Article

Estimation of Tax Expenditures Stimulating the Energy Sector Development and the Use of Alternative Energy Sources in OECD Countries

1
Department of Public Finance, Financial University under the Government of the Russian Federation, 49 Leningradskiy Ave., 125993 Moscow, Russia
2
Department of World Financial Markets and Fintech, Plekhanov Russian University of Economics, 36 Stremyanny Lane, 117997 Moscow, Russia
3
Procurement Department, Nazarbaev Intellectual School of Physics and Mathematics in Semey, Semey 071411, Kazakhstan
*
Author to whom correspondence should be addressed.
Energies 2023, 16(6), 2652; https://doi.org/10.3390/en16062652
Submission received: 8 February 2023 / Revised: 1 March 2023 / Accepted: 4 March 2023 / Published: 11 March 2023
(This article belongs to the Special Issue Innovative Economic Technologies and Policies in the Energy Sector)

Abstract

:
The energy crisis caused by global structural changes in the economic sphere is the cause accelerating the energy transition based on the concept of sustainable development. This study is to test the hypothesis about the incentive effect of tax expenditures on alternative energy and energy conservation. The objects of empirical research are the EU, OECD countries, OECD partner countries and Russia from 2018–2020. The tools of scientific research are based on methods of economic–statistical and comparative analysis and expert judgments. The concept of tax expenditures in terms of decarbonization is analyzed using a systematic approach. The integrated methodological approach shows the relationship between the tax policy and government strategies in achieving sustainable development goals to ensure the transition to rational energy consumption patterns and sustainable energy sources. The authors analyze incentives for the energy sector and alternative energy sources in the considered groups of countries, and they assess the scale of tax expenditures in the energy sector for OECD countries. There are two types of tax expenditures for achieving environmental sustainability—increasing renewable energy sources and improving the energy efficiency. The authors apply the multivariate average formula to assess the scale of tax incentives in OECD countries. The results are typified depending on the scale of tax expenditures as one of the tools and these results are grouped according to the dynamics. In the presented sample, a wide range of tax benefits and preferences is typical for the leading countries in the ranking. The countries at the bottom of the ranking support fossil fuels, but they have already started the energy transition.

1. Introduction

The concept of tax expenditures has a long history and has managed to obtain legislative consolidation and international recognition. In general, tax expenditures are a loss of income that comes from certain reliefs, tax laws that provide exemptions, deductions from the tax base, a tax credit that is deducted from tax liability before payment, preferential rates and delays.
Tax incentives are benefits provided to certain payers compared to other payers. This may be the opportunity not to pay a tax or pay a smaller amount. The larger the size of the tax benefit, the greater the state participation in activities of the one to whom it is granted. Granting the tax benefit looks like this: the payer does not redistribute their income to the state, but at the same time the state provides them with the opportunity to use the benefit and leaves funds at their disposal that could be used to pay obligations. Tax incentives are considered as tax expenditures of the budget because they reduce its revenue.
Tax expenditures have their own history. In this case, the Federal Republic of Germany (hereinafter referred to as the FRG) and the United States of America (hereinafter referred to as the USA) were the first to apply the system estimating budget shortfalls. In 1954, the report of the Federal Republic of Germany justified the convertibility of tax incentives and subsidies, and since 1959 they began to draw up reports that contained data on subsidies, including information on tax expenditures. The concept was developed in the 1980s in the USA. Since incentives reduce financial discipline and create abuse in the form of benefits to special interests, the concept was to solve this problem. In 1967, tax expenditures were included in the budget as a separate item. As soon as the number of benefits began to increase, their efficiency needed to be estimated. So, the Ministry of Finance began to provide reports on direct subsidies and tax preferences [1].
Further, the concept became an integral part of the budget, and was fixed by the regulatory provision. Then, when approving the budget, the report considered the rational use of tax expenditures [2]. To save time and simplify administration, a subsidy needed to be paid by reducing the tax base. Subsequently, there was an idea to replace direct expenditures, which could save the state money, since it is a necessity condition in times of tight budgetary policy [3]. Some measures, such as estimating tax expenditures to improve budgetary control, have been widely used in world practice since the 1970s.
Over time, the developed concept has become relevant and significant for many countries. It became the main topic for discussion at the meetings of the International Fiscal Association and the Organization for Economic Cooperation and Development (hereinafter referred to as the OECD). Various consultations and meetings led to the fact that participating countries were recommended to prepare a report highlighting tax expenditures. Identifying and quantifying tax expenditures is critical to understand the overall impact of the tax system [4].
The history of the concept of tax expenditures testifies to disagreements in understanding the essence, and, in general, the significance. The contradictions in government circles led to uniform recommendations and rules, materials and basic provisions, which formed the basis for consultations by the International Monetary Fund (hereinafter referred to as the IMF). Then, such countries as Austria, Canada, Great Britain, France, Spain, Belgium and some other countries started estimating tax expenditures [5]. Thus, it can be concluded that many countries have come to the opinion that the concept of tax expenditures was effective. At that time, about 80% of OECD countries were already preparing reports, which indicates the practical significance and necessity to create a theoretical basis for further implementation.
Further, the IMF defines recommendations and reflects government policies that may be qualified as tax expenditures. Currently, there is no consensus on the definition of tax expenditures. Each country determines it individually, based on the features and principles of calculation and the principles of its fiscal system, but general definitions are given in publications of international organizations. The OECD defines tax expenditures as the provision of government resources by reducing tax liabilities in lieu of direct budget expenditures.
Reforming the system of tax incentives can become an additional source, an alternative to raising tax rates and it can make tax systems more efficient and fairer [6] in terms of improving welfare and protecting the environment.
The introduction of tax incentives and preferences that support fossil fuels and accelerate the transition to renewable energy sources are in line with the UN Sustainable Development Goals, two of which directly support the energy change (Goals 7 and 12). Clean renewable energy, being a fundamental basis for the theory of sustainable development [7], accelerates the transition to a “green” economy, improves the environmental safety [8] and reduces geopolitical risks for states importing traditional energy resources.
In the context of the global agenda, to increase the level of decarbonization in the world’s economies, an increase in renewable energy sources (hereinafter referred to as RESs) and energy conservation require incentive measures from governments. The purpose of this study is to estimate tax expenditures as stimulus measures that ensure transformations in the energy sector.
The paper begins with a discussion of the concept of tax expenditures in terms of decarbonization. Theoretical and empirical literature is viewed in Section 2. The data set and approaches used to assess the impact of tax expenditures are described in Section 3. This is followed by the results with grouping of countries by the level of tax expenditures for energy efficiency and renewable energy sources in Section 4. Section 5 contains a list of the vectors to keep tax incentives and emission targets, which are followed by the conclusion in Section 6. References are found at the end of this paper.

2. Literature Review

Theoretical foundations and relevant empirical literature are detailed in separate subsections in this section.

2.1. Theoretical Background

Three general approaches are distinguished for determining benchmark taxes and determining tax expenditures: the conceptual approach, the legal approach and the subsidizing approach [9]. Many scientific works present detailed descriptions of the method for estimating tax expenditures for the exemption from the personal income tax, the capital gains tax and the withholding tax, the corporate income tax, including the minimum tax, as well as tax expenditures for customs duties and excises, the value added tax and registration fees [10].
Those works that examine the impact of tax expenditures on the budget and capital (including investment) are very popular. The EUROMOD micro-simulation model is used to quantify the impact of tax expenditures on government tax revenues and household disposable income. This model includes the interaction between various tax tools and tax credits [11]. To assess the impact of tax expenditures on the economic activity (increase in investment capital) of residents in special economic zones, we use one-factor power econometric models [12].
Tax expenditures, despite their clearly positive side, have several imperfections. The problems accompanying the tax expenditure system can be divided into three main blocks—informational, technical and functional—depending on the nature of the problem.
Informational problems identified in the analysis of African countries are related to the lack of reporting on tax expenditures or inconsistency in reporting requirements [13]. More than 64% of African countries do not provide any information about their tax expenditures, while most of the countries that report tax expenditures miss important information such as political targets and key beneficiaries. Informational problems are also associated with a lack of the transparency and accountability. The study carried out in all countries showed that statistical data underestimate the amount of tax expenditures. For example, Portugal and Costa Rica provide only total estimates aggregated by the tax base. In addition, China and Saudi Arabia do not publish any official information about tax expenditures at all. The functional block reflects the problems associated with the inconsistency of tax expenditures with the stated goals and negative side effects, such as increasing inequalities and contributing to climate change [14]. It is possible to single out the functional–information block of problems identified in a study of the G20 countries, where schemes for tax expenditures to a large extent turned out to be non-transparent, expensive and often ineffective to achieve the stated goals, causing undesirable side effects. New tax incentives are introduced regularly without proper control despite the limited transparency on the magnitude of existing tax expenditures. For example, out of 43 G20 and OECD countries, 8 countries have not reported on tax expenditures over the past 10 years, 26 have published a basic report over the past 10 years and only 9 countries regularly publish a detailed and comprehensive report [15]. Technical problems include, for example, the inability to replicate best practices in estimating the amount of tax expenditures [16]. In Germany, large-scale estimations of tax expenditures are carried out once per legislative cycle, in accordance with the mandate to estimate each type of tax expenditure at least once every 10 years. Ireland estimates each type of tax expenditure every five years, but this country recognizes that the quantification cannot be prepared for many types of tax expenditures. Another technical problem identified in the analysis of one country was the lack of unified approaches when defining the conceptual model of the tax reference structure and, consequently, the generally accepted criteria when qualifying a tax law norm as an element of the tax reference structure or tax benefits (expenses). It leads to different interpretations of the same deviations from this structure [17].
In terms of tax expenditures for groups of G20 countries, it is advisable to increase the transparency of tax incentives through more frequent and complete reports on tax expenditures; improve the structure of tax incentives to minimize windfalls and negative spillovers within and between countries; and phase out tax expenditures that harm the environment, including tax incentives for fossil fuels and other schemes that promote the unsustainable use of natural resources [18].
Ensuring access to clean energy is critical to the sustainable recovery of OECD economies. In addition to access to energy at the individual level, energy security, which can be broadly defined as the availability of sustainable sources of energy at an affordable price, is a key driver of economic growth. At the same time, effective taxes on energy encourage citizens and businesses to opt for more environmentally friendly products, reducing climate damage and air pollution [19].

2.2. Empirical Literature

According to the UNEP, the mass of anthropogenic emissions of greenhouse gases in the world exceeds the allowable amount to achieve the target threshold of a level well below 2 °C (Paris Agreement to limit global warming), and, moreover, the preferred threshold of 1.5 °C. Annual emissions of CO2 equivalents have increased by 40–50% compared to 1990. About 75% of emissions are accounted for by the G20 countries; emissions from developing countries increased by 2–4 times compared to 1990 [20].
The most significant contribution to global anthropogenic emissions is made by the PRC, the USA, the EU-27, India, Russia and Japan—with 67.8% of global emissions at the end of 2021 [21]. Figure 1 shows changes in CO2 emissions for countries with a global share of more than 1%.
In 2021, global CO2 emissions returned to the pre-pandemic level of 2019, increasing immediately by 5.3% compared to 2020 (China and Iran, despite COVID-19 restrictions, increased CO2 emissions in 2020 as well). The highest growth in emissions in 2021 came from India (+10.5%) and Brazil (+11%). Brazil, India, Russia, Turkey, China, Iran and Saudi Arabia emitted more CO2 in 2021 than in 2019. Australia was the only country that maintained the trend of reducing CO2 emissions in 2021, there was a decrease of 2.4%. The EU, Russia, the USA and Japan showed the CAGR of CO2 emissions compared to 1990. At the same time, more than 60 countries (the UK, the EU, the USA, China, Japan, etc.) announced that they will achieve “carbon neutrality” by 2050–2060 and even earlier. The fulfillment of the tasks set requires system-wide transformations, and various deterrent and incentive tools. Incentive tools contribute to certain behavior patterns, such as tax incentives and preferences for alternative energy sources—RESs. Although individual studies show that tax incentives may not have the desired effect, both for one country [22] and a group of countries [23], their scale can be quite impressive. In some countries, lost revenues from tax incentives amount to more than 13% of GDP [24]. Thus, the dynamics of greenhouse gas emissions are not uniform in different countries.
At the same time, the tax policy differs significantly in different countries. Some countries introduce incentives for energy taxes, others do not have similar taxes at all. From an economic point of view, the absence of a tax is equivalent to exemption from its payment, but it cannot be estimated as a tax expense, due to the absence of this tax base. In the context of environmental sustainability, GTED highlights tax spending that is to reduce greenhouse gas emissions, improve energy efficiency, promote renewable energy, protect biodiversity or support climate change adaptation. When considering measures to support fossil fuels by the OECD [25], almost 60% of all measures can be tax expenditures, which is significant enough, but not complete. Tax expenditures for fossil fuels can be divided into three broad groups: final consumption of fossil fuels; fossil fuels as inputs for production; production of fossil fuels, including extraction, processing and transportation [26]. We will adhere to the position that the comparison of tax expenditures in the energy sector is rather conditional, but at the same time it reflects the general trend in the area under consideration.
Optimistic forecasts by 2050 show a share of investments in renewable energy projects of about 77% of all investments in the electric power industry [27], although there is also a dispersion of indicators here [28]. However, experts tend to assume a rather optimistic scenario for the development of global renewable energy to reduce greenhouse gas emissions, as shown in various studies [29,30].
The hypothesis about the impact of tax regulation on RESs in terms of reduction of greenhouse gas emissions was confirmed when considering the sample of countries for 1991–2018 [31]. We note a more significant contribution of RESs in the reduction of greenhouse emissions for countries with a high tax burden in the environment. At a certain threshold level of RES development, the tax policy can be tightened without the loss of efficiency. These results emphasize the role of tax regulation in the environment and they are consistent with previous findings [32] about the positive impact of energy taxes on curbing emission growth.
The governments of the EU countries independently determine incentive measures to develop RESs: preferential prices for electricity generated using RESs; trade in electricity consumption quotas—“green” certificates (Sweden); tax incentives for enterprises using RESs; “green” tariffs (Denmark), etc. [33].
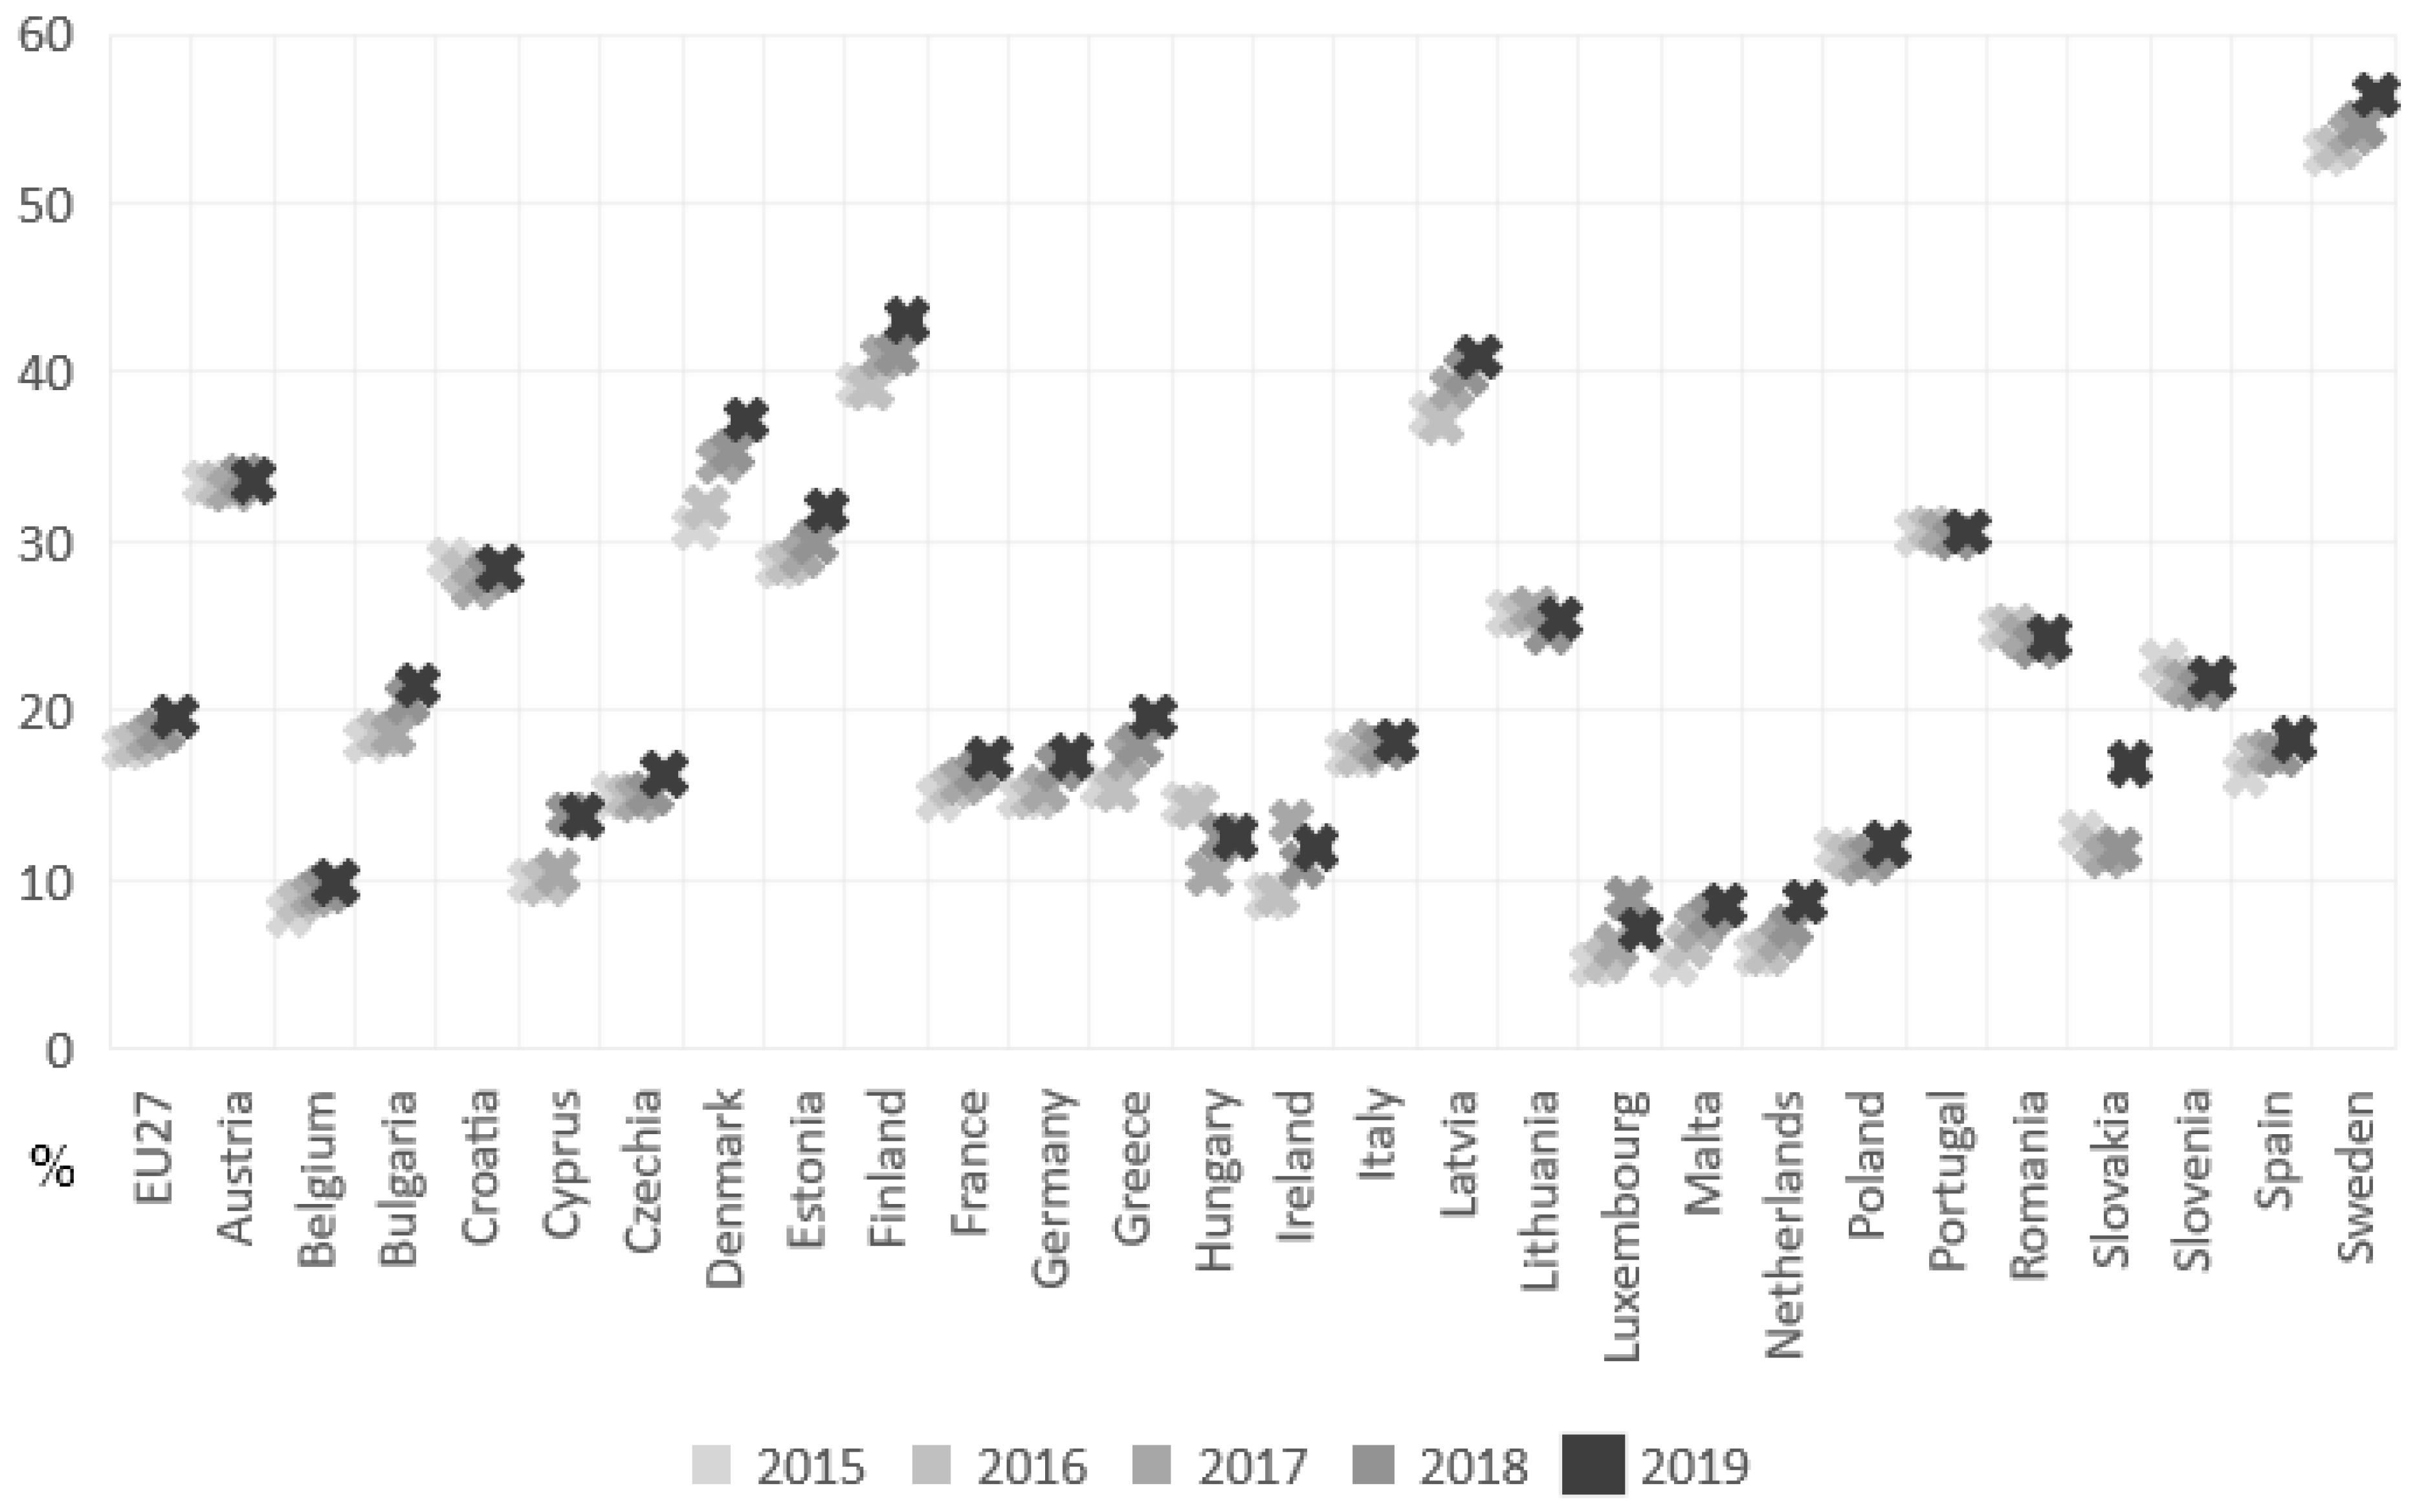
The EU Bioeconomy Monitoring System (BMS) has been developed as part of the EU Bioeconomy Strategy. In 2022, seven new indicators were added to BMS dashboards, including: sustainable management of natural resources, reducing dependence on non-renewable unsustainable resources, regardless of mining jurisdiction. Dashboards display almost 30% of indicators, covering 67% of all regulatory criteria [34]. Figure 2 presents the share of renewable energy sources for transport, electricity, heating and cooling in the EU countries from 2015–2019.
The indicators of the EU countries are quite heterogeneous in terms of the share of renewable energy sources, with 15 countries showing an indicator below the average (19.7% in 2019). The largest share of RESs is observed in Sweden (56.4% in 2019). Sweden is a world leader in decarbonization, with a goal of achieving “zero” emissions by 2045. This is followed by Finland (43.1%), Latvia (41%), Denmark (37.2%), Austria (33.6%), Estonia (31.9%), Portugal (30.6%), Croatia (28.5%), Lithuania (25.5%), Romania (24.3%), Slovenia (22%), Bulgaria (21.6%) and Greece (19.7%). Most countries progressively increased the share of RESs in transport, electricity, heating and cooling, with the exception of Austria (2015—33.5%, 2016—33.4%, 2017—33.1%, 2018—33.8%, 2019—33.6%), Greece (decrease in 2016—15.4% compared to 2015—15.7%, then growth), the Netherlands (decrease in 2016—14.4% compared to 2015—14.5%, then growth), Ireland (decrease in 2018—10.9% compared to 2017—13.5%, then growth), Italy (2015—17.5%, 2016—17.4%, 2017—18.3%, 2018—17.8%, 2019—18.2%), Latvia (decrease in 2016—37.1% compared to 2015—37.5%, then growth), Lithuania (2015—25.8%, 2016—25.6%, 2017—26%, 2018—24.7%, 2019—25.5%), Luxembourg (decrease in 2019—7.1% compared to 2018—9.0%), Portugal (2016—30.9%, 2017—30.6%, 2018—30.2%, 2019—30.6%), Romania (2016—25%, 2017—24.5%, 2018—23.9%, 2019—24.3%), Slovenia (2015—22.9%, 2016—22%, 2017—21.7%, 2018—21.4%, 2019—22%) and Spain (2017—17.6%, 2018—17.5%, 2019—18.4%). The most significant increase in the share of RESs in 2019 was shown by Slovakia (+5% to 16.9%), the most significant drop was in Luxembourg (−1.9% to 7.1%) and this is the lowest share of RESs among the EU countries.
The European Green Deal [35,36] defines the target for participating countries to become a climate neutral continent by 2050. In this regard, the Energy Efficiency Directive [26] and other energy regulations have been finalized to guarantee the reduction of greenhouse gas emissions by at least 55% by 2030. The EU countries must achieve reductions of 1.5% of the final energy consumption every year between 2024 and 2030 (today it is about 0.8%).
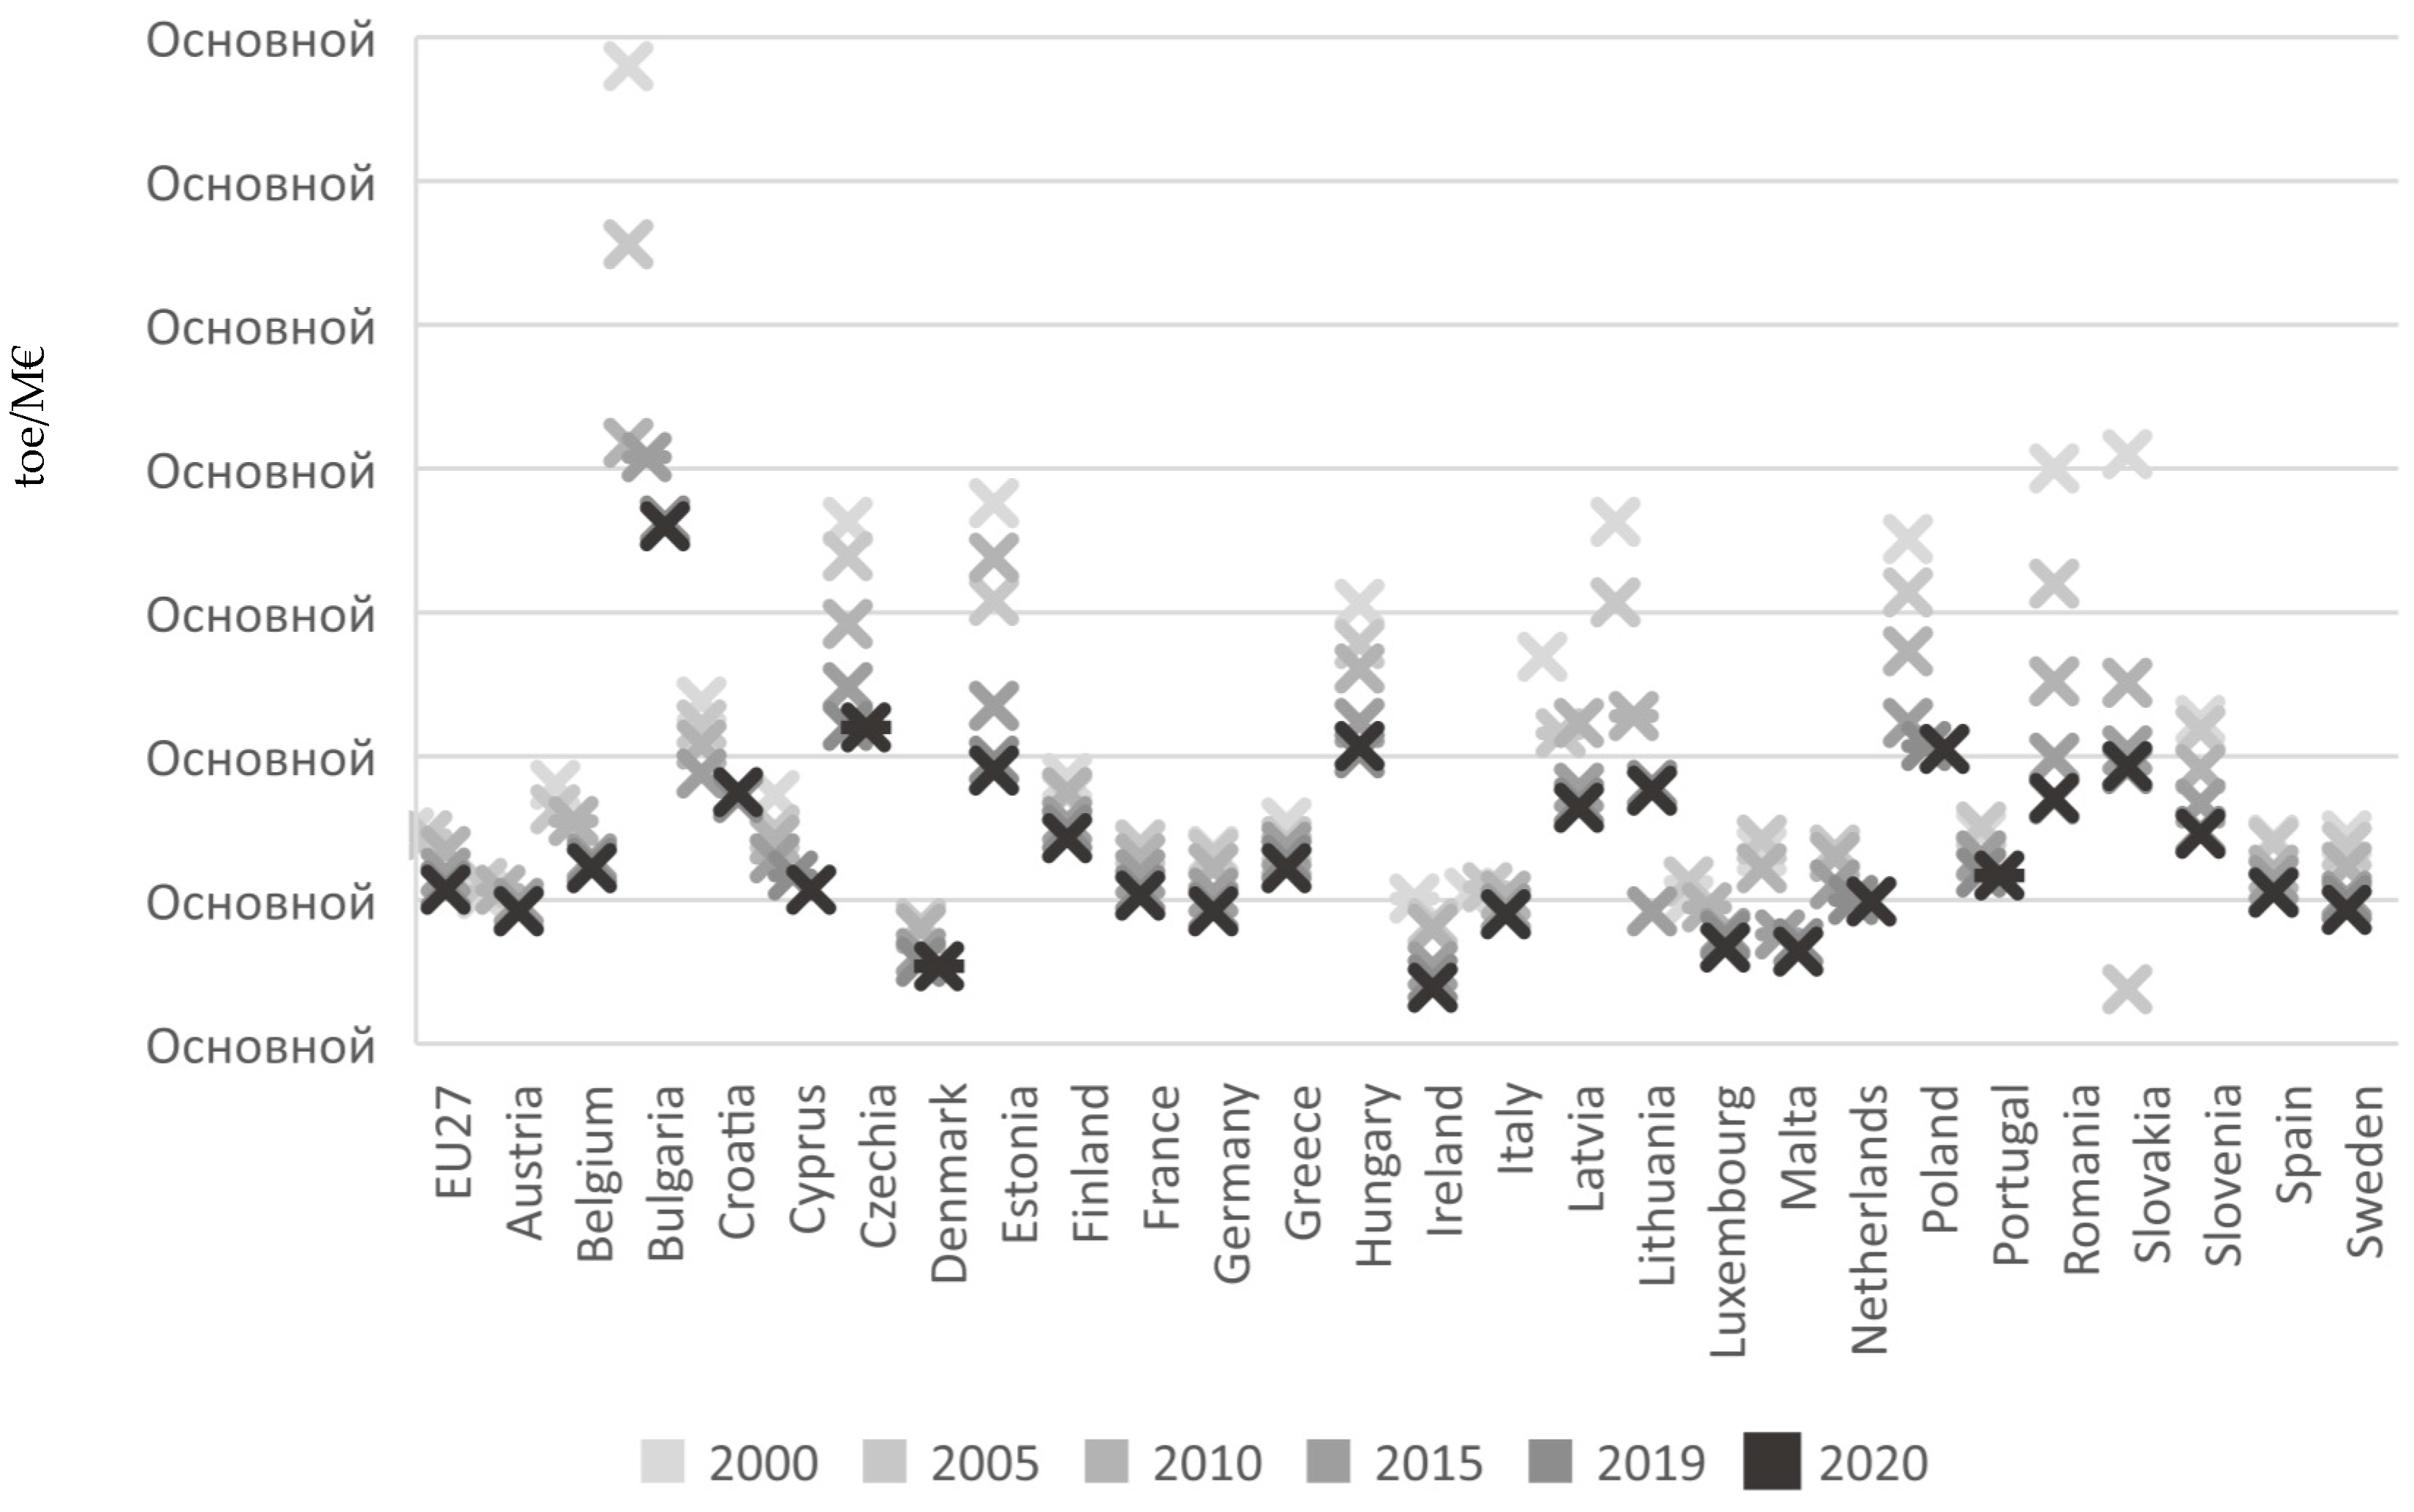
At the same time, the reduction in the specific energy consumption slowed down (−1%) globally in 2021 compared to the average value for 2000–2019 (−1.5%) [36]. Figure 3 presents the energy intensity of the EU economies, which is understood as the ratio between the gross domestic energy consumption and GDP, calculated for a calendar year.
The most energy-intensive country in the EU is Bulgaria (360 toe/M€ in 2020). This country’s indicator significantly exceeds that of other countries throughout the entire analyzed period, but we should note a rapid decrease in energy intensity by 47% compared to 2000. The lowest energy intensity indicators (compared to the EU average) are in Ireland (39 toe/M€ in 2020), Denmark (54), Malta (64), Luxembourg (67), Italy (90), Germany (92), Austria (92), Sweden (9), the Netherlands (99) and France (103). The leaders in reducing the energy intensity, after Bulgaria, are Romania (−229), Slovakia (−217), Lithuania (−187), Estonia (−186), Poland (−146), the Czech Republic (−143) and Latvia (−107).
For most advanced economies, renewable capacity scaling limits are the difficulty while permitting and extending grid infrastructure. As for developing countries, the lack of affordable financing and sparse infrastructure are the main problems. According to expert estimates, if these problems are solved by 2025, the growth of RES capacities can increase by 25% [37] compared to the baseline forecast, which assumes an increase in electricity production from RESs by 60% by 2050 (“clean zero” scenario).
To achieve environmental sustainability, OECD countries have implemented several policy initiatives to improve the energy efficiency by increasing the share of renewable energy consumption in the energy mix. Great attention is paid to tax incentives to increase investments in energy efficient technologies [37].

3. Materials and Methods

This section will describe the data set and approaches used to assess the impact of tax expenditures.

3.1. Data

The authors assess the relationship between tax incentives and preferences (tax expenditures for the state budget) and the incentive effect on the energy sector and alternative energy sources. The sample of countries for analysis includes some OECD countries and OECD partner countries (Australia, Germany, Greece, Denmark, India, Ireland, Spain, Italy, Latvia, Mexico, the Netherlands, Poland, Russia, Finland, France, Sweden and South Korea). The sample of countries depended on the availability of data. The development of alternative energy is associated with a constant reduction in traditional sources, which means that it is necessary to consider partner countries in energy trade. The authors use annual data for 2018–2020.
The main sources of statistical data were the Global Tax Expenditures Database (GETS), OECD reports, EU Joint Research Center (JRC) publications, EU Bioeconomy Monitoring System (BMS) and analytical studies of consulting companies. The directions of tax reforms were studied in reports published by the governments and ministries of finance of individual countries.

3.2. Methodology

At the first stage, ten OECD countries are ranked in terms of the share of tax expenditures for stimulating the energy sector in total tax expenditures for developing priority sectors of the economy. The authors estimate the level of tax expenditures for the energy efficiency and renewable energy sources in the volume of tax revenues of consolidated budgets.
At the second stage, the authors typify tax expenditures for environmental sustainability.
At the third stage, the share of tax expenditures for increasing renewable energy sources and the energy efficiency in total tax expenditures for environmental sustainability is estimated. The rating of countries is carried out.
At the fourth stage, the authors apply a multivariate average formula to estimate the scale of tax incentives in OECD countries. The idea of using the multivariate average as an integrated indicator for rating territories in terms of tax expenditures is not new and it is covered in the work of Yu.A. Steshenko and A.V. Tikhonova [38], who use this mechanism to estimate tax incentives in Russian regions.
At the fifth stage, a matrix of grouping countries is built depending on the share of tax expenditures for the energy efficiency and renewable energy sources in the volume of tax revenues of consolidated budgets, with the allocation of three groups (low, average, high).
At the sixth stage, the multivariate average reflecting the magnitude of tax expenditures for the energy sector in each country is calculated by the following formula:
p ¯ i = 1 k j = 1 k x i x ¯ j
x i j —the value of the j-th variable (indicator of tax expenditures) for the i-th object (country);
x ¯ j —the average value of the j-th variable (indicator of tax expenditures) for all analyzed countries.
We use indicators of tax expenditures for OECD countries from the previous tables (Table 1, Table 2 and Table 3), namely:
x 1 —tax expenditures for stimulating the energy sector (as % of the country’s GDP);
x 2 —tax expenditures for stimulating the energy sector (as % of tax revenues of the country’s consolidated budget);
x 3 —tax expenditures for increasing renewable energy sources (as % of the country’s GDP);
x 4 —tax expenditures for increasing renewable energy sources (as % of tax revenues of the country’s consolidated budget);
x 5 —tax expenditures for energy efficiency improvements (as % of the country’s GDP);
x 6 —tax expenditures for energy efficiency improvements (as % of tax revenues of the country’s consolidated budget).
The advantage of the multivariate average is the ability to assess a certain general characteristic of various objects (countries, territories, etc.), based on various indicators and using a single methodology for their calculation. In our study, this characteristic was the scale of tax expenditures, and all indicators of tax expenditures were calculated as a percentage of GDP or tax revenues of the budget.

4. Results

Tax expenditures for stimulating the energy sector in terms of traditional energy sources (fossil fuels) include various types of preferences and incentives for taxpayers, namely: tax deductions; tax deferrals; tax exemption; reduction of tax rates; tax incentives, discounts and refunds; zero rating (a regime that implies that the entire value chain of the supply is exempt from taxes).
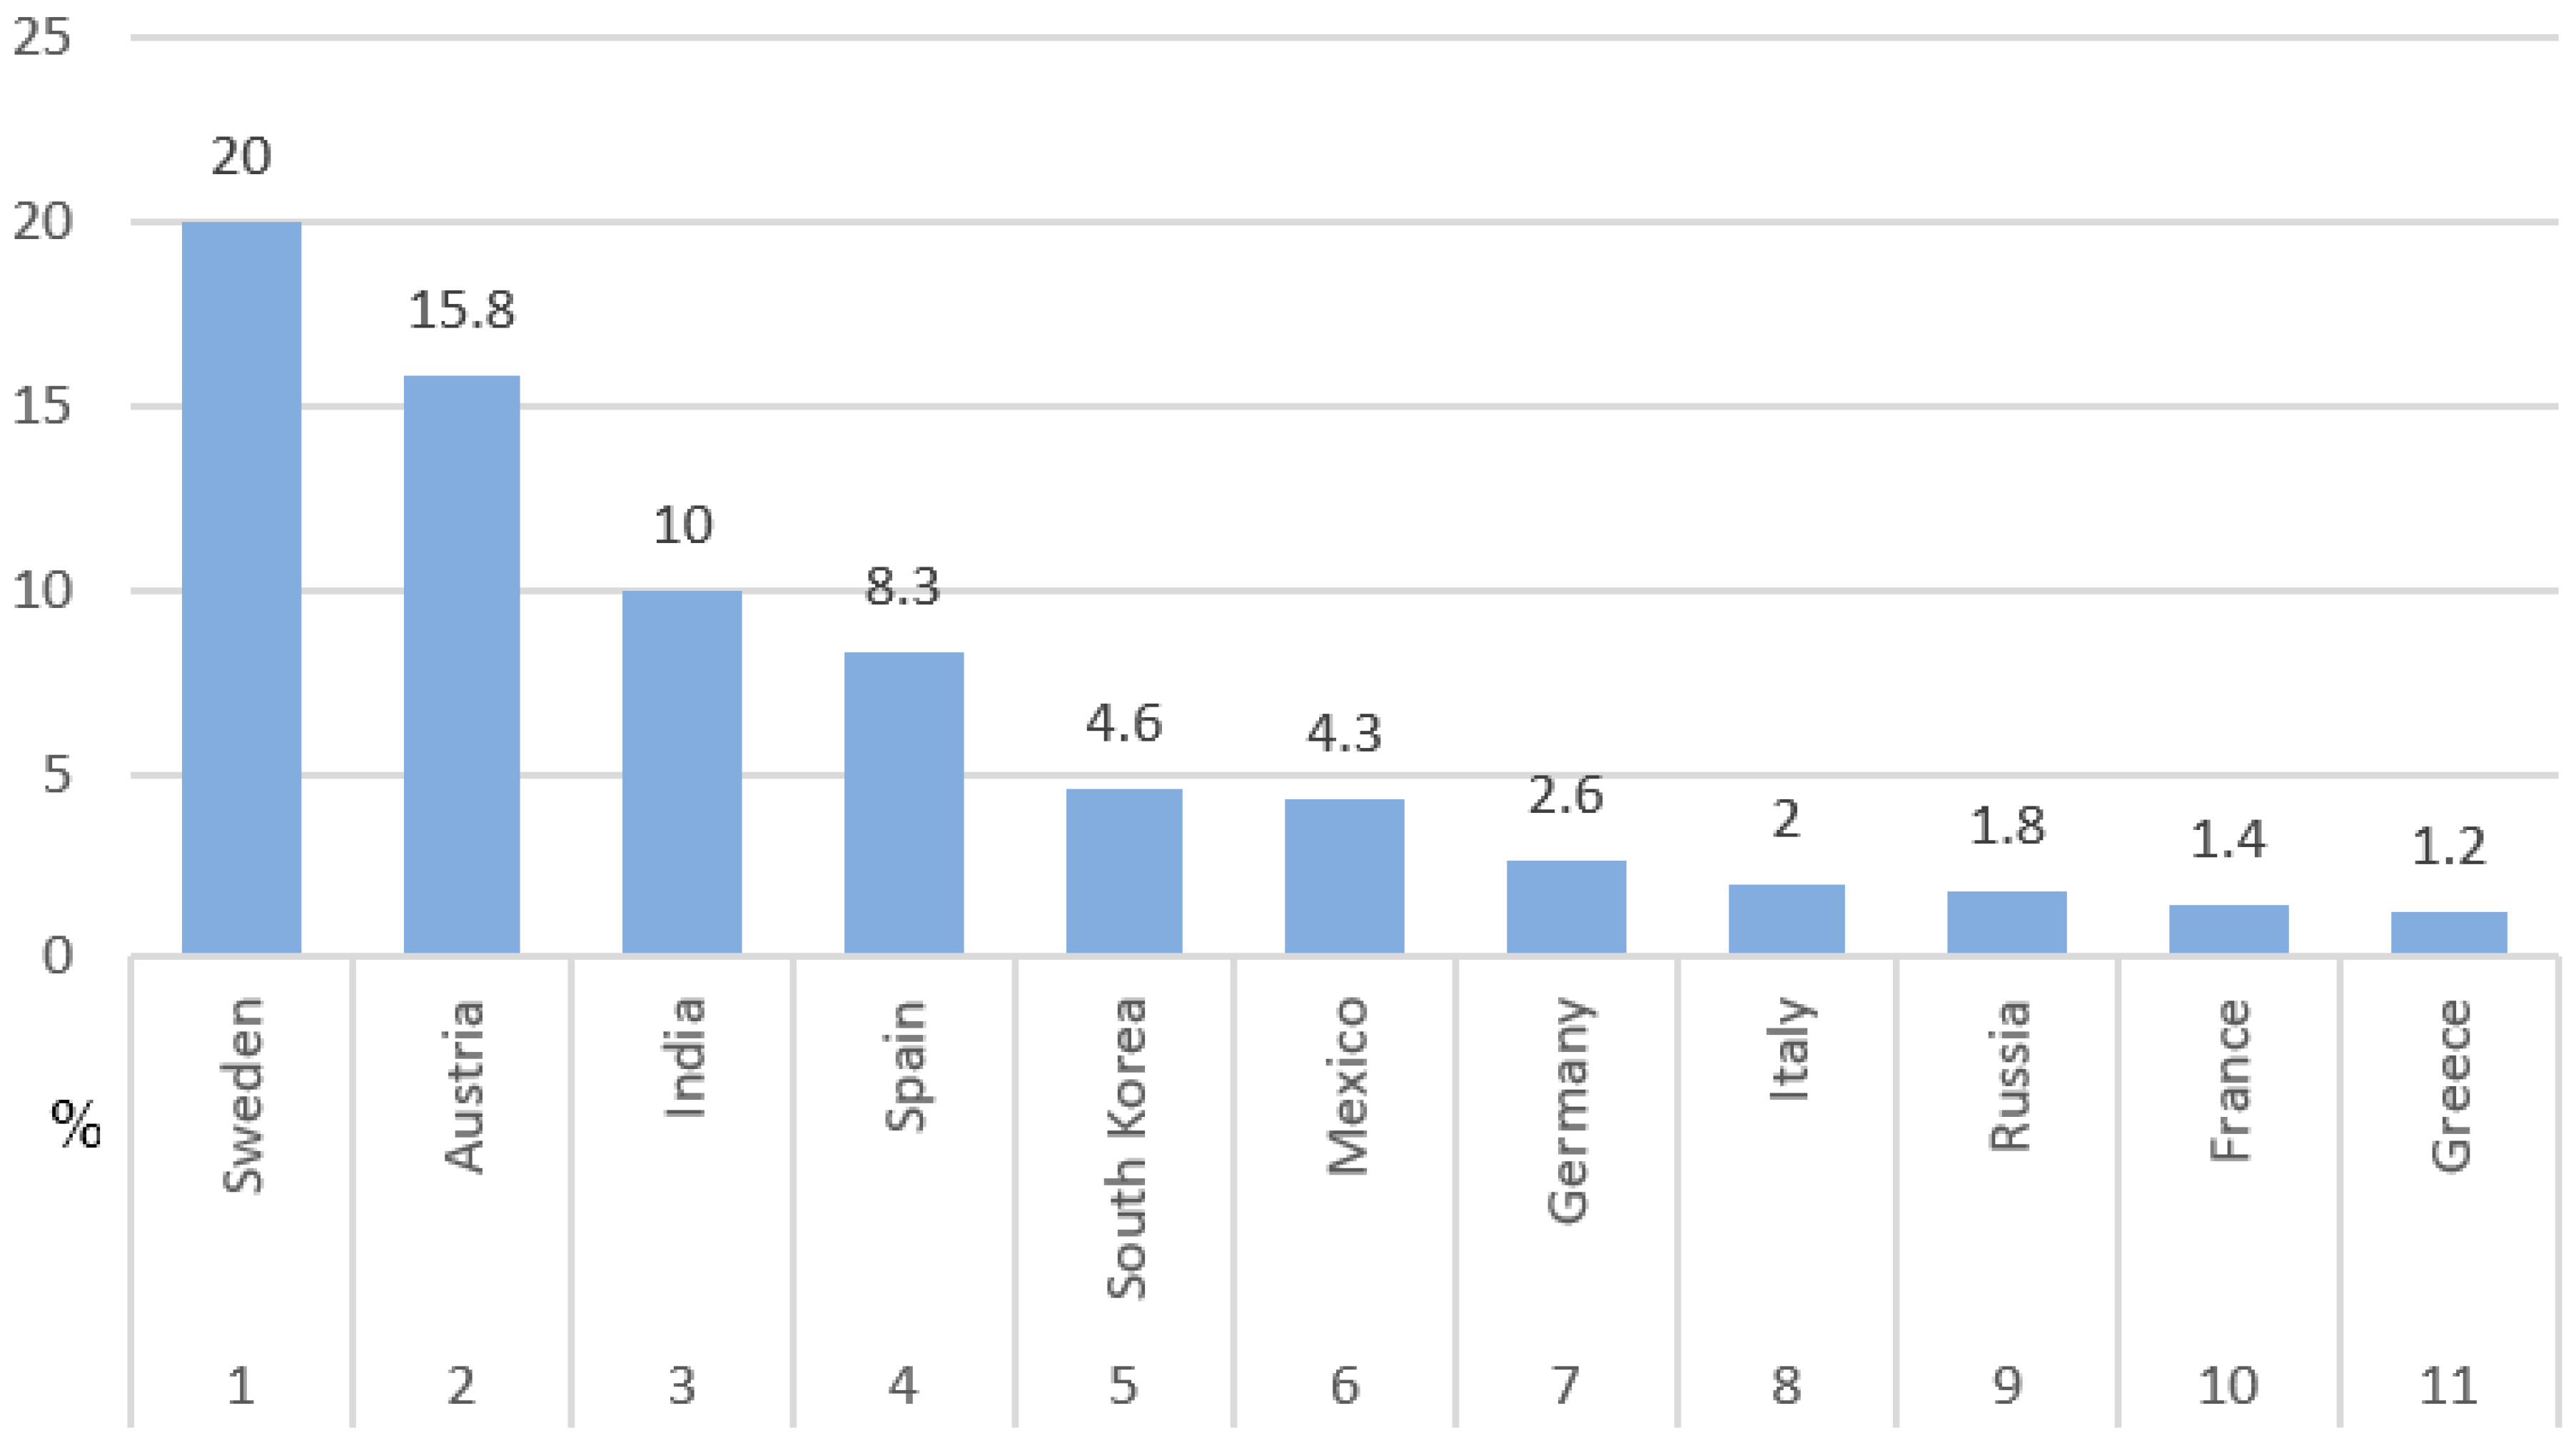
The study ranked ten OECD countries by the share of tax expenditures for stimulating the energy sector in total tax expenditures for developing priority sectors of the economy (Figure 4).
As Table 1 shows, in the period from 2018 to 2020, there were no significant changes in the level of tax expenditures to support the energy complex in the countries studied. Most likely, this is a consequence of the economic recession that arose due to the COVID-19 pandemic and it was in the form of a lack of budget funds for these purposes. Of all the countries presented in Table 1, only the Russian Federation is significantly increasing the volume of assistance to energy companies (the volume of tax expenditures increased from 0.52 to 1.1% of budget tax revenues over a three-year period).
Tax expenditures range from 0.002 to 0.04% of GDP (from 0.01 to 0.14% of tax revenues, respectively) in those OECD countries that provide tax support to the energy sector. The leader among the countries is Austria (Table 1), where fossil fuels are the main source of energy: oil ranks first with a share of 37.2% of the gross domestic consumption, followed by gas (22.1%) and coal (8.2%). However, the commitment to add more biofuels to fossil fuels and increased production of district heating from biomass have led to a record high use of renewable energy in Austria. Consequently, renewable energy currently accounts for 29.8% of the gross domestic consumption, with solid biomass being the most important renewable energy source (37%) followed by hydropower (34%). Other renewable energy sources include solar, wind, geothermal, biogas and biofuels, each of which accounts for less than 7% [39].
Tax expenditures for stimulating the energy development in India (a key OECD partner country) are significantly higher than in OECD countries (they amount to about 0.07–0.09% of GDP or 0.6% of tax revenues). Nevertheless, at present, the growth of the fossil fuel consumption in India is also gradually increasing. At the same time, the main energy consumption is coal—43.9%, oil—32.8% and natural gas—7.6%. Hence, there are high values of tax expenditures for companies in this area [40].
Of all the countries presented in Table 1, only the Russian Federation is significantly increasing the volume of assistance to energy companies (the volume of tax expenditures increased from 0.52 to 1.1% of budget tax revenues over a three-year period).
The following data (Table 2) let us draw several important conclusions about the role of tax expenditures for achieving environmental sustainability in OECD countries. The undisputed leader of tax expenditures for increasing renewable energy sources is Denmark (0.25% of GDP and 0.7–0.77% of tax revenues of the budget). Income tax incentives are applied here to support investments in electricity generation from renewable energy sources such as wind, solar, hydro and geothermal. The energy from renewable sources is expected to be a key factor in reducing emissions in developing countries and countries with economies in transition.
The countries with the most developed system of tax incentives for the energy efficiency are Finland and Sweden. Tax expenditures in Finland are about 0.3% of GDP (from 1.41 to 1.58% of tax revenues of the budget). Tax expenditures for the energy efficiency in Sweden are slightly lower than in Finland—0.16–0.25% of GDP (from 0.68 to 1.1% of tax revenues of the budget, respectively), but nevertheless they exceed the average values for OECD countries. Tax expenditures for environmental sustainability in terms of the renewable energy and energy efficiency increased in most countries between 2018 and 2020.
The ranking of countries in terms of the share of tax expenditures for increasing renewable energy sources and improving the energy efficiency in total tax expenditures for environmental sustainability is presented in Table 3. Among the leading countries in terms of “share of tax expenditures for increasing renewable energy sources” are Poland, Germany, Sweden and Italy (the last two countries share 3rd place). According to “share of tax expenditures for improving the energy efficiency”, the places were distributed differently: South Korea, Ireland and Finland are in the top three.
As shown in Table 3, there are no figures for tax expenditures for increasing renewable energy sources in the Russian Federation. At the same time, according to “share of tax expenditures for improving the energy efficiency”, our country, if included in the rating of OECD countries, will take 7th place (the value of the indicator is 12.5%). This is because a significant share of tax expenditures for environmental sustainability in Russia are tax expenditures for biodiversity conservation.
The grouping of countries by the level of tax expenditures for the energy efficiency and renewable energy sources, by the share in tax revenues of each country’s consolidated budget, is presented in Table 4.
Sweden, Germany, Poland, Mexico and Italy are countries with a stable tax policy to support the energy efficiency and energy transition using tax incentives. The group with a high level of tax expenditures includes Denmark (in terms of supporting RESs) and Finland (in terms of supporting the energy efficiency).
The scale of tax expenditures indicates that Finland has the highest rating (large scale of tax expenditures as one of the tools for energy development) (the value of the multivariate average is 1.6179) (Table 5). The authors calculated the integrated indicator based on four indicators, because the country’s legislation has no tax incentives to support the production and use of fossil fuels. However, there are extremely high (compared to other OECD countries) tax expenditures for energy efficiency improvements.
The Netherlands is in second place in the ranking (the multivariate average value is 1.4583) due to the highest values of tax expenditures for increasing renewable energy sources among the countries studied. The third place in terms of the scale of tax expenditures is occupied by Sweden (the multivariate average value is 1.3783).
Paradoxically, the bottom positions in the ranking are occupied by countries which, on the one hand, support the continued use of fossil fuels, but, on the other hand, have already begun a gradual transition to renewable energy technologies (for example, South Korea and France). This means that the calculation of the multivariate average for these countries was made based on all six indicators.
Note that not all six indicators are relevant for each country. For some countries, the multivariate average is calculated by only four indicators. At the same time, the higher the country’s rating, the more actively it uses such tools as tax expenditures.

5. Discussion

The study shows that tax expenditures in the energy sector reflect tax incentives for companies and they are actively used tools for the energy development among developed countries. At the same time, tax expenditures contribute to the continued transition from fossil fuels to alternative energy sources and energy conservation.
Sweden is the leader in the OECD rating by the share of tax expenditures for the energy sector in total tax expenditures for developing priority sectors of the economy. Sweden’s tax spending system in this area is very broad and specific, mainly including exemptions from various taxes or reduced tax rates for different companies. For example, natural gas and liquefied petroleum gas used as fuel in transport are exempt from the energy tax. Additionally, natural gas and liquefied petroleum gas used in transportation are subject to lower carbon tax rates. Any fuel used by companies in the agriculture, forestry and aquaculture sector for heating purposes receives a 24% reduction in the carbon tax. Industries outside the European Greenhouse Gas Emissions Trading Scheme (EU ETS) are granted a reduced carbon tax rate on all fossil fuels used for heating [41].
If we include data for the Russian Federation in the rating, then it will be in 9th place, even though it has the highest values of tax expenditures as a percentage of GDP and tax revenues among the analyzed countries. This is a consequence of the fact that the largest share of tax expenditures in Russia falls on the extractive sector of the economy (31.4%), the transport industry (15%) and science-intensive activities (12.3%), which are also a priority. That is, accounting for tax preferences provided is kept separately (which is not always typical for other countries) for mining companies and energy companies.
The amount of tax expenditures to support the energy industry in the Russian Federation is several times higher than the amount of tax expenditures in any of the analyzed countries. An example of tax incentives is a zero-property tax rate for gas pipeline facilities, gas production facilities, helium production and storage facilities. Organizations are also exempt from taxation in respect of newly commissioned facilities with high energy efficiency, in accordance with the list of such facilities established by the Government of the Russian Federation. In addition, taxpayers have the right to apply a special coefficient to the basic depreciation rate (but not higher than 2) in relation to depreciable fixed assets related to such objects when calculating the corporate income tax [42].
There are two types of tax expenditures for achieving environmental sustainability, according to their purpose—increasing the use of renewable energy sources and improving the energy efficiency. Moreover, in some of the considered countries there are both types of tax expenditures (the Netherlands, South Korea, Finland, France), and, in some, only one. For example, the Netherlands provides tax support for environmentally friendly investments through a combination of targeted income tax incentives and high carbon prices, including two investment incentives and a special accelerated depreciation schedule [43].
Ranking countries by estimating the share of tax expenditures for increasing renewable energy sources and improving the energy efficiency in total tax expenditures for environmental sustainability identified the leading countries: Poland, Germany, Sweden and Italy (for the first indicator) and South Korea, Ireland and Finland (for the first indicator). The results obtained can be explained by two reasons. The bottom-ranked countries, while providing tax incentives for environmental sustainability, do not focus only on the energy sector, using various types of tax expenditures, for example, biodiversity conservation, reduction of greenhouse gas emissions, support for climate change adaptation, etc. The leading countries have a wide range of tax benefits and preferences. For example, Polish tax legislation provides for a reduction in the property tax for wind farms. In addition, tax incentives to encourage renewable energy sources in Poland include exemption from the agricultural tax and exemption from the excise tax on electricity produced using renewable energy sources [44]. One component of tax expenditures for the energy efficiency in South Korea is a tax credit for investments in energy-saving facilities. The tax credit is provided for the purchase of appropriate new facilities and equipment to achieve energy savings and it is 1% for large companies, 3% for medium-sized companies and 7% for small and medium-sized enterprises.
The countries with the most developed system of tax incentives for the energy efficiency growth are Finland and Sweden. The system of tax incentives in Finland is quite wide. Thus, farmers are entitled to a tax refund, which is paid for electricity, light and heavy fuel oil and biofuels. Biogas is completely excluded from taxation when calculating the energy tax. At the same time, tax expenditures on peat are gradually reduced (since peat is a fossil fuel, the use of which does increase the energy efficiency for energy production) [45].
Currently, taxes form the backbone of Sweden’s energy efficiency policy, as they are often the main driver for other policy instruments. However, taxes can have a detrimental effect on the competitiveness of Swedish industry. Therefore, there are several tax breaks for industrial enterprises, especially for those ones which take part in the European Emissions Trading Scheme. These enterprises only pay the energy tax, not the carbon tax, as the price of the carbon credits is considered to have the same effect as the tax. Biogenic fuels are exempt from both carbon and energy taxes. Thus, in practice, the carbon and energy taxes in Sweden perform the same functions—stimulating energy saving and switching to another type of fuel [46].
The scale of tax expenditures indicates that Finland has the highest rating, in second place is the Netherlands and in third place is Sweden. There are no tax incentives for renewable energy sources, but tax expenditures for the energy efficiency are almost as high as in Finland.
Paradoxically, the bottom positions in the ranking are occupied by countries that, on the one hand, support the continued use of fossil fuels, but, on the other hand, have already begun a gradual transition to renewable energy technologies (for example, South Korea and France). This means that the calculation of the multivariate average was based on all six indicators.
Like any exception to the general rule, tax breaks and privileges create economic distortions and cause distribution problems, which may be the subject of further research. In the context of the specifics of the energy opportunities and tax policy of each country, the finding of data for international comparisons, the calculation of the efficiency of tax expenditures and their convertibility into direct forms of budget financing are laborious, but promising.
Another promising area of research was proposed by a group of Italian scientists who are improving a new indicator that links anthropogenic impact on the environment with socio-economic goals—the Thermodynamic Human Development Index (THDI) [47]. As we noted, the quality of energy is an essential basic condition for sustainable development, the consistent principles of which are ecological balance, economic growth and social responsibility. The authors consider the use of rice straw, reviewed in [48], based on the THDI to reduce fossil fuels and greenhouse gas emissions. It seems to us that tax preferences for biofuels from renewable organic biomass can intensify the process of spreading this approach, especially for agricultural industries and territories. This can be a vector for further research and development of state policy to ensure sustainable development of agricultural territories.
If we keep tax incentives and emission targets, we can stimulate the transition to new hybrid forms of energy generation and optimization of electricity costs, and we can change consumer preferences. At the same time, in the short term, the dynamics of processes will be drastically influenced by factors caused by the global energy crisis, the features of which are characterized by the involvement of the entire set of energy sources (oil, natural gas, coal, biofuel, hydrogen, nuclear fuel).

6. Conclusions

The comparative analysis of tax expenditures for fossil fuels in OECD countries and key OECD partner countries has led to some important conclusions.
Based on the available statistics, many developed countries have now taken a course towards the transition to alternative energy sources, which involves moving away from investing in fossil fuels and refusing state (including tax) support for traditional energy. The conclusion is supported by data on the total absence of tax expenditures for stimulating fossil fuels in many countries. Only a few OECD countries have tax expenditures that are so significant that they can be identified as part of the GDP or part of tax revenues of the budget.
In those OECD countries that provide tax support to the energy sector, tax expenditures represent a small share. However, the commitment to add more biofuels to fossil fuels and increased production of district heating from biomass have led to a record high use of renewable energy in Austria.
Energy incentive expenditures in India (a key OECD partner country) are significantly higher than in OECD countries. India is undergoing an energy transition with a steady decline in the share of fossil fuels in its energy portfolio and this country is moving towards a reallocation of energy sources in favor of wind, solar and biomass, as well as greater use of electricity and hydrogen. The amount of tax expenditures to support the energy industry in the Russian Federation is many times higher than the amount of tax expenditures in any of the analyzed countries. The variety of tax preferences that exist in the energy sector is associated with increased attention to the energy industry as a priority for the country.
Between 2018 and 2020, there were no significant changes in the level of tax expenditures to support the energy complex in the countries studied. Most likely, this is a consequence of the economic recession that arose due to the COVID-19 pandemic, and it was in the form of a lack of budget funds for these purposes.

Author Contributions

Conceptualization, Y.T. and S.F.; methodology, Y.T.; validation, S.D., M.K. and A.K.; formal analysis, S.F.; investigation, S.D. and M.K.; data curation, S.D. and M.K.; writing—original draft preparation, Y.T., S.D. and M.K.; writing—review and editing, S.D. and M.K.; visualization, S.D. and M.K.; supervision, A.K.; project administration, S.F. All authors have read and agreed to the published version of the manuscript.

Funding

The manuscript was based on research carried out at the expense of budgetary funds under the state order of the Financial University.

Data Availability Statement

The data were obtained from free online databases and the information is provided in the manuscript.

Conflicts of Interest

The authors declare no conflict of interest.

References

  1. Tax Expenditures: Current Issues and Five-Year Budget Projections for Fiscal Years 1984–1988. The Congress of the United States. Congressional Budget Office; 25 October 1983. Available online: https://www.cbo.gov/sites/default/files/98th-congress-1983-1984/reports/doc26a.pdf (accessed on 15 January 2023).
  2. Surrey, S.S.; McDaniel, P.R. The Tax Expenditure Concept: Current Developments and Emerging Issues. Boston Coll. Law Rev. 1979, 20, 225. Available online: https://www.semanticscholar.org/paper/The-Tax-Expenditure-Concept%3A-Current-Developments-Surrey-McDaniel/528ac53eaac085edb9761c0475569b4290d6ffab (accessed on 9 January 2023).
  3. Thuronyi, V. Tax Expenditures: A Reassessment. Duke Law J. 1988, 37, 1182. Available online: https://scholarship.law.duke.edu/cgi/viewcontent.cgi?article=3057&context=dlj (accessed on 10 January 2023). [CrossRef] [Green Version]
  4. Tyson, J. Reforming Tax Expenditures in Italy: What, Why, and How? IMF Work. 2014, 14, 4. Available online: http://reforming.it/doc/635/taxexpenditureinitaly.pdf (accessed on 15 January 2023). [CrossRef] [Green Version]
  5. Best Practice Guidelines—Off Budget and Tax Expenditures. OECD J. Budg. 2004, 4, 121–142.
  6. Sokolovska, A.; Zatonatska, T. Debatable aspects of the concept of tax expenditures. Ekonomika 2022, 101, 109–124. [Google Scholar] [CrossRef]
  7. Grisolia, G.; Fino, D.; Lusia, U. Biomethanation of rice straw: A Sustainable perspective for the valorisation of a field residue in the energy sector. Sustainability 2022, 14, 5679. [Google Scholar] [CrossRef]
  8. Demidova, S.; Balog, M.; Chircova, T.; Kulachinskaya, A.; Zueva, S.; Akhmetova, I.; Ilyashenko, S. Development of methodology and assessment of ecological safety of the EAEU and CIS regions in the context of sustainable development. Economies 2021, 9, 100. [Google Scholar] [CrossRef]
  9. Villela, L.A. Tax Expenditures Budgets: Concepts and Challenges for Implementation; IDB Working Paper Series: 131. HJ4642.V55; Inter-American Development Bank: Washington, DC, USA, 2021. [Google Scholar]
  10. Bertrand, L.; Caldeira, E.; Quatrebarbes, C.; Bouterige, Y. Tax Expenditure Assessment: From Principles to Practice Methodological Guide; under the supervision of Anne-Marie Geourjon; Fondation pour les Études et Recherches sur le Développement International (Ferdi): Clermont-Ferrand, France, 2018; ISBN 978-2-9550779-5-5. [Google Scholar]
  11. Barrios, S.; Figari, F.; Gandullia, L.; Riscado, S. The Fiscal and Equity Impact of Tax Expenditures in the EU. JRC Working Papers on Taxation and Structural Reforms. 2016. Available online: https://joint-research-centre.ec.europa.eu/system/files/2016-12/jrc104176.pdf (accessed on 10 January 2023).
  12. Kakaulina, M.O.; Gorlov, D.R. Assessment of the impact of tax incentives on investment activity in special economic zones of the Russian Federation. J. Appl. Econ. Res. 2021, 21, 282–324. [Google Scholar] [CrossRef]
  13. Mosquera, I.; Lesage, D.; Lips, W. Taxation, International Cooperation and the 2030 Sustainable Development Agenda; Springer International Publishing: Cham, Switzerland, 2021; pp. 173–193. ISBN 978-3-030-64857-2. [Google Scholar] [CrossRef]
  14. Haldenwang, C.; Redonda, A. Tax Expenditures: The Hidden Side of Government Spending, VoxEU.org—CEPR’s Policy Portal. 2021. Available online: https://cepr.org/voxeu/columns/tax-expenditures-hidden-side-government-spending (accessed on 28 January 2023).
  15. Redonda, A.; Sarralde, S.; Hallerberg, M.; Johnson, L.; Melamud, A.; Rozemberg, R.; Schwab, J.; Haldenwang, C. Tax expenditure and the treatment of tax incentives for investment. Economics: The Open-Access. Open-Assess. E-J. 2019, 13, 1–11. [Google Scholar] [CrossRef] [Green Version]
  16. Beer, S.; Benedek, D.; Erard, B.; Loeprick, J. How to Evaluate Tax Expenditures; How to Note (International Monetary Fund); International Monetary Fund: Washington, DC, USA, 2022; Available online: https://www.imf.org/en/Publications/Fiscal-Affairs-Department-How-To-Notes/Issues/2022/11/How-to-Evaluate-Tax-Expenditures-525166 (accessed on 10 January 2023).
  17. Fedorova, E.; Lapshina, N.; Borodin, A.; Lazarev, M. Impact of information in press releases on the financial performance of Russian companies. Ekon. Polit. 2021, 3, 138–157. [Google Scholar] [CrossRef]
  18. Inventory of Estimated Budgetary Support and Tax Expenditures for Fossil Fuels; OECD Publishing: Paris, France, 2011; Available online: https://www.oecd.org/fossil-fuels/48805150.pdf (accessed on 9 January 2023).
  19. Zehir, C.; Zehir, M.; Borodin, A.; Mamedov, Z.F.; Qurbanov, S. Tailored Blockchain Applications for the Natural Gas Industry: The Case Study of SOCAR. Energies 2022, 15, 6010. [Google Scholar] [CrossRef]
  20. Borodin, A.; Zaitsev, V.; Mamedov, Z.F.; Panaedova, G.; Kulikov, A. Mechanisms for Tax Regulation of CO2-Equivalent Emissions. Energies 2022, 15, 7111. [Google Scholar] [CrossRef]
  21. Crippa, M.; Guizzardi, D.; Banja, M.; Solazzo, E.; Muntean, M.; Schaaf, E.; Pagani, F.; Monforti-Ferrario, F.; Olivier, J.; Quadrelli, R.; et al. CO2 Emissions of all World Countries; EUR 31182 EN; Publications Office of the European Union: Luxembourg, 2022. [Google Scholar] [CrossRef]
  22. Benzarti, Y.; Carloni, D. Who really benefits from consumption tax cuts? Evidence from a large VAT reform in France. Am. Econ. J. Econ. Policy 2019, 11, 38–63. [Google Scholar] [CrossRef] [Green Version]
  23. Kronfol, H.; Steenbergen, V. Evaluating the Costs and Benefits of Corporate Tax Incentives. Methodological Approaches and Policy Considerations; World Bank: Washington, DC, USA, 2020; Available online: http://documents1.worldbank.org/curated/en/180341583476704729/pdf/Evaluating-the-Costs-and-Benefits-of-Corporate-Tax-Incentives-Methodological-Approaches-and-Policy-Considerations.pdf (accessed on 29 December 2022).
  24. Shedding Light on Worldwide Tax Expenditures. GTED Flagship Report. 2021. Available online: http://www.GTED.net (accessed on 9 January 2023).
  25. Ziyadin, S.; Streltsova, E.; Borodin, A.I.; Kiseleva, N.; Yakovenko, I.; Baimukhanbetova, E. Assessment of Investment Attractiveness of Projects on the Basis of Environmental Factors. Sustainability 2019, 11, 2544. [Google Scholar] [CrossRef] [Green Version]
  26. Energy Efficiency Trends and Policies in Austria; Austrian Energy Agency: Vienna, Austria, 2021; Available online: https://www.odyssee-mure.eu/publications/national-reports/energy-efficiency-austria.pdf (accessed on 15 January 2023).
  27. Renewable Energy Sources as a New Development Step for Oil and Gas Companies. 2019. Available online: www.assets.kpmg/content/dam/kpmg/ru/pdf/2019/12/ru-ru-renewable-energy-sources-for-oil-and-gas.pdf (accessed on 20 December 2022).
  28. Makarova, A.A.; Mitrova, T.A.; Kulagina, V.A. (Eds.) Forecast for the Development of Energy in the World and Russia 2019; M.: ERI RAS—Moscow School of Management SKOLKOVO: Moscow, Russia, 2019; 210p, ISBN 978-5-91438-029-5. [Google Scholar]
  29. Gole, I.; Dumitrache, V.-M.; Bălu, F.O. Assessment of a decade of greenhouse gas emissions. In Proceedings of the International Conference on Economics and Social Sciences, Bucharest, Romania, 2020; Springer: Berlin/Heidelberg, Germany, 2020; pp. 332–340. [Google Scholar] [CrossRef]
  30. Kotlikoff, L.; Polbin, A.; Zubarev, A. Will Paris accord accelerate climate change? Econ. Policy 2021, 16, 8–37. [Google Scholar]
  31. Valko, D. Impact of renewable energy and tax regulation on reducing greenhouse gas emissions in OECD Countries: CS-ARDL Approach. Econ. Policy 2021, 16, 40–61. (In Russian) [Google Scholar] [CrossRef]
  32. Stepanov, I.A. Energy taxes and their contribution to greenhouse gas emissions reduction. HSE Econ. J. 2022, 23, 290–313. [Google Scholar] [CrossRef]
  33. Golovanova, A.E.; Polaeva, G.B.; Nurmatova, E.A. European Union energy policy in renewable energy. Innov. Investig. 2018, 11, 52–55. (In Russian) [Google Scholar]
  34. Kilsedar, C.; Patani, S.; Olsson, M.; Girardi, J.; Mubareka, S. EU Bioeconomy Monitoring System Dashboards: Extended with Trade-Related Indicators; Publications Office of the European Union: Luxembourg, 2022; ISBN 978-92-76-61625-2. [Google Scholar] [CrossRef]
  35. A European Green Deal. Available online: https://commission.europa.eu/strategy-and-policy/priorities-2019-2024/european-green-deal_en#actions (accessed on 12 November 2022).
  36. Statistical Pocketbook 2022. Available online: https://op.europa.eu/en/publication-detail/-/publication/7d9ae428-3ae8-11ed-9c68-01aa75ed71a1/language-en/format-PDF/source-279588540 (accessed on 15 January 2023).
  37. OECD Investment Tax Incentives Database—2022 Update: Tax Incentives for Sustainable Development (Brochure); OECD Publishing: Paris, France, 2022; Available online: www.oecd.org/investment/investment-policy/oecd-investment-tax-incentives-database-2022-update-brochure.pdf (accessed on 22 January 2023).
  38. Steshenko, J.A.; Tikhonova, A.V. An integral approach to evaluating the effectiveness of tax incentives. J. Tax Reform 2018, 4, 157–173. [Google Scholar] [CrossRef]
  39. Mamedov, Z.F.; Qurbanov, S.H.; Streltsova, E.; Borodin, A.; Yakovenko, I.; Aliev, A. Mathematical models for assessing the investment attractiveness of oil companies. SOCAR Proc. 2021, 4, 102–114. [Google Scholar] [CrossRef]
  40. Country Profile—Sweden. European Environment Agency (Energy Support 2005–2012). Available online: https://webcache.googleusercontent.com/search?q=cache:GLvkJyidDjkJ:https://www.eea.europa.eu/publications/energy-support-measures/sweden-country-profile&cd=10&hl=ru&ct=clnk&gl=ru&client=safari (accessed on 15 January 2023).
  41. Bashir, M.F.; Benjiang, M.A.; Bashir, M.A.; Radulescu, M.; Shahza, U. Investigating the role of environmental taxes and regulations for renewable energy consumption: Evidence from developed economies. Econ. Res.-Ekon. Istrazĭvanja 2022, 35, 1262–1284. [Google Scholar] [CrossRef]
  42. Ministry of Finance of the Russian Federation. The Main Directions of the Bbudget, Tax and Customs Tariff Policy for 2019 and the Planning Period of 2020 and 2021. Annex 1—Tax Expenditures of the Russian Federation 2015–2021. (In Russisan). Available online: https://minfin.gov.ru/ru/perfomance/budget/policy/osnov?id_65=124752-osnovnye_napravleniya_byudzhetnoi_nalogovoi_i_tamozhenno-tarifnoi_politiki_na_2019_god_i_na_planovyi_period_2020_i_2021_godov (accessed on 10 January 2023).
  43. Report of the Working Group on Energy Taxation Reform: A Proposal for Implementing the Intentions and Goals of the Government Program and for Further Development of Energy Taxation; VN/11347/2019; Publications of the Ministry of Finance: Helsinki, Finland, 2021; ISBN 978-952-367-508-7. Available online: http://urn.fi/URN:ISBN:978-952-367-508-7 (accessed on 10 January 2023).
  44. South Korea. Survey of Global Investment and Innovation Incentive. 2020. Available online: https://www2.deloitte.com/content/dam/Deloitte/global/Documents/Tax/dttl-tax-survey-of-global-investment-and-innovation-incentives-southkorea-2020.pdf (accessed on 10 February 2023).
  45. Holmberg, R. How Are the Swedish Taxes on Energy and Carbon Dioxide Related to Energy Efficiency? Odyssee-Mure Project. 2020. Available online: https://www.odyssee-mure.eu/publications/policy-brief/swedish-taxes-energy-carbon.pdf (accessed on 10 January 2023).
  46. Ptak, M. Incentives to Promote the Development of Renewable Energy in Poland. Economic and Environmental Studies (E&ES). Econ. Environ. Stud. 2014, 14, 427–439. Available online: https://www.econstor.eu/bitstream/10419/178869/1/ees_14_4_05.pdf (accessed on 14 January 2023).
  47. Lusia, U.; Fino, D.; Grisolia, G. A thermo-economic indicator for the sustainable development with social considerations: A thermo-economy for sustainable society. Environ. Dev. Sustain. 2021, 24, 2022–2036. [Google Scholar] [CrossRef]
  48. Bressan, M.; Campagnoli, E.; Ferro, C.G.; Giaretto, V. Rice straw: A waste with a remarkable green energy potential. Energies 2022, 15, 1355. [Google Scholar] [CrossRef]
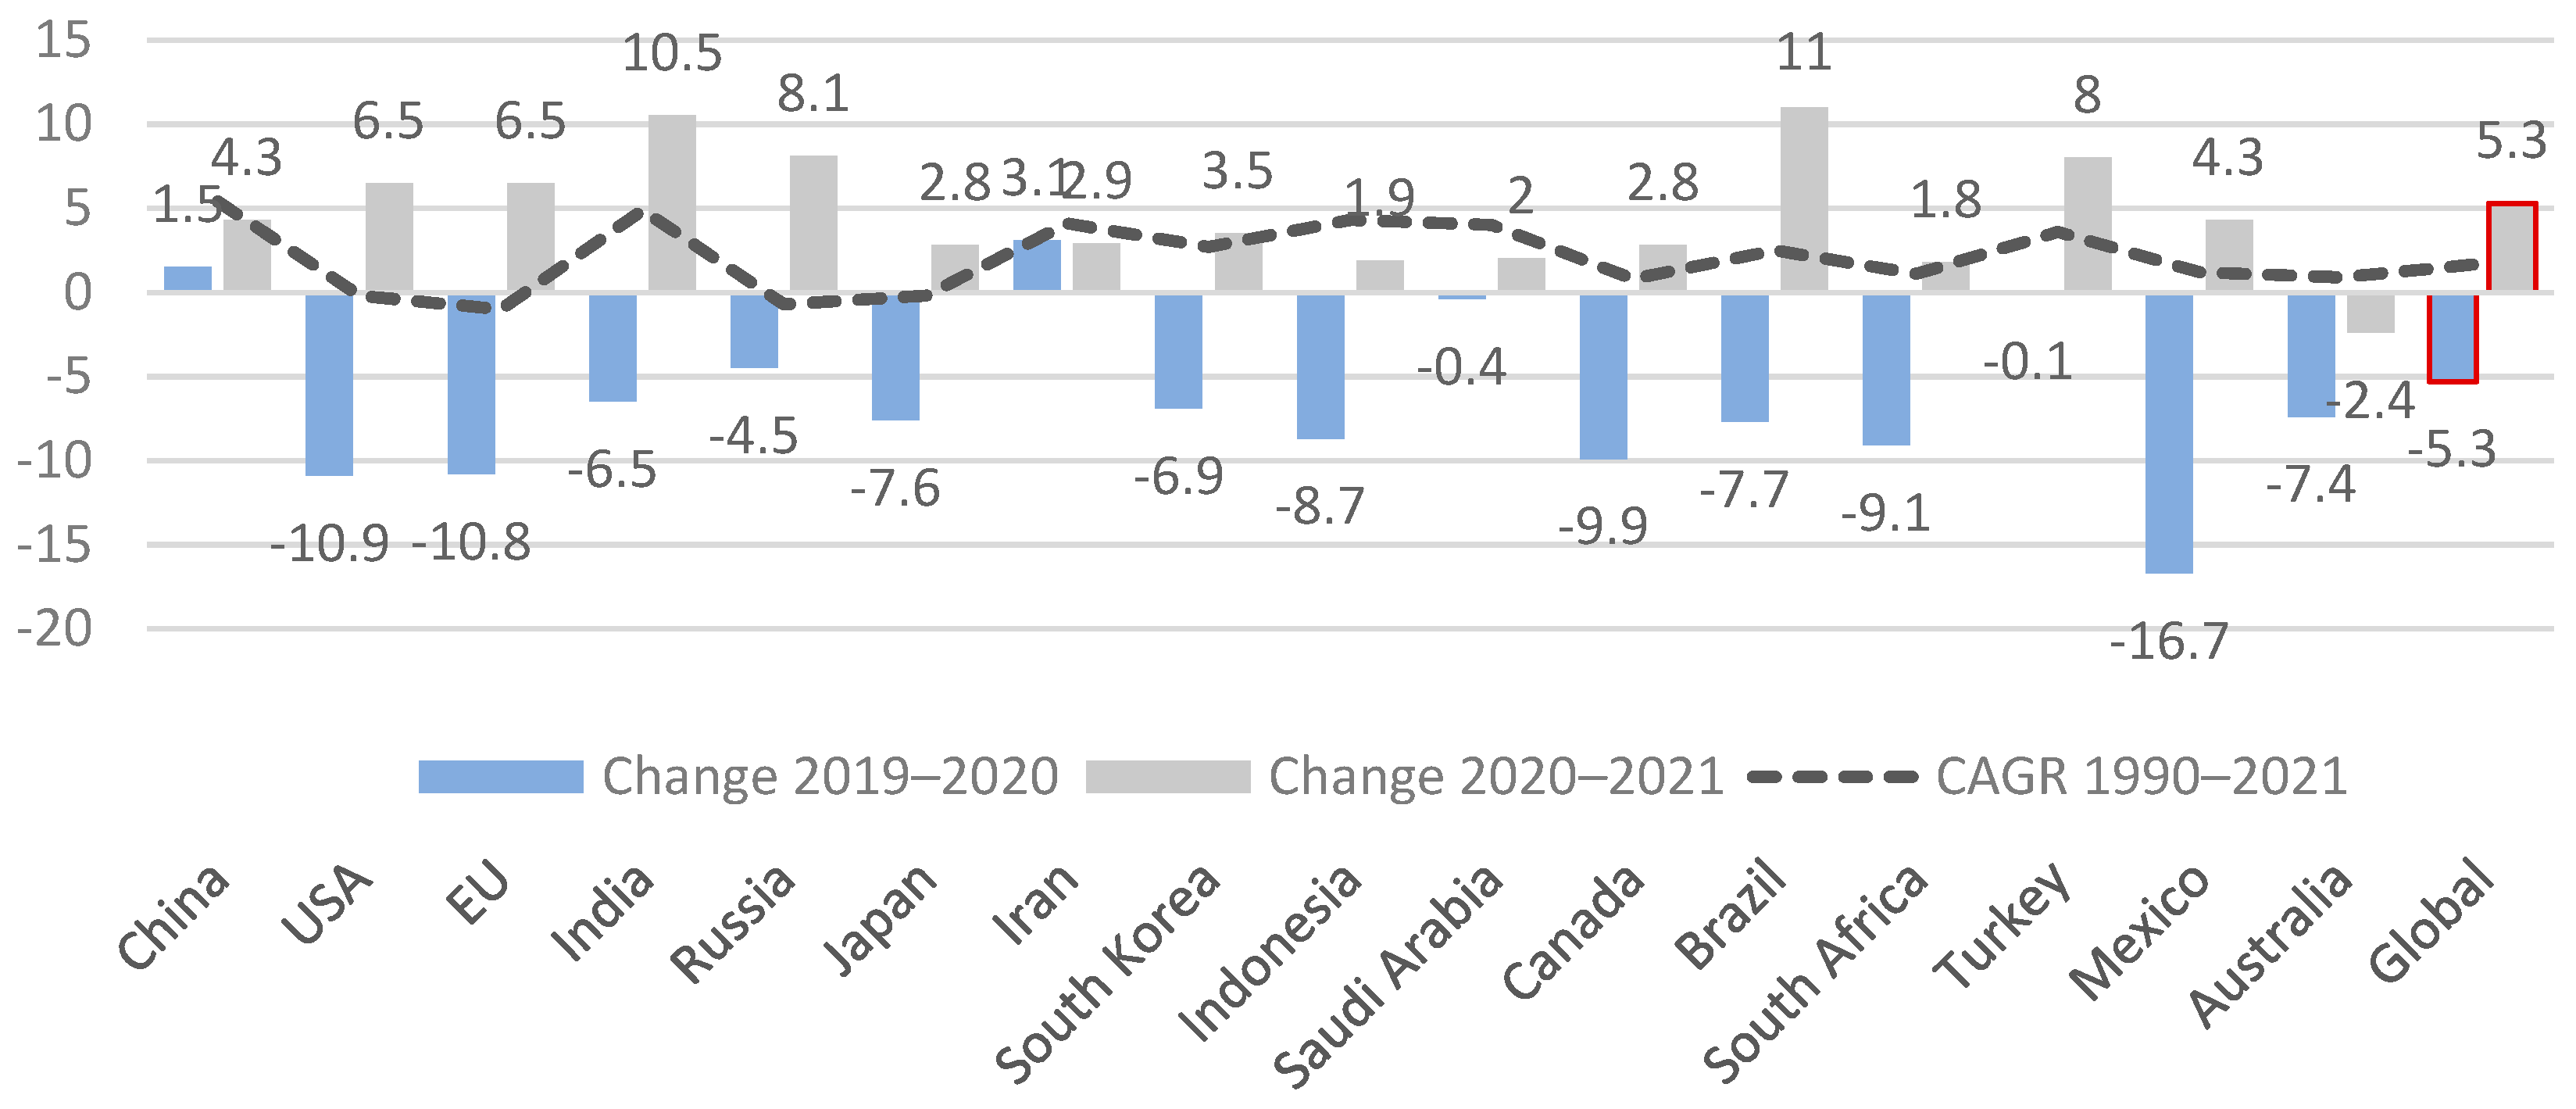
Figure 1. Dynamics of CO2 emissions in selected countries in the periods 2019–2020, 2020–2021, from 1990–2021 (%).
Energies 16 02652 g001
Figure 2. The share of RESs for transport, electricity, heating and cooling in the EU countries from 2015–2019, %. Source: compiled by the authors.
Energies 16 02652 g002
Figure 3. The energy intensity of the EU countries in 2000–2020, toe/M€. Source: compiled by the authors.
Energies 16 02652 g003
Figure 4. Ranking of OECD countries and OECD key partner countries by the share of tax expenditures for stimulating the energy sector in 2020. Source: compiled by the authors.
Energies 16 02652 g004
Table 1. Tax expenditures stimulating the energy sector development in selected OECD countries and key OECD partner countries from 2018–2020.
YearAustriaIndiaSpainSouth KoreaRussiaFranceSweden
% of GDP
20180.040.070.0020.010.10.010.005
20190.040.080.0020.010.10.010.005
20200.040.090.0020.010.130.010.005
% of tax revenues of the consolidated budget
20180.140.590.010.020.520.10.02
20190.130.60.010.020.940.10.01
20200.120.60.010.021.10.10.01
Source: compiled by the authors.
Table 2. Tax expenditures aimed at achieving environmental sustainability in selected OECD countries from 2018–2020.
CountryYearTax Expenditures Related to Increased Use of Renewable Energy SourcesTax Expenditures Related to Energy Efficiency Improvements
% of GDP% of Tax Revenues of the Consolidated Budget% of GDP% of Tax Revenues of the Consolidated Budget
Germany20180.010.05- -
20190.010.13- -
20200.030.15- -
Denmark20180.250.77- -
20190.240.72- -
20200.250.7- -
Ireland2018 - -0.0010.01
2019 - -0.0010.01
2020 - - 0.001 0.01
Spain2018 - -0.020.1
2019 - -0.020.1
2020 - -0.010.07
Italy20180.00270.01- -
20190.0030.013- -
20200.00360.016- -
Netherlands20180.030.120.030.14
20190.030.130.030.11
20200.040.150.030.1
Mexico20180.0120.1- -
20190.020.12- -
20200.0250.14 - -
Poland20180.010.07- -
20190.0150.09- -
20200.0150.1- -
South Korea20180.0040.020.010.05
20190.0040.020.010.08
20200.0040.020.010.1
Finland20180.010.010.331.58
20190.010.020.31.46
20200.010.020.291.41
France20180.010.020.090.51
20190.010.020.050.3
20200.010.020.050.3
Sweden2018- -0.160.68
2019- -0.231.04
2020- -0.25 1.1
Source: compiled by the authors.
Table 3. Ranking of OECD countries by share of tax expenditures related to the promotion of environmental sustainability in 2020.
CountryTax Expenditures Related to Increased Use of Renewable EnergyTax Expenditures Related to Energy Efficiency Improvements
%Ranking%Ranking
Poland83.31- -
Germany38.129.59
Sweden33.3333.34
Italy33.3316.76
Denmark304108
Finland28.6542.93
Mexico256 --
Netherlands19.478.310
South Korea17.6852.91
France17.6826.55
Latvia4.39 --
Ireland --502
Spain --33.34
Russia --12.57
Source: compiled by the authors.
Table 4. Grouping of countries by the level of tax expenditures for the energy efficiency and renewable energy sources, by the share in tax revenues of each country’s consolidated budget.
Level of tax expenditures for energy efficiency (b)high Finland
(+/−)
averageSweden (+)France
(c/−)
lowSpain (−)
Ireland (c)
South Korea (c/+)Netherlands (+/−)
na Italy (+)Germany (+)
Poland (+)
Mexico (+)
Denmark (−)
nalowaveragehigh
Level of tax expenditures for increasing renewable energy (a)
Symbols: (−)—decrease; (+)—increase, (c)—constant level, (a/b). Source: compiled by the authors.
Table 5. Multivariate average indicator, reflecting the rating of each country in estimating the scale of tax incentives.
CountryTax Expenditures Stimulating the Energy Sector DevelopmentTax Expenditures Related to Increased Use of Renewable Energy SourcesTax Expenditures Related to Energy Efficiency ImprovementsNumber of IndicatorsIntegrated Indicator Reflecting Rating (Multivariate Average)
% of GDP% of Tax Revenue% of GDP% of Tax Revenue% of GDP% of Tax Revenue
Spain0.0020.01 - -0.010.0740.2030
South Korea0.010.020.0040.020.010.160.4954
France0.010.10.010.020.050.361.0663
Sweden0.0050.01 - -0.251.141.3783
Netherlands - -0.040.150.030.141.4583
Finland - -0.010.020.291.4141.6179
Average value0.00680.03500.01600.05250.10670.5133--
Source: compiled by the authors.
Disclaimer/Publisher’s Note: The statements, opinions and data contained in all publications are solely those of the individual author(s) and contributor(s) and not of MDPI and/or the editor(s). MDPI and/or the editor(s) disclaim responsibility for any injury to people or property resulting from any ideas, methods, instructions or products referred to in the content.