2. Research Results
The analysis of the national oil and petroleum products market will be carried out in the context of comparison with the main oil-producing countries, since the Russian oil market is a single interconnected phenomenon functioning on the basis of changing rates of development of the world oil market, fluctuations in supply and demand, schemes for promoting goods on world markets.
One of the most important development problems that have a direct impact on the dynamics of oil production growth is the adequacy of the replenishment of the resource base. Proven reserves are oil reserves, which, based on the analysis of geological and engineering data, can be said with a high degree of confidence that they are commercially recoverable from a certain date, based on known reserves and in current economic conditions. Proven reserves is a term used by the world’s most widespread global classification, which takes into account not only the probability of finding oil and gas in the field, but also the economic efficiency of extracting these reserves. Some statistics in this list are controversial and contradictory, as different sources (OPEC, CIA World Factbook [
14,
15], oil companies) give different figures, and there are different types of oil. In addition, the results of the calculation of proven reserves in certain countries may change, since previously economically inefficient deposits can be assessed as effective.
The study of oil reserves considered by us in comparison with the main oil-producing countries showed their extremely uneven distribution across the countries and regions of the continent.
Table 1 presents data on oil reserves and production volumes in the main oil-producing countries of the world [
16].
Based on the data in
Table 1 compiled on the basis of the Statistical Review of World Energy for 2020 by British Petroleum, it can be emphasized that the proven world oil reserves in the world are estimated at 242.17 billion tons, of which OPEC countries accounted for 70.5% of world reserves. The countries with the largest proven oil reserves were: Venezuela, with 300,878 billion barr. or 19.9%; Saudi Arabia, with 297,700 billion barrels, or 16.7%; and Iran, with 211,600 billion. barr. or 11.9% of the global reserves. Additionally, among the 10 largest countries were Canada, Iraq, the United Arab Emirates, Kuwait, Russia, Libya and Nigeria. In the table, in addition to the number of oil reserves, the projected year of depletion of oil reserves in the current production and production of oil in the countries of the world is indicated. So, in Russia, according to forecasts, if no new deposits are discovered or current consumption does not decrease, oil reserves may be exhausted by 2039. In general, according to experts, the world’s oil reserves are sufficient to meet the growing global demand for about 40 years.
The Russian Federation ranks 8th in proven oil reserves with reserves of 80 billion. barrels, which is 4% of global reserves, and for the production conditions of the Russian Federation, the use of this volume is likely to be 22.5 years. At the same time, the availability of reserves in the main oil-producing countries is: 86 years in Saudi Arabia, and more than 100 years in Iran and Venezuela. Assessing the oil reserves of the Russian Federation by districts, it should be noted that the state reserves balance takes into account 2525 oil fields, of which about 2/3 of the explored reserves are concentrated in 150 large facilities, and most of the Russian fields are medium and small and their share in many regions reaches 20–50%. Empirical analysis of oil reserves in the context of federal districts revealed their shares in the domestic market [
17]: Ural, 36%; Volga, 22.6%; Siberian, 16%; Far Eastern, 7.8%; Northwestern, 6.6%; Southern, 5.7%; North Caucasian, 5.3%. Another problem is the inefficient structure of the reserves being developed, and as a result, oil production at 50% of the country’s fields is unprofitable, and the share of hard-to-recover and low-efficiency reserves in the total balance of proven reserves has reached 55%.
Next, let us look at the dynamics of oil production by the leading countries of the world—
Table 2 [
18].
Analysis of the dynamics of oil production by the leading countries of the world has shown that the dynamics of replenishment of oil and gas reserves in the world does not correspond to the dynamics of production.
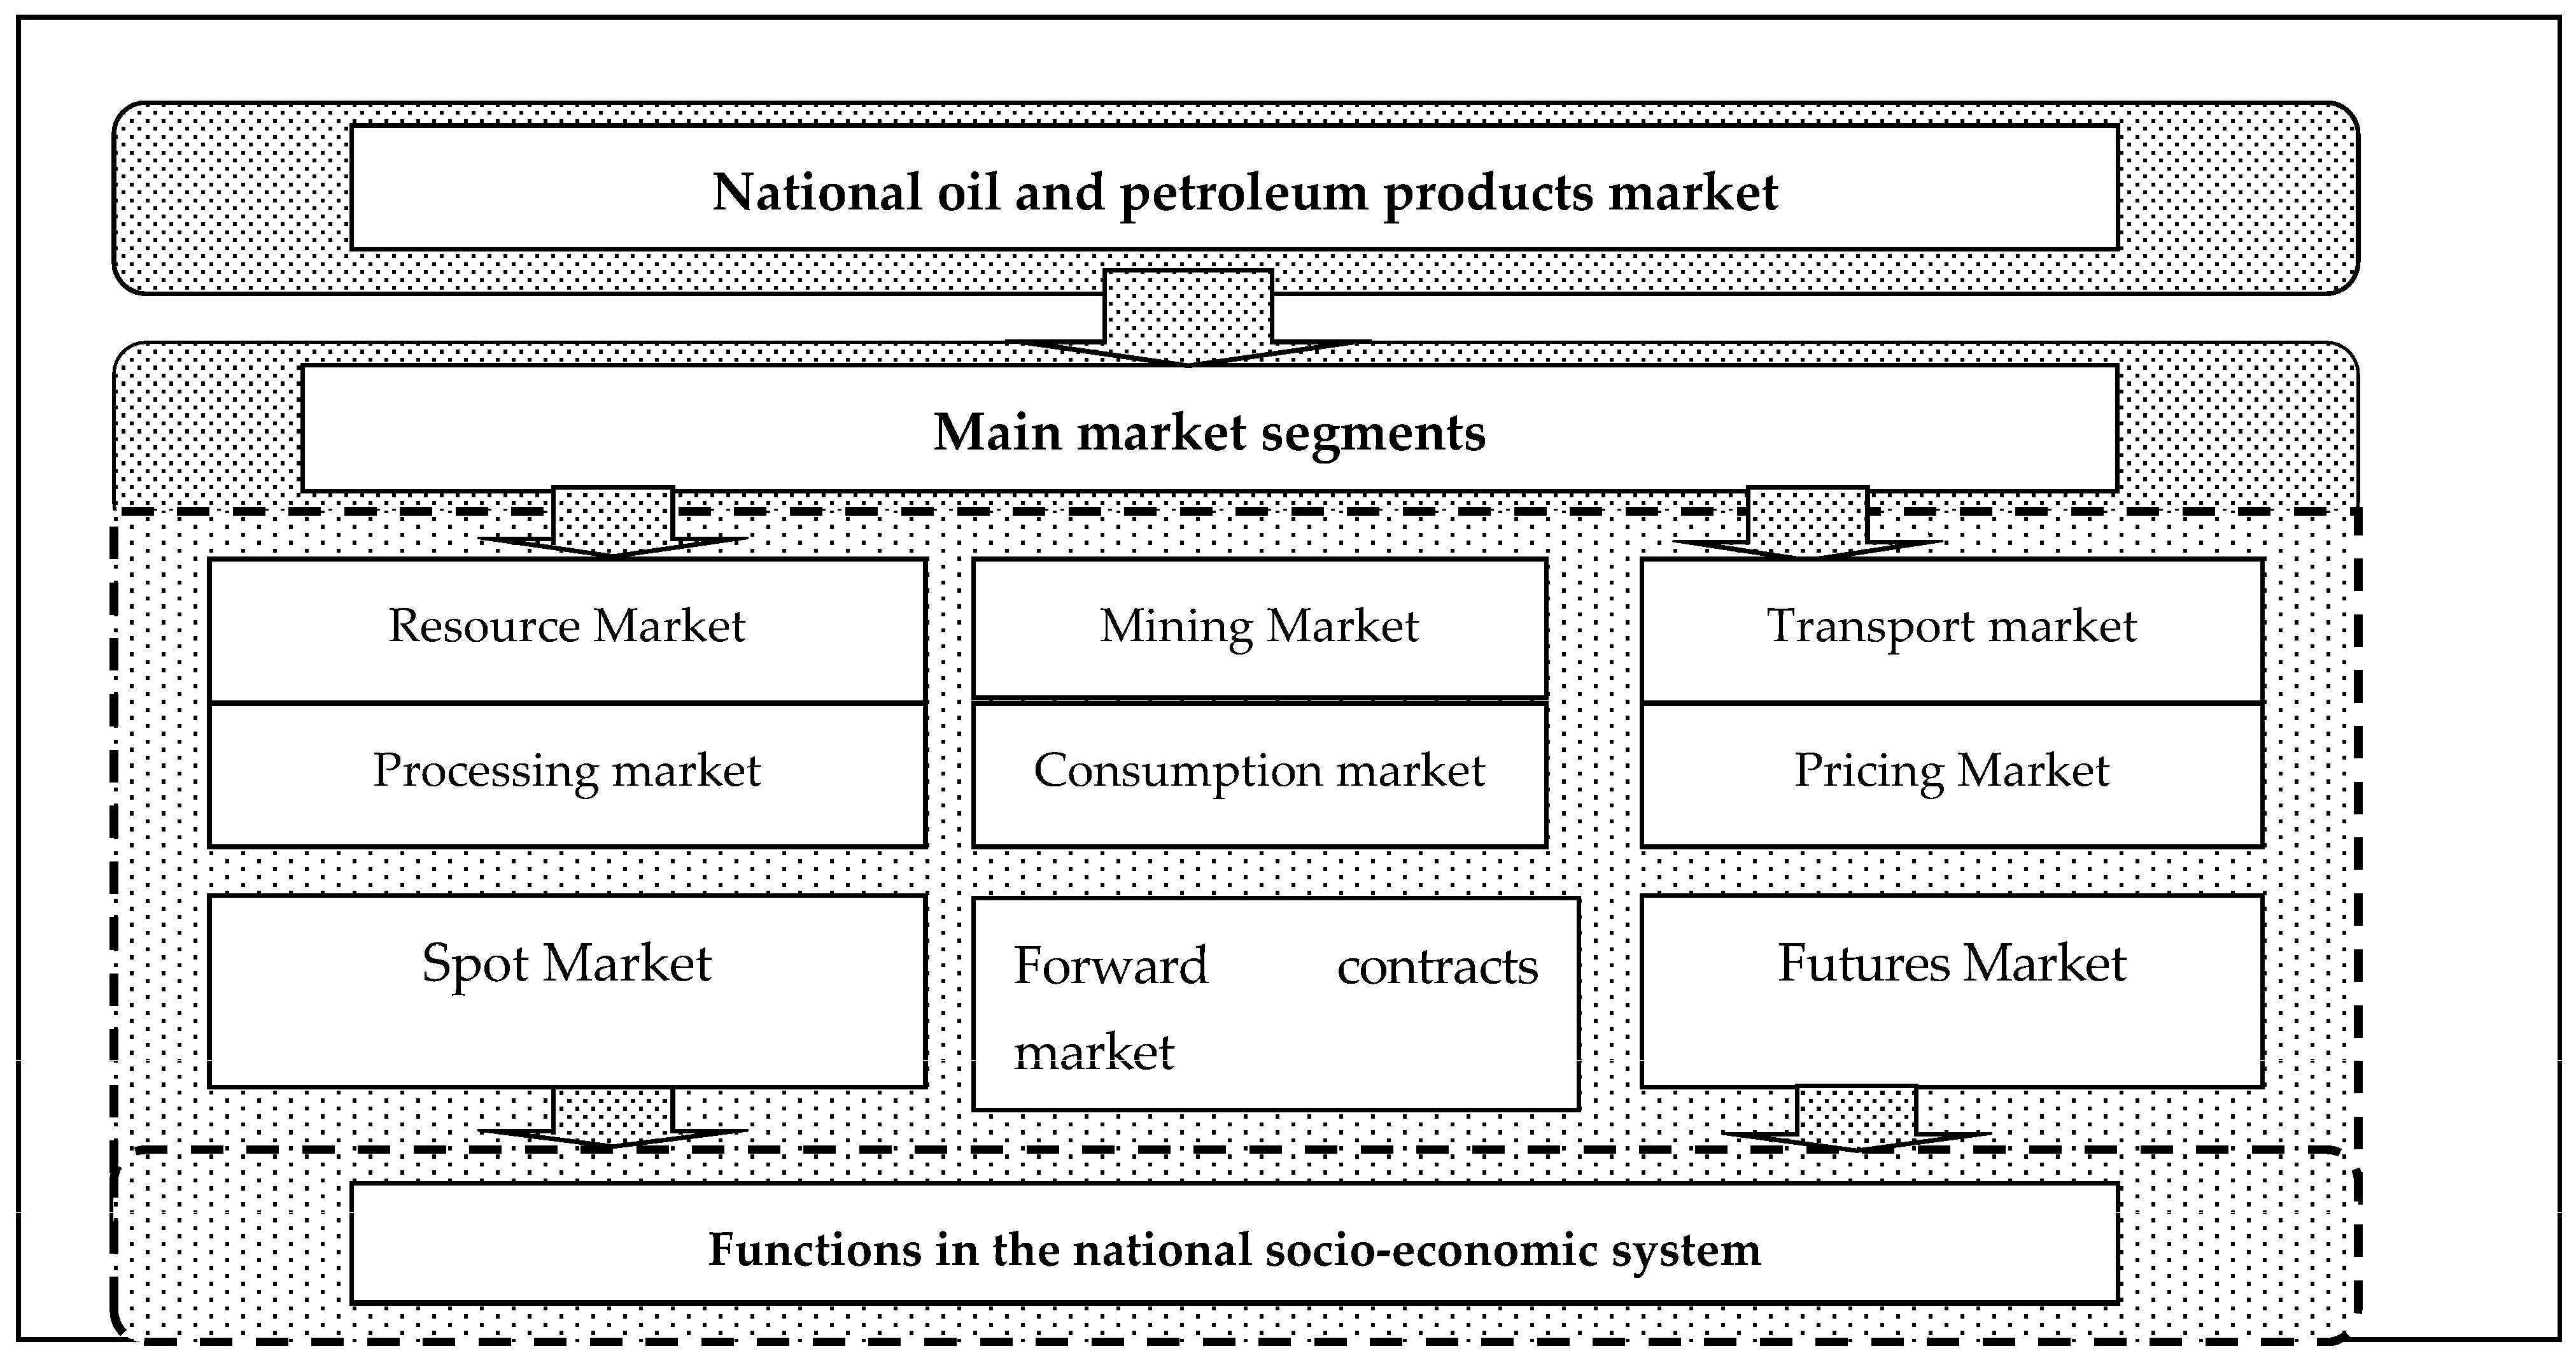
The structure of the modern Russian oil and petroleum products market, formed at the beginning of the XXI century, is a set of markets: resource oil raw materials, extraction, transportation, petroleum products, production of goods and services, and consumption. At the same time, the oil market of recent years has been characterized by its serious transformation, manifested in a significant diversification of its institutional structure, in the functioning of traditional, innovative market segments: spot market and forward contracts, and a futures segment, which is accompanied by a change in the positions of the main participants and the emergence of new players. The scheme of the national oil and petroleum products market of the Russian Federation is shown in
Figure 1.
The modern Russia, steadily developing the oil and petroleum products market, significantly affects the pace of economic development, and trends show that the main macroeconomic parameters of the country are characterized by positive dynamics: the growth of the most important economic indicators of development, a decrease in inflation, population growth, and the preservation of high oil prices. However, the growth of the main economic parameters is not sustainable over the long term, due to their provision, to a large extent, and due to the favorable conjuncture of the world oil markets.
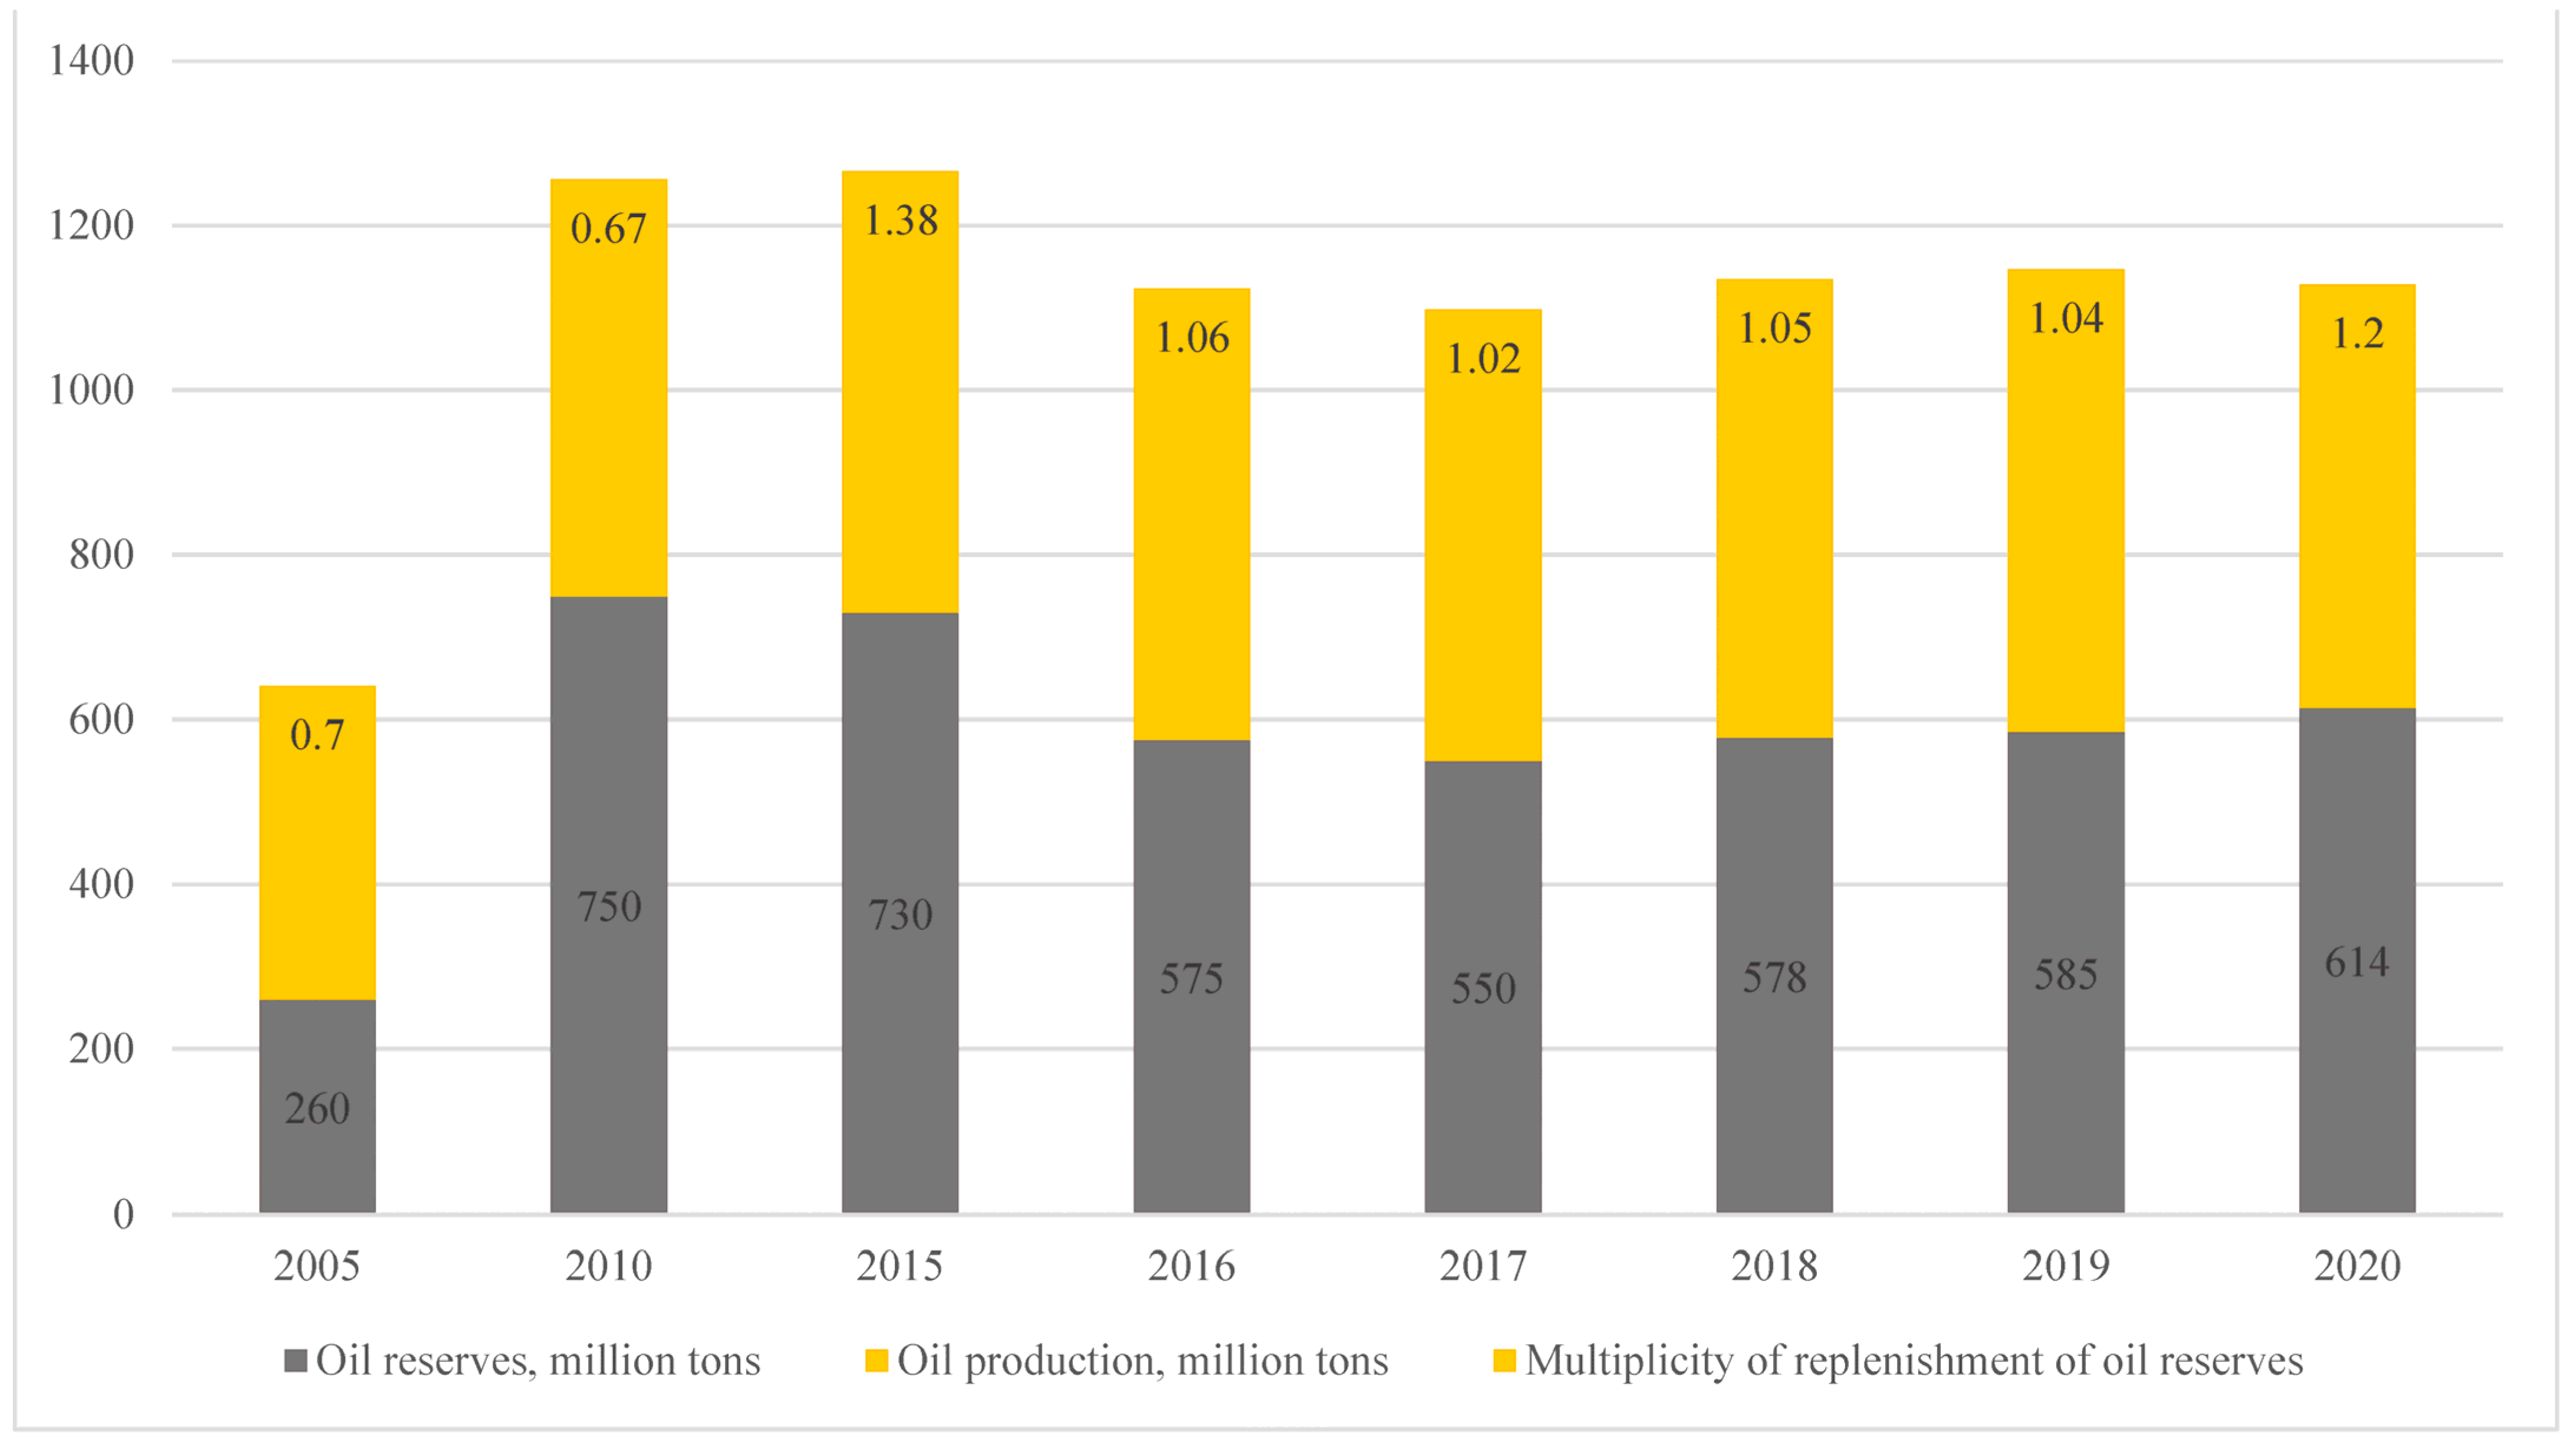
The stability of the extractive industries largely depends on the volume of preparation and quality of the mineral resource base (MSB), the parameters of the process of reproduction of reserves. In the period from 1991 to 2004, there was a steady decline in the rate of preparation of the raw material base of oil; in 2004, the increase in reserves amounted to only 218 million tons, or 47% of the current level of oil production in the country. However, with the rise in world oil prices and the need to replenish the raw material base, the growth rate of reserves began to grow, and in 2008, for the first time in 15 years, the volume of preparation of new reserves corresponded to the level of current oil production (500 million tons).
In the period after 2004, up to 2010, there was a steady excess of the increase in oil reserves over production. The increase in oil reserves as a result of geological exploration carried out at the expense of the federal budget and subsoil users in 2020, according to the Ministry of Nature of Russia, amounted to 614 million tons, an increase of 29 million tons or 5.0% compared to the previous year. In general, the dynamics of oil production, its reserves, as well as the multiplicity of replenishment of oil reserves in the Russian Federation for 2004–2010 is presented in
Figure 2 [
19].
It follows from the data in
Figure 2 that the reserves of crude oil in Russia for the period from 2010 to 2020 decreased by almost a third. Thus, oil reserves in the country in 2010 amounted to 28.2 billion tons, and in 2020, this value was 19.1 billion tons. At the same time, compared to 2019, 2020 stocks increased by 2.1%. The minimum increase in reserves over the past decade was noted in 2017, when it compensated for a decrease of only 3%. In 2019, the excess of growth over production was 14%. In 2020, the excess increase in oil reserves amounted to almost 70%, due to a sharp decline in production and a significant increase due to exploration.
In the production of liquid hydrocarbons in Russia over the past decade, positive dynamics has been observed and an increase of 9.3% has been noted. Oil production in Russia peaked in 2019 at 561.0 million tons. During the analyzed period, the exception was 2020, which revealed a decrease in oil production. According to the results of 2020, the volume of national crude oil production decreased by 48.4 million tons (−8.6%) compared to 2019 and amounted in absolute terms to 513.1 million tons at least over the past 10 years. Against the background of the spread of coronavirus, restrictive measures were introduced in many countries of the world, which led to a reduction in business activity, a decrease in consumer demand and prices for hydrocarbons. The decrease is also due to Russia’s fulfillment of its obligations to curb national oil production at the level of quotas established under the OPEC+ agreement, which eliminated the entire ten-year growth.
Another important factor in the efficiency of the industry is the territorial location of production. The grouping of the federal districts of the Russian Federation by the volume of production of liquid hydrocarbons in Russia by federal districts is presented in
Figure 3.
Based on the data in
Figure 3, it is possible to draw conclusions about the territorial localization of oil production in the federal districts of the Russian Federation, which showed that in 2020 they excelled in industrial production: Ural (60.7%) and Volga Federal districts (21.2%). In Group 2, the Siberian (5.8%), Far Eastern (3.6%), Northwestern (6.3%) federal districts. The lowest level of oil production is in two federal districts: the Southern (1.8%) and the North Caucasus (0.4%).
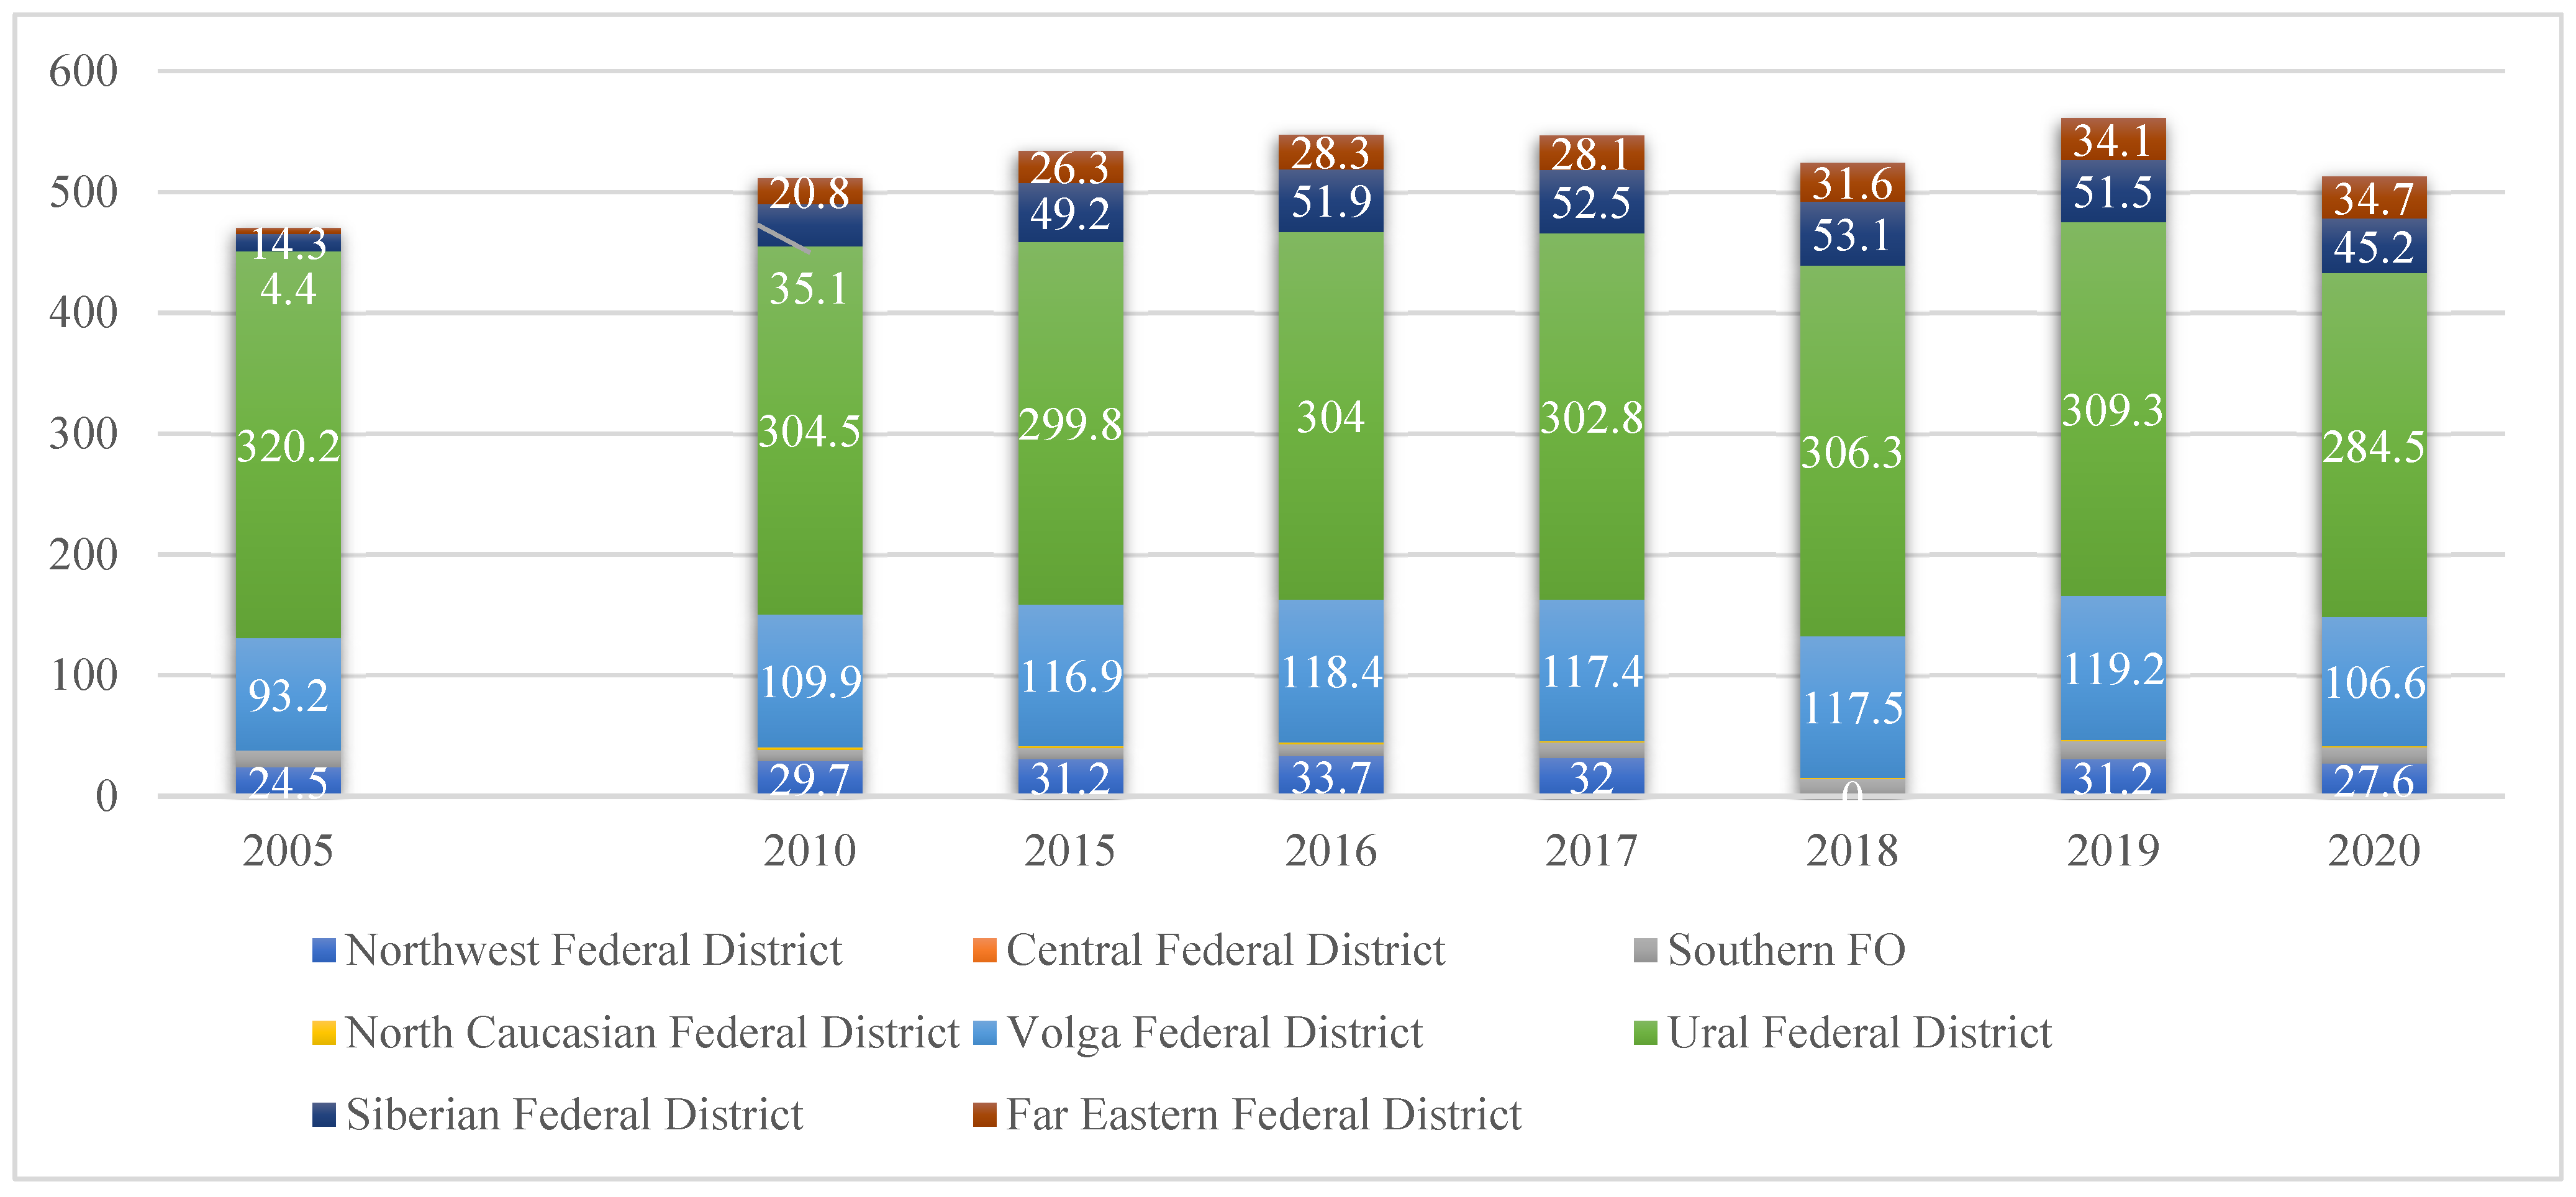
Figure 4 shows the dynamics of oil production by federal districts of the Russian Federation for 2005–2020.
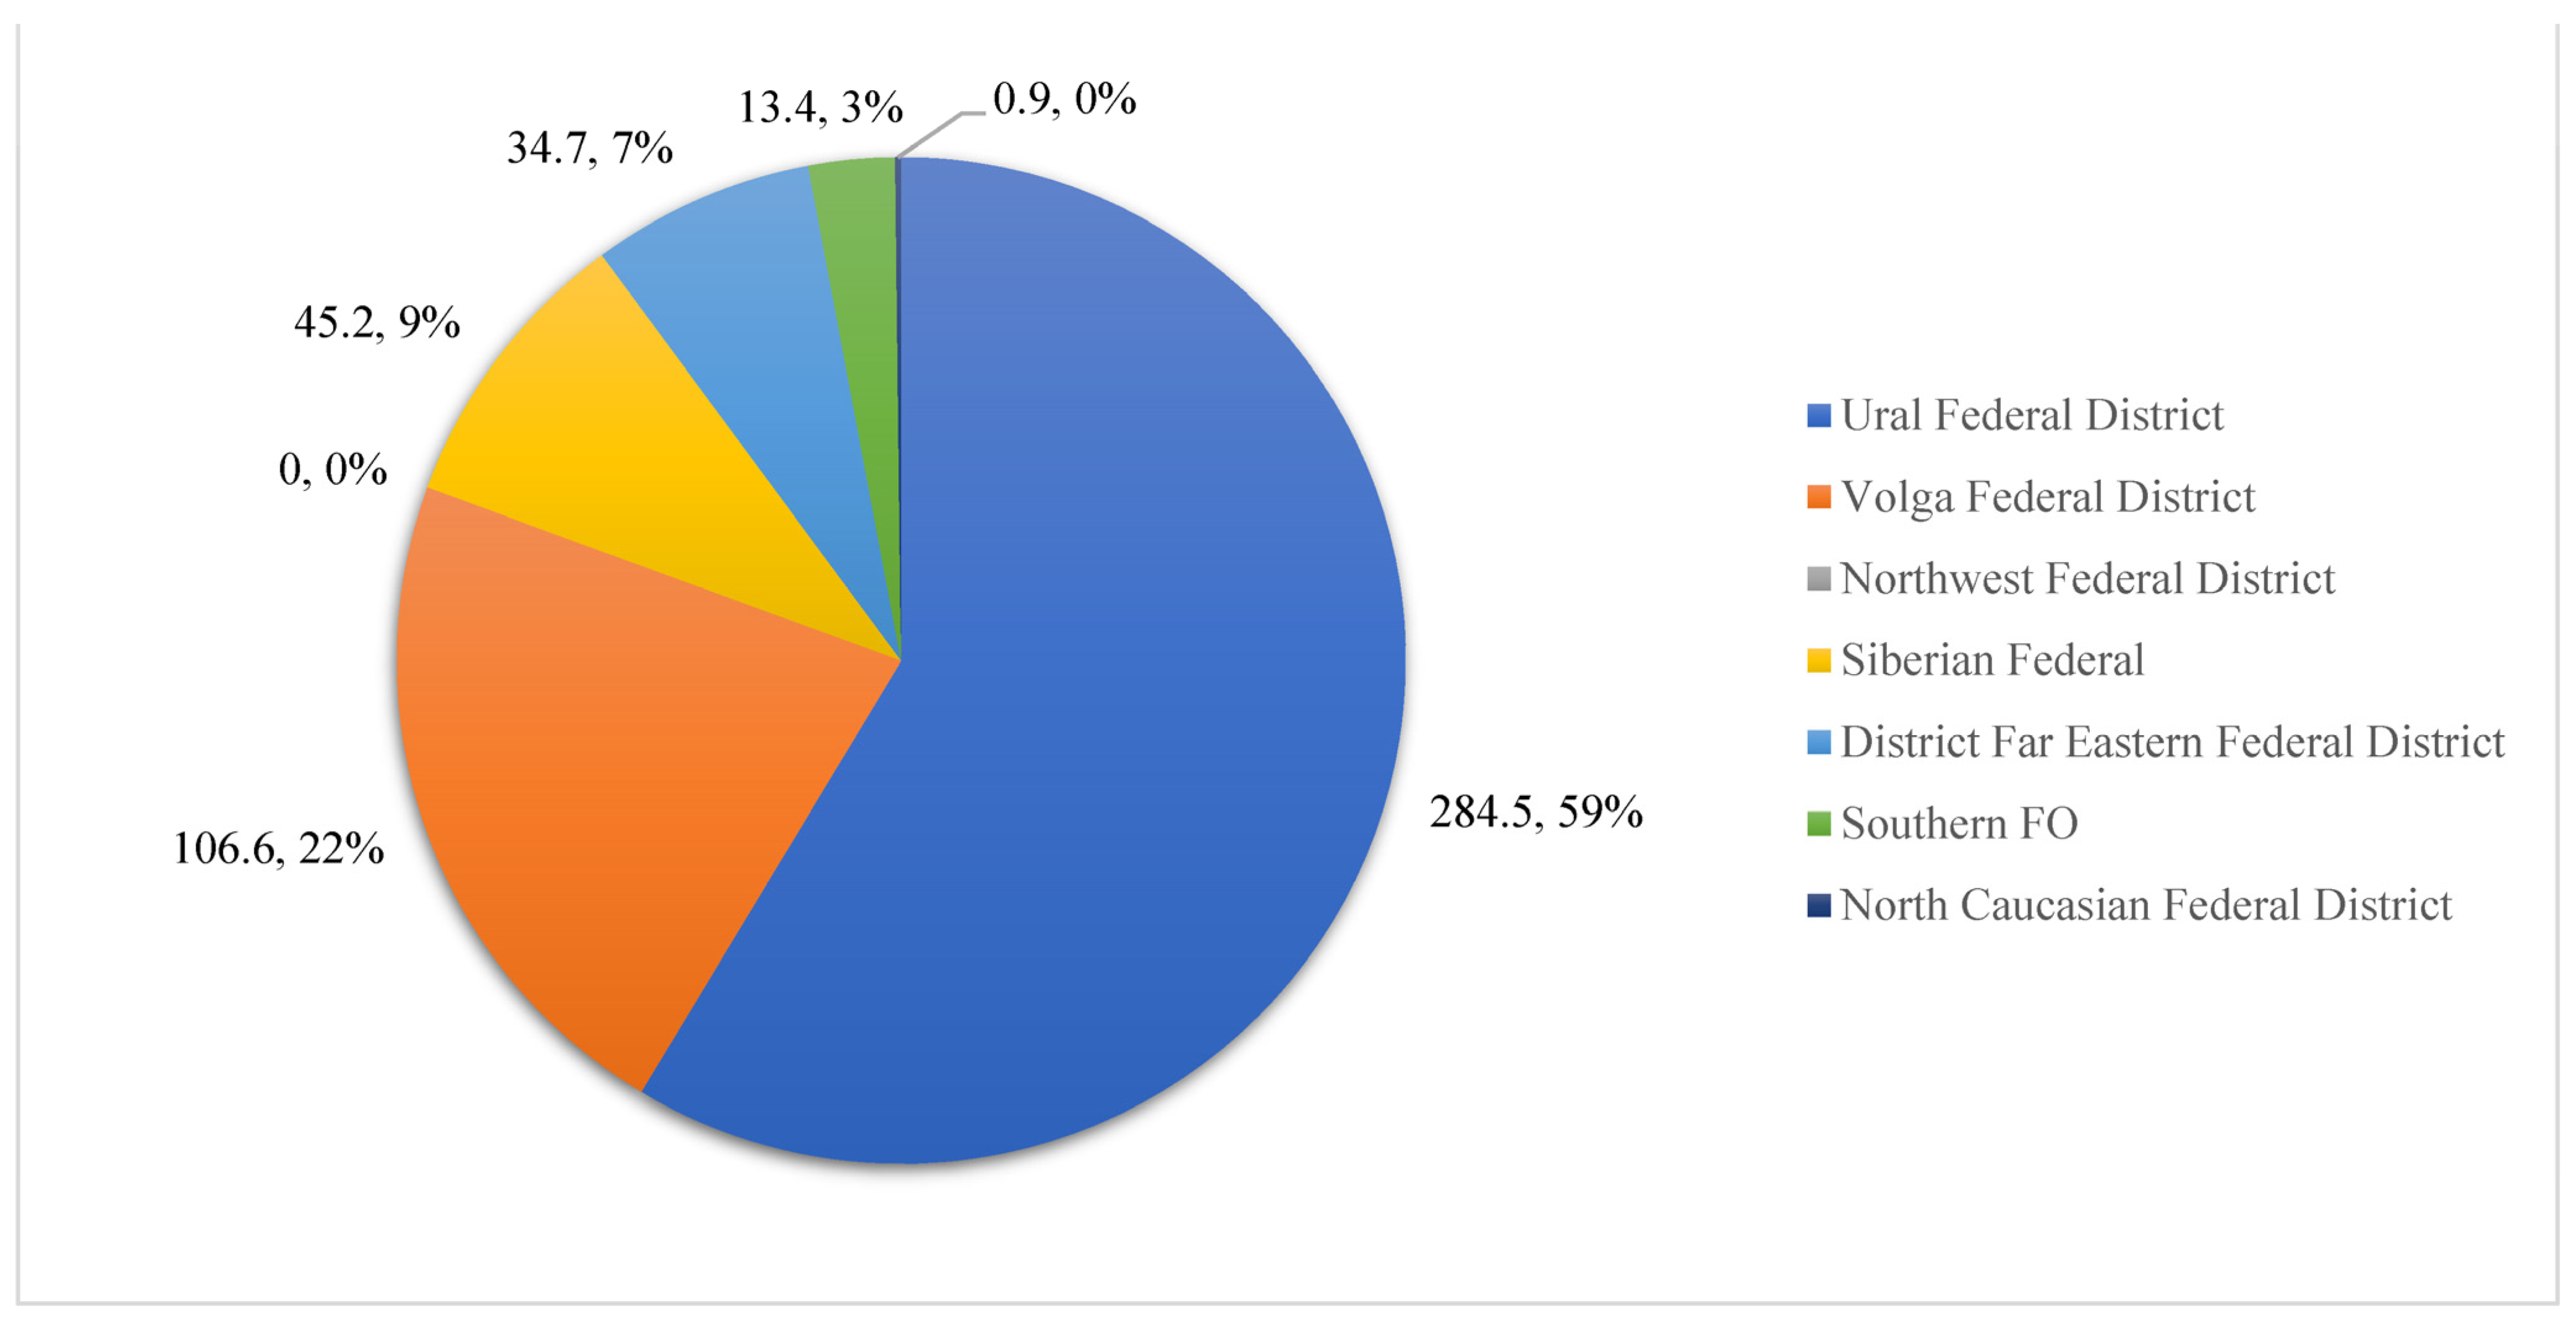
The presented statistical data in
Figure 4 allow us to conclude that the leader in 2020 in oil production is the Ural Federal District, in which about 67% of Russia’s oil reserves are concentrated and 284.5 million tons of oil were produced. In the Khanty-Mansiysk (KhMAO) and Yamalo-Nenets Autonomous Okrugs, which are part of the district, oil fields are exploited, which belong to the West Siberian oil and gas province. The Volga Federal District was in second place in terms of oil production, where in 2020, oil production amounted to 106.6 million tons. The largest oil-producing entities of the district are the Republic of Tatarstan and the Republic of Bashkortostan, within which the main oil production regions are located, which are part of the Volga-Ural oil and gas province. In third place was the Siberian Federal District, where there is a tendency to increase oil production due to the discovery of new fields in Eastern Siberia. Thus, oil production in the district increased almost 4 times: from 14.3 million tons, in 2005, to 45.2 million tons, in 2020. Next on the list are the Far Eastern District, with an oil production volume of 34.7 million tons, and the Northwestern Federal District, where the volume of oil production in the region amounted to 27.6 million tons. The Southern and North Caucasian Federal Districts complete the rating, with production volumes of 13 and 0.9 million tons, respectively.
The presented statistical data in
Figure 4 allow us to conclude that the leader in 2020 in oil production is the Ural Federal District, in which about 67% of Russia’s oil reserves are concentrated, and 284.5 million tons of oil were produced. In the Khanty-Mansiysk (KhMAO) and Yamalo-Nenets Autonomous Okrugs, which are part of the district, oil fields are exploited, which belong to the West Siberian oil and gas province. The Volga Federal District was in second place in terms of oil production, where in 2020, oil production amounted to 106.6 million tons. The largest oil-producing entities of the district are the Republic of Tatarstan and the Republic of Bashkortostan, within which the main oil production regions are located, which are part of the Volga-Ural oil and gas province. In third place was the Siberian Federal District, where there is a tendency to increase oil production due to the discovery of new fields in Eastern Siberia. Thus, oil production in the district increased almost 4 times: from 14.3 million tons, in 2005, to 45.2 million tons, in 2020. Next on the list are the Far Eastern District, with an oil production volume of 34.7 million tons and the Northwestern Federal District, where the volume of oil production in the region amounted to 27.6 million tons. The Southern and North Caucasian Federal Districts complete the rating, with production volumes of 13 and 0.9 million tons, respectively.
Oil companies are currently of decisive importance in the Russian oil industry. In 2020, 285 organizations with licenses for the right to use the subsoil carried out oil production on the territory of the Russian Federation, including: 98 organizations included in the structure of 11 vertically integrated companies; 184 independent mining companies; and 3 companies operating under the terms of production sharing agreements. The main volume of national oil production formed by the five largest vertically integrated companies is large joint-stock companies controlled by the state (Rosneft, Gazprom Neft) and private shareholders (LUKOIL, Surgutneftegaz, etc.). In fact, the share of the free oil market in the Russian Federation is about 15–20%, which indicates its oligopolistic nature.
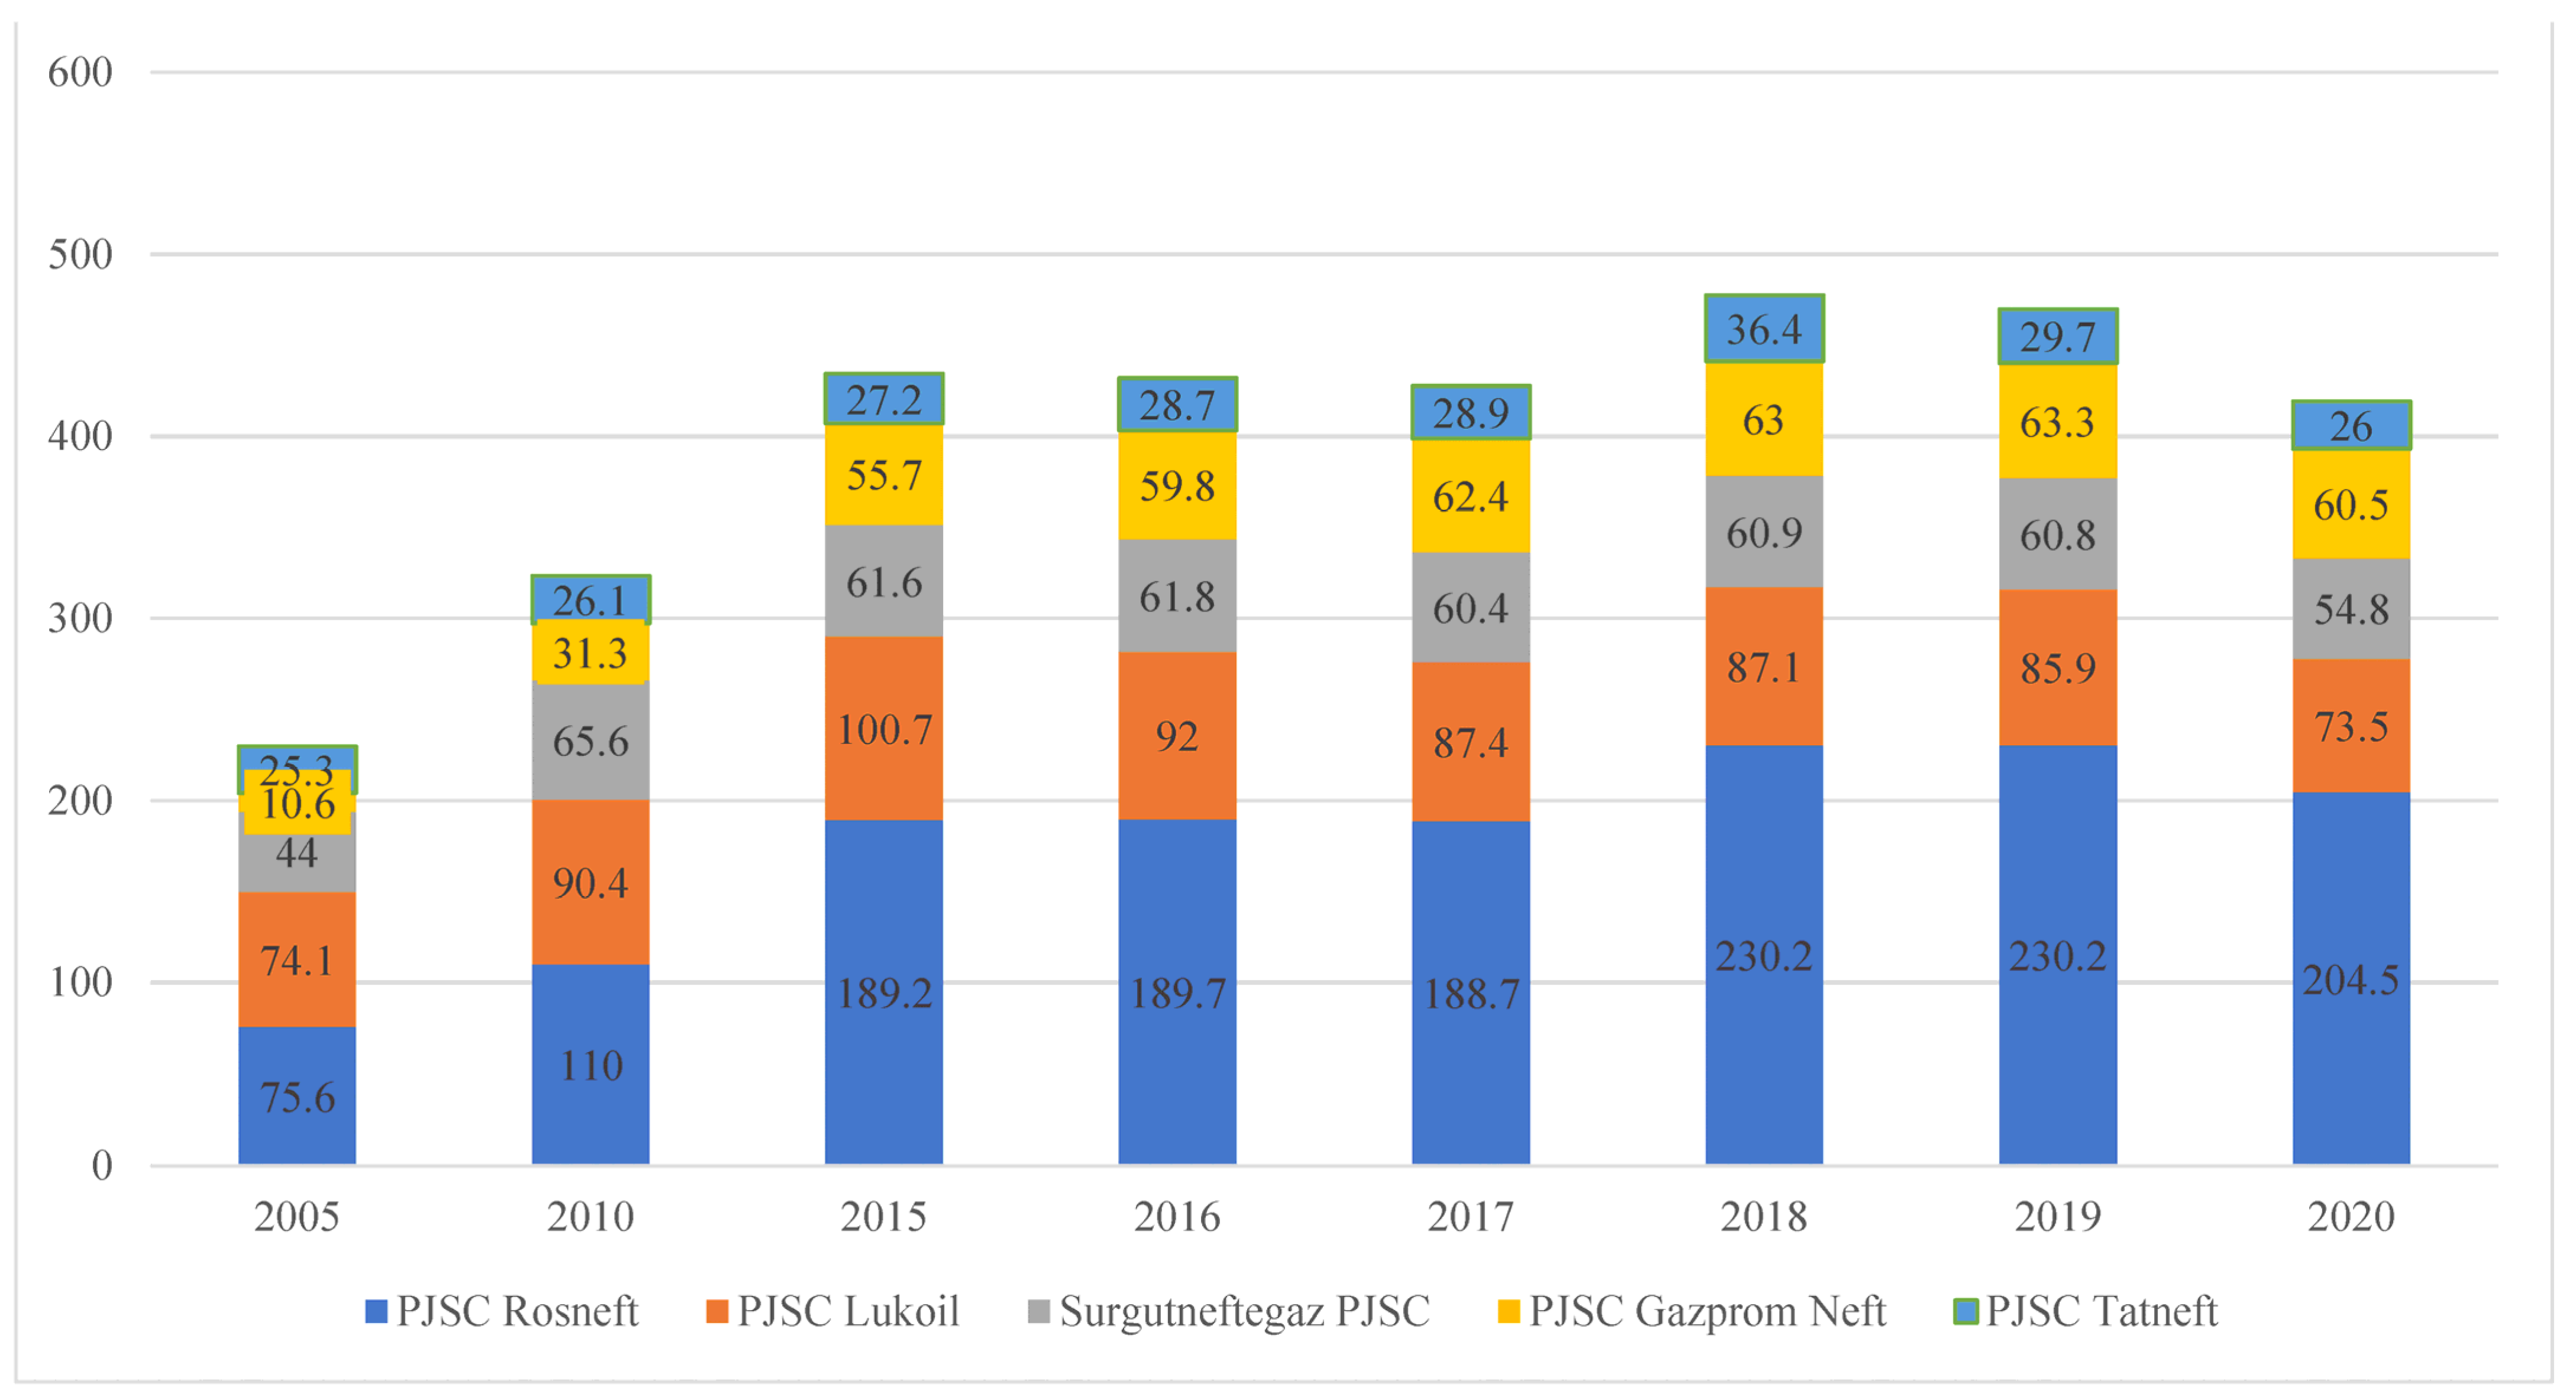
Figure 5 shows the dynamics of oil production by the largest Russian vertically integrated oil companies for 2005–2020 [
20,
21,
22,
23,
24,
25].
An analysis of the dynamics of oil production by Russian vertically integrated companies in
Figure 5 showed that in 2020, there was a decrease in oil production, as the OPEC+ countries, including Russia, reached an agreement to reduce oil production by 2 million barrels per day, which was the largest reduction since the beginning of the Aids-2019 pandemic. Thus, PJSC Rosneft accounted for the largest amount of oil production, the volume of which amounted to 230.2 million tons, in 2019, and 204.5 million tons, in 2020. In second place was PJSC Lukoil, with 85.9 and 73.5 million tons, respectively. Next is PJSC Surgutneftegaz, whose operating data for 2020 showed that oil production amounted to 54.7 thousand tons, which is 10% lower than in 2019. Revenue also decreased synchronously by 31% in 2020, but profit increased almost 7 times compared to the previous year and amounted to 742 billion rubles.
During the analyzed period, there is a tendency in the structure of oil production to reduce the share of vertically integrated companies and strengthen the positions of independent producers. Thus, in the structure of oil and condensate production, 78.5% is accounted for by vertically integrated companies, 17.9% of hydrocarbons are produced by independent companies, and 3.6% of production is accounted for by companies operating under production sharing agreements. The average growth rate of oil production by independent companies over the past 10 years was 7.8%, and the crisis of 2020, to a lesser extent, affected the level of their production, in which production decreased by 3%, while vertically integrated companies were forced to reduce production by 10%.
Another important segment of the oil market is the refining sector. According to the Ministry of Energy of the Russian Federation, in 2020, 32 large oil refineries, 250 mini-refineries, 6 specialized plants for the production of specialized oils and lubricants operated in the country, with their placement being closer to the places of consumption [
26]. The volume of refined petroleum products was 6.9 million barrels daily, with a volume of 7% of the world market. The leader of the international oil refining market was the USA, with a 20% share, 130 refineries and a production volume of 18.9 million barrels per day. The second place was occupied by China, with a market share of 17% and an oil refining volume of 13.5 million barrels. per day.
In the Russian Federation, the largest refining capacities belong to the refineries of Rosneft, Lukoil, Gazprom Neft and Surgutneftegaz. The main volume of primary oil refining is accounted for by PJSC Rosneft, which operates 9 refineries in the country (Komsomolsk (Komsomolsk-on-Amur city, Khabarovsk Territory, Tuapse (Tuapse city, Krasnodvrsky Territory), Kuibyshevsky (Samara city, Samara region), Novokuibyshevsky city of Novokuibyshevsk, Samara region), Syzransky (Samara city, Samara region), Achinsky (Bolsheuluysky district of Krasnoyarsk Krai), Saratov Refinery (Saratov city, Saratov region), Ryazan Refinery (Ryazan city, Ryazan region) and Angarsk Petrochemical Company (Angarsk city, Irkutsk region)). In general, the plants of PJSC Rosneft processed 77.5 million tons of oil in 2020, which is 3.2 million tons or 4.1% less compared to 2019. The refineries of PJSC Lukoil processed 45.6 million tons of oil in 2020, which is 0.8 million tons less than in 2019. There are fewer indicators of Rosneft plants. At the same time, it is necessary to take into account the average production per enterprise, which is 12 million tons of oil per year. In this aspect, Surgutneftegaz Joint-stock Company is the leader, since with only one enterprise, its capacity amounted to 22 million tons.
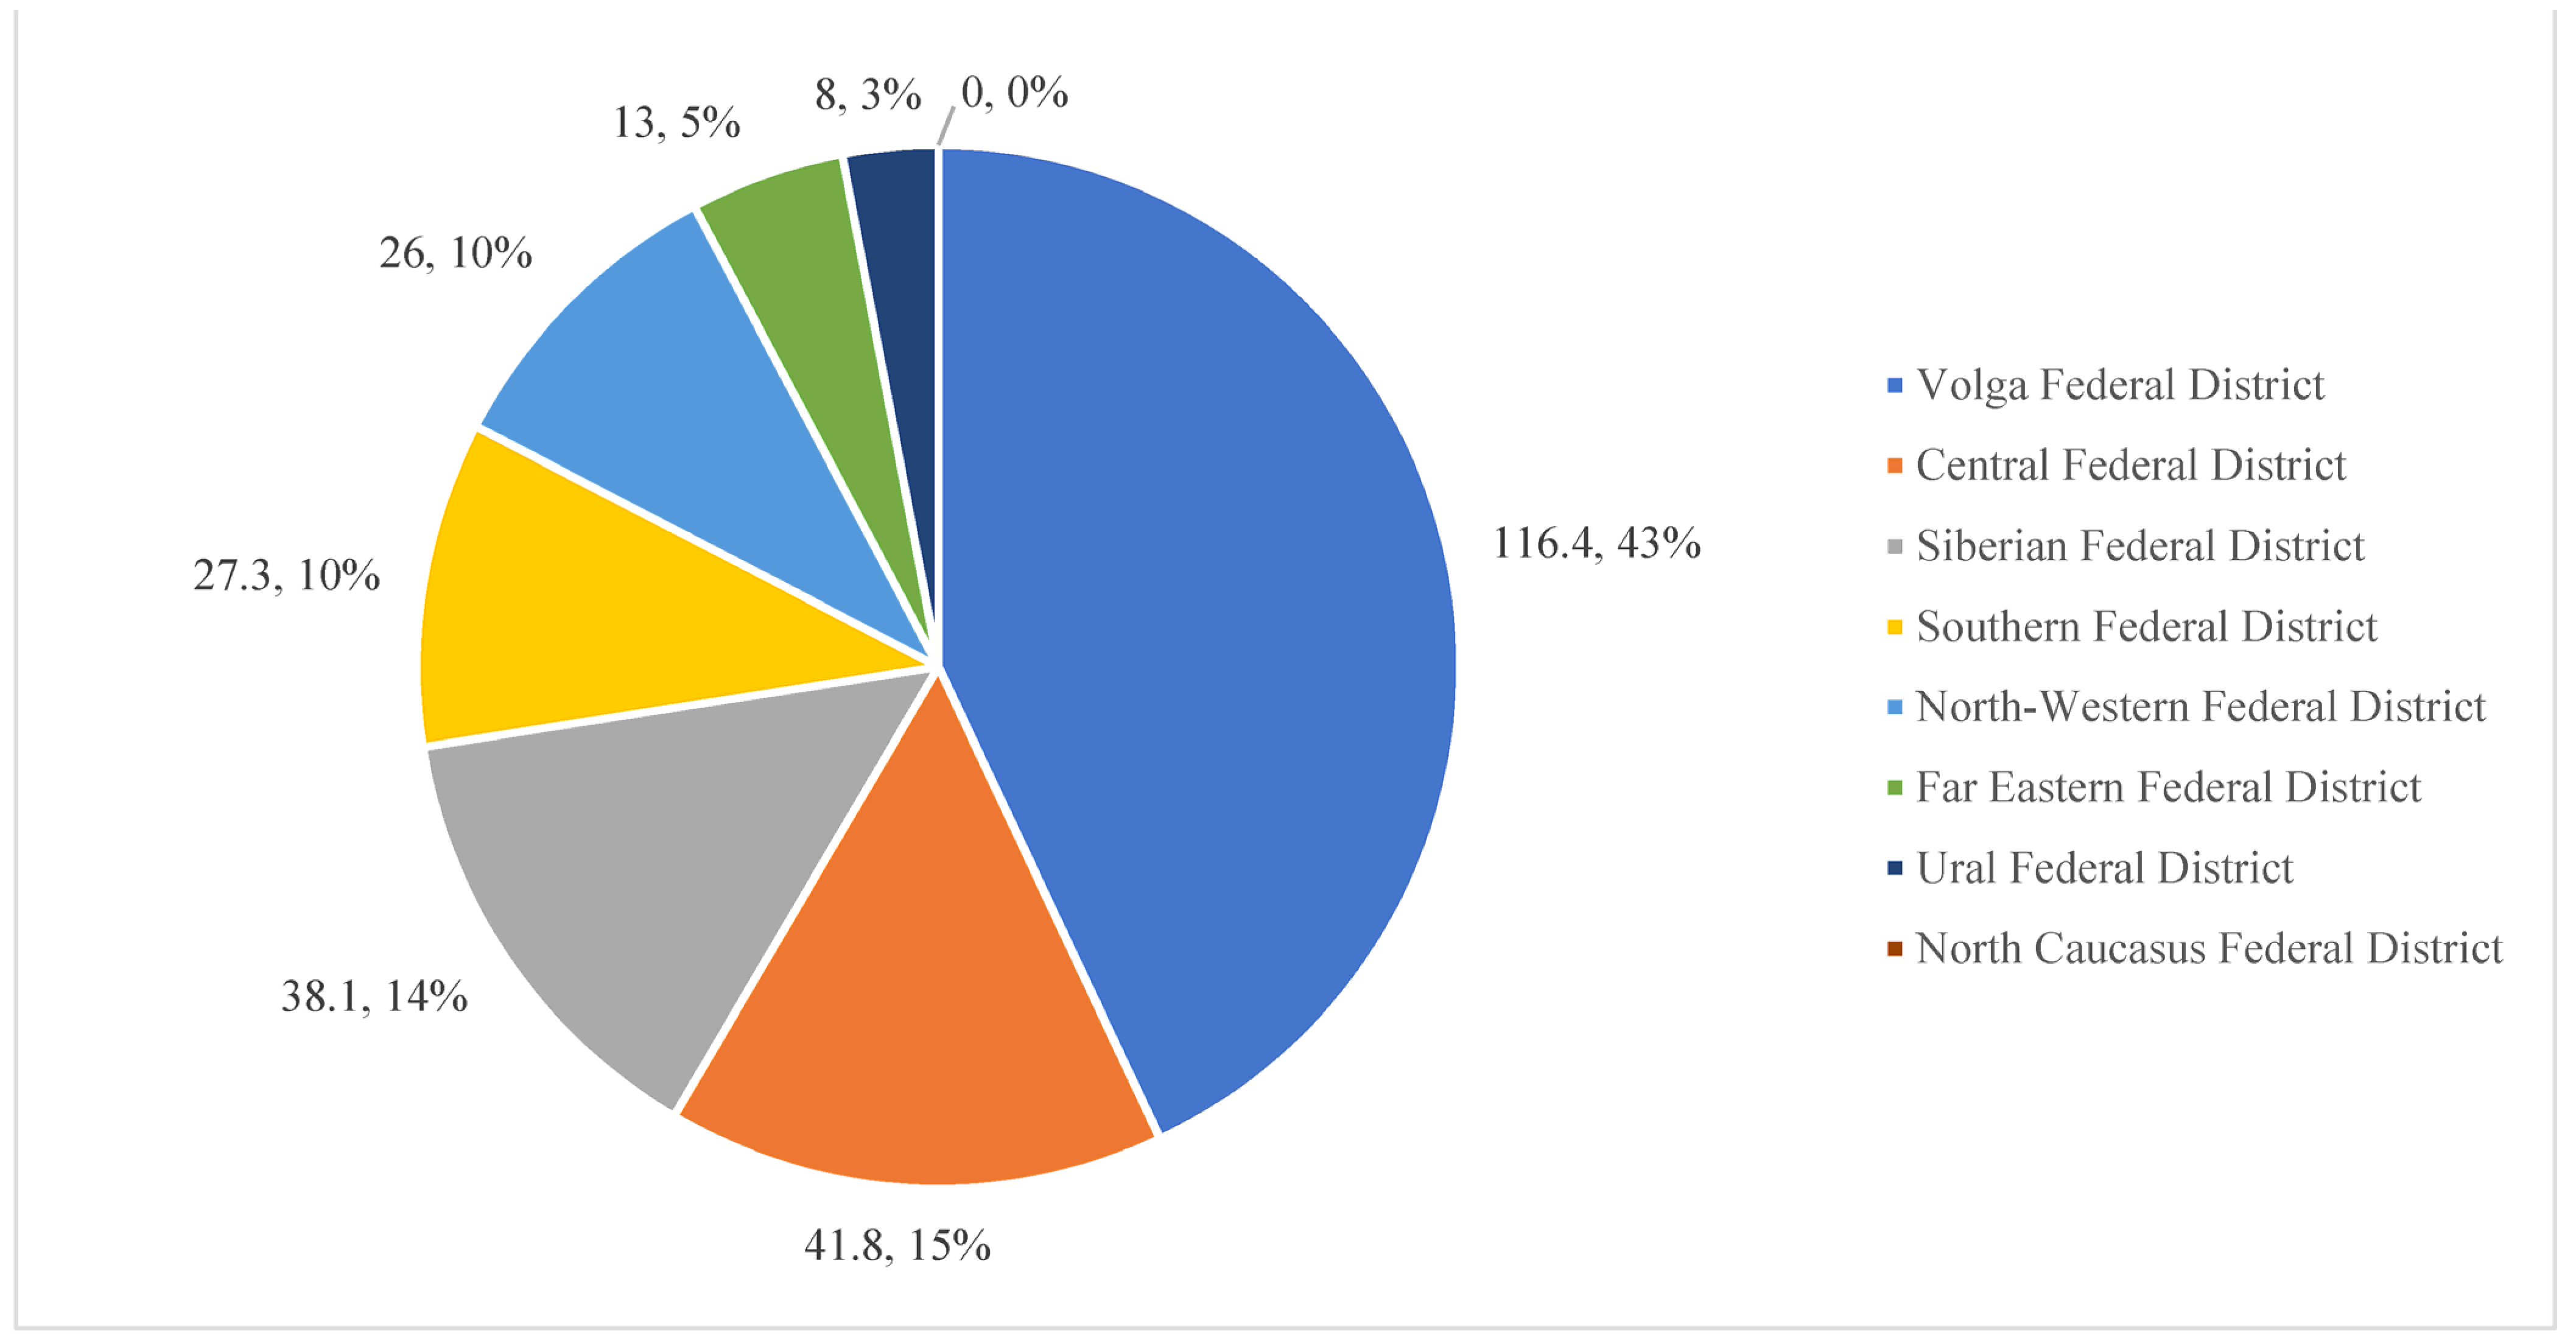
The regional structure of the oil refining sector evidently represents the territorial location of oil refineries in the federal districts of the Russian Federation. The largest number of enterprises are located in the Volga Federal District, with 14 large factories and 16 mini-factories, and in the Central District, with 5 large factories and 16 mini-factories. The grouping of the federal districts of the Russian Federation by volume of oil refining, for 2020, is presented in
Figure 6 [
27].
The analysis of
Figure 6 shows that in terms of oil products production for 2020, the leaders are: Volga, 116.4 million tons (42%), and Central, 41.8 million tons (14.6%), federal districts. In Group 2, the leaders are: the Siberian, 38.1 million tons (14.2%), the Southern, 27.3 million tons (11.0%), and the North-Western District, 26 million tons (9.9%), districts. In the group of outsiders, the leaders are: the Far Eastern, 13 million tons (4.6%), and the Ural 8 million tons (2.9%), districts. In the North Caucasus District, the production of petroleum products has been discontinued.
In the regional industry structure, the Volga Federal District occupies the first place in terms of primary oil refining, which accounts for 36.4% of primary oil refining in Russia. The district has large oil refineries owned by Lukoil (Nizhegorodnefteorgsintez and Lukoil-Permnefteorgsintez), with a capacity of 17 million tons and 13.1 million tons, respectively. Significant capacities in the district are concentrated in the Bashkir group of enterprises and in the factories of the Samara region (Novokuibyshevsky, Kuibyshevsky and Syzransky). The region also has the most technologically advanced plants with a processing depth of about 99% (“Mari”, “TANECO”).
The second region in terms of primary oil refining is the Central District, with a primary refining volume of 14.6%, in which three large oil refineries are located with a total refining volume of 40.9 million tons in 2020, which is 0.8 million tons less than the previous year, due to the overhaul of technological installations. The third region is the Siberian Federal District, with a market share of 14.2% and four large oil refineries, in which the volume of primary oil refining in 2020 amounted to 39.2 million tons, but decreased by 0.9 million tons compared to 2019.
The fourth region is the Southern Federal District, geographically closest to the export markets of petroleum products through ports on the Black and Caspian Seas. Eight large oil refineries are concentrated in the Southern District, and the largest of them is the Volgograd plant of LUKOIL with an installed capacity of 15.7 million tons of raw materials per year. In 2020, the volume of oil refining in the district amounted to 27.3 million tons, or 11.0% of the all-Russian indicator. In the North-Western District, 9.9% of Russian oil is processed, in which three large plants with a refining volume of 26.0 million tons operate. One of the largest Russian oil refineries, Kirishinefteorgsintez, is located in the district, with a volume of primary processing of raw materials of more than 18 million tons per year.
Our analysis has shown that the majority of Russian oil refineries are characterized by: the use of imperfect technologies, a low proportion of deepening processes; a fairly significant degree of depreciation of fixed assets; an insufficient level of conversion of crude oil into more valuable refined products. In addition, oil refining capacities are unevenly distributed throughout the country, which leads to the creation of prerequisites for the formation of regions that are excessive in production and regions that are “deficient” in the provision of petroleum products and an increase in the load on transport for its transportation. Almost all refineries are located in the interior of the country, away from the border and sea export terminals, which reduces the efficiency of exporting petroleum products by increasing transportation costs.
An important characteristic of the oil market of the Russian Federation is the dynamics of the utilization of refining capacities, which in 2020, amounted to 270 million tons, and the degree of utilization of primary oil refining units decreased to the lowest level since 2007, amounting to 82.3%. The overall reduction in the volume of primary processing of crude oil at Russian refineries was accompanied by a decrease in the production of all major types of petroleum products, namely, motor gasoline, diesel fuel, heating oil and aviation kerosene, which was largely due to the different dynamics of the reduction in external and internal demand for these fuels from consumers in the conditions of COVID-19. In addition, the dynamics of primary oil refining was influenced by legislative decisions in the field of taxation, which reduce the attractiveness of exports of dark petroleum products, as well as the process of state regulation of the domestic market of petroleum products.
An important value representing the technological efficiency of the industry is the depth of oil refining, which means the total yield as a percentage of all petroleum products, except for the non-converted residue used as boiler fuel. With shallow oil refining, the profit is 13.7 billion rubles, and with a deep chemical scheme, 41.9 billion rubles, i.e., the growth is more than 300%. In 2010, the refining depth of Russian refineries was 70.9%, in 2015, the indicator reached 74.2%, in 2017, the result was 81.3%, and in 2019, it was 83.1%. In 2020, the average depth of oil refining in the country increased by 1.3 percentage points to 84.4%. Despite the reconstruction and modernization of many enterprises and the improvement of the oil refining complex, the products were still more focused on domestic consumption, due to the low quality of oil refining. For comparison, in the USA, the average depth of oil refining is 90–95%, and at the most modern American refineries—up to 98%; in OPEC member countries, average depth is 85%, and in European countries, 85–90%. That is, we state that Russia is noticeably lagging behind in this indicator.
In 2020, Russian oil companies increased the depth of oil refining compared to the scale of 1.2–2.5%, and accordingly, the output of light oil products increased. Thus, the refineries of PJSC Lukoil had the greatest refining depth, 88.8%, which allowed them to increase the share of light products output from 69.3%, in 2018, to 73%, in 2020, respectively, reducing the share of fuel oil produced from 22%, in 2014, to 11%, in 2020. The greatest depths of oil refining were recorded in NOVATEK-Ust-Luga (99.9%), Antipinsky (99.5%), Novoshakhtinsky (99.1%), and Omsk (98.9%) refineries. However, a number of plants retain low refining depth indicators: Achinsk (65.6%), Tuapse (65.4%), Komsomolsk Refinery (63.1%). PJSC Rosneft, with the largest number of refineries, stood out for a relatively low level of refining depth of 74.4%. The analysis made it possible to note a significant differentiation of oil refineries by processing depth and to determine the average value for the federal districts, which in 2020, amounted to 79% in the North-Western District, 74% in the Siberian, 72% in the Volga, 70% in the Central, 62% in the South, 61% in the Far East, 55% in the Urals.
Thus, the conducted research showed that the state policy of Russia in the oil refining industry over the past few years has been aimed at increasing the level of oil refining depth and increasing the yield of light petroleum products. The main trends in the Russian oil refining industry in 2020 were the modernization of refineries, the renewal of equipment and technological capacities, the growth of production of high-octane gasoline that meets Euro-5 standards and higher, and the organization of “oil-free” production. As a result, the processing depth in comparison with 2014 increased by 15% in 2020 and amounted to 83.1%. Against the background of a reduction in the production of fuel oil by 42%, the share of the output of motor gasoline and diesel fuel increased, and a positive trend was observed in terms of the dynamics of production indicators. At the same time, the analysis of the oil refining sector market revealed a feature of the territorial structure of the refining sector, which is expressed in a higher level of dispersion across the country than the structure of its reserves and production.
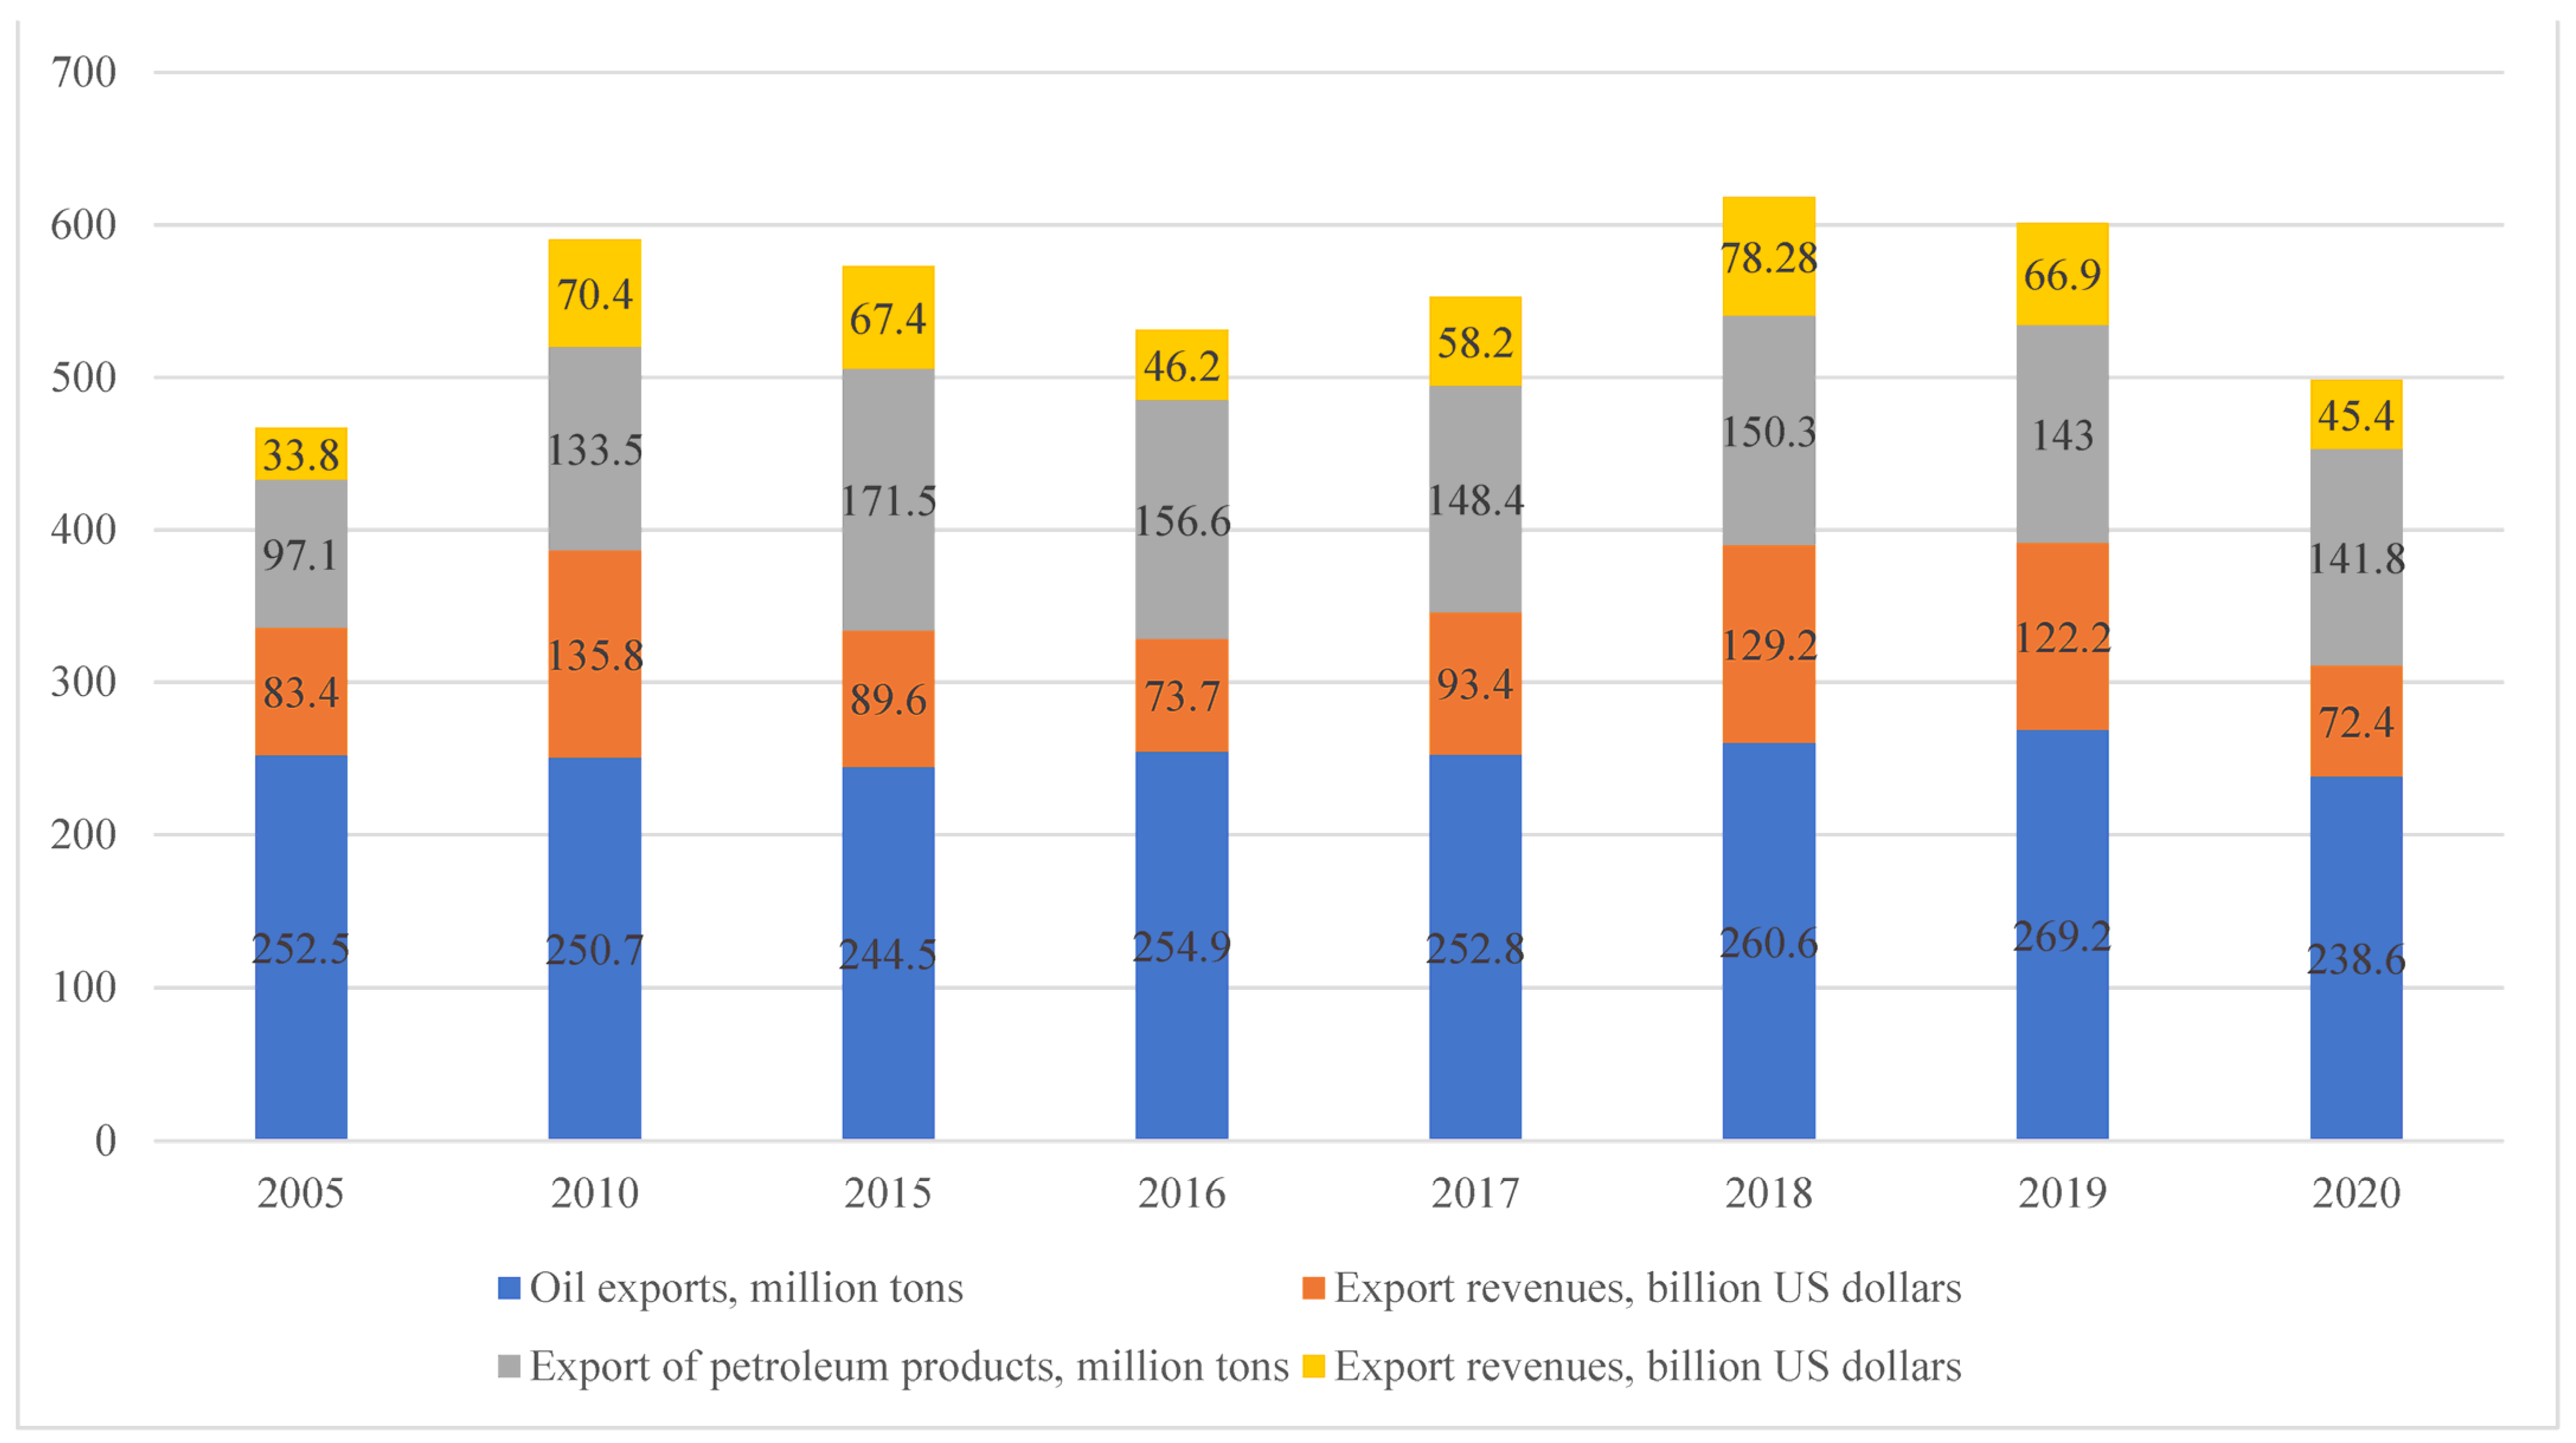
Oil is the most important export commodity of the Russian Federation and provides more than 20% of cash receipts from foreign trade. According to the Federal Customs Service, in 2020, oil and petroleum products in monetary terms provided 35% of revenues to the budget of the Russian Federation from foreign trade. The dynamics of exports of oil and petroleum products from Russia for the period 2005–2020 is presented in
Figure 7.
A study of the dynamics of the volume of exports of oil and petroleum products for 2005–2020 in Russia showed that on average, about 250 million tons were exported per year. In the period 2010–2014, there was a decrease in the volume of oil exports, and for the period 2015–2019, there was a steady increase in exports, and a record volume of 269.2 million tons was achieved in 2019. The growth compared to 2018 was 8.5 million tons or 3.3% [
28]. However, in 2020, due to the complex of problems encountered, there was a decrease in exports by 11.3% to 238.6 million tons per year. Revenues from the export of oil and petroleum products for 2020 amounted to USD 141.7 billion, a decrease of 36.1% compared to the same period in 2019. Exports are mainly: crude oil and crude oil products to China (33%), the Netherlands (13%), and Germany (9%); and petroleum products to the Netherlands (15%), the USA (9%), and Turkey (5%). The analysis of the Russian oil market over the past ten years has revealed that as a result of rising world prices and an increase in oil supplies, the export revenue of Russian oil companies from oil sales has increased by more than 5 times (from USD 25 billion up to USD 135 billion), and revenue from oil products increased 7 times (from USD 10 billion to USD 70 billion).
One of the important indicators affecting GDP growth and the standard of living of the population is the volume of oil consumption, since the countries and regions that consume oil receive the maximum profit. There is a certain interdependence between the average per capita volume of oil consumption and the size of the gross domestic product (GDP) per capita: the higher the consumption, the higher the level of GDP per capita.
Table 3 shows the volumes of oil consumption in the developed countries of the world.
The analysis of
Table 3 shows that 78% of oil and petroleum products from the total volume of world consumption are consumed in the 20 leading countries of the world.
The largest consumer in the world is the USA, with a market share of 19.2%; the EU countries are in second place—15.0%; China is in third and fourth place—14.2%; and India has a share of 5.3%. It should be noted that in Russia, over the past decades, there has been a decrease in the consumption of oil and petroleum products from 223 million tons in 1995 to 146.9 million tons in 2020, and the country ranks 7th in terms of consumption. At the same time, the share of consumption per capita of the world volume is only 3.3% [
13]. In the leading countries, in terms of oil consumption in 2020, the volume of consumption in the United States was 19.8 million barrels per day; in China—14.2 million barrels per day; in India—5.3 million barrels per day. Total global oil consumption, according to OPEC data for 2020, amounted to 90.8 million barrels per day, and according to experts’ forecasts, this indicator will continue to grow to 96.9 million barrels per day.
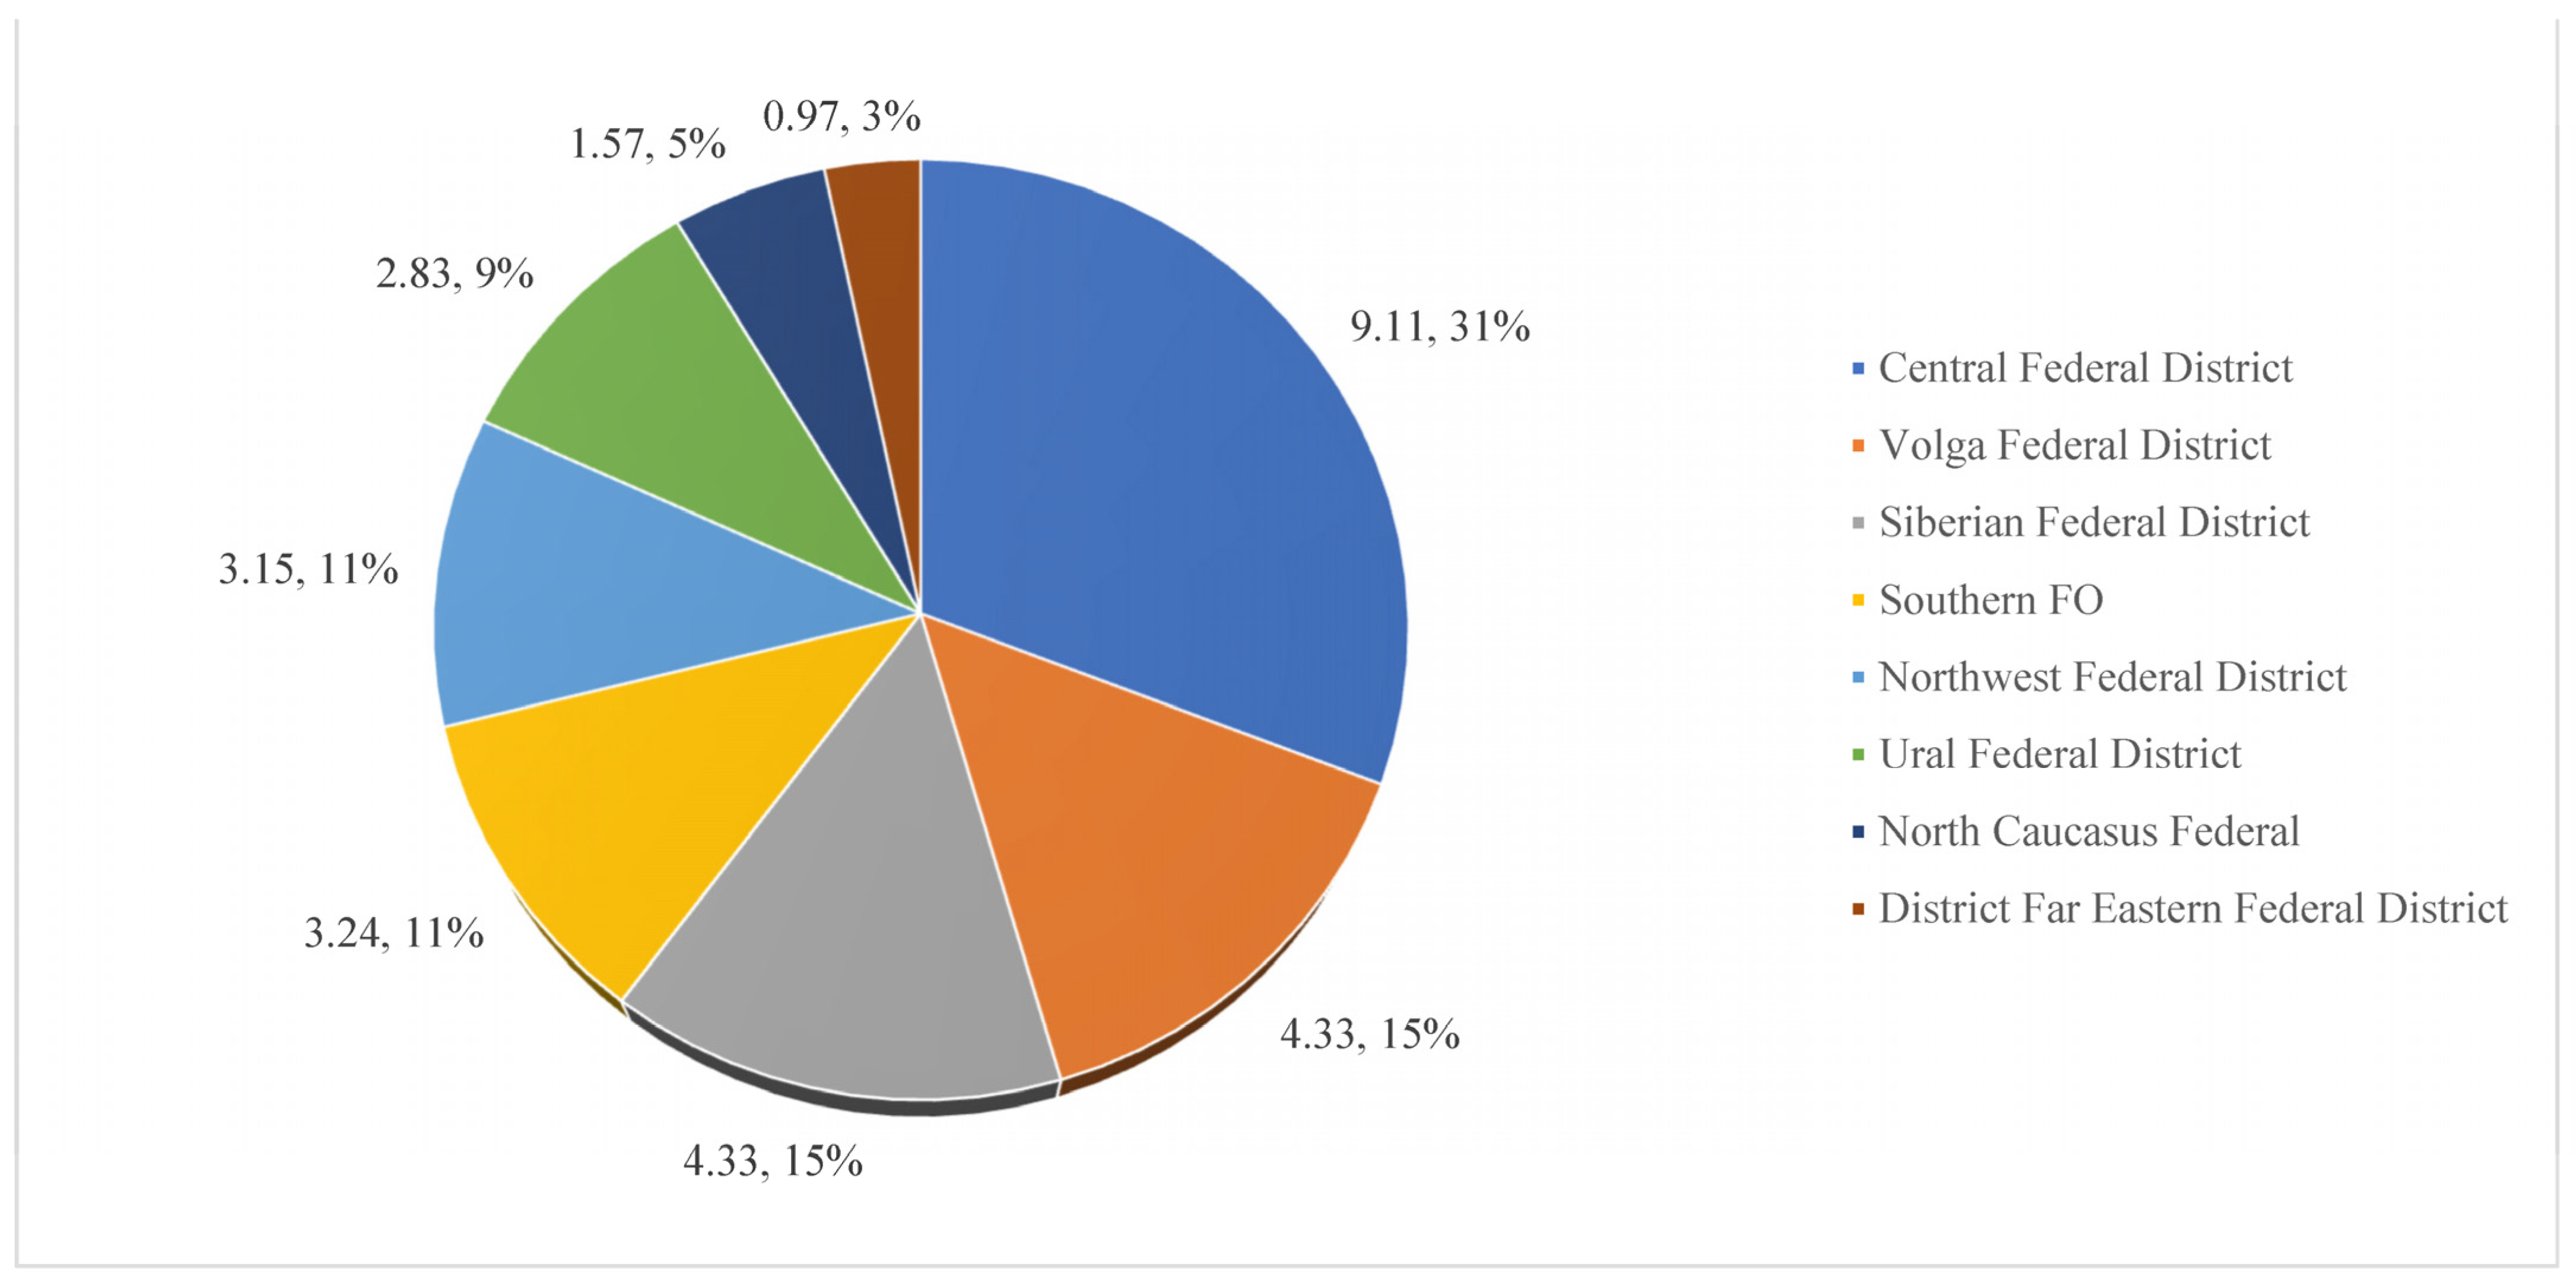
Let us further consider the volume of consumption of one of the main petroleum products—motor gasoline in the Russian Federation—grouped by us by federal districts of the Russian Federation—
Figure 8.
In the whole country, the total volume of gasoline consumption in 2020 amounted to 35.2 million tons. The leaders in the volume of consumption according to federal district were: Central—9.11 million tons (29.2%); Volga—5.98 million tons (19.2%); and Siberian—4.33 million tons (13.9%). This is followed by: the Southern district—3.24 million tons; Northwestern—3.2 million tons; Ural—2.8 million tons; North Caucasian—1.57 million tons; and Far Eastern—0.97 million tons; which complete the rating [
29].
The revealed imbalances in gasoline consumption are due to several factors: the level of stability of the region, the degree of development of the economy and infrastructure, the standard of living of the population, geographical features, and the number of cars in the district. To a significant extent, the volume of consumption of petroleum products is directly dependent on oil prices. It should be noted that the current structure of the Russian oil market is due to the imperfection of domestic pricing, its dependence on the global pricing system for oil and petroleum products, as evidenced by the lack of a unified methodology for determining them, and the presence of many oil prices in the country. The competitive oil market, which should be the basis of pricing in Russia, is oligopolistic and controlled by several vertically integrated companies, which practically deprives this segment of a competitive environment.
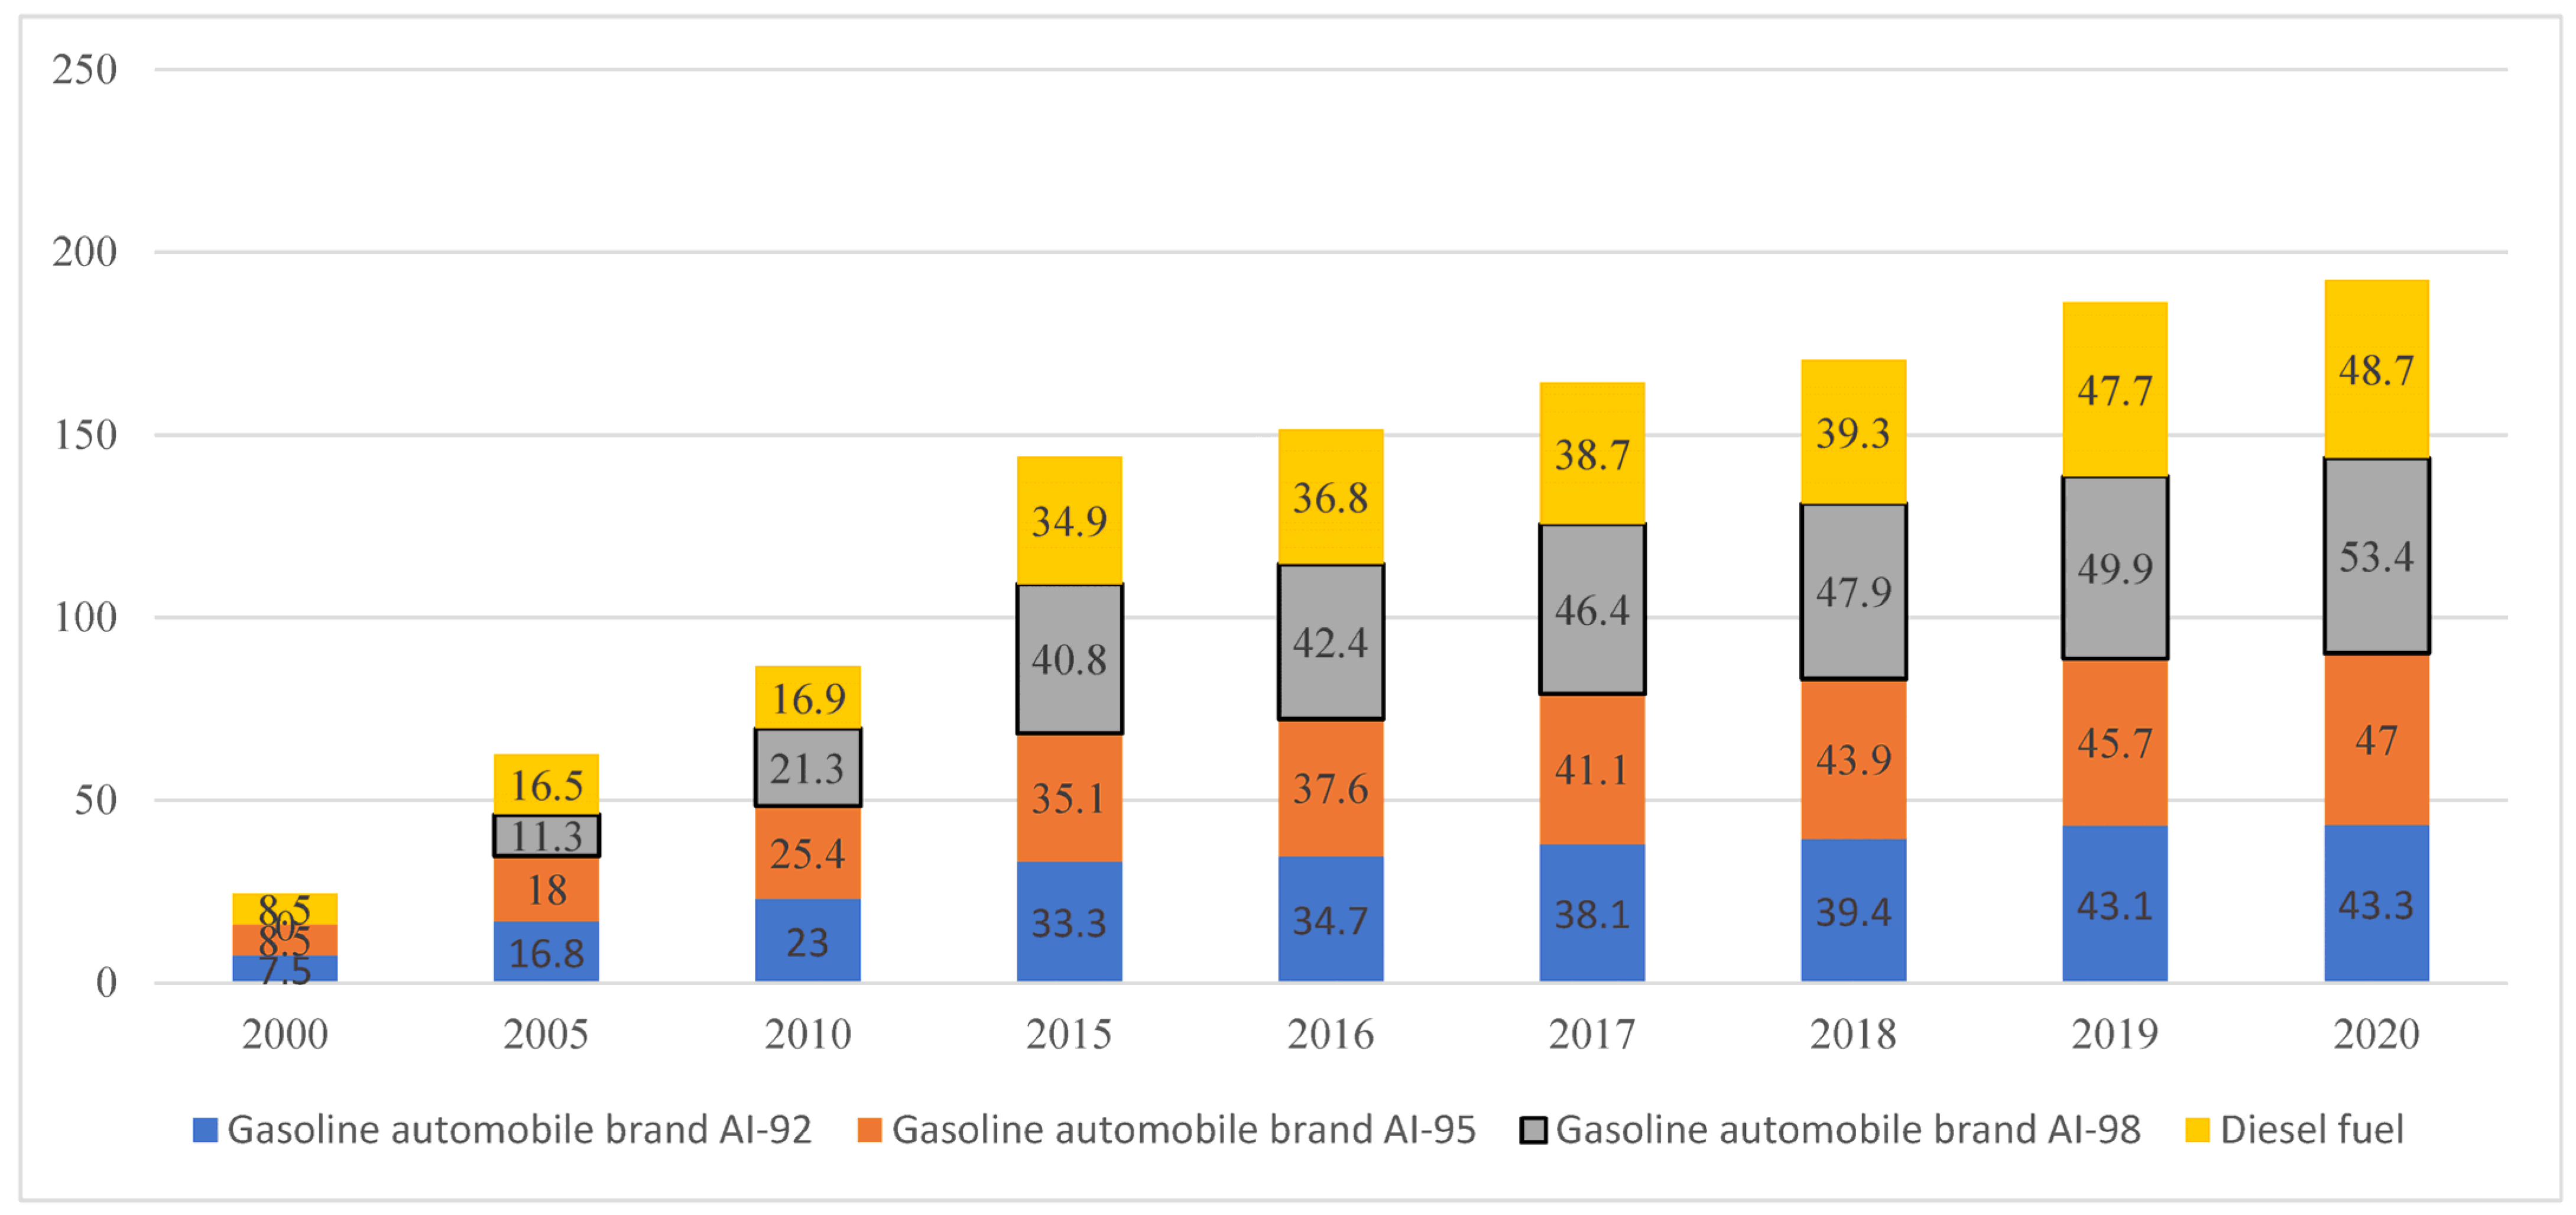
A comparison of Russian domestic prices for petroleum products with export prices proves the existence of a clear relationship between the Russian and European markets, which causes an increase in domestic prices in the Russian Federation in proportion to their growth in the world markets. The lowest gasoline prices were formed in Venezuela, Kuwait, Iran, the UAE, and Saudi Arabia, and mainly high gasoline prices are noted in the European Union. Gasoline prices in countries may vary depending on the availability of raw materials, refineries, types of taxes, excise taxes and other costs. The dynamics of Russian prices for brands of motor gasoline and diesel fuel is shown in
Figure 9.
The statistics given in
Figure 9 allow us to conclude that over the past two decades, the increase in prices for automobile gasoline of various brands averaged 449% or 4.49 times for the AI-92 brand, and 441% or 4.41 times for the AI–95 brand. The average producer prices for automobile gasoline and diesel fuel in 2020 were: automobile gasoline—45.9 rubles; and diesel fuel—48.7 rubles.
To identify the factors of price growth, we will consider the pricing structure of motor gasoline in Russia based on the average cost of 1 L of motor gasoline in the Russian Federation and conduct a comparative analysis with the structure of the cost of gasoline in the United States—
Table 4.
The analysis of
Table 4 showed that: in Russia, in the final price of gasoline, the cost of raw materials is 12%, whereas in the USA, this cost is 54%; taxes and excise taxes in the Russian Federation (VAT, mineral extraction tax, income tax) reach almost 70%, whereas in the USA, the cost is 18%; and profit in Russia is 5%, where in the USA it is 6%.


 Venezuela
 Saudi Arabia
 Iran
Iran Canada
 Iraq
Iraq United Arab Emirates
 Kuwait
 Russia
 Libya
Libya Nigeria
 USA
USA China
China Brazil