Abstract
The regulation of the seasonal energy supply for natural gas and the storage of fossil energy are important to society. To achieve it, storing a large amount of natural gas in porous underground media is one of the government’s choices. Due to the successful lesson learned from the oil and gas industry, natural gas storage in underground porous media has been regarded as the most potential long−term energy storage method. In this paper, we developed a new workflow to evaluate the performance of gas reservoir−type underground natural gas storage (UGS). The theoretical background of this workflow includes the correction of the average formation pressure (AFP) and gas deviation factor by error theory and the analytical mathematical model of UGS wells. The Laplace transform, line source function, and Stehfest numerical inversion methods were used to obtain pressure solutions for typical vertical and horizontal wells in UGS. The pressure superposition principle and weighting method of the gas injection−withdrawal rate were used to obtain the AFP. Through the correction of the AFP and gas deviation factor in the material balance equation, the parameters for inventory, effective inventory (the movable gas volume at standard condition), working gas volume (the movable gas volume is operated from the upper limit pressure to the lower limit pressure), and effective gas storage volume (the available gas storage volume at reservoir condition) were determined. Numerical data from the numerical simulator was used to verify the proposed model pressure solution. Actual data from China’s largest Hutubi UGS was used to illustrate the reliability of the proposed workflow in UGS performance evaluation. The results show that large−scale gas injection and withdrawal rates lead to composite heterogeneity in gas storage wells. The nine injection and production cycles’ pressure and effective inventory changes from Hutubi UGS can be divided into a period of rapid pressure rise and a period of slow pressure increase. The final AFP is 32.8 MPa. The final inventory of the Hutubi UGS is 100.1 × 10⁸ m3, with a capacity filling rate (the ratio of effective inventory to designed gas storage capacity) of 93.6%. The effective inventory is 95.3 × 10⁸ m3, and the inventory utilization ratio (the ratio of effective inventory to inventory) is 95.2%. The working gas volume is 40.3 × 10⁸ m3. This study provides a new method for inventory evaluation of the gas reservoir−type UGS.
1. Introduction
The Paris Climate Agreement calls for the world to reduce carbon emissions to nearly 95% of their 1990 level by 2050 [1,2]. The Chinese government has also proposed the goal of carbon neutrality, to achieve “zero emissions” of carbon dioxide by 2060 [3,4,5,6]. Therefore, the transition from traditional fossil energy represented by coal and oil to new energy has become imminent, and this transition has put forward higher requirements for new, large−scale energy storage technologies [7,8]. Starting from the storage medium, current energy storage technologies include mechanical energy storage, electrical energy storage, electrochemical energy storage, thermal energy storage, and chemical energy storage [9,10]. Compared with other energy storage technologies, mechanical energy storage technologies represented by pumped storage, compressed air energy storage, and underground gas storage have been favored by more and more countries and regions due to their excellent safety, economy, and long−term performance [11,12,13]. Additionally, in order to better balance the seasonality and regionality of energy supply and demand throughout the year, underground natural gas storage (UGS) has become the government planning task for various countries [14,15].
Target UGS regional structures include depleted oil and gas reservoirs, salt caverns, aquifers, and abandoned underground mines [16]. Due to the characteristics of geological structure and the traps sealing property, depleted oil and gas reservoirs are currently the mainstream way of using UGS [17,18]. As shown in Figure 1, 67% of the 689 UGS projects in operation around the world in 2018 came from depleted oil and gas reservoirs [19,20]. These 689 operating gas storage projects do not include EOR−related components. The Chinese government has also been committed to the construction of UGS in the past few decades, and the vast majority of them belong to this type of depleted oil and gas reservoirs. In 1970, Daqing Oilfield from China National Petroleum Corporation started the construction of China’s first UGS project [21,22]. The Dazhangtuo UGS was completed and put into operation in 2000. It was the first commercially operated UGS in China. [23]. Jintan UGS, as China’s first salt cavern−type UGS, began production in 2018 [24]. In order to meet the purpose of west−east natural gas transmission, China National Petroleum Corporation started the Hutubi UGS construction in 2013 and it was designed to be the largest UGS in China [25].
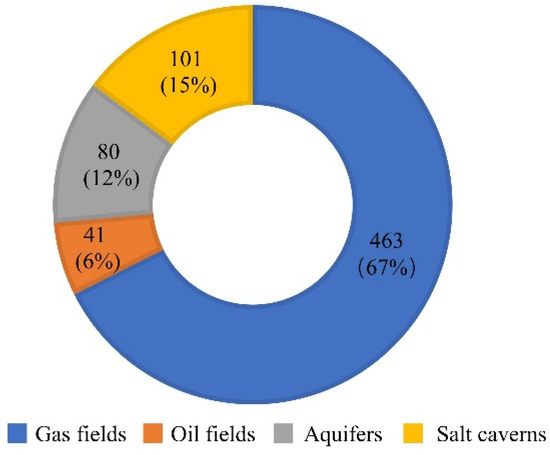
Figure 1.
The number of various types of UGS and their proportions in global UGS Reprinted/adapted with permission from Ref. [20]. Copyright 2021, Elsevier Ltd.
Similar to the SEC reserves of oil and gas reservoirs, the effective inventory and working gas volume of UGS are important parameters for evaluating the company’s performance and directly determine the capital value of the gas storage company [26]. The successful lesson from gas reservoir development shows that the material balance method, the numerical simulation method, and the volumetric method are common methods used to calculate the geological reserves of gas reservoirs [27,28,29,30]. This also provides a reference for the effective inventory and working gas volume calculation in the field of gas storage. Many scholars have used commercial numerical simulators to evaluate the gas storage capacity during UGS [31,32,33,34,35,36,37]. Although the numerical simulator can simulate the entire gas injection−withdrawal cycle of the gas storage, the complexity of the composition model and geological model brought by gas injection further increases the scene limitations of model application. In particular, the alternation of additional injection−withdrawal cycles in the gas storage brings more computational cost to history matching in the numerical simulation [38,39,40]. The volumetric method can directly calculate the theoretical gas storage volume and capacity from the geological perspective. However, this value is static, and it ignores the dynamic behaviors of gas injection and withdrawal cycles. The material balance method is a common method in gas reservoir engineering to calculate the oil and gas reservoirs geological reserves, and it has been used in the field of gas storage [41,42,43]. Through the pressure and deviation factor ratios in the original state and the average state, the oil and gas reservoir reserves can be obtained by the Y−intercept. Therefore, the prerequisite for the application of the material balance method is that the balanced average formation pressure (AFP) at the end of the injection and withdrawal stages is known. However, there is still a lack of methods to determine the balanced AFP in gas storage. The current material balance methods in UGS usually only use static pressure data at a certain time point.
To narrow this gap, this paper proposes a performance evaluation method for gas reservoir−type UGS. The mathematical theoretical basis includes the correction of the AFP and deviation factor by error theory and the analytical mathematical model of gas storage wells. The gas diffusion equation in UGS was solved by the Laplace transform method and the Stehfest numerical inversion method. The point source and line source function methods were used to obtain bottom−hole pressure solutions for vertical and horizontal wells in UGS. The reliability of the pressure solution was verified by data from commercial numerical simulation software. Furthermore, the proposed method was used to evaluate the inventory of Hutuobi UGS.
2. Methodology
In this section, the mathematical models for vertical and horizontal gas storage wells were respectively established to describe the flow behaviors in UGS. The reservoir domain consists of two regions with different flow capacities. The point source, line source function, and Laplace transform methods were used to obtain the pressure solutions of vertical and horizontal well models in Laplace space. The wellbore storage and the skin effects were considered in the method proposed by Mukherjee and Economides [44]. The Stehfest inversion method was used to obtain the bottomhole pressure solution in the real domain [45].
2.1. Physical Model
The physical model of vertical and horizontal wells in UGS is shown in Figure 2. The near−wellbore zone with high flow capacity was caused by high−speed gas injection and withdrawal rates, and the outer region refers to the initial formation. The UGS was considered to have a consistent formation thickness and a uniform initial pressure and temperature distribution. Horizontally, the physical model of UGS was infinite. The inner and outer regions were assumed to be continuous media. The vertical and horizontal wells were located in the center of the study area. The duration of the test well process is usually short compared to the long duration of the gas injection and withdrawal processes. Therefore, the inner region radius was assumed to be a constant value . The interface between inner and outer boundaries satisfied the conditions for equal pressure and unequal flow rates. The remaining assumptions are as follows:
- (1)
- Gas in the reservoir was the single−phase, compressible fluid, and it obeyed Darcy’s law.
- (2)
- The vertical and horizontal wells in UGS were involved in the gas injection and withdrawal processes at a constant rate.
- (3)
- The effects of gravity and temperature on gas flow were ignored.
- (4)
- The UGS formation had a closed top−to−bottom interface in the vertical direction.
- (5)
- The effects of wellbore storage and skin−on−gas flow during gas injection and withdrawal were considered.
- (6)
- Due to the gas’s compressibility, the pseudo−pressure method proposed by Al−Hussainy was used to describe the natural gas flow [46].

Figure 2.
Physical model of UGS: (a) schematic diagram of gas reservoir−type underground natural gas storage (modified from Geostock [48]); (b) the horizontal and vertical wells with heterogeneous features in underground natural gas storage.
2.2. Mathematical Model
With the physical model and its assumptions, the governing equations for the vertical and horizontal wells in UGS can be given as:
where is the radial distance, is the time, is the wellbore radius, is the reservoir permeability, is the porosity, is the total compressibility, and is the inner region radius (the subscripts 1 and 2 represent inner and outer regions, respectively). The initial condition for UGS is:
where is the initial pseudo−pressure. The outer boundary condition for UGS can be expressed as:
The pressure and flow rate conditions for the interface between the inner and outer regions are:
The vertical and horizontal wells in UGS are considered to have constant rate production:
where is the reservoir thickness, is the production rate in standard condition, is the pressure in standard condition, and is the temperature in standard condition. According to the dimensionless variables in Appendix A, the bottom−hole pressure solution of the vertical well can be expressed as Equation (10) (see Appendix B for details),
where is the dimensionless bottom−hole pseudo−pressure, is the Laplace variable, is the zero−order first−class Bessel function, and is the zero−order second−class Bessel function. The undetermined coefficient and in Equation (10), be given as Equations (11) and (12):
Similarly, the undetermined coefficients and of Equations (11) and (12) can be expressed as:
where is the diffusion ratio, is the dispersion ratio, is the dimensionless inner region radius, is the first−order first−class Bessel function, and is the first−order second−class Bessel function. The line source function method proposed by Ozkan was used to obtain the general pressure solution of horizontal wells in UGS [49]:
where and are the dimensionless horizontal distance, is the dimensionless vertical distance, refers to the dimensionless vertical position for horizontal well, and is the integral variable. The , , , and in Equation (15) can be given as Equations (16)–(19):
The method proposed by Mukherjee and Economides was used to consider the effects of the wellbore storage coefficient and skin factor [44].
where is the wellbore storage coefficient and is the skin factor. As given in Figure 3, the Stehfest numerical inversion method was used to obtain a real−domain bottom−hole pressure solution [45]. Figure 3 shows the solution procedure for vertical and horizontal wells in the gas storage.
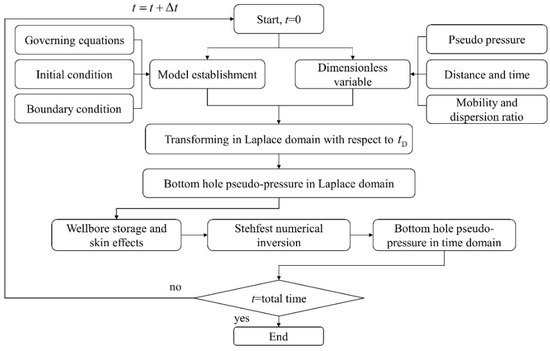
Figure 3.
The solution procedure for bottom−hole pressure for vertical and horizontal wells.
2.3. Model Validation
In order to verify the correctness of the proposed model, the commercial numerical simulation software KAPPA was used to simulate the gas injection process for the vertical and horizontal wells in UGS, respectively. The reservoir domain included two regions, and the boundary for the inner region was circular. The outer boundary was chosen as infinite. The inner region radiuses for vertical and horizontal wells were chosen as 100 m and 500 m. The horizontal well’s length was 300 m. The mobility ratio and dispersion ratio between the inner and outer regions were set to 4. The wellbore storage factor and skin factor were selected as 0.5 m3/MPa and 2, respectively. In order to accurately describe the pressure change in the near−wellbore area, the minimum iteration time step was 1 × 10⁻⁵ h. The time step was gradually increased with the time increase to reduce the computational expense, and the maximum time step was 5 × 10⁴ h. The pressure and pressure derivatives from vertical and horizontal well models are given in Figure 4. There is a good agreement between the numerical results and the results from the proposed model. The input parameters for the model are given in Table 1.
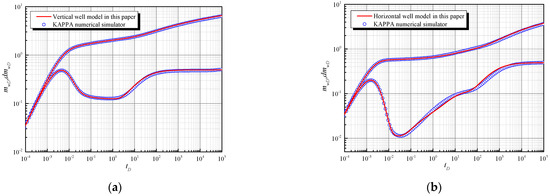
Figure 4.
Pressure comparison results between the model in this paper and the numerical simulation from KAPPA: (a) the vertical well model; (b) the horizontal well model.

Table 1.
Model validation parameters for vertical and horizontal wells with composite features in underground natural gas storage.
3. Flow Chart
With the theoretical method in Section 2.2, the storage performance evaluation technical process is shown in Figure 5. Specifically, the following main steps can be included:
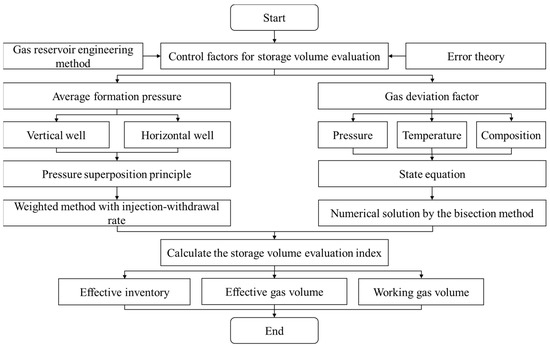
Figure 5.
The flow chart for the performance evaluation method of the gas reservoir−type UGS.
- 1.
- Step 1 Inventory Parameters Evaluated by Gas Reservoir Engineering
Lessons from the development of gas reservoirs indicate that the inventory evaluation parameters include inventory, effective inventory, effective gas volume, peak shaving gas volume, working gas volume, and cushion gas volume [50,51]. Similar to SEC reserves, effective inventory, effective gas volume, and working gas volume are key evaluation parameters for listing transactions, and they directly determine the market valuation of UGS companies. As shown in Figure 6, the effective inventory is equivalent to the technically recoverable reserves in gas reservoir engineering, and it is one of the parameters to measure the UGS performance. The material balance method in Equation (21) proposed by Tek can be used to calculate the effective inventory value [41].
where is the effective inventory, is the total amount of produced gas, the subscript is the ending time of gas injection stage, and is the ending time of gas withdrawal stage. The effective gas volume directly determines the gas storage capacity of UGS. According to the gas state equation, the effective gas volume can be calculated by Equation (22).
where is the effective gas storage volume, is the AFP at the end of the gas injection stage, is the deviation factor at the end of the gas injection stage, and is the formation temperature. The working gas volume is used to meet market demand. As shown in Figure 6, the working gas volume can be calculated using Equation (23).
where is the working gas volume, is the upper limit pressure, is the lower limit pressure, and and are deviation factors for the upper limit pressure and the lower limit pressure, respectfully.
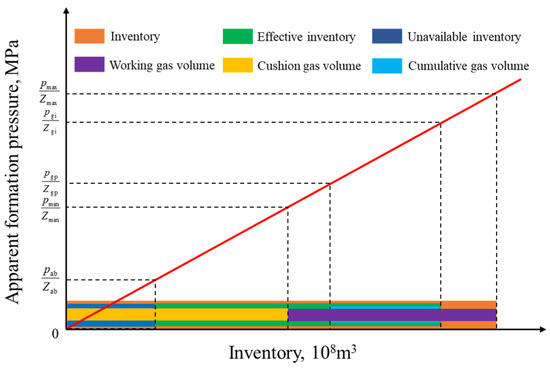
Figure 6.
The inventory evaluation parameters of UGS in the material balance method (modified from Ma et al. [50]).
- 2.
- Step 2: Error Sources in Error Theory
Due to the limitations of monitoring equipment and calculation methods, there will be errors in the monitoring results of temperature, pressure, gas injection, and withdrawal volume in UGS. With the error theory proposed by Tek, as shown in Equation (24), the error sources in UGS mainly come from the AFP, deviation factor, pseudo−pressure, and pseudo−pressure drop [41]. In addition, deviation factor, pseudo−pressure, and pseudo−pressure drop are related to the formation pressure. Thus, the AFP plays a more critical role in inventory evaluation. The detailed derivation for Equation (24) can be found in Appendix C.
where is the relative error and is the absolute error.
- 3.
- Step 3: Calculation of Average Formation Pressure
Different from the gas reservoir development process, the gas injection and withdrawal volume in UGS is a constant value that is determined by social demand. Due to the requirements of society’s heating needs, the gas injection phase in UGS usually occurs from April to November, and the gas withdrawal process usually includes January, February, and March. This long−term and large−scale gas injection and withdrawal process leads to uneven pressure distribution in UGS, and the well interference is serious [52,53,54]. We use the radial composite model and the homogeneous model to calculate the AFP for the single well. However, the pressure for a single well often cannot represent the AFP of the entire UGS. The pressure superposition principle and weighting method of the gas injection−withdrawal rate are used to calculate the AFP. Since the target partial differential equation is linear, the pressure superposition principle in Figure 7 can be used to obtain the pressure solution with the effect of adjacent wells through Equations (10), (15) and (20) [55,56]. For wells that are farther away, the weighting method of gas injection−withdrawal rate is used [42].
where is the bottom−hole pressure solution of the target well, is the pressure interference from the adjacent well, is the dimensionless distance between the adjacent well and the target well, and is the number of wells in UGS. The weighting method of the gas injection−withdrawal rate can be described by Equation (26).
where is the AFP of gas storage, is the cumulative gas injection and production volume of a single well, and the subscripts and represent serial numbers of wells.
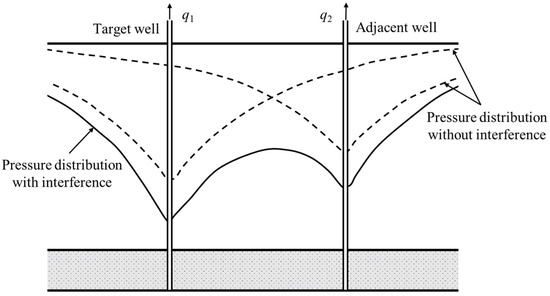
Figure 7.
Schematic diagram of the pressure superposition principle between two wells.
- 4.
- Step 4: Calculation of the Deviation Factor
The deviation factor reflects the deviation degree between the real gas and the ideal gas, and it is used to correct the ideal gas state equation [57]. The method proposed by the American Gas Association (AGA) is used to calculate the deviation factor [58]. This method requires a detailed molar composition analysis of the gas mixture. The components with a mole fraction less than 0.00005 are ignored. In addition, hydrogen sulfide, water, and hydrocarbon components with carbon molecular number greater than 8 cannot be considered. It can be expressed as Equation (27) (please see Appendix D for details).
where is the reduced density, , , and are undetermined coefficients, is the second virial coefficient, and is the equation coefficient related to gas composition and temperature. Combining Equations (2) and (27), we can get the final equation:
Equation (28) is the transcendental equation in one variable about . The bisection method is used to calculate the pressure value. When the absolute error of pressure is less than 1 × 10⁻⁶, the calculation process is considered to be finished.
4. Field Application
This section uses the actual data of pressure and gas injections, as well as the production volumes of Hutubi UGS to carry out a field application. First, the geological background of Hutubi UGS and its reservoir properties, fluid properties, and well properties are briefly introduced. The typical pressure monitoring results for Hutubi UGS are discussed. The storage inventory parameters from Hutubi UGS are determined using the proposed method.
4.1. Geological Background
The Hutubi UGS is China’s first UGS for receiving gas imported from Central Asia, and it is located at the eastern end of the third row of structural belts in the North Tianshan piedmont depression of the Junggar Basin. The gas reservoir is a set of retrogradational delta deposits in a lacustrine setting, which is a large continuous sedimentary depression [59]. The gas storage layer is the Tertiary Ziniquanzi formation, including the Zi I and Zi II layers. The top depth of the UGS is about 3500 m. The thicknesses of the gas reservoir, direct caprock, and regional caprock are 120 m, 150 m, and 870 m, respectively [60]. The reservoir lithology is mainly fine sandstone and siltstone, and the pores are primary intergranular pores. The average porosities for Zi I and Zi II layers are 19.4% and 15.4%, respectively. The absolute permeabilities for two layers are 48.6 mD and 19.7 mD. The Hutubi gas field started to produce in April 1998. In 2010, the gas production from the Hutubi gas reservoir was below the economic production value, and it started the construction of the UGS. The remaining geological reserve before the UGS construction was 45.3 × 10⁸ m3 [61]. The UGS has been in operation since June 2013. Currently, the Hutubi UGS includes 29 vertical wells and 14 horizontal wells. Gas chromatographic data shows that the methane content in the produced gas from the Hutubi UGS is above 92.5% and the content of non−hydrocarbon components is less than 2%. The average relative density of injected gas is 0.59. The designed upper limit pressure and lower limit pressure for the Hutubi UGS are 34 MPa and 18 MPa, respectively. The designed storage capacity, working gas volume, and maximum daily gas injection volume are 107 × 108 m3, 45.1 × 10⁸ m3, and 1550 × 104 m3 [62,63,64]. The geological structure and well location map of the Hutubi UGS are shown in Figure 8.
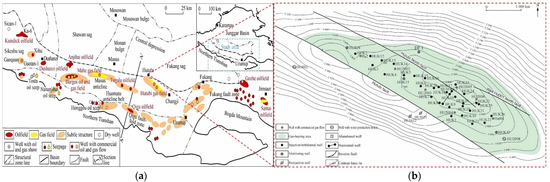
Figure 8.
(a) Regional location of the Hutubi UGS (modified from Chen et al. [65]); (b) Well location distribution of the Hutubi UGS (modified from Zheng et al. [66]).
4.2. Pressure Monitoring
Three pressure monitoring methods have been applied to the Hutubi UGS, namely the permanent monitoring well, the direct monitoring for bottom−hole pressure, and the pressure transient monitoring [61,67]. The permanent monitoring wells in the Hutubi UGS include one well for caprock monitoring, nine wells for trap, and three wells for formation. The trap monitoring results show that the pressure fluctuates between 28.7 and 31.3 MPa. The small variation in pressure indicates that the gas storage is in a sealed state. The monitoring pressure inside the formation varies widely and is injection−withdrawal cycle−related. The pressure range during the 1–4th injection−withdrawal cycle is 14.6–30.8 MPa. Subsequently, the pressure tends to be stable, and the range is 22.3–32.9 MPa. In addition, the bottom−hole pressure of the injection−withdrawal well after 15 days of the shut−in period is selected as the direct monitoring result for bottom−hole pressure. The trend of pressure change is similar to the results of permanently monitored wells. The pressure range for the first four gas injection cycles is 19.9–34.0 MPa. For gas production duration, the range is 18.4–26.6 MPa. After the fourth injection−withdrawal cycle, the above two pressure ranges were updated to 29.5–34.2 MPa and 23.0–26.7 MPa, respectively. To evaluate the injection−production capacity of gas storage wells and the AFP, 127 pressure transient tests are also carried out during nine injection−withdrawal cycles. Gas injection and withdrawal testing times are 210 h and 240 h, respectively. The obtained testing pressure data were matched by the proposed model, and the balanced pressure values were obtained after a prolonged testing time. Compared with the direct monitoring results, the balanced pressure ranges during the 1–4th injection−withdrawal cycle changed by 4.3% and 3.5%, respectively. After the fourth injection−withdrawal cycle, the pressure ranges for gas injection and withdrawal are 2.3% and 2.2%, respectively. The transient pressure behaviors in Figure 9 show that the potential flow regimes in the Hutubi UGS include wellbore storage effect flow, skin effect flow, linear flow (for horizontal wells), pseudo−radial flow in the inner zone, transitional flow, and pseudo−radial flow in the outer zone. Different from the development of gas reservoirs, the large−scale injection−withdrawal rate in UGS leads to the obvious radial composite characteristics in pressure data. With the increase of the injection−withdrawal cycle, the derivative curve gradually rises, and the radial composite feature becomes obvious. The evaluated permeability distribution range is 16–55 mD. The skin factor and mobility ratio ranges are 0–5 and 2–6.2. The inner zone radius distribution ranges from 50 m to 300 m.
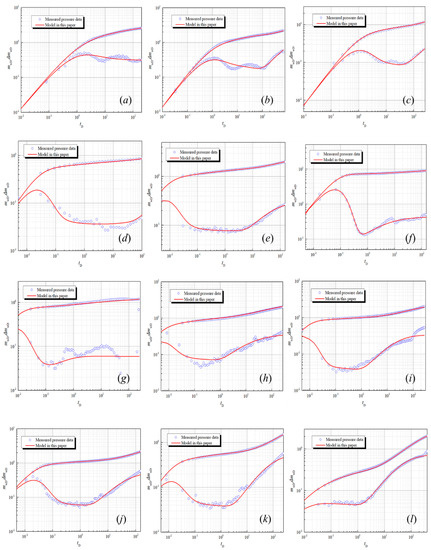
Figure 9.
Pressure behaviors of typical wells with different injection−withdrawal periods: (a–c) refer to well H17 in 2nd, 3rd, and 4th gas injection cycles; (d–f) is the well H5 in the 4th, 5th, and 6th gas injection cycles; (g–i) is the well H9 in the 1st, 5th, and 6th gas production cycles; and (j–l) is the well H22 in the 3rd, 4th, and 6th gas production cycles.
4.3. Model Application
With the proposed methodology, the inventory evaluation for the Hutubi UGS is determined by the following steps.
- 1.
- Step 1: Inventory Parameters Evaluated by Gas Reservoir Engineering
Based on the gas reservoir engineering method, the material balance equation in Equation (21) and the gas state equation in Equations (22) and (23), the main technical parameters for UGS inventory evaluation include inventory, effective inventory, effective gas volume, and working gas volume.
- 2.
- Step 2: Error Sources in Error Theory
The relative error of effective inventory in Equation (24) shows that the error sources in inventory evaluation are mainly the relative errors of AFP, deviation factor, pseudo−pressure, and pseudo−pressure drop. Deviation factor, pseudo−pressure, and pseudo−pressure drop are also related to the AFP. The AFP is therefore the main source of inventory errors.
- 3.
- Step 3: Calculation of the AFP and Deviation Factor
First, we collected the reservoir, fluid, and well properties of the Hutubi UGS in order to calculate the AFP. Subsequently, we collected the transient pressure testing data of 127 wells, the direct pressure monitoring data of 415 wells, and the permanent monitoring data of 13 wells from the Hutubi UGS. With curve matching of pressure transient testing data, the typical parameters, including permeability, skin coefficient, mobility ratio, and inner zone radius, can be obtained. The pressure solutions from vertical and horizontal wells in Equations (10) and (15) are obtained by the Laplace transform technology. The wellbore storage and skin effects are considered in the method of Mukherjee and Economides [44]. The balanced state pressure of a single well in the gas storage is obtained by prolonging the well shut−in time. The pressure superposition method in Equation (25) and the weighting method of the gas injection−withdrawal rate in Equation (26) are used to obtain the AFP. The weighting coefficient is related to the gas injection and production volume, and the weighting coefficient of Hutubi UGS is between 0.02 and 0.12. As shown in Figure 10, the balanced AFP for the Zi I layer at the end of the injection−withdrawal cycle increased rapidly from 18.7 MPa and 16.3 MPa in the 1st cycle to 32.1 MPa and 25.4 MPa in the 4th cycle. After the fourth period, the AFP tends to remain unchanged. The Zi I layer AFP for the injection−withdrawal cycle is finally stable at around 32.9 MPa and 22.2 MPa. For the Zi II layer, the final AFP values are 32.8 MPa and 22.4 MPa. The reason is that the gas injection volume of UGS at the initial stage is greater than the production volume to replenish formation energy. According to the AFP, for reservoir temperature and gas composition, Table 2 shows that the deviation factor in Equations (2), (27) and (28) varies from 0.93 to 1.02.
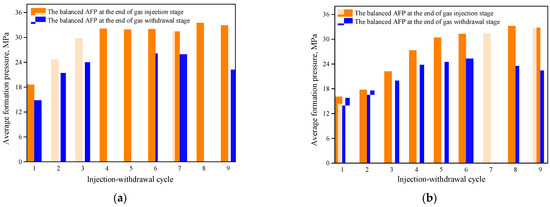
Figure 10.
AFP variation trend in Hutubi UGS during nine injection−withdrawal cycles: (a) Zi I layer; (b) Zi II layer.
Table 2.
The deviation factor calculation results for Hutubi UGS during nine injection−withdrawal cycles.
- 4.
- Step 4: Inventory Evaluation Results
After completing the above steps, the evaluation parameters, including effective inventory, effective gas volume, and working gas volume, are obtained by Equations (21)–(23). The effective inventory, effective storage volume, and working gas volume in Figure 11 increase rapidly at the initial stage. After entering the fourth injection−production cycle, the increase rate of effective inventory, effective gas volume, and working gas volume slows down. After nine injection−withdrawal cycles, Figure 12 shows that the inventory of Hutubi UGS has increased to 100.1 × 10⁸ m3 and the capacity filling rate is 93.6%. The inventory utilization ratio increased from 41.9% to 95.2%. The final effective inventory, effective gas volume, and working gas volume are 95.3 × 10⁸ m3, 3626 × 104 m3, and 40.3 × 10⁸ m3.
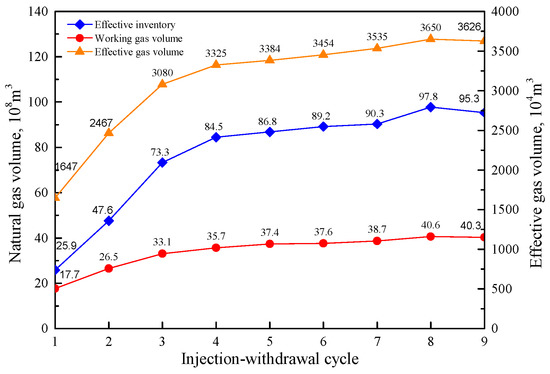
Figure 11.
Effective inventory, effective gas volume, and working gas volume curves in Hutubi UGS during nine injection−withdrawal cycles.
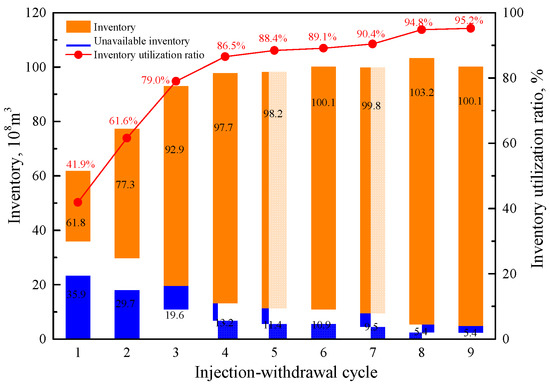
Figure 12.
Inventory, unavailable inventory, and inventory utilization ratio variation trend in Hutubi UGS during nine injection−withdrawal cycles.
5. Summary and Conclusions
This study developed a novel method for performance evaluation of the gas reservoir−type UGS. Subsequently, the proposed workflow was applied to the field case of the largest Hutubi UGS in China. Some obtained key conclusions are as follows:
- The workflow and theoretical basis behind the method were first introduced. The flexibility and effectiveness of this method in UGS performance evaluation were illustrated. The well models based on the Laplace transform technology and the Stehfest numerical inversion method were used to match the field pressure monitoring data. By prolonging the well shut−in time, the balanced formation pressure represented by a single−well was obtained. The pressure superposition principle and weighting method of the gas injection−withdrawal rate were selected to obtain the AFP.
- The pressure monitoring results show that large−scale injection and production lead to a continuous rise of the pressure derivative curve in the middle and late stages. This reflects the formation heterogeneity caused by gas injection and production. For the Zi I layer, the AFP at the end of the gas injection and withdrawal cycle increased rapidly from 18.7 MPa and 16.3 MPa in the first cycle to 32.1 MPa and 25.4 MPa in the fourth cycle. After the fourth cycle, the AFP tended to be stable. The final AFP values of the Zi I layer were stable at around 32.9 MPa and 22.2 MPa. For the Zi II layer, the final AFP values were 32.8 MPa and 22.4 MPa.
- By using the material balance method, the inventory, effective inventory, and working gas volume were calculated. During the nine injection−withdrawal cycles in Hutubi UGS, the changes in inventory parameters could be divided into a rapid−increase stage and a steady stage. In the rapid−increase stage, the inventory, effective inventory, and working gas volume increased to 97.7 × 10⁸ m3, 84.5 × 10⁸ m3, and 35.7 × 10⁸ m3, respectively, in the fourth cycle. From the fourth cycle, these three parameters began to stabilize, and the variation range was less than 11.4%. The final inventory, effective inventory, and working gas volume were 100.1 × 10⁸ m3, 95.3 × 10⁸ m3, and 40.3 × 10⁸ m3, respectively.
Author Contributions
Conceptualization, Q.W., H.X. and W.Z., methodology, W.Z., Y.G. and L.S., software, Y.G., G.P. and J.F., validation, Y.G., H.X. and K.Z., formal analysis, Q.W., J.L. and L.S., investigation, Q.W., H.X. and W.Z., resources, Q.W., H.X. and L.S., data curation, G.P., K.Z. and J.F., writing—original draft preparation, W.Z. and Y.G., writing—review and editing, W.Z., Q.W. and H.X., visualization, L.S., G.P. and J.F., supervision, K.Z., J.L. and J.F., project administration, H.X., G.P. and L.S., funding acquisition, Q.W. and W.Z. All authors have read and agreed to the published version of the manuscript.
Funding
This work received funding support from the National Natural Science Foundation of China (51974013 and 12202042).
Data Availability Statement
Not applicable.
Acknowledgments
We are grateful to the editors and the reviewers for their constructive comments on improving this manuscript.
Conflicts of Interest
The authors declare that there are no conflict of interest regarding the publication of this article.
Nomenclature
| Pressure, MPa | |
| Temperature, K | |
| Pseudo−pressure, MPa2/mPa·s | |
| Time, h | |
| Radial distance, m | |
| Reference length, m | |
| Permeability, mD | |
| Production rate, m3/d | |
| Compressibility, MPa−1 | |
| Laplace variable | |
| Reservoir thickness, m | |
| Deviation factor | |
| The origin position | |
| Skin factor | |
| Wellbore storage coefficient | |
| Mobility ratio | |
| Effective inventory, m3 | |
| The cumulative gas injection and production volume of a single well, m3 | |
| Total amount of produced gas, m3 | |
| Effective gas volume, m3 | |
| Working gas volume, m3 | |
| Upper limit pressure, MPa | |
| Lower limit pressure, MPa | |
| Well number | |
| Gas constant, J·mol−1·K−1 | |
| Zero order, first−class Bessel function | |
| First order, first−class Bessel function | |
| Zero order, second−class Bessel function | |
| First order, second−class Bessel function | |
| Porosity | |
| Gas viscosity, mPa·s | |
| The integral variable | |
| Dispersion ratio | |
| Molar density, kmol·m−3 | |
| Reduced density | |
| Dimensionless | |
| Initial condition | |
| Standard condition | |
| Wellbore | |
| The ending time of the gas injection stage | |
| The ending time of the gas withdrawal stage |
Appendix A. Dimensionless Variables
The definitions of dimensionless variables used in this study are as follows:
Dimensionless pseudo−pressure,
Dimensionless time,
Dimensionless distance,
where are the horizontal distances, is the reference length, and is the vertical position for the horizontal well. The dimensionless inner radius is given as,
Mobility ratio,
Dispersion ratio,
Appendix B. Model Solution Equation Chapter (Next) Section 1
With these dimensionless variables in Appendix A, the governing equations of the inner and outer regions can be written as:
The initial condition is:
The outer boundary condition is:
The boundary conditions for the inner and outer regions are:
The inner boundary condition is:
The Equations (A7) and (A8) in the Laplace domain can be rewritten as:
Similarly, the initial and boundary conditions in the Laplace domain can be given as:
Setting to 1, the bottom−hole pseudo−pressure solution can be expressed as:
The coefficients , , , and can be obtained by boundary conditions in Equations (A21)–(A24).
Appendix C. Error Theory
The relative error of can be expressed as [41]:
where is the absolute error. The relative error for can be given as:
The absolute error is regarded as the differential, and the relative error for x refers to the . Therefore, the relative errors of the multiplication and division methods can be expressed as Equations (A27) and (A28).
With Equations (A25)–(A28), the relative error of effective inventory in Equation (20) can be expressed as:
The relative errors of gas injection−production rate and temperature in UGS can be ignored, and the Equation (A29) can be simplified as:
Appendix D. Calculation of Deviation Factor
The deviation factor in gas equation of state is expressed as:
The deviation factor calculation method proposed by the American Gas Association (AGA) can be described as [58]:
The second virial coefficient B to calculate the gas composition and temperature is:
where is the mole fraction of the gas component, is the gas mixture interaction coefficient, and are parameters in the state equation, is the binary energy parameter, is the volume parameters of gas components, and is the component numbers of a gas mixture. The can be calculated by Equation (A34).
where , , , and are energy parameters in a gas mixture, and are parameters in the state equation. The relative density can be calculated using Equation (A35).
Substituting the calculated parameters , , and into Equation (A36), the dichotomous method is used to calculate the pressure value. The absolute error for pressure is chosen to be 1 × 10⁻⁶. The obtained can be substituted into Equation (A31) to calculate the gas deviation factor.
References
- Qafleshi, M.; Kryeziu, D.R.; Qafleshi, D. A Review on the Kosovo’s Challenge on Green Energy Generation and Paris Climate Agreement. 2021. Available online: https://knowledgecenter.ubt-uni.net/conference/2021UBTIC/all-events/8 (accessed on 28 November 2022).
- Cohen, R.; Eames, P.C.; Hammond, G.P.; Newborough, M.; Norton, B. Briefing: The 2021 Glasgow Climate Pact: Steps on the transition pathway towards a low carbon world. Proc. Inst. Civ. Eng.-Energy 2022, 175, 97–102. [Google Scholar] [CrossRef]
- Jia, Z.; Lin, B. How to achieve the first step of the carbon-neutrality 2060 target in China: The coal substitution perspective. Energy 2021, 233, 121179. [Google Scholar] [CrossRef]
- Wang, Y.; Guo, C.H.; Chen, X.J.; Jia, L.Q.; Guo, X.N.; Chen, R.S.; Zhang, M.S.; Chen, Z.Y.; Wang, H.D. Carbon peak and carbon neutrality in China: Goals, implementation path and prospects. China Geol. 2021, 4, 720–746. [Google Scholar] [CrossRef]
- Xu, G.; Dong, H.; Xu, Z.; Bhattarai, N. China can reach carbon neutrality before 2050 by improving economic development quality. Energy 2022, 243, 123087. [Google Scholar] [CrossRef]
- Xu, T.; Tian, H.; Zhu, H.; Cai, J. China actively promotes CO2 capture, utilization and storage research to achieve carbon peak and carbon neutrality. Adv. Geo-Energy Res. 2022, 6, 1–3. [Google Scholar] [CrossRef]
- Depledge, J.; Saldivia, M.; Peñasco, C. Glass half full or glass half empty? the 2021 Glasgow Climate Conference. Clim. Policy 2022, 22, 147–157. [Google Scholar] [CrossRef]
- Bashir, M.F.; Pan, Y.; Shahbaz, M.; Ghosh, S. How energy transition and environmental innovation ensure environmental sustainability? Contextual evidence from Top-10 manufacturing countries. Renew. Energy 2023, 204, 697–709. [Google Scholar] [CrossRef]
- Mahlia, T.M.I.; Saktisahdan, T.J.; Jannifar, A.; Hasan, M.H.; Matseelar, H.S.C. A review of available methods and development on energy storage; technology update. Renew. Sustain. Energy Rev. 2014, 33, 532–545. [Google Scholar] [CrossRef]
- Koohi-Fayegh, S.; Rosen, M.A. A review of energy storage types, applications and recent developments. J. Energy Storage 2020, 27, 101047. [Google Scholar] [CrossRef]
- Plaat, H. Underground gas storage: Why and how. Geol. Soc. Lond. Spec. Publ. 2009, 313, 25–37. [Google Scholar] [CrossRef]
- Lemieux, A.; Shkarupin, A.; Sharp, K. Geologic feasibility of underground hydrogen storage in Canada. Int. J. Hydrogen Energy 2020, 45, 32243–32259. [Google Scholar] [CrossRef]
- Li, L.; Liang, W.; Lian, H.; Yang, J.; Dusseault, M. Compressed air energy storage: Characteristics, basic principles, and geological considerations. Adv. Geo-Energy Res. 2018, 2, 135–147. [Google Scholar] [CrossRef]
- Barron, T.F. Regulatory, technical pressures prompt more US salt-cavern gas storage. Oil Gas J. 1994, 92. [Google Scholar]
- Zhang, J.; Tan, Y.; Zhang, T.; Yu, K.; Wang, X.; Zhao, Q. Natural gas market and underground gas storage development in China. J. Energy Storage 2020, 29, 101338. [Google Scholar] [CrossRef]
- Ozarslan, A. Large-scale hydrogen energy storage in salt caverns. Int. J. Hydrogen Energy 2012, 37, 14265–14277. [Google Scholar] [CrossRef]
- Soroush, M.; Alizadeh, N. Underground gas storage in a partially depleted gas reservoir. In Proceedings of the Petroleum Society’s 8th Canadian International Petroleum Conference, Calgary, AB, Canada, 12–14 June 2007. [Google Scholar] [CrossRef]
- Lysyy, M.; Fernø, M.; Ersland, G. Seasonal hydrogen storage in a depleted oil and gas field. Int. J. Hydrogen Energy 2021, 46, 25160–25174. [Google Scholar] [CrossRef]
- Goryl, L. 2012–2015 Triennium Work Reports: Working Committee 2: Underground Gas Storage WGC PARIS 2015 World Gas Conference; International Gas Union: Barcelona, Spain, 2018. [Google Scholar]
- Molíková, A.; Vítězová, M.; Vítěz, T.; Buriánková, I.; Huber, H.; Dengler, L.; Hanišáková, N.; Onderka, V.; Urbanová, I. Underground gas storage as a promising natural methane bioreactor and reservoir? J. Energy Storage 2021, 47, 103631. [Google Scholar] [CrossRef]
- Ding, G.; Li, C.; Wang, J.; Xu, H.; Zheng, Y.; Wanyan, Q.; Zhao, Y. The status quo and technical development direction of underground gas storages in China. Nat. Gas Ind. B 2015, 2, 535–541. [Google Scholar] [CrossRef]
- Tang, Y.; Long, K.; Wang, J.; Xu, H.; Wang, Y.; He, Y.; Shi, L.; Zhu, H. Change of phase state during multi-cycle injection and production process of condensate gas reservoir based underground gas storage. Pet. Explor. Dev. 2021, 48, 395–406. [Google Scholar] [CrossRef]
- Song, X.; Li, G.; Wen, X. A Probabilistic Model to Evaluate the Operation Reliability of the Underground System in Underground Gas Storage Transformed from Depleted Gas Reservoir. In Proceedings of the International Petroleum Technology Conference, Bangkok, Thailand, 14–16 November 2016. [Google Scholar] [CrossRef]
- Wanyan, Q.; Ding, G.; Zhao, Y.; Li, K.; Deng, J.; Zheng, Y. Key technologies for salt-cavern underground gas storage construction and evaluation and their application. Nat. Gas Ind. B 2018, 5, 623–630. [Google Scholar] [CrossRef]
- Ma, X.; Pei, G.; Xu, H.; Song, L. Hutubi Gas Storage Facility. In Handbook of Underground Gas Storages and Technology in China; Springer: Singapore, 2020. [Google Scholar] [CrossRef]
- Qin, Q.; Lin, L.; Pan, X. Research Methods of Main Parameter Sensitivity Differences in China’s Dynamic Oil and Gas Reserve Estimation under SEC Standards. Energies 2022, 15, 5358. [Google Scholar] [CrossRef]
- Han, G.; Liu, Y.; Sun, L.; Liu, M.; Gao, D.; Li, Q. Determination of pore compressibility and geological reserves using a new form of the flowing material balance method. J. Pet. Sci. Eng. 2019, 172, 1025–1033. [Google Scholar] [CrossRef]
- Wei, Y.; Jia, A.; Xu, Y.; Fang, J. Progress on the different methods of reserves calculation in the whole life cycle of gas reservoir development. J. Nat. Gas Geosci. 2021, 6, 55–63. [Google Scholar] [CrossRef]
- Liu, Y.; Zhu, W.; Kong, D.; Pan, B.; Yue, M. Analytical model of hydraulic fracturing horizontal well gas production capacity of a water-bearing tight sandstone reservoir considering planar heterogeneity. Phys. Fluids 2022, 34, 126603. [Google Scholar] [CrossRef]
- Cui, M.; Fan, A.; Wang, Z.; Gao, W.; Li, J.; Li, Y. A volumetric model for evaluating tight sandstone gas reserves in the Permian Sulige gas field, Ordos Basin, Central China. Acta Geol. Sin. Engl. Ed. 2019, 93, 386–399. [Google Scholar] [CrossRef]
- Gümrah, N.; Fevzi, K. A numerical simulation study on mixing of inert cushion gas with working gas in an underground gas storage reservoir. Energy Sources 2000, 22, 869–879. [Google Scholar] [CrossRef]
- Agate, G.; Colucci, F.; Guandalini, R.; Moia, F.; Pagotto, R.; Crosta, G.B. A Numerical Modeling Approach to Investigate the Safety Aspects of the Gas Storage in a Deep Geological Reservoir. In Proceedings of the Offshore Mediterranean Conference and Exhibition, Ravenna, Italy, 29–31 March 2017. OMC-2017–768. [Google Scholar]
- Wang, J.; Fu, J.; Xie, J.; Wang, J. Quantitative characterisation of gas loss and numerical simulations of underground gas storage based on gas displacement experiments performed with systems of small-core devices connected in series. J. Nat. Gas Sci. Eng. 2020, 81, 103495. [Google Scholar] [CrossRef]
- Wei, C.; Liu, Y.; Deng, Y.; Cheng, S.; Hassanzadeh, H. Temperature Transient Analysis of Naturally Fractured Geothermal Reservoirs. SPE J. 2022, 27, 2723–2745. [Google Scholar] [CrossRef]
- Tahmasebi, A.; Nasiri, A.; Riazi, M.; Amiri, M. Advantages and disadvantages of in situ N2 presence in underground gas storage (UGS) process: Technical and economical evaluation of a case study. J. Nat. Gas Sci. Eng. 2020, 84, 103649. [Google Scholar] [CrossRef]
- Mahdi, D.S.; Al-Khdheeawi, E.A.; Yuan, Y.; Zhang, Y.; Iglauer, S. Hydrogen underground storage efficiency in a heterogeneous sandstone reservoir. Adv. Geo-Energy Res. 2021, 5, 437–443. [Google Scholar] [CrossRef]
- Li, H.; Deng, J.; Wanyan, Q.; Feng, Y.; Kamgue Lenwoue, A.R.; Luo, C.; Hui, C. Numerical investigation on shape optimization of small-spacing twin-well for salt cavern gas storage in ultra-deep formation. Energies 2021, 14, 2859. [Google Scholar] [CrossRef]
- Reza, M.; Reza, A. The optimization of underground gas storage in a partially depleted gas reservoir. Pet. Sci. Technol. 2011, 9, 824–836. [Google Scholar] [CrossRef]
- Iwaszczuk, N.; Prytula, M.; Prytula, N.; Pyanylo, Y.; Iwaszczuk, A. Modeling of Gas Flows in Underground Gas Storage Facilities. Energies 2022, 15, 7216. [Google Scholar] [CrossRef]
- Azin, R.; Nasiri, A.; Entezari, A.J. Underground gas storage in a partially depleted gas reservoir. Oil Gas Sci. Technol.-Rev. IFP 2008, 63, 691–703. [Google Scholar] [CrossRef]
- Tek, M.R. Underground Storage of Natural Gas; Gulf Publishing Company, Book Division: Houston, TX, USA, 1987. [Google Scholar]
- Lee, J.; Wattenbargar, R.A. Gas Reservoir Engineering; Society of Petroleum Engineers: Houston, TX, USA, 1996; ISBN 978-1-61399-924-0. [Google Scholar] [CrossRef]
- Tang, L.; Wang, J.; Bai, F.; Shi, L. Inventory forecast of underground gas storage based on modified material balance equation. Pet. Explor. Dev. 2014, 41, 528–532. [Google Scholar] [CrossRef]
- Mukherjee, H.; Economides, M.J. A parametric comparison of horizontal and vertical well performance. SPE Form. Eval. 1991, 6, 209–216. [Google Scholar] [CrossRef]
- Stehfest, H. Algorithm 368: Numerical inversion of Laplace transforms. Commun. ACM 1970, 13, 47–49. [Google Scholar] [CrossRef]
- Al-Hussainy, R.; Ramey, H.J.; Crawford, P.B. The Flow of Real Gases Through Porous Media. J. Pet. Technol. 1966, 18, 624–636. [Google Scholar] [CrossRef]
- Johnson, T.W.; Berwald, W.B. Deviation of Natural Gas from Boyle’s Law; US Government Printing Office: Washington, DC, USA, 1932; Volume 539.
- Geostock. 2022. Available online: https://www.geostockgroup.com/activites/types-de-stockage-souterrains (accessed on 28 November 2022).
- Ozkan, E.; Raghavan, R. New solutions for well-test-analysis problems: Part 1—Analytical considerations. SPE Form. Eval. 1991, 6, 359–368. [Google Scholar] [CrossRef]
- Zheng, D.; Xu, H.; Wang, J.; Sun, J.; Zhao, K.; Li, C.; Shi, L.; Tang, L. Key evaluation techniques in the process of gas reservoir being converted into underground gas storage. Pet. Explor. Dev. 2017, 44, 840–849. [Google Scholar] [CrossRef]
- Ma, X.; Zheng, D.; Shen, R.; Wang, C.; Luo, J.; Sun, J. Key technologies and practice for gas field storage facility construction of complex geological conditions in China. Pet. Explor. Dev. 2018, 45, 507–520. [Google Scholar] [CrossRef]
- He, Y.; Lan, Y.; Liu, J.; Cao, R. New Interpretation Methods of Interference Test and Its Application on UGS. International Field Exploration and Development Conference; Springer: Singapore, 2022. [Google Scholar] [CrossRef]
- Chu, H.; Ma, T.; Zhu, W.; Gao, Y.; Zhang, J.; Lee, W.J. A novel semi-analytical monitoring model for multi-horizontal well system in large-scale underground natural gas storage: Methodology and case study. Fuel 2023, 334, 126807. [Google Scholar] [CrossRef]
- Chu, H.; Ma, T.; Chen, Z.; Liu, W.; Gao, Y. Well Testing Methodology for Multiple Vertical Wells with Well Interference and Radially Composite Structure during Underground Gas Storage. Energies 2022, 15, 8403. [Google Scholar] [CrossRef]
- Cinco, L.; Heber, F.; Samaniego, V.; Dominguez, N.A. Transient pressure behavior for a well with a finite-conductivity vertical fracture. Soc. Pet. Eng. J. 1978, 18, 253–264. [Google Scholar] [CrossRef]
- Chu, H.; Zhang, J.; Zhang, L.; Ma, T.; Gao, Y.; Lee, W.J. A new semi-analytical flow model for multi-branch well testing in natural gas hydrates. Adv. Geo-Energy Res. 2023, 7, 176–188. [Google Scholar] [CrossRef]
- Standing, M.B.; Katz, D.L. Density of natural gases. Trans. AIME 1942, 146, 140–149. [Google Scholar] [CrossRef]
- ISO-12213-2; Natural Gas—Calculation of Compression Factor—Part 2: Calculation Using Molar-Composition Analysis. Technical Report; International Organization for Standardization: Geneva, Switzerland, 2006.
- Hu, G.; Zhang, S.; Li, J.; Li, J.; Han, Z. The origin of natural gas in the Hutubi gas field, Southern Junggar Foreland Sub-basin, NW China. Int. J. Coal Geol. 2010, 84, 301–310. [Google Scholar] [CrossRef]
- Liao, W.; Liu, G.; Chen, R.; Sun, J.; Zhang, S.; Wang, Y.; Liu, X. Evaluation on the dynamic sealing capacity of underground gas storages rebuilt from gas reservoirs: A case study of Xinjiang H underground gas storage. Nat. Gas Ind. B 2021, 8, 334–343. [Google Scholar] [CrossRef]
- Wang, Y.; Feng, G.; Li, Z.; Xu, W.; Zhu, J.; He, L.; Xiong, Z.; Qiao, X. Retrieving the displacements of the Hutubi (China) underground gas storage during 2003–2020 from multi-track InSAR. Remote Sens. Environ. 2022, 268, 112768. [Google Scholar] [CrossRef]
- Wang, B.; Li, D.; Xu, B.; Zhang, Y.; Zhang, F.; Wang, Q.; Yang, B. Probabilistic-based geomechanical assessment of maximum operating pressure for an underground gas storage reservoir, NW China. Geomech. Energy Environ. 2022, 31, 100279. [Google Scholar] [CrossRef]
- Song, L.; Xu, H.; Wang, J.; Zhao, K.; Liao, W.; Zhang, S.; Zhang, G. Production Performance Analysis of the Biggest Underground Gas Storage in China. In Proceedings of the SPE Asia Pacific Oil & Gas Conference and Exhibition, Virtual, 17–19 November 2020. [Google Scholar] [CrossRef]
- Zhang, B.; Wang, B.; Wei, B.; Wu, Z.; Wu, N.E.; Lu, R.; Ji, Z.; Hou, J.; Li, L. Spatiotemporal evolution of seismicity during the cyclic operation of the Hutubi underground gas storage, Xinjiang, China. Sci. Rep. 2022, 12, 14427. [Google Scholar] [CrossRef] [PubMed]
- Chen, J.; Wang, X.; Ni, Y.; Xiong, B.; Liao, F.; Liao, J.; Zhao, C. “Genetic type and source of natural gas in the southern margin of Junggar Basin, NW China. Pet. Explor. Dev. 2019, 46, 482–495. [Google Scholar] [CrossRef]
- Zheng, Y.; Sun, J.; Qiu, X.; Lai, X.; Liu, J.; Guo, Z.; Wei, H.; Min, Z. Connotation and evaluation technique of geological integrity of UGSs in oil/gas fields. Nat. Gas Ind. B 2020, 7, 594–603. [Google Scholar] [CrossRef]
- Lee, J.; Rollins, J.B.; Spivey, J.P. Pressure Transient Testing; Society of Petroleum Engineers: Richardson, TX, USA, 2003; ISBN 978-1-55563-099-7. [Google Scholar]
Disclaimer/Publisher’s Note: The statements, opinions and data contained in all publications are solely those of the individual author(s) and contributor(s) and not of MDPI and/or the editor(s). MDPI and/or the editor(s) disclaim responsibility for any injury to people or property resulting from any ideas, methods, instructions or products referred to in the content. |
© 2023 by the authors. Licensee MDPI, Basel, Switzerland. This article is an open access article distributed under the terms and conditions of the Creative Commons Attribution (CC BY) license (https://creativecommons.org/licenses/by/4.0/).