Article

Agent-Based Simulation and Micro Supply Chain of the Food–Energy–Water Nexus for Collaborating Urban Farms and the Incorporation of a Community Microgrid Based on Renewable Energy

1
Industrial Engineering & Management Systems Department, University of Central Florida, Orlando, FL 32816, USA
2
Research Group on Logistics Systems, College of Engineering, Universidad de La Sabana, Campus del Puente del Común, Km. 7, Autopista Norte de Bogotá, Chía 250001, Colombia
*
Author to whom correspondence should be addressed.
Energies 2023, 16(6), 2614; https://doi.org/10.3390/en16062614
Submission received: 9 February 2023 / Revised: 3 March 2023 / Accepted: 6 March 2023 / Published: 10 March 2023
(This article belongs to the Special Issue Advanced Machine Learning Applications in Modern Energy Systems)

Abstract

:
An agent-based modeling framework is developed and employed to replicate the interactions among urban farms. The objectives are to efficiently manage an urban farm’s food, energy, and water resources, decrease food waste, and increase the food availability for the local community. A case study of eleven farms was investigated in Vancouver, Canada to study the linkages between the resources in the urban food, energy, and water nexus. Each urban farm in the simulation belonged to a community microgrid generating electricity from solar and wind. The local farms aimed to provide fresh produce for their respective local communities. However, at some points, they lacked supply, and at other points, there was excess supply, leading to food waste. Food waste can be converted into fertilizers or bioenergy. However, an alternative solution must be employed due to the natural resources required for production, efficiently managing resources, and adhering to sustainability guidelines. In this paper, an optimization framework was integrated within the agent-based model to create a micro supply chain. The supply chain directly linked the producers with the consumers by severing the links involved in a traditional food supply. Each urban farm in the study collaborated to reduce food wastage and meet consumer demands, establishing farmer-to-farmer exchange in transitional agriculture. The optimization-based micro supply chain aimed to minimize costs and meet the equilibrium between food supply and demand. Regular communication between the farms reduced food waste by 96.9% over 16 weeks. As a result, the fresh food availability increased for the local community, as exemplified by the consumer purchases over the same period. Moreover, the simulation results indicated that the renewable energy generation at the community microgrids aided in the generation of 22,774 Mwh from solar and 2568 Mwh from wind. This has the potential to significantly reduce CO2 emissions in areas that heavily rely on non-renewable energy sources.

1. Introduction

The modern industrial world must change its demographics, urban sprawls, and increased demands for food, energy, and water resources. As the demand for resources increases, we must also consider that the supply of some resources may decrease in the future. Thus, we are faced with significant challenges that require more efficient methods for utilizing resources to meet the global demand. The production, distribution and processing of energy and water are interconnected, and it becomes increasingly important to ensure that efficient amounts are utilized. In addition, water and energy resources are needed to produce and distribute food to consumers. Thus, agricultural innovation is required to satisfy demands, improve food and water security, and address spatial issues. An approach coined the food–energy–water (FEW) nexus has been developed to investigate the interconnectedness of resources; identify the synergies, complexities, and trade-offs that occur’ and design policies and systems that would meet the strategic sustainability goals for efficiently using resources [1].
The main challenge is successfully incorporating the interconnectedness of the evolving FEW nexus, as there will be greater demand for food, energy, and water resources in the future. Energy and water will be required to produce food, and energy will also be required for the treatment and distribution of water. This enforces the importance of understanding the connection between these resources and how to manage them efficiently. There is also a need to optimize local production, diversify food sources and enable the design of resilient food systems based on the circular economy and obtain minimum energy, carbon, and water footprints while minimizing food waste, as important natural resources are used in production. Future population projections require global food production to increase by 70% to 100% by 2050 [2]. Many constraints and challenges need to be solved to meet the anticipated food demand increase by 2050, and this involves focusing on increasing food access and reducing food waste [3]. Many variables are associated with sustainable food production, including efficiently using land, utilizing all produced food, and creating food trade regimes [3]. Improving crop yield is insufficient to meet the projected global food demand, and focusing on decreasing food waste can aid in meeting the demand and lowering carbon emissions [4]. Additionally, global water demand is expected to increase by 20 to 30% by 2050, and the agriculture sector currently comprises approx. 70% of the global water use [5]. Kaufman and Bailkey (2000) identified the need for collaboration between urban farms. They pointed out that introducing food exchanges between farms can help minimize food waste and increase food availability for the local community surrounding an urban farm [6]. In addition, approx. 25% of food transport greenhouse gas (GHG) emissions in the United States are associated with food delivery to consumers. These emissions are due to the reliance on trucks for food transportation in the produce sector [7]. Therefore, collaborating with urban farms and solving spatial issues by establishing farms close to consumers can aid in alleviating the issue of greenhouse gas emissions related to food transportation.
This paper aims to further extend our previous work on the agent-based modeling of the FEW nexus [8] by developing a comprehensive system of urban farming with community microgrids and urban farm collaboration with food exchanges to synergize the plans and policies to meet the sustainability goals of the urban food–energy–water nexus. This leads to a greater understanding of the complexities, trade-offs, risks, and synergies associated with the urban FEW nexus and addresses its spatial aspects. The novelty is in integrating technology and management as a nexus framework in which socio-economic tools and spatial analyses are utilized to identify the linkage between the components, using an agent-based model integrating the optimization of food exchange, and introducing the term farmer-to-farmer exchange (FFE). This sharing/exchange framework is of increased importance as it aids in solving spatial issues, reducing food waste, and increasing local community access to urban farms. Policymakers can utilize the framework introduced in this article to meet their sustainability goals, such as lowering carbon emissions and utilizing renewable energy. In addition, the framework can aid in increasing the food availability for the local communities and encouraging farmers to increase their production and collaboration.
The remaining sections of this paper are organized in the following manner. The following section discusses the work conducted by other researchers in the areas of agent-based modeling, the food–energy–water (FEW) nexus, food supply chains, the agri-food sector, and food sustainability. Additionally, the gaps in past research are identified. Section 3 begins by introducing the problem at hand and discusses the methodology in the form of agent-based modeling and optimization models. Section 4 discusses the data collection and the methodology behind the data used in the derived models. Section 5 discusses the results of the agent-based model and the micro supply chain that are derived in this paper. The paper concludes by summarizing the findings of this paper and discussing the limitations and possible future studies.

2. Literature Review

Agent-based modeling (ABM) has been widely utilized to study a range of topics involving human behavior and analyze the interactions between autonomous agents in the system. ABM is applied to various fields of study, including supply chains, stock markets, epidemiology, economics, social sciences, and marketplace behaviors [9]. Regarding agricultural ABM, researchers have utilized models to combat food deserts and increase food availability to consumers. For example, an ABM was developed to study the various policies and their effects on improving food availability for low-income consumers in Brooklyn, NY, which found that farmer’s markets improved food availability [10]. However, the spatial issues were not addressed, and the consumers who did not live near a market could not improve their access to food [10]. In addition, food utilization in relation to food security was investigated through an ABM approach. It found that food utilization depends on fuel and water availability and that rainfall variability was linked to a significant decline in food utilization [11]. Another paper studied consumer satisfaction when shopping at a farmer’s market. While the successful, spatial issues were not addressed, additional work was needed to consider the distribution for increasing consumer satisfaction [12]. Other work in the ABM literature focused on commodity markets and on studying the effect of price and quantity [13]. Other work focused on small food shops for increasing food purchases and studied the effect of changing the shop locations [14]. Other ABM agriculture models focused on farmer decision-making to assess the effect of farmer decisions and interactions within an agricultural network [15,16]. Another focus of the ABM agriculture models consisted of studying crop yields and modeling plants as agents to identify their interactions with other plants and the environment [17].
Many previous works have been conducted on the FEW nexus, and they have focused on studying the interactions between the resources and the internal and external forces that cause a change between one resource and another. Various methods were utilized, including life cycle analyses [18], ecological network analyses [19], econometric models [20], mathematical and statistical models [21], one-way analyses [22], and interactive analyses [23]. Other researchers focused on investigating the social and environmental indicators of the performances of the respective resources in the nexus utilizing integrated index analyses [24]. Furthermore, designing the optimal systems for the FEW nexus was investigated to assess the impacts on the strategic goals and to consider the overall impact on the system, which included several approaches. The optimization models [25] were used to design the optimal systems. First, they needed a proper investigation into the trade-offs and synergies between the resources in the FEW nexus. Agent-based modeling [26] and system dynamics [27] were used to study a system’s social behaviors where different scenarios were employed. The FEW nexus was investigated and its role was determined by whether it could contribute to the economic growth in the global regions. The authors concluded that interventions are needed, along with collaboration between the sectors, and the way forward is to begin with macro-regional levels [28].
In the literature, most of the food supply chain research focused on large-scale supply chains that involve suppliers, wholesalers, and retailers. For example, one study investigated the food supply chain, studied the interactions between the suppliers, wholesalers, retailers, and buyers, and focused on the consumers’ purchase experience. The results identified competition between local retailers and other market outlets and that producers needed to provide additional market outlets to increase consumer food access [29]. In addition, the mango supply chain was investigated in another study, which began with farmers and passed through traders and retailers before finally reaching consumers. It was found that the farmers received the least value from mango sales. In contrast, the retailers received the most value [30].
Another area of research related to food security focused on economic policy, supply and demand strategies, and understanding consumer behavior to investigate better short food supply chains and their role in rural areas. Marsden et al. (2000) found that, while food supply chain management can be successful, it can pose challenges to the entities responsible for the economic and social growth in rural areas [31]. The survey methods to collect the data and model the behavior of the agents and their exact decision-making process in a dairy supply chain were considered in [32]. Another study utilized a multi-agent simulation model for a theoretical food supply system, incorporating farmer agents who would sell their food at a regional food. The goal was to sell food at the best possible price while also studying the effects of the different policies of the food hub on the system outcomes. The results found that the food hub policy considerably impacted the overall system performance, which dictated the costs, the number of farms, and the food distribution [33]. The agent-based simulation was recently employed to study the impact of contract farming on the rice supply chain in Vietnam. The work focused on identifying the monetary incentives and trust among the farmers, the impact on the farming contracts, and whether the farmers could oblige to the contracts for rice production [34]. Another study utilized agent-based modeling to reduce food waste by employing crowd-shipping to send food to food-insecure individuals. Food was donated to a food rescue program and sent to shelters. However, it was found that creating awareness for this program and finding committed volunteers was an issue that needed to be addressed [35]. Farmer coordination and the effect of the food supply chains were also studied using agent-based simulation. Krejca and Beamon (2015) studied farmers that grouped together to produce a single crop to achieve economies of scale and various factors, including income, volume, and profit-sharing. The results found that the farmers could consolidate over time, leading to a stronger supply chain structure [36]. Finally, a recent survey paper focused on the different applications of agent-based models in agri-food supply chains. It was found that the existing literature needed to focus on the collaboration between the agents and the buyer–seller relationships [37].
Many authors explored the challenges in the agri-food sector and investigated possible solutions through theoretical studies. The questions posed included determining how and by which means food supply chains and sustainability could be improved, as well as the managerial and strategical implications of using such tools. It was mentioned that it was important to consider the efficiency, effectiveness, and cost reductions in supply chain optimization. Digitization can improve supply chains, and efficiently managing supply chains can increase the access to markets, leading to strategic green choices [38]. Day-Farnsworth and Miller (2014) held a strategic conference with local and regional food suppliers to gain a greater insight into food supply chains and what efforts are needed to improve them. One of the findings was that regular communication between suppliers and buyers can improve food supply chains [39]. Other works echoed the importance of communication in food supply chains and the importance of structured logistics [40]. To promote sustainability and increase food access, food system innovations are essential, including farmer’s markets, community supported agriculture (CSA), farm-to-institution programs, and food subs [41]. Farmer’s markets and CSA are effective methods to increase farm income and support the local consumption of fresh produce [41]. Recent work further investigated the micro food supply chain (MFSC) with an example in Slovakia, where the micro supply chain was able to improve the social situations due to increased food sales. The shortening of links in the supply chain influenced the increased sales, and it was stated that, to improve the supply chain further, it was important to minimize the travel distances within the supply chain [42]. Dharmalingam et al. (2021) echoed using a short supply chain to combat food insecurities and meet food demand through a theoretical approach in a case study in India during the COVID-19 pandemic [43].
The research completed in the studies focusing on agent-based simulations and the supply chains of agricultural products did not factor in the synergy of the resources in the food–energy–water nexus, as food was the only resource considered, while energy and water resources were not. The limitation of these studies is that they need to consider the overall system and the connections and synergies between the resources, focusing on one resource at a time. Other works focused on theoretical approaches to the micro food supply chain and still need to implement models to solve the problem. In addition, these studies focused on food sales. In this paper, we focus on implementing a micro supply chain between collaborating farms where there is a direct link from the producer to the consumer in the supply chain.
The demand for sustainable solutions continues to grow as the awareness of climate change, resource management and environmental friendliness increases. Policymakers are tasked with developing sustainable strategies to tackle world issues in various sectors that focus on various natural resources. As previously stated, the FEW nexus is a valuable tool, as it allows decision-makers to gain a greater understanding of the connections, synergies, complexities and trade-offs that occur between food, energy, and water resources. Many policymakers are tasked with setting sustainability goals, which are derived from varying world issues. Some are based on resource management, reducing pollution, or the anticipation of future demand. There is ongoing discourse among decision-makers, discussing the importance of developing sustainable cities [44] through energy generation, water management, and food cultivation for self-sufficiency, and these ideologies are echoed by many organizations around the world. The introduction of the concept of urban farms can complement the sustainable goals that are set by decision-makers through crop cultivation and energy and water management. Additionally, these urban farms can contribute to various sustainable objectives in different sectors. There are numerous benefits that arise from the introduction of urban farming, creating a promising solution for tackling world issues. Urban farming can lead to lower carbon emissions due to a reduction in transportation for food since the source is now located closer to a community, promoting waste management and creating an atmosphere for community engagement.
Various researchers have investigated the concept of the introduction of urban agriculture within cities around the world, and some of these ideologies are starting to be implemented. In addition, researchers discuss the feasibility of urban farms, as well as the available support from governments for implementing them and the guidelines set in place. An example of this is in [45], where a study was conducted to determine Copenhagen’s case for urban farming through determining the requirements, challenges, costs, and potential impacts. Similar studies were also completed for other geographic regions around the world where spaces suitable for urban farming were identified, including the following areas: Japan [46], West Jakarta, Indonesia [47], Bangkok, Thailand [48], Naples, Italy [49], Texas, USA [50], and New York City, USA [51].
The city of Vancouver, in British Columbia, Canada, is an interesting case, as work has been completed on a census of urban farming activity in the city [52], as well as other work identifying suitable spaces throughout the city for urban farming activities [53]. Government officials in the province have taken action in supporting urban farming through the creation of policies and guidelines [54,55]. The Vancouver Urban Farming Society (VUFS) [56] is an organization that was founded in 2012, which began as a group of urban farmers who had met with the city and other food security advocates in order to discuss how urban farming conditions can improve in the city. Once officially formed as a society, the main objective was to support urban farming activity in the city through education, networking, business support, and increasing awareness in the local community. Additionally, the VUFS encourages collaboration between farmers and the city of Vancouver. The province of British Columbia has an objective of reaching net-zero carbon emissions by 2050 [57], and they are progressing well towards this objective as the current energy profile for the province consists of ~95% renewables sources [58].
The previously identified studies for various geographic regions mention the feasibility of urban farming, as well as the necessary steps to establish urban farming infrastructure. Many of these studies for urban farming in Vancouver are theoretical, do not include any mathematical models, and discuss the need for frameworks and policies to improve urban farming infrastructure. The consideration that the city of Vancouver has already established urban farming guidelines and policies and continues to promote this sustainable approach led to the use of this case study in this paper. In addition, the census conducted by the VUFS provided us with the necessary information on the existing urban farm infrastructure, leading to a more accurate portrayal of the current situation of urban farming in the city of Vancouver. We introduced an agent-based modeling approach to simulate the different interactions that occur within an urban farm and the surrounding community. This will allow us to gain a greater understanding of the system in place and identify potential improvements for the current infrastructure as well as demonstrate the benefits of urban farming in urban areas. Considering British Columbia’s net-zero objective, we included a community microgrid for generating electricity from renewables to serve the urban farm and surrounding community. The formulation and results of the agent-based model are presented in the following sections.

3. Methods and Procedures

3.1. Agent-Based Model

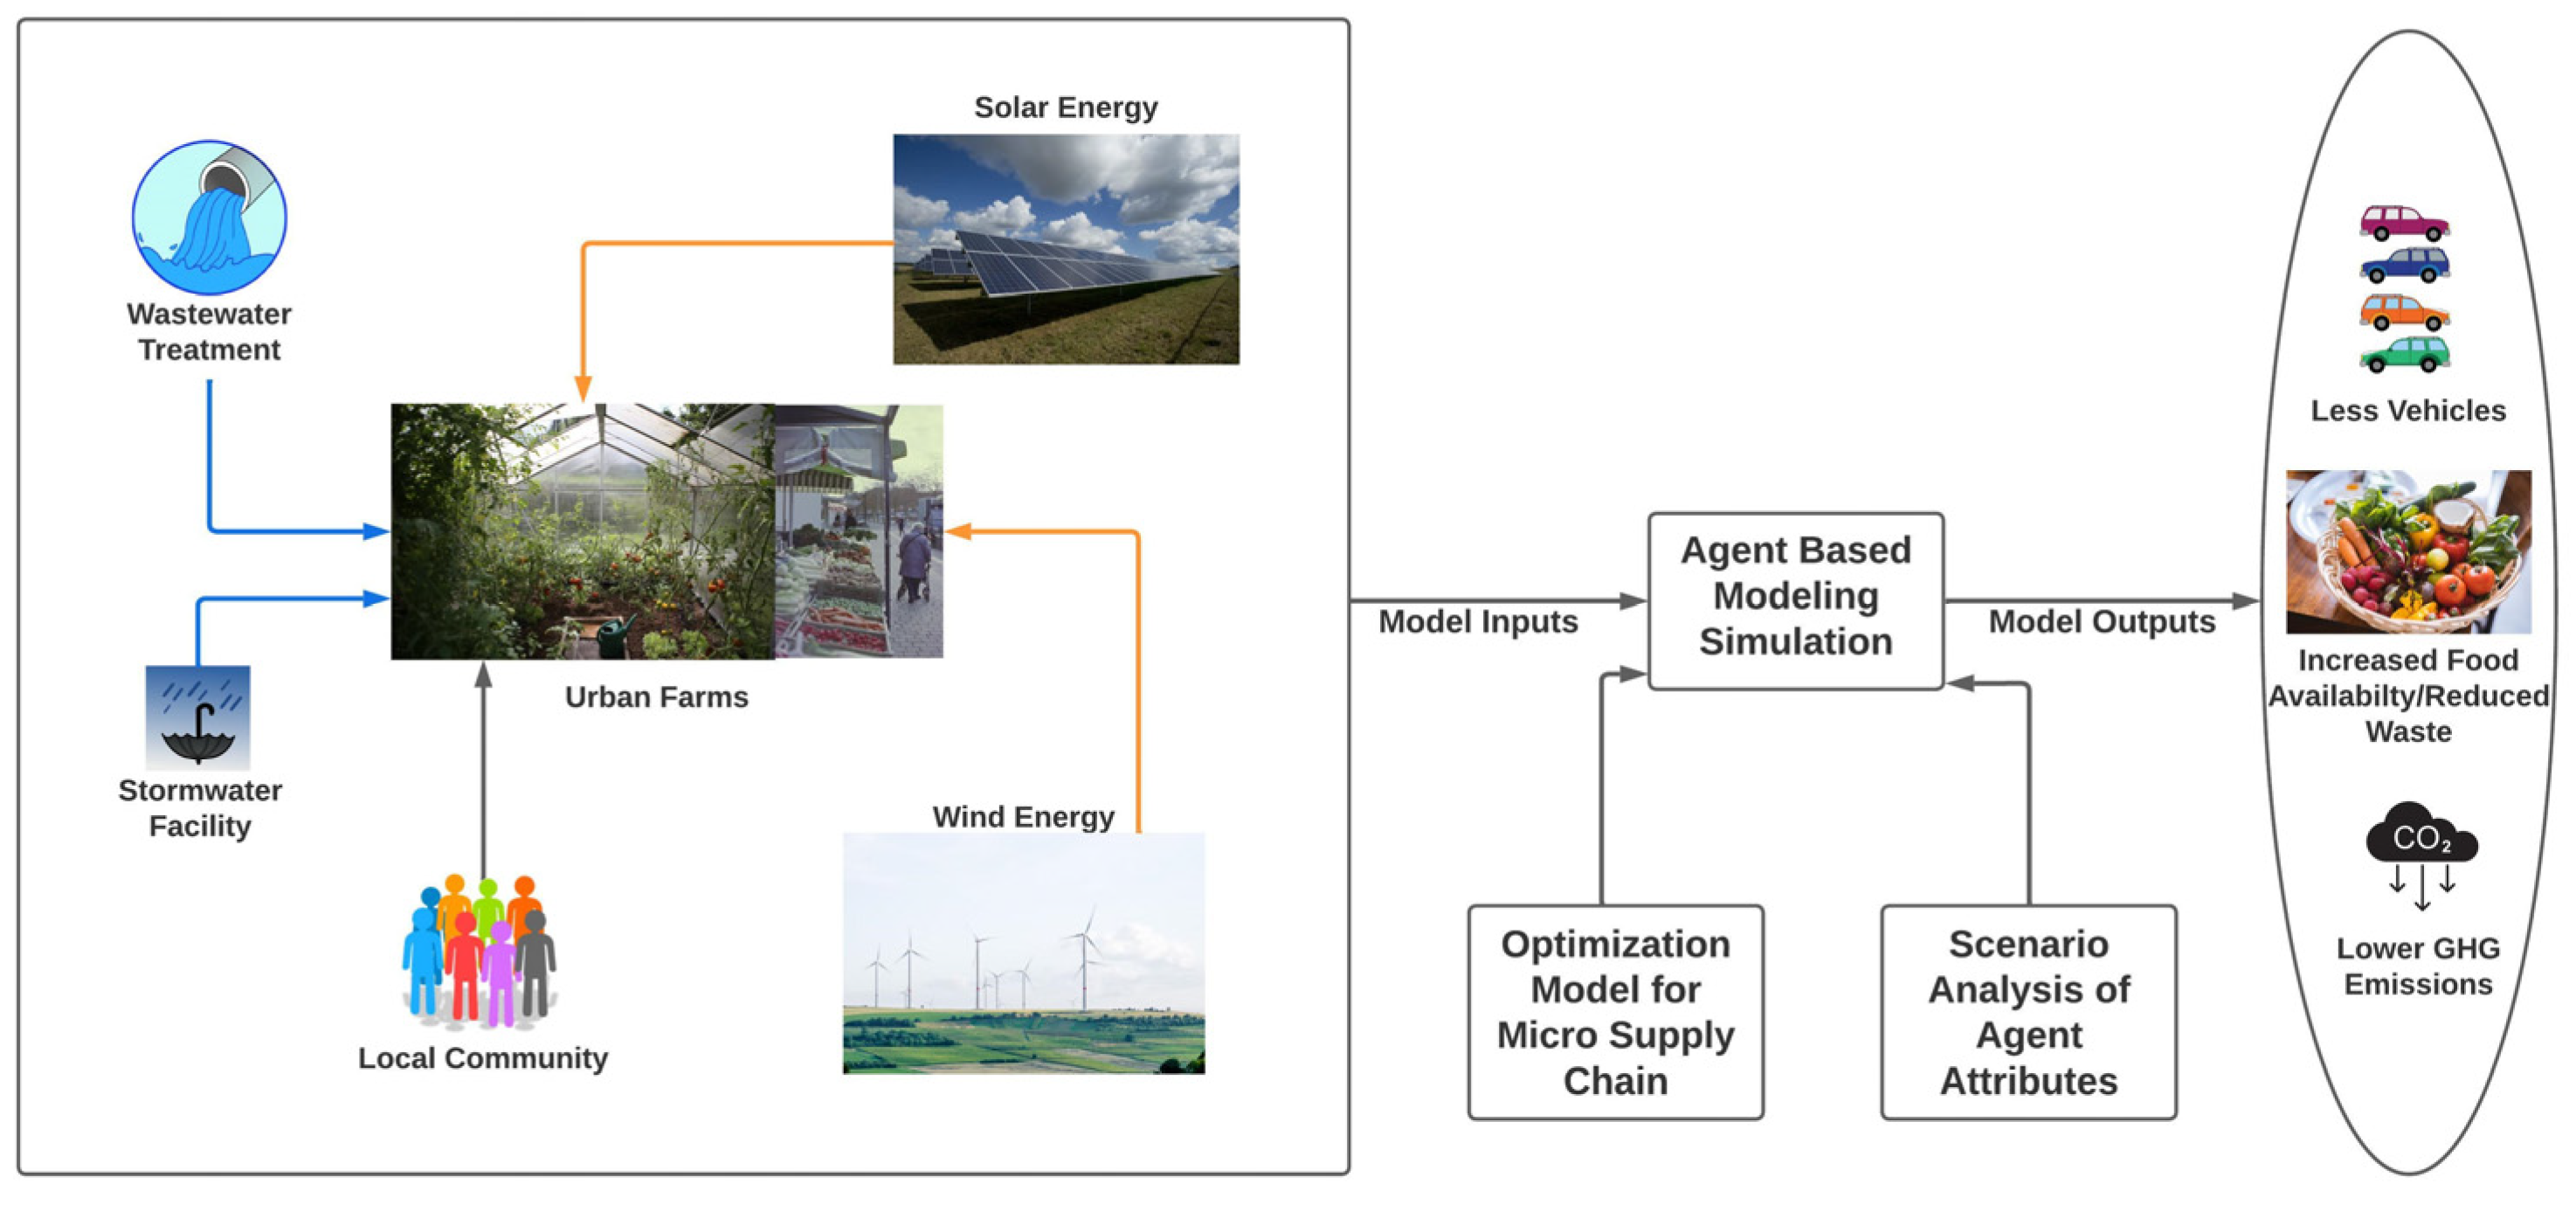
In this paper, an agent-based model (ABM) was formulated to simulate and study the interactions that occur within an urban farm that belongs to a community microgrid and whose main purpose is to provide fresh produce for the local community while also providing electricity from renewable sources, helping to reduce carbon emissions. In the formulated model, there were five agents. These were farmer agents, household agents, microgrid agents, electricity grid agents, and water agents. The goal of the ABM was to replicate the real-life interactions that would occur between the five agents. Every agent in the model was a decision-maker and interacted with the other agents and the environment in the ABM. Every agent had attributes and a decision-making process. Depending on an agent’s attributes, this could influence its decision-making. The agents in the formulated ABM were all data-driven, as their attributes were based on the input data and distributions. Through running the ABM simulation, we observed emergent phenomena and studied the results and their impacts on two of the three sustainability measures: social and environmental. The interactions between the proposed agents and the main purpose of each agent are illustrated in Figure 1. Additionally, Figure 2 showcases a visualization of the model inputs for the ABM as well as the expected outputs. The ABM also integrated an optimization model for the micro supply chain, which is discussed in Section 3.2.

3.1.1. Farmer Agent

The first agent of interest in the simulation is the farmer agent. The main objective of this agent is to grow vegetables and sell them in a harvest box to household agents every week. The harvest box will contain 1.4 kg of vegetables, and the farmer agent sells one box for each household member that a household agent has. The farmer agent will grow the vegetables for a few months, then in the 16-week summer period, will look to sell the harvest boxes to the household agents. Farmers can only sell produced vegetables during this period due to the harvest season in the city of Vancouver. The farmer agent also requires water for irrigation purposes, and thus purchases water from the water agent when there is not enough rainfall. The climate variables were collected from the statistics in the Canada database [59], and the rainfall amounts were scaled with the cultivated land size to determine the rainfall and irrigation requirements for each farmer agent. The simulation had eleven farmer agents, and each had a different sized land and production capacity. The production values were determined from the cultivated land size and which vegetables were grown. The Vancouver Urban Farming Society Census data provided the list of vegetables grown [60].
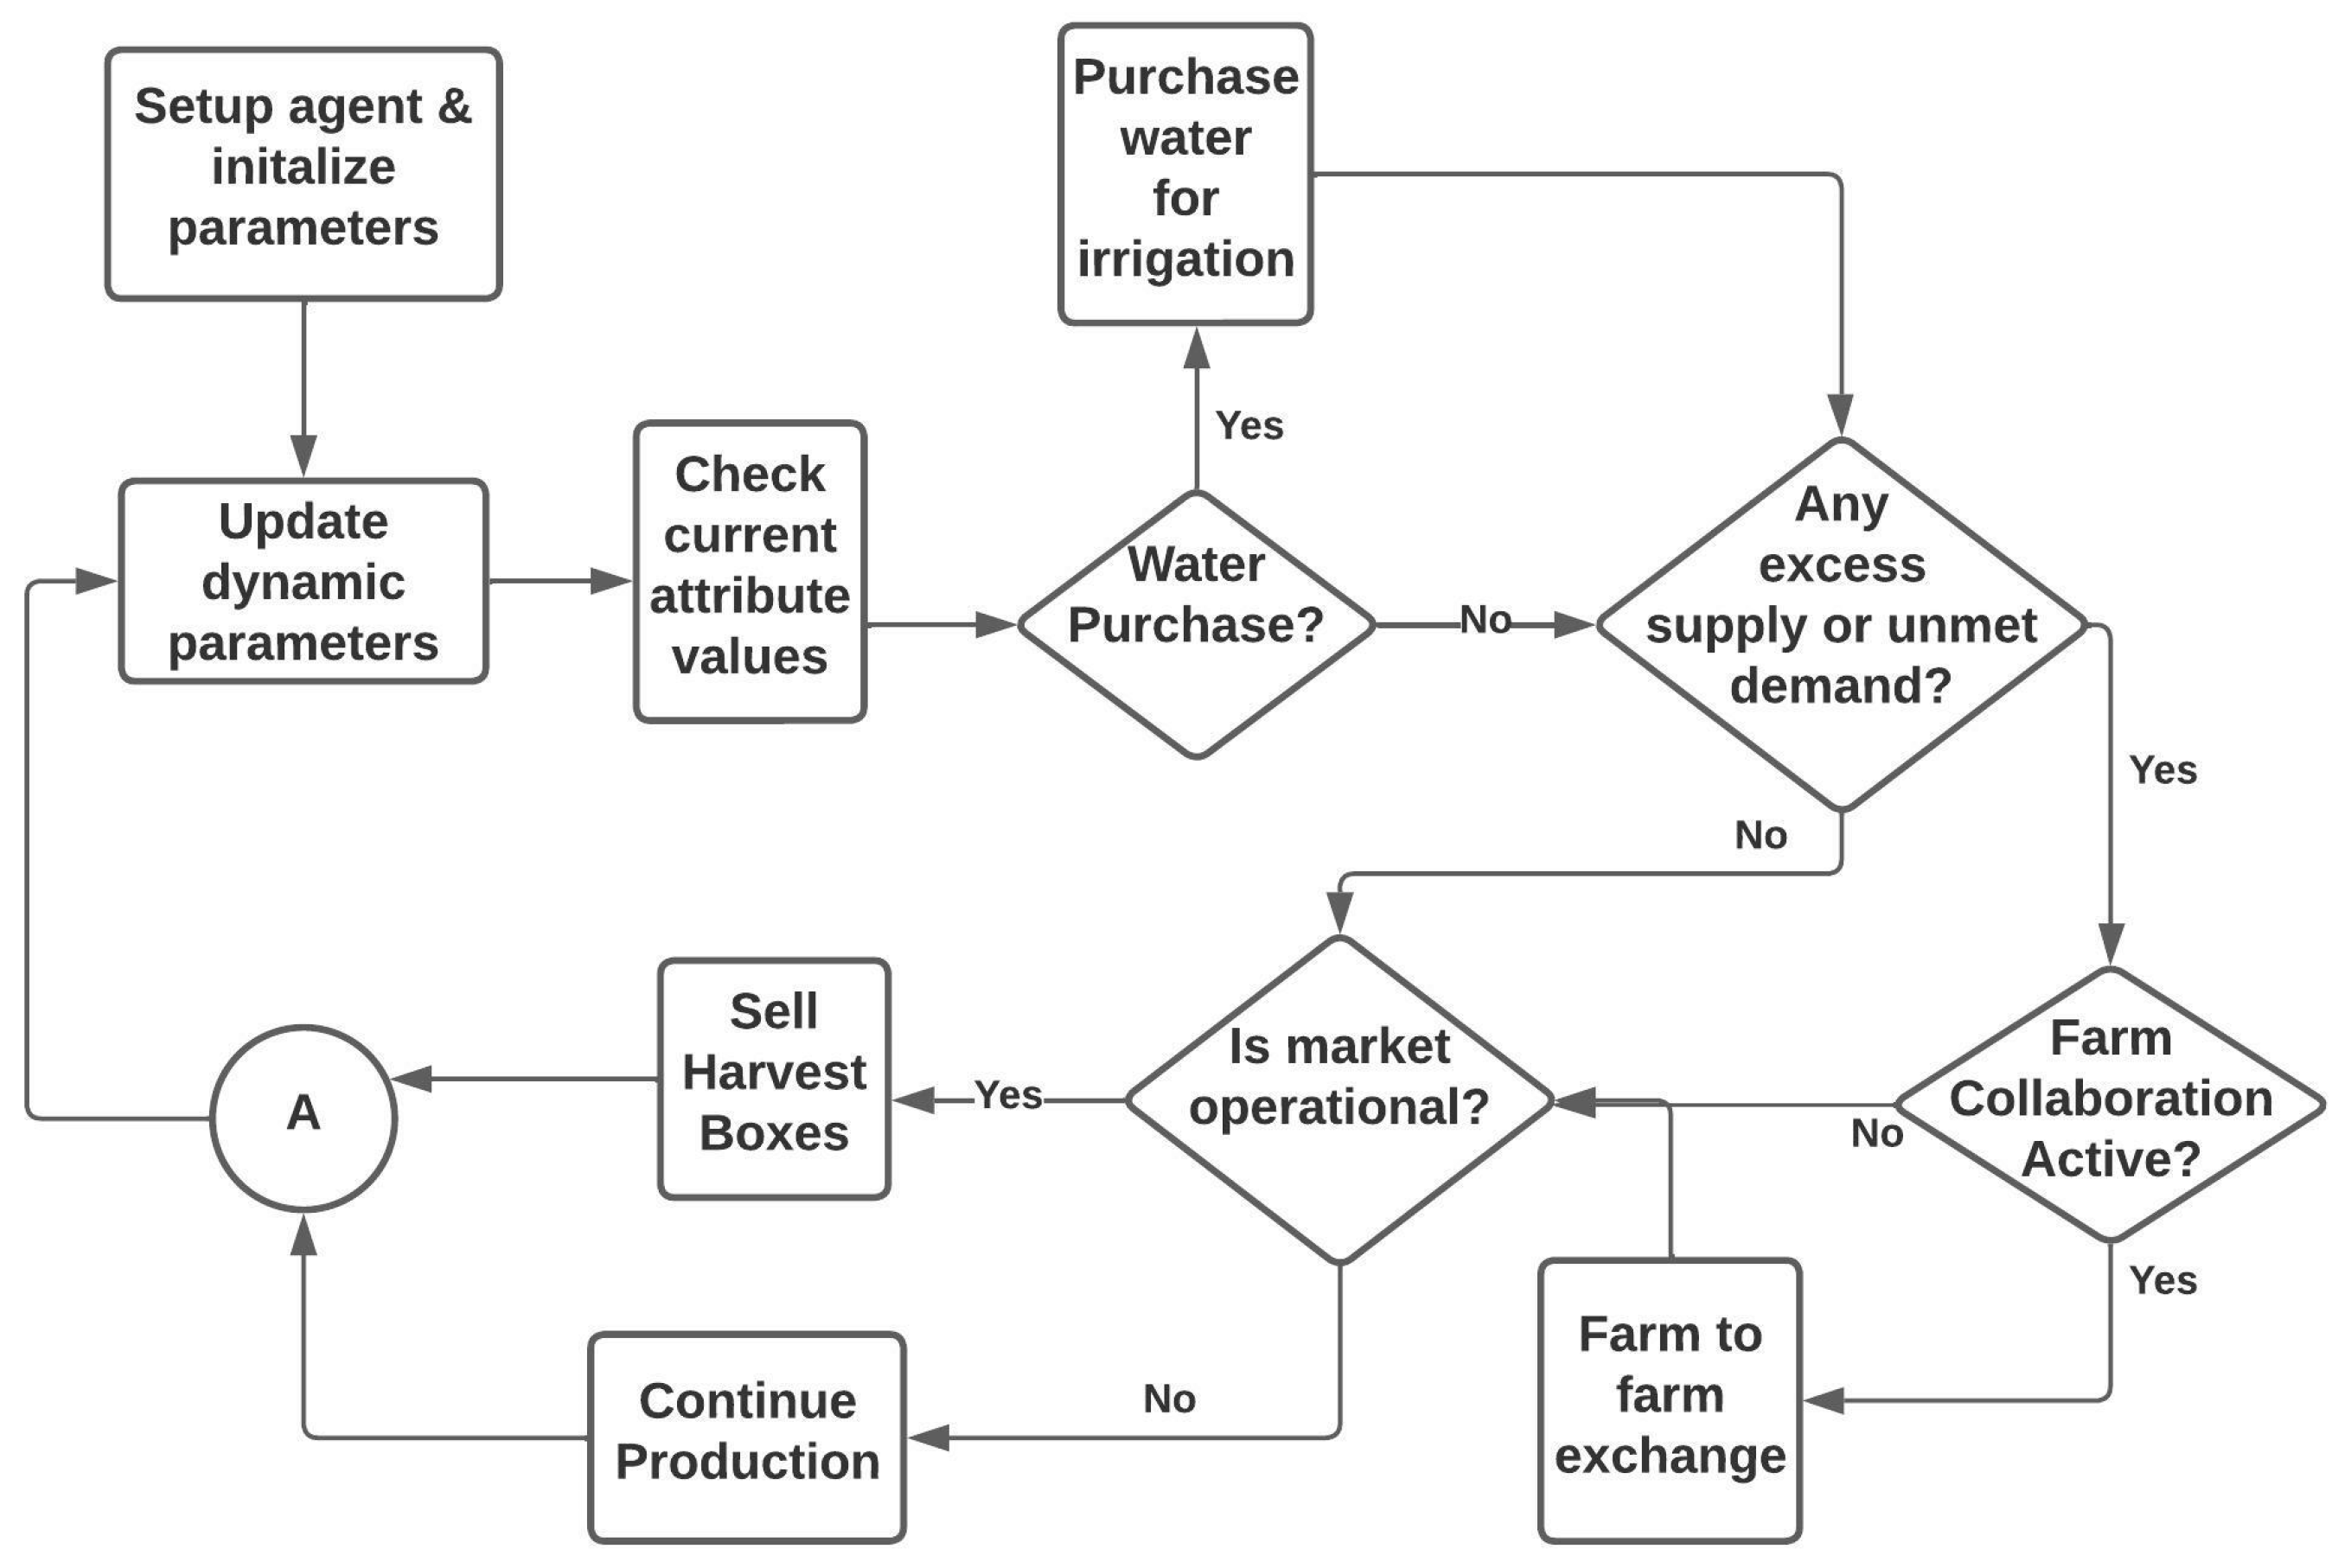
The decision-making process of the farmer agent was programmed into the agent-based model, as displayed in Figure 3. There were pre-defined rules in the decision-making process, and there were instances where the farmer agent was required to make a decision. The process begins with initializing the farmer agent’s initial attributes: the farm’s location, cultivated land size, production rate, current inventory, irrigation requirement, and selling strategy. The input data for this agent are further discussed in Section 4. The irrigation requirement depends on the cultivated land area, and the requirement per m2 was obtained from [61]. Once the dynamic parameters have been initialized, the values are checked before the farmer agent begins to make decisions. The agent’s first decision is whether they need to purchase water for irrigation purposes. If so, they interact with the water agent to complete the water purchase. The next decision is whether there is an excess supply or unmet demand based on the previous week. If this condition is met, the agent checks whether farm collaboration is active and participates in the farm-to-farm exchange. The integrated optimization model determines the amount of food exchanged. Suppose farm collaboration is not active, and the farmer agent has an excess supply (food waste). In that case, the waste could be converted into energy by burning it and creating biogas or could be converted into fertilizer, leading to a circular economy at the urban farm. Following these decision-making events, the agent checks the current time and whether the farmer’s market is operational for selling harvest boxes to the household agents. If a farm-to-farm exchange occurs, the farm will have a new inventory value before entering the farmer’s market scenario. If the farmer’s market is not operational at the current time, the agent will continue its production and will restart the decision-making process.

3.1.2. Household Agent

Household agents have several attributes, including their annual income, location, household size, preferred farm to visit, education, and buying strategy. All the household agents in the simulation were located within a kilometer of a farmer’s market. The values of these attributes were derived from the historical data collected [62]. The household agent’s main objective is to purchase fresh produce every week for their household from the farmer agent. The household agent’s location and preferred farm determine which farm the agent visits to purchase their products during the 16-week summer period. The household agent’s annual income attribute determines the agent’s buying strategy and how much they need to spend on groceries every week, including purchasing fresh produce from the farmer’s market in the summer period. The education attribute shapes an agent’s decision-making process and how likely they are to purchase fresh vegetables from the farmer’s market, with a higher education level influencing the agent on the importance of consuming this food group. Every 16 weeks, the household agent visits the urban farm to purchase a harvest box. Due to the farmer agents’ production level, the household agent may sometimes return home without a harvest box, and thus will not satisfy their demand for vegetables from the farmer’s market that week. Depending on the household size of the agent, they will look to purchase a harvest box for each of their household members when they visit the market. At the same time, the household agent supplements their total food consumption by purchasing other types of food from other sources, however the main method to purchase fresh produce is by visiting an urban farm.
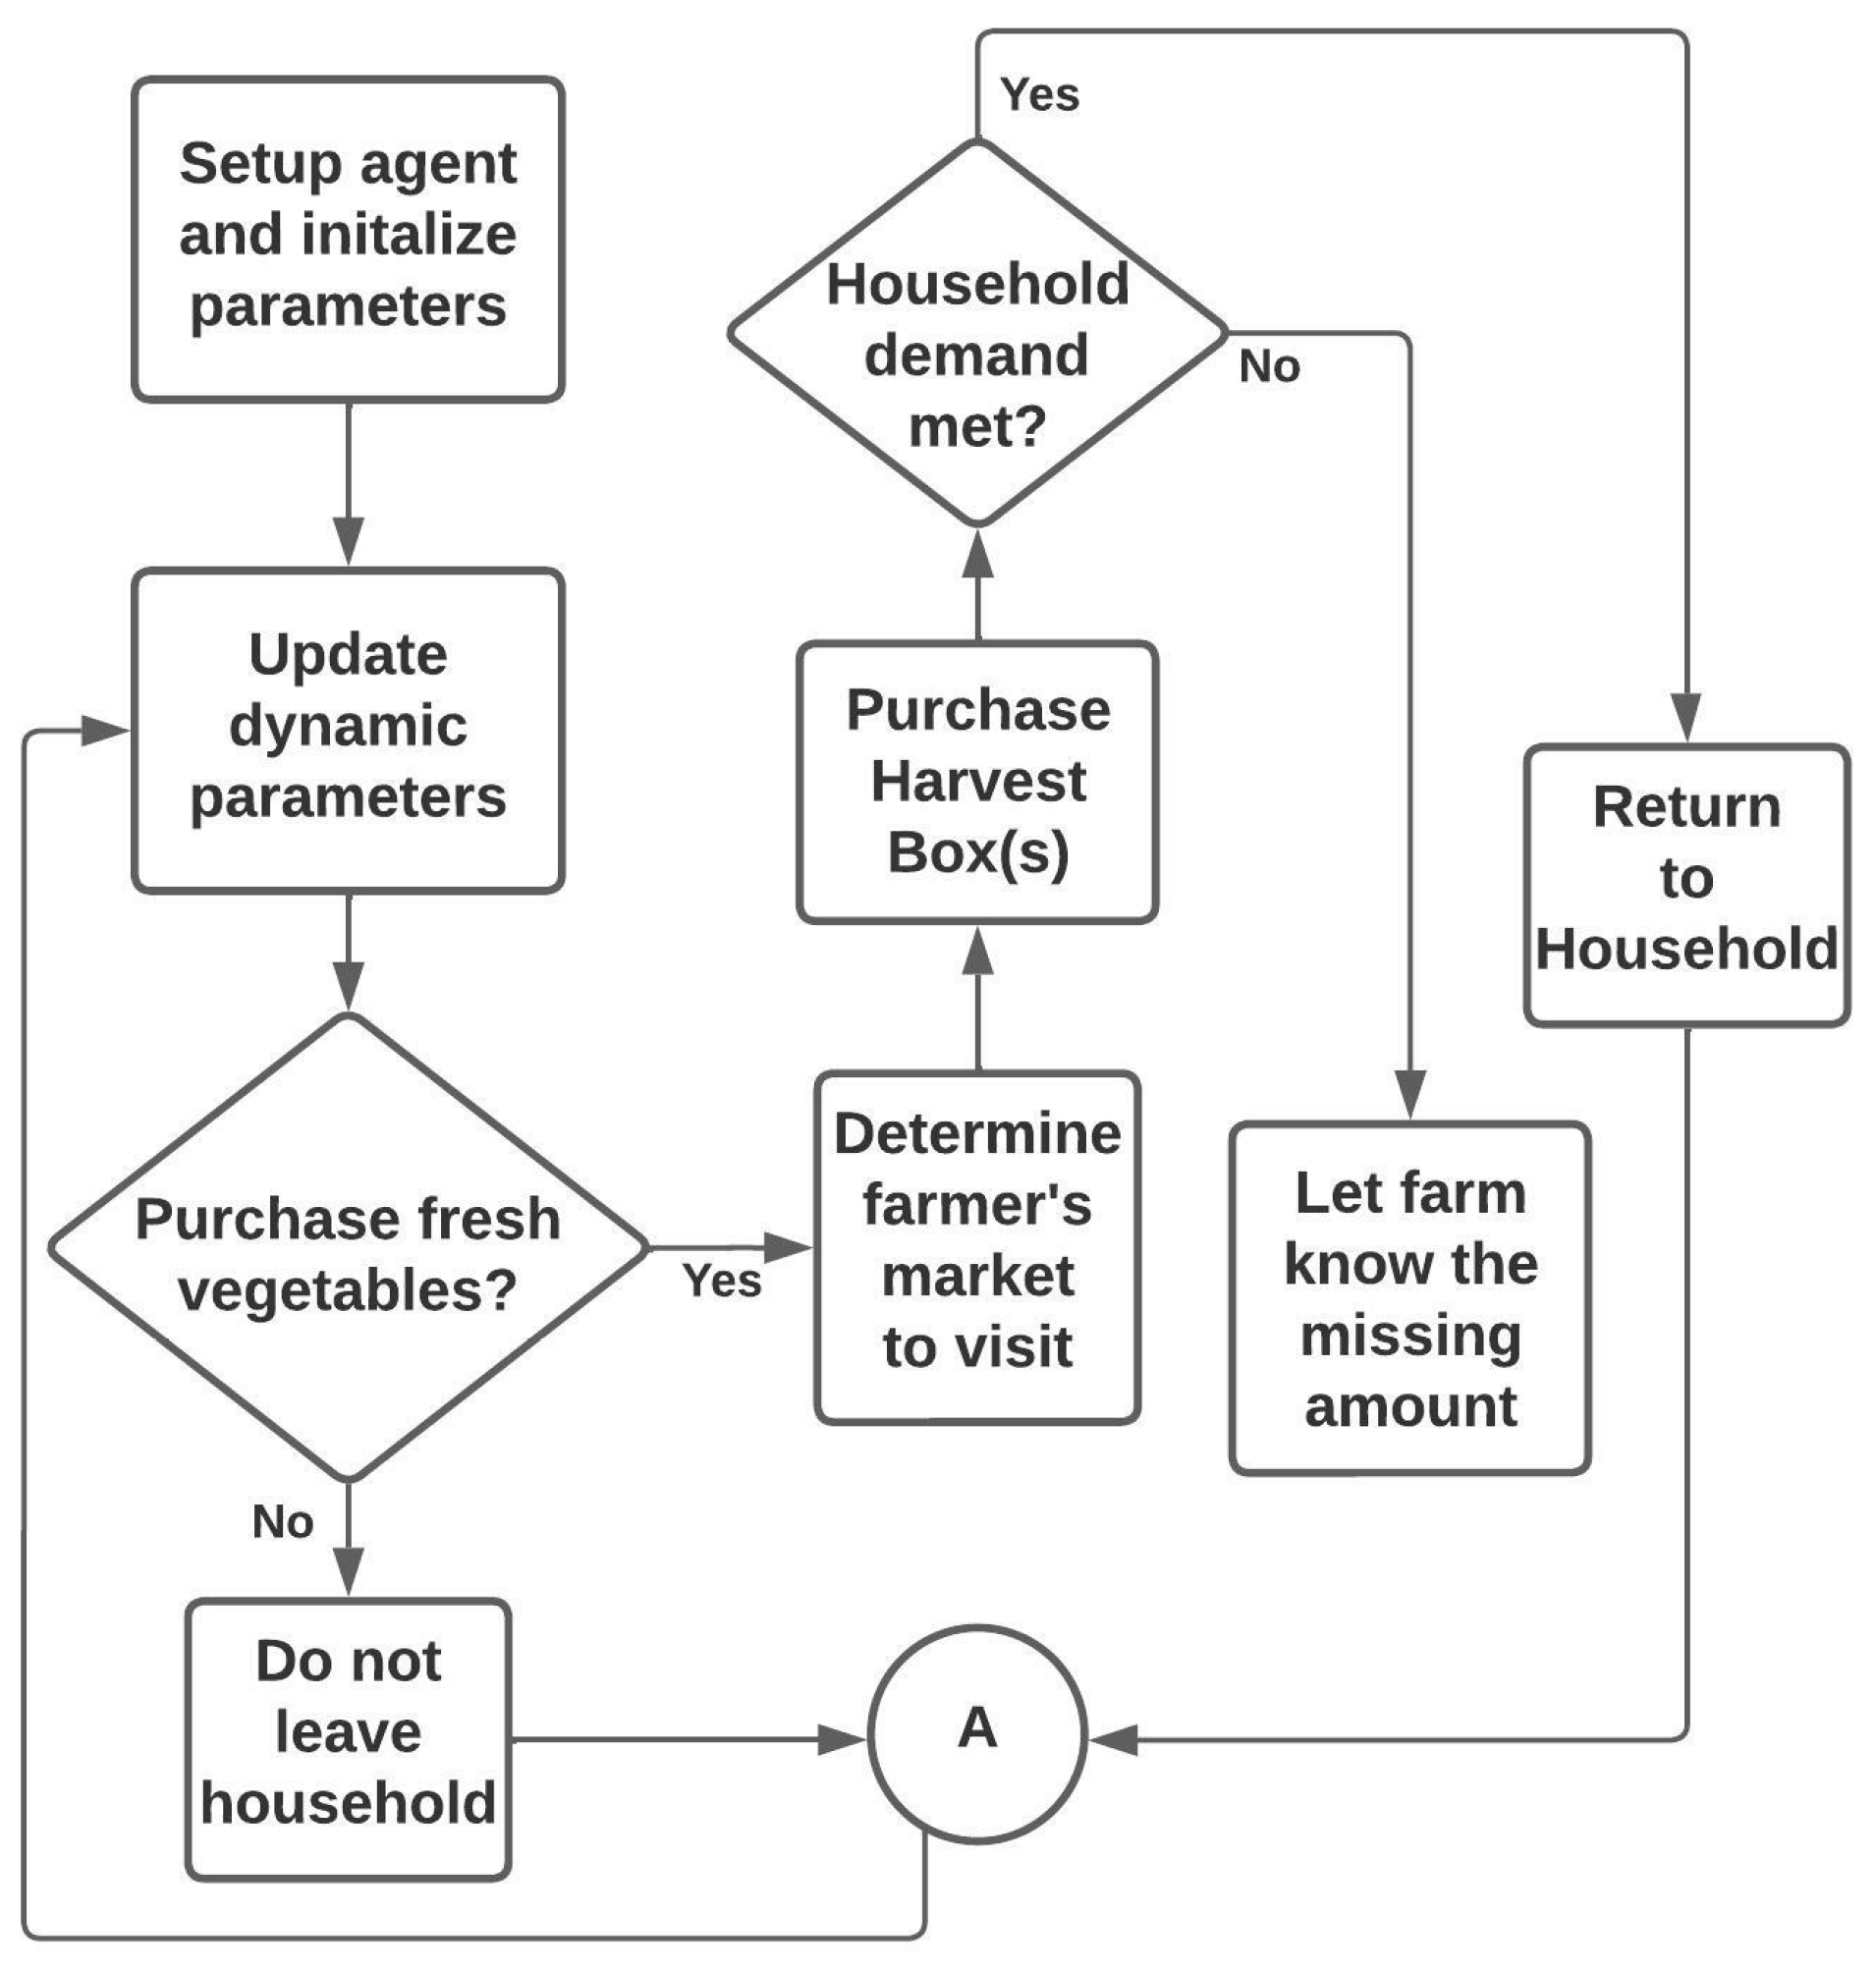
The decision-making process of the household agent is shown in Figure 4. The household agent follows a pre-defined rule set and makes some decisions over the simulation period. The decisions a household agent must make are based on the objective of an agent purchasing harvest boxes from the farmer’s market during the sixteen-week summer period. The decision-making process begins with the setup and initialization of agent attributes. These were based on the demographic data collected based on the neighborhood location of each farm in the city of Vancouver. Each household agent initialized their income attribute value based on a distribution of the average income in each Vancouver neighborhood, where the average income for all neighborhoods ranged from $31,500 to $78,100 [62]. By taking a sample from the distribution, this ensured that the agent population accurately portrayed the actual population of the city. The household size attribute was derived similarly, where the average household size for all the neighborhoods ranged from 1.7 to 3.1. The preferred farm attribute depended on the agent’s neighborhood location, and the buying strategy was dependent upon the household size attribute where the agent looked to purchase a harvest box for each household member. The first decision a household agent must make is to determine whether they need to purchase fresh vegetables for their household, which, if so, will determine which farmer’s market they will visit. While determining which farm to visit, the household agents check whether the farmer’s market is open. If it is open, they will visit the farm and purchase harvest boxes for each household member. Next, the agent determines whether their purchase of harvest boxes is sufficient to meet their household demand. If so, they will return to their household and the decision-making process will restart. If the agent doesn’t meet their household demand of harvest boxes, the farm was either out of harvest boxes leading to a non-purchase or the farm had fewer produce than the demand of the agent. If this condition is met, the household agent will communicate to the farmer agent that their demand has not been met and how many harvest boxes they want to purchase. At the beginning of the decision-making process—following the update of the dynamic parameters of the agent, which updates the amount spent on groceries by the household and their income—if the household agent does not require fresh vegetables or if the farmer’s market is not operating, they will choose to stay home and not visit a farmer’s market.

3.1.3. Microgrid Agent

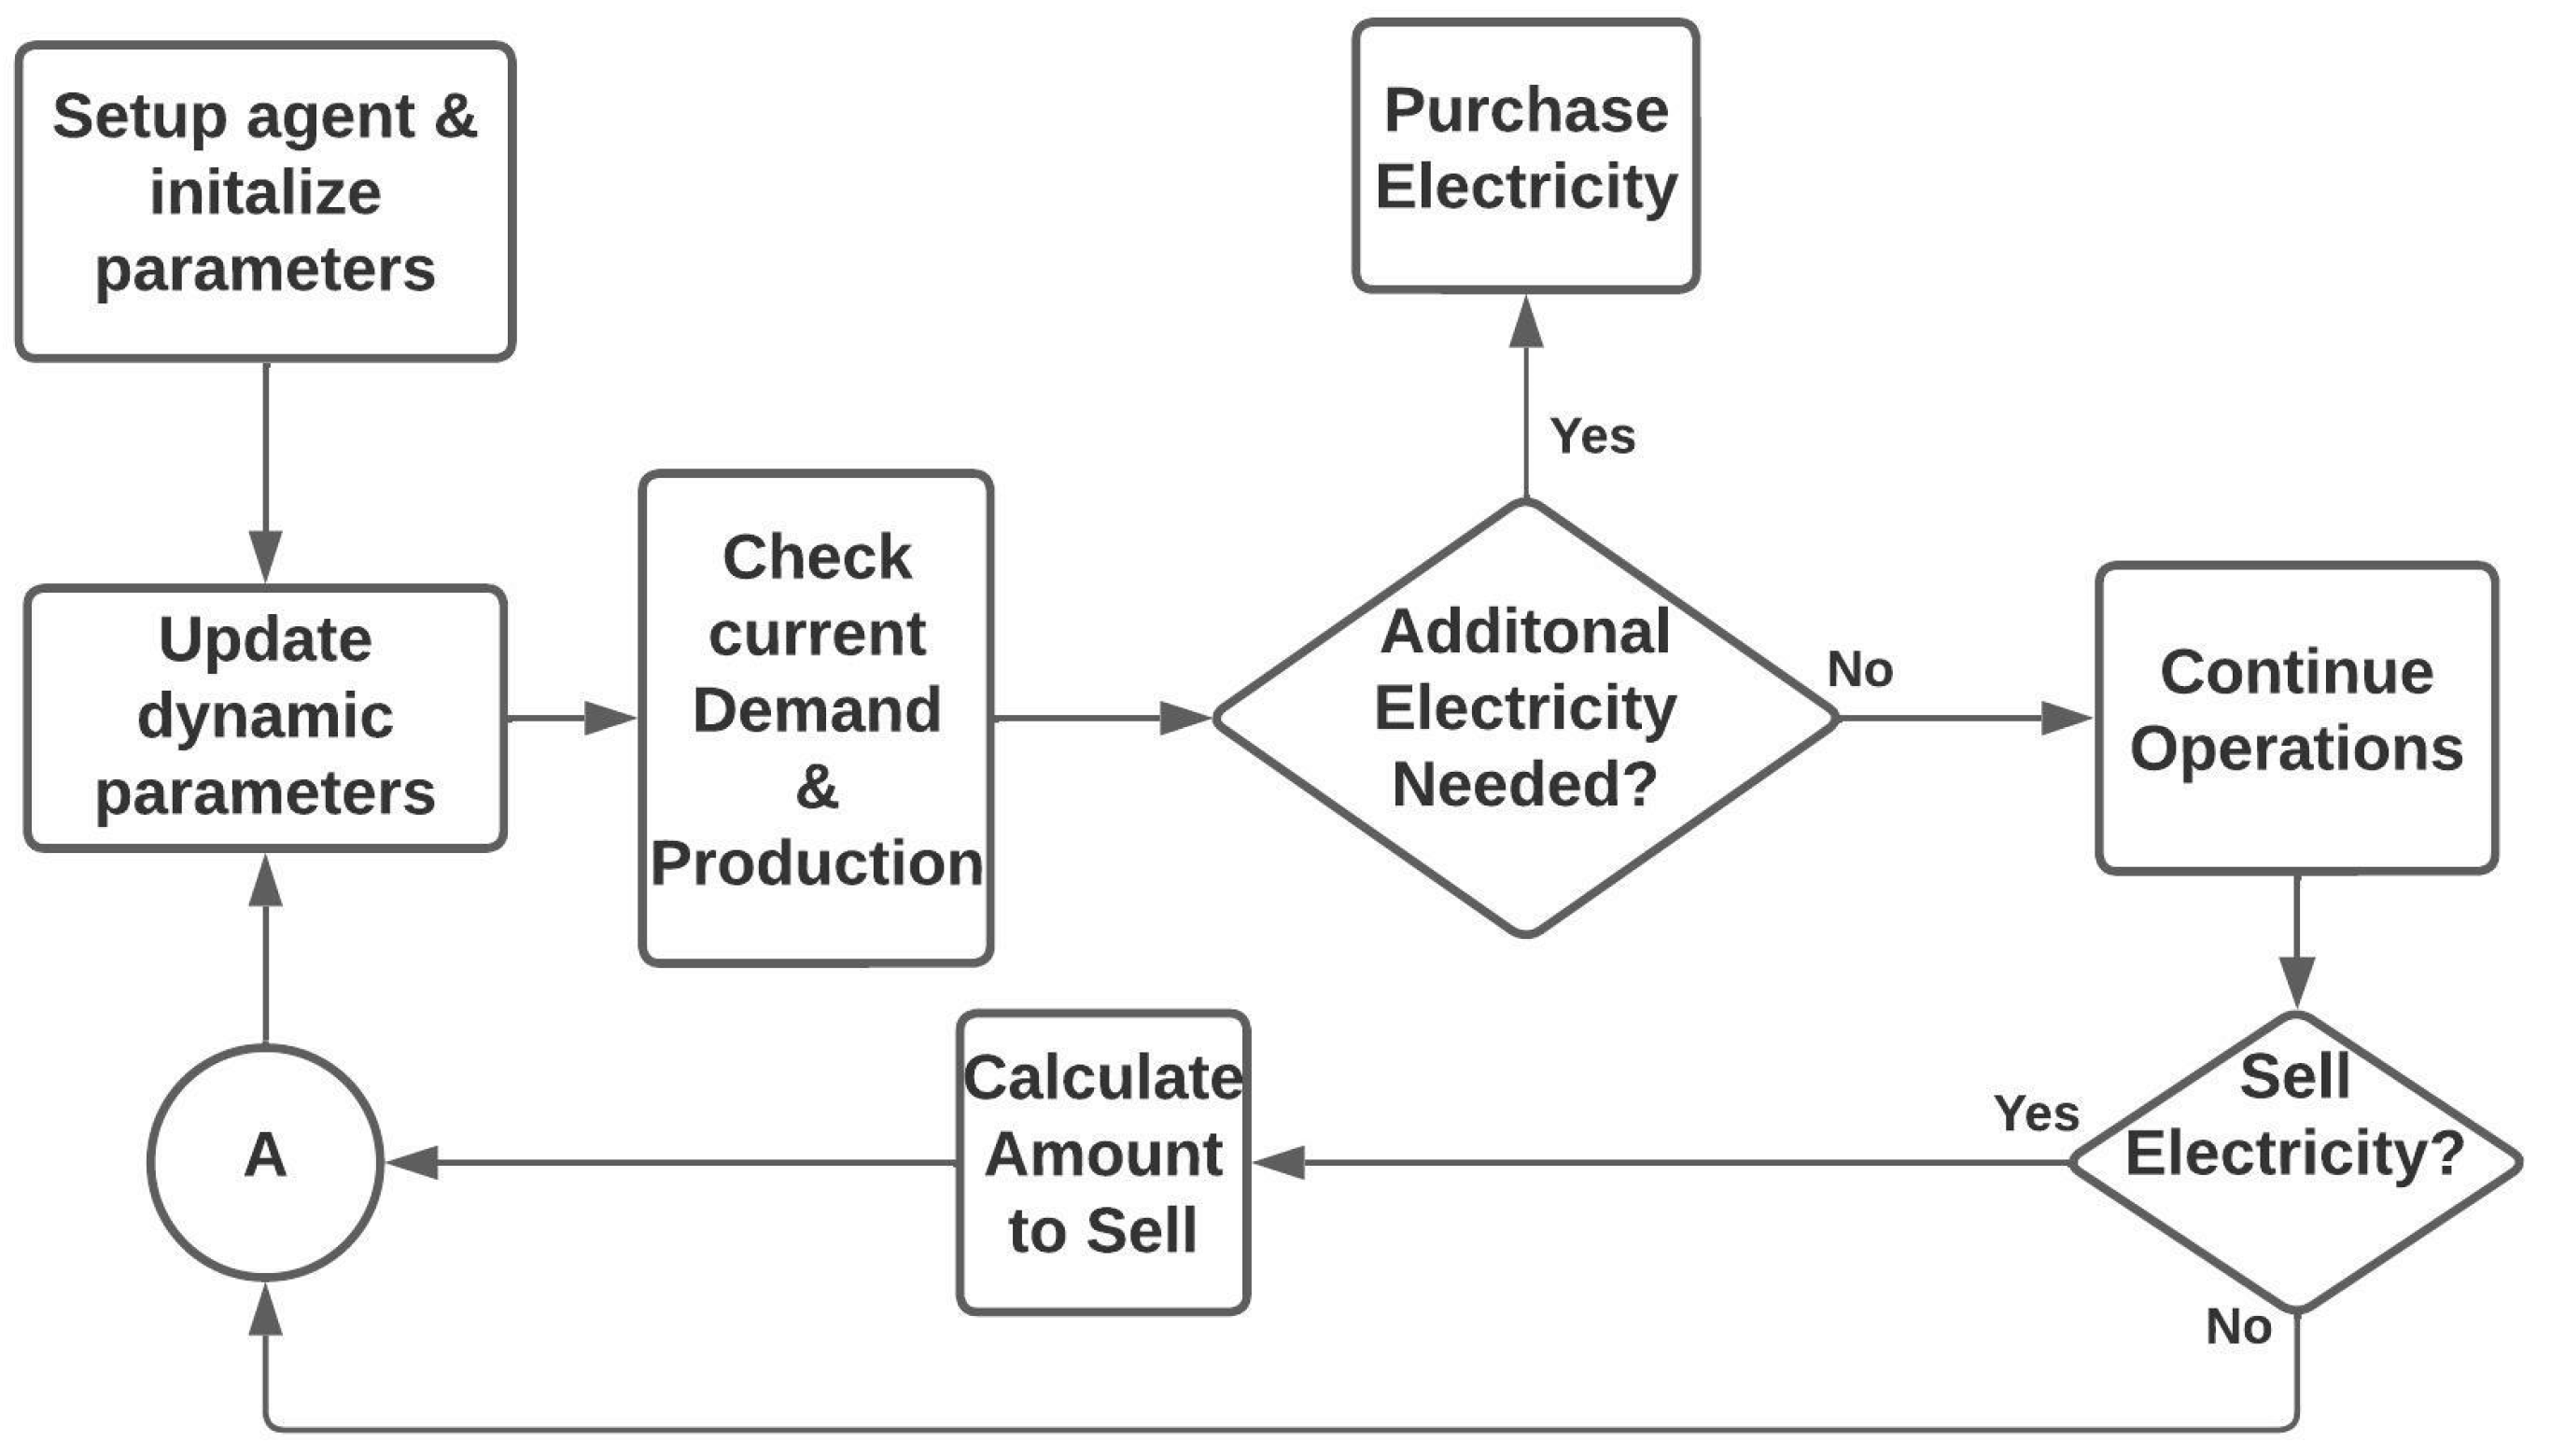
The microgrid agent has an hourly electricity demand that must be satisfied by producing electricity through solar and wind energy alongside a battery storage system that can help store excess produced electricity, or in times of electricity production deficits, can help meet the set hourly demand. If the electricity demand is still not met by the produced renewable energy and the battery storage system, then the microgrid agent will purchase electricity from the electricity grid agent. In times of an electricity surplus, the microgrid agent will sell the electricity to the grid agent. The derivation of the electricity demand is explained further in the proceeding section. The decision-making process of the microgrid agent is shown in Figure 5 and begins with the setup and initialization of the agent parameters. The hourly electricity demand values, the hourly solar electricity generation, and the hourly wind electricity generation are inputted into the model for one year. The derivation of these values is further explained in Section 4. The microgrid agent first checks their current electricity demand and electricity production from their renewables for that hour and the amount of electricity stored in the battery storage system. The first decision made is whether additional electricity needs to be purchased from the electricity grid agent due to not having sufficient power in the battery storage system to meet this demand. If this condition is met, the microgrid agent will interact with the electricity grid agent and the amount of electricity purchased is calculated. If electricity is not required to be purchased, then the microgrid agent will continue its operations. This leads to the next decision the microgrid agent must make if there is a surplus of electricity produced during that hour and the battery storage system is full. The microgrid agent will interact with the electricity grid agent and the amount of electricity bought by the microgrid agent is calculated. After all these decisions are made, the decision-making process of the microgrid agent restarts. The microgrid agent goes through this process every hour in the simulation.

3.1.4. Electricity Grid Agent

The electricity grid agent has one main function—to sell electricity to the microgrid agent when needed or to purchase electricity from the microgrid agent. The historical electricity price per kWh was taken from BC Hydro [63] and is used to determine the dollar value of the purchased and sold electricity. When the microgrid agent has an electricity deficit and requires additional electricity, it creates an interaction between the two agents, and the electricity grid agent will conduct an electricity sale. On the other hand, when the microgrid agent has a surplus of electricity, the grid agent will purchase the excess electricity. The profit from selling electricity and the cost of buying electricity over the simulation period are given by Equations (1) and (2), respectively. Equation (1) calculates the revenue from the electricity sales ( E G m g , t S a l e ) at time t based on the electricity demand deficit ( E l e c m g , t D e f i c i t ) of the microgrid agent f and utilizing an electricity price ( E t P r i c e ) per kWh. Equation (2), on the other hand, deals with the electricity purchase ( E G f , t P u r c h a s e ) from the microgrid agent mg based on its electricity surplus ( E l e c m g , t S u r p l u s ) at time t and electricity price ( E t P r i c e ).
E G m g , t S a l e = E l e c m g , t D e f i c i t × E t P r i c e  
E G m g , t P u r c h a s e = E l e c m g , t S u r p l u s × E t P r i c e

3.1.5. Water Agent

The water agent partakes in one decision—to sell water to the farmer agent for use in irrigation. Depending on the time, the farmer agent will have different irrigation requirements, and thus will purchase different amounts of water. The value of the water sold by the water agent is summed up at the end of the simulation to aid in calculating the water footprint. The calculation is shown in Equation (3), where the total water sales by the water agent ( W A f , t S a l e s ) to the farm, f, at time, t, is equal to the price of the water ( W a t e r t P r i c e ) at time, t, multiplied by the amount of water purchased ( W a t e r f , t P u r c h a s e ) by the farm, f, at time, t, for irrigation purposes.
W A f , t S a l e s = W a t e r t P r i c e × W a t e r f , t P u r c h a s e

3.2. Optimization Model

In this paper, we utilized a transportation model integrated within an agent-based model to optimize the micro supply chain and minimize the produce transportation distance and waste between the urban farms while also meeting the demand of each urban farm. Only ten of the farms in the case study considered exchanging produce. The eleventh farm was separate from the community shared agriculture agreement between the other ten farms. Table 1 shows the network representation of the transportation model between the farms. The supply relationships were spread across space and time. Every week in the simulation, there were potentially different sets of supply and demand for the farms depending on consumer behavior at the different urban farm locations. The surplus and demand quantities of food also differed in the simulation over time. As a result, the transportation of food from the supplier farms to the demand farms was also different. The transportation problem was solved within the agent-based simulation to minimize the transportation costs while meeting each farm’s potential food purchases (produce requirements).
For each week, the historical value from the previous season of supply and demand at each urban farm was taken, and thus a different case can occur with regards to the food supply chain, as there can be different values for supply and demand, and thus the way the model is solved was altered. For each week, there were three possible cases (Table 2). In the first case, the supply was equal to demand, and thus the transportation problem was solved for the food supply chain. In the second case (Table 2, row 2), the demand exceeded the supply, and thus new demands, d j n e w , were calculated for each farm, f, and the transportation problem was solved. The calculation of the new demands considered the amount of the original demand so that the deficits at the demand farms were equally distributed. The third possible case was when the supply exceeded the demand. In this case, a new supply amount, s i n e w , was calculated for each supply farm, and the original excess amounts were taken into account so that the excess supply was uniformly distributed among the supply farms.
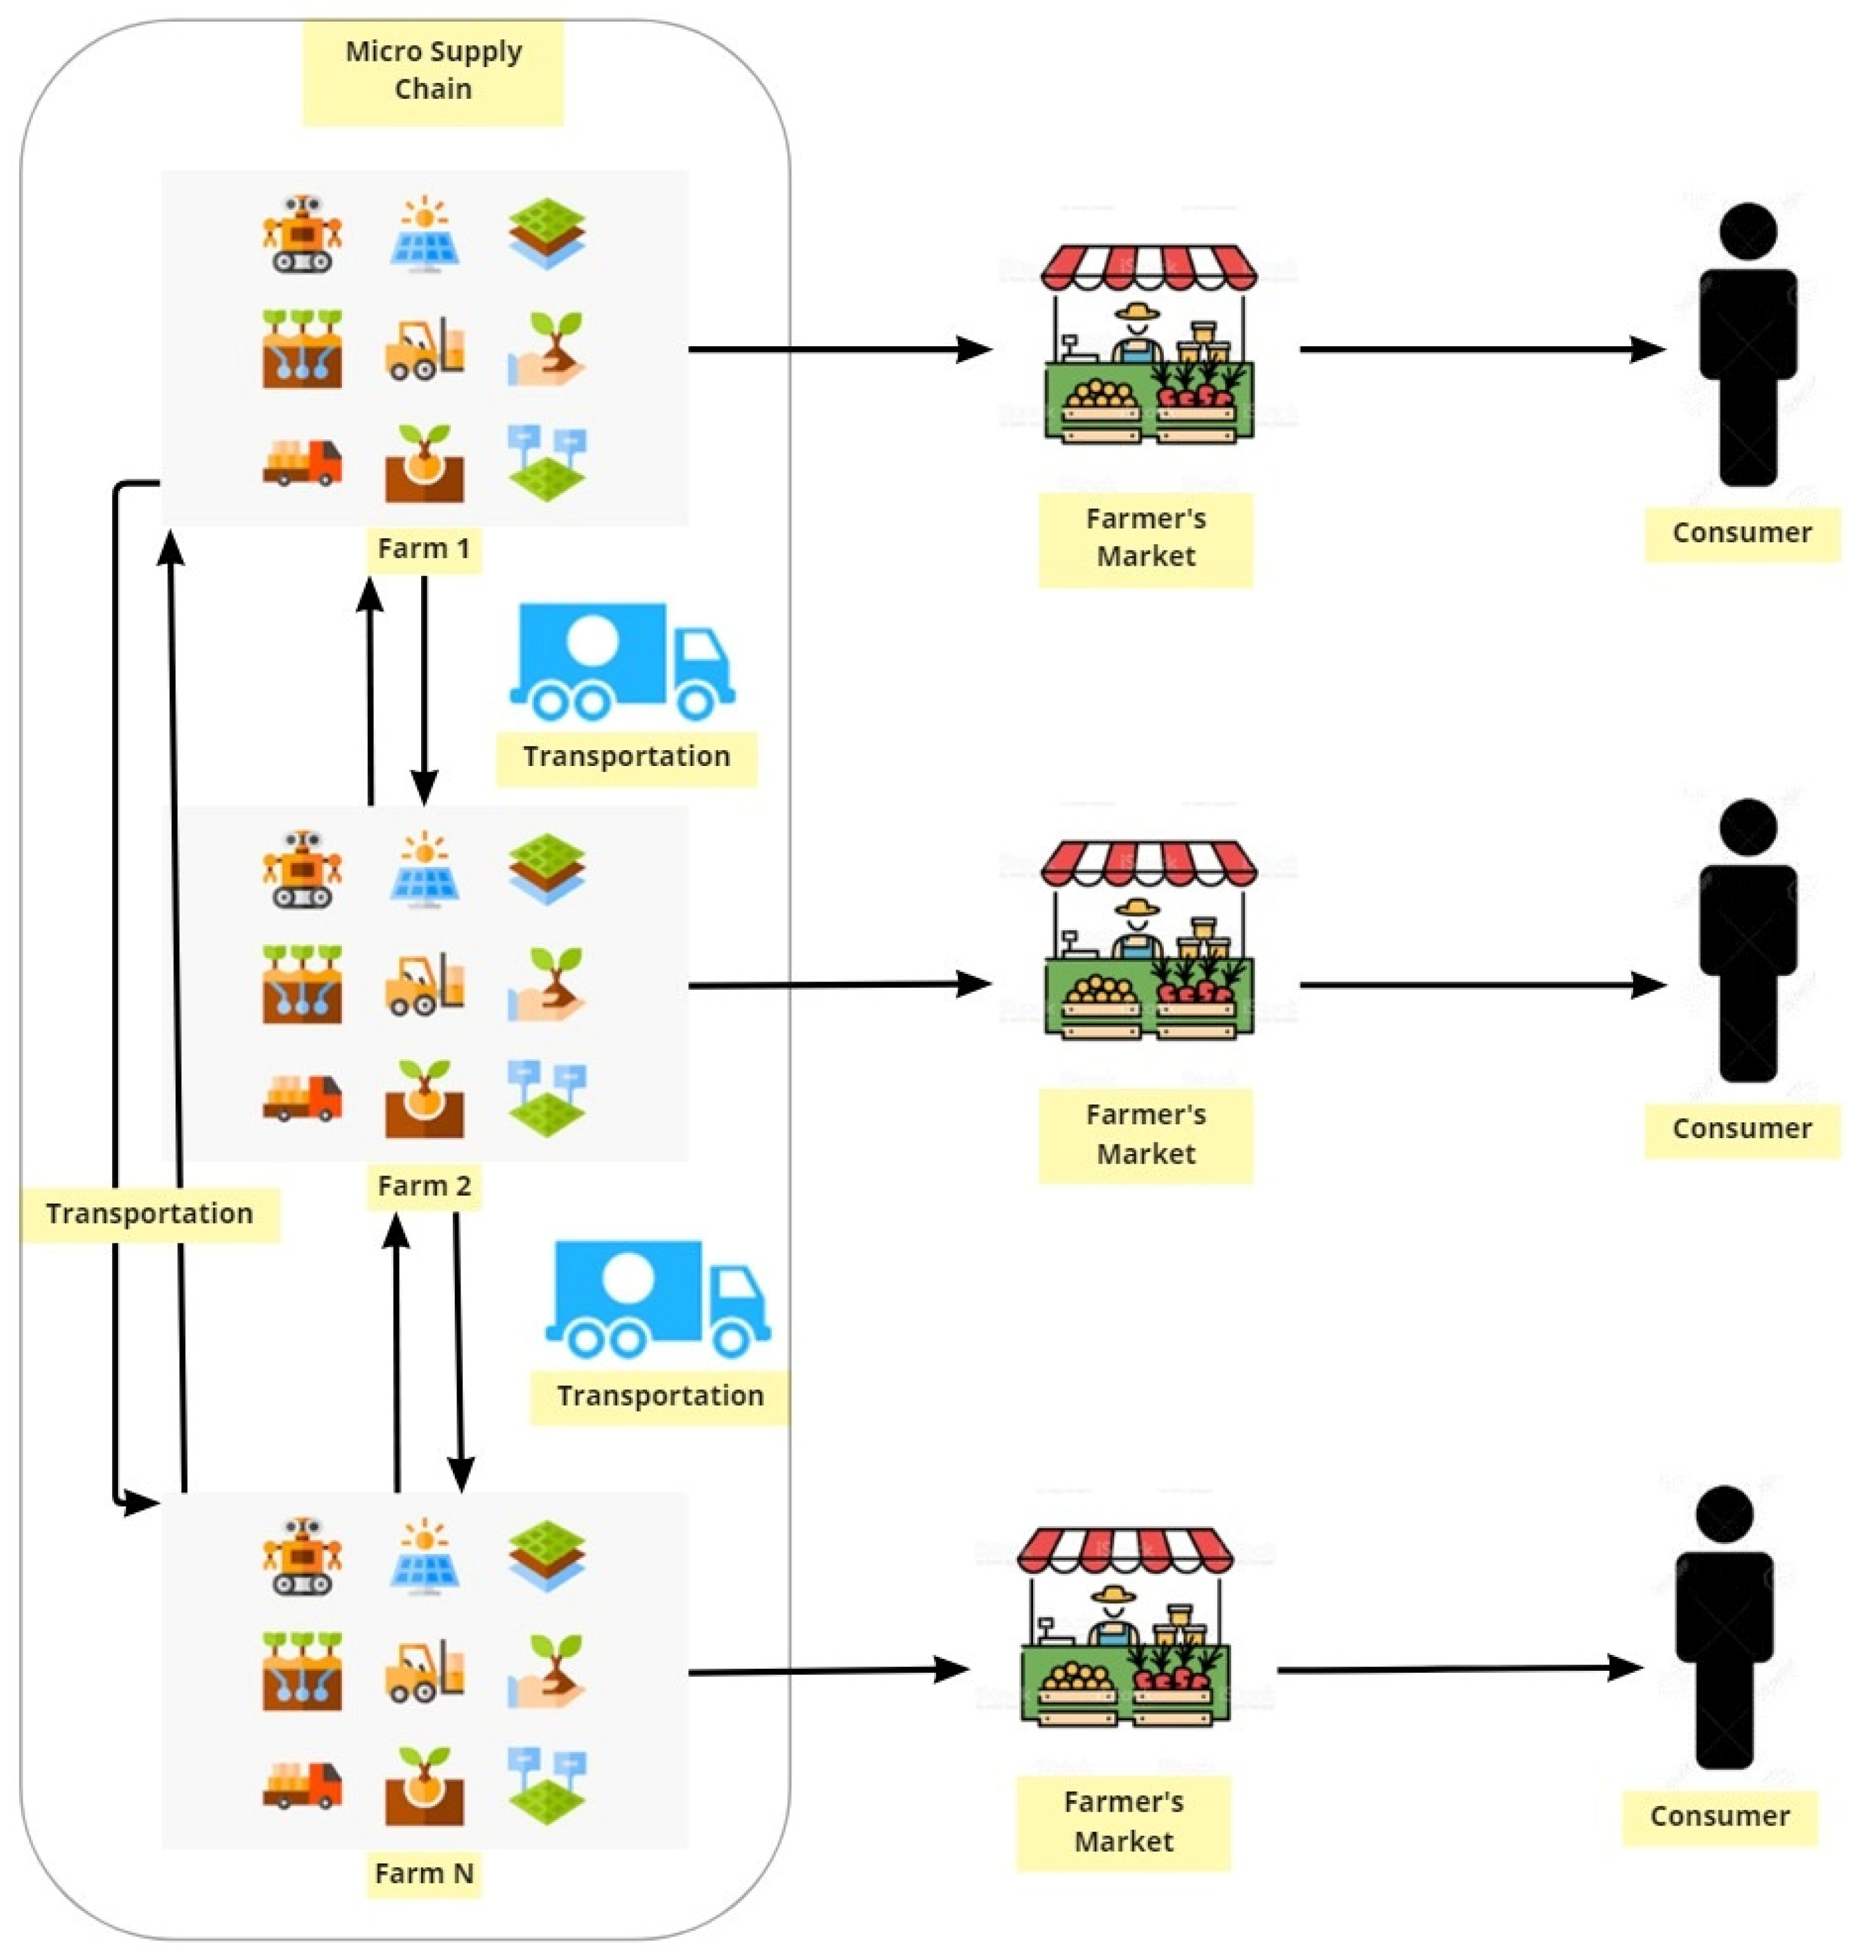
Solving the transportation problem within the agent-based model led to the creation of a micro supply chain for the collection of urban farms in the city of Vancouver that were being studied. This is also shown by the fact that, unlike traditional food supply chains, there were no intermediaries, and the product was passed directly from the producer to the consumer. This further enforces the concept of community shared agriculture as different farms are collaborating to deliver products to the final consumer, as illustrated in Figure 6.

4. Experimental/Numerical Setting

The urban farms belonged to a community-scale microgrid that looked to provide electricity for the local community by utilizing renewable energy sources, such as solar and wind. The urban farms also had irrigation requirements for the crops that were growing in the periods where rainfall was not sufficient. The goal of the urban farms was to utilize a community supported/shared agriculture (CSA) model to sell fresh produce. Local consumers would visit the urban farms and purchase a harvest box of an assortment of fresh vegetables every week. This harvest box model is similar to a farmer’s market, however, the vegetables purchased are packaged ahead of time. Therefore, depending on the consumer’s family size, they can purchase a different sized harvest box to satisfy the family’s dietary needs. In addition, the harvest box type model was utilized for the summer harvest period, and thus the market existed for 16 weeks, from June to September. Table 3 lists the size of each studied urban farm and the weekly production of vegetables. It is important to note that, while farm 11 serves the community of Vancouver, it has not entered into an agreement with the other ten farms, and thus did not participate in the micro supply chain scenario.
The production number of vegetables for each urban farm was determined by assessing the farm lot size and considering the average harvest amount of each vegetable. In terms of the community microgrid, the electricity demand took into account the local community in the vicinity of the urban farms for the city of Vancouver in BC, Canada by looking at the number of buildings in the area as well as taking into account the climate variables at different hours of the day, which led to different electricity demands. Once the demand for electricity was determined, the agent-based model employed a system of renewable energy generation through solar and wind power, as well as utilizing a battery storage system in order to store the generated electricity that was not utilized. In times of electricity deficits, electricity will be purchased from the local electricity grid, and in times of electricity surplus, electricity will be sold to the grid. Table 4 lists the average electricity demand of each community microgrid and the capacities of the renewable energy technologies and battery storage capacities. The solar and wind energy data were obtained through satellite observations from the NASA database for the city of Vancouver. There were several calculations performed to determine the amount of electricity that was being generated from renewable sources. The first calculation regarded solar energy and is shown in Equation (4), where the solar electricity was calculated for each farm, f, at time, t. Further details can be found in [8]. The variable I t r ( t ) refers to the hourly transmitted plane-of-array irradiance measured in (W/m2). P d c o refers to the nameplate rating of the solar panel in watts, and γ(t) is the temperature coefficient (%/°C), which can have varying values depending on the chosen solar panels. The values were −0.47%/°C for the standard glass cover module, −0.35%/°C for the premium anti-reflective module, and −0.25%/°C for the thin film module. The last variable ( T r e f ) in the calculation is the reference temperature, which is measured in Celsius. The satellite data were used to obtain the climate variables in order to calculate the hourly generated solar electricity as outlined in [64].
E f , t S = I t r ( t ) 1000   P d c o ( 1 + γ ( t ) ( T c e l l ( t ) T r e f ) )
The next renewable energy source that was calculated was wind energy (Equation (5)). The electricity generation by wind depends on the wind generation capacity installed at each farm location. The hourly wind electricity generation was calculated outside of the model for a one-year time period and was then entered into the agent-based model for the simulation. The generated wind electricity ( E f , t W ) was calculated for each farm, f, at time, t. In Equation (5), k denotes the constant to convert the generated power from the wind turbine into kilowatts, C p is the wind turbine’s power coefficient, A is the wind turbine’s rotor swept area, V3 is the wind speed measured in mph, and p is the air density. The resultant hourly generated wind electricity dataset was obtained using the methods in [65].
E f , t W = 1 2 k C p A V 3 p
There was a battery storage system at each farm that was used to store excess produced electricity or to provide electricity in times of production deficits. For each farm, f, at time, t, the battery storage system had a stored power level ( E f , t B a t ), as well as the amount of charged power ( C P f , t B a t ) or discharged power ( D P f , t B a t ). The calculation of the stored power level ( E f , t B a t )   are shown in Equation (6), where the power level of the battery at the previous time interval ( E f , t 1 B a t ) was taken, the charging power at the previous time interval ( C P f , t 1 B a t ) was added, and the discharging power at the previous time interval ( D P f , t 1 B a t ) was subtracted. Since a battery cannot be charging and discharging power at the same time, one of the values will be equal to zero depending on the battery’s status at time t.
E f , t B a t = E f , t 1 B a t + C P f , t 1 B a t D P f , t 1 B a t  

5. Results and Discussion

The simulation experiments in this paper were designed to investigate the effect of community shared agriculture of an urban farm. Two cases were considered: a base case where there was no sharing of produce among the farms and the sharing case composed of the farms collaborating to exchange food and satisfy consumer demand and, therefore, contributing to food security. The sustainability results (including social, economic and environmental) for both cases are discussed in this section. The simulation considered a one-year time period where fresh produce was grown and the electricity was managed by microgrid agents through generating renewable energy, managing battery storage systems, and interacting with the local utility grid. Additionally, the irrigation requirements for produce were also assessed and water was purchased from the water agent as needed. The community shared agriculture scenario operated on Sundays when consumers visited an urban farm to purchase a harvest box for a period of sixteen weeks in the summer months. The average supply and demand from the previous year was taken into account before the optimization of the micro supply chain in the current season. This scenario that was proposed allowed for the assessment of the impact of the micro supply chain on social sustainability in the form of increasing food availability and reducing food waste at each urban farm as well as aiming to satisfy consumer demand.

5.1. Social Sustainability

The first sustainability measure that was investigated was social sustainability. The methodology behind measuring social sustainability determined the food security levels of consumer households in the simulation. There were various methods developed and utilized to measure the food security levels in the literature. Jones et al. (2013) discussed several of these methods which included the sharing of food expenditures by the poor, domestic food price volatility, the global food safety index (GFSI), comprehensive food security and vulnerability analyses (CFSVA), the coping strategy index (CSI), household economy analyses (HEA), the household hunger scale (HHS), and household consumption and expenditure surveys (HCES) [66]. In the simulation, consumer agents had an income attribute, a budget for groceries, and their purchasing behavior. Based on the available data collected, the chosen metric was the household consumption and expenditure (HCES) method where a value above 50% indicated food insecurity and below 50% indicated food security [67]. The way the HCES metric was calculated for each household agent is shown in Equation (7). The calculation was over the whole simulation period where each agent’s expenditure on food ( H e x p e n d i t u r e - f o o d ) was taken and divided by the agent’s income ( H I n c o m e ). The result was multiplied by 100 to convert the metric into a percentage. The next step was to calculate the HCES metric for each neighborhood of each urban farm, f, and this is given by Equation (8). The summation of the HCES for all the households in that neighborhood was taken and divided by the total population in the vicinity of farm, f. The resultant value was multiplied by 100, to convert the metric into a percentage. Finally, in Equation (9), we took the summation of all the H C E S f T o t a l for each farm neighborhood and divided this by eleven, as there were eleven farm areas simulated in the model. This provided the average HCES metric for the entire simulated population. This allowed for the study of the impact of farmer’s markets on the local community as well as the assessment of the change that occurs when farm collaboration is introduced and when the farms participate in a farm-to-farm exchange.
H C E S   ( % ) = H e x p e n d i t u r e - f o o d H I n c o m e × 100
H C E S f T o t a l = H C E S P o p f × 100
H C E S T o t = i = 1 f H C E S f T o t a l 11
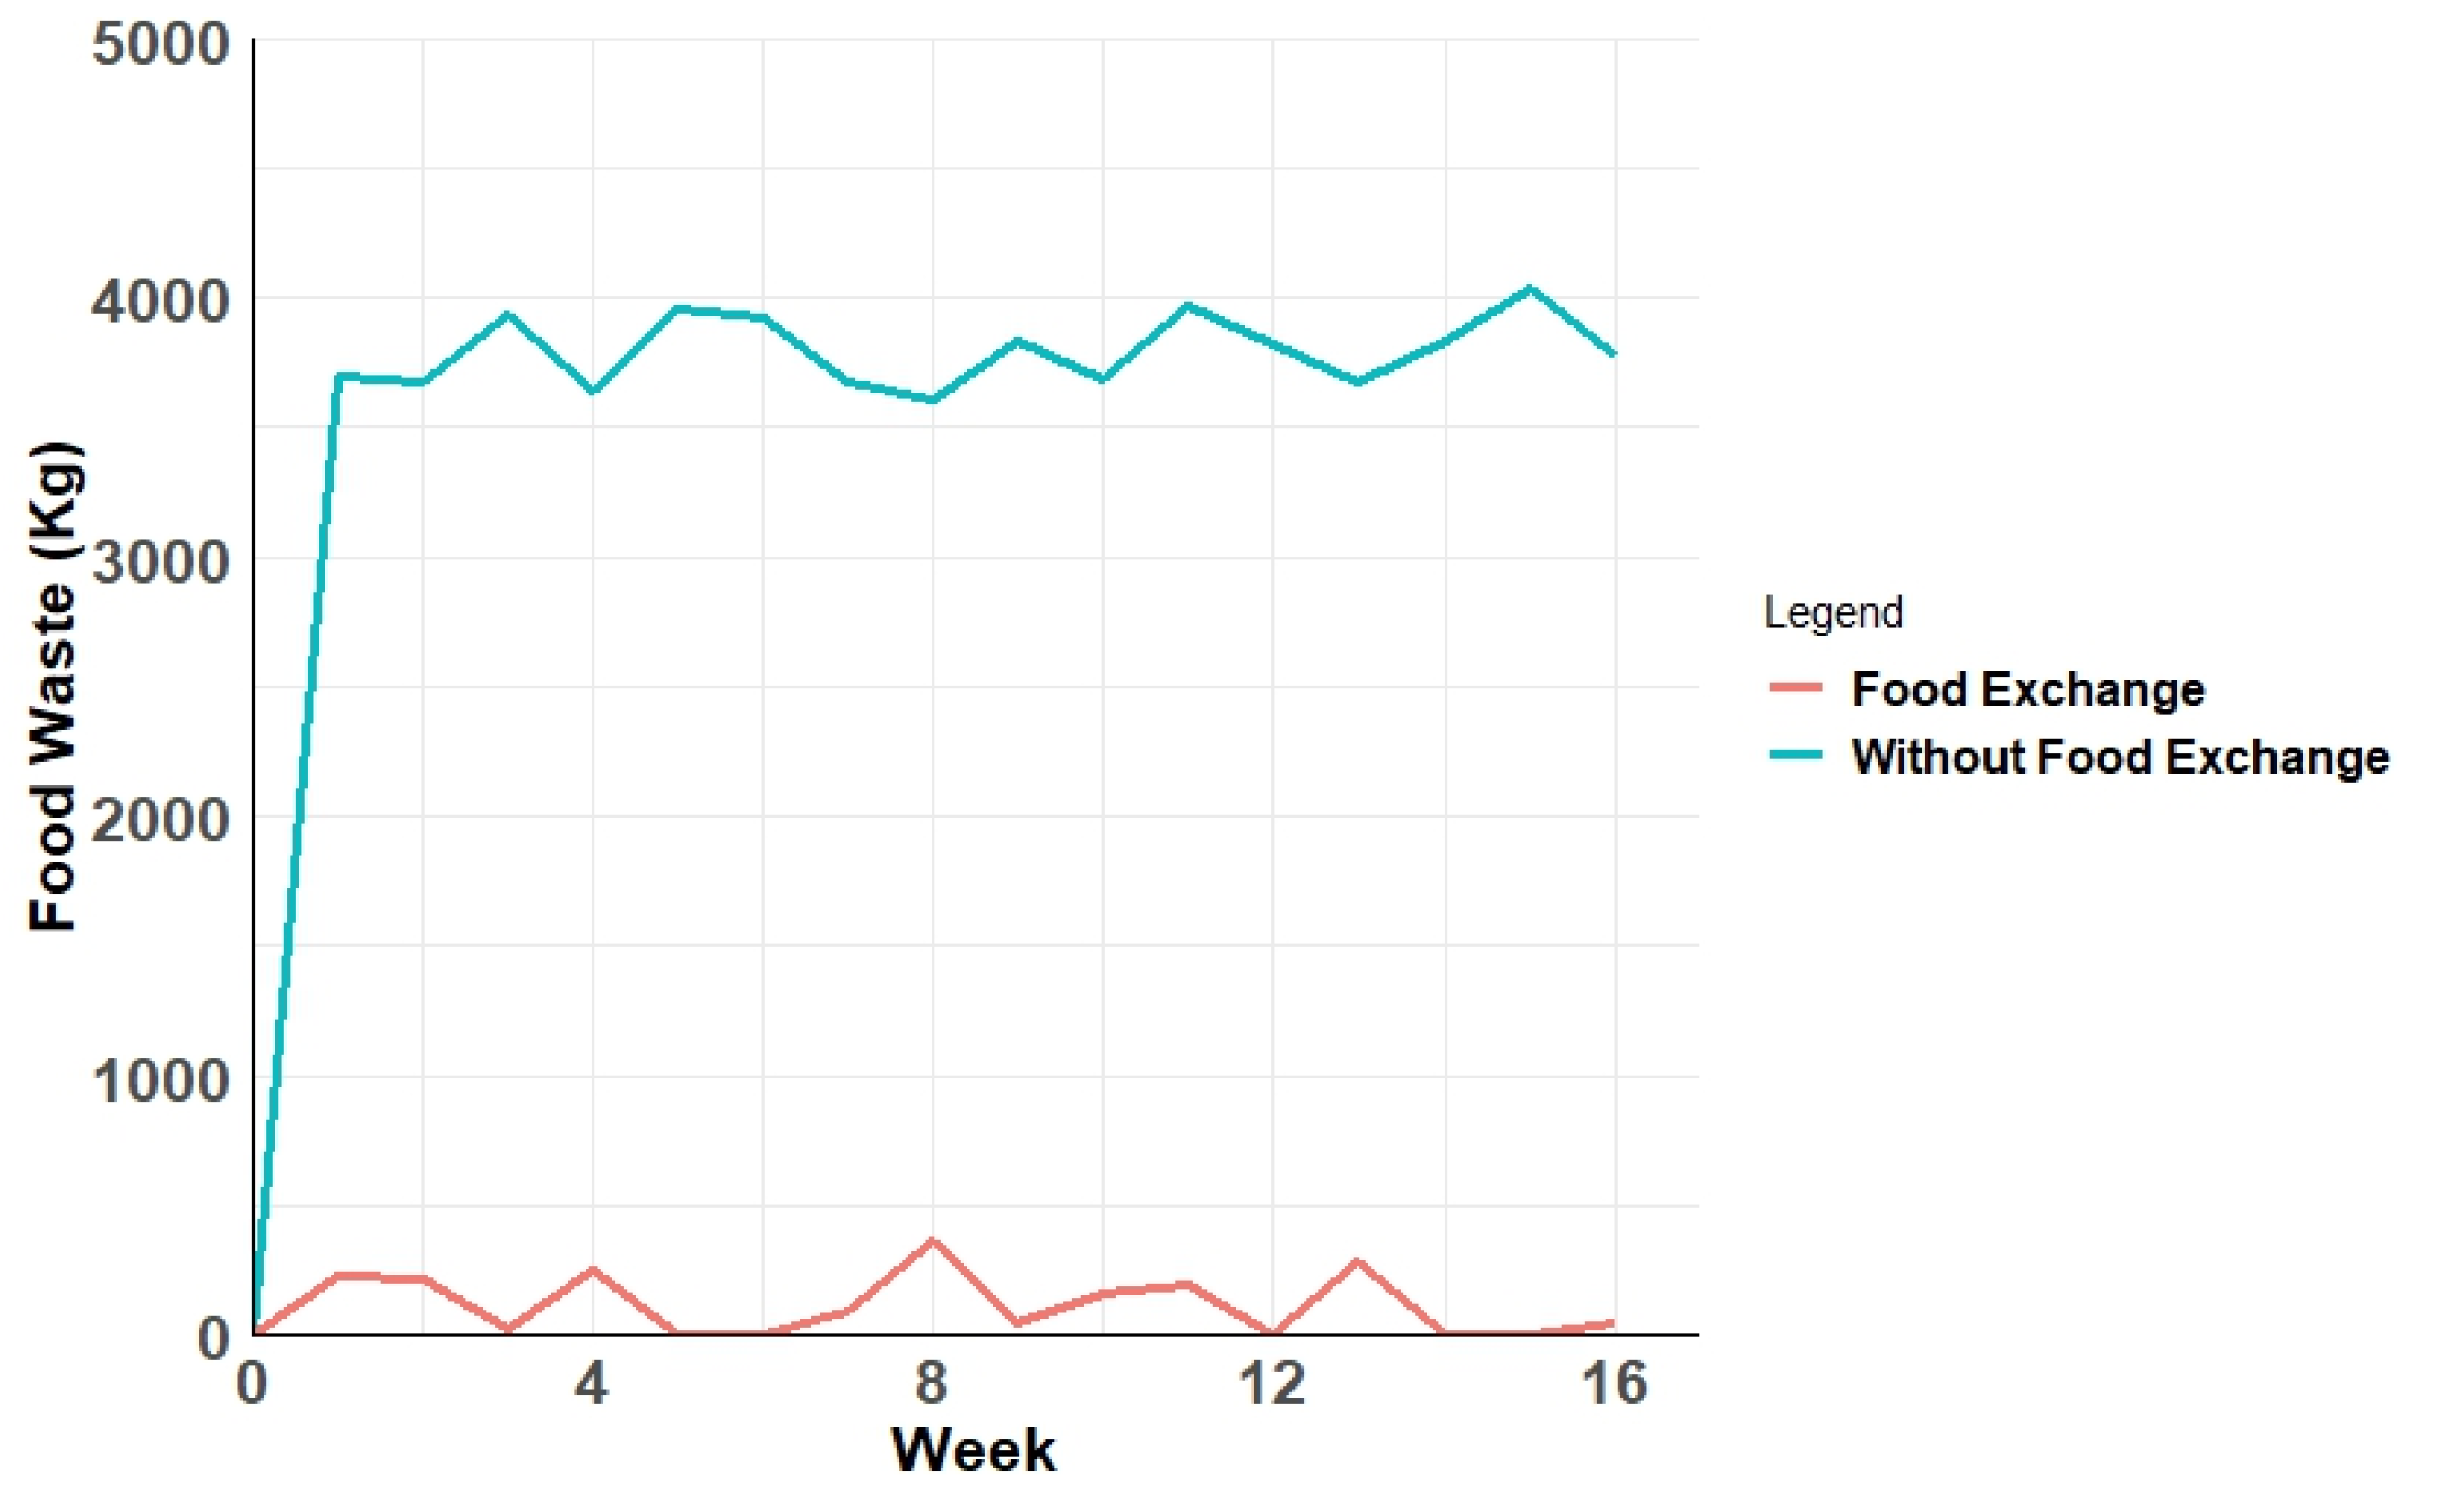
The HCES was calculated for each household agent in each of the eleven farm areas. In the first case, the average HCES (%) for all the regions was found to be 41.4% without the food supply chain. Compared to the collaboration case with the micro food supply chain, the HCES value was found to be 43.5%. The effects of the micro supply chain on food consumption illustrated that there was less food waste across the urban farms over time (Figure 7) as well as an increasing average HCES value for households over the simulation period, indicating that household agents were able to purchase more produce due to the increased availability. Food waste was reduced by 96.9%, with a remaining total of 1873 kg over the sixteen-week summer period. This indicated that more fresh produce was sold to consumers, thus increasing food availability.

5.2. Economic Sustainability

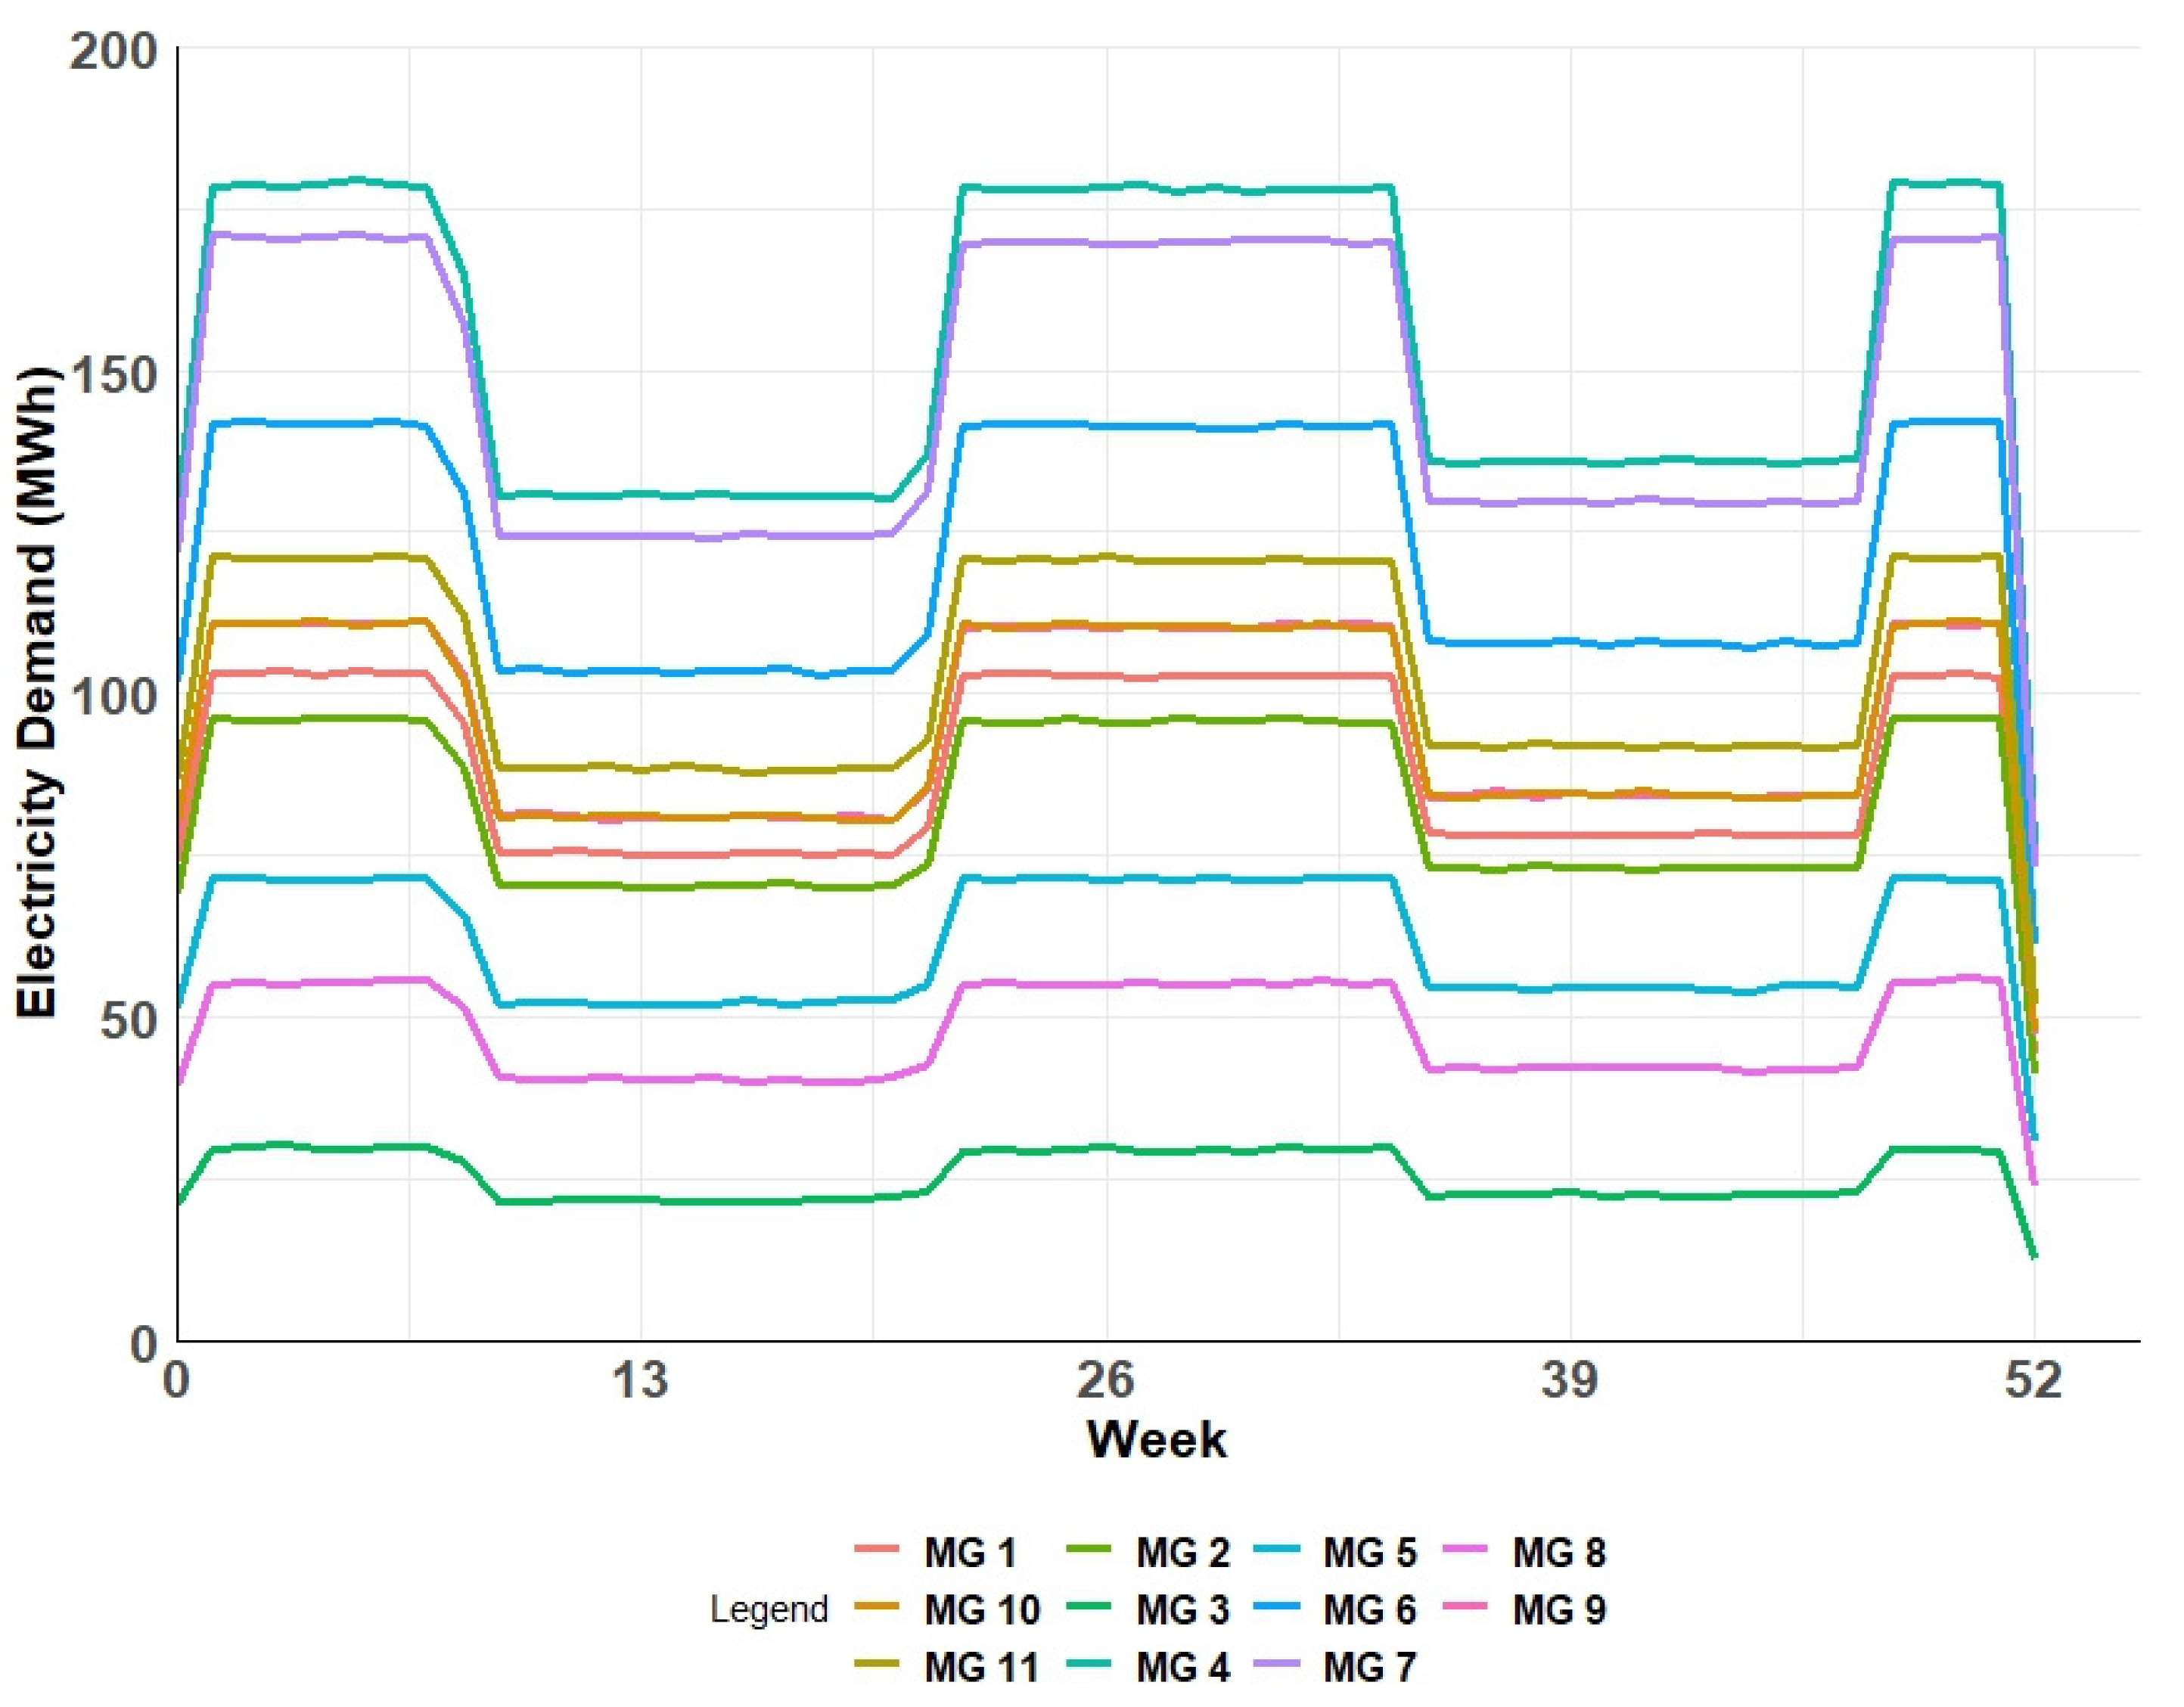
The next sustainability pillar that was investigated to assess the simulation results was economic sustainability. This indicator was chosen to investigate the costs associated with the developed system, as well as identifying the running costs from year to year. One way to observe these costs was to identify the difference between the electricity purchases and sales for each microgrid agent. The electricity demand of the eleven urban microgrids over one year is shown in Figure 8, grouped by week. The total electricity demand was found to be 54,052 MWh.
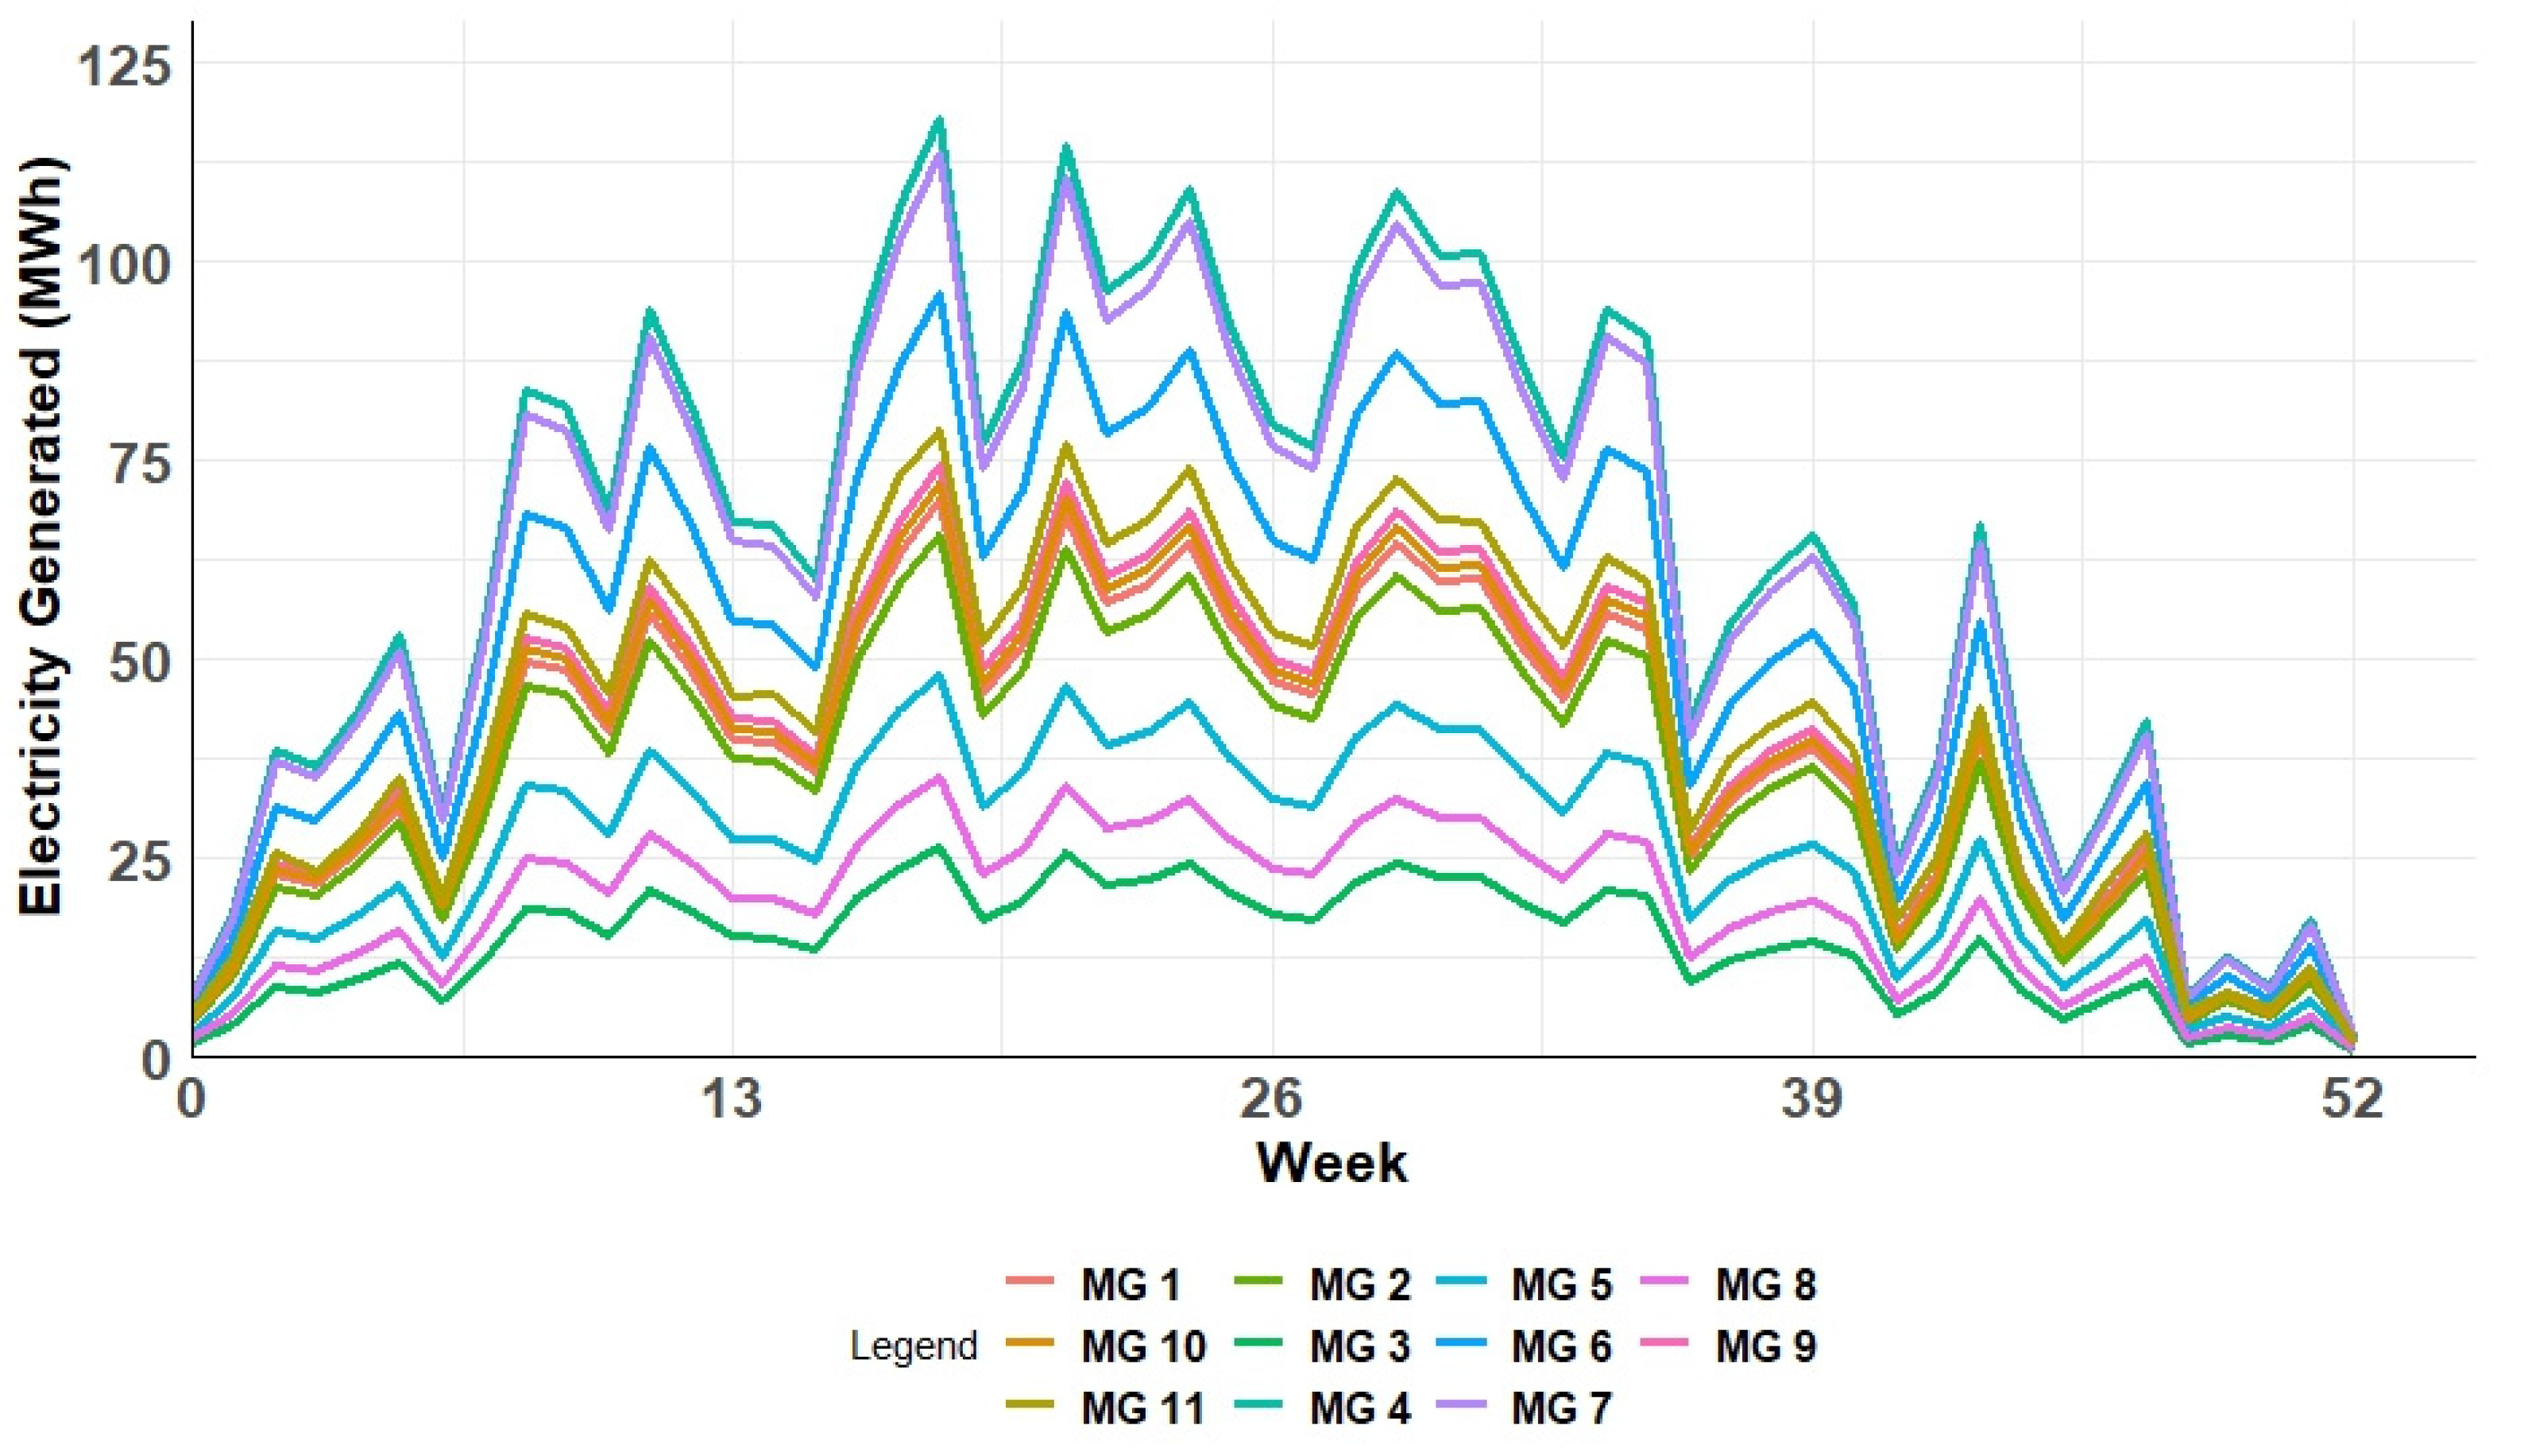
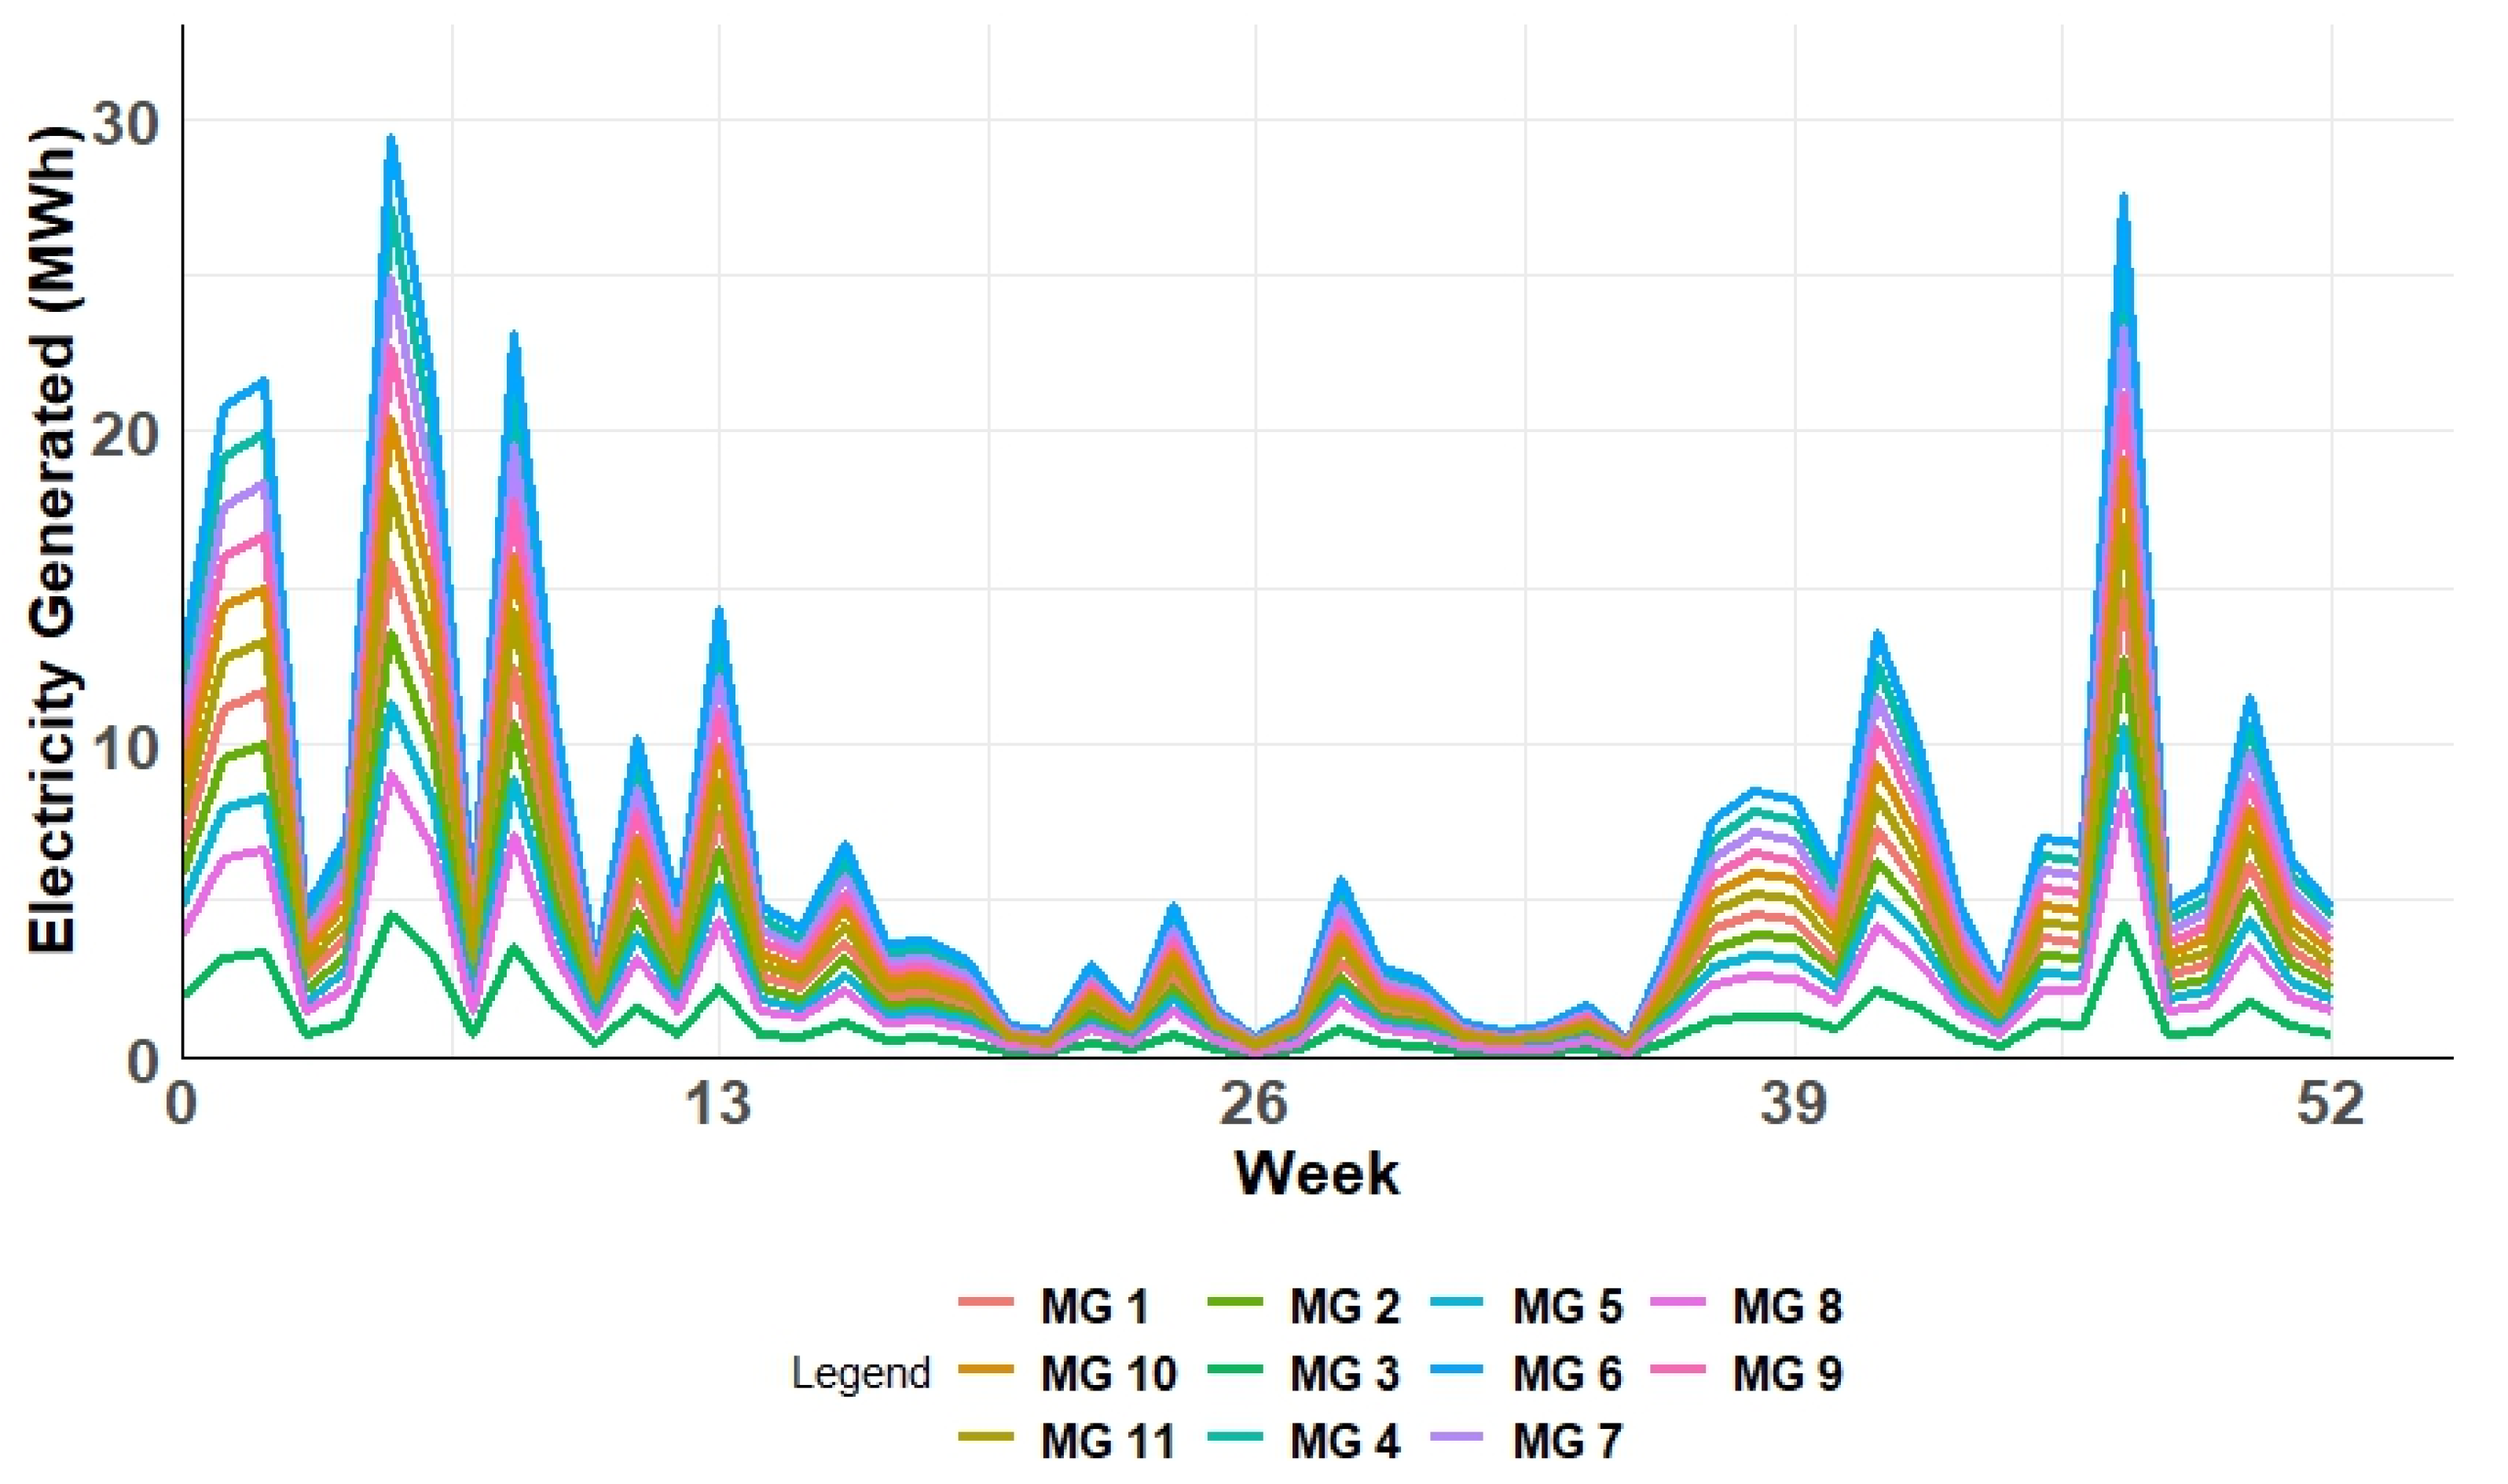
The electricity produced from solar energy was 22,774 MWh, and 2568 MWh was generated from wind energy. Compared to the electricity demand of the different farms and vicinity households, 4471 MWh was purchased for one year from the main electricity grid. The suggestion here is to increase the renewable energy generation capacity and battery storage capacity. The trend of the electricity generated from solar energy can be seen in Figure 9 while that of wind energy is shown in Figure 10. By observing both figures, it can be seen that wind energy had higher peaks in the first and last few weeks of each year. The generated solar energy had higher peaks in the summer period due to the geographic location of the city of Vancouver being exposed to more sunlight during the summer weeks.
The trend of the electricity sales and purchases throughout the year are illustrated in Figure 11 and Figure 12, respectively. The electricity sales were greater in the spring weeks of the year due to the increased production of electricity from wind and the overlapping of increased solar energy generation. The electricity purchased from the utility grid was consistent across all weeks of the simulated period. However, there was a slight decrease in the spring weeks, which was consistent with the trend of electricity sales, as these were trending higher at that time period.

5.3. Environmental Sustainability

The third sustainability pillar was environmental sustainability where the carbon and water footprints were assessed. The carbon emissions were related to the greenhouse gases (GHG) that were emitted when producing energy. First, the carbon emissions avoided due to renewable energy production were calculated in terms of a carbon footprint. This was found to be 540.7 tons of CO2 avoided for one year. The value was based on the energy profile of the province of British Columbia. British Columbia generates 95% of its electricity from renewable sources and has a goal of zero carbon emissions by 2050 [58]. The value of the avoided GHG emissions was not large in this case study, however if we applied the methods in this simulation to another geographic area—for example the state of Florida, USA, which generates approximately 80% of its electricity from non-renewables—the potential avoided CO2 emissions would be significant. Several calculations within the simulation identified the number carbon emissions that were avoided due to renewable energy production, and they are given by Equations (10)–(12). The first calculation was for the total avoided carbon emissions ( E M f , t T o t a l ) for farm, f, at time, t (Equation (10)), which is the summation of the avoided carbon emissions due to the production of solar ( E M f , t S ) and wind ( E f , t W ) energy. Equation (11) was for the calculation of the emissions from the generation of solar energy E M f , t S ) for farm, f, at time, t, which takes the amount of the produced solar electricity ( E f , t S ) for farm, f, at time, t, and multiplies it by the average carbon emissions (CE) per kWh that the coefficient non-renewable energy sources would normally produce. A similar calculation (Equation (12)) was conducted for the emissions avoided by the non-renewable energy sources, which normally produce ( E f , t W ) for farm, f, at time, t, from the average carbon emissions (CE) per kWh that the coefficient non-renewable energy sources would normally produce.
E M f , t T o t a l = E M f , t S + E M f , t W
E M f , t S = E f , t S × C E S o l a r
E M f , t W = E f , t W × C E W i n d
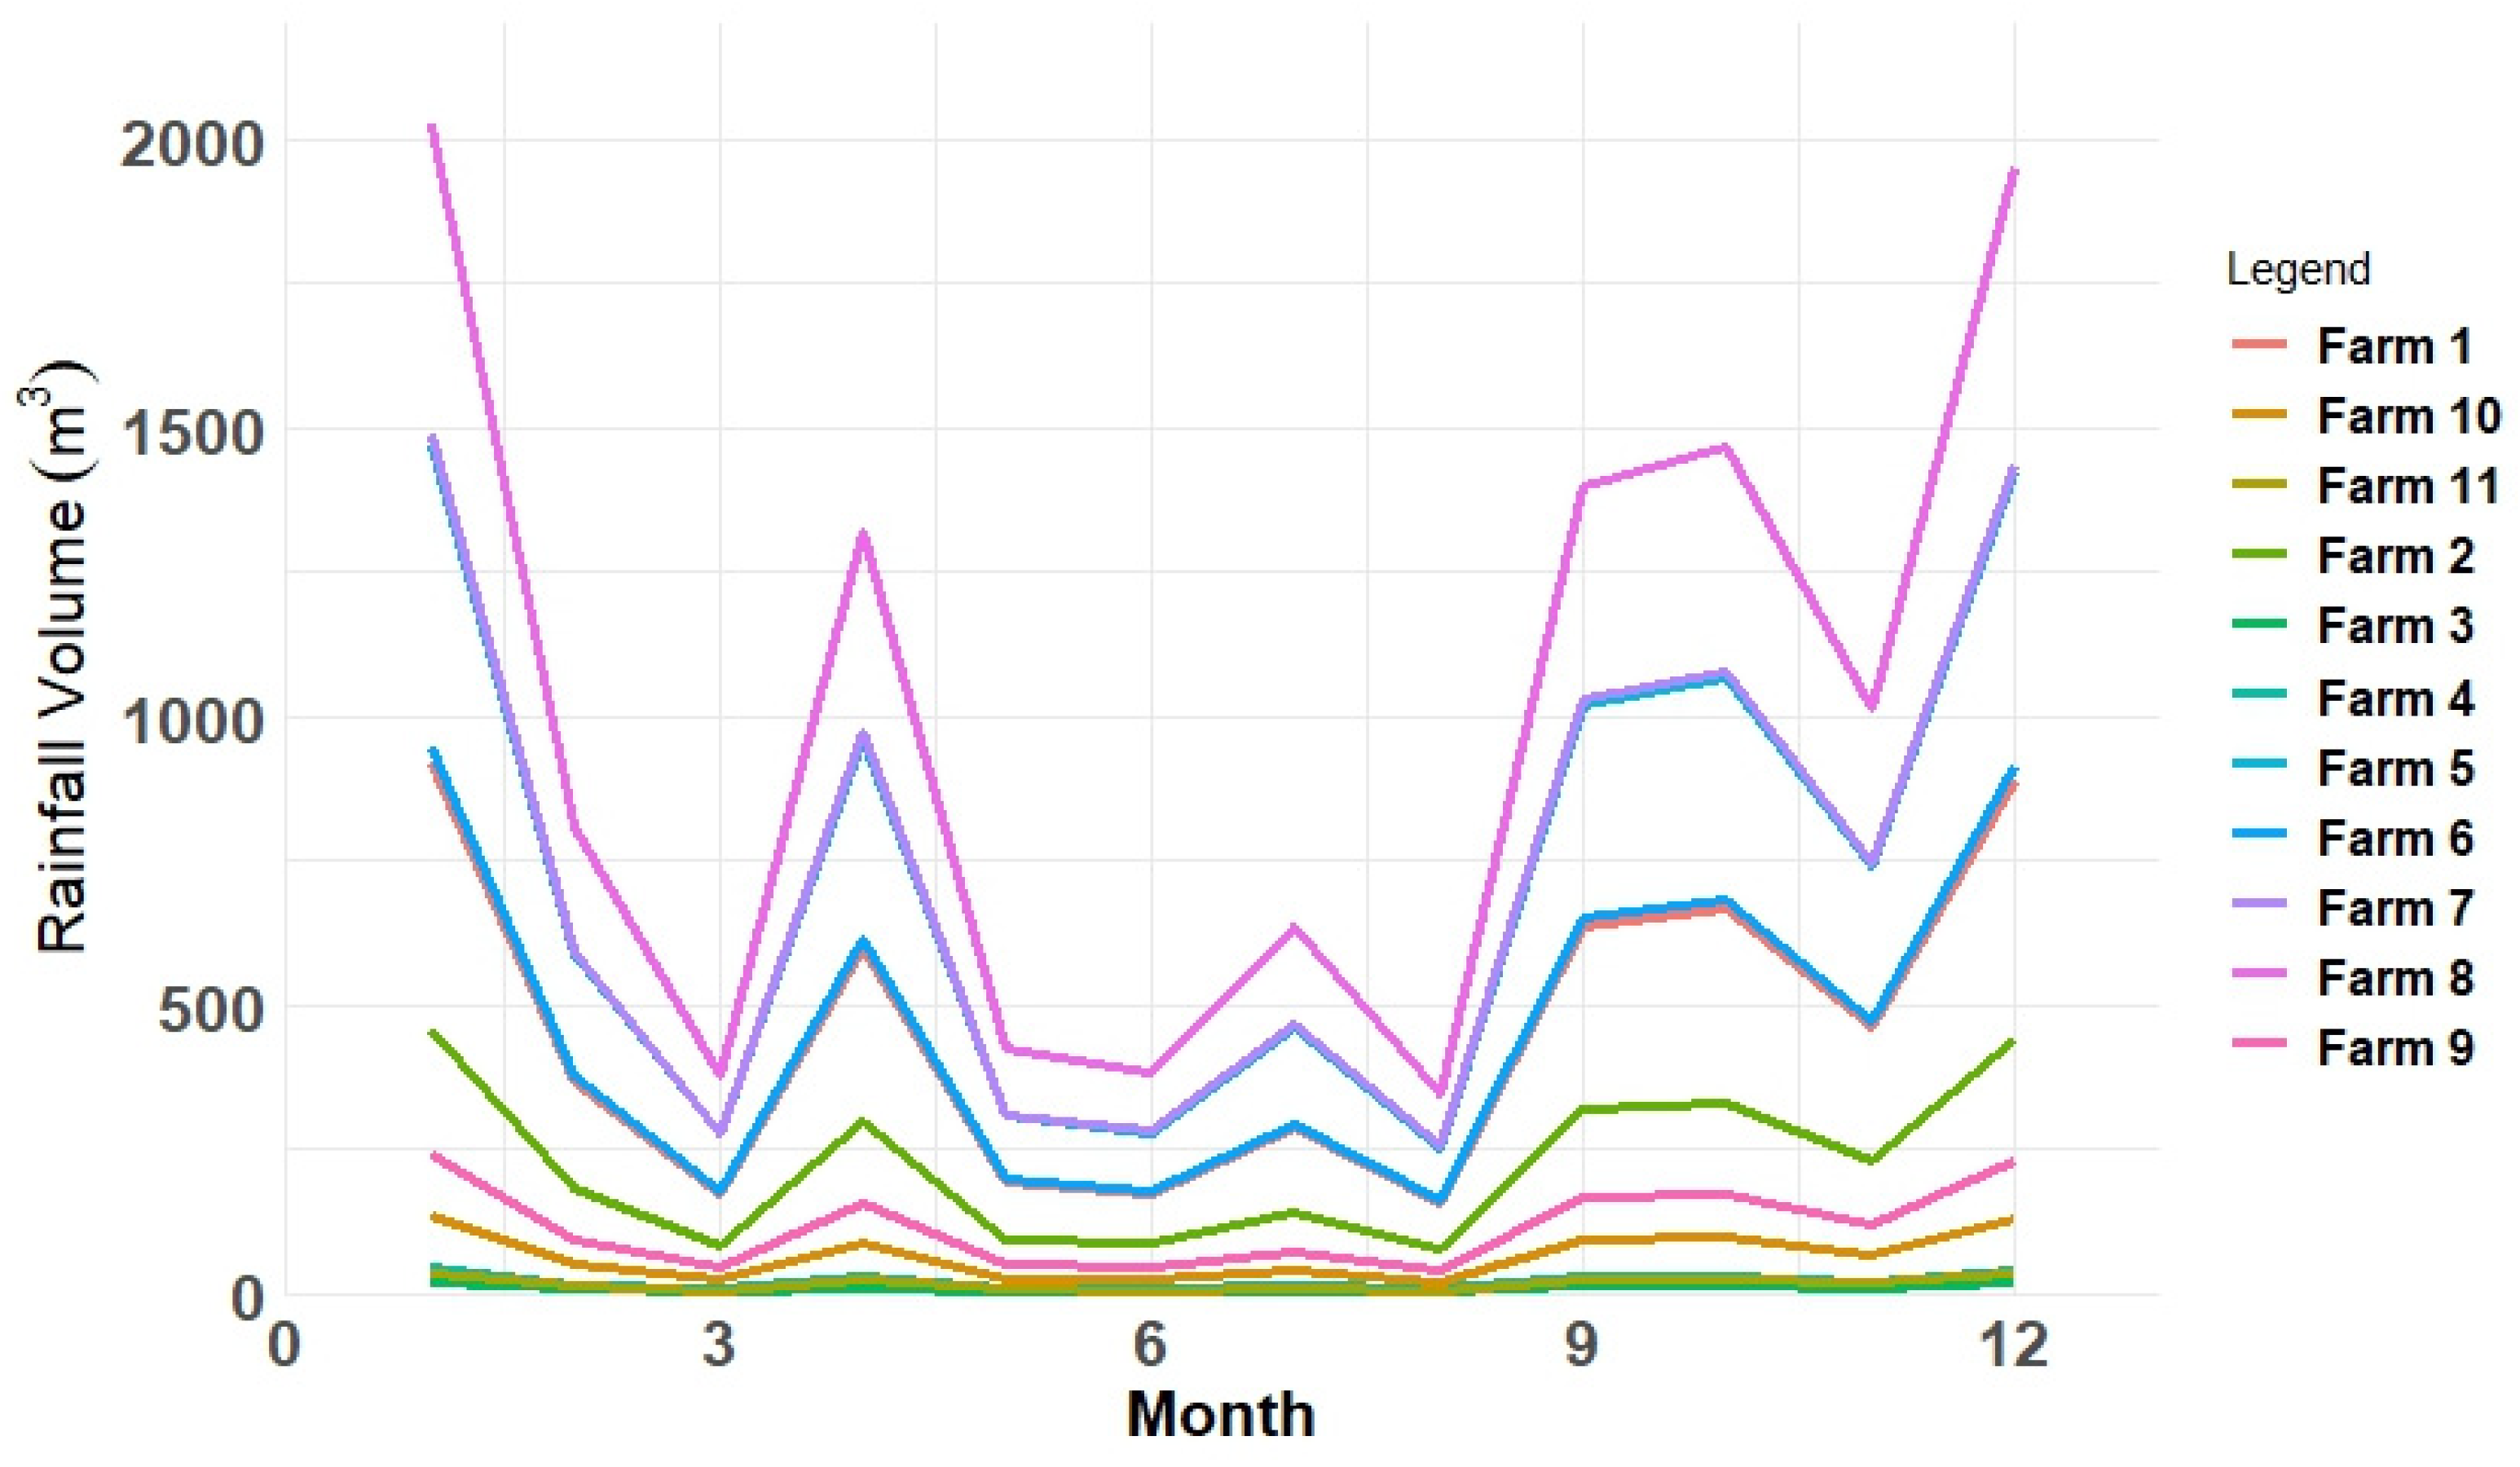
Next, the water footprint needed to be assessed, and there were two subcategories to the water footprint. This footprint included a green water footprint and a blue water footprint. The green water footprint refers to the amount of rainwater utilized to produce food, and the blue water footprint is the amount of irrigated surface and groundwater required to produce food. The total green water footprint was found to be 46,818 m3 of rainfall, and the blue water footprint was found to be 32,264 m3. Therefore, the total water footprint used to produce food was 79,082 m3. The rainfall trend throughout the year can be seen in Figure 13, where the trend was higher in the winter months. The irrigation trend is shown in Figure 14.
The simulation model calculated the water footprint based on Equations (13)–(16). Equation (13) calculated the total water footprint ( W f , t T o t a l ) for farm, f, at time, t, by summing the water used for irrigation ( W f , t I r r i g a t i o n ) for farm, f, at time, t, and the amount of rainfall ( W f , t R a i n f a l l ) for farm, f, at time, t. The value of all of these variables was measured in m3. As previously discussed, the green water footprint is related to the amount of rainfall, and the blue water footprint relates to the amount of water used for irrigation purposes to grow food. Equation (14) provided the total water footprint for the simulation at time, t, which was similar to its footprint ( W f , t T o t a l ) for all the farms, f, at time, t. Equation (15) was similar as it calculated the total irrigation ( W a t e r t I r r _ T o t a l ) at time, t, by taking the summation of the water used for irrigation ( W f , t I r r i g a t i o n ) for all the farms, f, at time, t. Equation (16) calculated the total rainfall ( W a t e r t R a i n _ T o t a l ) at time, t, by taking the summation of the rainfall ( W f , t R a i n ) for all the farms, f, at time, t.
W f , t T o t a l = W f , t I r r i g a t i o n + W f , t R a i n f a l l
W a t e r t T o t a l = W f , t T o t a l , f
W a t e r t I r r _ T o t a l = W f , t I r r i g a t i o n , f
W a t e r t R a i n _ T o t a l = W f , t R a i n , f

5.4. Micro Supply Chain Results

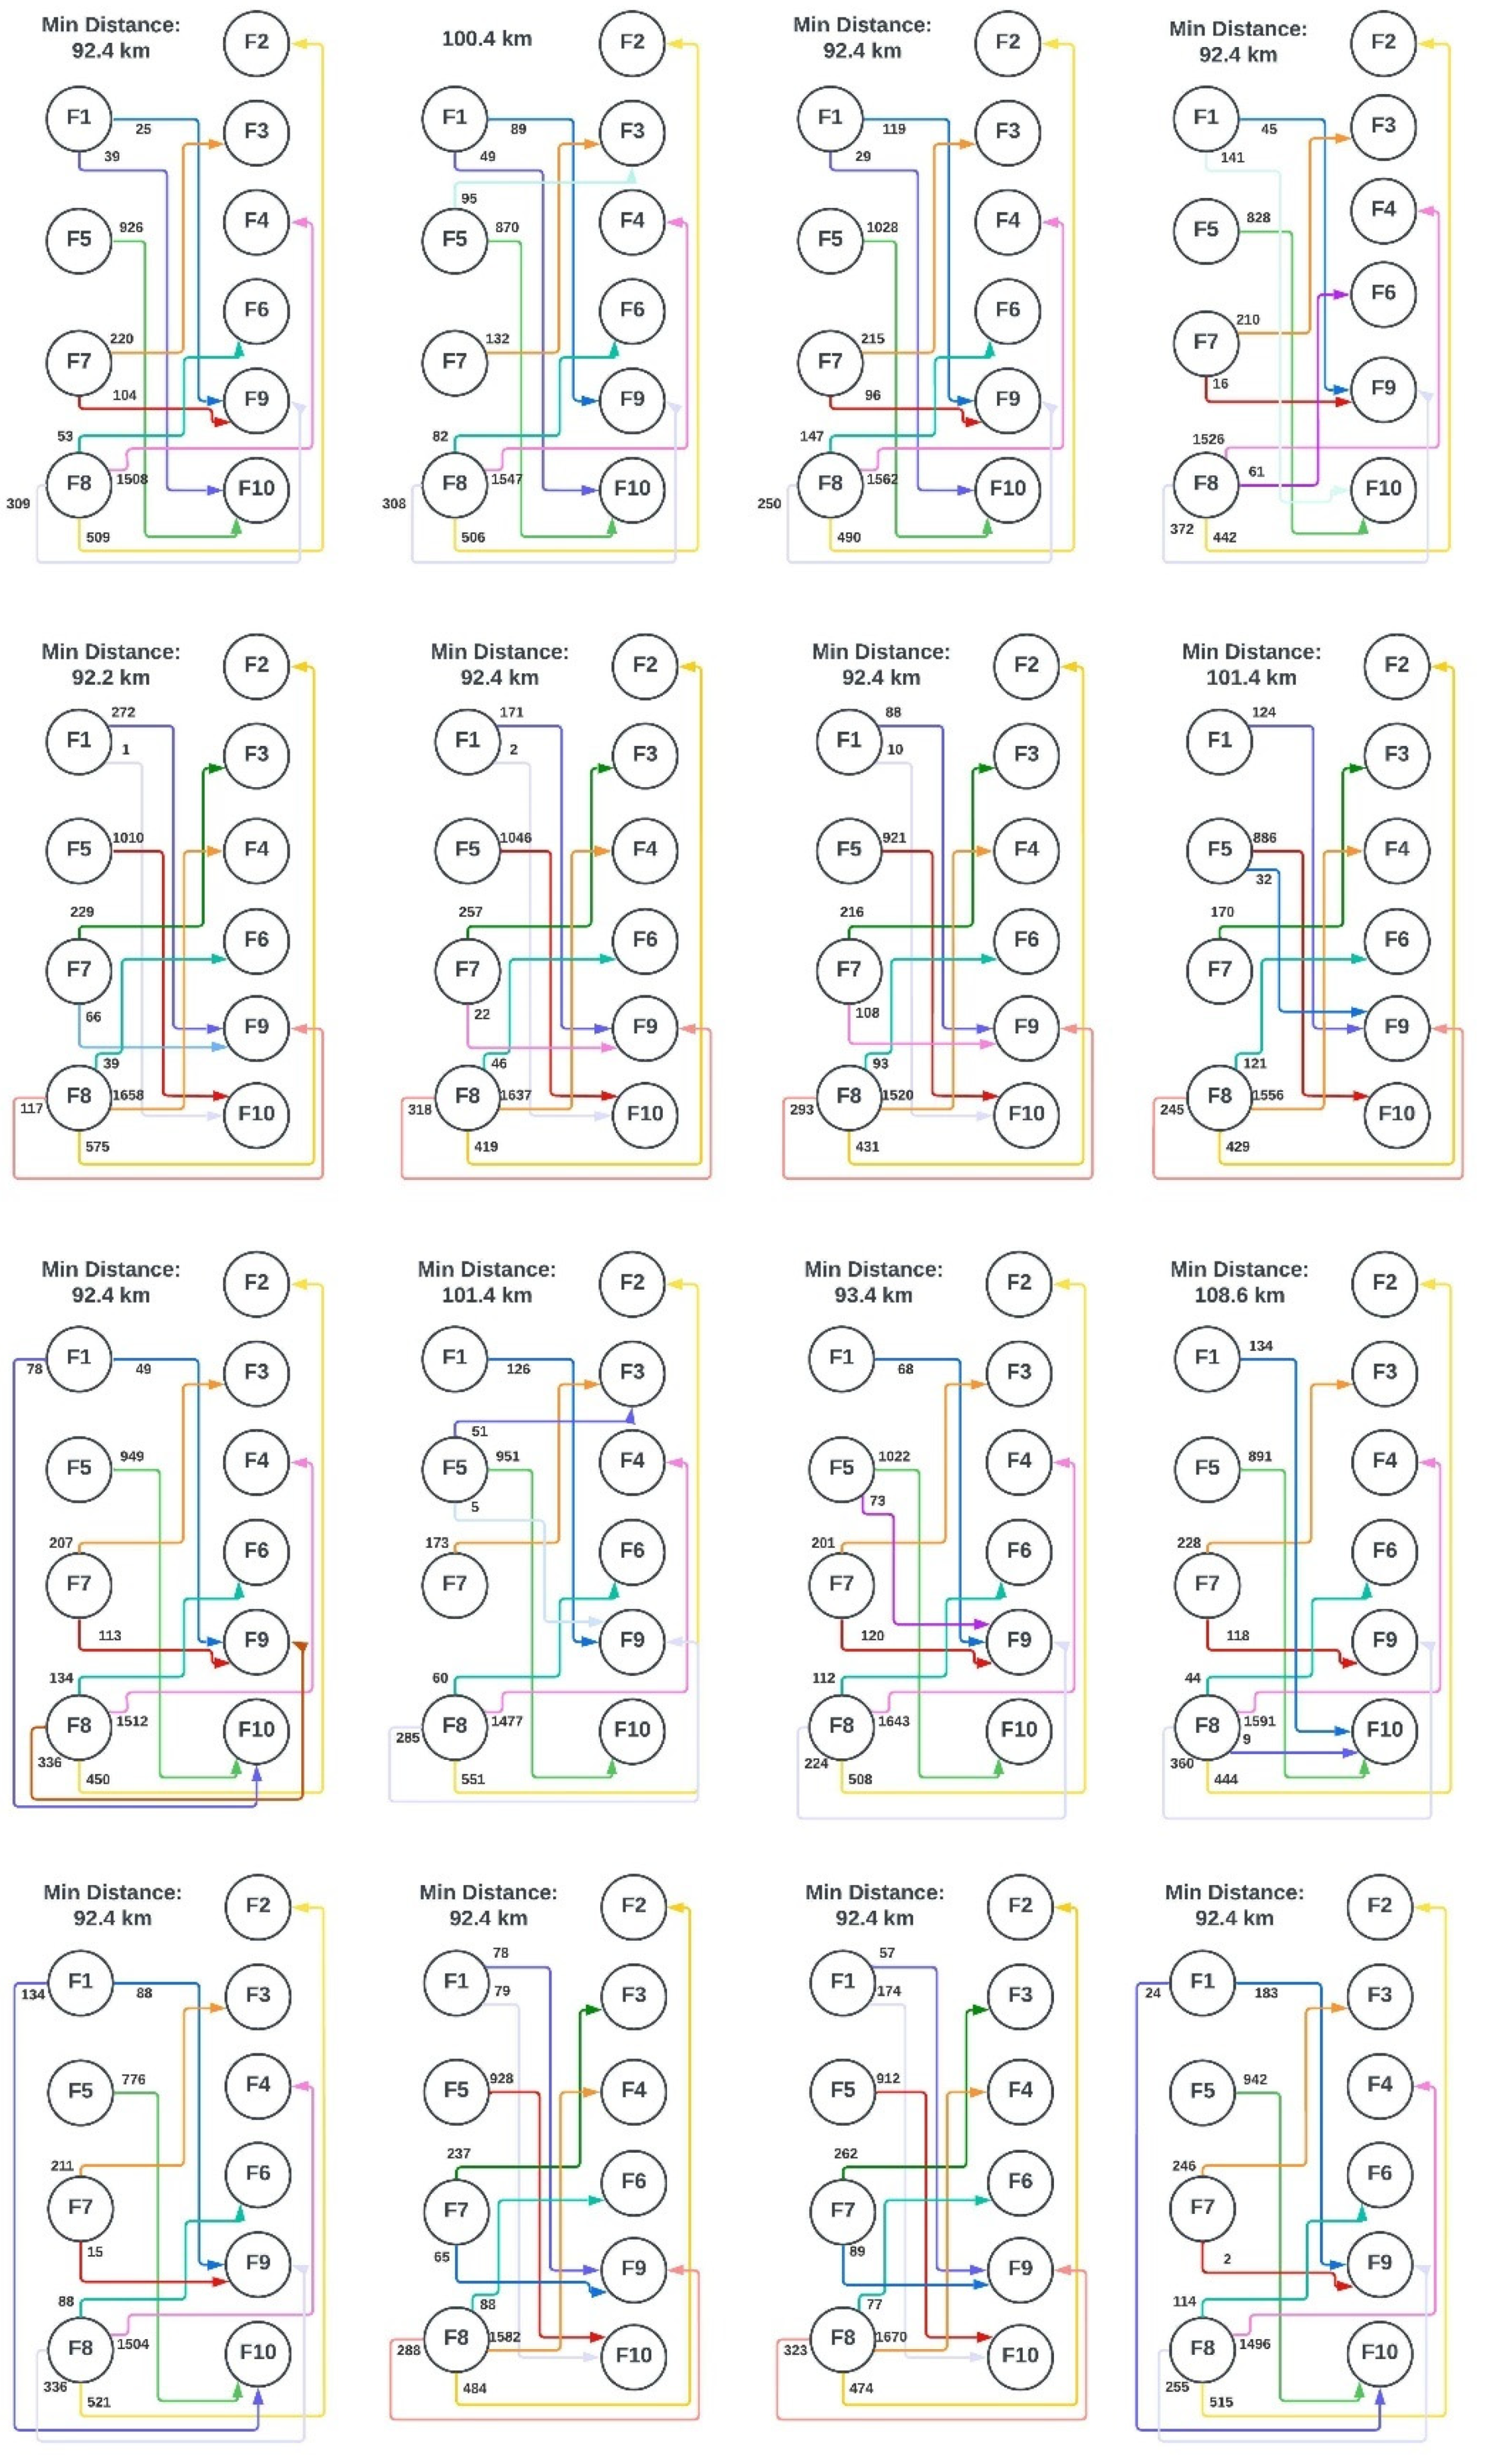
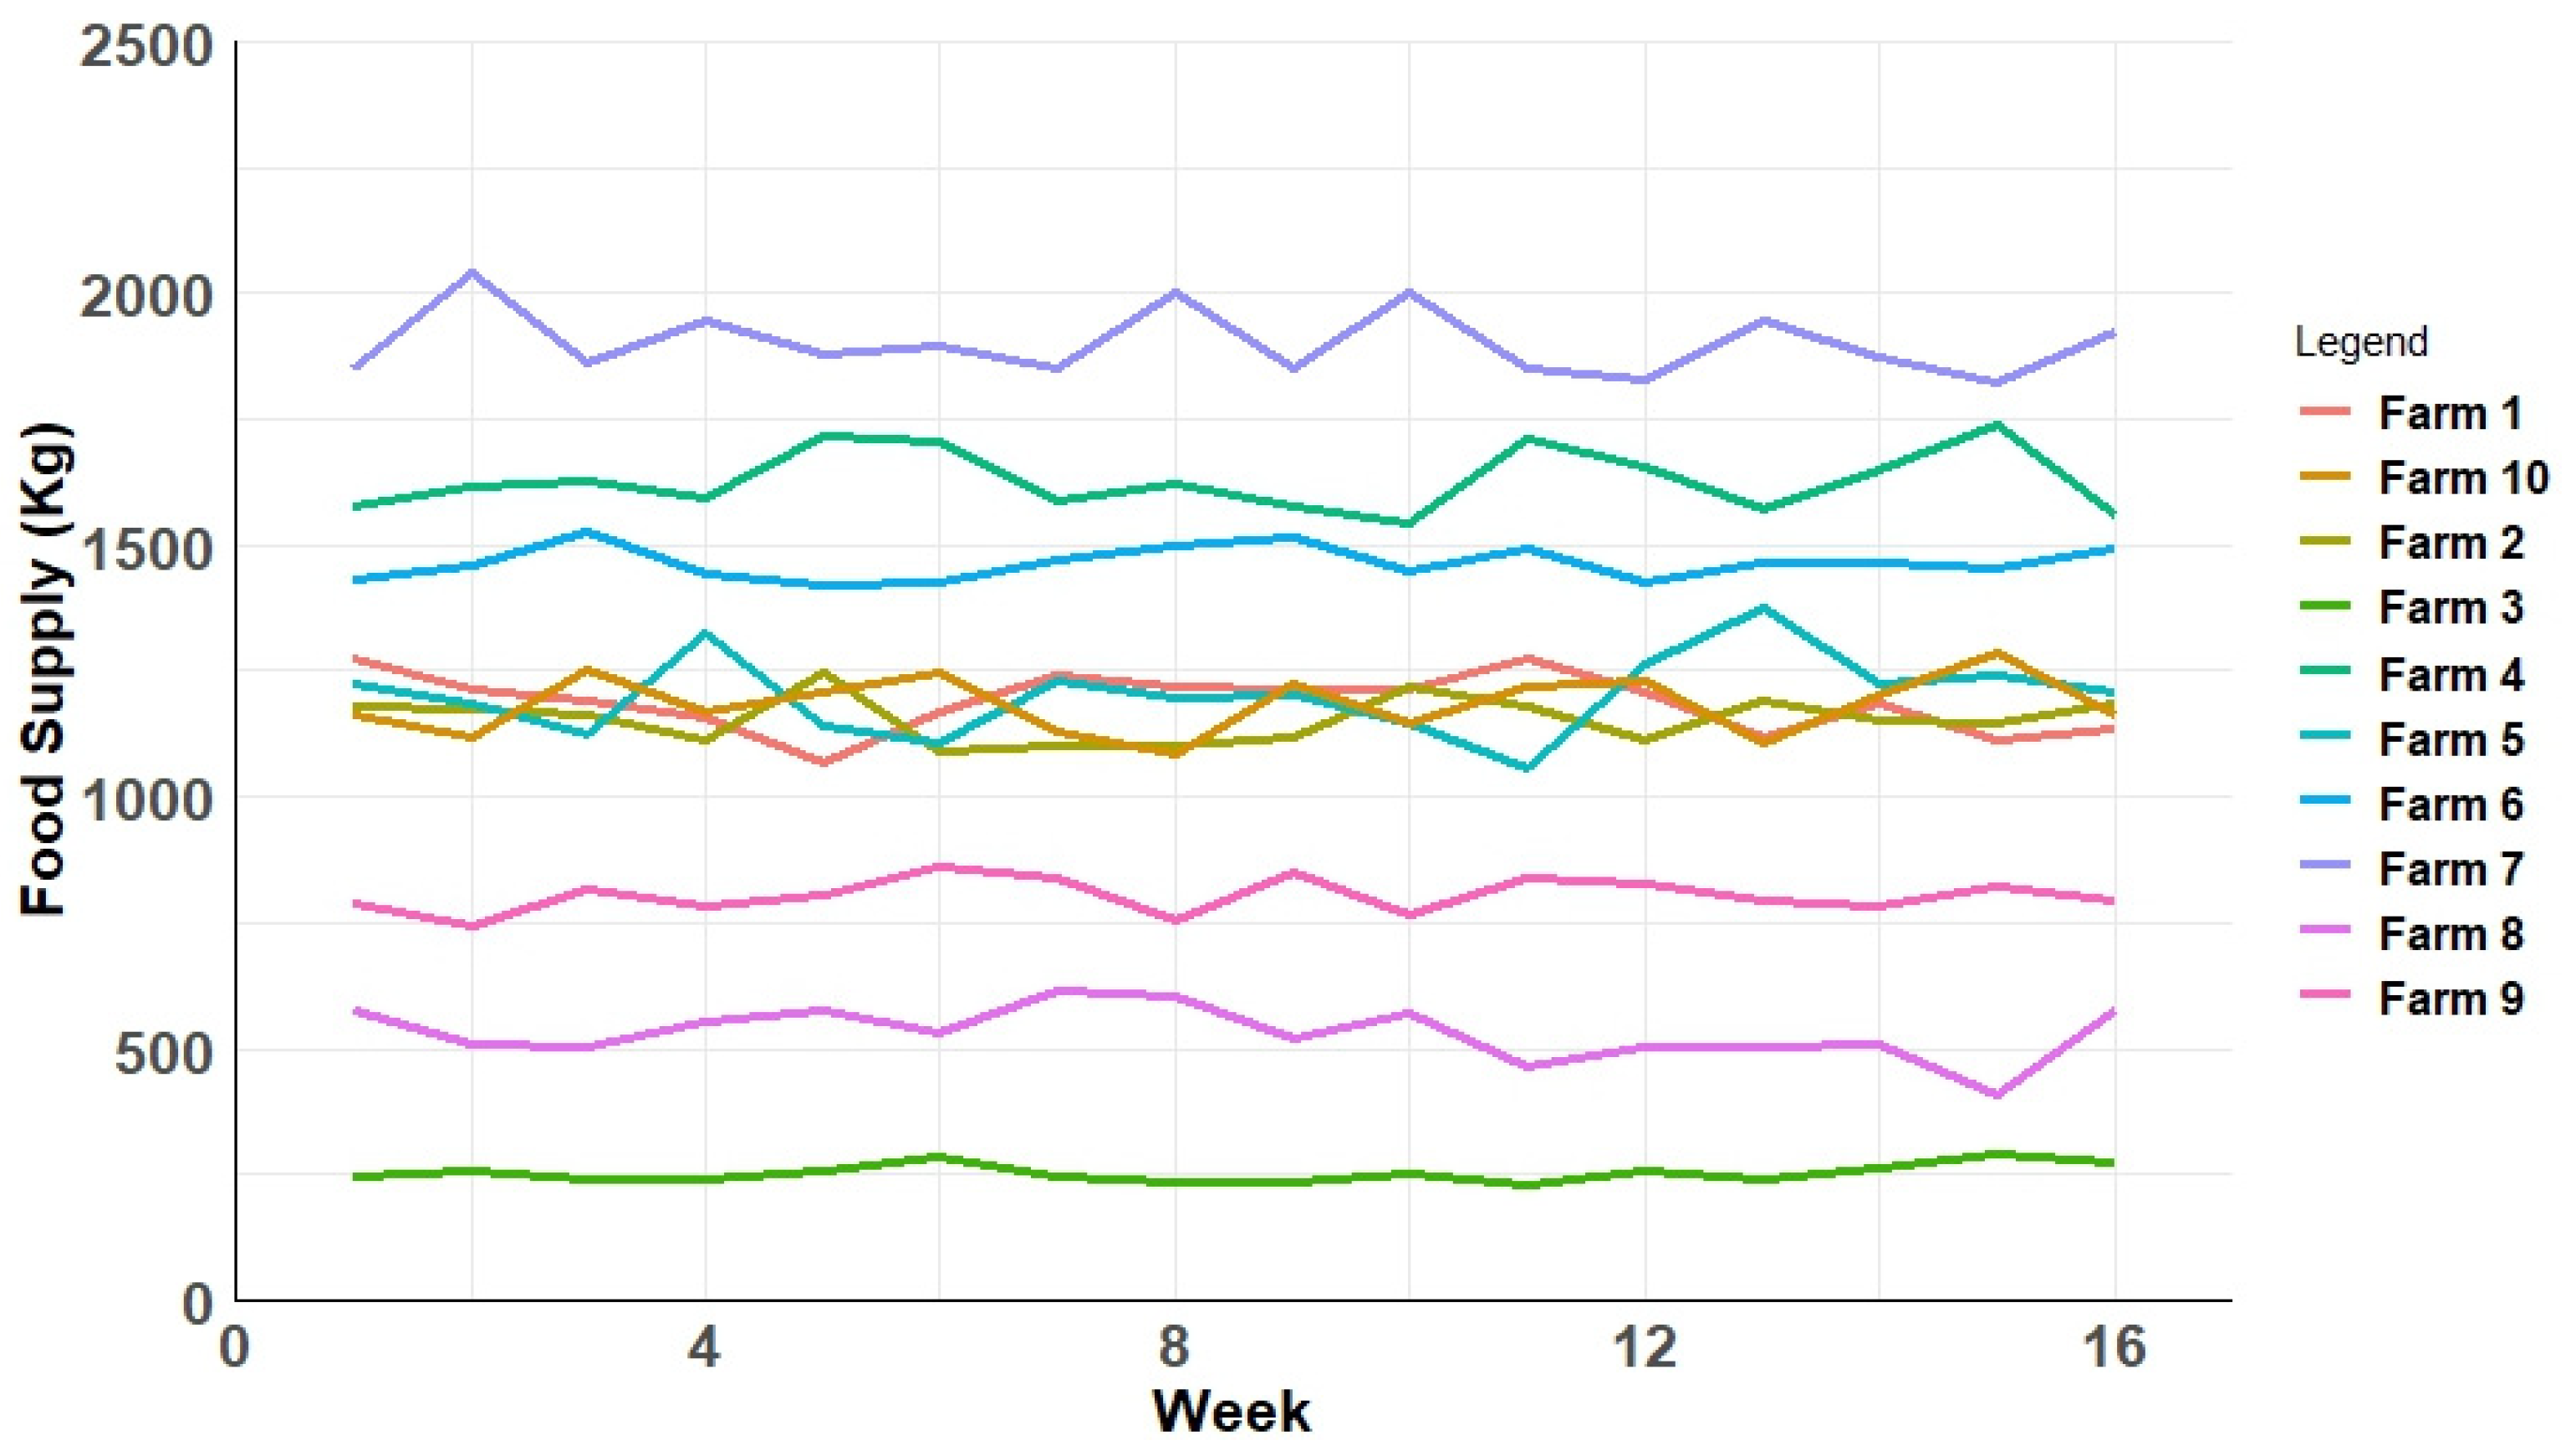
The results of the food supply chain are illustrated in Figure 15, where the weekly food exchange amounts are listed from farm to farm in kg, along with the minimum transportation distance in kilometers. The results supported the initial hypothesis of a reduction in food waste as well as increased food availability to households. The historical values for the supply and demand from the previous harvest season were considered when optimizing the micro supply chain for the current season. Using the historical values aided in the reduction in food waste due to the food exchange but did not lead to zero wastage, as illustrated previously in Figure 6. The farms in this study were in close proximity to one another, with the minimum distance being 0.4 km and the maximum being 12.5 km. Throughout the simulation, the same four farms were suppliers (Farms 1, 5, 7, and 8) and the remaining farms (Farms 2, 3, 4, 6, 9, and 10) were the demand farms. The amount of food exchanged from the supply to the demand farms constantly changed throughout the 16 weeks. Figure 16 shows the changing food supply at each urban farm after the food exchange occurred. These values differed from the initial production values at each urban farm listed in Table 3. The amount of food exchanged between the farms followed a consistent trend from week to week over the sixteen-week summer period, with the amount being higher in some weeks and lower in other weeks. This was due to the historical values of supply and demand at each, which changed weekly. When the supply chain was optimized, the minimum transportation distance was chosen and the model evenly distributed the food supply to the food demand. In addition, the supply farms did not always exchange produce with the same demand farms and the week-to-week exchange actions changed based on the micro supply chain optimization. The micro supply chain that was developed and implemented in this case study proved to be successful for the sixteen-week summer period, and this led to an increased food availability for households as well as contributing to decreased food waste; 58,858 kg less than the scenario without food exchange leading to a 96.9% reduction.

5.5. Implication of the Results and Discussion

The implications of the results presented in this paper are a solid foundation for policymakers to combine the sustainable solutions of urban farming and renewable energy generation into their respective communities. As shown in this paper, urban farms are able to supplement fresh food for local communities by increasing food availability. Additionally, renewable energy generation is shown to supplement local electricity demand, contributing to renewable energy goals and fewer carbon emissions. Policymakers can replicate this infrastructure in their respective regions by identifying urban farming areas in a city, as well as introducing renewable energy. The specifications of the renewable energy infrastructure and the crops to be cultivated depend on a region’s climate.
The methodology and results illustrated in this paper serve as valuable recommendations for policymakers in the urban agriculture sector. Policymakers can replicate the urban farm infrastructure presented in this paper and apply it to other geographic regions around the world. However, they need to establish urban farming guidelines and identify urban farming spaces to serve their local communities. Additionally, a community microgrid can also be added to the urban agriculture sites in order to supplement electricity through renewable energy generation. The results show the potential benefits to a society through a reduction in both carbon emissions and food waste.
The micro supply chain formulated in this paper showed its effectiveness by increasing food access to the local community and reducing food waste, thus allowing for a more efficient use of natural resources. The micro supply chain is a valuable tool that policymakers can introduce after the establishment of urban farms in their respective areas, as it can encourage farm collaboration, reduce food waste, increase food access, and create a greater sense of community. For the city of Vancouver, we saw the effectiveness of such a tool, and it is recommended that policymakers adopt this approach within their current infrastructure of urban farms. Due to British Columbia’s net-zero objective for 2050, it is recommended that the introduced vehicles should utilize electricity, which is a viable option as the farms were in close proximity with one another, and thus there shouldn’t be any down time for vehicles to spend at charging stations.
The city of Vancouver previously established guidelines and policies for urban farmers and continues to incentivize this sustainable approach. Work has been completed on the identification of urban farming sites, along with which policy and frameworks need to be introduced so that urban farming can be successful in Vancouver. However, none of these approaches used simulations to study the current situations. the work presented in this paper can supplement the current efforts of urban farming expansion in Vancouver and provide suggestions for community microgrids and a micro supply chain to further contribute to sustainability.

6. Conclusions and Future Research

This paper illustrated an agent-based model that simulated a case study of eleven urban farms with attached community microgrids in Vancouver, BC, Canada. The simulation focused on food, energy, and water resources and assessed social and environmental sustainability. In addition, a micro supply chain optimization program was integrated within the agent-based model to holistically link the producers with the consumers by severing the links involved in a traditional food supply chain. Ten of the eleven farms in the simulation collaborated to reduce food wastage and meet consumer demands, thus establishing a farmer-to-farmer exchange or transitional agriculture. The optimization-based micro supply chain aims to minimize costs by reducing the transportation distance and also aims to establish an equilibrium between food supply and demand. Urban farms sold harvest boxes of vegetables to local households every week for sixteen weeks in the summer harvest period. The resulting food exchange successfully increased food availability and decreased food waste by 96.9% over the sixteen weeks. Regarding the ability measures, local households were found to be food secure due to the urban farms, and the microgrids were able to assist with the electricity demand by producing 22,774 MWh from solar energy and 2568 MWh from wind energy for one year. The water footprint was found to be 79,082 m3, with 32,264 m3 from irrigated water and 46,818 m3 from rainfall.
The methodology and results illustrated in this paper serve as valuable recommendations for policymakers in the urban agriculture sector. Policymakers can replicate the urban farm infrastructure presented in this paper and apply it to other geographic regions around the world. However, policymakers need to establish urban farming guidelines, as well as identify urban farming spaces to serve their local communities. Additionally, a community microgrid can be added to the urban agriculture sites in order to supplement electricity through renewable energy generation. The results show the potential benefits to society through a reduction in both carbon emissions and food waste.
The micro supply chain derived in this paper is a valuable resource for policymakers, however the total cost of transportation, potential profits and potential carbon emissions from transportation were not considered. The costs in the model only considered the distance for food to be transported, and there was no constraint to determine whether transporting was beneficial in terms of profit for an urban farm. Additionally, the cost of fuel and the potential carbon emissions of the vehicles transporting food in the micro supply chain were not considered. Another area for improvement in the agent-based model is to consider whether urban farms are profitable, as the objective in this study was how these farms can contribute to society, as well as contributing towards sustainable objectives set by policymakers. Furthermore, the costs associated with the installation of solar panels, wind turbines, battery storage systems, and vehicles for the micro supply chain can be considered in future work, with a full cost–benefit assessment of the installed renewable energy infrastructure and an assessment of the creation of the micro supply chain in this case study.

Author Contributions

Conceptualization, M.E. and L.R.; methodology, M.E., L.R. and A.T.S.; software, M.E. and L.R.; validation, M.E. and L.R.; formal analysis, M.E., L.R. and A.T.S.; investigation, M.E., L.R. and A.T.S.; resources, L.R.; data curation, M.E.; writing—original draft preparation, M.E.; writing—review and editing, L.R. and A.T.S.; visualization, L.R. and A.T.S.; supervision, L.R. and A.T.S.; project administration, L.R.; funding acquisition, L.R. All authors have read and agreed to the published version of the manuscript.

Funding

This research received no external funding.

Data Availability Statement

Data available upon request.

Conflicts of Interest

The authors declare no conflict of interest.

References

  1. Simpson, G.B.; Jewitt, G.P.W. The Development of the Water-Energy-Food Nexus as a Framework for Achieving Resource Security: A Review. Front. Environ. Sci. 2019, 7, 8. [Google Scholar] [CrossRef] [Green Version]
  2. Alexandratos, N.; Bruinsma, J. World Agriculture towards 2030/2050: The 2012 Revision; FAO: Rome, Italy, 2012; ISSN 2521-1838. [Google Scholar]
  3. McKenzie, F.C.; Williams, J. Sustainable food production: Constraints, challenges and choices by 2050. Food Secur. 2015, 7, 221–233. [Google Scholar] [CrossRef]
  4. Bajželj, B.; Richards, K.S.; Allwood, J.M.; Smith, P.; Dennis, J.S.; Curmi, E.; Gilligan, C.A. Importance of food-demand management for climate mitigation. Nat. Clim. Chang. 2014, 4, 924–929. [Google Scholar] [CrossRef] [Green Version]
  5. Boretti, A.; Rosa, L. Reassessing the projections of the World Water Development Report. Npj Clean Water 2019, 2, 15. [Google Scholar] [CrossRef] [Green Version]
  6. Kaufman, J.; Bailkey, M. Farming inside Cities: Entrepreneurial Urban Agriculture in the United States; Lincoln Institute of Land Policy: Cambridge, MA, USA, 2001. [Google Scholar]
  7. Weber, C.L.; Matthews, H.S. Food-Miles and the Relative Climate Impacts of Food Choices in the United States. Environ. Sci. Technol. 2008, 42, 3508–3513. [Google Scholar] [CrossRef] [Green Version]
  8. Elkamel, M.; Valencia, A.; Zhang, W.; Zheng, Q.P.; Chang, N.-B. Multi-agent modeling for linking a green transportation system with an urban agriculture network in a food-energy-water nexus. Sustain. Cities Soc. 2023, 89, 104354. [Google Scholar] [CrossRef]
  9. Abar, S.; Theodoropoulos, G.K.; Lemarinier, P.; O’Hare, G.M.P. Agent Based Modelling and Simulation tools: A review of the state-of-art software. Comput. Sci. Rev. 2017, 24, 13–33. [Google Scholar] [CrossRef]
  10. Widener, M.J.; Metcalf, S.S.; Bar-Yam, Y. Agent-based modeling of policies to improve urban food access for low-income populations. Appl. Geogr. 2013, 40, 1–10. [Google Scholar] [CrossRef]
  11. Dobbie, S.; Schreckenberg, K.; Dyke, J.G.; Schaafsma, M.; Balbi, S. Agent-Based Modelling to Assess Community Food Security and Sustainable Livelihoods. J. Artif. Soc. Soc. Simul. 2018, 21, 9. [Google Scholar] [CrossRef] [Green Version]
  12. Ghandar, A.; Theodoropoulos, G.; Zhong, M.; Zhen, B.; Chen, S.; Gong, Y.; Ahmed, A. An Agent-Based Modelling Framework for Urban Agriculture. In Proceedings of the 2019 Winter Simulation Conference (WSC), National Harbor, MD, USA, 8–11 December 2019; pp. 1767–1778. [Google Scholar]
  13. Giulioni, G. An Agent-Based Modeling and Simulation Approach to Commodity Markets. Soc. Sci. Comput. Rev. 2018, 37, 355–370. [Google Scholar] [CrossRef]
  14. Calisti, R.; Proietti, P.; Marchini, A. Promoting Sustainable Food Consumption: An Agent-Based Model About Outcomes of Small Shop Openings. J. Artif. Soc. Soc. Simul. 2019, 22, 2. [Google Scholar] [CrossRef]
  15. Marvuglia, A.; Bayram, A.; Baustert, P.; Gutiérrez, T.N.; Igos, E. Agent-based modelling to simulate farmers’ sustainable decisions: Farmers’ interaction and resulting green consciousness evolution. J. Clean. Prod. 2022, 332, 129847. [Google Scholar] [CrossRef]
  16. Ng, T.L.; Eheart, J.W.; Cai, X.; Braden, J.B. An agent-based model of farmer decision-making and water quality impacts at the watershed scale under markets for carbon allowances and a second-generation biofuel crop. Water Resour. Res. 2011, 47. [Google Scholar] [CrossRef]
  17. Lopez-Jimenez, J.; Quijano, N.; Wouwer, A.V. On the Use of Agent-Based Modeling for Smart Farming. In Proceedings of the 2018 22nd International Conference on System Theory, Control and Computing (ICSTCC), Sinaia, Romania, 10–12 October 2018; pp. 348–353. [Google Scholar]
  18. Feng, K.; Hubacek, K.; Siu, Y.L.; Li, X. The energy and water nexus in Chinese electricity production: A hybrid life cycle analysis. Renew. Sustain. Energy Rev. 2014, 39, 342–355. [Google Scholar] [CrossRef] [Green Version]
  19. Chen, S.; Chen, B. Urban energy consumption: Different insights from energy flow analysis, input–output analysis and ecological network analysis. Appl. Energy 2015, 138, 99–107. [Google Scholar] [CrossRef]
  20. Zaman, K.; Khan, M.M.; Ahmad, M.; Rustam, R. The relationship between agricultural technology and energy demand in Pakistan. Energy Policy 2012, 44, 268–279. [Google Scholar] [CrossRef]
  21. Alimagham, S.M.; Soltani, A.; Zeinali, E.; Kazemi, H. Energy flow analysis and estimation of greenhouse gases (GHG) emissions in different scenarios of soybean production (Case study: Gorgan region, Iran). J. Clean. Prod. 2017, 149, 621–628. [Google Scholar] [CrossRef]
  22. Babel, M.S.; Shrestha, B.; Perret, S.R. Hydrological impact of biofuel production: A case study of the Khlong Phlo Watershed in Thailand. Agric. Water Manag. 2011, 101, 8–26. [Google Scholar] [CrossRef]
  23. Mortensen, J.G.; González-Pinzón, R.; Dahm, C.N.; Wang, J.; Zeglin, L.H.; Van Horn, D.J. Advancing the Food-Energy–Water Nexus: Closing Nutrient Loops in Arid River Corridors. Environ. Sci. Technol. 2016, 50, 8485–8496. [Google Scholar] [CrossRef] [PubMed] [Green Version]
  24. Flörke, M.; Schneider, C.; McDonald, R.I. Water competition between cities and agriculture driven by climate change and urban growth. Nat. Sustain. 2018, 1, 51–58. [Google Scholar] [CrossRef]
  25. Nie, Y.; Avraamidou, S.; Xiao, X.; Pistikopoulos, E.N.; Li, J.; Zeng, Y.; Song, F.; Yu, J.; Zhu, M. A Food-Energy-Water Nexus approach for land use optimization. Sci. Total Environ. 2019, 659, 7–19. [Google Scholar] [CrossRef] [PubMed] [Green Version]
  26. Khan, H.F.; Yang, Y.C.E.; Xie, H.; Ringler, C. A coupled modeling framework for sustainable watershed management in transboundary river basins. Hydrol. Earth Syst. Sci. 2017, 21, 6275–6288. [Google Scholar] [CrossRef] [Green Version]
  27. Newell, B.; Marsh, D.; Sharma, D. Enhancing the Resilience of the Australian National Electricity Market: Taking a Systems Approach in Policy Development. Ecol. Soc. 2011, 16, 15. [Google Scholar] [CrossRef] [Green Version]
  28. Markantonis, V.; Reynaud, A.; Karabulut, A.; El Hajj, R.; Altinbilek, D.; Awad, I.M.; Bruggeman, A.; Constantianos, V.; Mysiak, J.; Lamaddalena, N.; et al. Can the Implementation of the Water-Energy-Food Nexus Support Economic Growth in the Mediterranean Region? The Current Status and the Way Forward. Front. Environ. Sci. 2019, 7, 84. [Google Scholar] [CrossRef]
  29. Abatekassa, G.; Peterson, C. Market Access for Local Food through the Conventional Food Supply Chain. Int. Food Agribus. Manag. Rev. 2011, 14, 63–82. [Google Scholar]
  30. Alam, M.M. Mango supply chain and value chain analysis from farm to market. Int. J. Supply Chain Manag. 2018, 7, 7–12. [Google Scholar]
  31. Marsden, T.; Banks, J.; Bristow, G. Food Supply Chain Approaches: Exploring their Role in Rural Development. Sociol. Rural. 2000, 40, 424–438. [Google Scholar] [CrossRef]
  32. Utomo, D.S.; Onggo, B.S.S.; Eldridge, S.; Daud, A.R.; Tejaningsih, S. Eliciting agents’ behaviour using scenario-based questionnaire in agent-based dairy supply chain simulation. J. Simul. 2022, 16, 58–72. [Google Scholar] [CrossRef]
  33. Krejci, C.; Beamon, B.M. Assessing regional farm-to-institution food distribution systems: An agent-based approach. IIE Annu. Conf. Expo 2014, 2014, 3592–3601. [Google Scholar]
  34. Khanh, H.N.; Chiong, R.; Chica, M.; Middleton, R.H. Agent-based simulation of contract rice farming in the Mekong Delta, Vietnam. In Proceedings of the 2017 21st Asia Pacific Symposium on Intelligent and Evolutionary Systems (IES), Hanoi, Vietnam, 15–17 November 2017; pp. 127–132. [Google Scholar]
  35. Mittal, A.; Gibson, N.O.; Krejci, C.C. An Agent-based Model of Surplus Food Rescue Using Crowd-shipping. In Proceedings of the 2019 Winter Simulation Conference (WSC), National Harbor, MD, USA, 8–11 December 2019; pp. 854–865. [Google Scholar]
  36. Krejci, C.; Beamon, B. Impacts of Farmer Coordination Decisions on Food Supply Chain Structure. J. Artif. Soc. Soc. Simul. 2015, 18, 19. [Google Scholar] [CrossRef]
  37. Utomo, D.S.; Onggo, B.S.; Eldridge, S. Applications of agent-based modelling and simulation in the agri-food supply chains. Eur. J. Oper. Res. 2018, 269, 794–805. [Google Scholar] [CrossRef] [Green Version]
  38. Remondino, M.; Zanin, A. Logistics and Agri-Food: Digitization to Increase Competitive Advantage and Sustainability. Literature Review and the Case of Italy. Sustainability 2022, 14, 787. [Google Scholar] [CrossRef]
  39. Day-Farnsworth, L.; Miller, M. Networking Across the Supply Chain: Transportation Innovations in Local and Regional Food Systems. Available online: https://ageconsearch.umn.edu/record/316237 (accessed on 1 December 2022).
  40. Paciarotti, C.; Torregiani, F. Short food supply chain between micro/small farms and restaurants. Br. Food J. 2018, 120, 1722–1734. [Google Scholar] [CrossRef]
  41. Sitaker, M.; Kolodinsky, J.; Jilcott Pitts, S.B.; Seguin, R.A. Do entrepreneurial food systems innovations impact rural economies and health? Evidence and gaps. Am. J. Entrep. 2014, 7, 3–16. [Google Scholar] [PubMed]
  42. Floriš, N.; Schwarcz, P.; Schwarczová, L.; Munk, M. Short Food Supply Chains and Small Farms—Evidence from Slovakia. Sustainability 2022, 14, 2728. [Google Scholar] [CrossRef]
  43. Dharmalingam, B.; Giri Nandagopal, M.S.; Thulasiraman, V.; Kothakota, A.; Rajkumar. Chapter Two—Short food supply chains to resolve food scarcity during COVID-19 pandemic—An Indian model. In Advances in Food Security and Sustainability; Cohen, M.J., Ed.; Elsevier: Amsterdam, The Netherlands, 2021; Volume 6, pp. 35–63. [Google Scholar]
  44. Sodiq, A.; Baloch, A.A.B.; Khan, S.A.; Sezer, N.; Mahmoud, S.; Jama, M.; Abdelaal, A. Towards modern sustainable cities: Review of sustainability principles and trends. J. Clean. Prod. 2019, 227, 972–1001. [Google Scholar] [CrossRef]
  45. Tavares, J.; Hoops, G.P.; Olshansky, H.P.; Rosen, R. Copenhagen’s Case for Urban Farming: A Feasibility Study; Worcester Polytechnic Institute: Worcester, MA, USA, 2018; Available online: https://digital.wpi.edu/show/fb4948799 (accessed on 1 December 2022).
  46. Akita, N. How Urban Agriculture Can Contribute to Green Infrastructure in Japanese Cities. In Urban Services to Ecosystems: Green Infrastructure Benefits from the Landscape to the Urban Scale; Catalano, C., Andreucci, M.B., Guarino, R., Bretzel, F., Leone, M., Pasta, S., Eds.; Springer International Publishing: Cham, Switzerland, 2021; pp. 227–242. [Google Scholar] [CrossRef]
  47. Chandra, A.J.; Diehl, J.A. Urban agriculture, food security, and development policies in Jakarta: A case study of farming communities at Kalideres—Cengkareng district, West Jakarta. Land Use Policy 2019, 89, 104211. [Google Scholar] [CrossRef]
  48. Likitswat, F. Urban Farming: Opportunities and Challenges of Developing Greenhouse Business in Bangkok Metropolitan Region. Future Cities Environ. 2021, 7, 8. [Google Scholar] [CrossRef]
  49. Rigillo, M.; Vigo Majello, M.C. Opportunities for Urban Farming in Cities. The Case Study of San Martino Hill in Naples, Italy. WIT Trans. Ecol. Environ. 2014, 191, 1671–1683. [Google Scholar]
  50. Bruce, D.D.; Ahmed, K.A. Urban Agriculture Case Studies in Central Texas: From the Ground to the Rooftop. In Urban Agriculture; Mohamed, S., Ed.; IntechOpen: Rijeka, Croatia, 2016; Chapter 2. [Google Scholar] [CrossRef]
  51. Althaus Ottman, M.M.; Maantay, J.A.; Grady, K.; Cardoso, N.; da Fonte, N.N. Community Gardens: An Exploration of Urban Agriculture in the Bronx, New York City. Cities Env. 2010, 3, 20. [Google Scholar]
  52. Schutzbank, M.; Riseman, A. Entrepreneurial Urban farms: An Urban farming census of Vancouver, British Columbia. Int. J. Environ. Sustain. 2013, 8, 131–163. [Google Scholar] [CrossRef]
  53. Mendes, W.; Balmer, K.; Kaethler, T.; Rhoads, A. Using Land Inventories to Plan for Urban Agriculture: Experiences From Portland and Vancouver. J. Am. Plan. Assoc. 2008, 74, 435–449. [Google Scholar] [CrossRef]
  54. City of Vancouver. Urban Farm Guidelines. Available online: https://guidelines.vancouver.ca/guidelines-urban-farm.pdf (accessed on 1 November 2022).
  55. City of Vancouver. Urban farming: Growing Food to Sell. Available online: https://vancouver.ca/people-programs/growing-food-for-sale.aspx (accessed on 1 November 2022).
  56. VUFS. Vancouver Urban Farming Society. Available online: http://urbanfarmers.ca/ (accessed on 1 November 2022).
  57. CleanBC. Roadmap to 2030. Available online: https://www2.gov.bc.ca/assets/gov/environment/climate-change/action/cleanbc/cleanbc_roadmap_2030.pdf (accessed on 1 November 2022).
  58. CleanBC. Is Rising to the Challenge of Climate Change. Available online: https://cleanbc.gov.bc.ca/ (accessed on 1 November 2022).
  59. Government of Canada. Historical Data: Past Weather and Climate. Available online: https://climate.weather.gc.ca/historical_data/search_historic_data_e.html (accessed on 1 November 2022).
  60. Vancouver Urban Farming Society. Urban Farming Census 2017–2019. Available online: http://urbanfarmers.ca/urban-farms/urban-farming-census/ (accessed on 1 November 2022).
  61. Selda, O.; Ustun, S.; Melek, E.; Metin, T.; Ertan, Y. Principles of Irrigation Management for Vegetables. In Vegetable Crops; Ertan, Y., Melek, E., Eds.; IntechOpen: Rijeka, Croatia, 2021; Chapter 13. [Google Scholar] [CrossRef]
  62. Statistics Canada. Statistics Canada: Canada’s National Statistical Agency. Available online: https://www.statcan.gc.ca/en/start (accessed on 1 November 2022).
  63. BC Hydro. Hydrometeorologic Data. Available online: https://www.bchydro.com/energy-in-bc/operations/transmission-reservoir-data/hydrometeorologic-data.html (accessed on 1 November 2022).
  64. Pfenninger, S.; Staffell, I. Long-term patterns of European PV output using 30 years of validated hourly reanalysis and satellite data. Energy 2016, 114, 1251–1265. [Google Scholar] [CrossRef] [Green Version]
  65. Staffell, I.; Pfenninger, S. Using bias-corrected reanalysis to simulate current and future wind power output. Energy 2016, 114, 1224–1239. [Google Scholar] [CrossRef] [Green Version]
  66. Jones, A.D.; Ngure, F.M.; Pelto, G.; Young, S.L. What Are We Assessing When We Measure Food Security? A Compendium and Review of Current Metrics. Adv. Nutr. 2013, 4, 481–505. [Google Scholar] [CrossRef] [Green Version]
  67. Smith, L.C.; Subandoro, A. Measuring Food Security Using Household Expenditure Surveys; International Food Policy Research Institute: Washington, DC, USA, 2007; Volume 3. [Google Scholar]
Figure 1. Interactions of the agents in the ABM simulation and corresponding flows.
Energies 16 02614 g001
Figure 2. Proposed modeling framework with modeling inputs.
Energies 16 02614 g002
Figure 3. Farmer agent decision-making process.
Energies 16 02614 g003
Figure 4. Household agent decision-making process.
Energies 16 02614 g004
Figure 5. Microgrid agent decision-making process.
Energies 16 02614 g005
Figure 6. Micro supply chain illustrating the farm-to-farm exchange.
Energies 16 02614 g006
Figure 7. Food waste (kg) of all the farms over a 16-week period with and without Food Exchange.
Energies 16 02614 g007
Figure 8. Weekly electricity demand (MWh) at each microgrid over a one-year time period.
Energies 16 02614 g008
Figure 9. Weekly solar energy (MWh) generated at each microgrid over a one-year time period.
Energies 16 02614 g009
Figure 10. Weekly wind energy (Mwh) generated at each microgrid over a one-year time period.
Energies 16 02614 g010
Figure 11. Weekly electricity sold (Mwh) at each microgrid through a one-year time period.
Energies 16 02614 g011
Figure 12. Weekly electricity purchased (Mwh) at each microgrid through a one-year time period.
Energies 16 02614 g012
Figure 13. Monthly rainfall (m3) at each urban farm for a one-year period.
Energies 16 02614 g013
Figure 14. Weekly irrigation (m3) at each urban farm for a one-year time period.
Energies 16 02614 g014
Figure 15. Food exchange between the urban farms as a result of the food supply chain.
Energies 16 02614 g015
Figure 16. Food Supply at each Urban Farm due to Food Exchange.
Energies 16 02614 g016
Table 1. Produce optimization model for the micro supply chain among the farms.
Variables and Parameters
x i j The number of units shipped from the farm source, i, to the farm destination, j
c i j The cost of shipping one unit from the farm source i, to the farm destination, j
s i The surplus (supply) at the farm source, i
d j The deficit (demand) at the farm destination, j
Objective Function
Transportation Cost = j = 1 n i 1 m c i j x i j
Constraints:
j = 1 n x i j   s i                       i = 1 , 2 , , m
i = 1 m x i j = d j                       j = 1 , 2 , , n
x i j 0         i , j
Table 2. Different possible cases when solving the transportation problem.
Case Equation(s)
I i s i = j d j
II i s i   < j d j , d j n e w d j = d j n e w d j ,   j ,   j J  
j = 1 J d j n e w = i = 1 I s i
III i s i > j d j  
s i n e w s i = s i n e w s i ,   i ,   i I  
i = 1 I s i n e w = j = 1 J d j
Table 3. Farm size and weekly production of vegetables at each urban farm location.
Farm #Size (m2)Production per Week (Kg)
140471341
22023670
38628
420166
564952152
641621379
765562172
889092953
91060352
10593197
1117057
Table 4. Electricity demand and electricity production capacity of the renewable energy source and battery storage capacity at each microgrid.
MG Avg Kwh
Demand/h
Solar Capacity (Kwh)Wind Capacity (Kwh)Battery Capacity (Kwh)
15351600350320
24991500300300
315460010090
49272700600550
53711100250220
67362200650440
78842600550530
8287800200160
95751700500330
105751650450300
116281800400350
Disclaimer/Publisher’s Note: The statements, opinions and data contained in all publications are solely those of the individual author(s) and contributor(s) and not of MDPI and/or the editor(s). MDPI and/or the editor(s) disclaim responsibility for any injury to people or property resulting from any ideas, methods, instructions or products referred to in the content.