1. Introduction
Renewable energy, alternative to conventional resource as fossil fuels, is used to reduce CO2 emissions. Representative renewable energy sources are hydro, photovoltaic (PV), and wind. Their operation cost (especially fuel cost) is almost free (maintenance is necessary). However, they are very unstable: hydro generating has a limit of location, PV can not generate power at night, and wind can not be controlled by the demand. This means that a “controllable” renewable energy = woody biomass is necessary.
IEA reports that the demand for biomass energy in 2050 with a net zero emission scenario is almost 100 EJ [
1]. This value is almost one-third of the total energy demand in the world in 2050. The available biomass energy is from 200 EJ to 500 EJ. Then, the potential of biomass energy is enough for the demand. In any case, in renewable energy usage, the problem is the “low density” of the energy. As the renewable energy density is very low, we have to design the user locally. In this paper, the Japan case is analyzed.
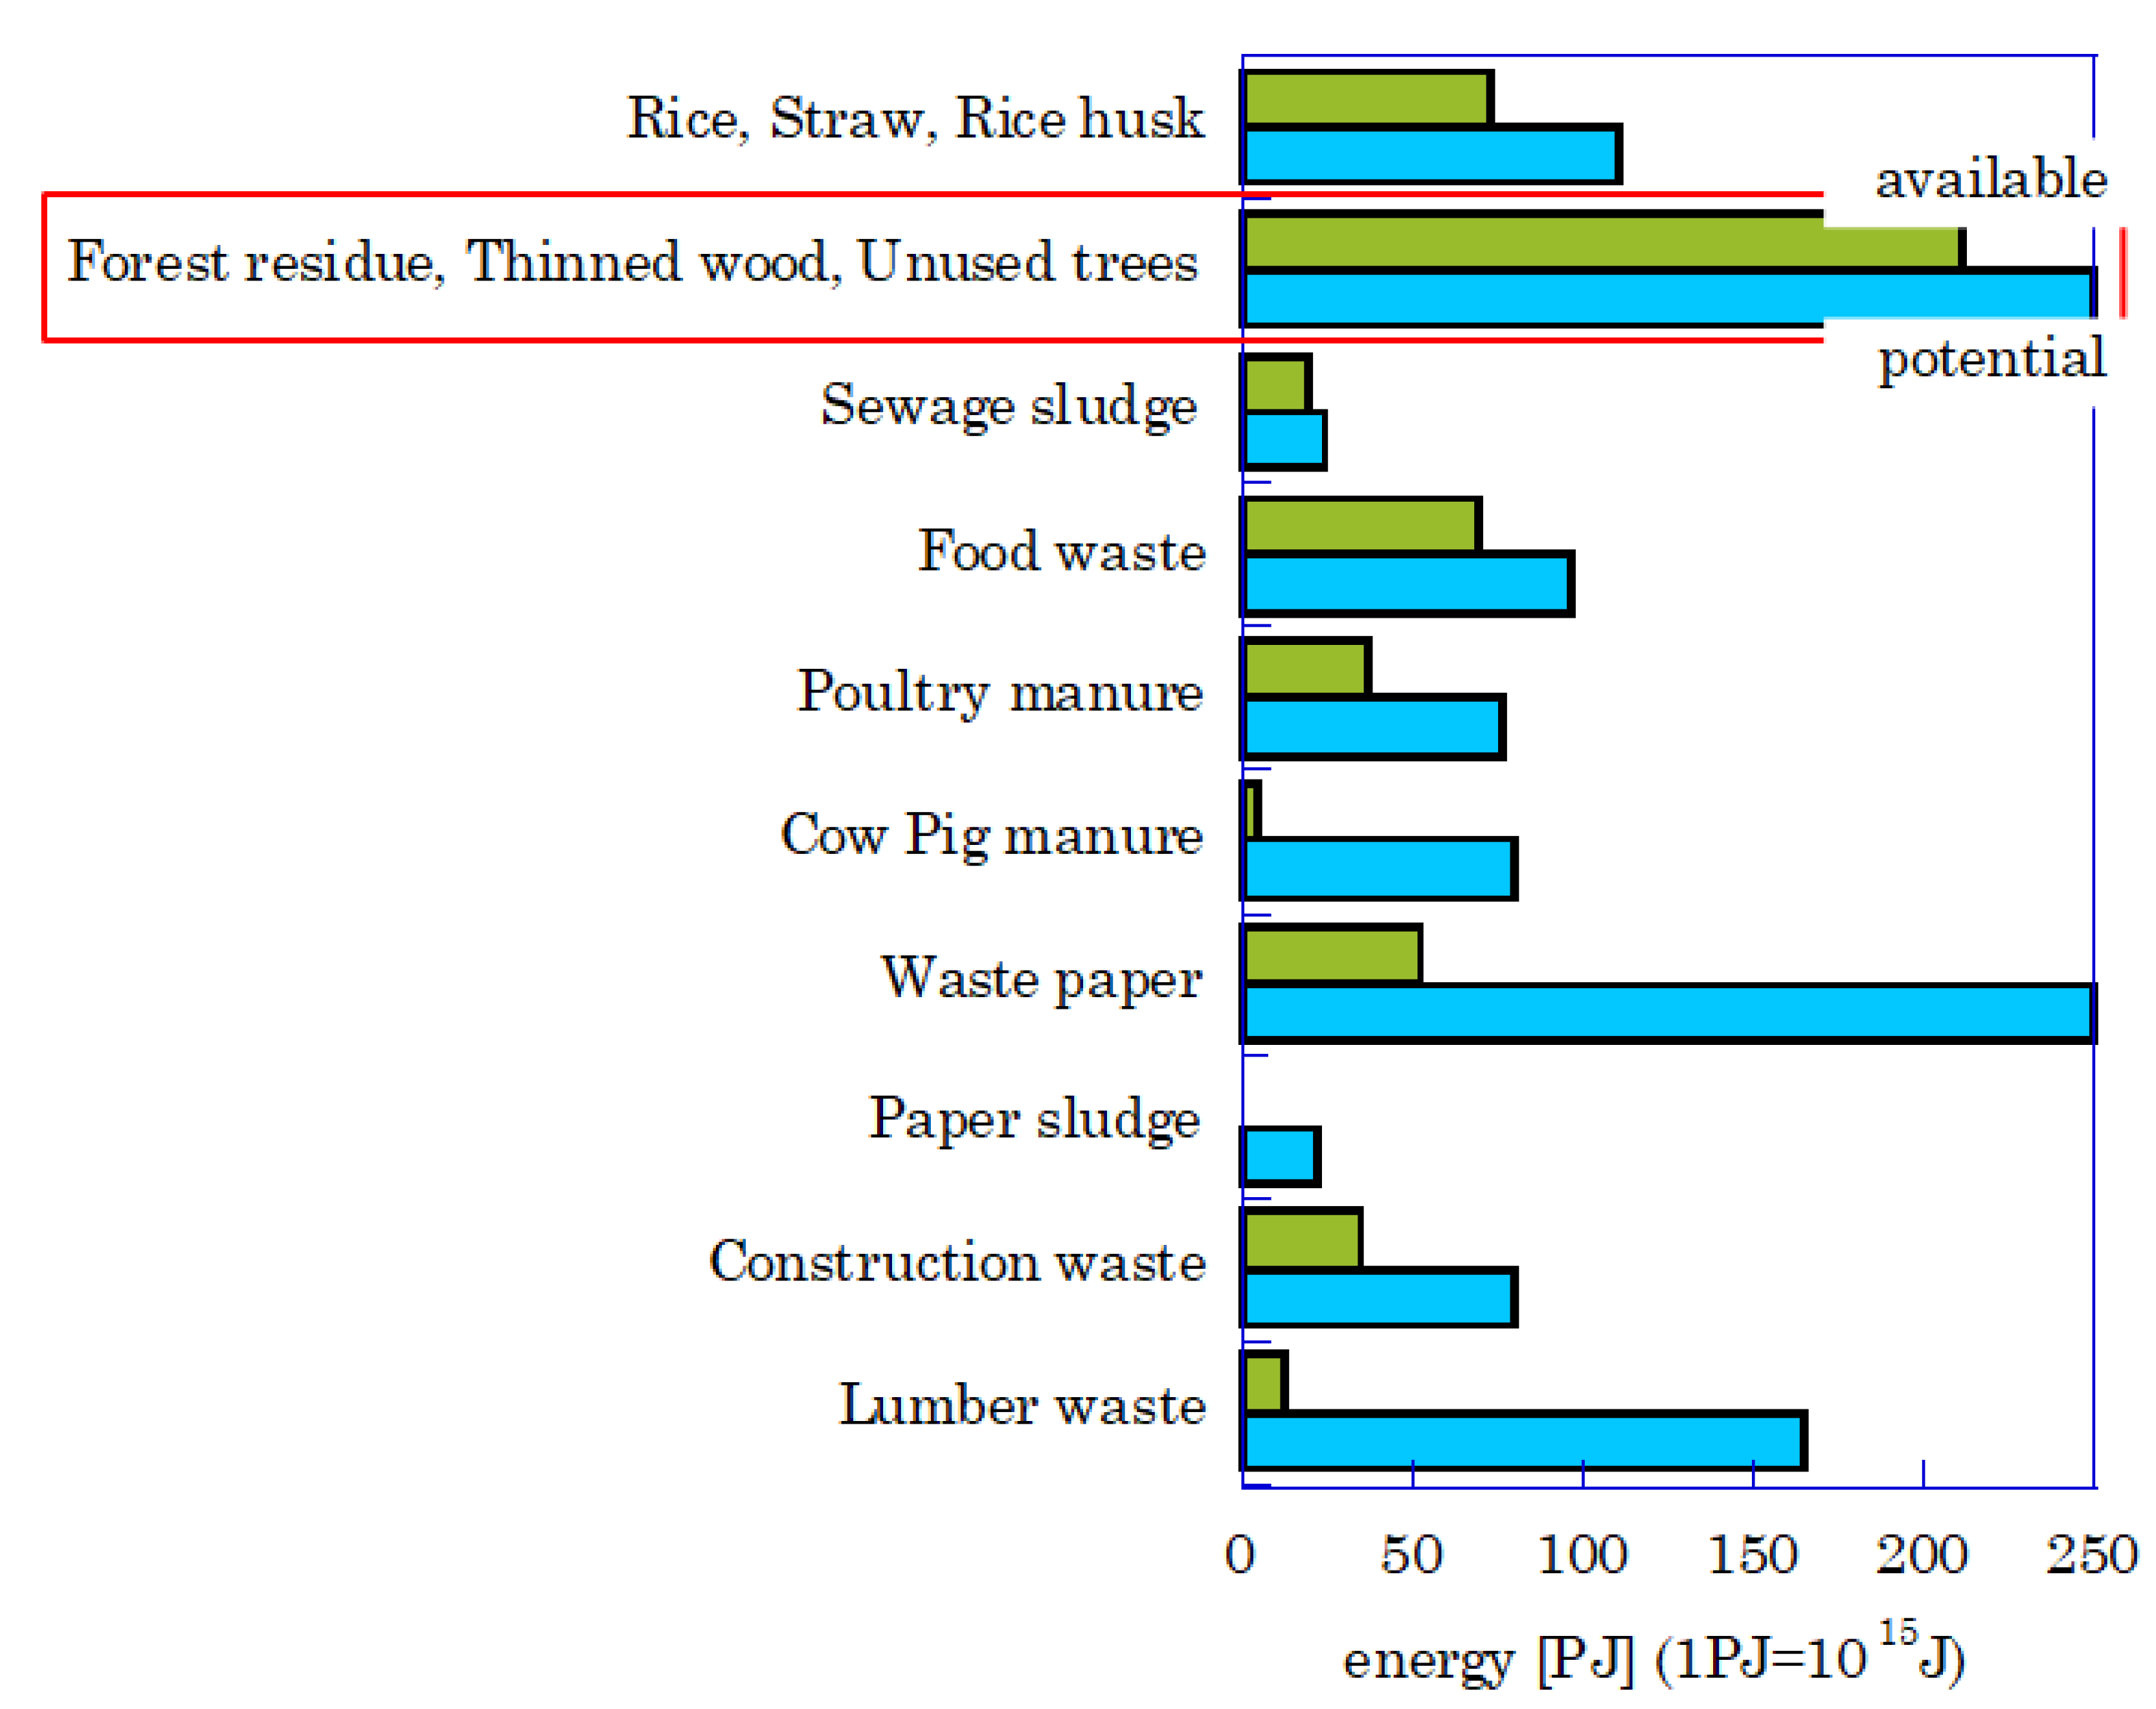
Each biomass energy amount (available and potential ones) in Japan is shown in
Figure 1 [
2]. The waste paper has a large potential amount. However, the available one is not much because the recycling system of waste paper is well integrated because of its long history. The woody biomass (red square) has almost the same potential as the waste paper, but the available one is large. In Japan, poor wood is thinned by one leaf in the forest because wood is used as a material for building/furniture. If the left wood (unused tree) could be used as energy with high efficiency, the CO
2 emission could be reduced.
To use these unused trees/wood in Japan, gasification with the reciprocating engine is effective. Generally, biomass fuel for power generation is used with the direct combustion method and with the gasification method. A steam turbine is used for the direct combustion method [
3]. A gas turbine and a reciprocating engine are used for the gasification method. In order to evaluate these methods, energy security is important first. In Japan, (1) the resource for power should be imported from a foreign country, and (2) a lot of natural disasters, such as earthquakes or typhoons, occur frequently. Then, distributed small power plants should be suitable. For a small power plant, a gas turbine/reciprocating engine should be better. Secondly, Japan has a lot of mountains. Then, it is not easy to collect woody resources from a large area. As a large steam turbine is necessary for high efficiency, it is impossible to use a steam turbine. Yoshioka (2006) et al. reported Japan’s high transportation cost in comparison with European countries [
4]. In the report, the reasons for the high cost are (1) the ratio of the mountain on the ground is large, (2) the length of the work path in the forest is not enough, and (3) few machines for forest work are introduced. From these analyses, a reciprocating engine with a gasifier is suitable for Japanese requests. Especially a general-purpose engine is better for the power plant because of its easy maintenance and easy availability [
5].
The fuel for a general-purpose reciprocating engine is normally gaseous or liquid. For the gasification method, Bridgwater, A.V. (2012) tried to calculate the production component ratio via thermal decomposition [
6]. In the report, (1) the fast thermal decomposition should make a liquid fuel that has almost 75% of input energy, (2) the liquid fuel has too much water to operate the reciprocating engine. On the other hand, in the case of gaseous fuel, the exchange ratio from wood energy to gas fuel energy (cold gas efficiency) could be almost 85%. Then, for the power plant, the combination of the gasifier and reciprocating engine with spark ignition is better.
Normally, the power plant has legal regulations for emissions to control the environment. The main regulated materials are CO
2, NOx (nitrogen oxides), HC (hydrocarbon), soot, and CO. In the usage of woody biomass, the CO
2 emission could be ignored because the wood will absorb CO
2 during growth. Nadaleti et al. (2018) operated a reciprocating engine that produced gas from wood (bio-syngas) [
7]. As a result, they reported that the exhaust had much CO in comparison with the usage of natural gas and fermentation gas. Arroyo et al. [
8] operated a reciprocated engine with a mixed fuel of H
2, CO, CO
2, and CH
4 and reported that the CO emission is higher compared to CH
4 or fermentation gas-fueled condition. In these reports, the reason is not clear. As CO is combustible, CO should be burned perfectly. Moreover, CO emission is very limited legally because of CO toxicity.
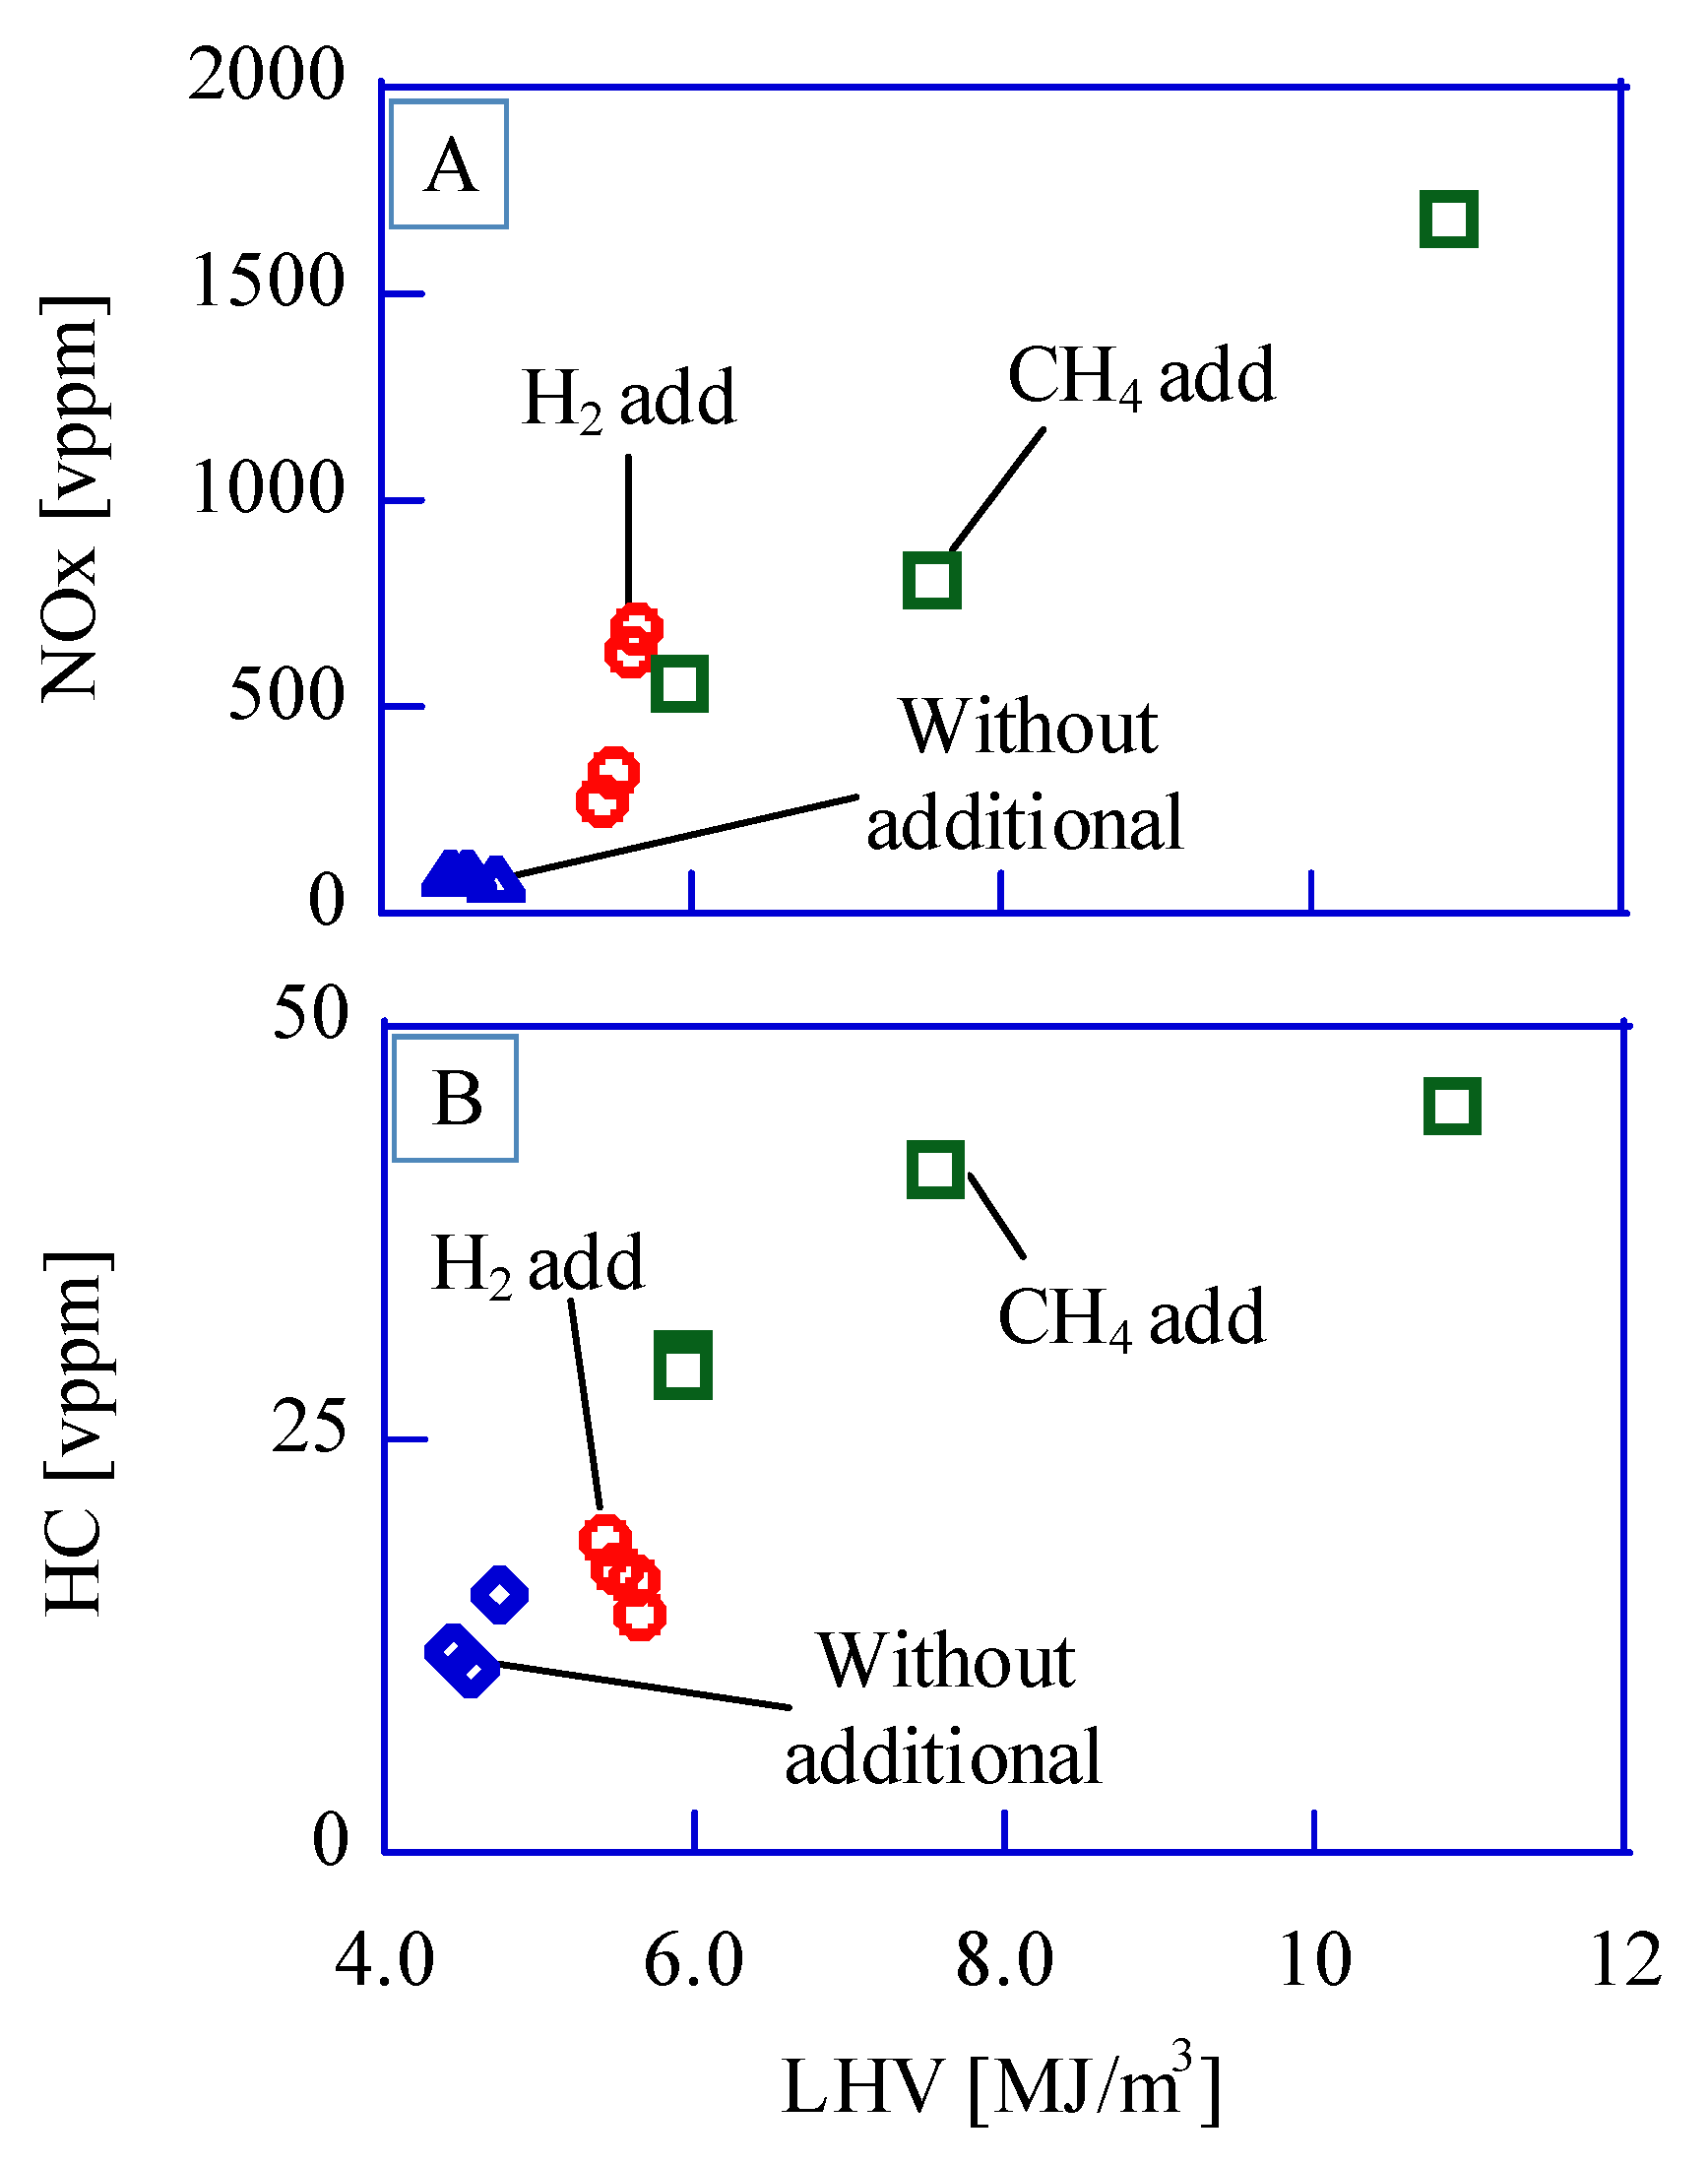
We tried to control the emissions (CO, NOx, and HC) with fuel-low heating value (LHV). These emissions are regulated in any country because of their toxicity. Methane or hydrogen is added to control the fuel’s low heating value. The based bio-syngas have almost 4.5MJ/m
3-LHV. In
Figure 2, the results of emissions (NOx and HC) from the reciprocating engine with a bio-syngas show that NOx density in the case of “without additional (= bio-syngas only)” is very low, less than 200 vppm. Tokyo metropolitan government regulates the NOx emission of less than 500 vppm [
9]. The combustion temperature in the chamber should be lower because of the low LHV of bio-syngas in comparison with fossil fuels such as natural gas or gasoline. In the case of additional methane or hydrogen, NOx density is larger with larger LHV. A simple reduction method with urea will be used for NOx removal because of its cost efficiency. The HC density in the case of only bio-syngas and that of hydrogen additional is less than 20 vppm because the methane ratio in bio-syngas is less than 2.0 v%. Shah et al. reported that the HC ratio in the exhaust was less than 40 ppm when they operated a reciprocated engine with a bio-syngas of 5.8 MJ/Nm
3-LHV from wood biomass [
10]. The soot density is also very low for the same reason, low hydrocarbon density in fuel.
On the other hand, the CO ratio in bio-syngas is more than 17.0 v%. This means that the CO in fuel should be exhausted “without perfect combustion” (unburned). State-of-art reciprocating engine for automotive has few gaps in the combustion chamber. These few gaps realize the lowest emission and highest thermal efficiency. However, a general-purpose reciprocating engine should be low cost, have easy maintenance, and have long durability, and the regal regulation is not severe in comparison with automotive emission. For example, emissions from a generator of less than 19 kW output are not regulated in Japan. Then, such a general-purpose engine has a large gap in the chamber. The gap should cause the unburned emission. The main region of the unburned volume is the piston crevice, which is the gap between the piston head and cylinder wall. Namazian et al. (1982) experimented with a reciprocating engine fueled with gasoline and propane to evaluate the HC emission [
11]. They concluded that the unburned emission should be caused by (1) an unburned mixture in the crevice, (2) quenching near the chamber wall, (3) blending the fuel vapor to the oil sheet on the chamber wall, (4) bulk quenching in the chamber. In this experiment, the unburned weight ratio caused by the crevice was 7% of the input mixture weight. The quenching volume near the wall could be evaluated with the thermal boundary layer, as reported by Monteiro et al. [
12]. In this report, the quenching distance of a mixture of H
2, CO, CO
2, CH
4, and N
2 is larger than that of methane. This means that the quenching distance should be considered for the unburned emission.
These previous studies show that it is not easy to achieve a stoichiometric operation for maximum power because of unburned CO. Generally, a stoichiometric mixture should be used for the maximum power operation. This paper aims to find the reason for unburned emissions, especially CO, from general-purpose reciprocating engines operated with bio-syngas. The evaluated mechanisms are (1) bulk quenching and (2) the effect of the crevice and of the thermal boundary layer near the wall.
2. Experimental Methodology
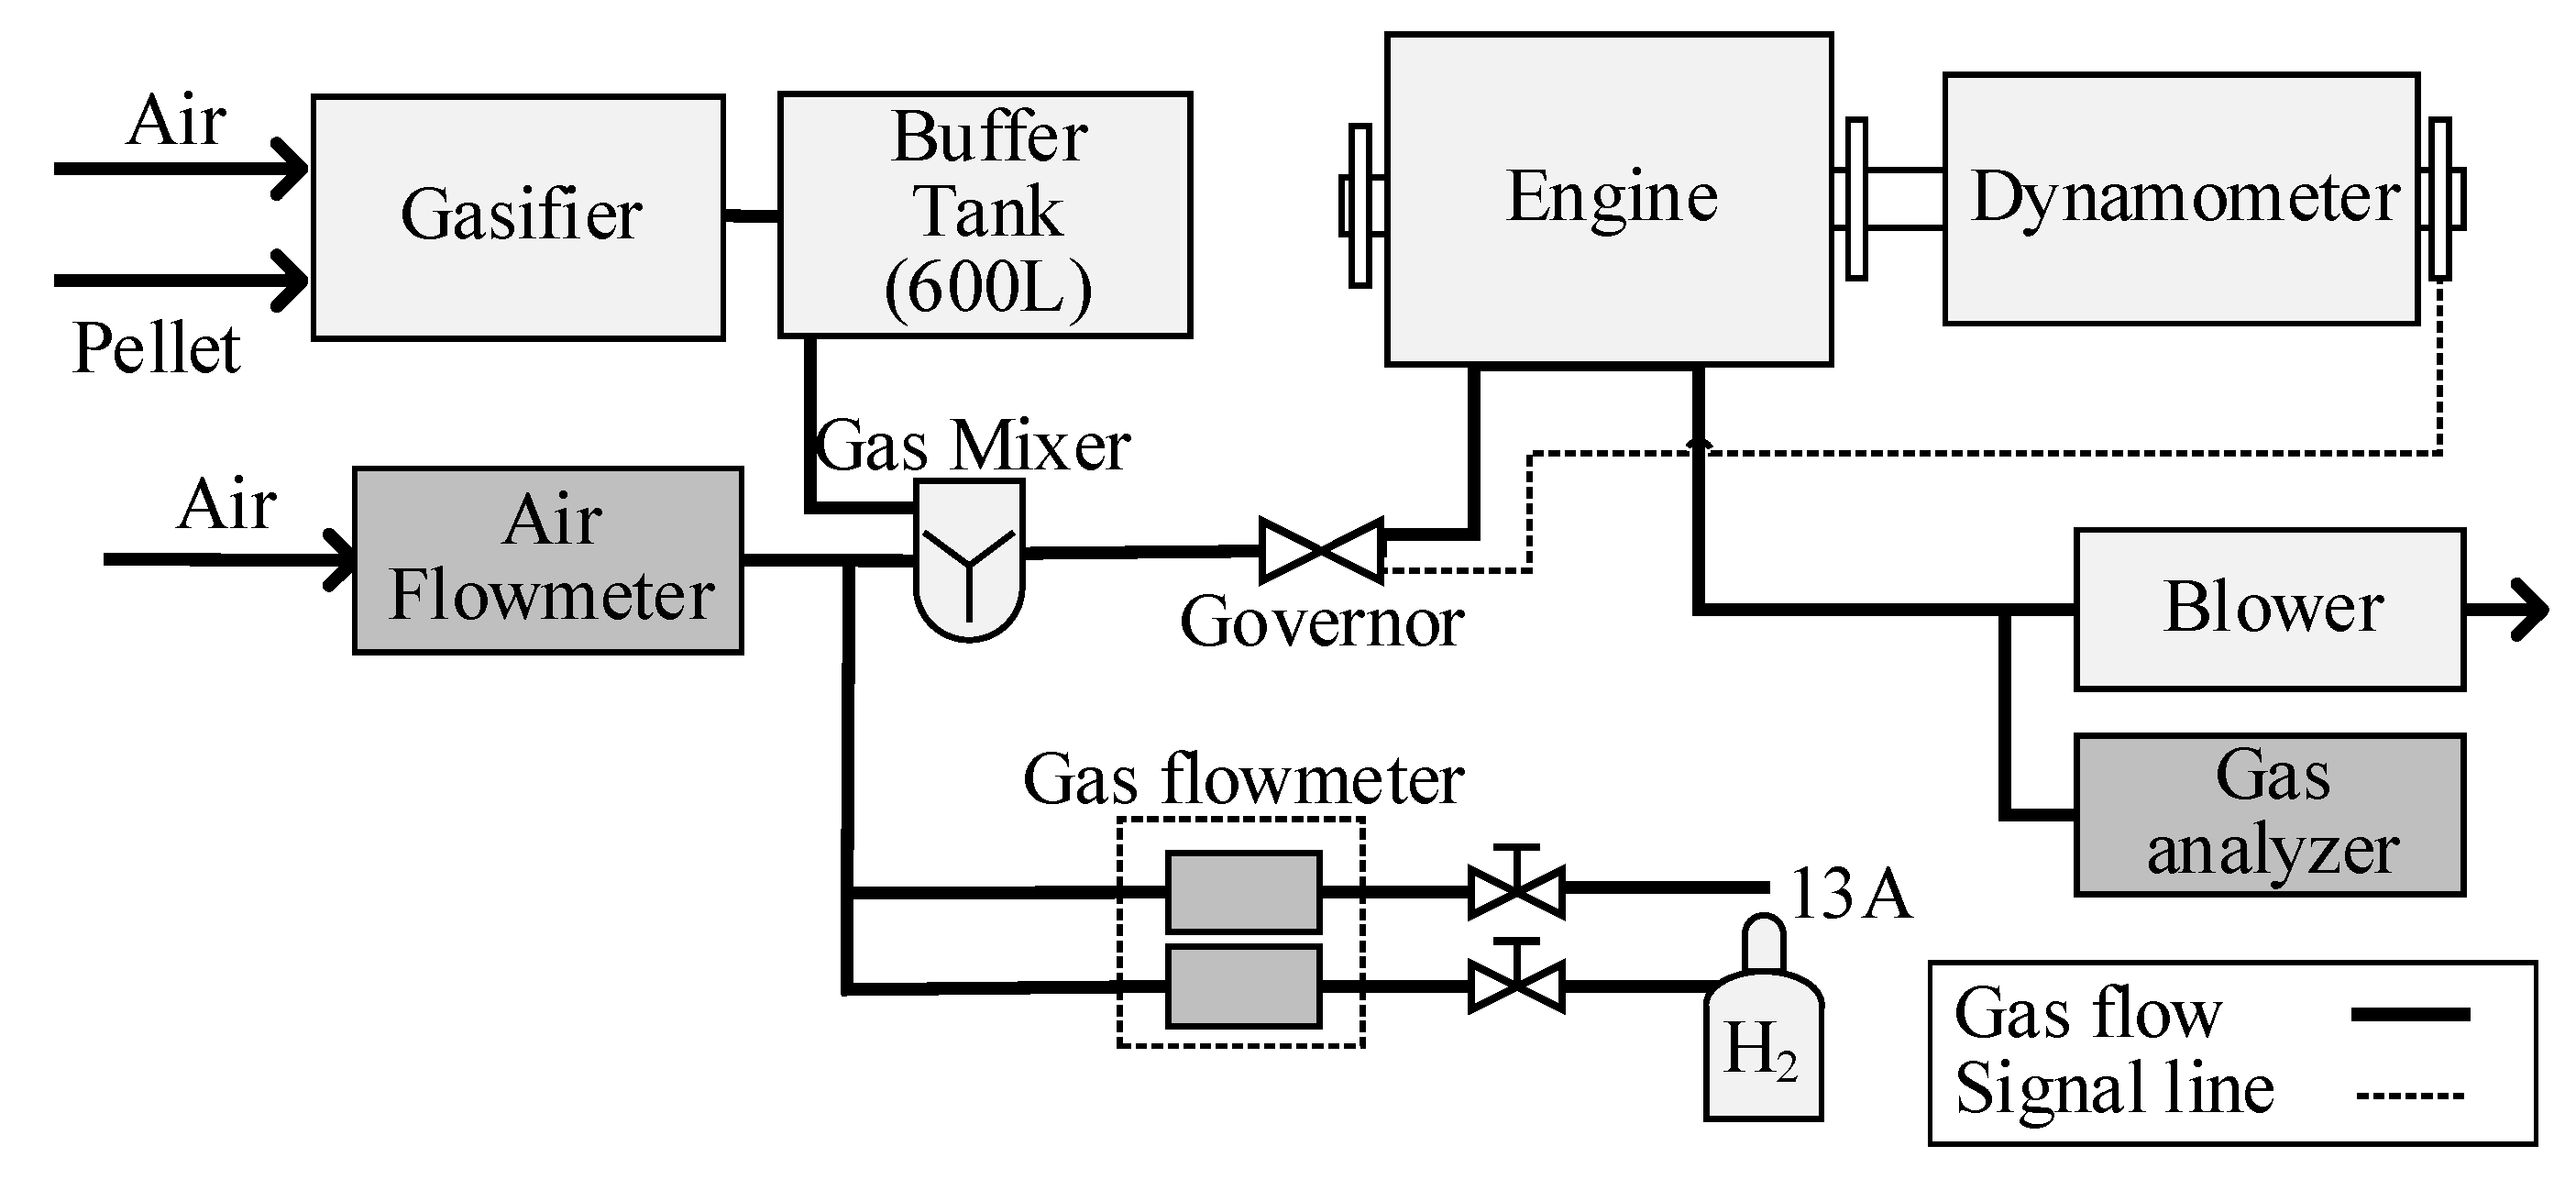
A self-made gasifier is used for this experiment [
13]. A commercial pellet of Japanese Ceder (6 mm diameter, 15 mm length, 8%-moisture content, shown in
Figure 3) is used for the gasifier fuel. This pellet is available easily in Japan. In this experiment, a pellet from Toyama prefecture is used.
Air is used as the oxidant for the gasifier. All the producer gas and bio-syngas, shown in
Table 1, are supplied to the reciprocating engine, Kawasaki FD750D. The FD750D is modified into a single cylinder. The main operating conditions are in
Table 2, and the experimental schematic is in
Figure 4. The details are the same as Enomoto et al. (2020) [
13]. The excess air ratio in the cylinder is adjusted from 1.2 to 1.3. The bio-syngas flow rate is adjusted by the supply of air to the gasifier. The LHV of supplied fuel mixture to the reciprocating engine is changed by additional alternative methane (city gas 13A) or hydrogen. The components are in
Table 3 (with CH
4) and
Table 4 (with H
2). The engine speed is adjusted to 1800 ± 22.5 rpm. The indicated mean effective pressure (IMEP) is 500 ± 20 kPa to avoid engine stall. The ignition timing is adjusted for each condition to achieve the minimum covariant of IMEP, and the maximum indicated thermal efficiency [
13]. Horiba MEXA-584L is used to measure the volume ratio of NOx, HC, CO, and CO
2 in exhaust gas.
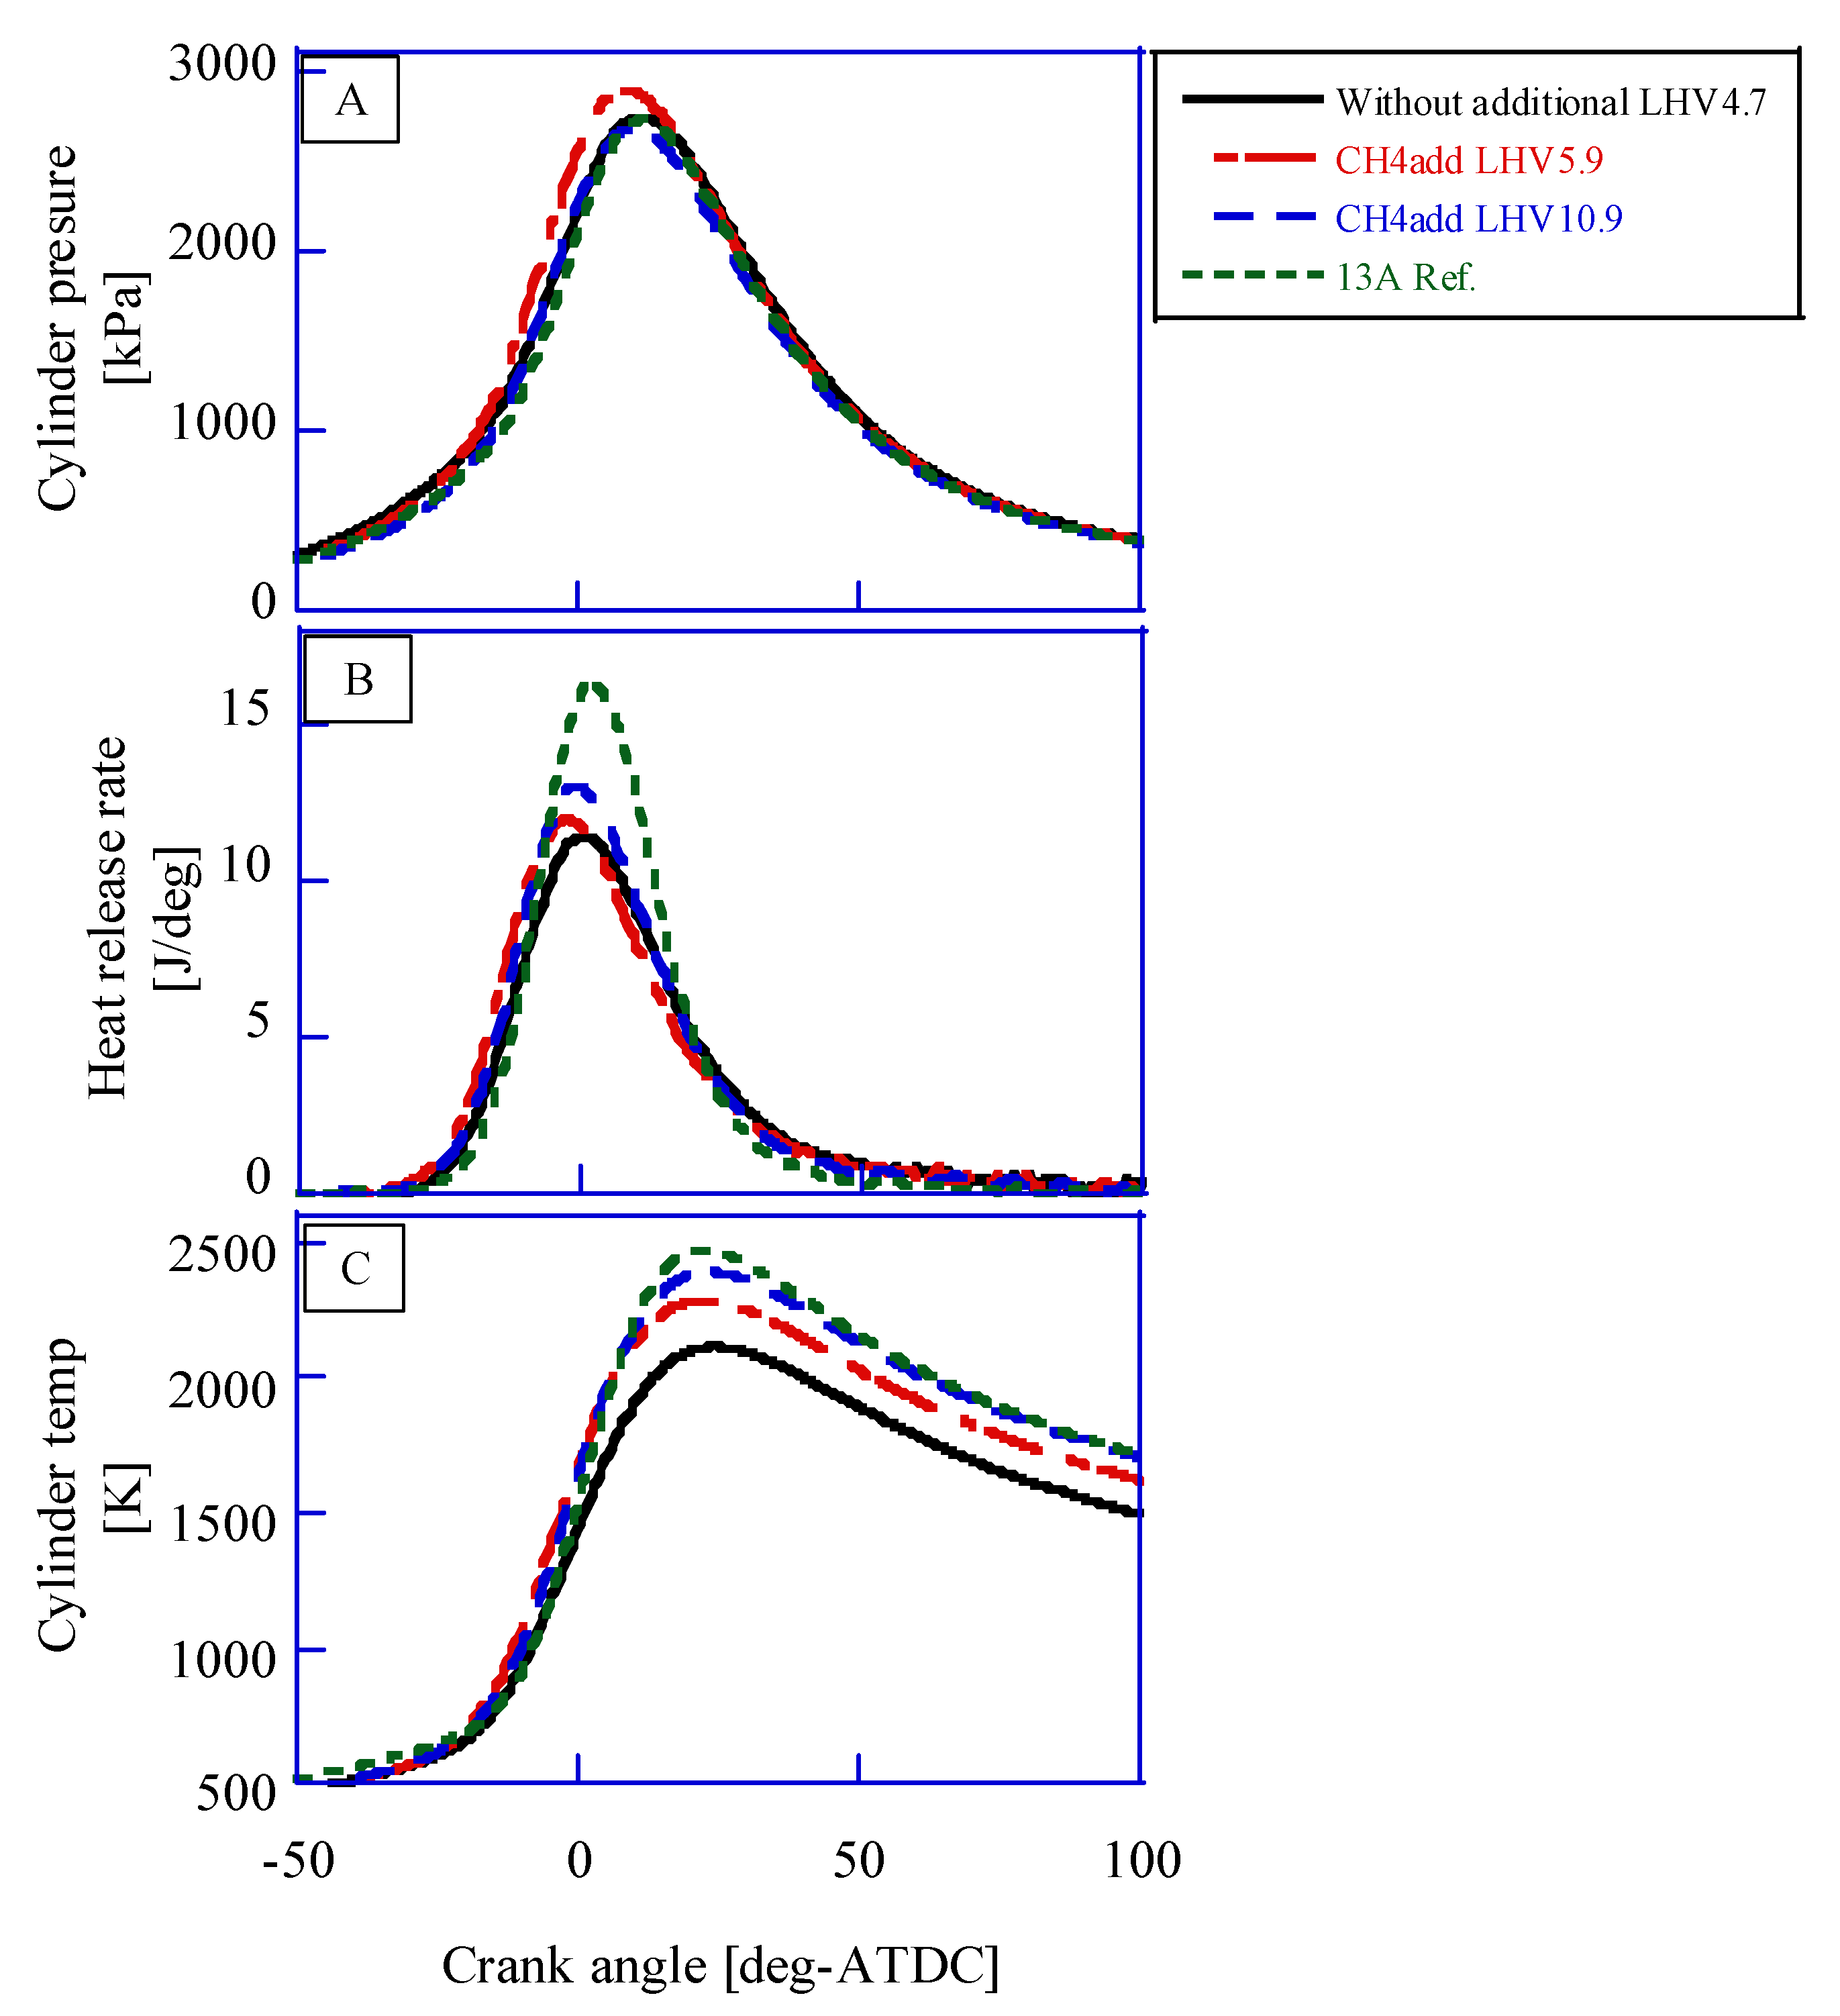
Kistler 6118CF-5CQ03S4-2 is used to measure the cylinder pressure. The pressure signal is recorded with a charge amplifier (Kistler 5018A). The combustion analyzer, Yokogawa 720340, with data logger DL850, is used. In this analysis, it is assumed that the fuel (combustible gas) in the cylinder should be completely burned (see
Supplementary Materials). In order to evaluate the analysis results, the calculated cylinder temperature is compared with Kan et al. (2018) [
14]. The cylinder pressure (A), the heat release rate (B), and the cylinder temperature are shown in
Figure 5 (methane additional) and
Figure 6 (hydrogen additional). Kan et al. reported the results of CFD with KIVA4. The calculated cylinder temperature is adequate because it is almost the same as Kan’s results.
A chemical kinetics simulation is used to consider the unburned component. GRI-Mech 3.0, Aramco mech 3.0, and Foundational Fuel Chemistry Model (FFCM-1) [
15] are evaluated as the kinetic model because the carbon number in the fuel is small. In the kinetics analysis, the larger number of elementary reactions shows a more detailed mechanism. However, too many elementary reactions need too much time for analysis. Though Aramco-mech has 3037 elementary reactions, some of them should not be important for our phenomena. In the general-purpose engine, turbulence in the chamber is not so strong that a laminar flame speed should be important. Then, laminar flame speed is calculated with these three kinetic models. The mixture components are 1.01 v%-CH
4, 6.86 v%-CO, 6.35 v%-CO
2, 7.66 v%-H
2, 0.62 v%-H
2O, 65.75 v%-N
2, 11.74 v%-O
2, the same as 1.3-EAR with bio-syngas. The initial pressure and the initial temperatures are 500 kPa and 500 K, respectively. As a result, the FFCM-1 case shows 98.6% of Aramco-mech cases. GRI-Mech case shows almost 84% of Aramco-mech cases. Varghese et al. (2019) also report that FFCM-1 is more accurate than GRI-Mech [
16]. Then, FFCM-1 is used for our CHEMKIN calculation. The mixture in the combustion chamber is assumed as perfectly mixed. The calculation model in CHEMKIN is a 0-dimensional premixed one.
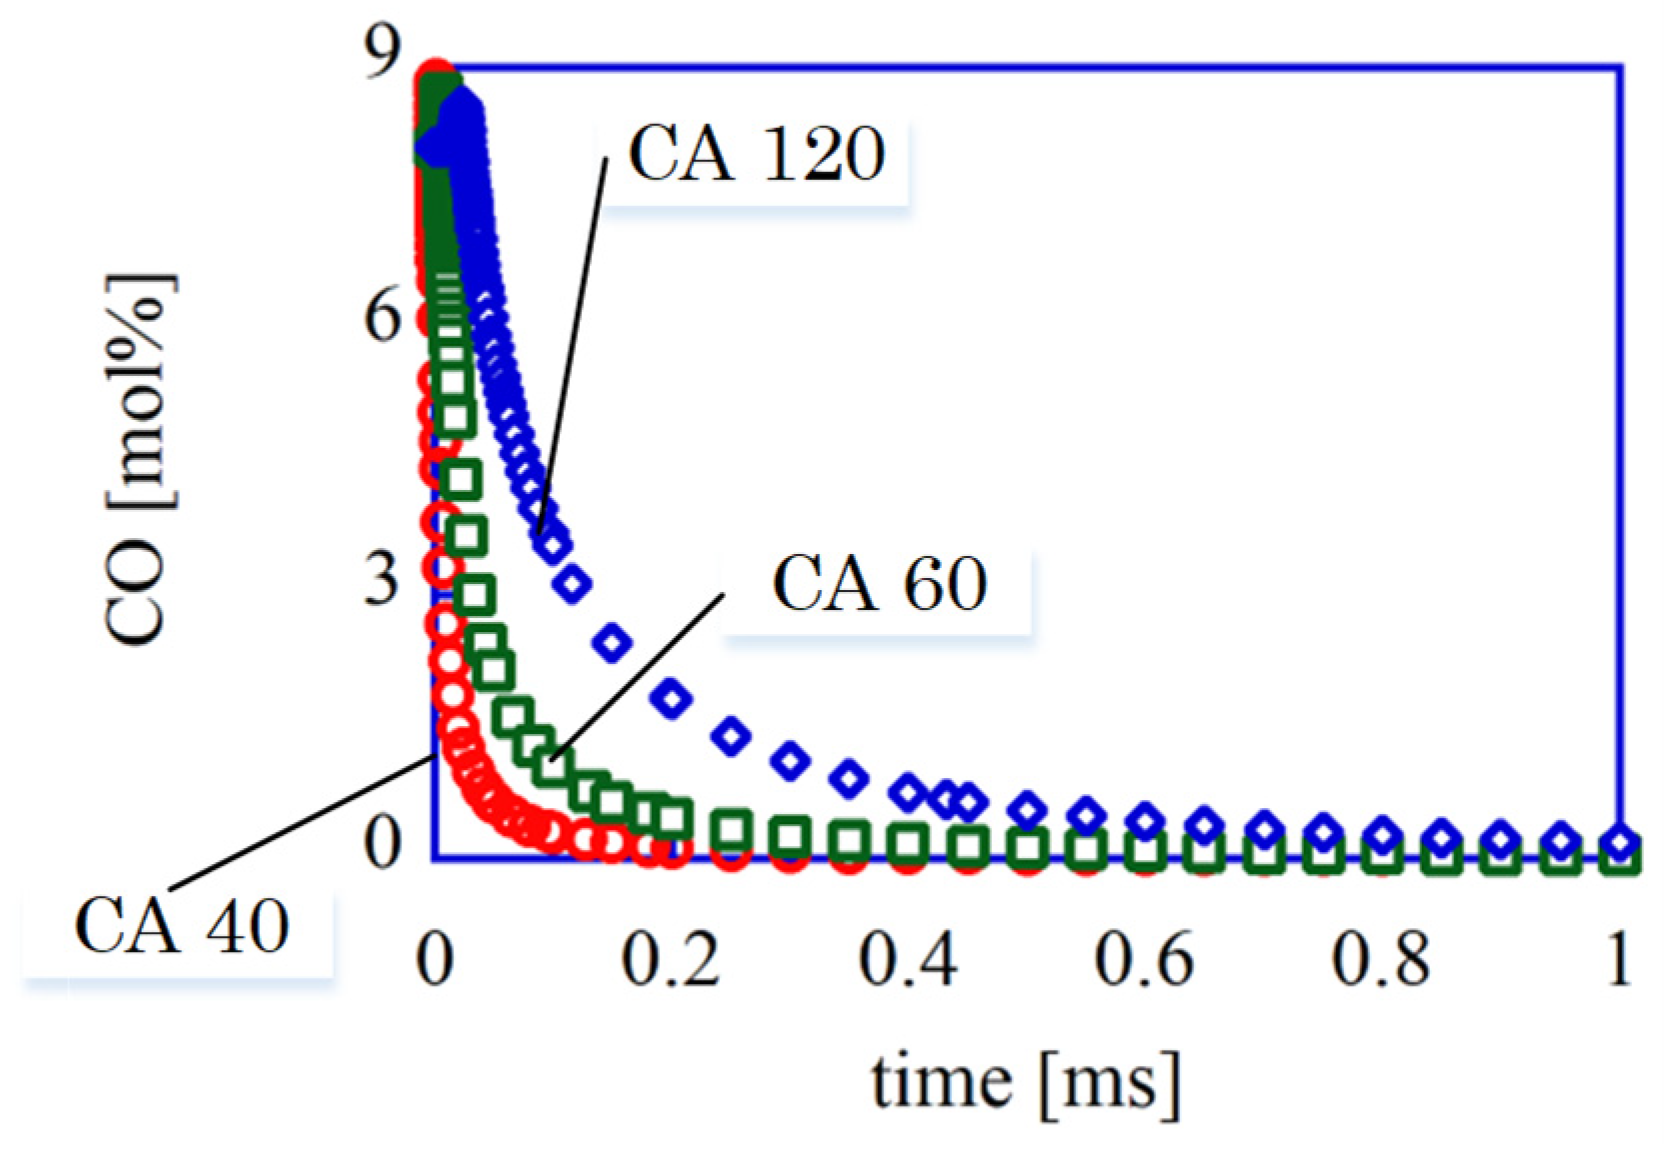
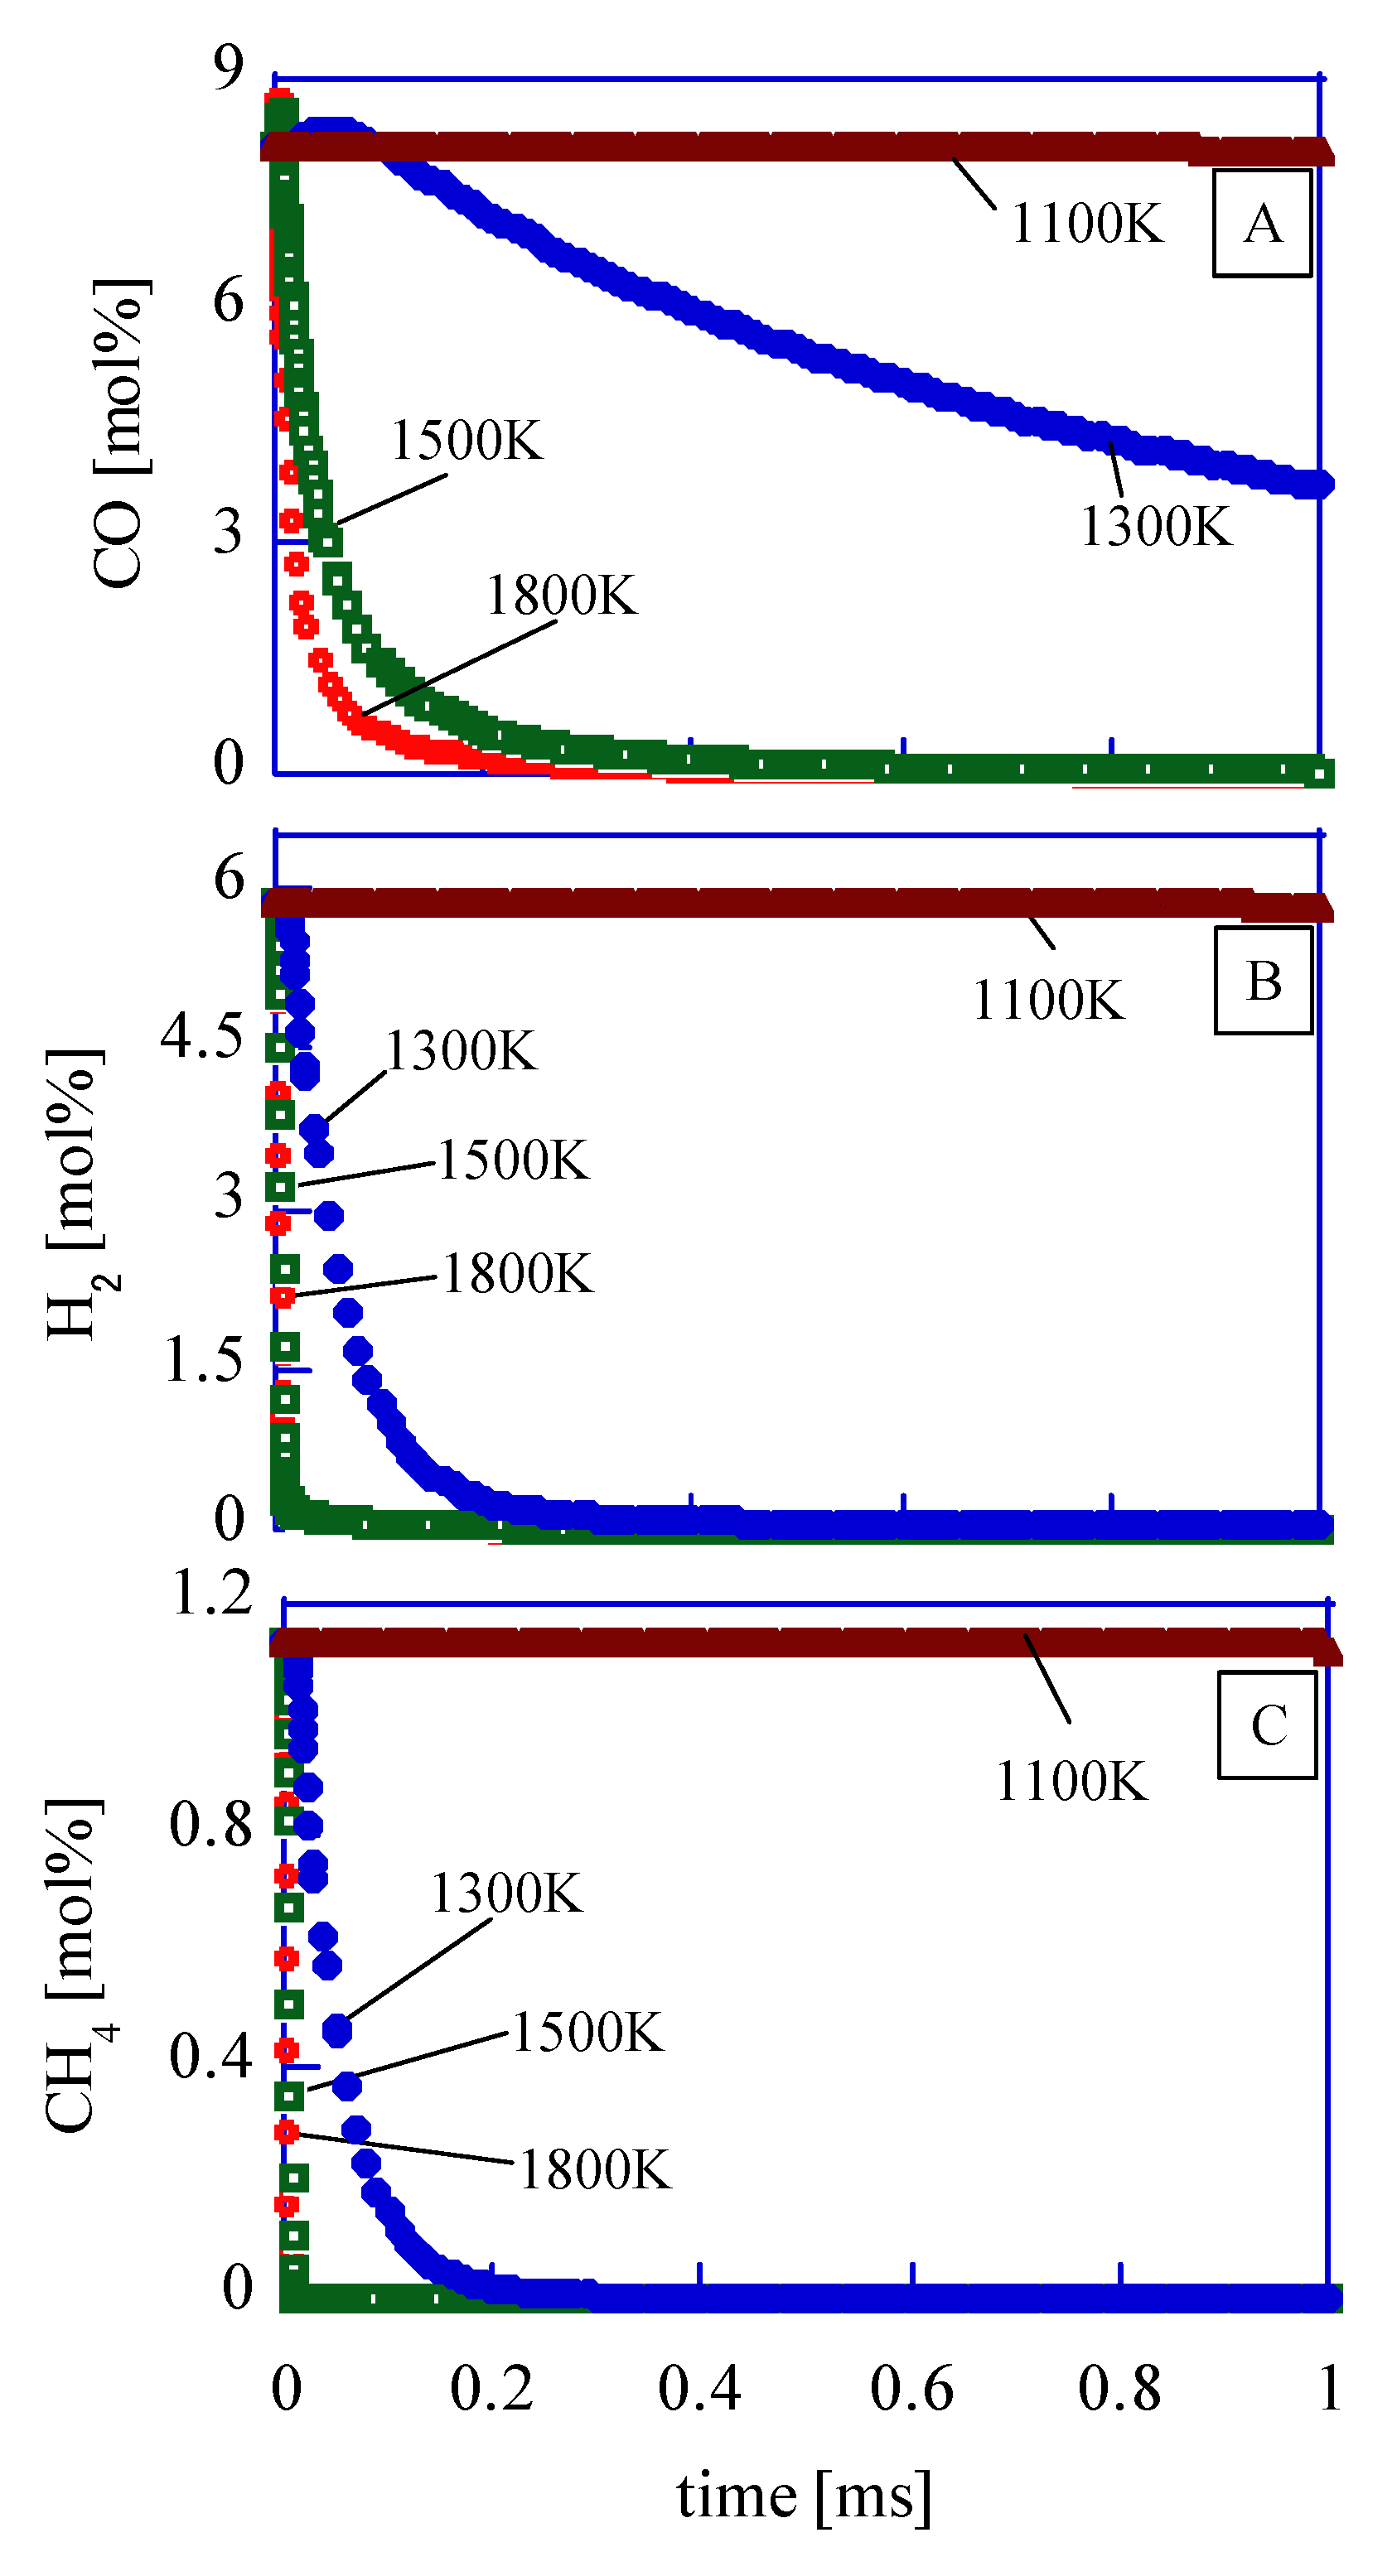
Table 5 shows the condition to evaluate the bulk quenching effect on the unburned component. In the expansion of the cycle, the pressure and the temperature in the cylinder should decrease. Then, bulk quenching could occur. The time histories of the heat release rate in
Figure 5 shows that the heat release finishes at almost 60 deg-ATDC. If the reaction rate at this condition is too low, a bulk quenching could occur. In order to evaluate the reaction rate, the conditions at 40 deg-ATDC, 60 deg-ATDC, and 120 deg-ATDC are used. The FD750D exhaust valve opens at 136 deg-ATDC. If the reaction rate at 120 deg-ATDC, just before the exhaust valve opening, is large enough, the bulk quenching could be ignored.
Table 6 shows the conditions to evaluate the quenching in the thermal boundary layer under the same pressure condition. As the chamber wall is water-cooled, a thermal boundary layer should be considered. In the thermal boundary layer, quenching should occur because the wall temperature is less than 500 K. To find the quenching temperature in the layer, 1800 K, 1500 K, 1300 K, and 1100 K are used. As the flame in the chamber should arrive at the wall at 60 deg-ATDC, the largest temperature of 1800 K is used. The pressure is the same at 60 deg-ATDC.
The accuracy of the measurement is in the supplement. Most measurement equipment has almost 10% relative error.
Table 7 shows the important parameter errors calculated with (S46) and (S47) in the
Supplementary Materials.
3. Results and Discussion
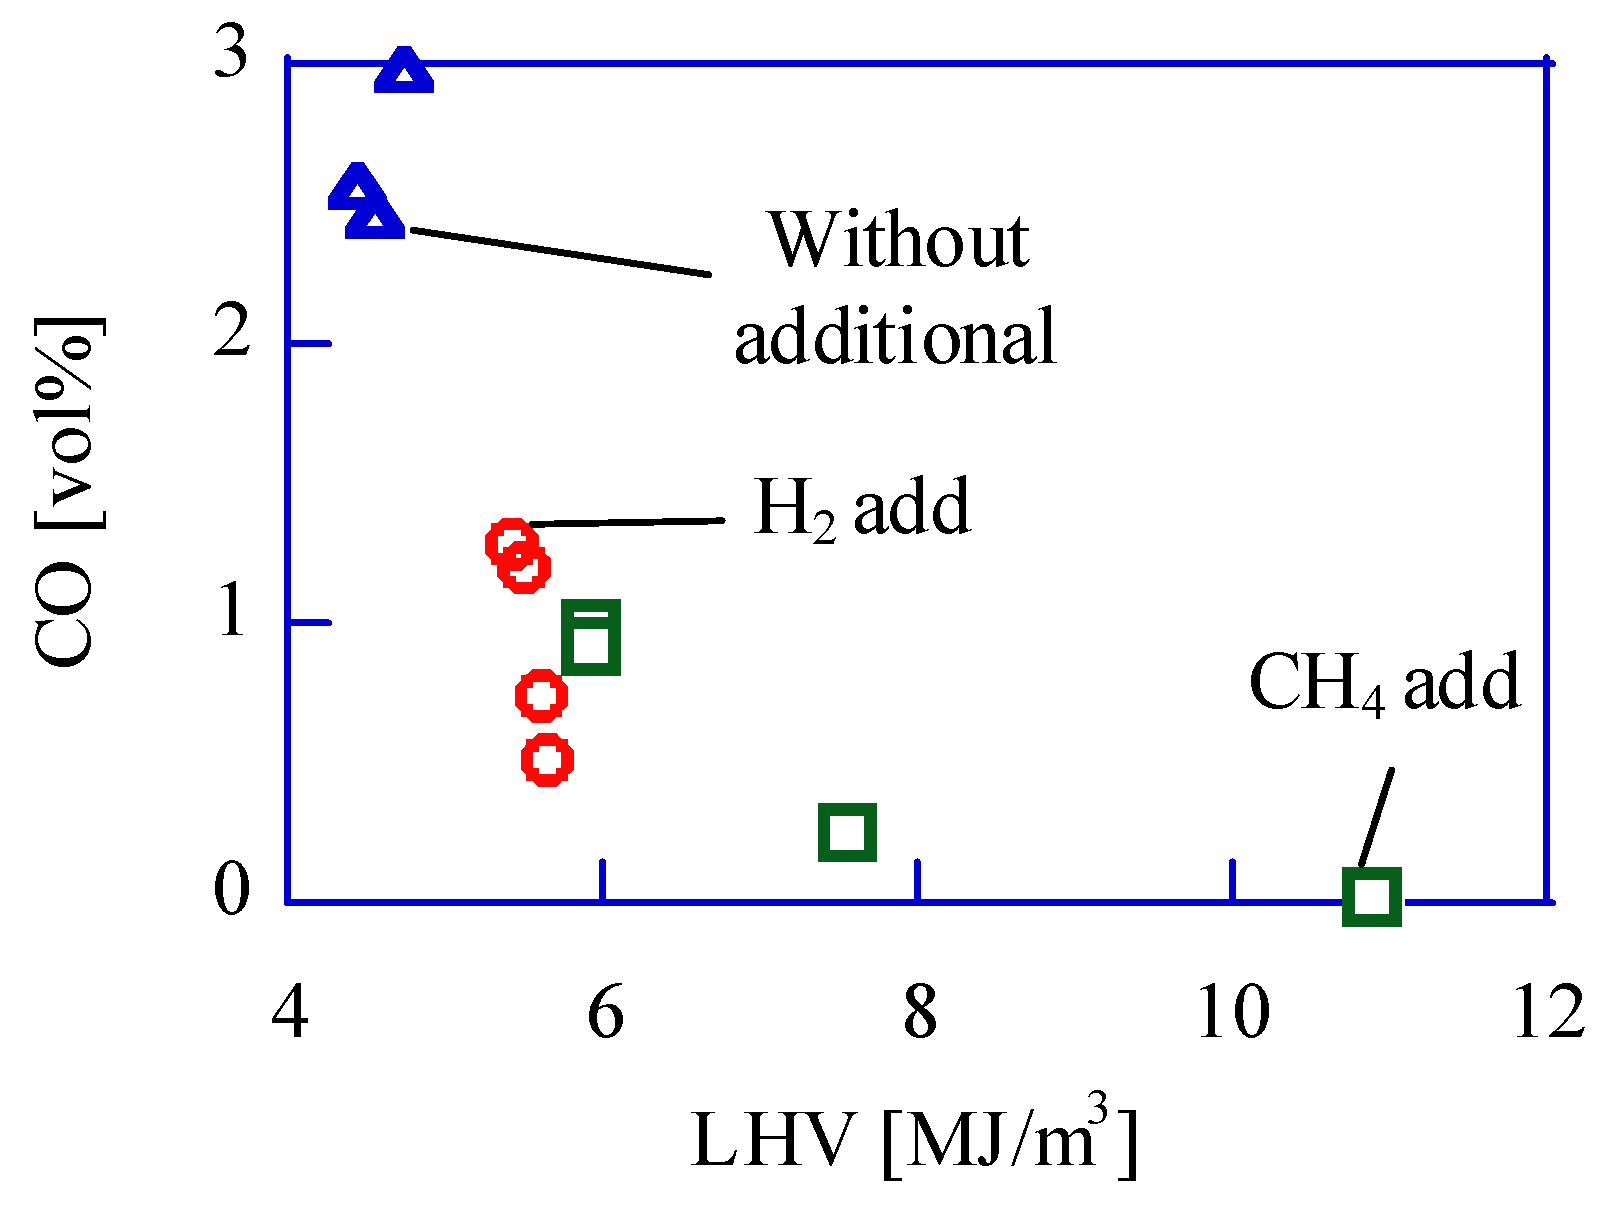
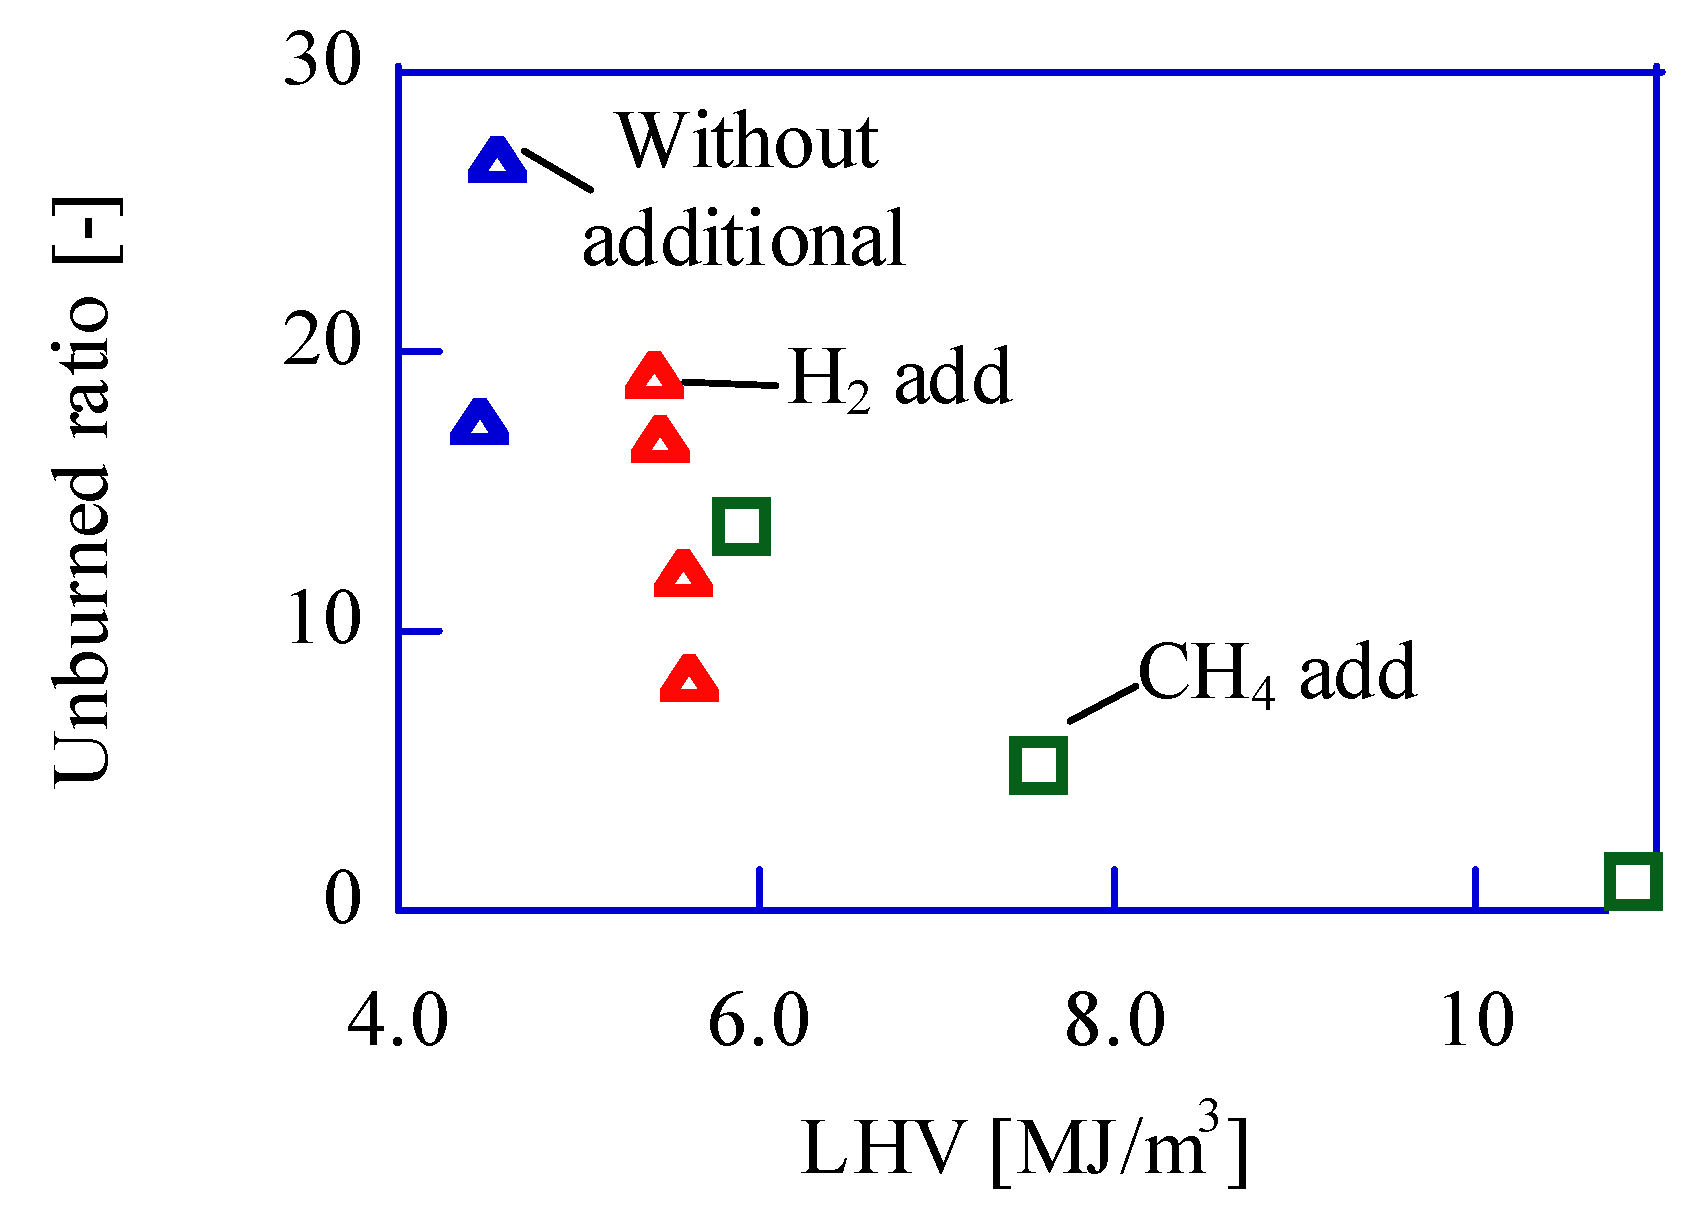
The relation between the LHV of fuel and the CO volume ratio in emission is shown in
Figure 6. In the case of methane addition, the LHV is more than 7.0 MJ/Nm
3, and the CO ratio in emission is less than 0.2 v%. If the LHV is less than 5.0 MJ/Nm
3, the CO ratio is more than 1.0 v%. The LHV of bio-syngas is almost 4.5 MJ/Nm
3 in the previous papers [
17,
18,
19]. In case of such low LHV, the temperature during combustion should be low. The CO emission should increase under low-temperature combustion because of quenching. In the reciprocating engine, the low-temperature condition will occur (1) at the expansion and (2) near the wall.
The calculated time histories of the CO mol fraction are shown in
Figure 7. The calculation conditions are in
Table 5. In the case of 60 deg-ATDC (1800 K), the CO fraction is almost zero at 1.0ms after the reaction start. 1.0ms is the same as 10.8 deg-crank angles at 1800 rpm-engine speed.
This means that the condition of 1400 K and 315 kPa at 60 deg-ATDC is enough for complete CO combustion. The experimental result that the heat release rate is almost zero at 60 deg-ATDC shows the same phenomena. Even if the unburned component remains at 120 deg-ATDC, these unburned components should be burned completely because the exhaust valve opens at 136 deg-ATDC, and the reaction time is more than 1.0 ms. Then, the bulk quenching doesn’t occur.
In order to evaluate the reaction rate in the low-temperature region, the time histories of CO, CH
4, and H2 in the chamber are shown in
Figure 8. The mixture components are as
Table 6. As a result, at 1100 K, these three components’ densities are not changed. This means that the region with lower than 1100 K is the quenching region. The components in the quenching region should be exhausted as an unburned mixture.
In order to evaluate the unburned volume ratio experimentally, the CO volume ratio (
rVj.exh) was measured with the exhaust gas analyzer as Equation (1). The relation between the LHV and the calculated unburned ratio is shown in
Figure 9.
To calculate the weight ratio near the wall, the temperature distribution near the wall is necessary. From the unburned volume ratio in
Figure 9, equations that could consider the cylinder pressure and the cylinder temperature is necessary because the difference in the LHV means the difference in chamber condition. The experimental equation by Ishizawa et al., Equation (2) which has parameters of the pressure and the temperature, is used [
20]. (1) Definition of the parameters
apress and
btemp in Equation (2), (2) thermal boundary layer calculation for the parameter
K1, (3) calculation of unburned volume with a hollow cylinder control volume method is performed.
Equation (2) shows the effect of pressure and temperature on the quenching distance. In this experiment, it is assumed that the wall temperature is the same as the coolant temperature because the engine is water-cooled. The parameters
K1,
apress, and
btemp should be determined but depend on fuel condition or mixture condition. In Equation (2), the effects of
apress and
btemp are larger than
K1. Then, the
K1 is assumed as constant in this experiment.
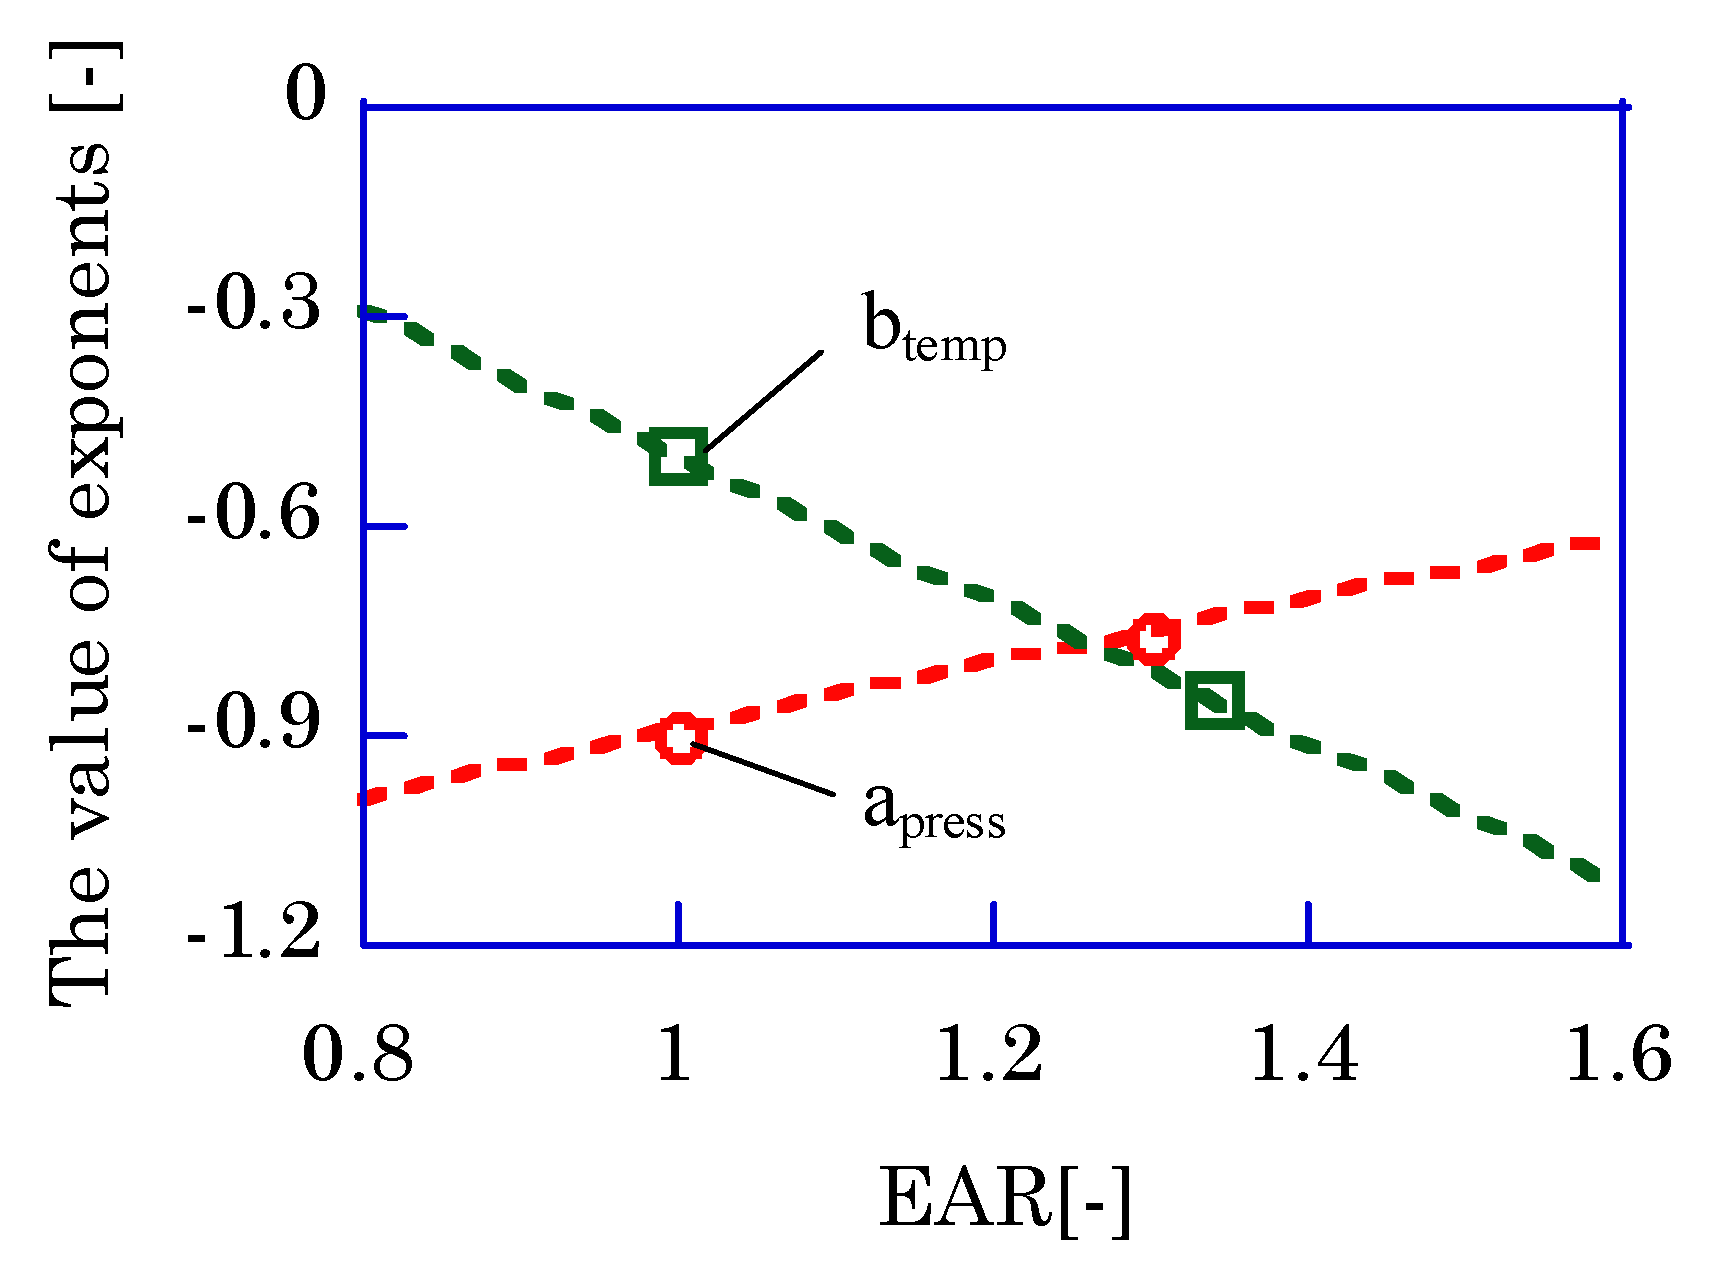
The influence of EAR on the parameters
apress and
btemp from Friedman et al. is shown in
Figure 10 [
21]. Friedman et al. reported that (1) the parameter
apress, index for the maximum cylinder pressure, was −0.76 at fuel-lean condition, (2) the parameter
apress was almost −0.88 in case of methane usage, (3) the parameter
btemp, index for the wall temperature, decreased at the fuel-lean condition and was −0.85 with propane at 1.3-EAR. The third point shows that hydrocarbon component will show a smaller
btemp. As their results shows that the
apress is almost same in any excess air ratio, −0.9 is used for
apress in this paper.
In our experiment, methane is used in the case of larger LHV. If the LHV is more than 7.5 MJ/Nm3, the methane ratio is larger at 3.8 points in comparison with normal bio-syngas. As Friedman et al. reported, the btemp with a larger hydrocarbon component mixture should be −0.85. Then, apress and btemp are −0.90 and −0.85, respectively, when the LHV is more than 7.5 MJ/Nm3. When the LHV is less than 7.5 MJ/Nm3, the Freidman et al. results are as follows (apress and btemp are −0.90 and −0.50, respectively).
The practical measurement is necessary to introduce
K1. However, it is not easy to measure the quenching distance experimentally in a reciprocating engine. Then, a simple temperature distribution is introduced with the thickness of the thermal boundary layer. Lyford-Pike et al. (1984) and Lucht et al. (1987) measured the thickness of the thermal boundary layer (
Bthk) in the reciprocating engine with propane fuel [
22,
23]. They reported that the
Bthk was 1.5 mm at 30 deg-ATDC and 2.0 mm at 60 deg-ATDC. In our discussion, it is assumed that the largest thermal boundary layer should occur at the largest CO emission in
Figure 7. The LHV is 4.7 MJ/m
3. At this condition, the
Bthk assumed same as the reported one, 2.0mm. The quenching temperature is 1100K, as shown in
Figure 9. The
K1 is calculated with this quenching temperature, the thickness of the thermal boundary layer, and simple thermal distribution. The thermal distribution is introduced as follows.
The simple temperature distribution is shown as Equation (3). The details are in the
Supplementary Materials. In the case of 4.7 MJ/Nm
3-LHV and 35 v%-unburned ratio, the quasi-cylinder temperature (
Tcyl) is 1413.2 K, and the maximum cylinder pressure is 315.8 kPa. The wall temperature (
Twall) is 392.3 K.
From the temperature distribution, the quenching distance is 1.0 mm at 1100 K-temperature. The K1 is 47.8 from Equation (2) with a 1.0 mm-quenching distance.
The quenching distance of each LHV case is calculated with these parameters. The thickness of the thermal boundary layer,
Bthk, is calculated with Equation (4). The
Bthk is used to calculate the unburned volume with the following hollow cylinder control volume method.
In order to calculate the unburned weight ratio in the thermal boundary layer, a control volume as a thin hollow cylinder is shown in
Figure S2 in the Supplementary Materials. The thickness of the hollow cylinder is 5 um.
The total unburned mixture is not only from the boundary layer but also from the gap as a crevice. As it is not easy to measure the crevice volume, the previous report of Namazian et al. is used. Namazian et al. measured the volume with a visualized engine that had a 0.34 mm gap between the piston and cylinder to introduce the crevice model. With the crevice model, they concluded that the mixture weight ratio in the crevice (
rMcrevice) was almost 7 % of the intake mixture (the test engine, a general-purpose one, had an 8.1-compression ratio, 96.5 mm-bore, 86.4mm-stroke). In our discussion, the
rMcrevice is used for Equation (5) because our test engine is also a general-purpose one. Then, the total unburned ratio is as Equation (6).
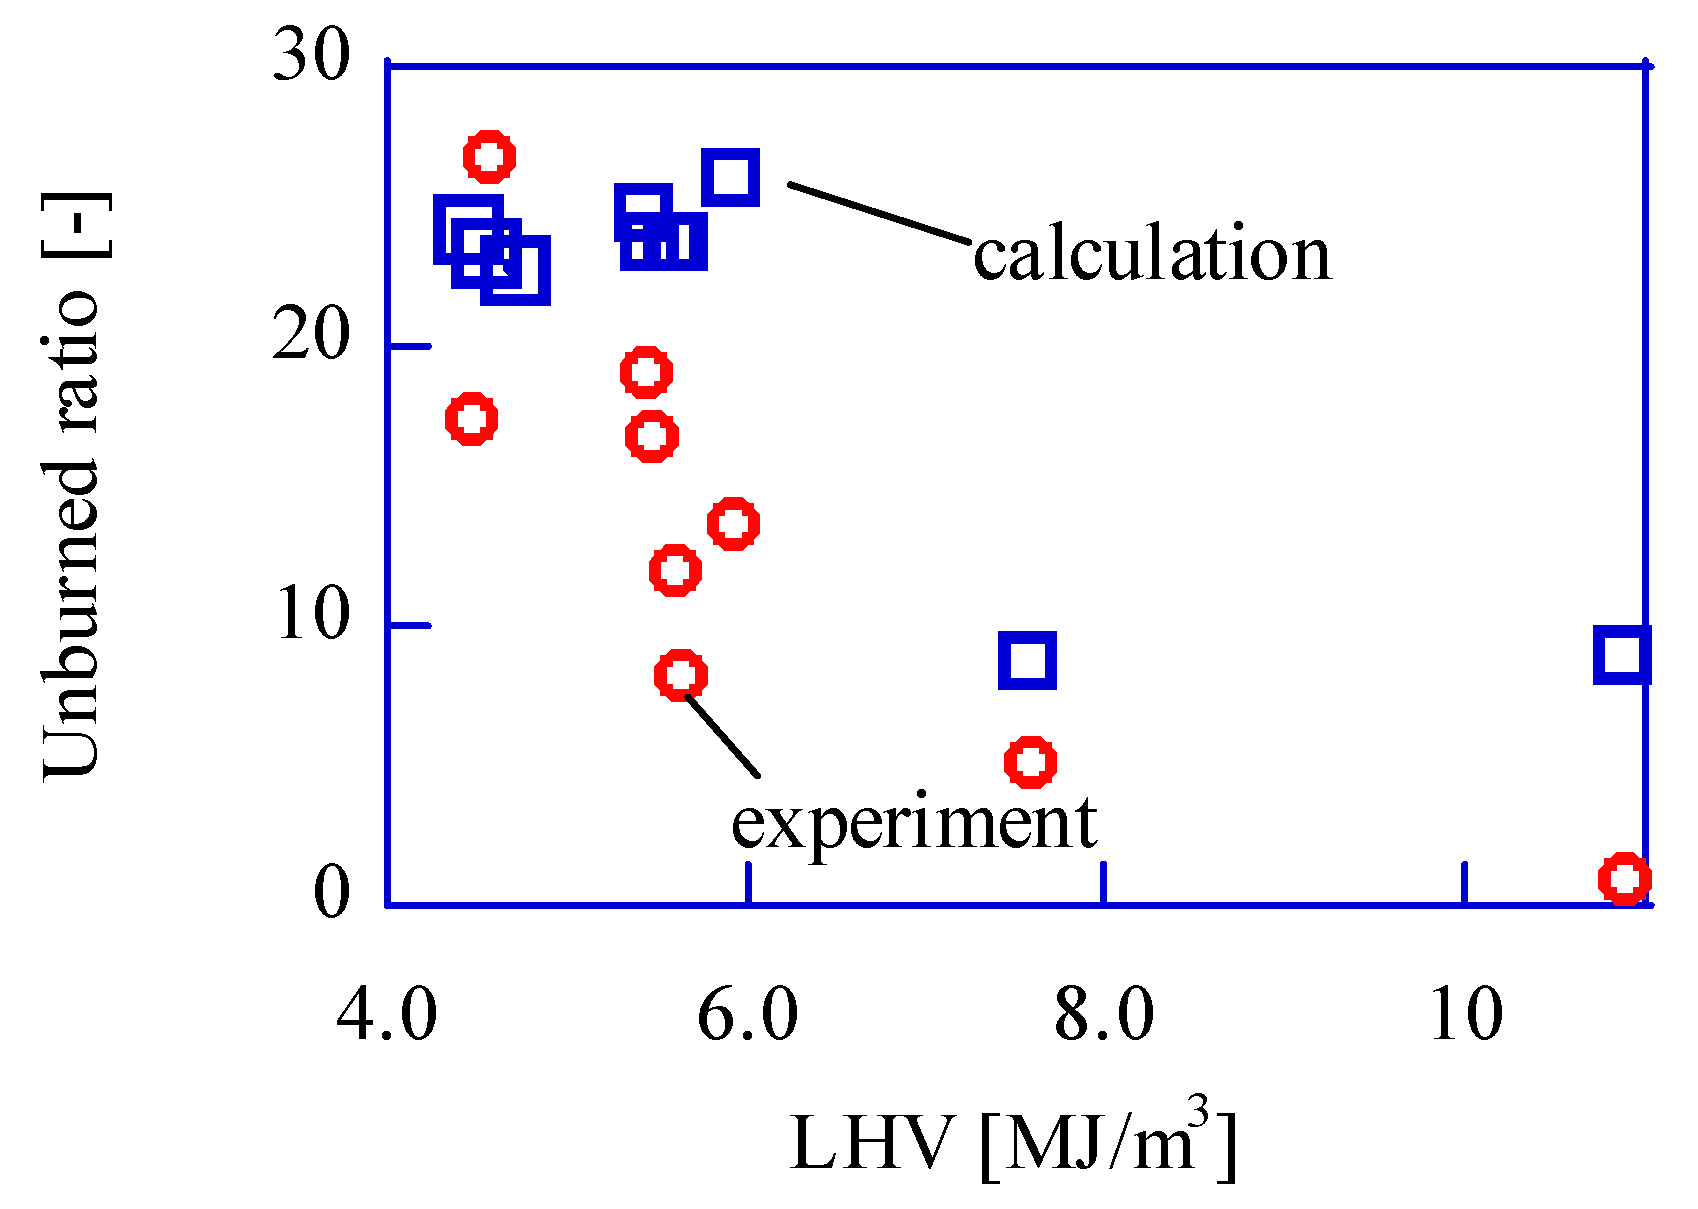
Figure 11 shows the comparison between the experimental unburned ratio and the calculated ones, and they show good agreement. The unburned components should be caused by the low-temperature region.
In this paper, the thermal boundary layer is used to calculate the unburned mixture. The thickness of the layer is from 1.9 mm to 2.0 mm. The effect of the thickness difference should be discussed. In the case of 1.9 mm-Bthk, the weight of the unburned mixture is 44.5 mg in this paper condition. In the case of 2.0 mm-Bthk, the weight is 46.9 mg. The difference is almost 5% and could be ignored. In the hollow cylinder control volume method, the thickness of the hollow cylinder is important. The 5.0 um-thicknesses case and the 0.87 um-thickness cases are compared in the same condition. As the difference between the two cases is less than 0.2%, it could be ignored.
Our discussion shows a good agreement of the thermal boundary layer effect on the unburned exhausted fuel.
However, the base equation is an experimental one. Moreover, the parameters in the calculation should be defined for each condition. In the case of the application of this method to other cases, the quenching distance especially should be discussed carefully.


