
Experimental Study on Denitration Transformation of CFB Boiler Burning Fujian Anthracite


Abstract
:1. Introduction
2. Experiment Conditions
3. LNC Transformation and Results
3.1. Reducing the Effective Cross-Sectional Area of Air Distributor
3.1.1. Effect of the Excess Air Coefficient on NOx Emission
3.1.2. Effect of the Secondary Air Rate on NOx Emission Concentration
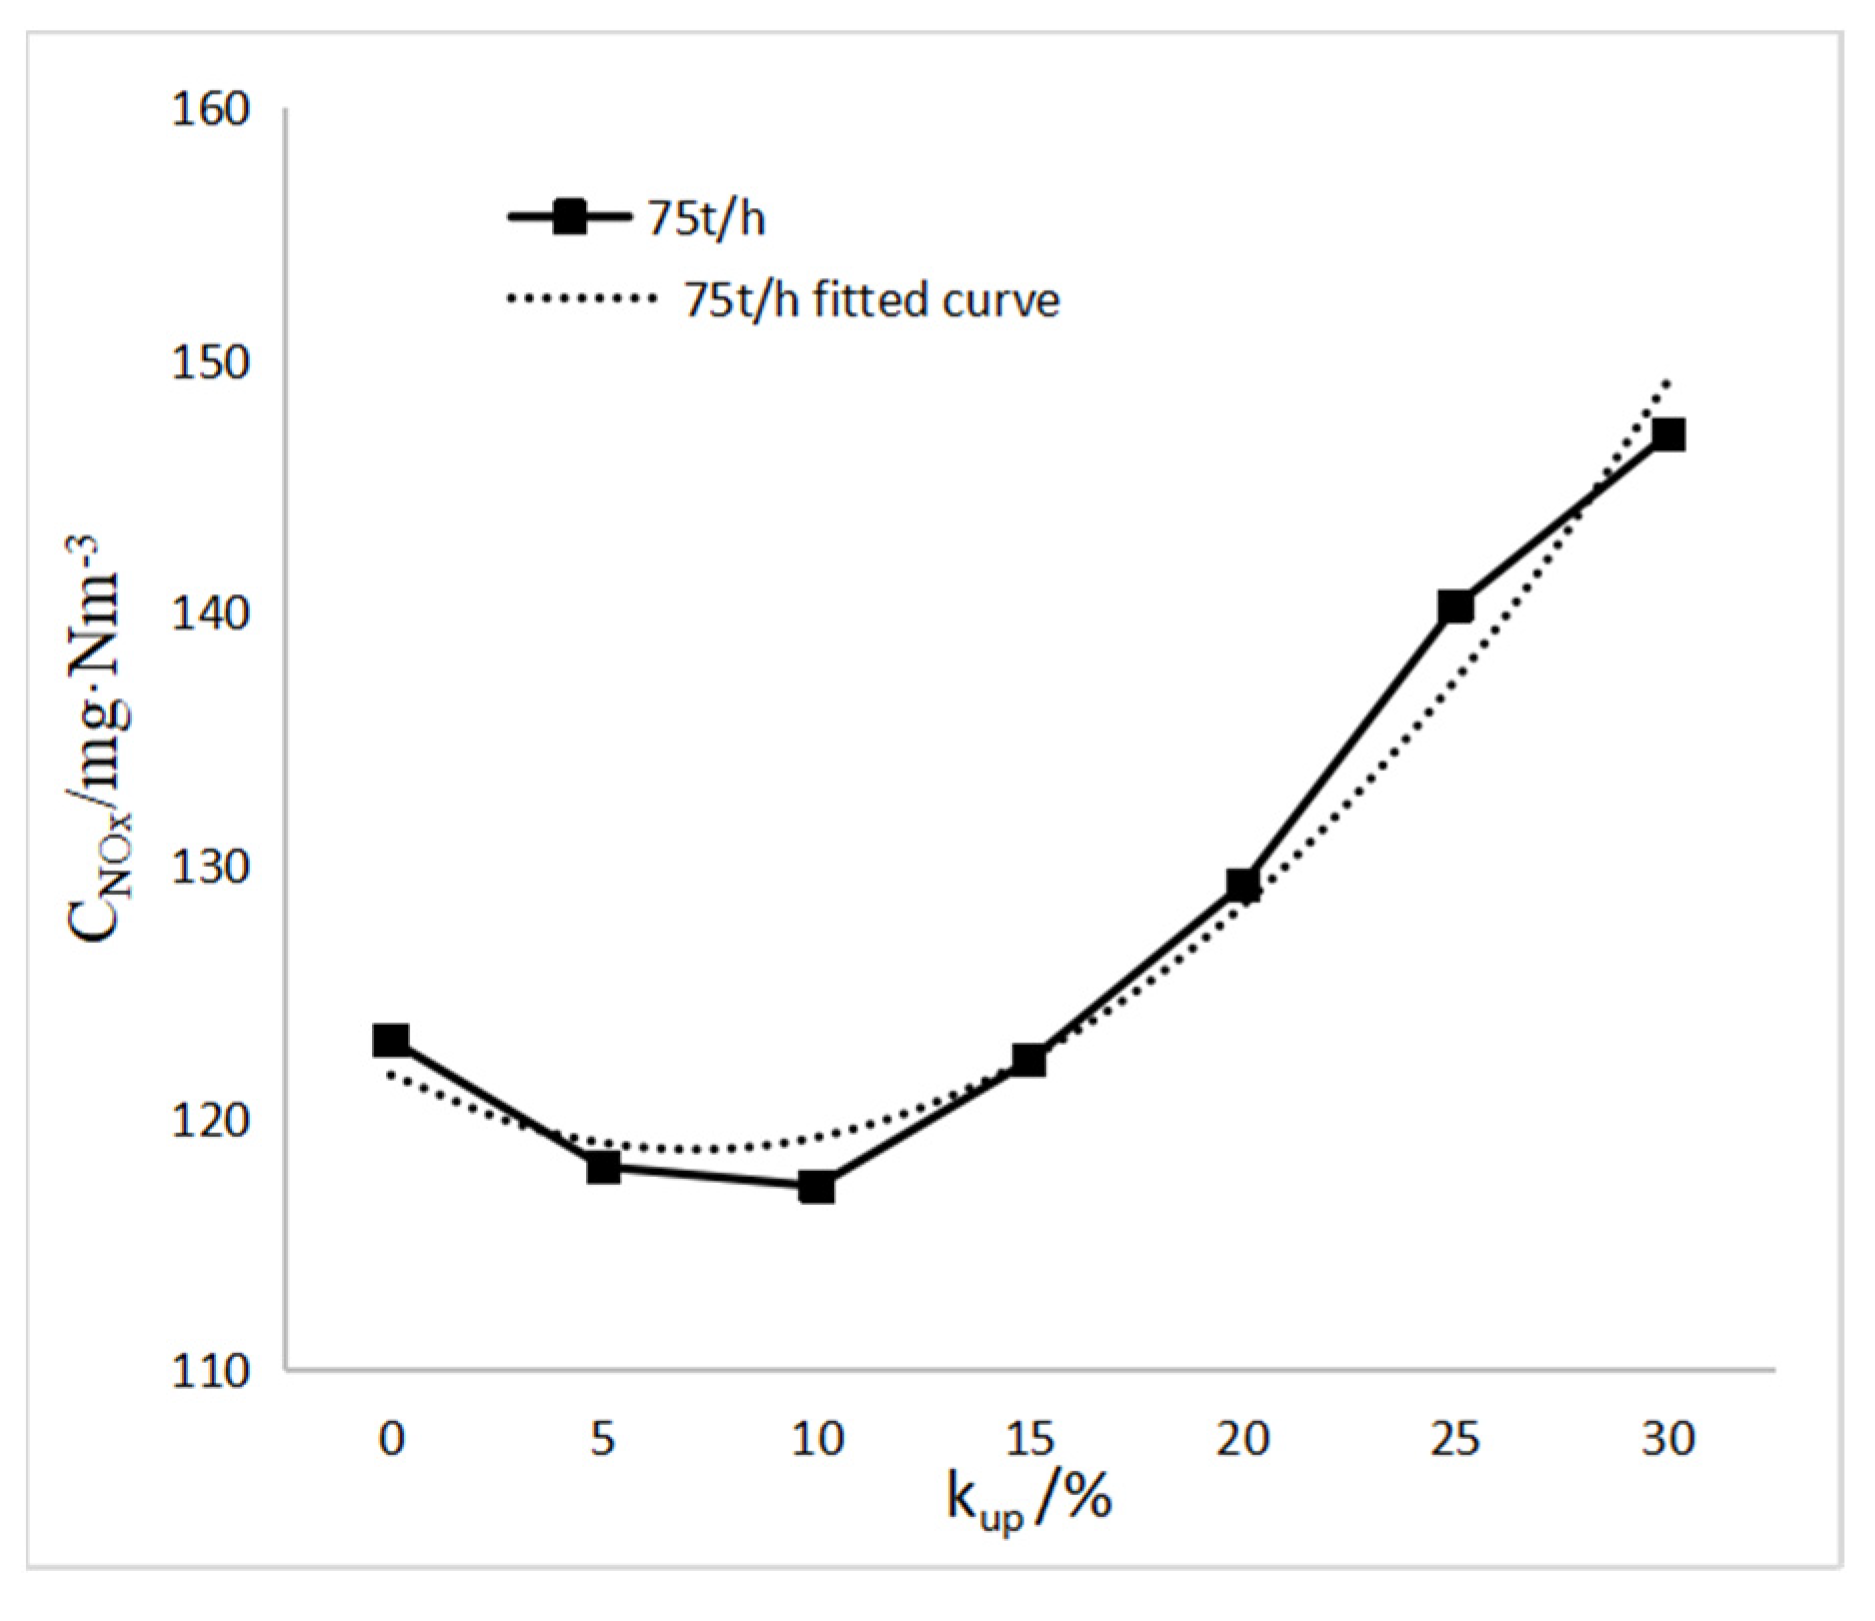
3.1.3. Effect of the Upper Secondary Air Rate on NOx Emission Concentration
3.1.4. Effect of β and kup on the Mechanical Incomplete Combustion Heat Loss and CO Emission Concentration
3.2. Secondary Air System Transformation
3.2.1. Effect of the Secondary Air Rate on NOx Emission Concentration
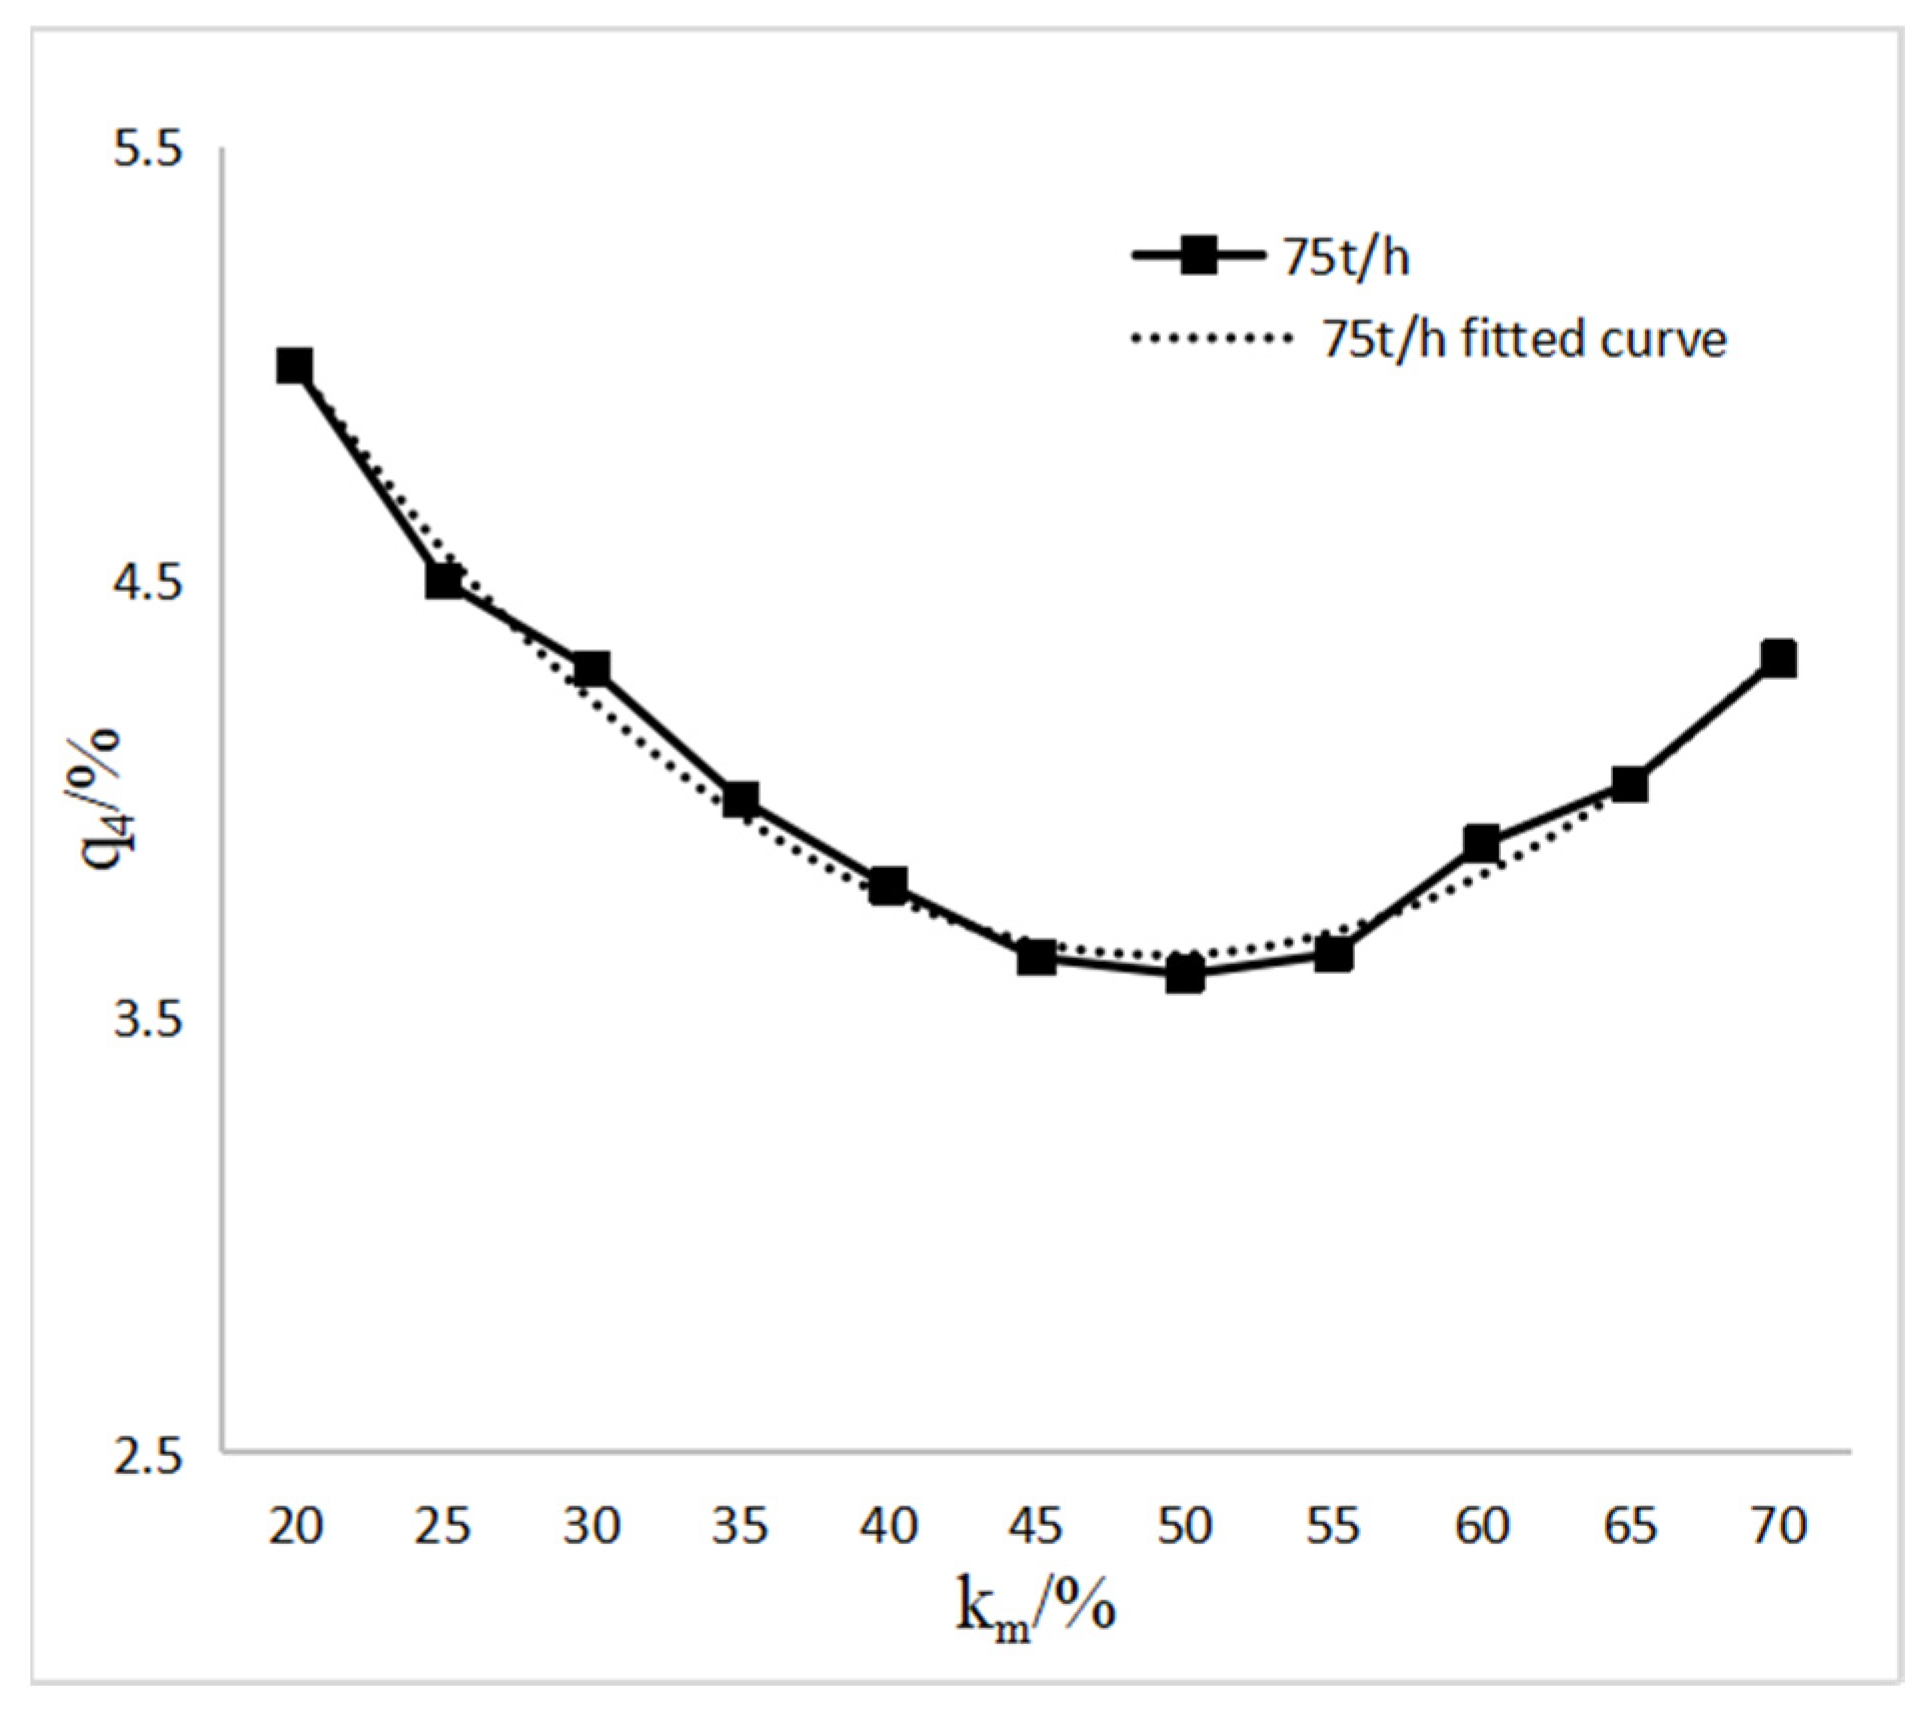
3.2.2. Effect of the Middle Secondary Air Rate on NOx Emission Concentration
3.2.3. Effect of the Upper Secondary Air Rate on NOx Emission Concentration
3.2.4. Effect of the Secondary Air Rate, the Middle Secondary Air Rate, and the Upper Secondary Air Rate on the Mechanical Incomplete Combustion Heat Loss
4. Conclusions
- (1)
- NOx emission is reduced from about 220 mg/m3 to about 180 mg/m3 by reducing the cross-sectional area of the air distributor by 15.26% and increasing the secondary air rate to 45%.
- (2)
- On the basis of reducing the effective cross-sectional area of the air distributor, NOx emission concentration is reduced from about 180 mg/m3 to about 140 mg/m3, with the lowest value of the NOx emission concentration below 120 mg/m3, and the mechanical incomplete combustion heat loss is also reduced by 1.0–1.5%, which results from adding a layer of the upper secondary air, raising the height of the lower secondary air nozzles by 0.5 m, and increasing the lower and middle secondary air speeds to 54 m/s. The economics of the boiler have been effectively improved.
- (3)
- For a 75 t/h medium temperature cyclone CFB boiler burning Fujian anthracite, the optimum range of the secondary air rate β is 50% to 60% at an excess air factor of 1.2. Under the same circumstances, the optimum middle secondary air rate is 45% to 55%, and the optimum upper secondary air rate is 10% to 15%.
Author Contributions
Funding
Conflicts of Interest
Abbreviations
| Symbol | Meaning |
| CFB | circulating fluidized bed |
| LNC | low NOx combustion |
| Mt | total moisture of raw coal sample, % |
| Aar | base ash received from coal, % |
| Vdaf | coal dry ash free volatile matter, % |
| FCar | coal receipt-based fixed carbon, % |
| Qar.net | received base low calorific value, MJ/kg |
| Car | carbon content of coal received base, % |
| Har | hydrogen content of coal received base, % |
| Oar | coal received base oxygen content, % |
| Nar | nitrogen content of coal received base, % |
| Sar | sulfur content of coal base, % |
| β | secondary air rate, % |
| λ | excess air coefficient |
| km | middle secondary air rate, % |
| CNOx | NOx emission concentration, mg/Nm3 |
| CCO | CO emission concentration, mg/Nm3 |
| kup | upper secondary air rate, % |
| q4 | mechanical incomplete combustion heat loss, % |
| Qr | heat input per kg of fuel, kJ/kg |
| Clz | combustible in ash residue of cold ash hopper, % |
| Cfh | combustible in fly ash, % |
| alz | mass share of ash content in ash of cold ash hopper in total ash content, % |
| afh | mass share of ash content in total ash content of fly ash, % |
References
- Wu, J. Research & Development for Reducing NOx Emission on Two 75t/h CFB Boiler Burning Fujian Anthracite with Medium-Temperatue Cyclone; Jimei University: Xiamen, China, 2016. [Google Scholar] [CrossRef]
- Liu, Z.; Ma, S.; Pan, X.; Chen, J. Experimental study on the load response rate under the dynamic combined combustion of PC coal and CFB coal in a CFB boiler. Fuel 2018, 236, 445–451. [Google Scholar] [CrossRef]
- Ke, X.; Engblom, M.; Yang, H.; Brink, A.; Lyu, J.; Zhang, M.; Zhao, B. Prediction and minimization of NOx emission in a circulating fluidized bed combustor: A comprehensive mathematical model for CFB combustion. Fuel 2021, 309, 122133. [Google Scholar] [CrossRef]
- Kong, R.; Li, W.; Wang, H.; Ren, Q. Optimization of oxy-fuel circulating fluidized bed combustion system with high oxygen concentration. Energy Rep. 2022, 8, 83–90. [Google Scholar] [CrossRef]
- Chen, H.; Song, Y.; Shi, Y.; Yang, X. Prediction of particle circulation rate in an internally circulating fluidized bed with a central draft tube. Powder Technol. Int. J. Sci. Technol. Wet Dry Part. Syst. 2021, 380, 497–505. [Google Scholar] [CrossRef]
- Huang, Z.; Deng, L.; Che, D. Development and technical progress in large-scale circulating fluidized bed boiler in China. Front. Energy 2020, 14, 699–714. [Google Scholar] [CrossRef]
- Zhang, H.; Gao, M.; Liu, C.; Liu, J.; Yue, G.; Zhang, J. Dynamic prediction of in-situ SO2 emission and operation optimization of combined desulfurization system of 300 MW CFB boiler. Fuel 2022, 324, 124421. [Google Scholar] [CrossRef]
- Jiang, L.; Li, Y.; Yao, Y.; Zhang, M.; Lu, J.; Huang, Z.; Zhou, T.; Yue, G. Heat transfer and protection of high-temperature reheater of a 660MW circulating fluidized bed boiler after black out. Appl. Therm. Eng. 2022, 213, 118654. [Google Scholar] [CrossRef]
- Jiang, M.; Xiao, P. Large-Scale Circulating Fluidized Bed Combustion Technologies; China Power Press: Beijing, China, 2009; pp. 171–175. [Google Scholar]
- US EPA. Standards of Performance for Electric Utility Steam Generating Units; US EPA: Washington, DC, USA, 2006. [Google Scholar]
- EU. On the Limitations of Certain Pollutants into the Air from Large Combustion Plants, Directive 2001 /80 /EC of the European Pallament and of Council; European Union: Brussels, Belgium, 2001. [Google Scholar]
- GB 13223-2011; Emission Standard of air Pollutants for Thermal Power Plants. Ministry of Ecology and Environment, The People’s Republic of China: Beijing, China, 2012.
- National Development and Reform Commission; Ministry of Environmental Protection; National Energy Administration. Coal Power Energy Saving and Emission Reduction Upgrading and Transformation Action Plan (2014–2020): Development and Transformation Energy [2014] No. 2093 [A/OL]. 12 September 2014. Available online: https://www.ndrc.gov.cn/xxgk/zcfb/tz/201409/t20140919_964234.html?code=&state=123 (accessed on 23 March 2022).
- Fujian Provincial Environmental Protection Department; Fujian Provincial Economic and Information Technology Commission; Fujian Provincial Development and Reform Commission; Fujian Provincial Price Bureau; Fujian Provincial Energy Regulatory Office. Notice on Printing and Distributing the Work Plan for Comprehensively Implementing Ultra-Low Emission and Energy Conservation Renovation of Coal-fired Power Plants in Fujian Province: Fujian Huanfa [2016] No.6 [A/OL]. 30 January 2016. Available online: http://sthjt.fujian.gov.cn/zwgk/zfxxgkzl/zfxxgkml/mlqtxx/201603/t20160331_107219.htm (accessed on 23 March 2022).
- Daood, S.; Javed, M.; Gibbs, B.M.; Nimmo, W. NOx control in coal combustion by combining biomass co-firing, oxygen enrich-ment and SNCR. Fuel 2013, 105, 283–292. [Google Scholar] [CrossRef]
- Du, H. Study on Energy Efficiency Evaluation of Layer Combustion Boiler Coupled with Pollutant Emission Reduction and Waste Heat Utilization. Ph.D. Thesis, Harbin Institute of Technology, Harbin, China, 2021. [Google Scholar] [CrossRef]
- Jie, Y.; Xin, G.; Yang, L. Application of Low NOx CombustionTechnology in Ultra Low Emission Retrofit of CFB Boilers. Power Syst. Eng. 2020, 36, 71–72. [Google Scholar]
- DL/T 260-2012; Electric Power Industry Standard of the People’s Republic of China: Code for Performance Acceptance Test of Flue Gas Denitration Device in Coal-Fired Power Plant. State Power Environmental Protection Research Institute: Nanjing, China, 2012.
- Basu, P. Circulating Fluidized Bed Boilers: Design Operation and Maintenance; Springer: Berlin/Heidelberg, Germany, 2015. [Google Scholar] [CrossRef]
- Feng, B.; Yuan, J.; Liu, H.; Bo, F.; Jianwei, Y.; Hao, L.; Jianxin, L.; Zhijie, L.; Dechang, L. Study on nitrogen oxide Emission in circulating fluidized bed coal Combustion. J. Eng. Thermophys. 1996, 17, 125–128. [Google Scholar]
- He, H. Experimental and Theoretical Study on the Cleaning Combustion of Fujian Anthracite in CFB Boiler. Ph.D. Thesis, Zhejiang University, Hangzhou, China, 2005. [Google Scholar]


| Items | Value | Items | Value |
|---|---|---|---|
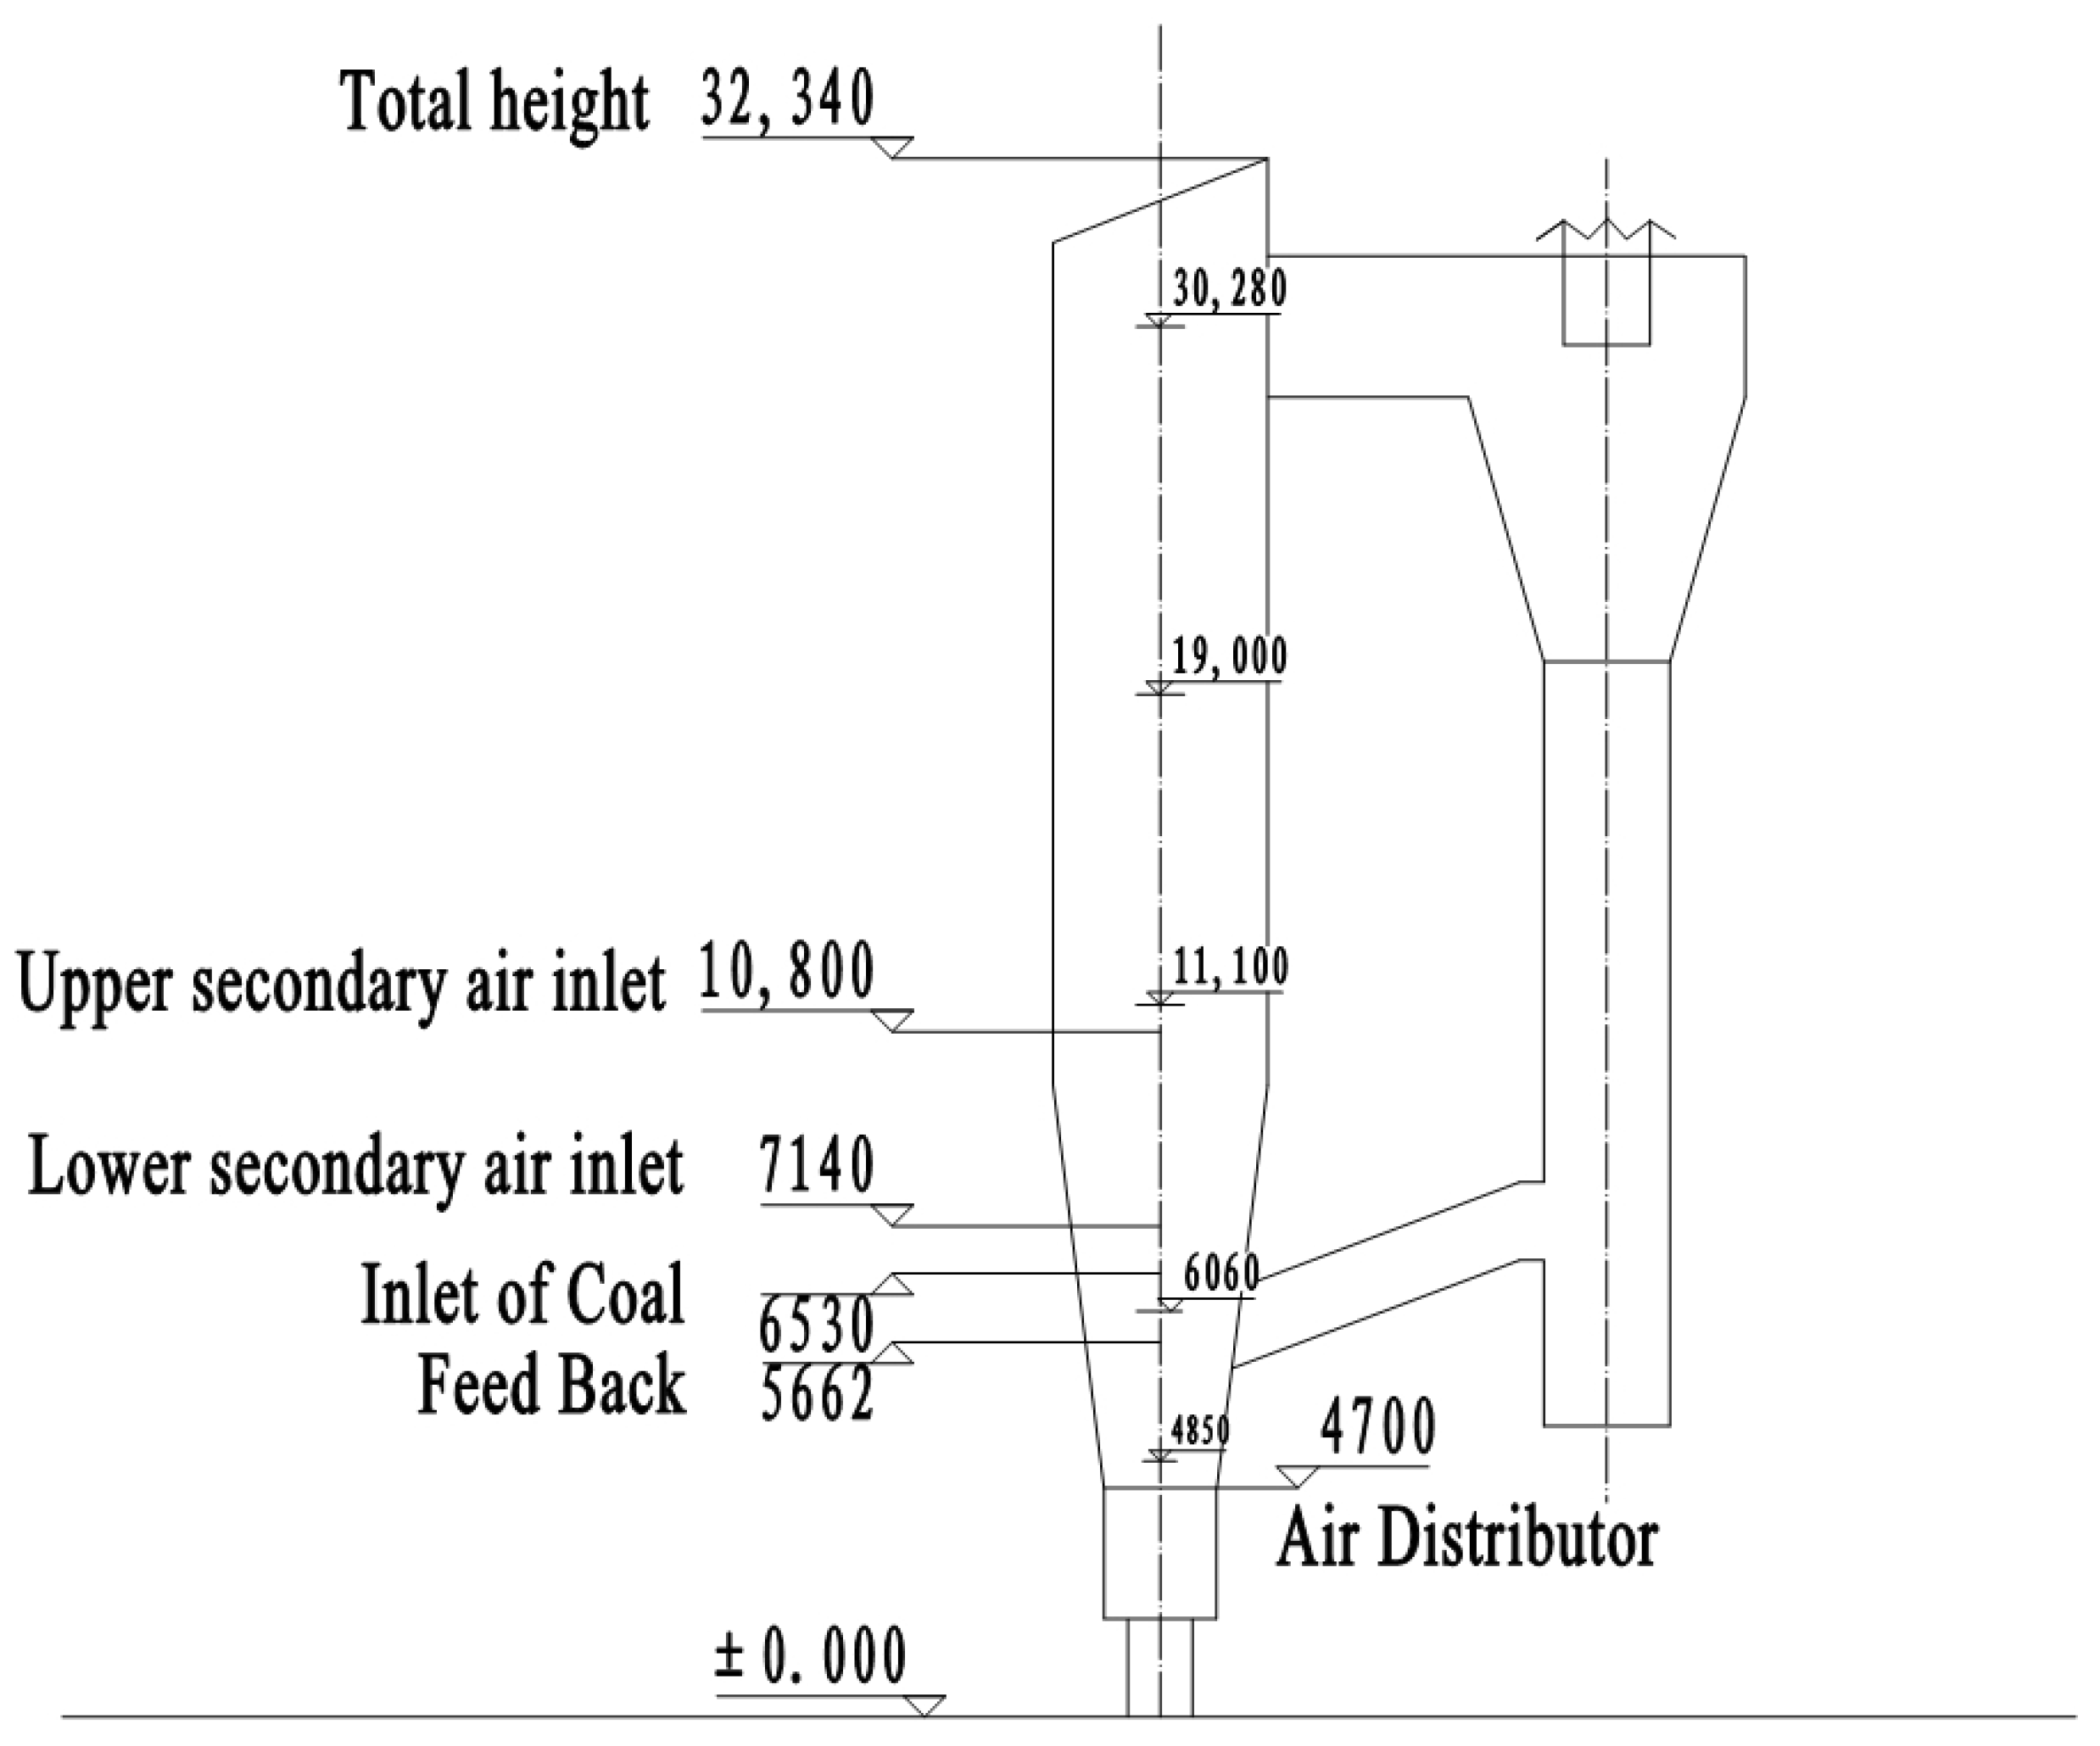
| Rated evaporation/(t·h−1) | 75 | Temperature at 4850 mm/°C | 950–980 |
| Superheated steam pressure /(MPa) | 3.82 | Temperature at 6060 mm/°C | 930–990 |
| Superheated steam temperature/°C | 450 | Temperature at 11,100 mm/°C | 900–1000 |
| Feed-water temperature/°C | 150 | Temperature at 14,400 mm/°C | 850–1020 |
| Cold air temperature/°C | 20 | Temperature at 19,000 mm/°C | 850–1050 |
| Exhaust temperature/°C | 120–150 | Temperature at 30,280 mm/°C | 520–580 |
| Proximate Analysis (%) | Ultimate Analysis (%) | |||||||||
|---|---|---|---|---|---|---|---|---|---|---|
| Mt | Aar | Vdaf | FCar | Qar.net /(MJ·kg−1) | Car | Har | Oar | Nar | Sar | |
| Design coal | 12.73 | 15.35 | 3.69 | 68.23 | 22.39 | 68.86 | 0.30 | 1.64 | 0.22 | 0.90 |
| Experimental coal (I) | 9.0 | 30.0 | 3.8 | 57.2 | 20.68 | 57.41 | 1.16 | 1.02 | 0.56 | 0.85 |
| Experimental coal (II) | 8.60 | 21.93 | 2.37 | 67.1 | 24.27 | 65.03 | 0.95 | 1.50 | 1.21 | 0.78 |
Disclaimer/Publisher’s Note: The statements, opinions and data contained in all publications are solely those of the individual author(s) and contributor(s) and not of MDPI and/or the editor(s). MDPI and/or the editor(s) disclaim responsibility for any injury to people or property resulting from any ideas, methods, instructions or products referred to in the content. |
© 2023 by the authors. Licensee MDPI, Basel, Switzerland. This article is an open access article distributed under the terms and conditions of the Creative Commons Attribution (CC BY) license (https://creativecommons.org/licenses/by/4.0/).
Share and Cite
Zhou, W.; He, H.; Zhuang, H. Experimental Study on Denitration Transformation of CFB Boiler Burning Fujian Anthracite. Energies 2023, 16, 2535. https://doi.org/10.3390/en16062535
Zhou W, He H, Zhuang H. Experimental Study on Denitration Transformation of CFB Boiler Burning Fujian Anthracite. Energies. 2023; 16(6):2535. https://doi.org/10.3390/en16062535
Chicago/Turabian StyleZhou, Wenting, Hongzhou He, and Huanghuang Zhuang. 2023. "Experimental Study on Denitration Transformation of CFB Boiler Burning Fujian Anthracite" Energies 16, no. 6: 2535. https://doi.org/10.3390/en16062535
APA StyleZhou, W., He, H., & Zhuang, H. (2023). Experimental Study on Denitration Transformation of CFB Boiler Burning Fujian Anthracite. Energies, 16(6), 2535. https://doi.org/10.3390/en16062535