1. Introduction
As the power industry moves towards increased sustainability and the cost of renewable energy systems continues to decrease, the number of commercial buildings provided with solar PV and BES systems is expected to increase significantly in the next few decades [
1,
2]. The utilization of such resources in buildings has the potential to provide power during outages, as well as financial benefits to customers. According to the United States (U.S.) Department of Energy [
3], the average cost of solar PV panels has dropped nearly 70% from 2014 to 2021. In September of 2022, the U.S. solar PV capacity reached 130.9 GW, enough to power 23 million homes [
4]. However, according to a recent study led by Wood Mackenzie [
5], the U.S. commercial rooftops still hold around 145 GW of untapped solar potential, since only 3.5% of commercial buildings have solar panels on their roofs.
The addition of a BES system allows for the storage of curtailed power generated by the solar panels. Therefore, if the solar panels ever produce more power than is required to supply the total load, the storage system will be able to store the power for later use (e.g., when the solar panels are unable to produce sufficient power). The need for power storage is critical when considering variable power generation such as solar power [
6] and power outages due to HILP events. Lithium-ion batteries have been widely used for off-grid energy storage due to their fast response times, high efficiency, and relatively low cost [
7]. In particular, critical loads, such as hospitals, benefit from using stored power during outages. The need for power storage is crucial when considering the rise in the probability of power infrastructure failure over the last few decades [
8]. Reducing the impact of power shortages and grid failures requires an increased level of power system resilience.
Power outages occur due to many reasons, with weather being a major cause. In the U.S., more than USD 1 billion are lost due to outages, per year, caused by natural disasters [
9]. From January 2000 to July 2016, around 50% of the U.S. power outages were caused by severe weather events [
8]. Estimations of the frequency of severe weather events are increasing, meaning that power systems must be able to withstand unpredictable HILP events in the years to come [
10]. More frequent outages can be caused by less severe weather events. In 2018, U.S. customers experienced average power outages of 2 h that were not caused by major events, but this increased to almost 6 h when major events were considered [
11]. In addition, some power outages are scheduled by utility companies to prevent possible disasters such as public safety power shutoffs (PSPSs), to reduce the risks of wildfires ignited by power lines. According to the California Public Utilities Commission (CPUC), PSPS programs accounted for more than 9 billion customer outage minutes from 2013 to 2020, resulting in more than USD 5 billion in total costs [
12]. Dryer climates and more extreme heat may call for more scheduled outages in the grid. Residential and commercial loads need to be able to provide themselves with power during such shortages [
13].
Power outages can be dangerous in the cases of critical loads such as hospitals. Ideally, power would be always delivered to a hospital, allowing for uninterrupted critical processes, such as surgeries and drug storage [
14]. A critical load must be provided with power during outages, meaning that the most important equipment in the hospital should be kept running. Although less critical, warehouse and school buildings would greatly benefit from a solar PV and BES system that is able to provide power during occasional outages. Work hours would continue, and schools would still be able to run devices such as computers and have functioning air conditioners and heating systems during outages. A power system that can provide energy during outages is crucial, but, in most cases, it is also important to consider the cost-effectiveness of the system. Affordable solar PV and BES systems would aid in the transition to a decarbonized power grid [
14]. Customers would be discouraged from installing such systems if there were no financial incentives involved.
Furthermore, with the increasing adoption of price-based demand response programs, electric utilities have shifted from fixed rates into more flexible rate structures, including tiered and time-of-use (ToU) rates. Understanding the impacts of different rates on the feasibility of PV and BES systems for financial and resilience purposes is paramount to inform planning and investment decisions.
2. Literature Review and Contributions of This Work
The existing literature on solar PV and BES system optimization is very extensive. The works in [
15,
16] comprehensively surveyed existing mathematical optimization approaches for standalone solar PV and BES system planning. Most of the existing works, however, focused on cost-based solutions and neglected the impact of power outages on the planning decisions. Some works developed cost-based approaches for commercial buildings such as shopping malls [
17], supermarkets [
18], and hotels [
19]. Other studies investigated the impacts of power outage risks on the planning of solar PV and/or BES system in distribution networks [
20] and resilient microgrids [
21], and the optimal energy management of residential units [
22]. More recent works developed techno-economic analyses for solar PV and BES systems considering specific geographic locations, load profiles, and electricity rates. For example, the work in [
14] investigated the integration of solar PV and a BES system to increase the power resilience at a hospital in Palmdale, CA. It showed favorable results, with an over USD 400,000 net present value (NPV) over a 20-year period. The work in [
23] conducted a similar analysis for three types of commercial buildings and compared the results with and without valuing resilience. In [
24], a case study of an office using a specific utility rate, based on the load’s characteristics, was analyzed to quantify resilience costs when installing a solar PV and BES system, with the NPV over a 20-year period being highly favorable. Research conducted in [
6] used a similar methodology to verify the NPV of commercial buildings considering three different load profiles and different outage durations.
Previous literature has mostly analyzed PV and BES system optimization considering fixed rate structures. In contrast to existing works, this paper provides a comprehensive techno-economic analysis to examine how different electricity rate structures affect the viability of PV and BES systems considering two perspectives: (1) financial (i.e., cost optimization alone); and (2) resilience (i.e., cost optimization under resilience requirements).
The main contributions of this paper are described as follows:
It investigates how flat, tiered, and ToU electricity rates affect planning decisions and the financial and resilience outcomes of solar PV and BES systems in commercial buildings for different combinations of geographic locations, load profiles, electricity rates, and power outage durations.
It analyzes the impact of different power outage times (i.e., day and night) and durations on the optimal sizing and operation of commercial solar PV and BES systems under different electricity rates.
Simulation studies are conducted using the National Renewable Laboratory’s (NREL) Renewable Energy Integration & Optimization (REopt) techno-economic decision support software. The feasibility assessment is conducted based on the resulting NPVs, which are analyzed and compared for different input parameter combinations. Such analysis can help investors to make informed decisions and achieve cost savings while enhancing power resilience with increased sustainability.
3. Materials and Methods
REopt [
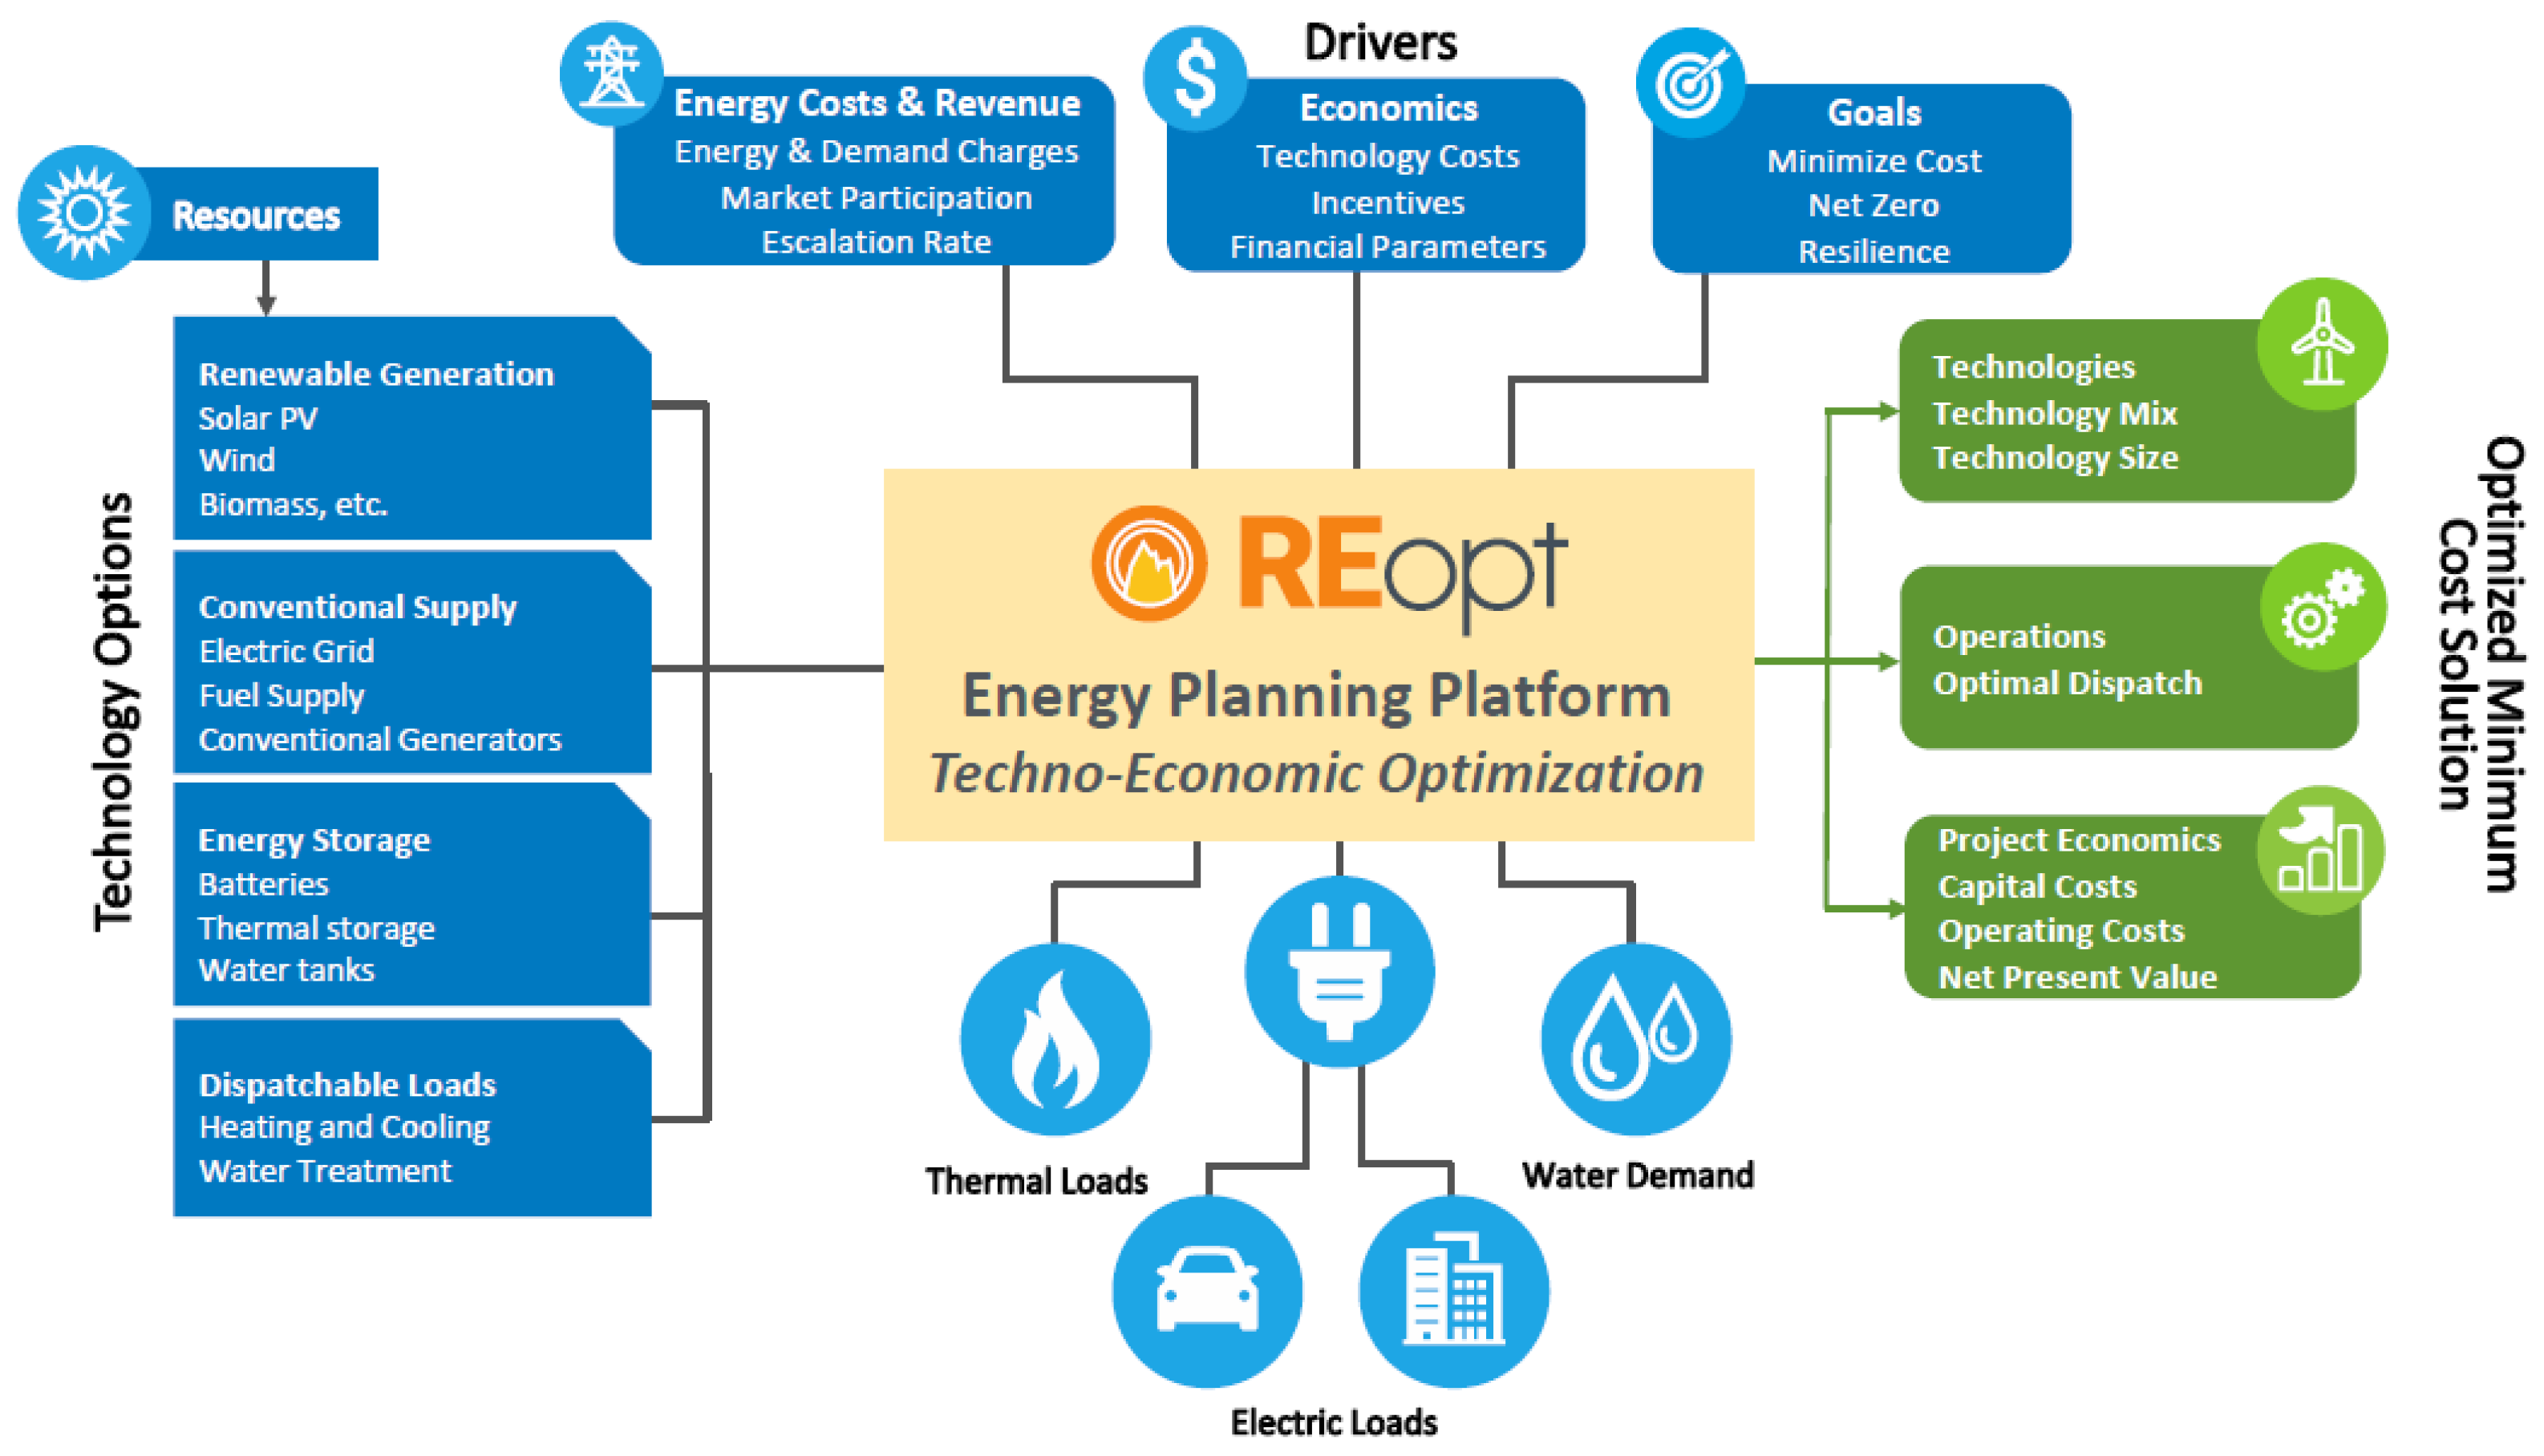
25] takes inputs based on the type of renewable generation system, BES system, and the load profiles, as illustrated in
Figure 1. Tax incentives and financial parameters are included by default in the simulation; however, they are not analyzed in this paper. The NPV, PV size, BES system size, and resulting power generation profiles are recorded and compared for each run. The complete list of the parameters used in the simulation studies can be found in [
26] (See also in
Supplementary Materials).
The viability of each case study is assessed using the NPV metric, which is defined as follows [
27,
28]:
where
is the net cash flow for the ith period,
r is the discount rate,
n is the life of the project, and
I is the total initial investment. The financial parameters considered for the NPV calculation in REopt consider the costs associated with each location selected.
Three different geographic locations in the U.S. were considered based on the average monthly direct normal irradiance (DNI) levels and classified into low, medium, and high DNI levels, as shown in
Table 1 [
29].
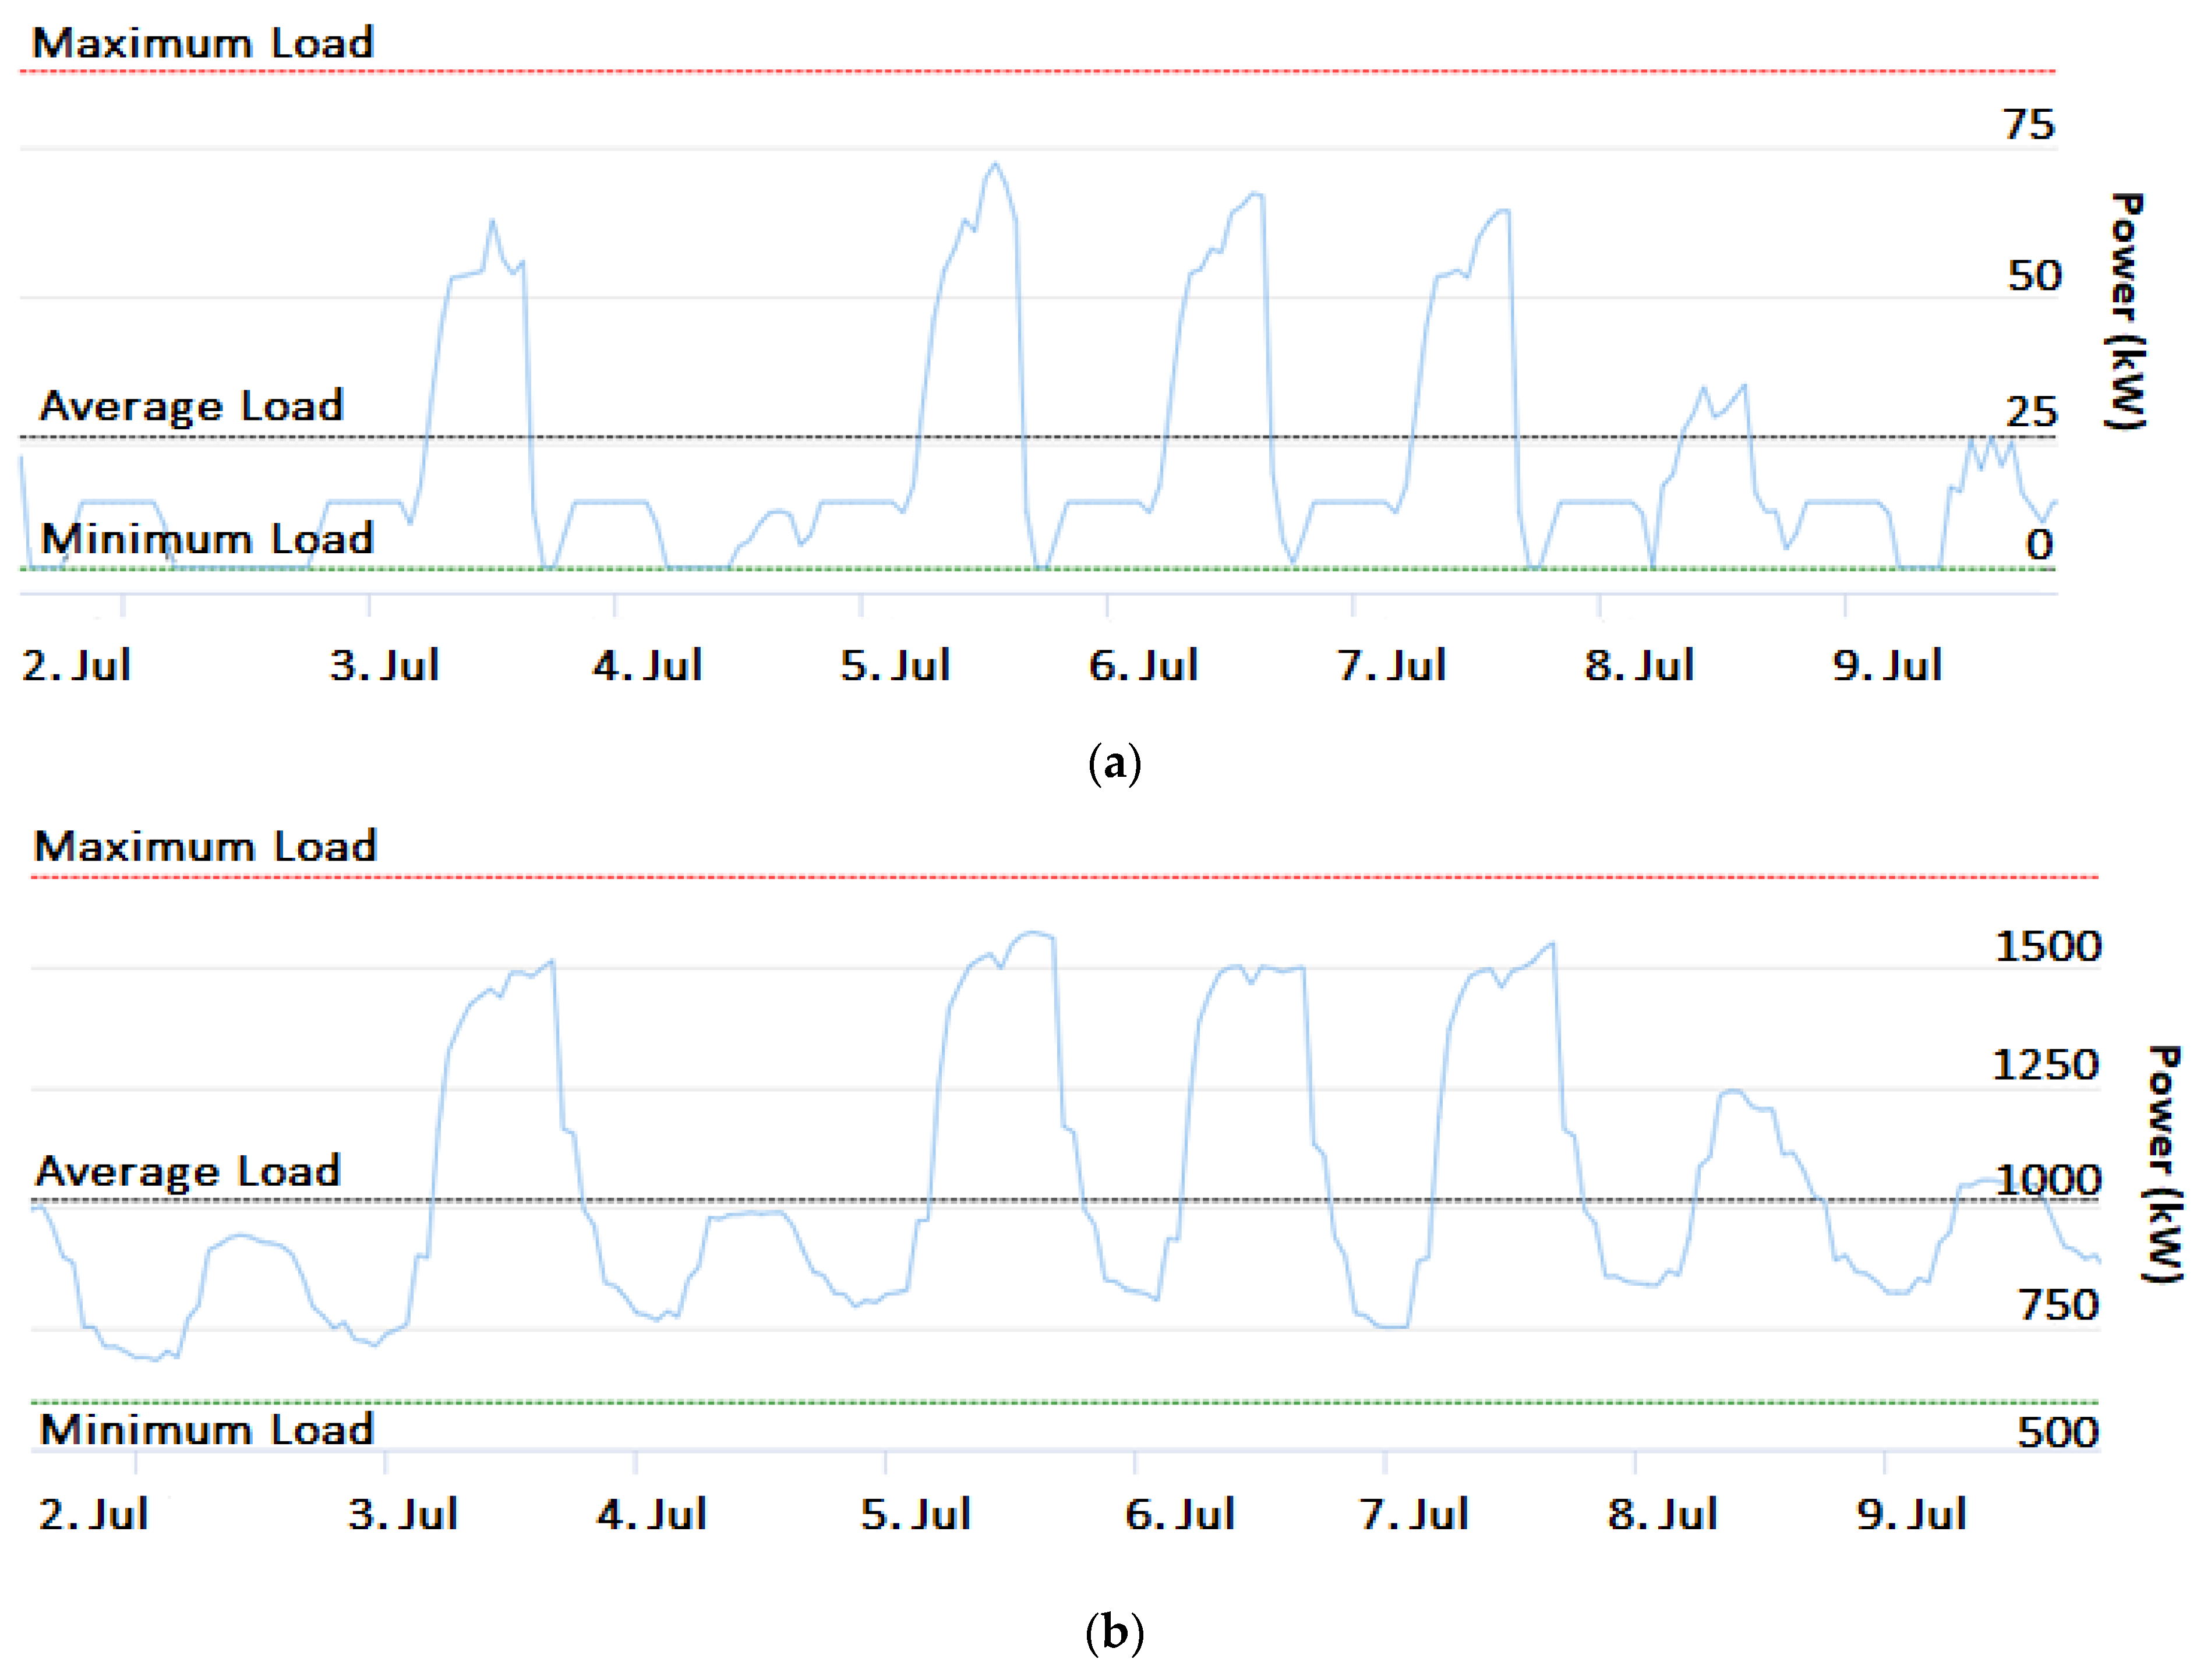
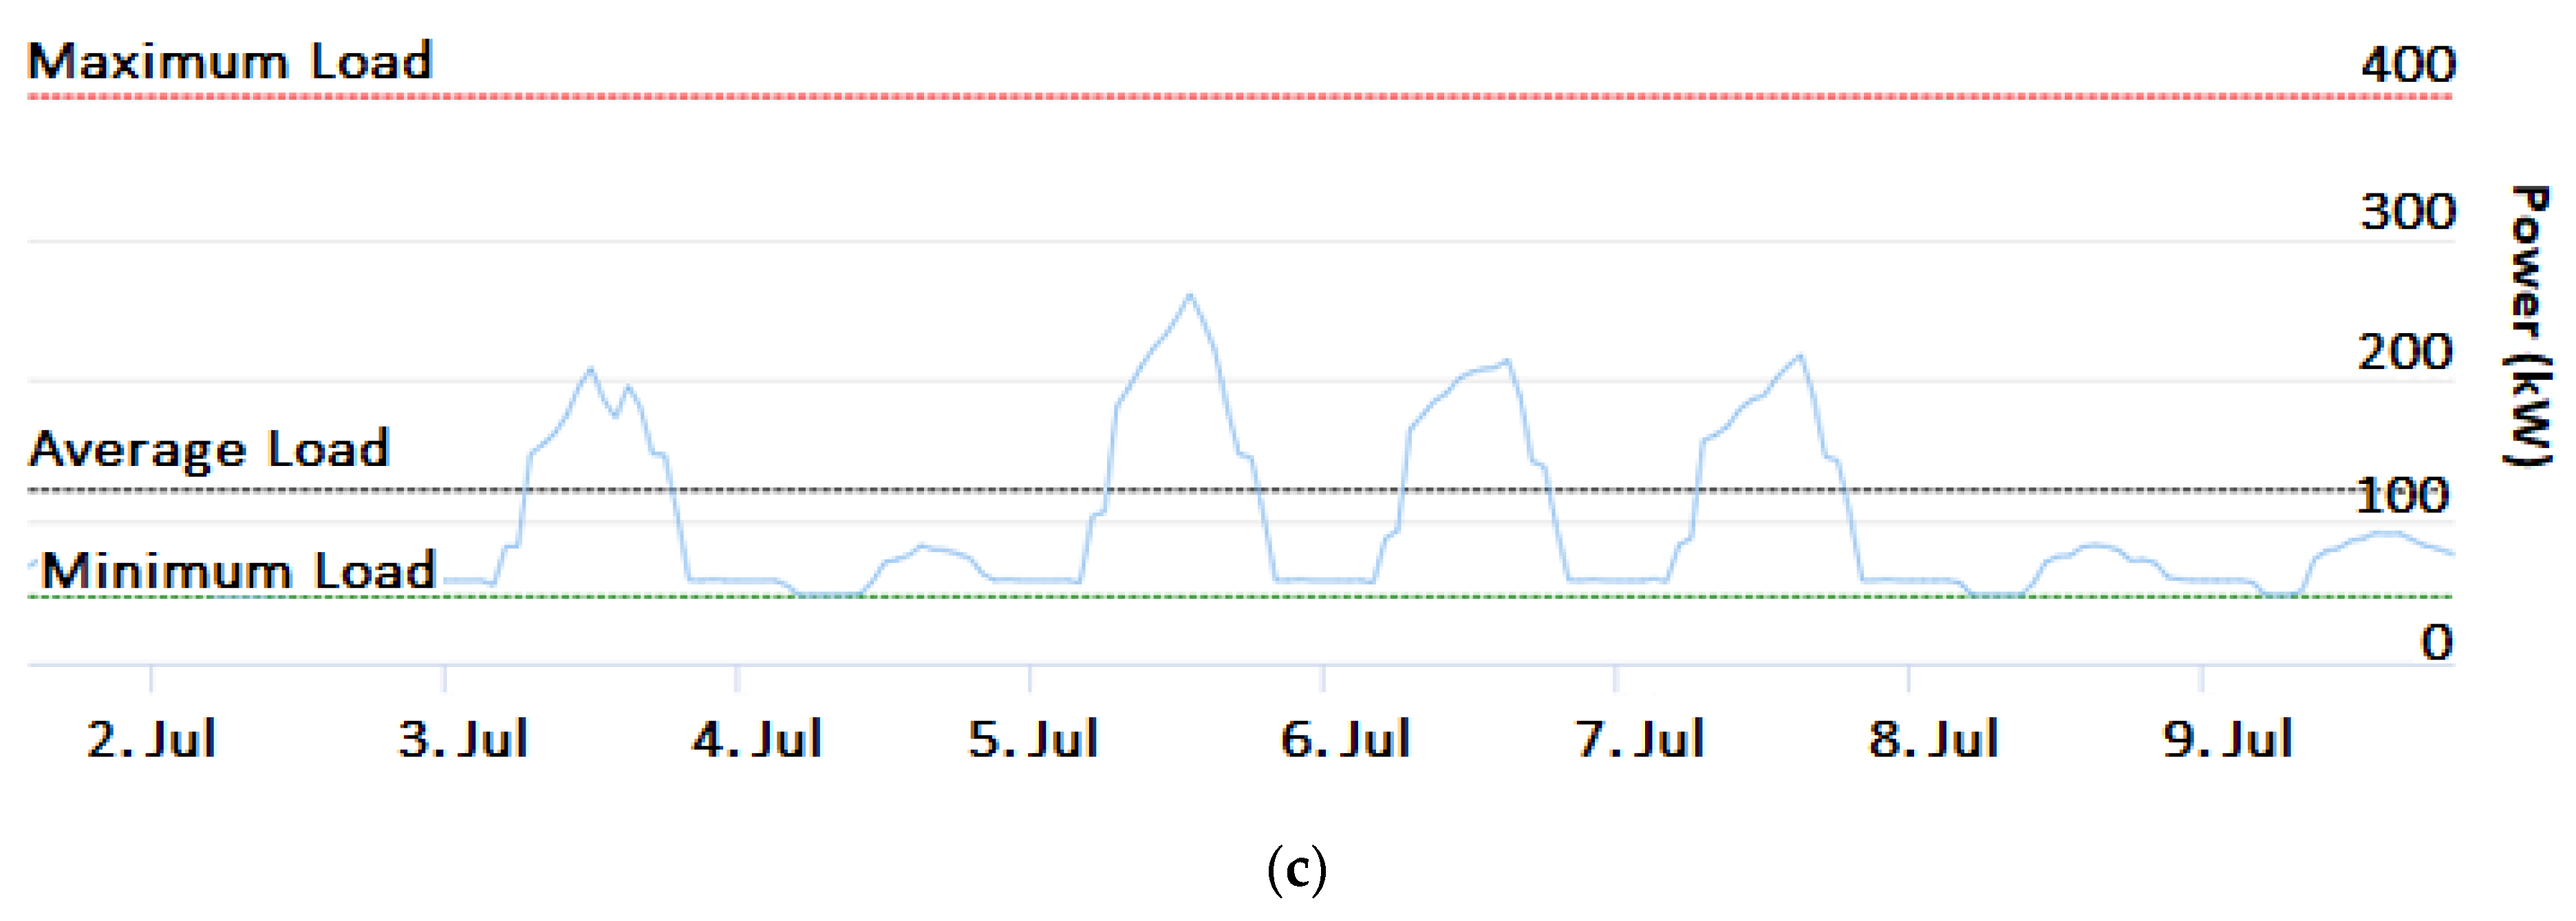
Commercial load profiles modeling warehouse, hospital, and primary school buildings in Kansas City, MO were extracted from REopt’s own database and used for the other two locations to avoid unnecessary variations. The weekly load profile data for the commercial loads are illustrated in
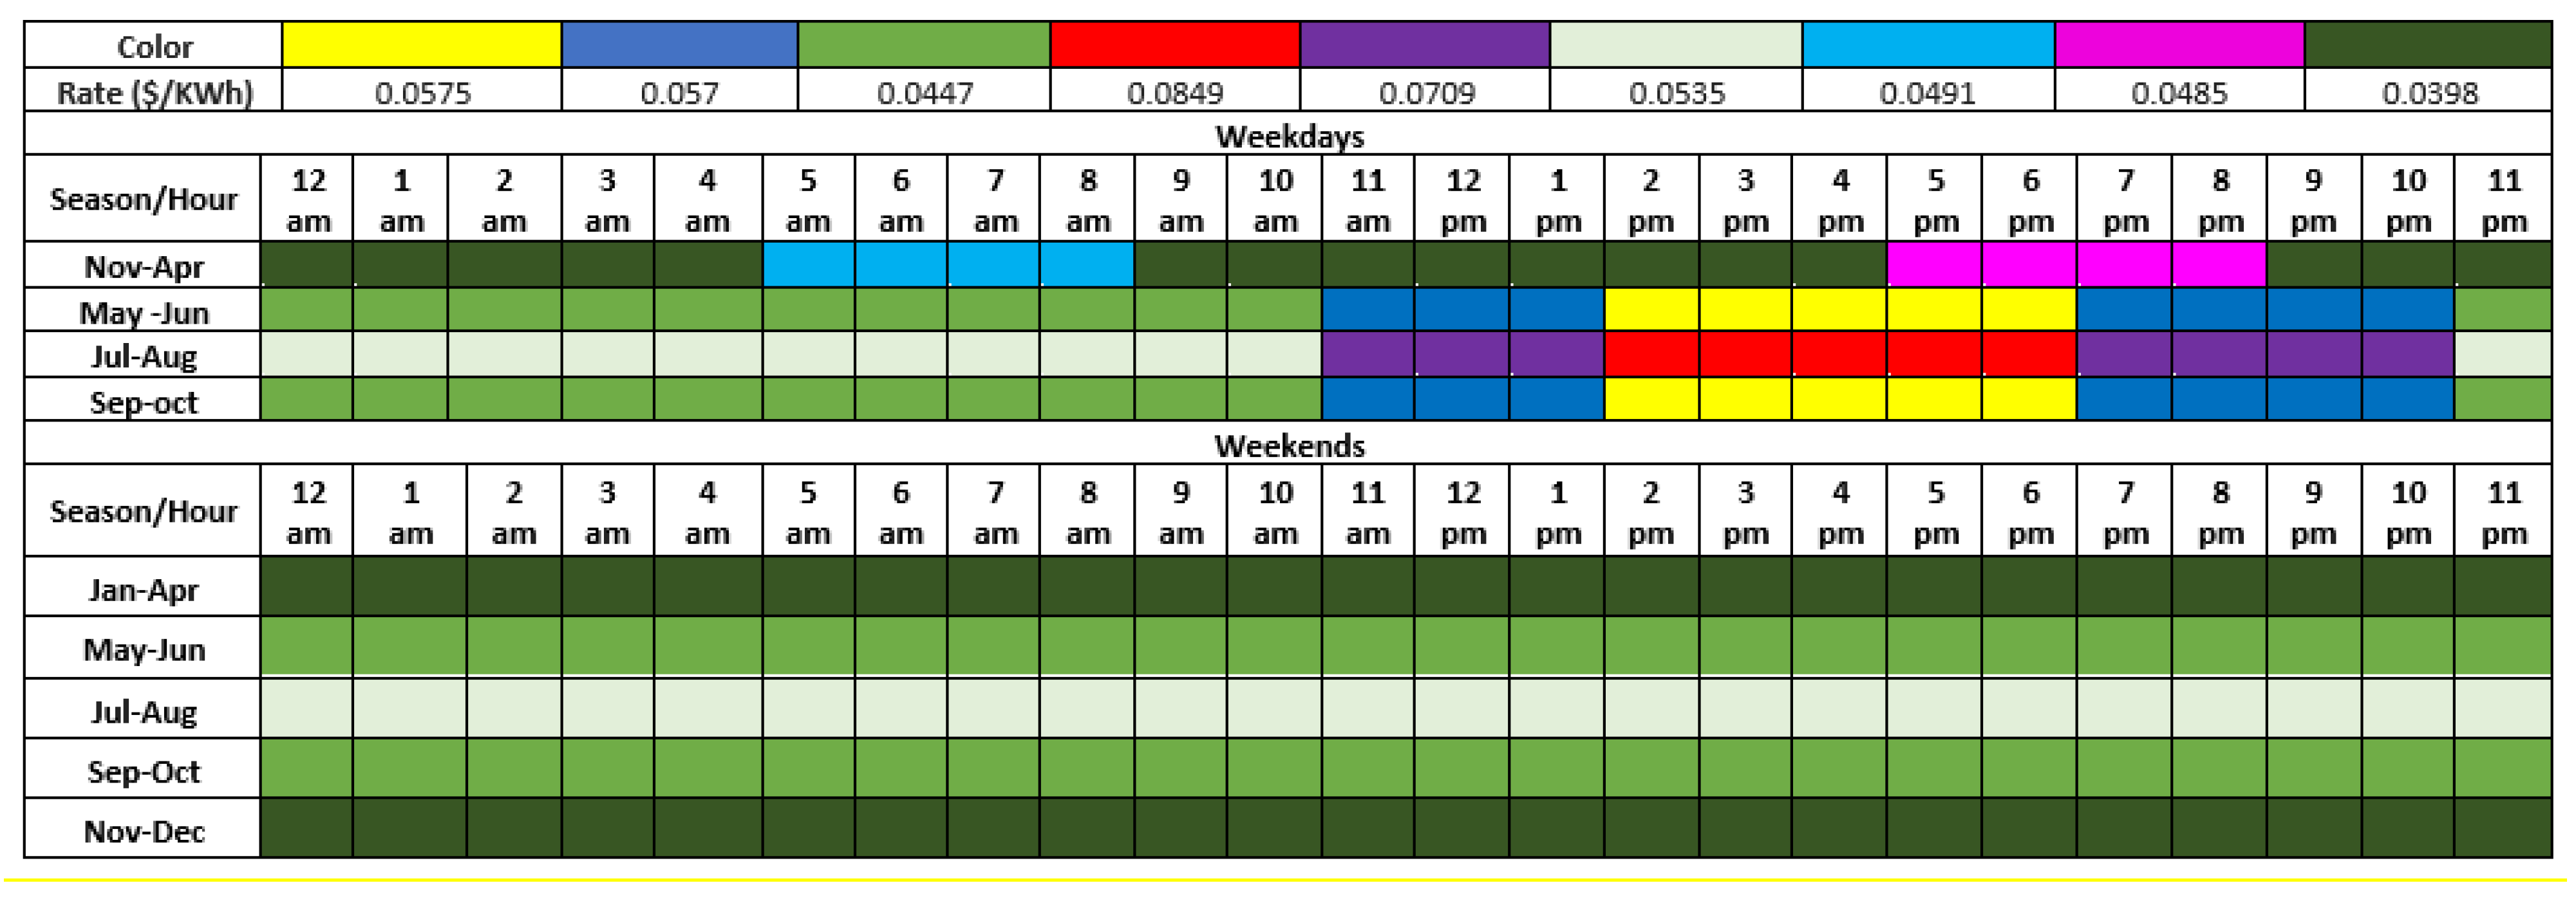
Figure 2. The electricity rates used for each location considered in this study are presented in
Appendix A. In particular, the electricity rates were collected from the Open Energy Information (OpenEI) database [
30] and represent real-world data from utilities within a 50-m radius from the cities listed in the previous section.
4. Results
In this section, we present and compare the results of the financial and resilience analyses (i.e., NPVs, solar PV system sizes, and BES system sizes) obtained with REopt for each location, load profile, electricity rate scheme, and outage scenario. The financial analysis maximizes the investor’s NPV over the project lifetime. Therefore, a zero NPV indicates that no solar PV and/or BES system will be deployed since it is not profitable. The resilience analysis, on the other hand, considers that the system should be self-sufficient for a certain number of outage hours. This, in turn, may result in negative NPVs, meaning that the system satisfies the resilience requirements but is not profitable.
4.1. Phoenix, AZ Region—Financial and Resilience Results
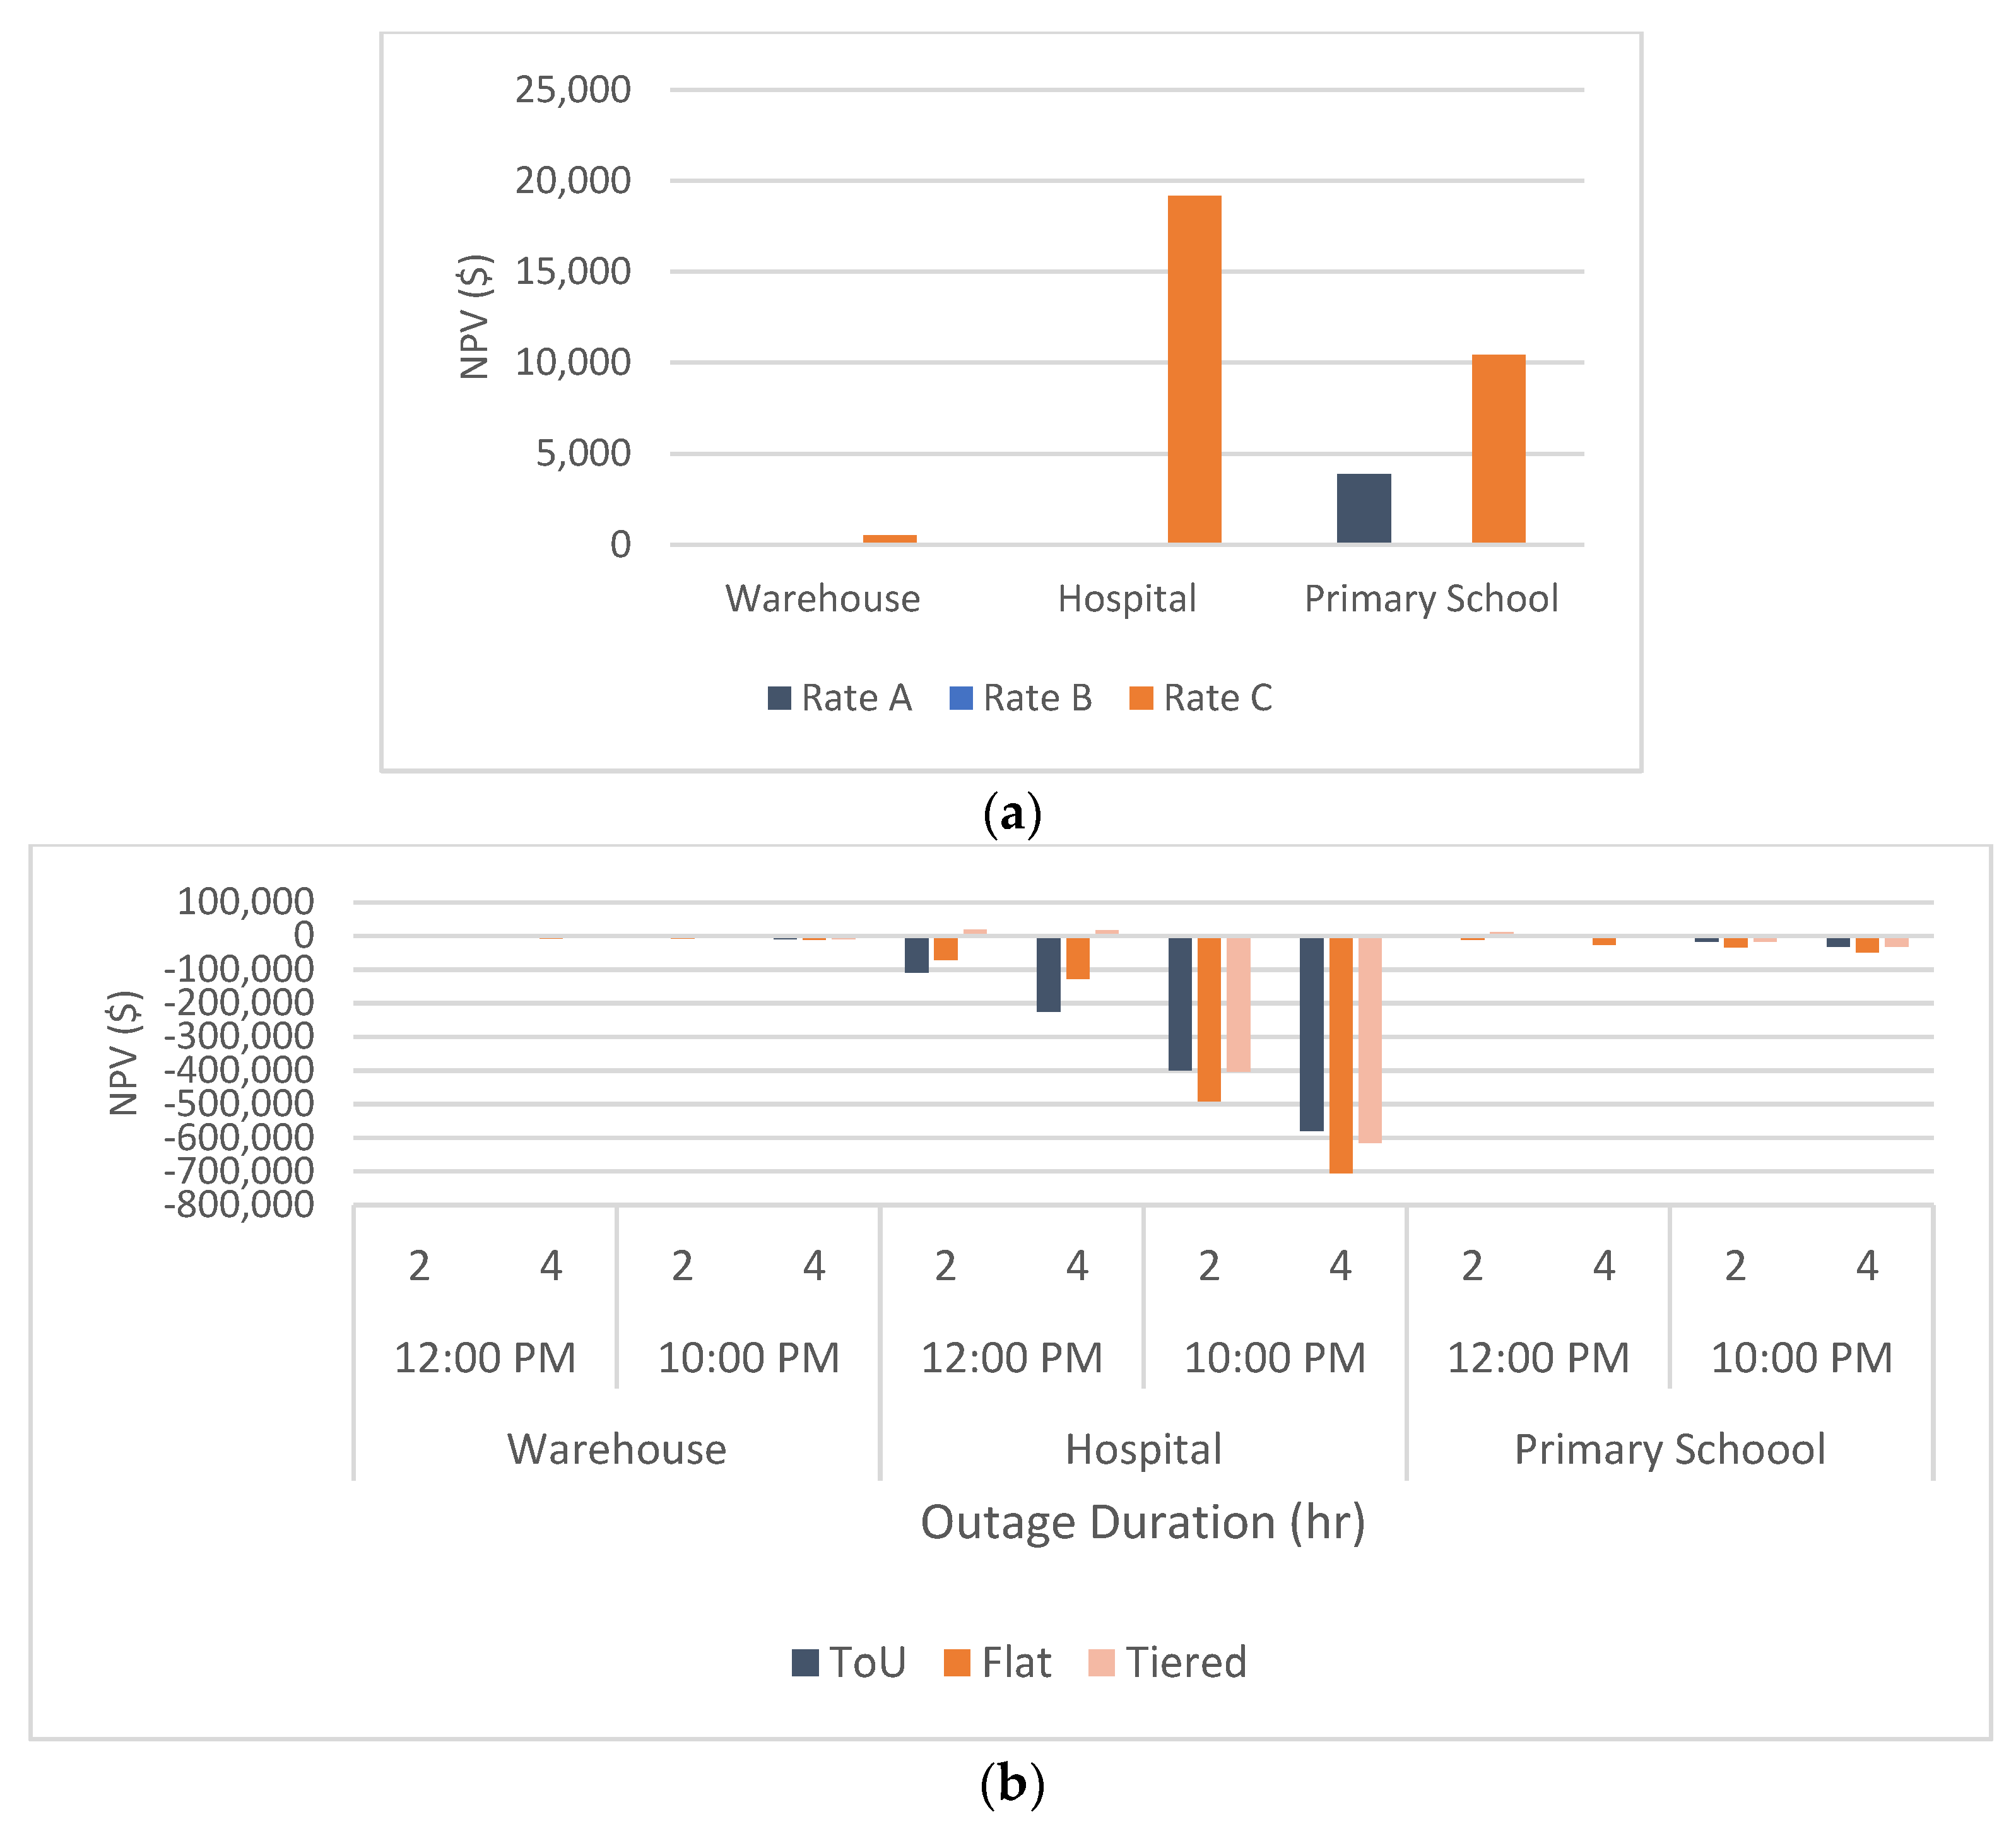
The NPV results for all loads in the Phoenix region are shown in
Figure 3. Note that the flat rate is not favorable for any of the loads in the financial analysis, meaning that no solar PV and BES system will be deployed since it is not profitable. In addition, ToU and flat rates did not show favorable results for the warehouse and hospital. However, the ToU rate allowed for an NPV of USD 3873 for the primary school profile. The tiered rate provided favorable NPV values for all three load profiles, more so for the hospital (USD 19,178) and primary school (USD 10,424) profiles than the warehouse (USD 496).
The resilience analysis shows that there is a positive NPV using ToU rates for the primary school of USD 2767 for a 2-h outage. The flat rate is highly unfavorable in the resilience analysis due to none of the profiles resulting in a positive NPV. Combined with the tiered rate, the hospital profile shows NPVs of USD 18,098 for a 2-h outage and USD 16,009 for a 4-h outage. The primary school profile shows NPVs of USD 10,187 and USD 3481 for a 2-h and 4-h outage, respectively. Although the daily DNI is the highest out of the three regions studied in this paper, Phoenix presented the lowest NPV values on average, mainly due to the low commercial rates.
Table 2 shows the positive NPV results from both the financial and resilience analyses in the Phoenix region for each commercial load. It also shows the optimal solar PV system size along with the BES system power and capacity for each combination of inputs. Note that only the ToU and tiered rates resulted in positive NPVs. It was found that the size of BES systems tends to increase with the outage duration, where the PV size remains constant in most cases.
4.2. Kansas City, MO Region—Financial and Resilience Results
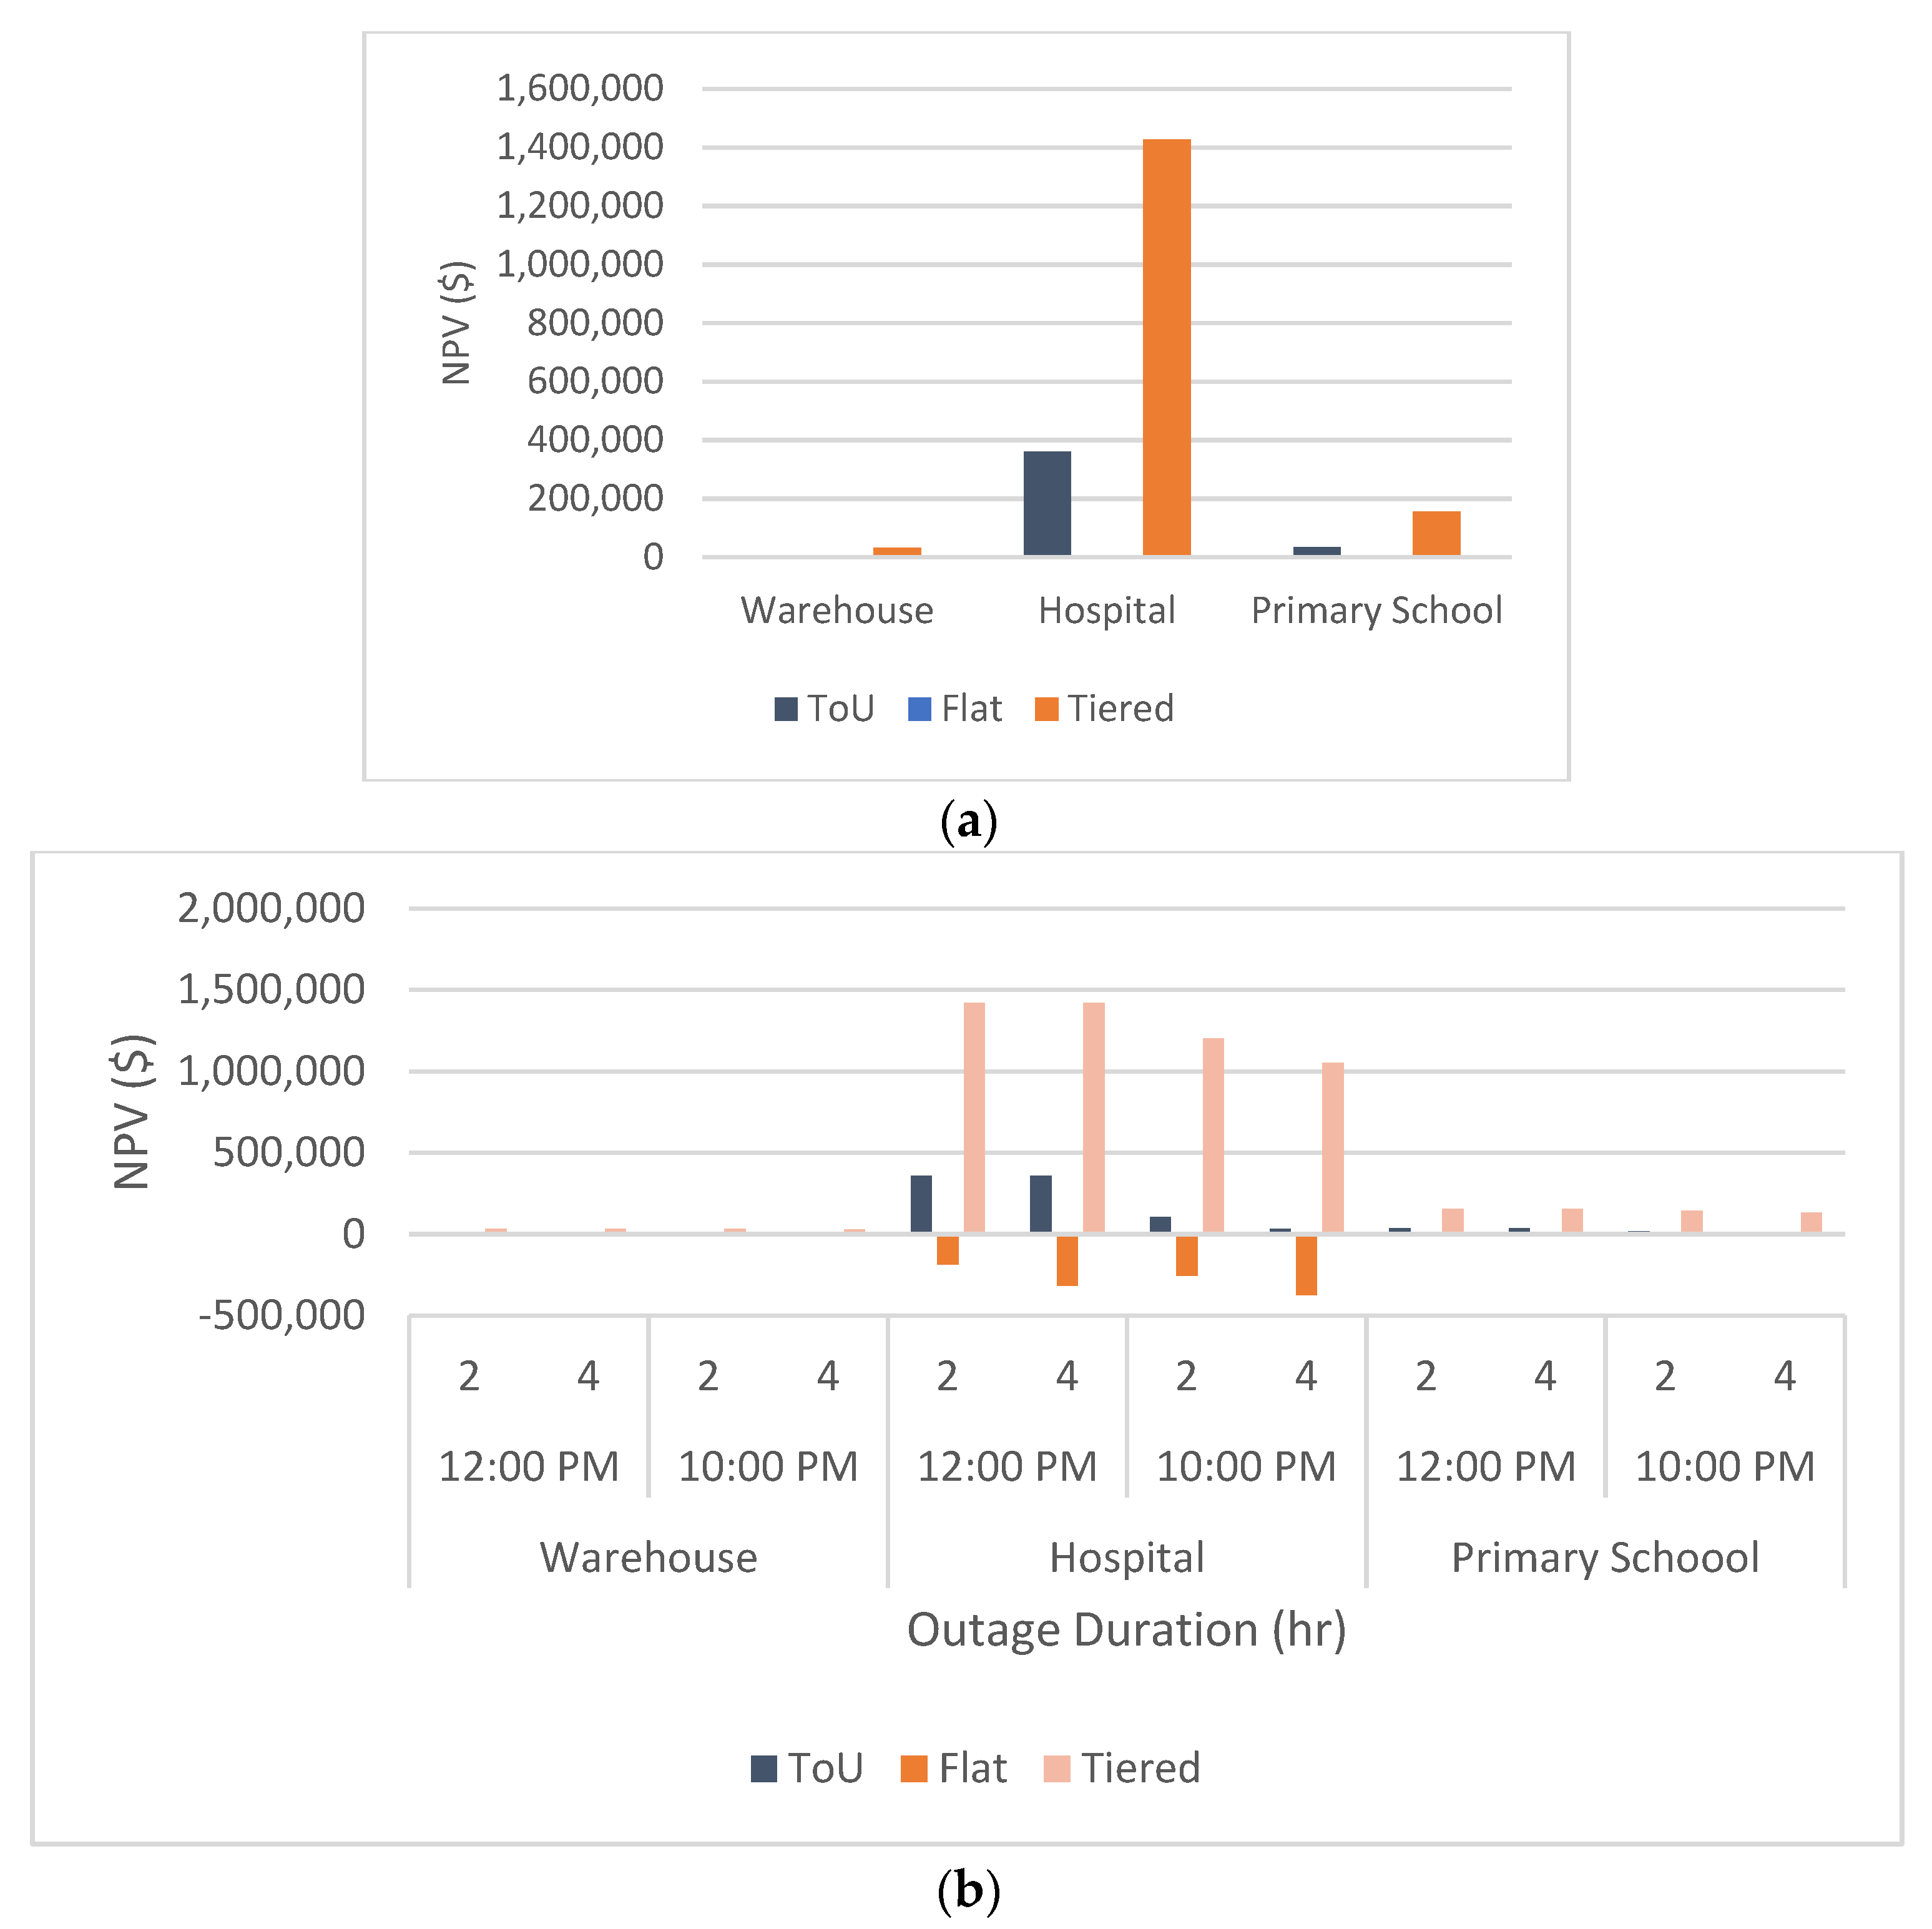
The NPV results for commercial loads in the Kansas City region, both financial and resilience analyses, are shown in
Figure 4. It was found that the tiered rate gives the most favorable results in the financial analysis, giving NPV values of USD 33,121; USD 1,427,000; and USD 157,002 for the warehouse, hospital, and primary school, respectively. The ToU rate resulted in NPVs of USD 6716; USD 362,089; and USD 35,576 for the warehouse, hospital, and primary school, respectively. Although relatively small, the flat rate gave positive NPV values that should be considered.
For the resilience analysis, the flat rate gives a positive NPV only for a 2-h outage for a primary school load. All other profiles and shortage duration combinations are negative, meaning that such customers cannot obtain a profit with solar PV and BES systems under this rate. On the other hand, the ToU rate resulted in positive NPVs for most of the outages evaluated. Commercial loads in the Kansas City region benefit from a PV and BES system for increased resilience under the ToU rate due to the high on-peak rates, compared with the other regions. Although Kansas City has a lower DNI than Phoenix, it presented more favorable NPV results, especially due to the higher commercial rates.
Table 3 shows the positive NPV results from both the financial and resilience analyses in the Kansas City region for each commercial load considered. It also shows the optimal solar PV system size along with the BES system power and capacity for each combination of inputs. It was found that, differing from the Phoenix case, the flat rate resulted in a positive NPV for both the financial and resilience analysis. Moreover, all the financial results for the commercial loads under a flat rate suggested the installation of a BES system in conjunction with a PV system. Note that the NPV of a hospital can vary from USD 5264 (for flat rate) to USD 1,427,000 (for tiered rate). The results show that the BES system capacity tends to be higher for night outages.
4.3. Boston, MA Region—Financial and Resilience Results
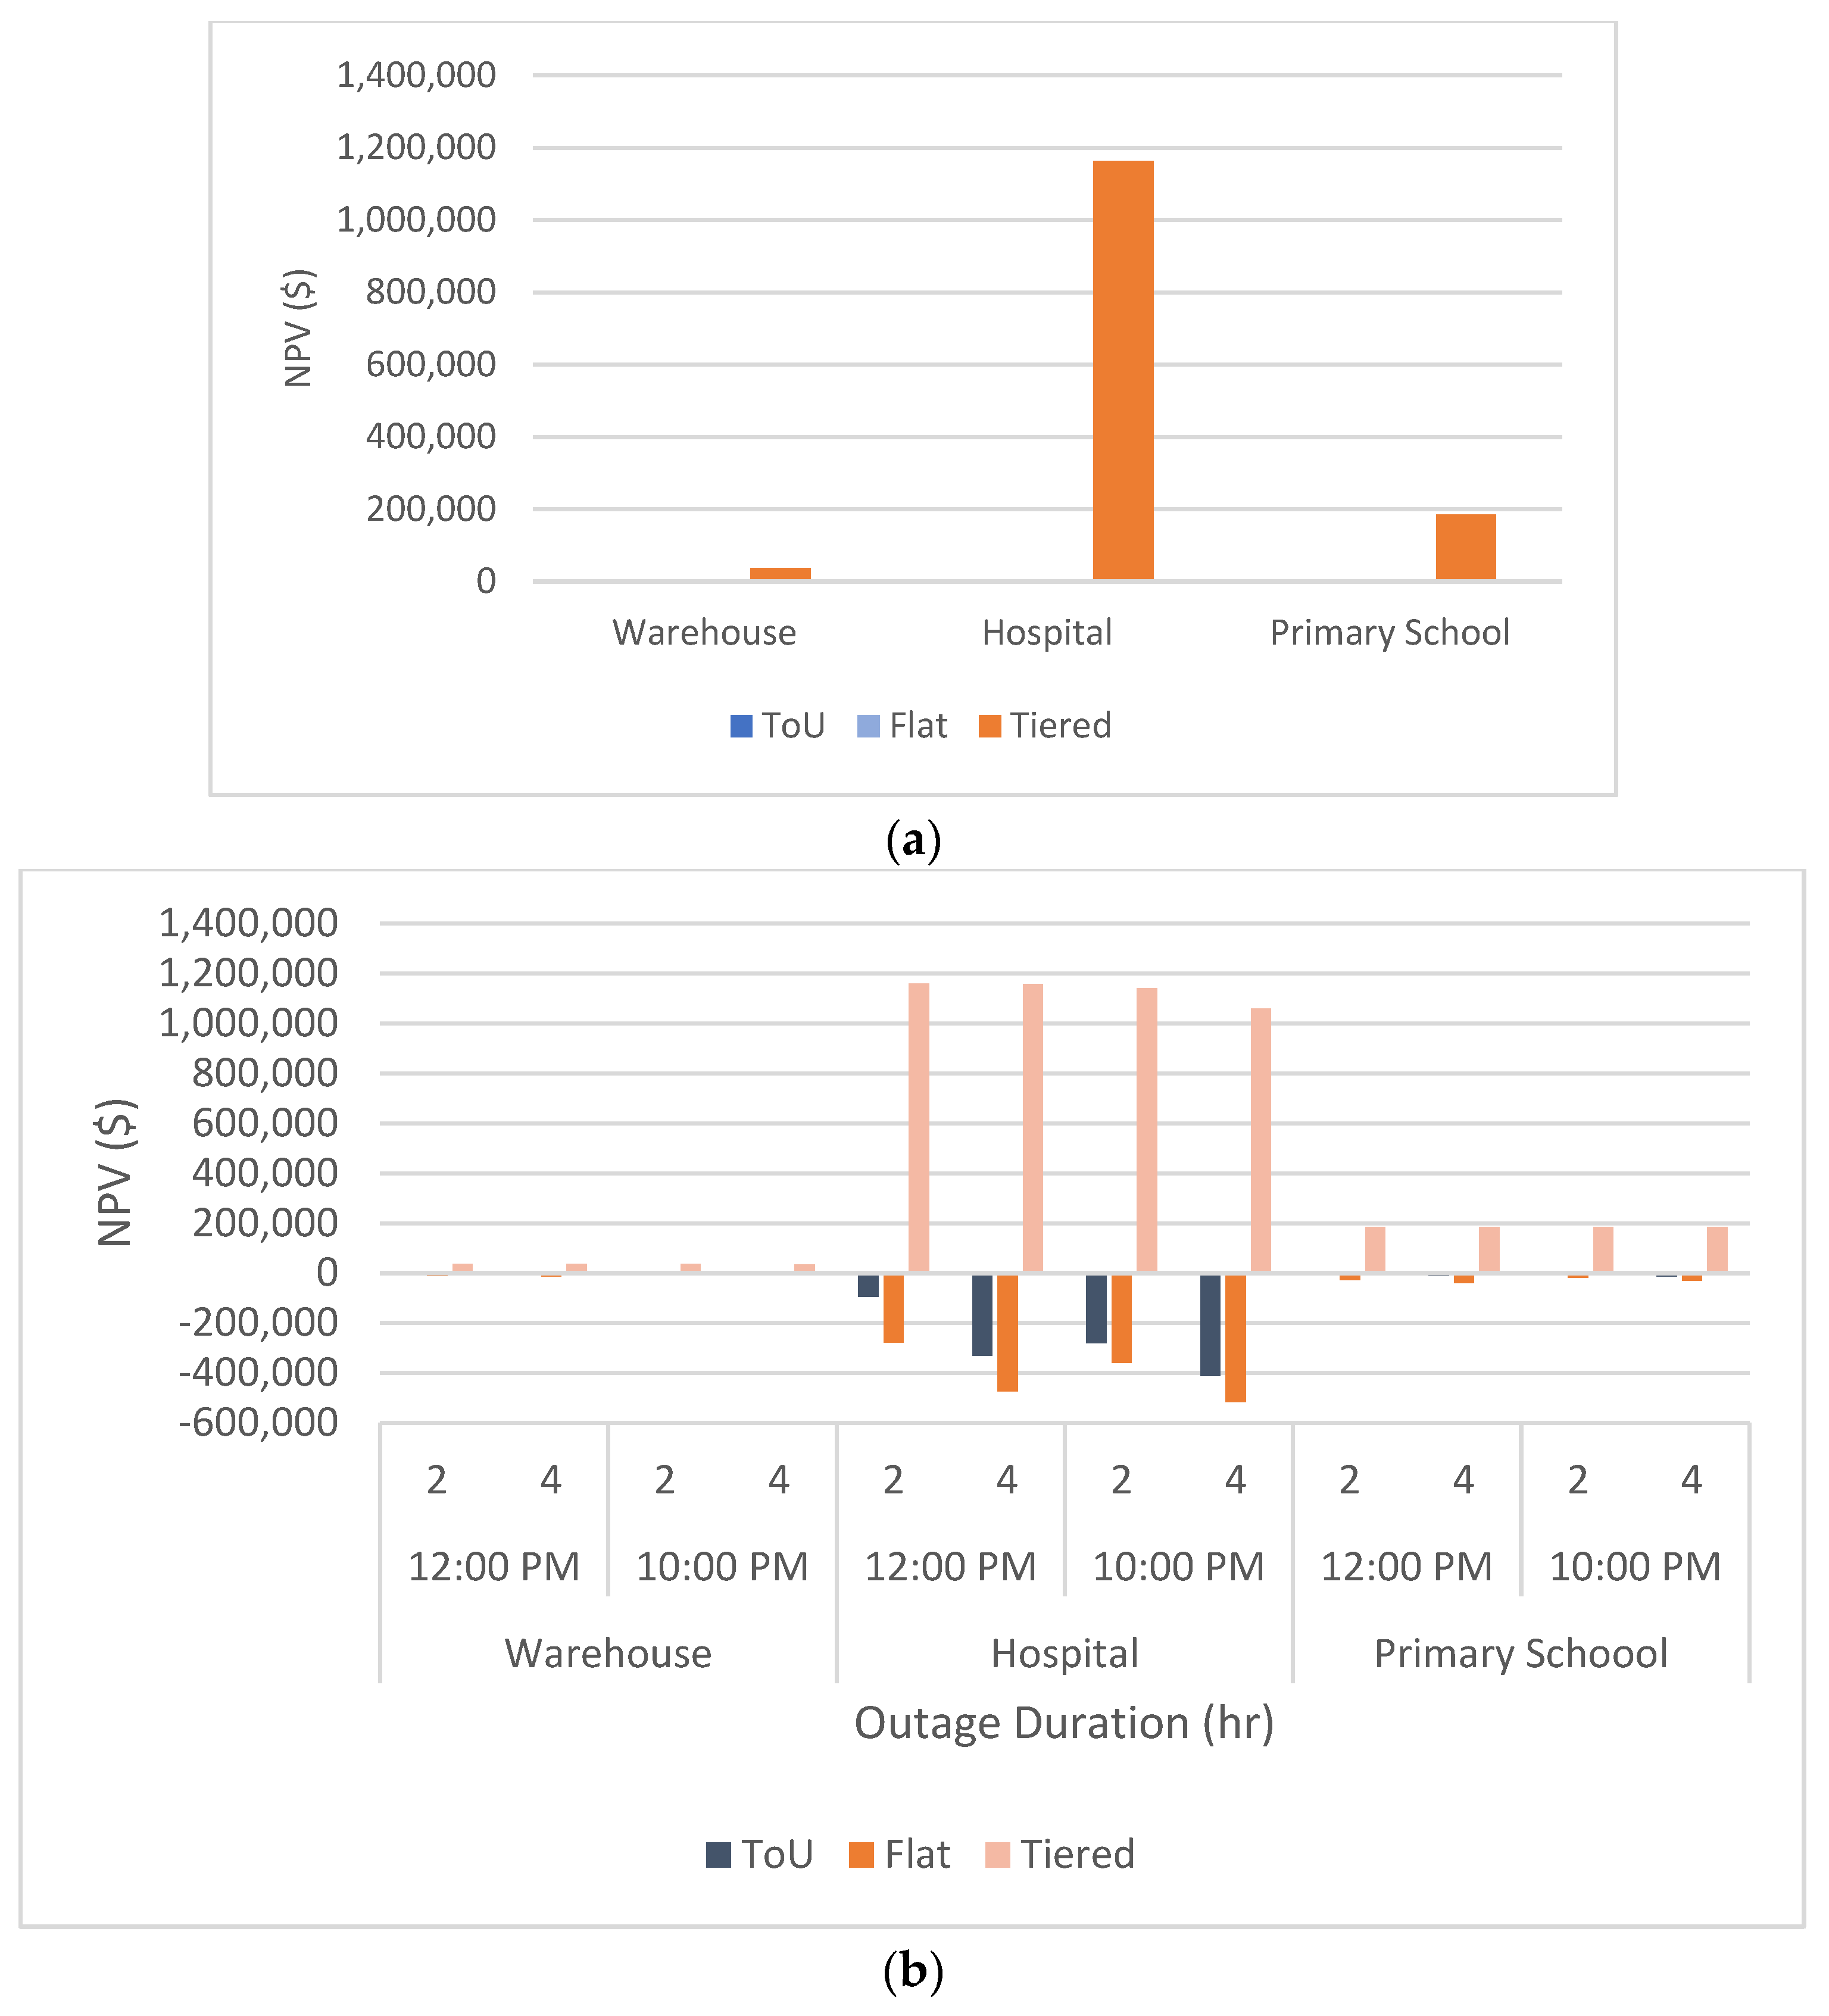
The ToU, flat, and tiered rates produced positive NPVs for all commercial loads in the Boston region, as shown in
Figure 5. In particular, utilizing a tiered rate results in considerable savings for each load profile: USD 36,888 for the warehouse, USD 1,164,797 for the hospital, and USD 184,709 for the primary school, respectively.
The resilience analysis completely favors the tiered rate since all outage scenarios are positive. The other two rates do not provide positive NPV rates for any of the outage parameter combinations. Note that the tiered rate is much higher than the ToU and flat rates. Therefore, it is more effective to install a PV and BES system under the tiered pricing scheme. The Boston region has the lowest DNI but the highest tiered rate of the three regions studied in this paper, thus resulting in the highest NPVs. The results show that regardless of the low DNI level, commercial customers in the Boston region can benefit from solar PV and BES systems for both financial and resilience purposes under tiered electricity rates.
Table 4 shows all positive NPV results from the financial and resilience analysis of Boston’s commercial rates on their respective load types. Note that, in the financial analysis, all rates resulted in positive NPV values for at least two commercial loads without requiring the installation of a BES system. For the resilience analysis, commercial loads under a tiered rate required larger BES systems to meet resilience requirements with lower NPVs. No positive NPVs were obtained with ToU and flat rates for any of the loads considered.
4.4. Examining the Impact of Electricity Rates on System Operation
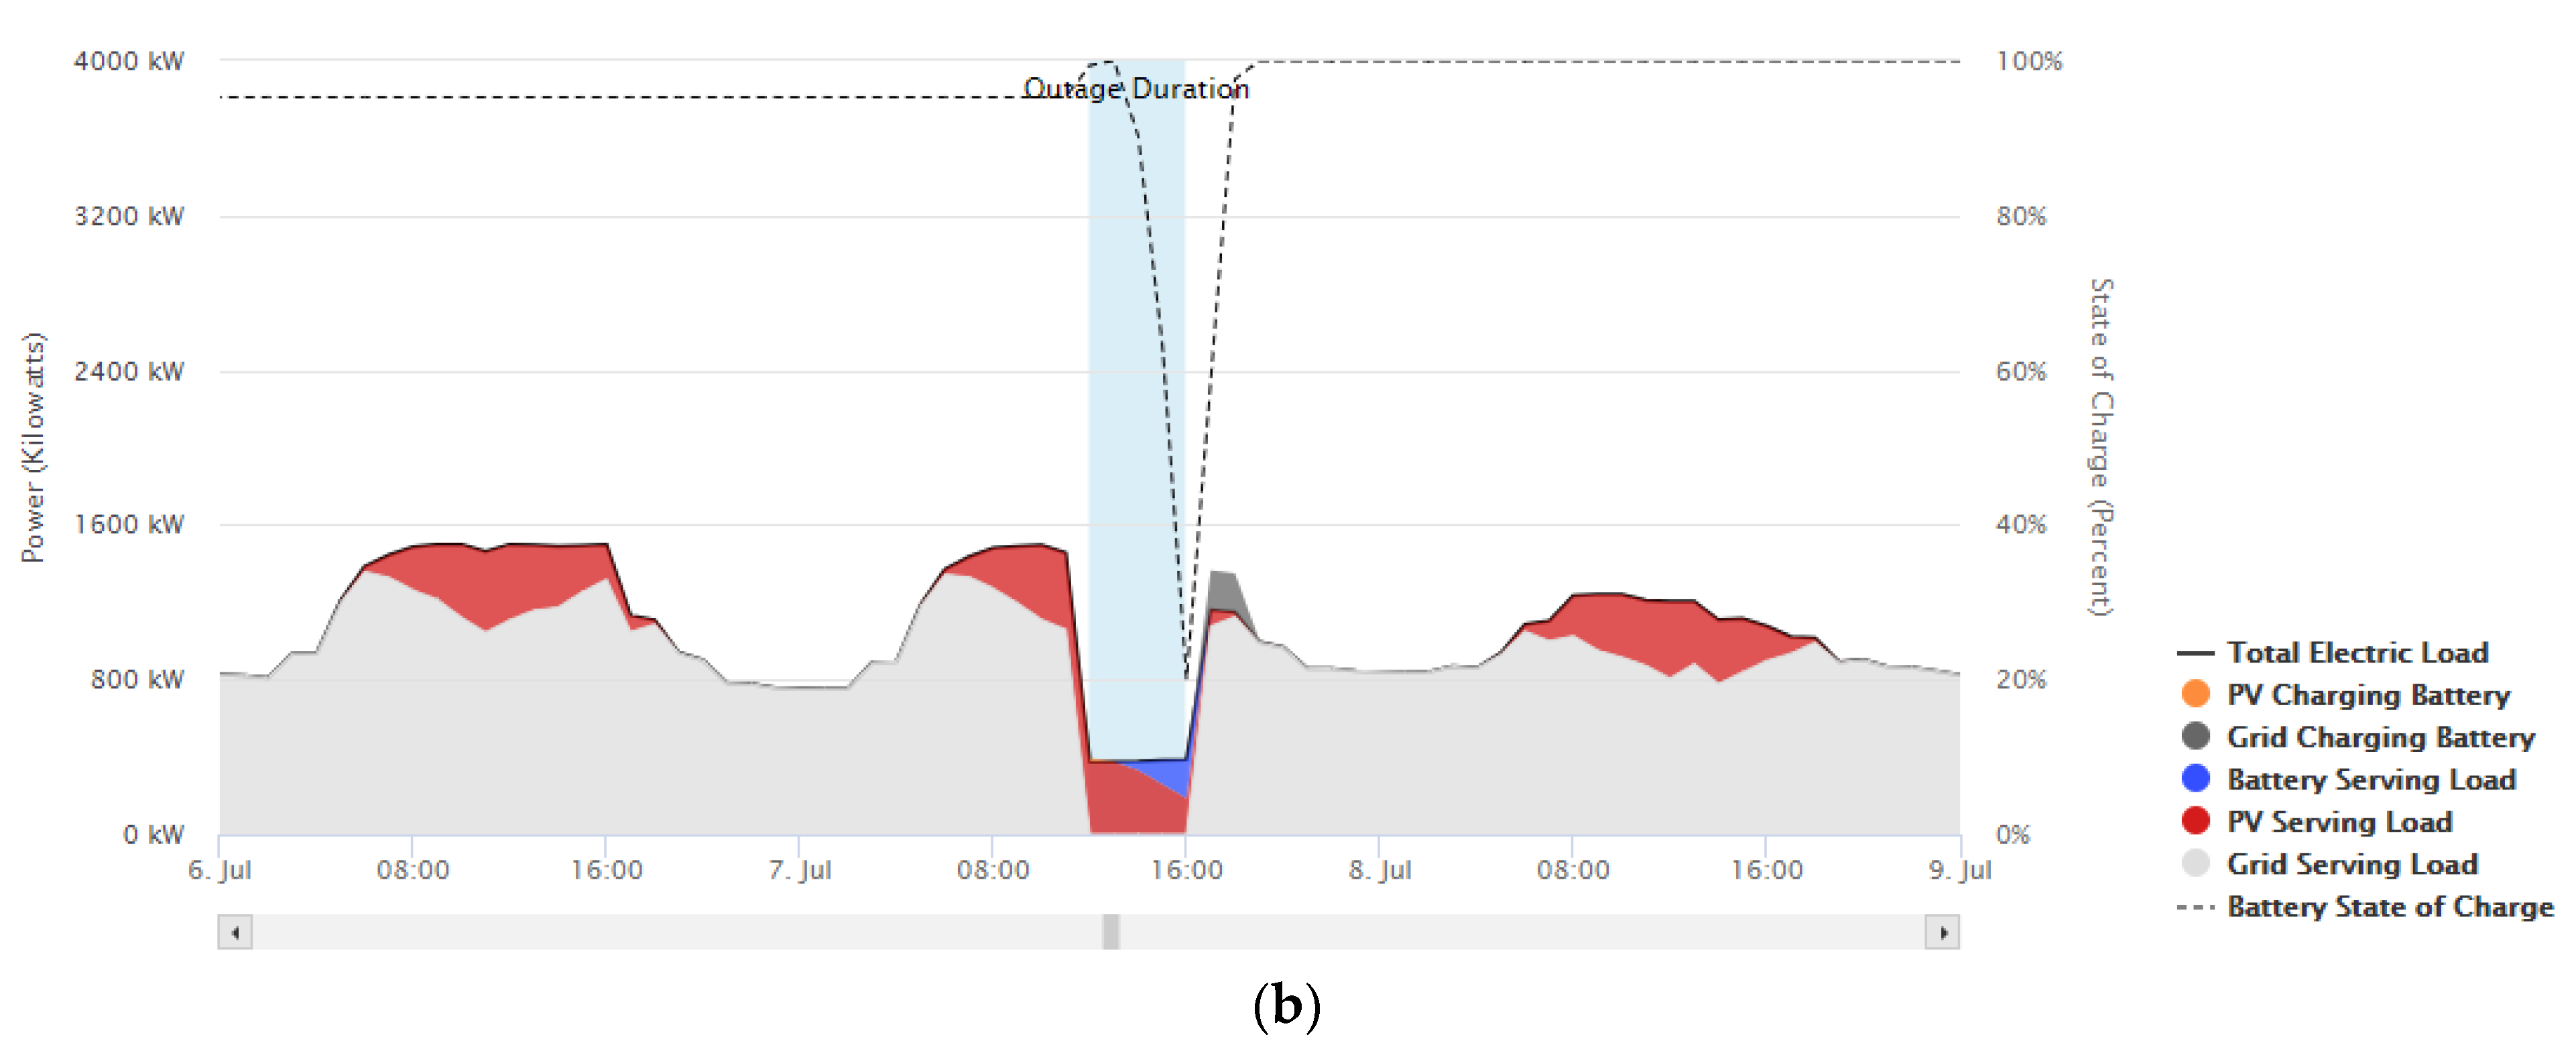
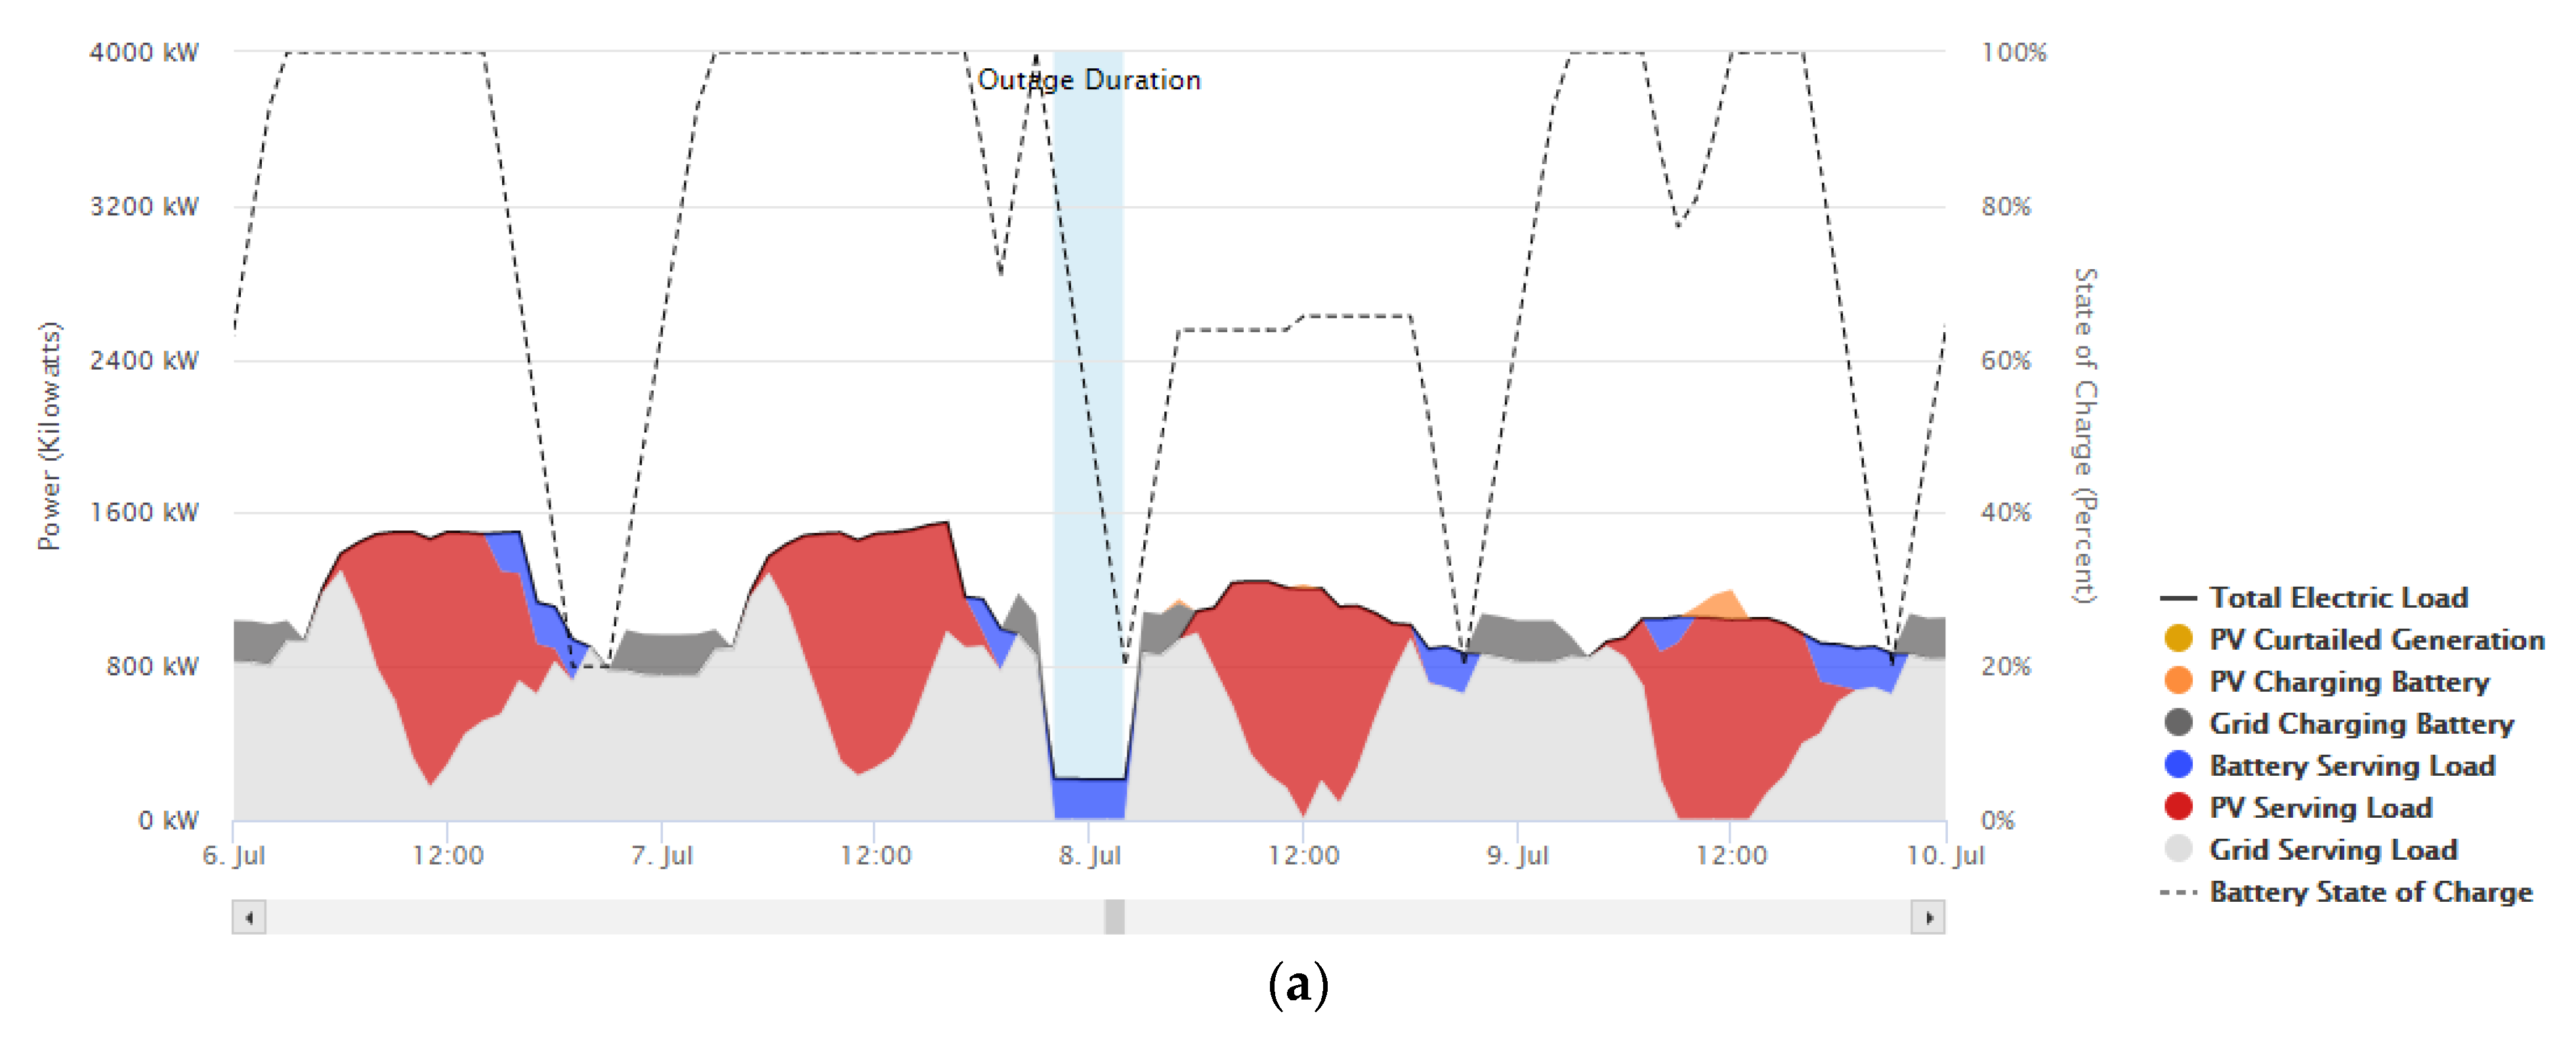
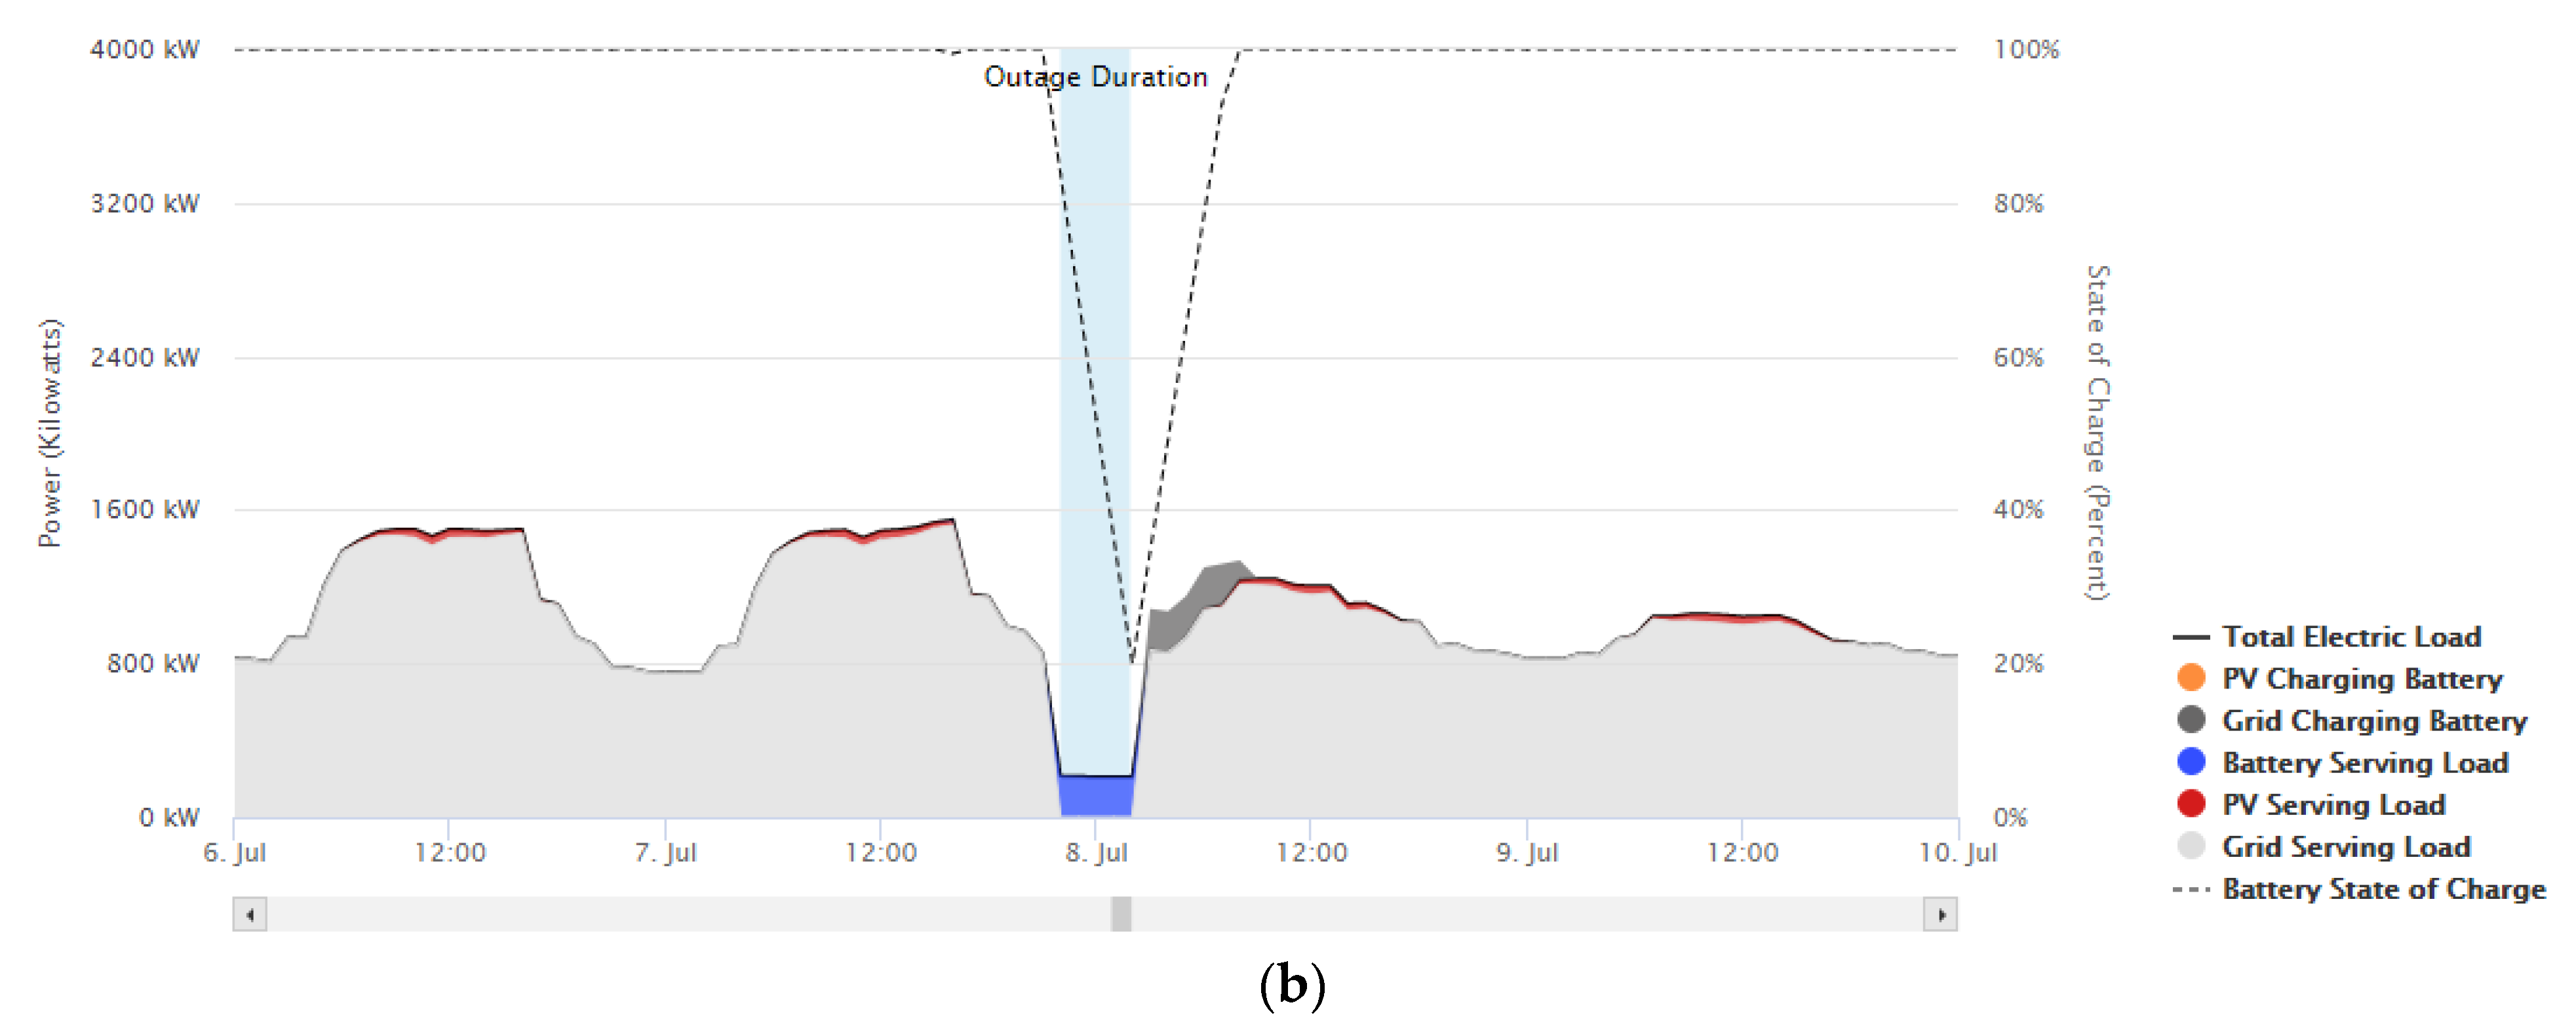
In this section, a deeper analysis is performed to study the impact of the ToU and flat electricity rates on the operation of the solar PV and BES system under a power outage. Kansas City was selected for this analysis due to the highest number of positive NPV results compared with the other two regions. The hospital load profile was used as the benchmark load since it is a critical load in any large-scale outage. Two types of outages were considered in this study: (a) a 4-h outage starting at 12 p.m., and (b) a 4-h outage starting at 10 p.m.
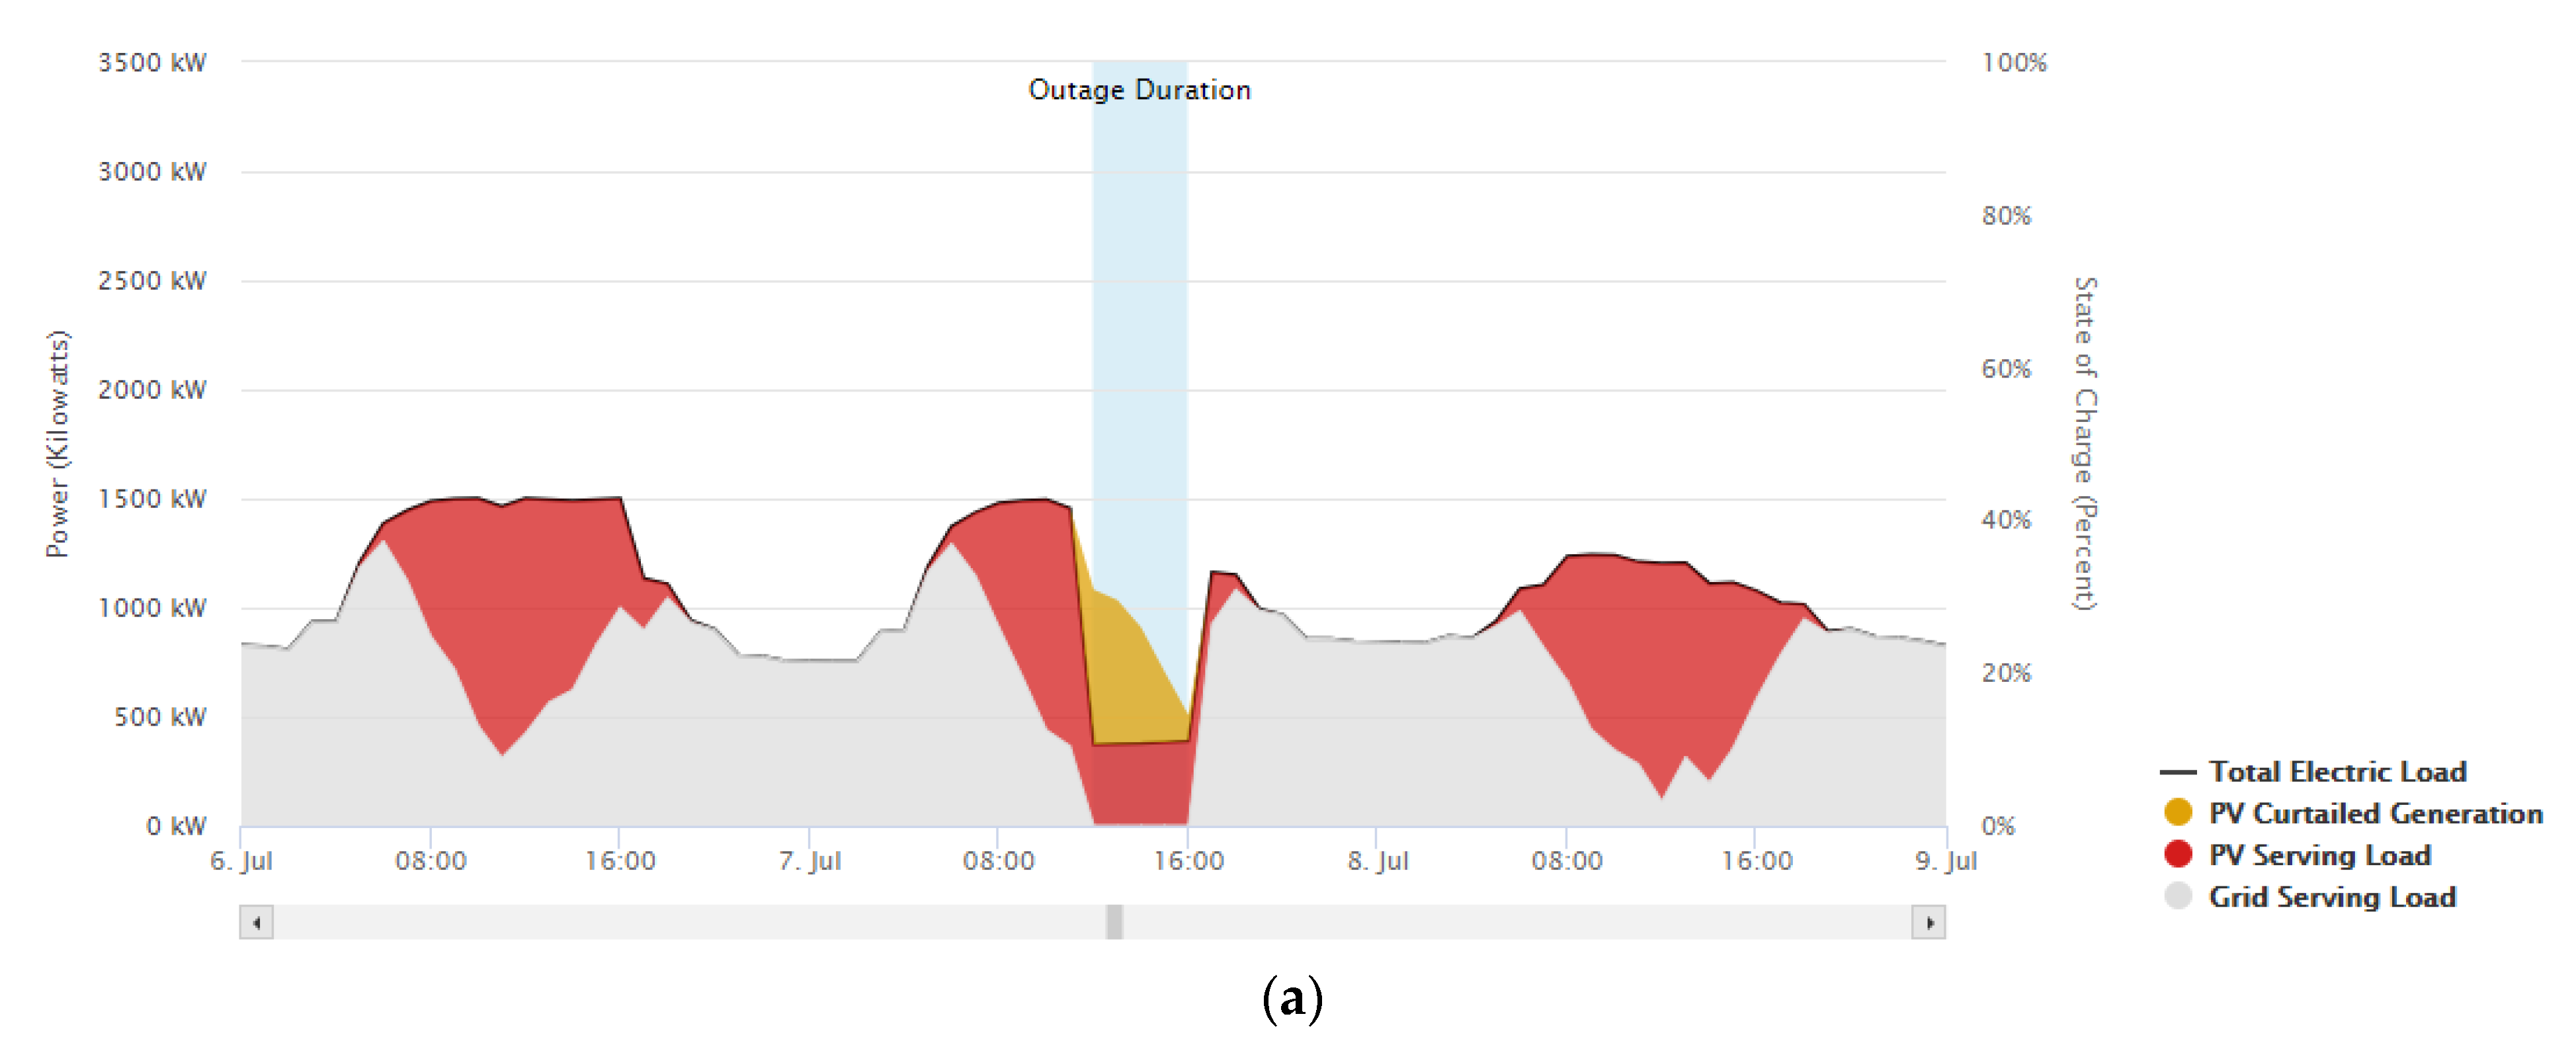
Figure 6 shows the system operation for the ToU and flat rates, respectively.
It was found that PV generation is curtailed when using ToU rates. In this case, a BES system is not installed. Therefore, the PV systems are large enough to supply the critical load during an outage. A substantial amount of the generated power is curtailed because the panels must supply enough power during the usual peak hours of the hospital. The PV system size required for using the ToU rate is 1831 kW. On the other hand, the optimized model for a flat rate requires a PV and BES system. The PV, in conjunction with the battery, supplies the power required for the critical load. This results in high costs for the customer, and inevitably a negative NPV. A PV capacity of 667 kW is required, in conjunction with a BES system that can provide 202 kW with a capacity of 495 kWh. This results in high costs for the customer, and an inevitably low NPV of −USD 317,751. For a business-as-usual case (i.e., no outage considered), a PV and BES system is not necessary. However, the grid will not be able to support the load during an eventual outage.
Figure 7 illustrates the system operation during a 4-h outage starting at 10 p.m. During this time, the sun’s energy cannot be immediately harvested. Therefore, all rates require a BES system that can provide power during the outage, charging during the day using the grid and PV generation. This, in turn, will impact the size of the required BES system and the overall NPV. The NPV under the ToU rate is shown to be USD 33,046 with a PV size of 2062 kW and a BES system delivering 214 kW and a capacity of 1393 kWh. The flat rate still results in a negative NPV of −USD 374,714 with a PV size of 2525 kW and a BES system delivering 254 kW with a capacity of 1393 kWh. This reiterates the necessity for an alternative and cost-effective power generation option for night outages using this flat rate.
5. Discussion and Conclusions
Installing solar panels with a BES system on buildings has the potential to promote increased power system resilience by mitigating the impacts of power outages and to help investors to reduce the dependency on the main power grid and reduce their energy costs. As renewable energy and BES technologies improve in efficiency, cost, and customer accessibility, more buildings are expected to accommodate such technologies. This paper analyzed the impact of various electricity rates on the financial and resilience outcomes of solar PV and BES systems in commercial buildings, considering different combinations of geographic locations, load profiles, utility rates, outage durations, and times, using REopt Lite’s simulation software. The impact of rate pricing on PV and BES system operation was then closely analyzed using a hospital’s load profile in the Kansas City region and two types of outages. Solar PV size, BES system size, and NPVs were recorded as results for each simulation run to provide a feasibility metric for each combination.
The variability of the NPV results showed that the electricity rates can significantly affect the feasibility of solar PV and BES systems for financial and resilience purposes, even in regions with higher solar irradiation levels. For example, the Phoenix region, with the highest DNI level, showed less favorable results than Kansas City in many cases. This was due to the lower rates comparatively in Phoenix, which requires smaller PV and BES system sizes. It is not feasible to have a very large PV and BES system when there is no positive return after, in this case, 25 years of use. Kansas City presented very favorable results, and this is most likely due to the moderate amount of sun, and the need for PV and BES systems when rates are higher, thus increasing the NPV of the system. The Boston region had overall favorable NPV results as well. This strengthens the argument that the pricing of utility rates greatly impacts the need for PV and BES systems, more so than DNI.
This paper also analyzed the impact of different electricity rates on the PV and BES system for a critical hospital load subject to outages during the day and nighttime. It was found that electricity rates can significantly affect the size of the PV and BES system, as well as the charging and discharging of the battery, and whether either the BES system or the PV should be exclusively installed. For example, a 2-h outage starting at 12 p.m. does not require the installation of a BES system for ToU and tiered rates, whereas a 495 kWh BES system is needed when considering a flat rate and the same outage scenario. It is crucial, therefore, to further investigate different commercial rate structures that are ideal for a PV and BES system in regions with aggressive decarbonization goals in order to promote increased resilience and cost-effectiveness. The specific analysis of rates should encourage customers to identify other rates that could be more cost-effective for different outage scenarios. Future research should also investigate how tax incentives and renewable energy programs in various locations, each with a different DNI level, can affect the capital investment costs and operation costs of PV and BES systems under different rate structures.
It is important to test as many parameters as possible to give customers and contractors metrics when deciding whether the location is suitable for the candidate building load to install a PV and BES system for different purposes. As weather becomes more severe and unpredictable, the development of cost-effective and climate-resilient energy systems is paramount. This should not be limited to PV and BES systems. Other power generation and storage options with potential to improve the resilience and return of investment should be further investigated. Financial and resilience analyses on a variety of renewable energy micro-power systems may lead to resilience improvements nationwide, including financial gains for commercial building owners.
