Article

Experiments and Modeling of Solid–Solid Phase Change Material-Loaded Plaster to Enhance Building Energy Efficiency

CNR (Consiglio Nazionale delle Ricerche)—ITAE (Istituto di Tecnologie Avanzate per l’Energia) “Nicola Giordano”, Salita S. Lucia Sopra Contesse 5, 98126 Messina, Italy
*
Authors to whom correspondence should be addressed.
Energies 2023, 16(5), 2384; https://doi.org/10.3390/en16052384
Submission received: 17 January 2023 / Revised: 20 February 2023 / Accepted: 27 February 2023 / Published: 2 March 2023
(This article belongs to the Special Issue Phase Change Materials for Thermal Energy Storage Applications 2022)

Abstract

:
In this paper, cement mortar IN200 integrated with solid–solid PlusIce X25 commercial PCM was fully characterized for the first time via experimental tests and numerical simulations. An experimental setup was designed and built to evaluate the thermal performance of the composite. Experimental results confirmed the expected advantages of the PCM-loaded plaster in terms of inner surface temperature, inbound heat flux reduction, and the enhanced damping effect on the average temperature. The experimental results were used to validate and calibrate a finite element model implemented in COMSOL Multiphysics® 5.6. The model was adopted to carry out a parametric analysis assessing the influence of PCM mass fraction, phase transition temperature, and PCM mortar thickness. The composite thickness was the most influential parameter, resulting in an energy saving increase from 3.29% to 72.72% as it was increased from 10 mm to 30 mm. Moreover, the model was used in a set of dynamic simulations, reproducing real Mediterranean climatic conditions to capture the transition process for a long period in buildings. The PCM mortar located on the interior side exhibited the highest reduction in both heat flux and inner surface temperature, representing a simple approach to achieving the best thermal comfort conditions.

1. Introduction

The choice of appropriate building materials is among the most crucial research actions discussed in the context of the bioclimatic architecture concept to reduce energy consumption in buildings. The implementation of phase change materials (PCMs) into the building envelope is among the most investigated solutions to make the building sector more sustainable [1]. Applying PCMs to assist heating and cooling allows a reduction in the energy consumption of buildings with a positive impact on climate change [2,3,4].
PCMs are energy-dense materials that absorb or release energy as latent heat during a phase transition process in a narrow temperature range, thereby enabling the efficient use of thermal energy [5]. Depending on the materials’ nature, it is possible to classify them as solid–liquid or solid–solid phase change materials [1]. Solid–liquid phase change materials (SL-PCMs) absorb heat during the solid–liquid phase transition [6]. The solid–liquid PCM type is currently adopted in the building sector in the form of micro-encapsulated paraffins, salt hydrates, eutectic mixtures or water-based ice systems [7].
Solid–solid phase change materials (SS-PCMs) absorb thermal energy in the reversible transition from a solid in the crystalline or semi-crystalline phase to another solid in the crystalline, semi-crystalline or amorphous phase [8]. SS-PCMs exhibit inherent advantages over solid–liquid types, i.e., smaller volume variation, no leakage issues, no need for encapsulation, and no nucleating agents needed to prevent supercooling, which makes them suitable for applications requiring long-term performance [9,10,11,12].
Direct incorporation, macro-encapsulation, micro-encapsulation, immersion, and shape stabilization are examples of techniques used to implement PCMs in the building envelope [13,14]. The integration in cement mortars can be realized, i.e., by embedding microcapsules of PCM inside the mixture or by impregnating the pure cement [15].
The investigation of the influence of PCM integration on the thermal characteristics of building materials as well as the introduction of methods to integrate them in cementitious mortars has gained interest in recent years. Frazzica et al. [16] investigated the thermal performance of two commercial micro-encapsulated hybrid cement mortar PCMs, Micronal DS 5038X and Micronal DS 5040X, for warm climate applications. The composites with nominal melting points of 23 °C and 26 °C in different percentages were produced and experimentally characterized. A numerical model, validated with the experimental data, was used to perform a parametric analysis aimed at defining an optimized melting temperature in order to reduce the overall energy consumption inside buildings both in winter and summer. The results showed that a melting temperature of 27 °C and a PCM mass fraction of 15% allowed to improve the comfort conditions by about 15% compared to pure cement mortars.
Wi et al. [17] prepared a bio-based mortar/microencapsulated PCM (B28) composite specimen for external insulation plastering. They showed that the use of the proposed material with a latent heat capacity of 67.92 and 71.48 J/g during the endothermic and exothermic processes achieved significant thermal improvement. In detail, the time-lag effect was improved by 59.4% with 10 wt.% of PCM, indicating excellent thermal storage performance. Hattan et al. [18] evaluated the thermal behavior of a shape-stabilized PCM incorporated in building plastered walls. The proposed PCM, PEG 600, showed a high potential to provide thermal energy storage capacity in external masonry wall systems by mitigating indoor temperature fluctuation as well as reducing and shifting the peak temperature. A homemade experimental setup was employed to test wall specimens with different PCM contents and water-to-cement ratios. Nemeth et al. [19] evaluated the heat storage capability and the effects on the thermal characteristics of paraffin PCM (Micronal® from BASF) microcapsule-loaded gypsum panel plaster. Through an experimental setup, two model houses, the reference one without PCM, were subjected to the same winter climatic conditions. They showed that the peak temperatures were delayed by ~2 h owing to the higher thermal inertia of the PCM walls. Moreover, both the minimum and maximum surface temperature values of the external walls in the PCM-plaster-lined house were ~2 °C higher than those of the reference house with better benefits for human comfort. Mi’ziane et al. [20] performed a numerical study to simulate the transient thermal behavior of a passive solar wall incorporating microencapsulated PCM. They showed a reduction in the peak temperature of ~1 °C and a shift of about 6.67 h in the peak-hour load due to the increase in the thermal inertia of the wall. Moreover, they showed that the oscillations in the amplitude of the heat flux and the temperature were affected by the wall thickness. Increasing the thickness from 1 cm to 3 cm, the maximum heat flux on the internal wall decreased from 43.98 W/m2 to 25.41 W/m2 while the maximum temperature from 27.94 °C to 25.88 °C. Dobri et al. [21] developed a semi-analytical model to describe the transient heat transfer in micro-encapsulated paraffin in gypsum plaster walls for building applications under constant flux conditions. They showed that the energy demands of an HVAC system were reduced by 15 to 20% with PCM volume loadings as low as 5%. Ramirez et al. [22] performed steady-state and transient simulations to investigate the thermal performance of solid–solid PCM-based acrylic plaster for thermal energy storage in building applications. They showed that the indoor temperature decreased by 67.26%, whereas the thermal lag increased by 9%. They assessed the viability of the proposed SS-PCM materials to control temperature fluctuations in relation to direct contact with outdoor/indoor applications. Baccega and Bottarelli [23] carried out experimental tests at the lab scale and numerical simulations with COMSOL Multiphysics to characterize a lime-based plaster with the addition of commercial A28 granular paraffin PCM. One reference lime-based plaster and one with incorporated 10% wt of granular PCM were applied to the external side of a wall. They showed a reduction in the incoming energy between 9% and 18%.
The brief literature review above shows that the vast majority of studies on PCMs has been focused on solid–liquid type.
Some recent studies have shown promising properties of the PCMs referred to as PlusIce [24,25,26]. This class allows to work in a wide range of operating temperatures between +4 °C and +89 °C covering the majority of the chilled water, heat recovery and heating applications in the building sector. Specifically, within the PlusIce class, the solid–solid type X (i) offers the chance to overcome the intrinsic drawbacks of SL-PCMs mentioned above and (ii) presents interesting physical properties that are promising for thermal storage applications. However, a thorough characterization of its properties and thermal performance is still lacking. For the first time, the present paper proposes a comprehensive characterization of the commercial PlusIce X25 integrated into pure cement mortar IN200 for thermal storage in the building envelope via experimental tests and numerical simulations.
A detailed finite element model implemented in COMSOL Multiphysics® 5.6 was validated and calibrated based on the experimental results. The model was used to evaluate, through parametric simulations, the benefits deriving from the application of the proposed solid–solid phase change material as a building construction material.
Most of the studies available in the literature—when carrying out parametric investigations—focus on one or two aspects only (typically, PCM fraction and melting temperatures). In contrast, in the present work, the numerical model represents the basis for giving a wide perspective on the application of the investigated composites towards their real application in buildings. In particular, the optimal mass fraction, PCM-loaded plaster thickness, phase transition temperature and wall stratigraphy are analyzed and discussed, thus making a step forward in the experimental application in realistic conditions. The numerical simulations showed a high potential for follow-ups and future studies. The PCM-loaded plaster’s benefits were discussed in terms of the inner surface temperature and inbound heat flux reduction, the heat latent stored and the attenuation of the temperature peaks.

2. Experimental Section

The first part of this study aimed at the preparation of the composite PCM mortar specimen. Before proceeding with its preparation, the pristine PCM, PlusIce X25, was characterized by differential scanning calorimetry (DSC) to check the stability of the material and to evaluate experimentally its main parameters (phase change enthalpy, transition temperature and specific heat). The experimental characterization was performed in the laboratory of CNR-ITAE in Messina.

2.1. Materials

The composite PCM-loaded plaster used in this study was prepared according to UNI EN 196-1 standard by mixing 10 vol.% of PlusIce X25 inside an IN200 gauged mortar. The PlusIce X25 was produced by the PCM Products Company (UK) [27] whereas the cement mortar IN200 was supplied by Tradimalt S.p.A. Therefore, the selected PlusIce is a solid–solid PCM; during the phase transition, its crystalline structure changes from one lattice configuration to another at a fixed and well-defined temperature. The amount of thermal energy stored as latent heat is comparable to the most effective solid–liquid PCMs. The selected cement mortar is IN200 supplied by Tradimalt S.p.A. The base mortar is a base coat plaster made from Portland cement 425. R Type II, lime, graded sand and specific additives for internal and external walls of residential, tertiary, commercial and industrial buildings. The main features of the material include high breathability, lower shrinkage and easy application with modest quantities of mixing water.
As evidenced in Figure 1, the preparation of the composite specimen consists of four phases whose detailed description is available in [16]. After pre-mixing the dry mortar constituents, the PCM was added to the mortar slurry. Different samples were prepared by allowing the volume percentage of the PCM to vary. After mixing, the PCM-filled mortar slurry was placed in a formwork where it was dried for 28 days in a climatic chamber according to UNI EN 1015-11, forming a sample with dimensions 100×100×20 mm.

2.2. Characterization

2.2.1. DSC

The thermal characterization of the PCM was carried out through differential scanning calorimetry (DSC). The DSC-1 Mettler Toledo instrument, calibrated with high-purity Indium, was used to determine the latent heat and the phase change temperature of the PCM. In the material preparation process, it was noticed that the pristine PlusIce X25, during the mixing phase, was totally dissolved by water. For this reason, in order to understand the effect of the dissolution phenomenon on the thermal properties of the PCM, calorimetric tests were carried out before and after the dissolution in water. The calorimetric tests were conducted between −10 °C and +60 °C with a heating/cooling rate of 2 °C/min under an 80 mL/min nitrogen flow. All the measurements were carried out with 40 µL open Al crucibles.
The DSC tests were used also to determine the specific heat (cp) of the pristine PlusIce X25 and PCM mortar composite samples. The DSC manufacturer software is based on the “DSC Sapphire” method. The DSC signal of the PCM was compared to that of the Al2O3 chosen as the reference material as no phase change took place in the selected range temperature.
The Cp was evaluated following the UNI EN 821-3: 2005 standard:
c p s = [ ( S s · m s ) S e ] · m c · c p c [ ( S c · m c ) S e ] · m s
where Ss and ms are the DSC signal [W/g] and the mass [g] of the specimen, and Sc, mc and cpc are the DSC signal, the mass and the specific heat [J/g K] of the Al2O3. Se is the DSC signal [W] of the empty crucible.
To avoid the discontinuity point in the correspondence of the phase transition, during which, both sensible and phase change heat influence the value of Cp, the tests were performed between −10 °C and 20 °C.

2.2.2. Thermal Performance

The thermal performance of the PCM-based composite was evaluated using the experimental apparatus already described in [16] and shown in Figure 2.
The experimental system mainly consists of two controlled thermal sources (thermostatic baths), able to reproduce different temperature profiles on the bottom side of the specimen in order to analyze the temporal evolution of the temperature on the upper side.
The bottom and the upper side will be referred to as external and internal walls, respectively. Its main feature is the possibility to comparatively test two different cement mortar bricks under the same testing conditions. It means that it was possible to operate the assembled equipment as a differential apparatus, evaluating the main features of the base IN200 gauged mortar against the PlusIce X25-loaded sample under the same operating conditions. The specimens were placed on an aluminum plate heat exchanger (HEX) in order to apply a temperature profile on their bottom side. To limit heat dissipation towards the environment, the system HEX specimens was insulated by a wooden box coated with polyurethane foam (thermal conductivity 0.025 W/m K).
The HEX was connected through a hydraulic circuit to the thermostatic baths kept at different temperatures. The two thermostatic baths, TC1 and TC2, used for cooling and heating the plant, respectively, had a capacity of 4.5 L and a power of 1.2 kW and allow to work within the temperature range [−28, 200 °C].
The circulation of the heat transfer fluid inside the hydraulic circuit was regulated with a system of 5 manual valves. In particular, V5 is a bypass valve that avoids breakdown or overheating problems. Three class A type T thermocouples were located on the upper side of each sample to dynamically monitor the temperature evolution due to the heat transfer from the plate HEX. In detail, thermocouples T2, T3 and T4 were placed on the PCM-based specimen while T5, T6 and T7 were placed on the pure mortar cement specimen. A further three thermocouples were used to monitor the HEX temperature (T0, T1) and the ambient temperature (T8). The experimental setup also included the National Instruments (NI) Data Acquisition connected to a dedicated LabVIEW® software.
Two different tests, defined as “equilibrium” and “continuous tests”, were performed to evaluate the thermal performances of the samples. Both of them applied a temperature step to the samples, consisting of the application of a sudden temperature change from 10 °C to 40 °C on the plate HEX. For the “equilibrium tests”, the step was prolonged until the temperature on the top surface of both samples reached a stable temperature for at least 30 min with a tolerance band of ±0.5 °C. For the “continuous test”, each heating up/cooling down step lasted 60 min. The selected temperature range is representative of typical Mediterranean climatic conditions.

2.3. Experimental Results

2.3.1. DSC

The results of the DSC tests for pristine and water-dissolved PlusIce X25 are depicted in Figure 3. It reports the heat flow rate (W/g) as a function of temperature and the value of the main calorimetric parameters: latent heat, onset temperature and peak temperature. The DSC manufacturer software measured the latent heat (mJ) of the solid–solid transition by peak integration. The water dissolution induces a slight degradation in the pristine PCM due to a decrease in the phase change enthalpy by 20.76% and 21.19% in the heating and cooling ramps, respectively.
To compare the pristine and water-dissolved PlusIce X25 in terms of stability, twenty consecutive cooling/heating cycles inside the calorimetric equipment were carried out. The number of cycles was selected to check whether a strong degradation occurs for the treated material or not. As it will be described later, the results showed a certain enthalpy reduction, which can be considered in line with the uncertainty of the measurement device and can be considered acceptable for the current activity. Future investigations will be dedicated to deep analysis of the stability and possible degradation mechanisms.
Figure 4 shows the obtained thermograms and Table 1 lists the main calorimetric parameters. The curves show that the pristine PlusIce X25 is almost stable both in the heating and cooling cycles. After the first heating cycle, the temperature peaks moved toward a lower temperature, passing from 38.17 °C to 34.17 °C and from 35.10 °C to 32.37 °C for the pristine and water-dissolved PlusIce X25, respectively. In the same way, after the first cooling cycle, the temperature peaks reduced from 21.77 °C to 17.93 °C and from 22.27 °C to 18.37 °C for the pristine and water-dissolved PlusIce X25, respectively.
Characterization tests showed that the onset temperature of the exothermic peak is lower than the onset temperature of the endothermic peak by about 6 °C. The highest phase change enthalpy reduction (10.57%) was observed in the pristine material after 20 cooling cycles. It was observed that the sub-cooling grade remained unchanged during the cycles. In both materials, there was no severe degradation in the shape of the thermograms even if a slight modification can be noticed in that of the exothermic peaks that, wider and indented, are composed of a series of smaller overlapped peaks.
The Cp curves obtained are depicted in Figure 5. The Cp of the pristine PlusIce X25 is in close agreement with the data sheets of the material [27]. The Cp of the PCM-loaded plaster is comparable to that of the pure mortar. This result could be explained considering that the small amount of PCM added (10% vol) to the pure mortar does not sensibly modify this parameter.

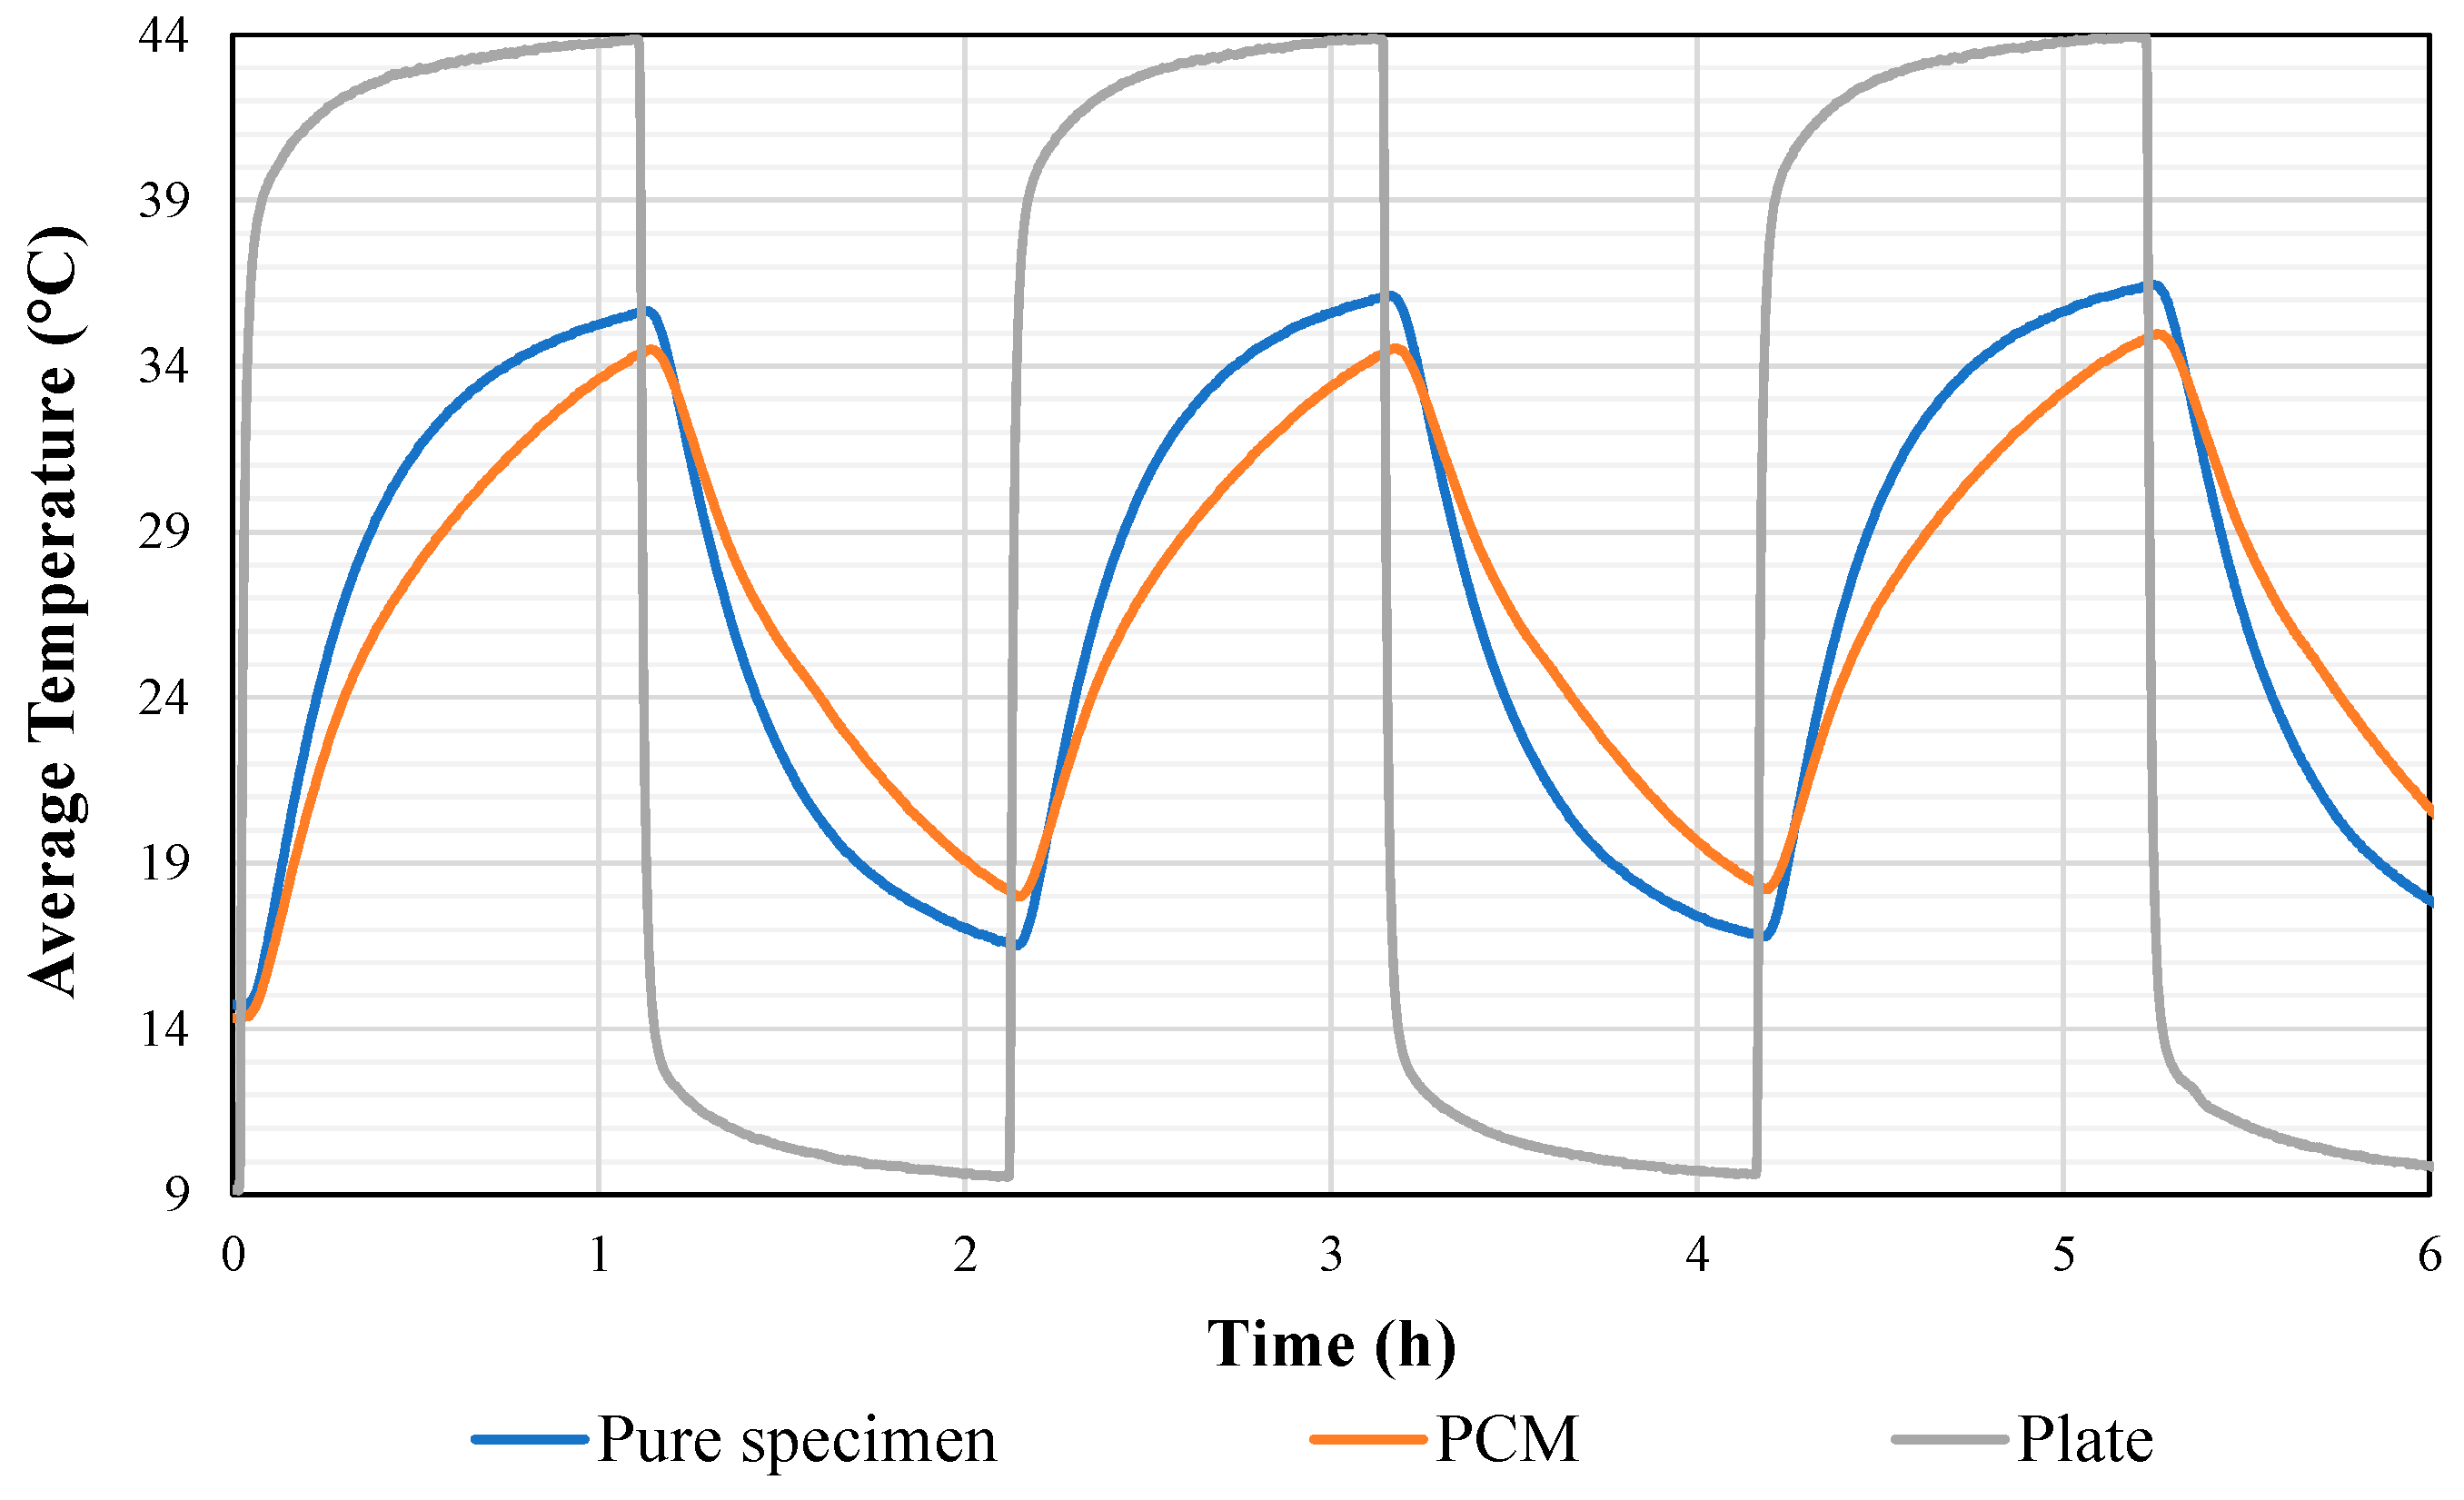
2.3.2. Thermal Performance

Figure 6 shows the results of a typical continuous temperature step test performed to evaluate the performance of the PCM-based sample in comparison to the reference the pure cement mortar specimen.
The evolution shows a temporal shift between the temperature of the plate and that on top of the two specimens as the stationary conditions were not reached simultaneously. After 1 h, a temperature difference of about 10 °C between the samples and the plate was registered due to the heat dissipation through the environment. Based on the experimental results, the enhanced thermal performance of the PCM specimen in comparison to the pure cement mortar specimen can be observed. The PCM specimen exhibited an improved damping effect on the average temperature. Indeed, compared to the reference specimen, the PCM-loaded plaster temperature was always higher during the cooling-down phase and lower during the heating-up. Briefly, 3.78 °C ± 0.01 was the maximum difference between the average temperatures measured.
The composite allows obtaining a temperature shift and an attenuation of the heat wave across the wall since the temperature evolutions diverge in the phase transition temperature range. The consequent reduction in the energy required for heating/cooling is the energy saving obtained thanks to the PCM inclusion, and it is proportional to the area between the blue and orange curves.

3. Numerical Analysis

3.1. Methodology

A 2D physical model of the system was implemented in COMSOL Multiphysics® 5.6 and validated based on the experimental results above discussed. The modeled specimen is a brick of size 100 mm × 100 mm and thickness of 20 mm composed of solid–solid PlusIce X25 commercial PCM (10 vol.%) and pure cement mortar IN200. The physical properties of the construction materials are listed in Table 2.
The following reasonable assumptions were made for modeling, based on either experimental evidence or previous studies:
  • The mixture pure mortar/ PCM is isotropic and homogeneous [28,29];
  • The physical properties are constant with temperature variations with the exception of the specific heat;
  • The PCM is simulated with variable Cp to include the latent heat effect in the transition interval;
  • Density, specific heat and thermal conductivity are equal for both solid phases of the PCM;
  • Volumetric expansion of the PCM during the phase change is neglected;
  • Possible supercooling effect is neglected;
  • Heat exchange by radiation is neglected;
  • Heat transfer is only in the thickness direction;
  • The temperature of the heat exchanger plate ( T H E X ) is uniform;
  • The system is initially started at the same experimental ambient temperature;
  • Simulations are carried out in transient conditions.
In order to reproduce the experimental conditions of the “continuous tests”, the following boundary conditions were assumed (Figure 7a):
  • Uniform temperature on the lower face of the specimen (Dirichlet’s condition) with temporal evolution imposed by the acquired experimental data;
  • Convective heat transfer on the external upper face of the specimen (Neumann’s condition);
  • Experimental ambient temperature on the upper face to simulate the convective heat transfer;
  • Perfect thermal insulation on the lateral sides.
The convective heat transfer on the external upper face h [W/(m2 K)] was set as a calibration parameter of the model. The experimental conditions of the “continuous tests” were imposed in a set of simulations aimed at investigating the effect of the mass fraction, transition temperature and PCM-loaded plaster thickness on the thermal performance of the specimen. The results referred to the pure and PCM-based specimens were compared in terms of energy saving (ES), defined as [28]:
E S % = | E PS E PCM | E PS 100
where E is the total energy demand, and the subscripts PCM and PS stand for phase change material and pure specimen, respectively. E is defined as:
E = t h e a t i n g / t c o o l i n g Q ( t ) d t
where Q is the heat flux [W/m2] across the medium.
The effectiveness of the PCMs was evaluated by comparing the heat flux across the specimen; therefore, from the point of view of the energy balance of the building, it represents the amount of energy to be provided (in winter) or extracted (in summer), i.e., by an HVAC system, to maintain comfort conditions for the occupants. The convective flux Q c o n v [W/m2] on the indoor face was evaluated by means of Newton’s law [30]:
Q c o n v = h i   ( T s u r f T f l )
where T s u r f is the temperature of the surface in contact with the fluid, T f l is the temperature of the fluid and h i the inner heat transfer coefficient [W/(m2 K)].
A set of dynamic simulations were carried out by imposing the sol-air temperature as the boundary condition (Figure 7b), instead of the temperature of the HEX plate, in order to reproduce real climatic conditions on an external wall slab assumed to face south. The sol-air approach allowed to include the value of the incident solar radiation G [W/m2] in the numerical model through an equivalent transient temperature profile. The sol-air temperature can be expressed as follows [16]:
T s o l a i r = T e x t + α   G h e x t
where T e x t is the external ambient temperature, α is the absorption coefficient of the wall (kept at 0.12) [31] and h e x t is the outdoor heat transfer adduction coefficient evaluated as follows:
h e x t 4   ε   σ   T e x t 3
where ε is the emissivity coefficient of the wall (kept at 0.96) [31] and σ is the Stefan–Boltzmann constant. It is worth noting that Equation (6) does not account for the wind speed effect. The experimental ambient temperature on the upper face was replaced with an internal temperature kept constant at 26 °C (summer conditions). The indoor heat transfer coefficient was assumed at 8.3 W/(m2 K) [32,33]. The simulations were initially started at the initial value of the T s o l a i r value.
The dynamic simulations were used to investigate the effect of the placement of the PCM-based mortar in the wall structure. The PCM-base mortar position, in fact, affects the heat storage efficiency and the indoor temperature regulation of the wall as well as its interaction with the outdoor environment.
All simulations were carried out with a triangular adaptive mesh with maximum and minimum element size of 1 mm and 0.02 mm, respectively. As the mesh size affects the accuracy of the simulations, a sensitivity analysis was carried out in order to minimize the discrepancy between approximated and exact solution. An average discrepancy below 1% in the predicted values of the average temperature on the upper side of the specimen was the criterion to select the grid for the final simulations. At each time step, i, the following condition was assumed as the convergence criterion:
T i T i 1 T i 1 10 6

3.2. Governing Equations

The conduction heat transfer mechanism occurring across the medium was evaluated by means of Fourier’s law [30]:
ρ   c p   T t λ   2 T = q
where T is the temperature [K] and q is the volumetric heat source [W/m3].
The density of the PCM-based specimen was evaluated as follows [34]:
ρ = ρ PCM   ϑ + ρ PS ( 1 ϑ )
where ϑ is the volumetric fraction (vol.%) of the PCM, which is correlated to the mass fraction, wt:
w t = ϑ   ρ PCM ϑ   ρ PCM + ( 1 ϑ )   ρ PS
The thermal conductivity of the PCM-based specimen was evaluated with the static model proposed by Maxwell [35]:
λ = λ PS   λ PCM + 2   λ PS + 2 ϑ ( λ PCM λ PS ) λ PCM + 2   λ PS ϑ ( λ PCM λ PS )
The energy balance for the PCM was evaluated as follows [36]:
ρ PCM   H t = λ PCM   2 T
where H is the total enthalpy [J/kg], which can be expressed as the sum of the sensible enthalpy and the latent heat as follows:
H = T 0 T c p PCM   d T + f L
where f is the PCM phase fraction above the transition temperature (solid phase 2), which can be expressed as follows:
f = { 0   i f   T < T S 1 T T S 1 T S 2 T S 1   1   i f   T > T S 2 i f   T S 1 < T < T S 2
[ T S 1 , T S 2 ] is the transition temperature interval between solid phase 1 and solid phase 2. In this work, the direct transition from solid phase 1 to solid phase 2 will be referred to as S1-S2 whereas the reverse transition from solid phase 2 to solid phase 1 is S2-S1.

3.3. Model Validation

The numerical model was validated against the experimental data. Figure 8 shows a comparison of the experimental and simulated data of a test carried out with a single temperature step from 10 °C to 40 °C. It is worth noticing that the inflection point in the red curve of the model represents the phase change temperature of the PCM.
During the heating-up phase, a portion of the heat flowing from the HEX plate into the upper surface drives the phase change of the PCM. Overall, the simulation results showed good agreement with the experimental data. The standard average deviation from experimental values of +0.36 °C, falling within the thermocouples uncertainty, allows assessing the ability of the model at describing the operation of the system.
The numerical results were further validated through the statistical metrics mean bias error (MBE) and root mean square error (RMSE), MBE % and RMSE % calculated as follows:
MBE = i = 1 N ( T i , m T i , e x ) N
RMSE = [ i = 1 N ( T i , m T i , e x ) N 2 ] 0.5
MBE   % = MBE T a v e , e x   100
RMSE   % = RMSE T a v e , e x   100
where T i , m is the ith value predicted by the model, T i , e x is the ith measured experimental value, T a v e , e x is the experimental mean value and N is the total number of measurements.
Based on the results, MBE (0.238), RMSE (0.538), MBE % (0.711) and RMSE % (1.611), the model can be actually considered able to describe the operation of the system.

3.4. Numerical Results

The validated model was used to carry out parametric analyses to evaluate the effect of PCM mass fraction, transition temperature and PCM mortar thickness on the thermal behavior of the specimen. As widely discussed in [32], these are the parameters that strongly affect the thermal behavior of a wall incorporating PCMs. Moreover, the model was used to perform dynamic simulations under real summer conditions in order to capture the transition phase over a long period. Typical Mediterranean weather conditions were used as input of the simulations. The meteorological data of ambient temperature and solar radiation were obtained from a weather station installed on the roof of the CNR ITAE in Messina, Italy. Finally, a characteristic day for summer was chosen and a set of simulations were performed to investigate the effect of the location of the PCM-loaded plaster in the wall structure. This section was divided into five subsections. In the first three sections, the effect on the thermal performance of the PCM-based mortar was discussed as the mass fraction, the transition temperature and the PCM thickness varied, respectively. The results are compared with the reference case of a pure mortar. The fourth section investigates the effect of the reference PCM (10 vol.%, Tf 25 °C) integrated in an external wall under real summer conditions in order to capture the transition process for a long period. The final section presents as a case study the use of the reference PCM-loaded plaster in different placements in the wall structure.

3.4.1. Effect of the PCM Mass Fraction

A set of simulations was aimed at investigating the effect of the PCM mass fraction on the thermal behavior of the composite. The experimental conditions of the “continuous test” were imposed in the present simulations. Figure 9 shows the effect on the thermal response for five values of mass fraction (from 5% to 25%).
The accumulated heat during the heating step is shown in Figure 10a.
Compared with the sample with 5 wt.% of PCM, all the samples have a larger area under the curves, indicating a higher energy storage capacity. It affects the time required for the wall surface to reach a given temperature value. For example, there is a delay of ~10 min to reach 26 °C on the upper surface with 25 wt.% mass fraction compared to 5 wt.%. Figure 10b shows the variation of the solid phase transition fraction defined in Equation (14). The lower the mass fraction of the PCM, the faster the transition of S1-S2. The solid fraction 2 increased with the simulation time. Due to the higher absorbed latent heat the ES increased almost linearly from 1.77% to 7.46% as the PCM mass fraction increased from 5% to 25%. The energy consumption and the associated operating costs represent crucial parameters for building designers to compare the performance of different building envelopes. This analysis will provide useful insights on the enhancement potential of the thermal efficiency of hypothetical composites. It has to be noted though that the maximum amount of PCM that can be loaded inside the composite must be properly investigated experimentally also from the mechanical stability point of view, which will represent part of future investigations. The samples realized so far with 7 wt.% of PCM demonstrated good mechanical stability. In order to increase the amount of PCM embedded, most probably, other additives (e.g., fibers) should be included to prevent possible cracking effects (due to the lower amount of binder) during the drying phase of the composites.

3.4.2. Effect of the Phase Transition Temperature

The experimental conditions of the “continuous tests” were imposed in a set of simulations aimed at investigating the effect of the phase transition temperature (Tf) for a PCM with all the other physical properties equal to those of the proposed X25 (e.g., 10% of PCM volume fraction). The results are shown in Figure 11.
The simulated values (from 20 °C to 30 °C) were selected according to the maximum temperature experimentally reached in order to ensure the transition phase of PCM. The phase-transition temperature of the PCM is a key parameter since it affects (i) the time interval during which the transition phase takes place and (ii) the storage efficiency of the specimen. At the beginning of the heating phase, the PCM was in the solid phase 1 for all transition temperatures. The transition phase S1-S2 took place due to the heat adsorbed through the upper surface of the specimen. Until the f fraction reached the maximum value 1, a reduction/increase in the inbound/outbound heat flux and an increase in the upper surface temperature were observed (Table 3).
The temperature reached at the end of the phase transition increased by 8.97 °C as Tf increased from 20 °C to 30 °C. A possible reason is that lower values of the transition temperature lead to a shorter thermal energy storage process, facilitating the conductive heat transfer toward the surface of the specimen. As the heating phase of the experimental tests is representative of summer conditions, the lower the transition temperature, the better the performance of the wall in terms of energy savings and temperature regulation capability. In detail, the ES reduced from 8.77% to 0.81% as Tf increased from 20 °C to 30 °C. The results showed that low transition temperatures are better only if the thermal stress of the wall does not cause a too-fast transition of the PCM which could limit the temperature regulation. This highlights that the phase transition temperature is a delicate design parameter for buildings’ walls, as its choice is dictated by site-specific climatic conditions.

3.4.3. Effect of the PCM-Loaded Plaster Thickness

The experimental conditions of the “continuous tests” were imposed in a set of simulations aimed at investigating the effect of the PCM-loaded plaster thickness (s) on the thermal behavior of the PluciceX25-based specimen (10% vol). The results depicted in Figure 12 show that the temperature of the upper surface of the specimen decreased as the PCM composite thickness increased (from 10 to 30 mm).
In detail, compared to the reference specimen (20 mm), the maximum surface temperature reduced from 1.47% to 9.72% as s increased from 15 to 30 mm. This effect is mainly due to two reasons. On the one hand, the higher the thickness, the higher the thermal mass of the specimen. On the other hand, the PCM mass increases, absorbing a higher amount of latent heat (Figure 13a). Moreover, the higher the thickness, the lower the solid phase 1 fraction at the same time (Figure 13b).
It should be noted that as the thickness increases, the complete transition may not occur in real building applications, so the period in which the PCM temperature is above its transition temperature could be lower than the time taken by f to reach the maximum value, 1. In contrast, a small thickness could lead to a fast transition with a premature end of the storage energy benefit. In both cases, the PCM would act as a thermal insulation layer.
Figure 12 shows that increasing the sample thickness shifts the peak temperature, with benefits in terms of reducing the temperature and heat flux across the wall. Compared to the reference specimen, a thickness lower than 20 mm is not recommended since the maximum temperature increased by 1.82% and 3.33% for the 15 mm and 20 mm thicknesses, respectively. In contrast, it decreased from 0.78% to 6.71% as the thickness increased from 20 to 30 mm. Improvements in terms of ES were remarkable for the experimental conditions simulated. In detail, for the best thickness (30 mm), ES increased by 72.72% during the heating-up process due to the heat flux reduction. In detail, compared with the wall without PCM, the difference between the maximum and minimum values of the surface temperature and indoor heat flux was reduced by 10.85% and 28.72%, respectively.
The choice of a reasonable thickness is a crucial design step to improve both the thermal energy utilization efficiency of buildings’ walls and the economic and technical potential of PCM’s application.

3.4.4. Simulations of Summer Conditions

A set of dynamic simulations were carried out to evaluate the effectiveness of incorporating the proposed specimen embedding 10 vol.% of PlucIceX25 into the building envelope. The meteorological data of ambient temperature and solar radiation from a weather station installed on the roof of the CNR ITAE in Messina, Italy, were used to calculate the sol-air temperature set as the boundary condition on the external wall as depicted in Figure 7b. The simulations were carried out considering a reference week in July as representative of summer conditions. Winter conditions were not considered as the external ambient average temperature in the same location (~15–16 °C) is less than the lower bound of the transition interval (23 °C) of the PCM. This means that the PCM-based composite would act only as a passive insulation material without any benefit related to the absorbed or released latent heat.
Figure 14a shows: the hourly variation of the (i) sol-air temperature, (ii) ambient temperature, (iii) inner wall temperature, and (iv) PCM solid phase 2 fraction for the summer week of 17–23 July. Only the results for 17 July (Figure 14b) are discussed in detail.
At 00:00 AM, the PCM was in its transition interval (f = 0.28). Until 05:00 AM, f further decreased until 0.03 so a fraction of the heat across the medium towards the outdoor environment was absorbed in the reverse transition S2-S1. The heat flux moved towards the outdoors due to the reduction in the external temperature above the indoor temperature 26 °C. The inner wall temperature was reduced by 0.49 °C. From 06:00 AM to 09:00 AM, due to the increase in the sol-air temperature from 23.75 °C to 285.9 °C, the f fraction increased until its maximum value, 1. The complete transition S1-S2 occurred so the PCM temperature reached the value 28.13 °C that is above its transition interval [23 °C–27 °C]. Due to the higher indoor heat fluxes, the inner wall temperature increased by 3.17 °C. The PCM remained in the S2 phase until 9:00 PM, acting as an additional thermal resistance in the building envelope. At 1:00 PM, both the sol-air and the inner wall temperature reached their maximum values of 35.99 °C and 33.18 °C, respectively. Based on the climatic data, it was the hour of the day with the maximum value of solar radiation, 144 kJ/(h m2), and external temperature, 27.90 °C. From 10:00 PM, f decreased until the value reached 0.94, and a cooling effect occurred on the inner wall.
As shown in Figure 14a in the selected summer week, the PCM temperature always increased above its transition phase. In fact, the total transition S1-S2 was observed in all days. The minimum PCM temperature was 23.72 °C, which means that in the simulated summer week, the complete transition S2-S1 did not occur due to the extremely high ambient temperature. From 20–23 July, the PCM was always in the S2 phase with a slight amount of latent heat adsorbed in the reverse transition. In these days, there were no benefits of using the PCM to store energy.
A higher transition temperature could be a way to reduce the time in which the f fraction persists at its maximum value, 1.
Figure 15 shows a comparison between the proposed PCM (Tf 25 °C) and a PCM with the same physical properties and Tf of 30 °C. At 30 °C, the reduction time in which the PCM was in the solid phase 2 allowed benefits during the charging storage phase. For the reference day, 17 July, from 09:00 AM to 12:00 PM, the PCM at 25 °C acted as an insulation layer, so the f value was 1 while at 30 °C it absorbed 21.34 J of thermal energy, improving the thermal performance of the wall with a lower surface temperature and inner flux values. In detail, the surface temperature and the inbound heat flux increased by 4.71 °C and 4.4 °C and by 39.05 W/m2 and 36.53 W/m2 at 25 °C and 30 °C, respectively. In contrast, the PCM performance was better at 25 °C during the discharge storage process (from 5:00 PM to 9.00 PM), so the surface temperature and inbound flux values were lower. In detail, the surface temperature and the inbound heat flux decreased by 4.02 °C and 3.35 °C and by 33.35 W/m2 and 27.84 W/m2 at 25 °C and 30 °C, respectively. Usually, the heating phase during the sunny hours is more significant, the thermal discomfort during the discharge storage process can be neglected in buildings, i.e., offices. Choosing a PCM that can be totally discharged as the solar radiation decreases is crucial, so (i) if the f fraction persists at 1, the PCM provides an additional thermal capacity acting as an inert building material, and (ii) if the total transition S2-S1 is not complete, the PCM will be over-saturated, and on the following day, only a part of the PCM will be available to absorb latent heat, resulting in the worsening of the thermal comfort for the occupants.
The results confirmed that the transition temperature is a significant factor affecting the thermal energy absorption and the release of the PCM panel. The temporal evolution of f does not have a regular daily trend due to the stochastic nature of the climatic conditions, so it is difficult to establish which PCM has the better performance all year round.

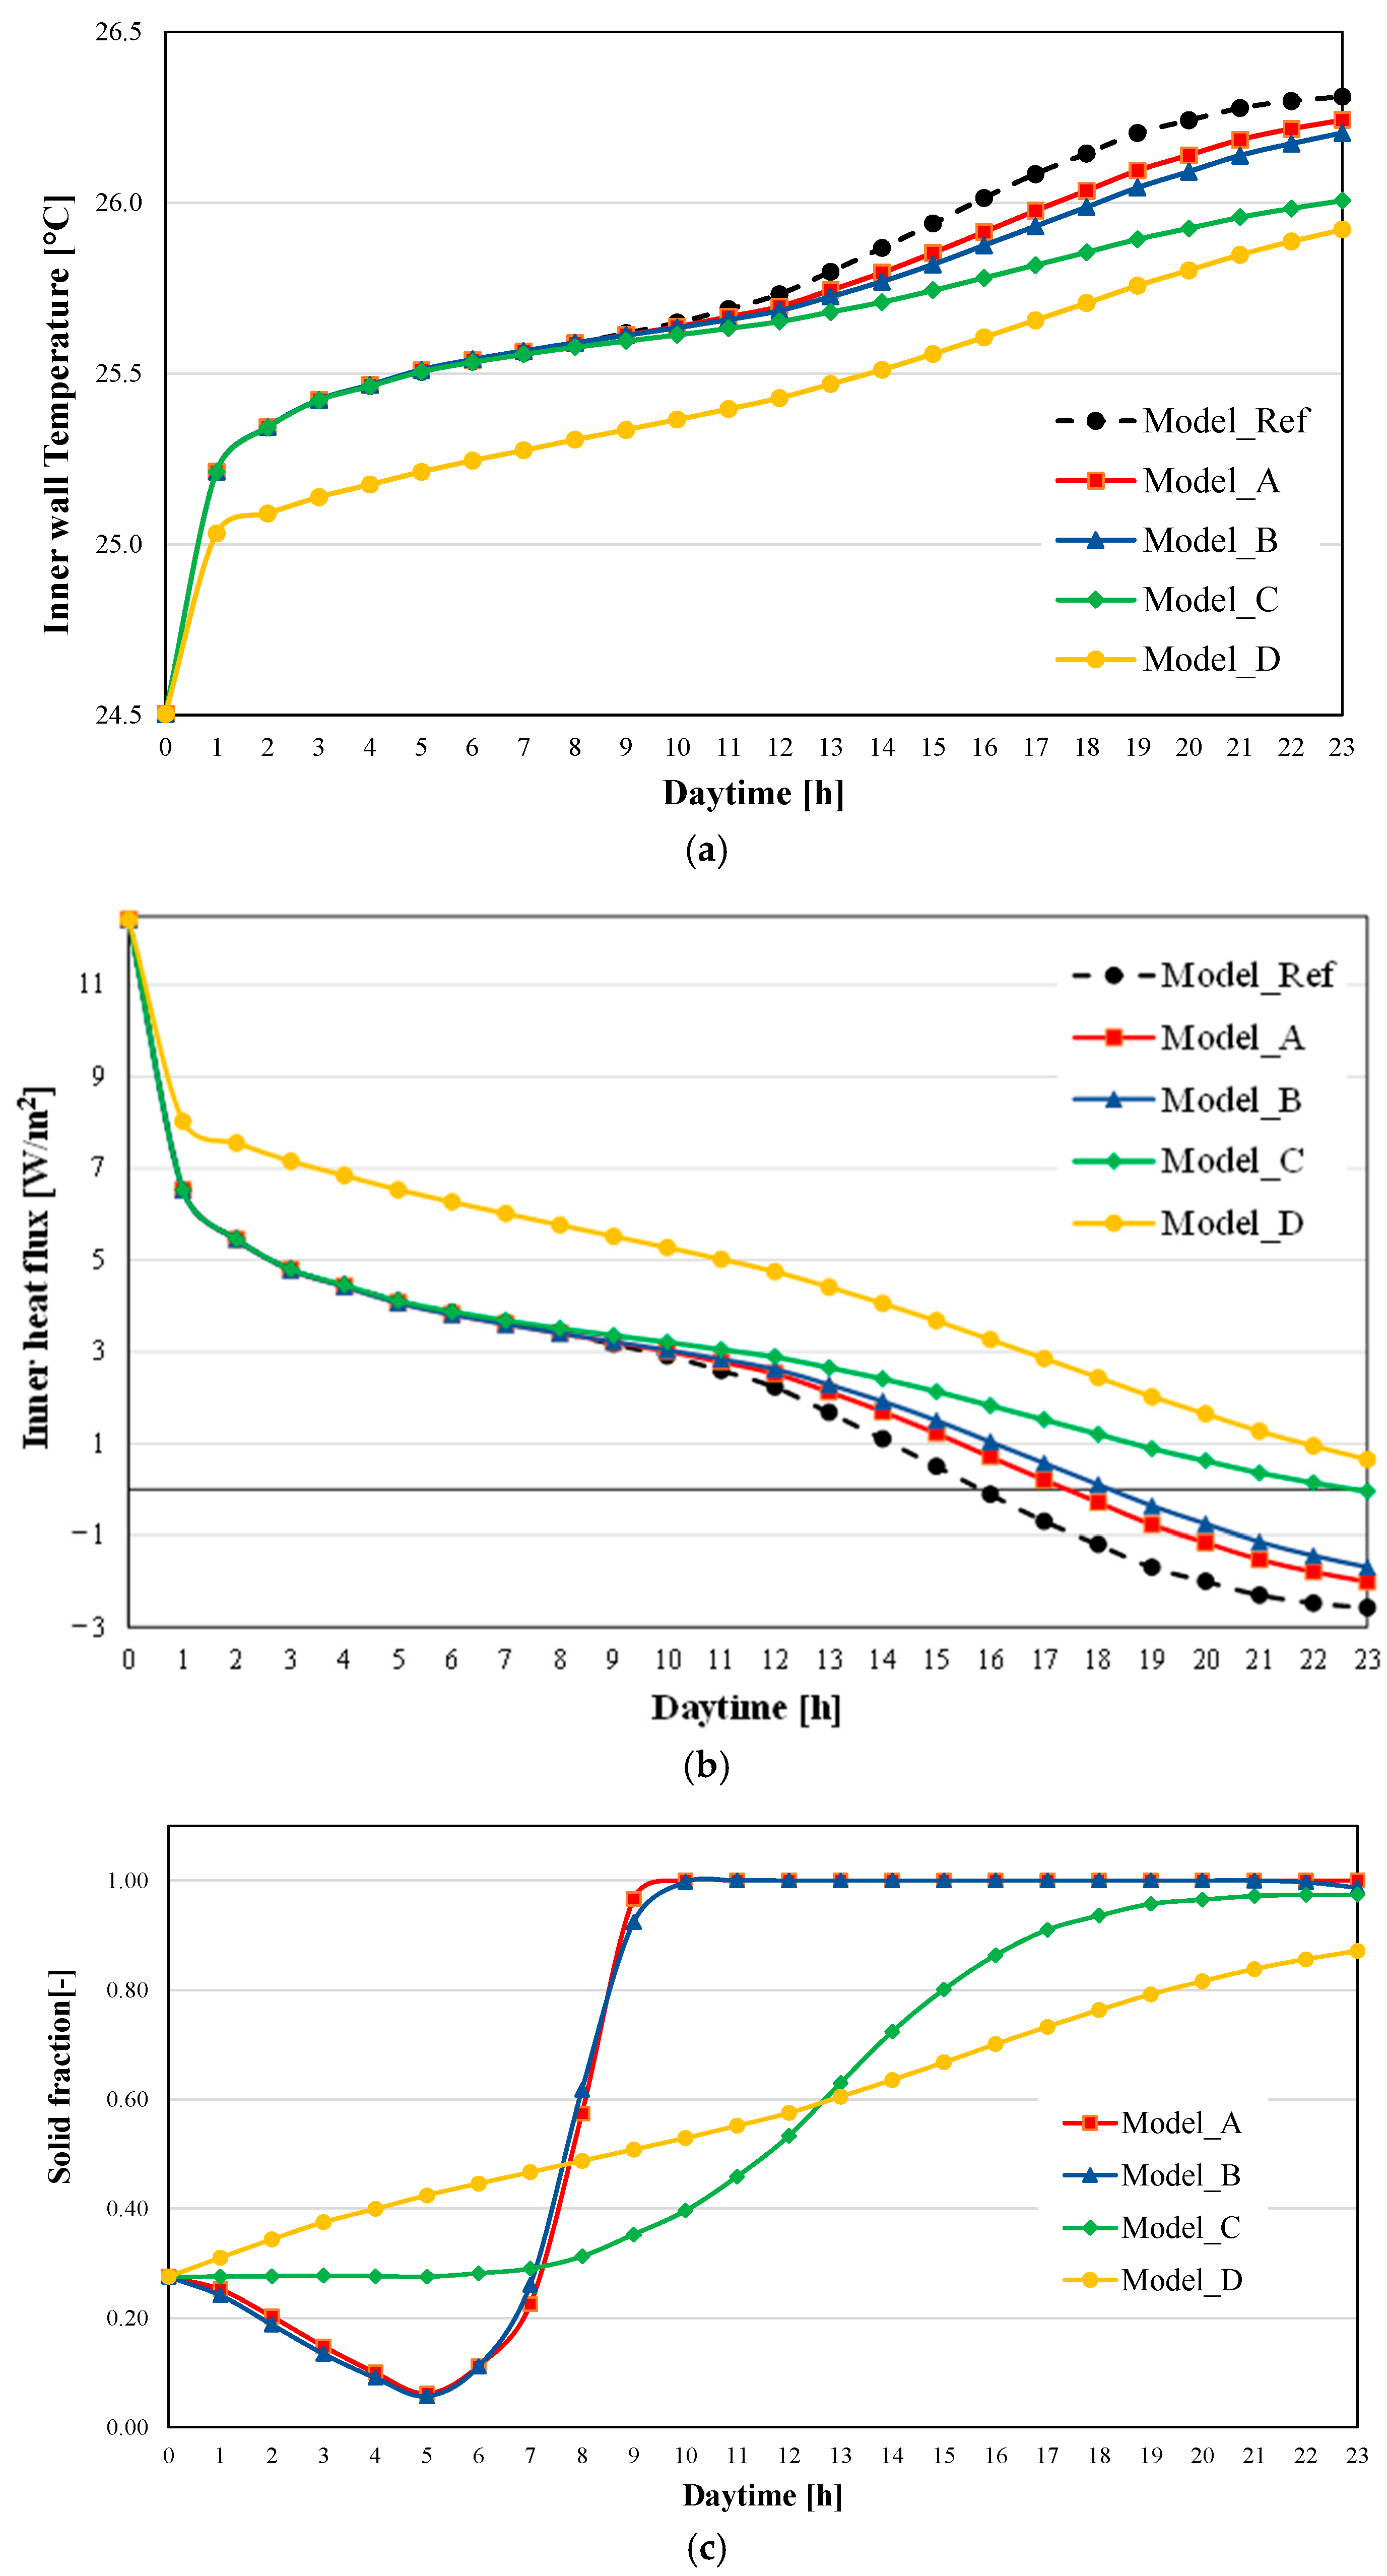
3.4.5. Effect of the PCM Location in the Wall Structure

The effect of the PCM mortar location on the thermal performance of the wall structure was investigated in order to ascertain its ideal position. The internal structure of the composite wall affects the effectiveness of its thermal regulation ability. The reference wall (thickness 30 cm) without PCM, from outside to inside, consists of four layers: cement mortar, brick 1, brick 2 and gypsum board. The insulation layer was not added in order to evaluate the applicability of the proposed PlucIceX25 also for the energy refurbishment of historical buildings. The physical properties of the layers are listed in Table 4.
The investigated stratigraphy’s layouts are depicted in Figure 16. Schematic representation of the PCM location in the wall structure. The PCM mortar layer was placed: between the cement mortar and brick 1 (Model A), on the exterior of the wall (Model B), between the two brick layers (Model C) and between brick 2 and the gypsum board (Model D).
Figure 17 shows the temporal variation of indoor heat flux, the inner wall temperature and the fraction solid for different PCM positions in the building envelope structure for the reference day, 17 July. The presence of the PCM (Model A to D) allowed to reduce the difference between the maximum and minimum inner wall temperature. In detail, the difference of 1.81 °C in the reference wall was reduced by 1.74 °C, 1.70 °C, 1.50 °C and 1.42 °C from Model A to D, respectively. When the PCM was placed between cement mortar and brick (Model A) or on the exterior side (Model B) the indoor air temperature difference was close to that reached without PCM. A possible reason could be that the brick layers hinder the heat transport towards the outdoor environment. In contrast, when the PCM was placed in the middle of the bricks or between brick 2 and the gypsum board, there is a better regulation of the indoor thermal environment with higher benefits in terms of thermal comfort for the occupants. Note that Model A and Model B have essentially the same effect, probably due to the low-volume fraction of the reference PCM mortar.
The surface temperatures increased in the time due to the reduction in the indoor heat flux moving towards the outdoor environment. Only in Models A and B from 4:00 PM to 24:00 PM did the surface temperature increase due to the heat flux released to the indoor environment. The lower maximum surface temperature was reached when the PCM mortar was placed between the brick and the gypsum board (Model D) as listed in Table 5.
The minimum and the maximum heat transfer to the outdoor environment occurred in the wall without PCM (44.91 kW/m2) and with the PCM mortar on the interior side (107.85 kW/m2), respectively. As shown in Figure 17c, in all models, due to the heat adsorbed by the wall, the PCM always reached phase solid 2 (f = 1). Only in Models A and B in the night hours did the reverse transition S2-S1 occur. In Models C and D, the heat flux was not enough to allow the total transition S1-S2. In both models, during the sunlight hours, in particular, there was the benefit of using the PCM as a storage medium; instead, in Model A and Model B after the f fraction reached the value of 1, the heat transfer was purely conductive.
Based on the discussed results, placing the PCM on the interior side of the building structure could be a reasonable approach to creating better thermal comfort conditions.

4. Conclusions

In the present work, the thermal performance of a hybrid cement mortar–PCM composite has been tested experimentally and studied numerically. The experimental results confirmed the advantages of the PCM-loaded plaster; the validation with experimental data showed a reliable prediction of the external surface temperature of the specimen.
Experimental results were used to validate and calibrate a finite element model implemented in COMSOL Multiphysics® 5.6. The model was used to perform a parametric analysis aimed at investigating (i) the effect of the PCM mass fraction, transition temperature and PCM thickness on the thermal performance of the specimen; (II) the thermal behavior of the specimen under real Mediterranean climatic summer conditions; (III) the benefits of the PCM integration for different placements in the external wall of a building.
The results showed that better thermal comfort can be obtained by increasing the PCM mass fraction due to the higher absorption of latent heat. It was found that the energy saving increased almost linearly from 17.7% to 7.46% as the PCM mass fraction increased from 5% to 25%. The PCM thermal regulation ability as well as its storage performance are affected by the phase-transition temperature whose optimal value is dictated by time- and site-specific climatic parameters. The results showed that under summer conditions, the integration of a PCM with a higher transition temperature reduced the daytime wall temperature and increased the nighttime wall temperature. In detail, for the reference day, 17 July, during the sunlight hours, the inner surface temperature and the inbound heat flux increased by 4.71 °C and 4.4 °C and by 39.05 W/m2 and 36.53 W/m2 at 25 °C and 30 °C, respectively.
Increasing the PCM-loaded plaster thickness, a better performance in terms of the heat storage and thermal regulation of the wall can be obtained. It was found that the maximum inner surface temperature reduced from 1.47% to 9.72% as the thickness increased from 15 to 30 mm. The study carried out showed that the choice of a reasonable thickness is a crucial design step to improve (i) the storage efficiency of buildings’ walls, and (ii) the economic and technical potential of the PCM application.
The effect of the PCM-loaded plaster location on the thermal performance of the wall structure was investigated in order to ascertain the ideal position. It was found that when placing the composite on the interior side of the building structure, the transition phase is slower with higher benefits in using the PCM as a storage material. Due to the highest heat flux reduction, this PCM-loaded plaster location represents a reasonable approach to creating better thermal comfort conditions.
Note that the study carried out in this paper was carried out considering the thermal behavior of PCM mortar only for typical Mediterranean climatic conditions. Weather conditions are crucial to determining the degree of interaction between the PCM and the indoor and outdoor environments. The study of the proposed PCM mortar in a wide range of climates will be the focus of future research.

Author Contributions

Conceptualization: G.A.F., V.B., V.P. and A.F., Methodology: G.A.F., V.B., Y.Z., Validation: G.A.F., V.B., Y.Z. and G.E.D., Formal analysis: G.A.F., V.B., Y.Z. and G.E.D., Investigation: G.A.F., V.B., Y.Z., V.P. and A.F., Resources: V.P. and A.F., Data Curation: G.A.F., V.B. and Y.Z., Writing: G.A.F., V.B., V.P.; Y.Z., G.E.D. and A.F., Writing—Review and Editing: G.A.F., V.B., V.P. and A.F., Visualization: G.A.F., V.B., V.P., Y.Z., G.E.D. and A.F., Supervision: V.P. and A.F., Project administration: A.F., Funding acquisition: A.F. All authors have read and agreed to the published version of the manuscript.

Funding

This project has been partially funded by P.O. FESR Sicilia 2014/2020, project “SMART ART—Sviluppo di Metodi Avanzati di Restauro, Diagnostica e Telecontrollo per la Conservazione del Patrimonio Artistico Architettonico” code 082030000276—CUP G79J18000620007.

Data Availability Statement

The data presented in this study are confidential.

Conflicts of Interest

The authors declare no conflict of interest.

Abbreviations

DSCDifferential scanning calorimetry
HEXHeat exchanger
HVACHeating, ventilation and air conditioning
MBEMean bias error
NINation instruments
PCMPhase change material
PMPost Meridiem
PSPure specimen
RMSERoot mean square error
SL-PCMsSolid–liquid phase change materials
Nomenclature
cpSpecific heat [kJ/(kg K)]
EEnergy demand
ESEnergy saving
fPCM phase fraction
GIncident solar radiation [W/m2]
HTotal enthalpy [J/kg]
hConvective heat transfer [W/(m2 K)]
LLatent heat [kJ/kg]
mMass [g]
NTotal number of measurements
QHeat flux [W/m2]
qVolumetric heat source [W/m3]
SDSC signal
sThickness [mm]
TTemperature [K]
T e x t External ambient temperature [K]
T f Transition temperature [K]
T H E X Plate exchanger temperature [K]
T f l Fluid temperature [K]
T s o l a i r Sol-air temperature [K]
T s u r f Surface temperature [K]
TCThermostatic bath (Thermocryostat)
VValve
vol%Volume fraction
Greek letters
αAbsorption coefficient
εEmissivity coefficient
ϑ Volume fraction
λThermal conductivity [W/(m k)]
ρDensity [kg/m3]
Subscripts
ave, exExperimental mean value
ConvConvective
extExternal ambient
fFluid
iInner
i,exith measured experimental value
i,mith value predicted by the model
sspecimen
S1Solid phase 1
S2Solid phase 2

References

  1. Rao, V.V.; Parameshwaran, R.; Ram, V.V. PCM-mortar based construction materials for energy efficient buildings: A review on research trends. Energy Build. 2018, 158, 95–122. [Google Scholar] [CrossRef]
  2. Courtois, E.; Glouannec, P.; Magueresse, A.; Loulou, T. Estimating thermal properties of phase change material from heat flux measurements. Int. J. Therm. Sci. 2022, 172, 107307. [Google Scholar] [CrossRef]
  3. Marin, P.; Saffari, M.; de Gracia, A.; Zhu, X.; Farid, M.M.; Cabeza, L.F.; Ushak, S. Energy savings due to the use of PCM for relocatable lightweight buildings passive heating and cooling in different weather conditions. Energy Build. 2016, 129, 274–283. [Google Scholar] [CrossRef] [Green Version]
  4. Lei, J.; Yang, J.; Yang, E.H. Energy performance of building envelopes integrated with phase change materials for cooling load reduction in tropical Singapore. Appl. Energy 2016, 162, 207–217. [Google Scholar] [CrossRef]
  5. Liu, Z.; Hou, J.; Huang, Y.; Zhang, J.; Meng, X.; Dewancker, B.J. Influence of phase change material (PCM) parameters on the thermal performance of lightweight building walls with different thermal resistances. Case Stud. Therm. Eng. 2022, 31, 101844. [Google Scholar] [CrossRef]
  6. Frigione, M.; Lettieri, M.; Sarcinella, A. Phase change materials for energy efficiency in buildings and their use in mortars. Materials 2019, 12, 1260. [Google Scholar] [CrossRef] [Green Version]
  7. Bastien, D.; Athienitis, A.K. Passive thermal energy storage, part 2: Design methodology for solaria and greenhouses. Renew. Energy 2017, 103, 537–560. [Google Scholar] [CrossRef]
  8. Fallahi, A.; Guldentops, G.; Tao, M.; Granados-Focil, S.; Van Dessel, S. Review on solid-solid phase change materials for thermal energy storage: Molecular structure and thermal properties. Appl. Therm. Eng. 2017, 127, 1427–1441. [Google Scholar] [CrossRef]
  9. Cabeza, L.F. Advances in thermal energy storage systems: Methods and applications. In Advances in Thermal Energy Storage Systems—Methods and Applications; Woodhead Publishing: Cambridge, UK, 2021; pp. 37–54. [Google Scholar] [CrossRef]
  10. Mehling, H.; Brütting, M.; Haussmann, T. PCM products and their fields of application—An overview of the state in 2020/2021. J. Energy Storage 2022, 51, 104354. [Google Scholar] [CrossRef]
  11. Harlé, T.; Hebert, R.L.; Nguyen, G.T.M.; Ledésert, B.A. A composite of cross-linked polyurethane as solid–solid phase change material and plaster for building application. Energy Build. 2022, 262, 111945. [Google Scholar] [CrossRef]
  12. Farulla, G.A.; Tumminia, G.; Sergi, F.; Aloisio, D.; Antonucci, V.; Ferraro, M.; Nazionale, C.; Avanzate, T.; Nicola, E.; Contesse, L. A review of key performance indicators for building flexibility quantification to support the clean energy transition. Energies 2021, 14, 5676. [Google Scholar] [CrossRef]
  13. Haurie, L.; Serrano, S.; Bosch, M.; Fernandez, A.I.; Cabeza, L.F. Single layer mortars with microencapsulated PCM: Study of physical and thermal properties, and fire behaviour. Energy Build. 2016, 111, 393–400. [Google Scholar] [CrossRef] [Green Version]
  14. Tyagi, V.V.; Kaushik, S.C.; Tyagi, S.K.; Akiyama, T. Development of phase change materials based microencapsulated technology for buildings: A review. Renew. Sustain. Energy Rev. 2011, 15, 1373–1391. [Google Scholar] [CrossRef]
  15. Sarı, A.; Bicer, A.; Karaipekli, A.; Al-Sulaiman, F.A. Preparation, characterization and thermal regulation performance of cement based-composite phase change material. Sol. Energy Mater. Sol. Cells 2018, 174, 523–529. [Google Scholar] [CrossRef]
  16. Frazzica, A.; Brancato, V.; Palomba, V.; La Rosa, D.; Grungo, F.; Calabrese, L.; Proverbio, E. Thermal performance of hybrid cement mortar-PCMs for warm climates application. Sol. Energy Mater. Sol. Cells 2019, 193, 270–280. [Google Scholar] [CrossRef]
  17. Wi, S.; Yang, S.; Yun, B.Y.; Kim, S. Exterior insulation finishing system using cementitious plaster/microencapsulated phase change material for improving the building thermal storage performance. Constr. Build. Mater. 2021, 299, 123932. [Google Scholar] [CrossRef]
  18. Abbasi Hattan, H.; Madhkhan, M.; Marani, A. Thermal and mechanical properties of building external walls plastered with cement mortar incorporating shape-stabilized phase change materials (SSPCMs). Constr. Build. Mater. 2021, 270, 121385. [Google Scholar] [CrossRef]
  19. Németh, B.; Ujhidy, A.; Tóth, J.; Gyenis, J.; Feczkó, T. Testing of microencapsulated phase-change heat storage in experimental model houses under winter weather conditions. Build. Environ. 2021, 204, 108119. [Google Scholar] [CrossRef]
  20. M’ziane, M.C.; Grine, A.; Younsi, Z.; Touhami, M.S.K. Modelling and Numerical Simulation of a Passive Wall Incorporating a Phase Change Material. J. Adv. Res. Fluid Mech. Therm. Sci. 2021, 79, 169–181. [Google Scholar] [CrossRef]
  21. Dobri, A.; Tsiantis, A.; Papathanasiou, T.D.; Wang, Y. Investigation of transient heat transfer in multi-scale PCM composites using a semi-analytical model. Int. J. Heat Mass Transf. 2021, 175, 121389. [Google Scholar] [CrossRef]
  22. Cárdenas-Ramírez, C.; Gómez, M.A.; Jaramillo, F.; Cardona, A.F.; Fernández, A.G.; Cabeza, L.F. Experimental steady-state and transient thermal performance of materials for thermal energy storage in building applications: From powder SS-PCMs to SS-PCM-based acrylic plaster. Energy 2022, 250, 123768. [Google Scholar] [CrossRef]
  23. Baccega, E.; Bottarelli, M. Granular PCM-Enhanced Plaster for Historical Buildings: Experimental Tests and Numerical Studies. Energies 2022, 15, 975. [Google Scholar] [CrossRef]
  24. Miers, C.S.; Marconnet, A. Experimental investigation of composite phase change material heat sinks for enhanced passive thermal management. J. Heat Transf. 2021, 143, 013001. [Google Scholar] [CrossRef]
  25. Fikri, M.A.; Pandey, A.K.; Samykano, M.; Kadirgama, K.; George, M.; Saidur, R.; Selvaraj, J.; Rahim, N.A.; Sharma, K.; Tyagi, V.V. Thermal conductivity, reliability, and stability assessment of phase change material (PCM) doped with functionalized multi-wall carbon nanotubes (FMWCNTs). J. Energy Storage 2022, 50, 104676. [Google Scholar] [CrossRef]
  26. Crespo, A.; Zsembinszki, G.; Vérez, D.; Borri, E.; Fernández, C.; Cabeza, L.F.; de Gracia, A. Optimization of design variables of a phase change material storage tank and comparison of a 2D implicit vs. 2D explicit model. Energies 2021, 14, 2605. [Google Scholar] [CrossRef]
  27. Phase Change Materials: Thermal Management Solutions. Available online: https://www.pcmproducts.net/ (accessed on 12 June 2022).
  28. Ahmad, M.; Bontemps, A.; Sallée, H.; Quenard, D. Experimental investigation and computer simulation of thermal behaviour of wallboards containing a phase change material. Energy Build. 2006, 38, 357–366. [Google Scholar] [CrossRef] [Green Version]
  29. Lachheb, M.; Younsi, Z.; Naji, H.; Karkri, M.; Ben Nasrallah, S. Thermal behavior of a hybrid PCM/plaster: A numerical and experimental investigation. Appl. Therm. Eng. 2017, 111, 49–59. [Google Scholar] [CrossRef]
  30. Incropera, F.P.; DeWitt, D.P.; Bergman, T.L.; Lavine, A.S. Fundamentals of Heat and Mass Transfer, 6th ed.; John Wiley & Sons: Hoboken, NJ, USA, 2007. [Google Scholar]
  31. Henninger, J.H. Solar Absorptance and Thermal Emittance of Some Common Spacecraft Thermal-Control Coatings; NASA Reference Publication: Washington, DC, USA, 1984.
  32. Rai, A.C. Energy performance of phase change materials integrated into brick masonry walls for cooling load management in residential buildings. Build. Environ. 2021, 199, 107930. [Google Scholar] [CrossRef]
  33. Elawady, N.; Bekheit, M.; Sultan, A.A.; Radwan, A. Energy assessment of a roof-integrated phase change materials, long-term numerical analysis with experimental validation. Appl. Therm. Eng. 2022, 202, 117773. [Google Scholar] [CrossRef]
  34. Nitsas, M.; Koronaki, I.P. Performance analysis of nanoparticles-enhanced PCM: An experimental approach. Therm. Sci. Eng. Prog. 2021, 25, 100963. [Google Scholar] [CrossRef]
  35. McCartney, L.N. Applications of Maxwell’s methodology to the prediction of the effective properties of composite materials. In Multi-Scale Continuum Mechanics Modelling of Fibre-Reinforced Polymer Composites; Woodhead Publishing: Cambridge, UK, 2021; pp. 179–216. [Google Scholar] [CrossRef]
  36. Zhang, G.; Xiao, N.; Wang, B.; Razaqpur, A.G. Thermal performance of a novel building wall incorporating a dynamic phase change material layer for efficient utilization of passive solar energy. Constr. Build. Mater. 2022, 317, 126017. [Google Scholar] [CrossRef]
  37. Salihi, M.; El Fiti, M.; Harmen, Y.; Chhiti, Y.; Chebak, A.; M’Hamdi Alaoui, F.E.; Achak, M.; Bentiss, F.; Jama, C. Evaluation of global energy performance of building walls integrating PCM: Numerical study in semi-arid climate in Morocco. Case Stud. Constr. Mater. 2022, 16, e00979. [Google Scholar] [CrossRef]
Figure 1. Flowchart of the preparation phases of the samples.
Energies 16 02384 g001
Figure 2. Experimental equipment to evaluate the thermal performance of the solid–solid PlusIce X25 PCM mortar specimen [16].
Energies 16 02384 g002
Figure 3. DSC curves of (a) pristine PlusIce X25; (b) water-dissolved PlusIce X25.
Energies 16 02384 g003
Figure 4. DSC thermograms obtained during heating/cooling cycles on (a) pristine and (b) water-dissolved PlusIce X25.
Energies 16 02384 g004
Figure 5. Cp of pristine PlusIce X25 and cement mortar PCM composite.
Energies 16 02384 g005
Figure 6. Results of the pure cement mortar and the PCM (X25). The blue and orange curves represent the average temperature measured by the sensors in contact with the pure mortar and PCM specimen, respectively, whereas the grey one represents the temporal forcing condition of the plate HEX.
Energies 16 02384 g006
Figure 7. Computational domain with boundary conditions assumed in the simulations using (a) the experimental conditions of the “continuous tests”, (b) the outdoor weather climatic data. The red and blue lines represent the indoor and outdoor walls, respectively.
Energies 16 02384 g007
Figure 8. Comparison of experimental and simulated data for PCM (X25)–10 vol%-cement mortar sample. The plotted temperature is evaluated as the average of the three thermocouples placed on the upper surface of the sample.
Energies 16 02384 g008
Figure 9. Effect of the PCM mass fraction on the thermal performance of the specimen. The reference sample corresponds to 7 wt.%. The inset shows a magnification in the peak temperature region.
Energies 16 02384 g009
Figure 10. (a) Thermal energy stored as latent heat; (b) solid phase transition fraction for different PCM mass fractions.
Energies 16 02384 g010aEnergies 16 02384 g010b
Figure 11. (a) Thermal energy stored as latent heat and (b) solid phase transition fraction for different transition temperatures.
Energies 16 02384 g011
Figure 12. Effect of the PCM thickness on the on the thermal performance of the specimen. The reference PCM sample corresponds to 20 mm; the pure is a specimen of 20 mm-thick plaster without PCM.
Energies 16 02384 g012
Figure 13. (a) Thermal energy stored as latent heat and (b) solid phase transition fraction for different PCM thicknesses.
Energies 16 02384 g013
Figure 14. (a) Results of the dynamic simulations in the summer week (17–23 July) to evaluate the thermal performance of the PCM and (b) reference day, 17 July.
Energies 16 02384 g014
Figure 15. Results of the dynamic simulations in the summer week (17–23 July) to evaluate the thermal performance of the PCM.
Energies 16 02384 g015
Figure 16. Schematic representation of the PCM location in the wall structure.
Energies 16 02384 g016
Figure 17. Effect of the PCM position on (a) inner wall temperature, (b) inner heat flux, (c) solid fraction for the reference day 17 July. Inbound flux is positive.
Energies 16 02384 g017
Table 1. Main parameters of pristine and water-dissolved PlusIce X25 after 20 heating/cooling DSC cycles.
CyclePlusIce X25StepH (J/g)T Onset (°C)T Peak (°C)
IPristineHeating92.7628.8238.17
V 92.4026.3035.50
X 90.3127.2634.40
XV 86.8927.5534.20
XX 86.0327.4934.17
Reduction %7.264.6110.48
IPristineCooling86.0322.6421.77
V 85.6722.0820.93
X 81.4019.7918.33
XV 81.5019.6518.00
XX 76.9420.2717.93
Reduction %10.5710.4717.64
IWater-dissolvedHeating91.8427.9035.10
V 92.0627.8832.73
X 86.1627.9832.30
XV 87.1228.1232.37
XX 84.5328.1532.37
Reduction %7.96−0.907.78
IWater-dissolvedCooling84.7223.2322.27
V 85.0522.6420.77
X 81.7123.9419.43
XV 81.1420.4919.40
XX 78.0721.1718.37
Reduction %7.858.8717.51
Table 2. Physical properties of the specimen materials.
IN200PCM-X25
Density ρ [kg/m3]1550925
Thermal conductivity λ [W/(m k)]0.760.36
Specific heat cp [kJ/(kg K)]0.8Cp (T)
Latent heat L [kJ/kg]-95.7
Table 3. Thermal performance of the PCM-loaded plaster at f = 1. Inbound flux is positive.
Transition Temperature (°C)2022252830
Upper surface temperature (°C)23.4025.1227.4230.2831.90
Surface heat flux (W/m2)23.3926.0911.67−17.98−53.02
Table 4. Physical properties of the wall layers [5,37].
Cement MortarBrickGypsum Board
ρ [kg/m3]155012001200
λ [W/(m k)]0.760.390.42
cp [J/(kg K)]8001050840
Table 5. Thermal performance of the wall for different PCM positions.
Model Ref.Model AModel BModel CModel D
Total outdoor heat flux [kW/m2]56.4159.7261.3768.86107.85
Maximum inner wall temperature [°C]26.3126.2426.2026.0125.92
ES %-5.858.7922.0691.17
Disclaimer/Publisher’s Note: The statements, opinions and data contained in all publications are solely those of the individual author(s) and contributor(s) and not of MDPI and/or the editor(s). MDPI and/or the editor(s) disclaim responsibility for any injury to people or property resulting from any ideas, methods, instructions or products referred to in the content.

