Article

Optimal Configuration of Extreme Fast Charging Stations Integrated with Energy Storage System and Photovoltaic Panels in Distribution Networks

1
Department of Electrical and Computer Engineering, Michigan Technological University, 1400 Townsend Dr., Houghton, MI 49931, USA
2
Department of Mechanical Engineering-Engineering Mechanics, Michigan Technological University, 1400 Townsend Dr., Houghton, MI 49931, USA
*
Authors to whom correspondence should be addressed.
Energies 2023, 16(5), 2385; https://doi.org/10.3390/en16052385
Submission received: 27 January 2023 / Revised: 25 February 2023 / Accepted: 27 February 2023 / Published: 2 March 2023

Abstract

:
Extreme fast charging (XFC) for electric vehicles (EVs) has emerged recently because of the short charging period. However, the extreme high charging power of EVs at XFC stations may severely impact distribution networks. This paper addresses the estimation of the charging power demand of XFC stations and the design of multiple XFC stations with renewable energy resources in current distribution networks. First, a Monte Carlo (MC) simulation tool was created utilizing the EV arrival time and state-of-charge (SOC) distributions obtained from the dataset of vehicle travel surveys. Various impact factors are considered to obtain a realistic estimation of the charging power demand of XFC stations. Then, a method for determining the optimal energy capacity of the energy storage system (ESS), ESS rated power, and size of photovoltaic (PV) panels for multiple XFC stations in a distribution network is presented, with the goal of achieving an optimal configuration. The optimal power flow technique is applied to this optimization so that the optimal solutions meet not only the charging demand but also the operational constraints related to XFC, ESS, PV panels, and distribution networks. Simulation results of a use case indicate that the presented MC simulation can estimate approximate real-world XFC charging demand, and the optimized ESS and PV units in multiple XFC stations in the distribution network can reduce the annual total cost of XFC stations and improve the performance of the distribution network.

1. Introduction

Due to technological advances and the availability of government incentives, automakers estimate that annual electric vehicle sales will reach 22 million by 2025 and about 100 million EVs will be on the road worldwide by 2035 [1]. To compete with the short refueling time of internal combustion engine vehicles, extreme fast charging technology has been introduced to recharge the battery of an EV in 15 min or less [2]. Different from AC level 2 chargers, which can only deliver a peak power of up to 19.2 kW, a 350 kW DC extremely fast charger can charge an EV in less than 10 min and provide 200 miles of driving range [3]. However, if EV charging stations are not properly configured, they will cause significant issues, such as feeder overloading, frequency violation, and voltage sags, in distribution networks [4,5,6]. Efficient control and management of AC level 2 charging processes have been widely studied to optimize grid operation and offer economic benefits [7,8,9,10,11,12]. However, the control problems for the XFC are different from the AC level 2 charging due to the short charging period. The XFC stations require additional distributed energy resources (DERs), such as localized photovoltaic panels and energy storage systems, within an XFC station to meet fast EV charging energy requirements and mitigate the transient impacts on distribution networks. The optimal design of the rated power and energy capacity of ESS and the number of PV panels within XFC stations with the consideration of EV charging demand, energy arbitrage of ESS, and operational constraints of the current distribution network is crucial to achieving the best performance.
For the optimal design of XFC stations, the estimation of their daily charging load is required. One of the most common approaches is using machine learning techniques to predict EV charging behaviors or charging loads. In [13], several common machine learning algorithms are explored to predict charging behavior, including charging duration and energy consumption. However, the prediction errors of these machine learning methods are relatively large when data is limited at the current time. In [14], a reinforcement learning method is proposed to forecast the load of EV charging stations. Results show that the charging load of plug-in hybrid electric vehicles can be predicted accurately by using the Q-learning algorithm. However, the training data is generated from simple probability distribution functions rather than real-world data. In [15], a data-driven framework for charging load profile generation is proposed for residential EVs using kernel density estimation. A real-world dataset with over 12,000 AC Level 2 charging units and 100 DC fast chargers is utilized to make charging decisions by using a machine learning algorithm, but few XFC chargers are involved. In [16], a multiple channels method with kernel density estimation is developed to find patterns in EV charging profiles. A total of 21,918 charging events from 255 different charging stations in the UK are investigated, but they are only for the period of 2012 to 2013 and are quite different from recent XFC events. In [17], a deep learning generative model is validated on the Pecan Street dataset. It shows good robustness against noise and errors in home charger data. Similarly, the Pecan Street dataset only includes EV home charger data. In [18], an EV fast charging demand forecasting model is proposed with a long-short-term memory neural network. The performance is validated using real-world EV fast charging station datasets in South Korea and shows better accuracy than Bidirectional Long-Short Term Memory (Bi-LSTM), Gated Recurrent Unit (GRU), and Recurrent Neural Network (RNN). These studies have shown the advantages of machine learning in estimating charging behavior due to the fewer initial assumptions needed, but the accuracy of the estimated results cannot be guaranteed because historical datasets for XFC are not widely available. In addition, these studies focused on home charger data, limited periods of time, or specific geographic locations, which may not reflect recent XFC events.
Other studies focus on analyzing driving patterns to estimate probability distributions of EV charging behavior. In [19,20], the authors start with National Household Travel Survey (NHTS) datasets to analyze the distribution of departure time, arrival time, and traveling mileage of traditional vehicles. They estimated the EV charging load with constant charging rates based on the distribution of state-of-charge and arrival time. In [21], the probability distribution of the charging load is estimated by using the stochastic distance to charging stations, the mileage range of EVs, and the amount of energy required to travel to the charging stations. Furthermore, based on analyzing the probability distribution of vehicle Global Positioning System (GPS) data, the authors in [22] adopt a queuing model to include the waiting time and waiting space once EVs arrive at a fast-charging station to improve the estimation of EV charging behaviors. However, the studies in [19,20,21] assume constant charging power, and paper [22] simply adopts the charging curve of Tesla to all EVs. This may result in estimation error since there are different types of EVs/HEVs in the real world. To address this issue, paper [23] uses a linearized piecewise function to simulate the constant current constant voltage charging process for different types of EVs. The charging curve of most EVs is not linearized and is highly dependent on the battery characteristics of different EV models [24]. Charging curves from various original equipment manufacturers (OEM) are quite different. For example, a Nissan Leaf can only accept a 50 kW charging rate, and a Tesla Model 3 can accept 250 kW, but a Porsche Taycan can accept 350 kW. Using a uniform charging rate may lead to a large margin of error when analyzing and configuring an XFC station. Therefore, the estimation of XFC load needs to be investigated with various EV charging characteristics.
The configuration and operation of DERs within EV charging stations have been studied by several researchers. In [25], random sizes of battery-based ESSs and converters for a fast-charging station are generated using Monte Carlo (MC) simulation. Results show that an ESS can work as an energy buffer to downsize the feeder capacity. A larger size ESS can achieve better performance to shave EVs’ peak load, but the cost of electricity purchased from the utility company will be increased as well. In [26], a mixed integer linear programming (MILP) model is proposed to determine the capacity of an ESS for an electric bus charging station, with the aim of reducing total investment and charging expenses. In [27], the MILP model of energy storage sizing is extended to include battery life span analysis in a microgrid. The benefits of a hybrid ESS, including batteries and ultracapacitors, for EV charging, have been discussed in [28]. Ultracapacitors can handle high-frequency power transients and the batteries can deal with average power leveling. In [29], the optimal sizing of a battery-based ESS is studied based on the whale optimization algorithm. The ESS can also offer frequency regulation services for an islanded microgrid. Meanwhile, localized PV panels can generate low-cost energy compared to energy purchased from the utility and require less installation investment than an ESS [3,30]. Installing both PV panels and an ESS within an XFC station can further reduce the huge XFC power demand from the power distribution network. In [19], a probabilistic MILP formulation for optimal configuration of PVs and ESSs is introduced. The energy costs associated with fast charging stations are minimized and the charging requirements are also satisfied. In [31], PVs and ESSs are investigated to maximize PV usage and minimize grid dependence. The MILP formulation is developed upon the risk analysis of traffic demand and battery data which offer more accurate results. In [32], the McCormick relaxation and Big-M methods are used to relax the constraints of ESSs. Then, a robust optimization-based MILP model is developed to handle the uncertainties of XFC charging demand and solar power generation. It is important to note that although these studies provide valuable insights into the optimal sizing and operation of DERs within EV charging stations, they only consider the microgrid level and do not consider the distribution network. This is a significant limitation as the integration of many EVs charging at XFC stations can result in a substantial increase in demand and load on the distribution network. The increased huge load caused by XFC can lead to voltage fluctuations and overloading of the network, which can result in power outages and equipment damage. Therefore, it is crucial to consider the impact of XFC stations on the distribution network and ensure that their integration does not cause adverse effects on the network’s stability and reliability.
Most existing literature focuses on the optimal configuration of ESSs, PV panels, and EVs at the microgrid level. The impact of XFC in distribution networks is rarely studied. This paper investigates the optimal configuration of multiple XFC stations integrated with an ESS and PV panels at the distribution network level to determine the optimal ESS energy capacity, ESS rated power, and the number of PV panels, which will minimize the investment and operation costs. The optimization considers the EV charging demand for over 200 EVs and the operational constraints of the grid, ESS, PV panels, and XFC. To accurately estimate the charging load, various EV charging curves as shown in Figure 4, and five different types of EVs are considered. The contributions of this paper include:
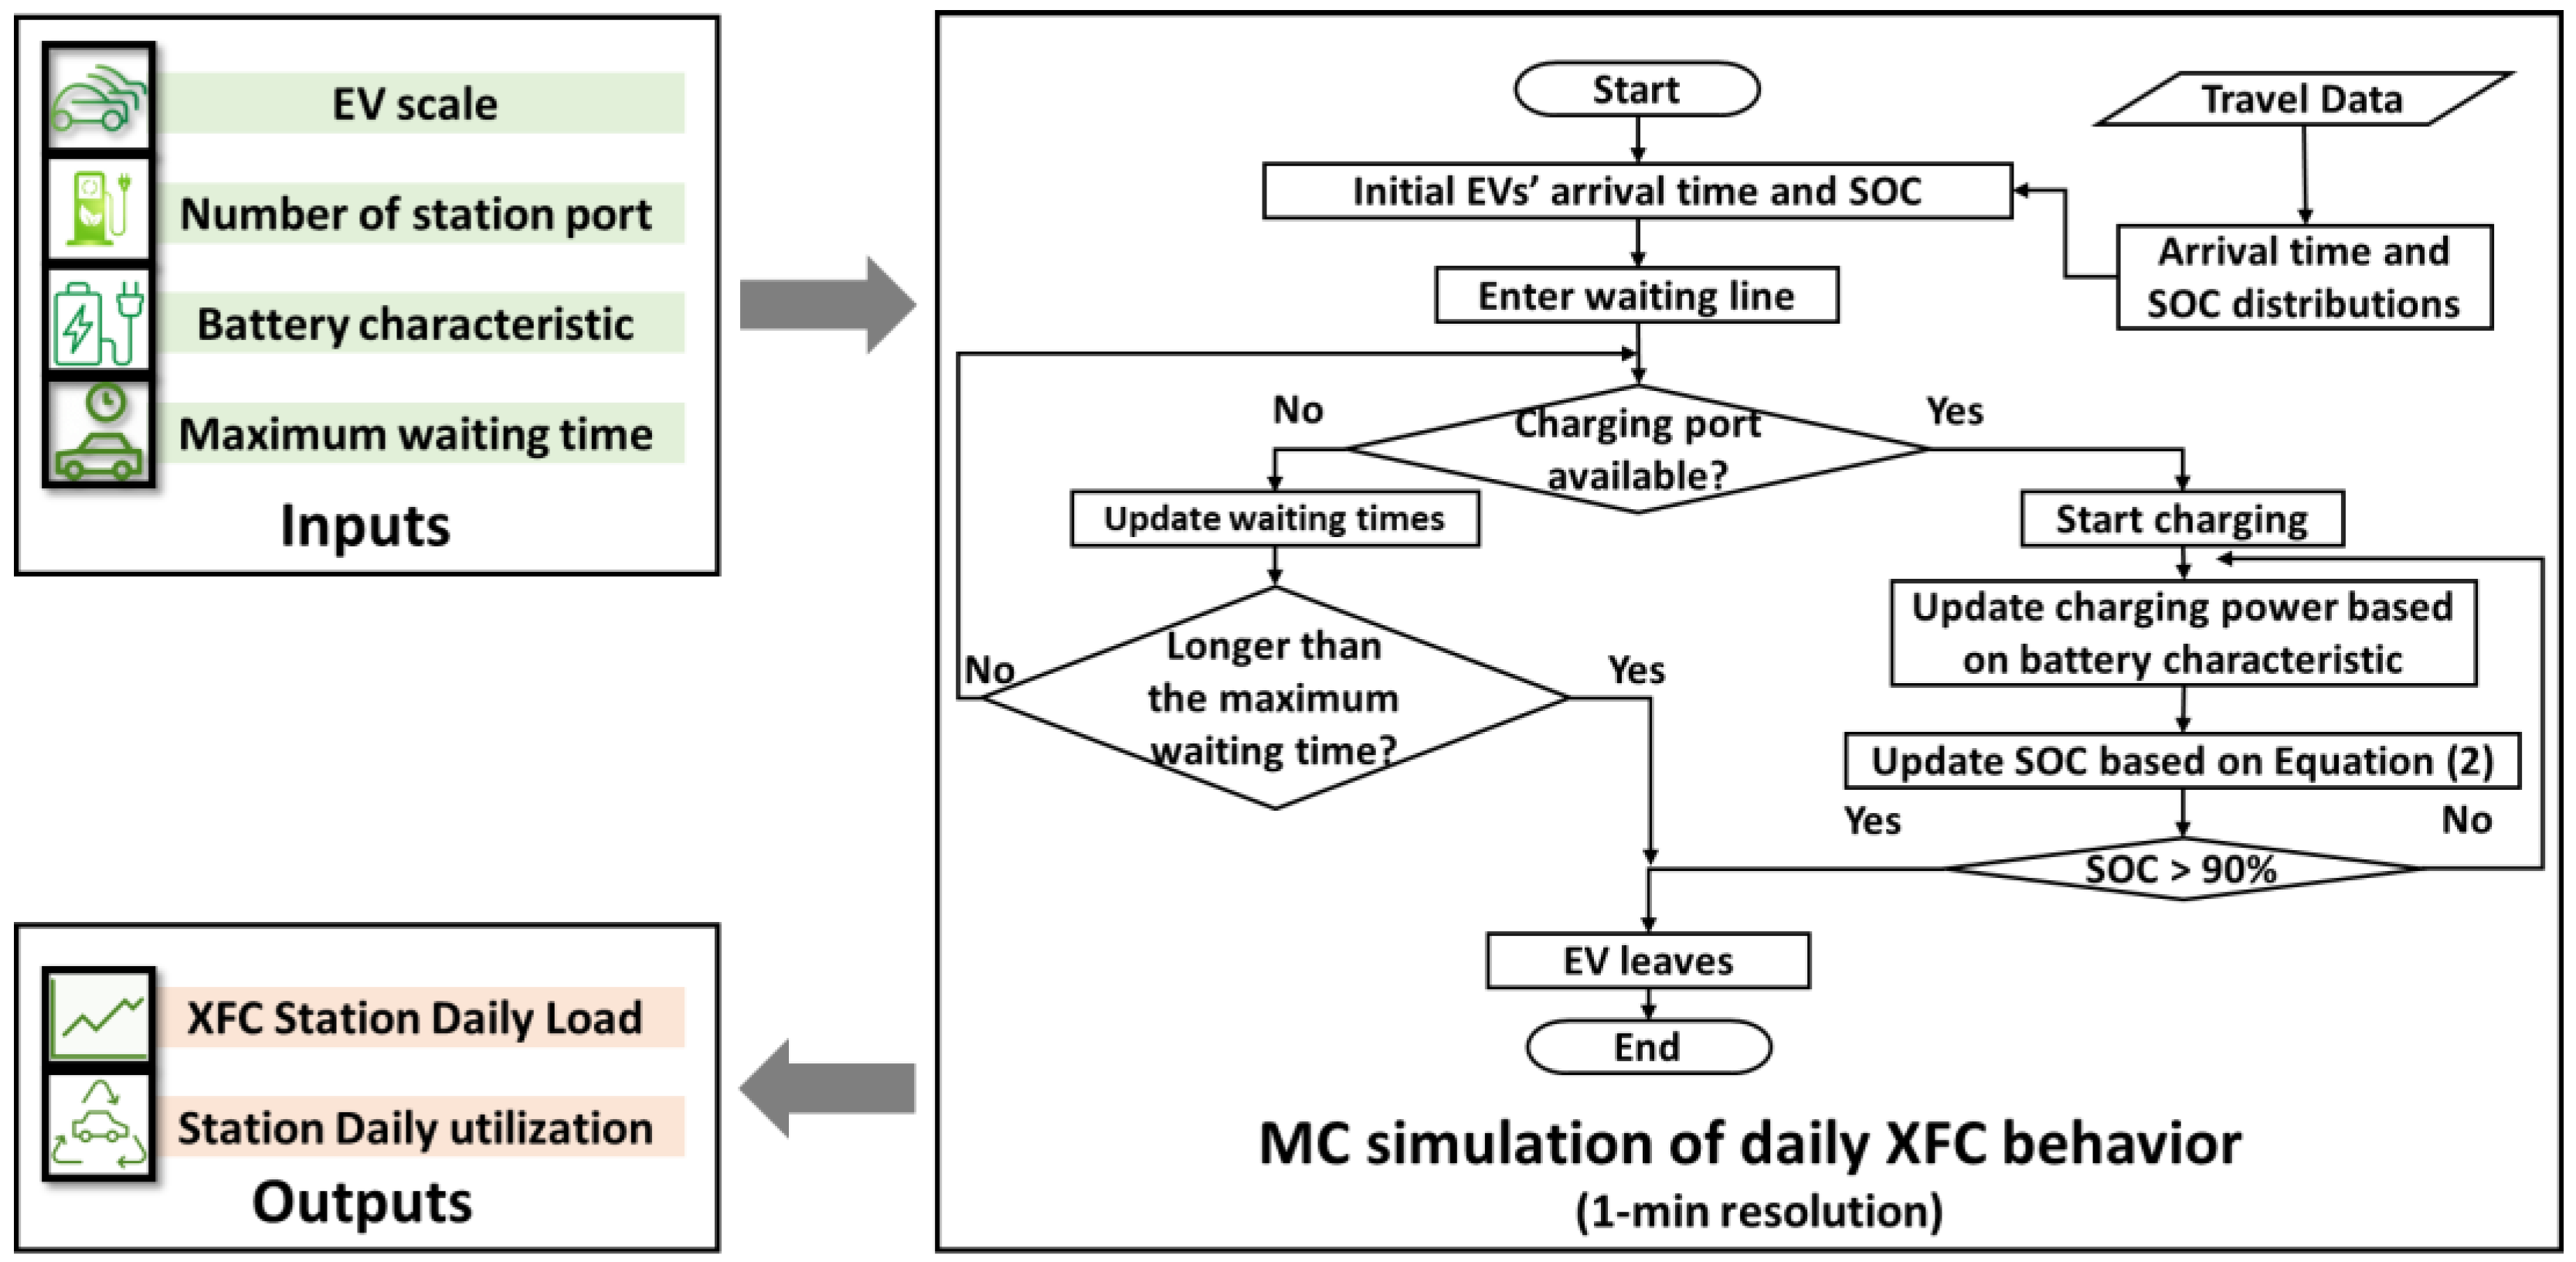
  • A Monte Carlo simulation tool has been developed to estimate the charging demand of XFC stations with the consideration of various aspects, including EV scale, types of EV models, the percentage of different EV models in the total simulated EVs, EV charging curves for different EV models, XFC station port availability, and the maximum waiting time. The utilization of the real-world vehicle travel survey data and battery charging characteristics provides a more realistic estimation for a large-scale EV charging demand at XFC stations.
  • Unlike most existing literature on the sizing of a single XFC station at the microgrid level, this paper studies the optimal configuration of multiple XFC stations at the distribution network level, which needs to consider distribution network power flow and grid constraints in the optimization problem to ensure that XFC stations do not violate grid requirements and the distribution network can operate efficiently and stably. A novel optimization algorithm is developed to determine the optimal ESS energy capacity, ESS rated power, and the number of PV panels for the individual XFC stations within the power distribution network. By fulfilling the charging demand and addressing the operational constraints of the distribution network, XFC, ESS, and PV panels, the presented method can effectively decrease both investment and operational expenses.
The rest of the paper is organized as follows: Section 2 introduces the MC simulation to estimate the EV charging demand at XFC stations. Section 3 presents the modeling and optimization formulation for the optimal configuration of XFC stations integrated with ESS and PV panels. Section 4 shows the simulation results of a use case study and discusses the benefits of optimal configuration. Section 5 concludes this paper.

2. EV Charging Demand Estimation

EV charging demand at XFC stations is the key impact factor to determine the optimal ESS energy capacity, ESS rated power, and the PV size integrated with XFC stations. Due to the lack of real-world XFC station charging demand data, Monte Carlo simulation is employed to estimate the XFC station charging load. Figure 1 shows the inputs, outputs, and estimation logic of the Monte Carlo simulation. The MC simulation parameters and the descriptions of these parameters are summarized in Table 1. The simulation inputs include EV scale, the number of station ports, battery characteristics, maximum waiting time, and the EV arrival time and SOC distribution. The probability distributions of the EV arrival time and SOC are obtained from a travel survey database. The outputs of the MC simulation are the load profiles and daily usage of each XFC station. A first-come, first-served queuing method is adopted in the load estimation logic. When an EV arrives at an XFC station, the driver will wait in the queue if there is no charging port available. When a port becomes available, the first vehicle in the queue will start to be charged. A vehicle will leave without charging if the waiting time reaches the maximum waiting time.

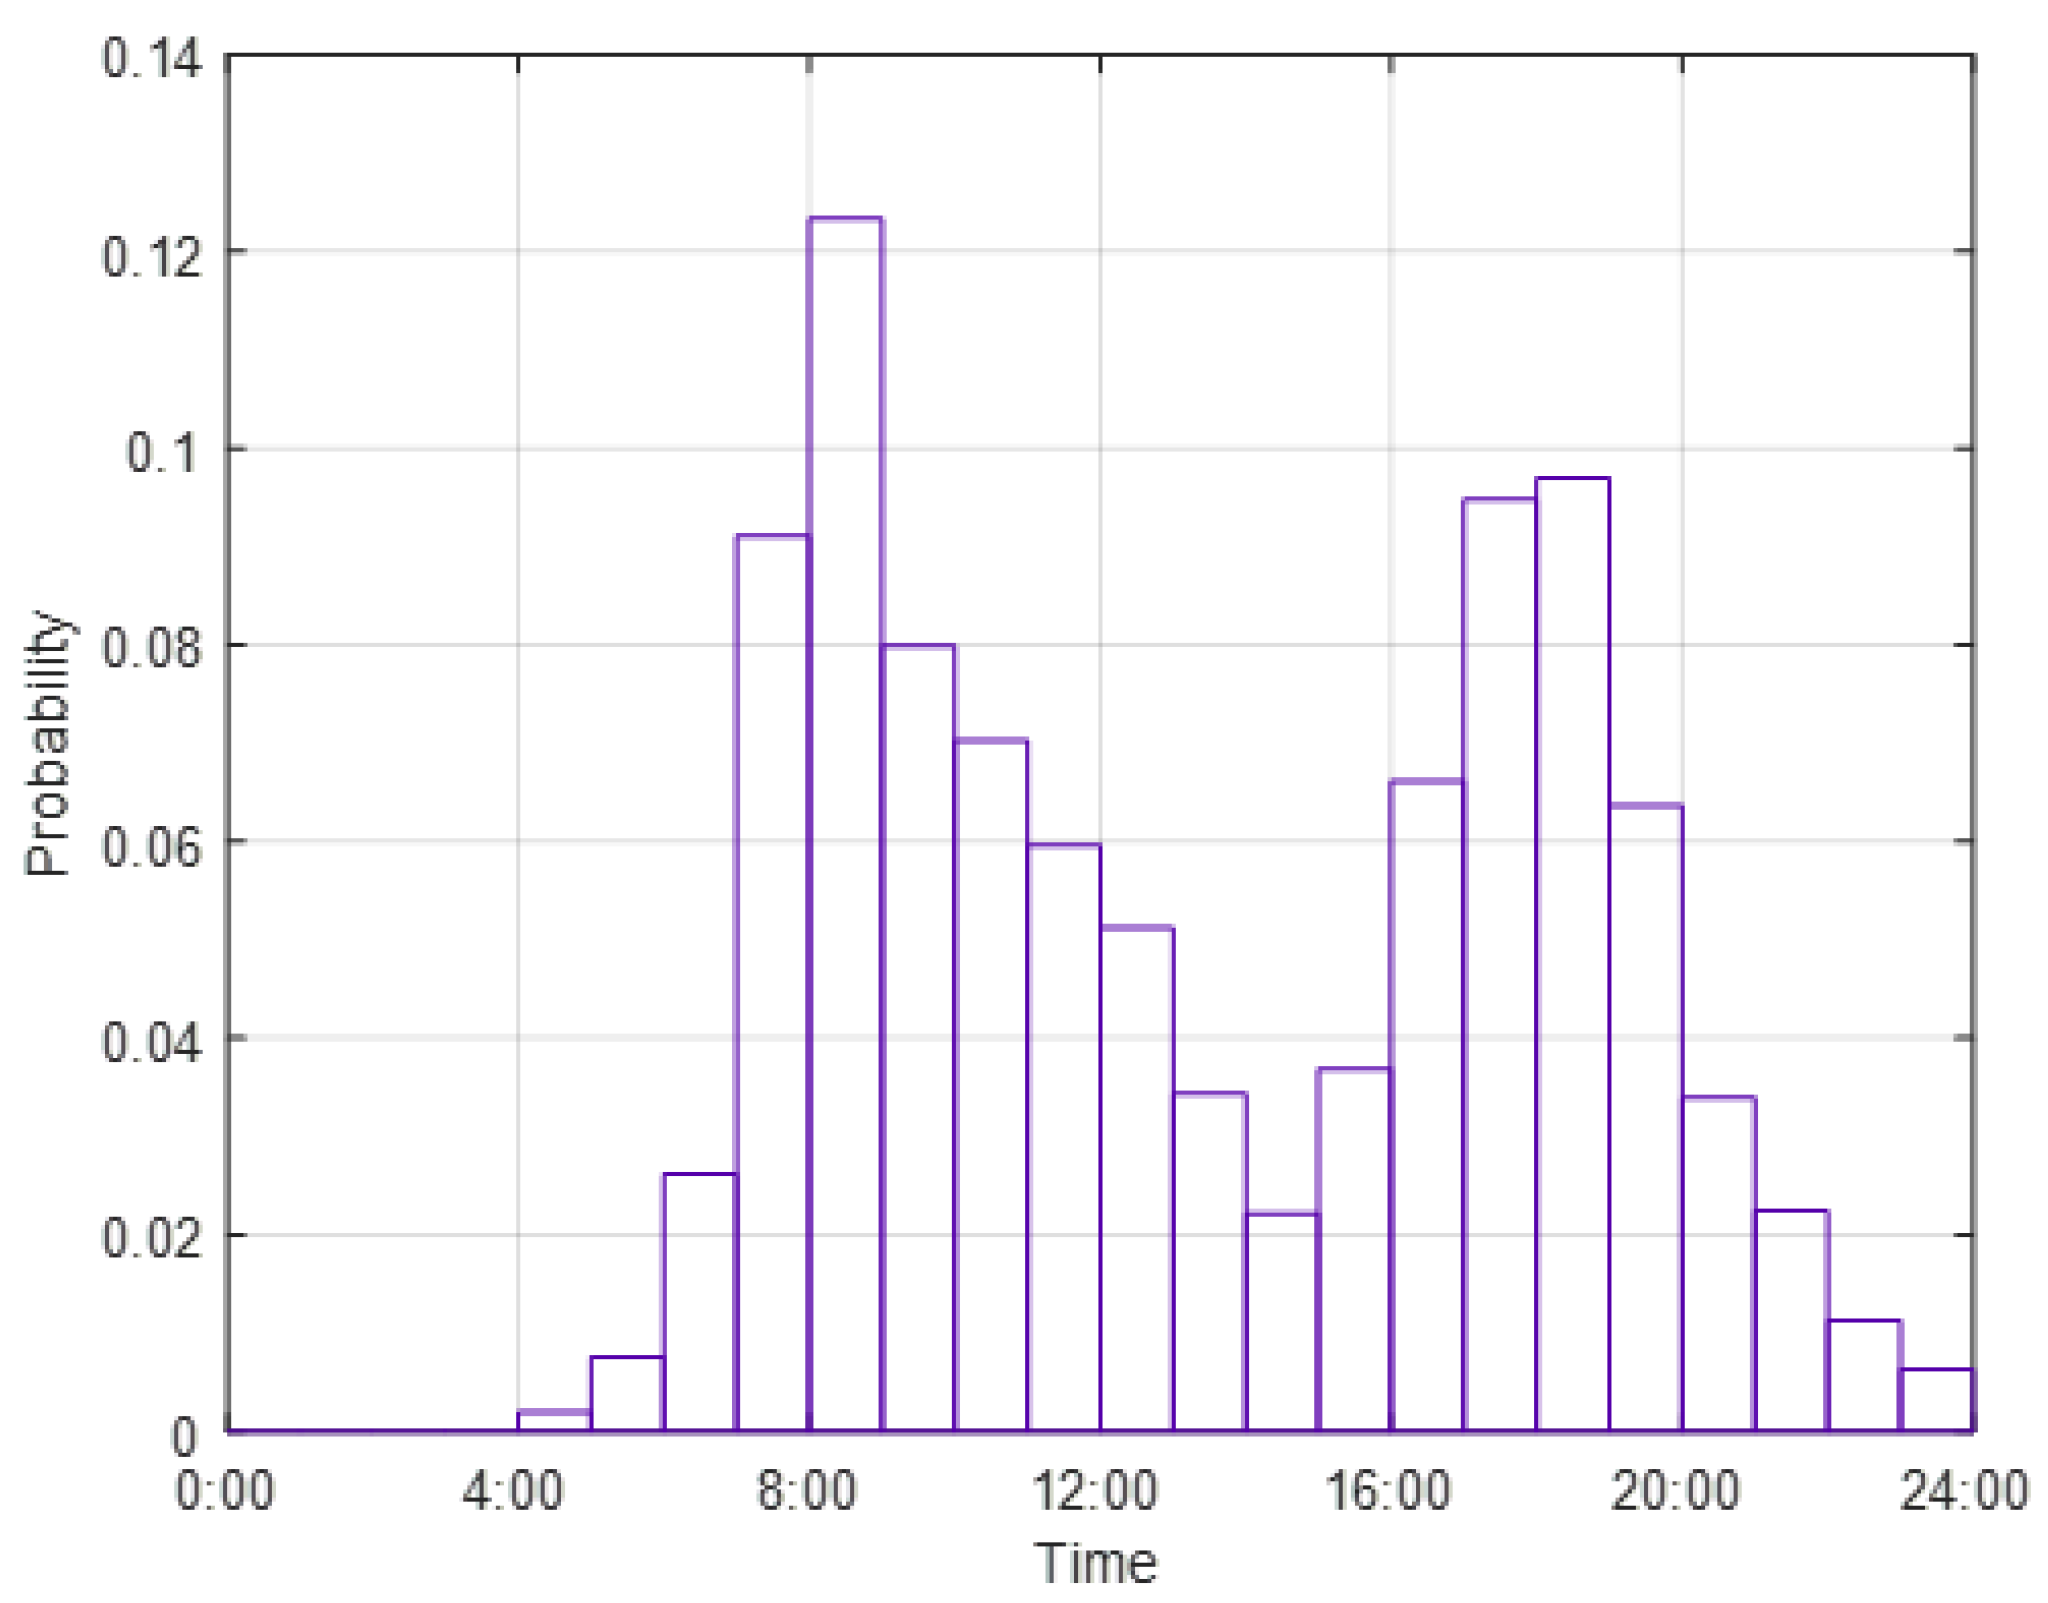
2.1. Probability Distribution of EV Arrival Time at XFC Stations

To obtain a realistic probability distribution of EV arrival time, the probability distributions of home departure time, the daily mileage, and the hourly probability of daily trips [32] are derived from an open database, the National Household Travel Survey (NHTS) [33]. The survey data provide information on driving patterns for 309,164 vehicles. The first peak of departure time from home to work is around 7:00–9:00 a.m., and most EVs travel within the range of 5 to 40 miles daily. The authors of [32] analyzed the travel survey data thoroughly and presented the probability distributions of home departure time and daily mileage. They also provide the hourly probability distribution of daily trips for a weekday and a weekend. These probability distributions were used in this study, to generate the probability distribution of EV arrival time at XFC stations.
A total of 100,000 EVs are simulated to generate the probability distribution of EV arrival time at XFC stations. Based on the report of EV Consumer Behavior [34], half of EVs were charged at home and the rest were charged elsewhere. Hence, it is assumed that half of these vehicles leave home with 90% SOC, and the rest with 40% SOC. It is also assumed that the arrival SOC at XFC stations follows a normal distribution. Figure 2 shows an example of arrival SOC distribution with a 25% mean and 3.4% standard deviation. In the simulation, the random values of home departure time, daily mileage, and the threshold of SOC to charge the vehicle are generated for each EV from the probability distributions of home departure time, daily mileage, and arrival SOC. The battery SOC of EVs at each time step is updated by:
SOC EV ( t + 1 ) = SOC EV t - m t d d max × 100
where m t is the hourly probability of a daily trip at time t , d denotes the daily mileage, and d m a x is the maximum mileage range of the EV battery. When an EV’s SOC becomes below its threshold SOC, the vehicle needs to be charged and the current time is recorded. The collection of this time for all 100,000 EVs forms the probability distribution of EV arrival time at XFC stations as shown in Figure 3. Two peaks, which are the morning peak from 7:00 a.m. to 9:00 a.m. and the evening peak from 5:00 p.m. to 8:00 p.m., are observed during the commuter periods.

2.2. EV Charging Load Estimation with the Consideration of Charging Curves for Different EV Models

As mentioned previously, the EV charging curves depend on both the charging port power rate and the EV’s battery characteristics. For example, an EV with a maximum charge rate of 50 kW can be connected to a 300 kW charger, but it will be charged at 50 kW. Therefore, the battery charging acceptance curve is necessary to be considered while estimating the charging load at XFC stations. The 300 kW charger operated by Fastned is adopted in this paper. The charging curves of various types of EVs are shown in Figure 4 [35].
The charging process of n-th EV is modeled as a discrete-time linear system as:
S O C n , e v ( t + Δ t ) = S O C n , e v ( t ) + η n , e v P n , e v ( t ) Δ t E n , e v × 100
where η n , e v is the charging efficiency, P n , e v is the instant charging power, and E n , e v is the battery capacity.
The number of charging ports is also considered an impact factor of charging load estimation at XFC stations. Based on the data from the Alternative Fuels Data Center [36], many EV charging stations have two to four ports. Common gas stations in the suburbs have 6 to 12 pumps. Therefore, in this paper, the number of charging ports is chosen within the range of 2 to 12. Each port has the ability to deliver power up to 300 kW, which can add 200 miles of range within 15 min. The maximum waiting time is 15 min. Based on the first-come, first-served queuing method, the MC simulation can be performed with a 1 min resolution over every 24 h period and generate approximate real-world load profiles and port usage of XFC. The charging load at every simulation time step is determined by the quantity of EVs undergoing charging and the associated charging profiles.

3. Optimal Configuration of XFC Stations Integrated with ESS and PV Panels in Distribution Networks

A schematic illustration of an XFC station with an ESS and PV panels in a medium voltage distribution network is shown in Figure 5. The XFC station is connected as a distribution node, and it receives power through the distribution feeder and transformer. The reverse power flow feeding back to the distribution network is not considered in this paper since the rules and regulations regarding reverse power flow to the grid vary depending on utility companies. At the current time, it is not allowed by default although some utility companies may provide special permits or programs to allow reverse power from distributed energy resources, such as solar panels and electric vehicles. Hence, the ESS is responsible for storing energy from the PV panels and the distribution network and releasing power to the XFC charging loads to meet charging requirements. The operation limitations of the grid also need to be considered while drawing power from the distribution network.

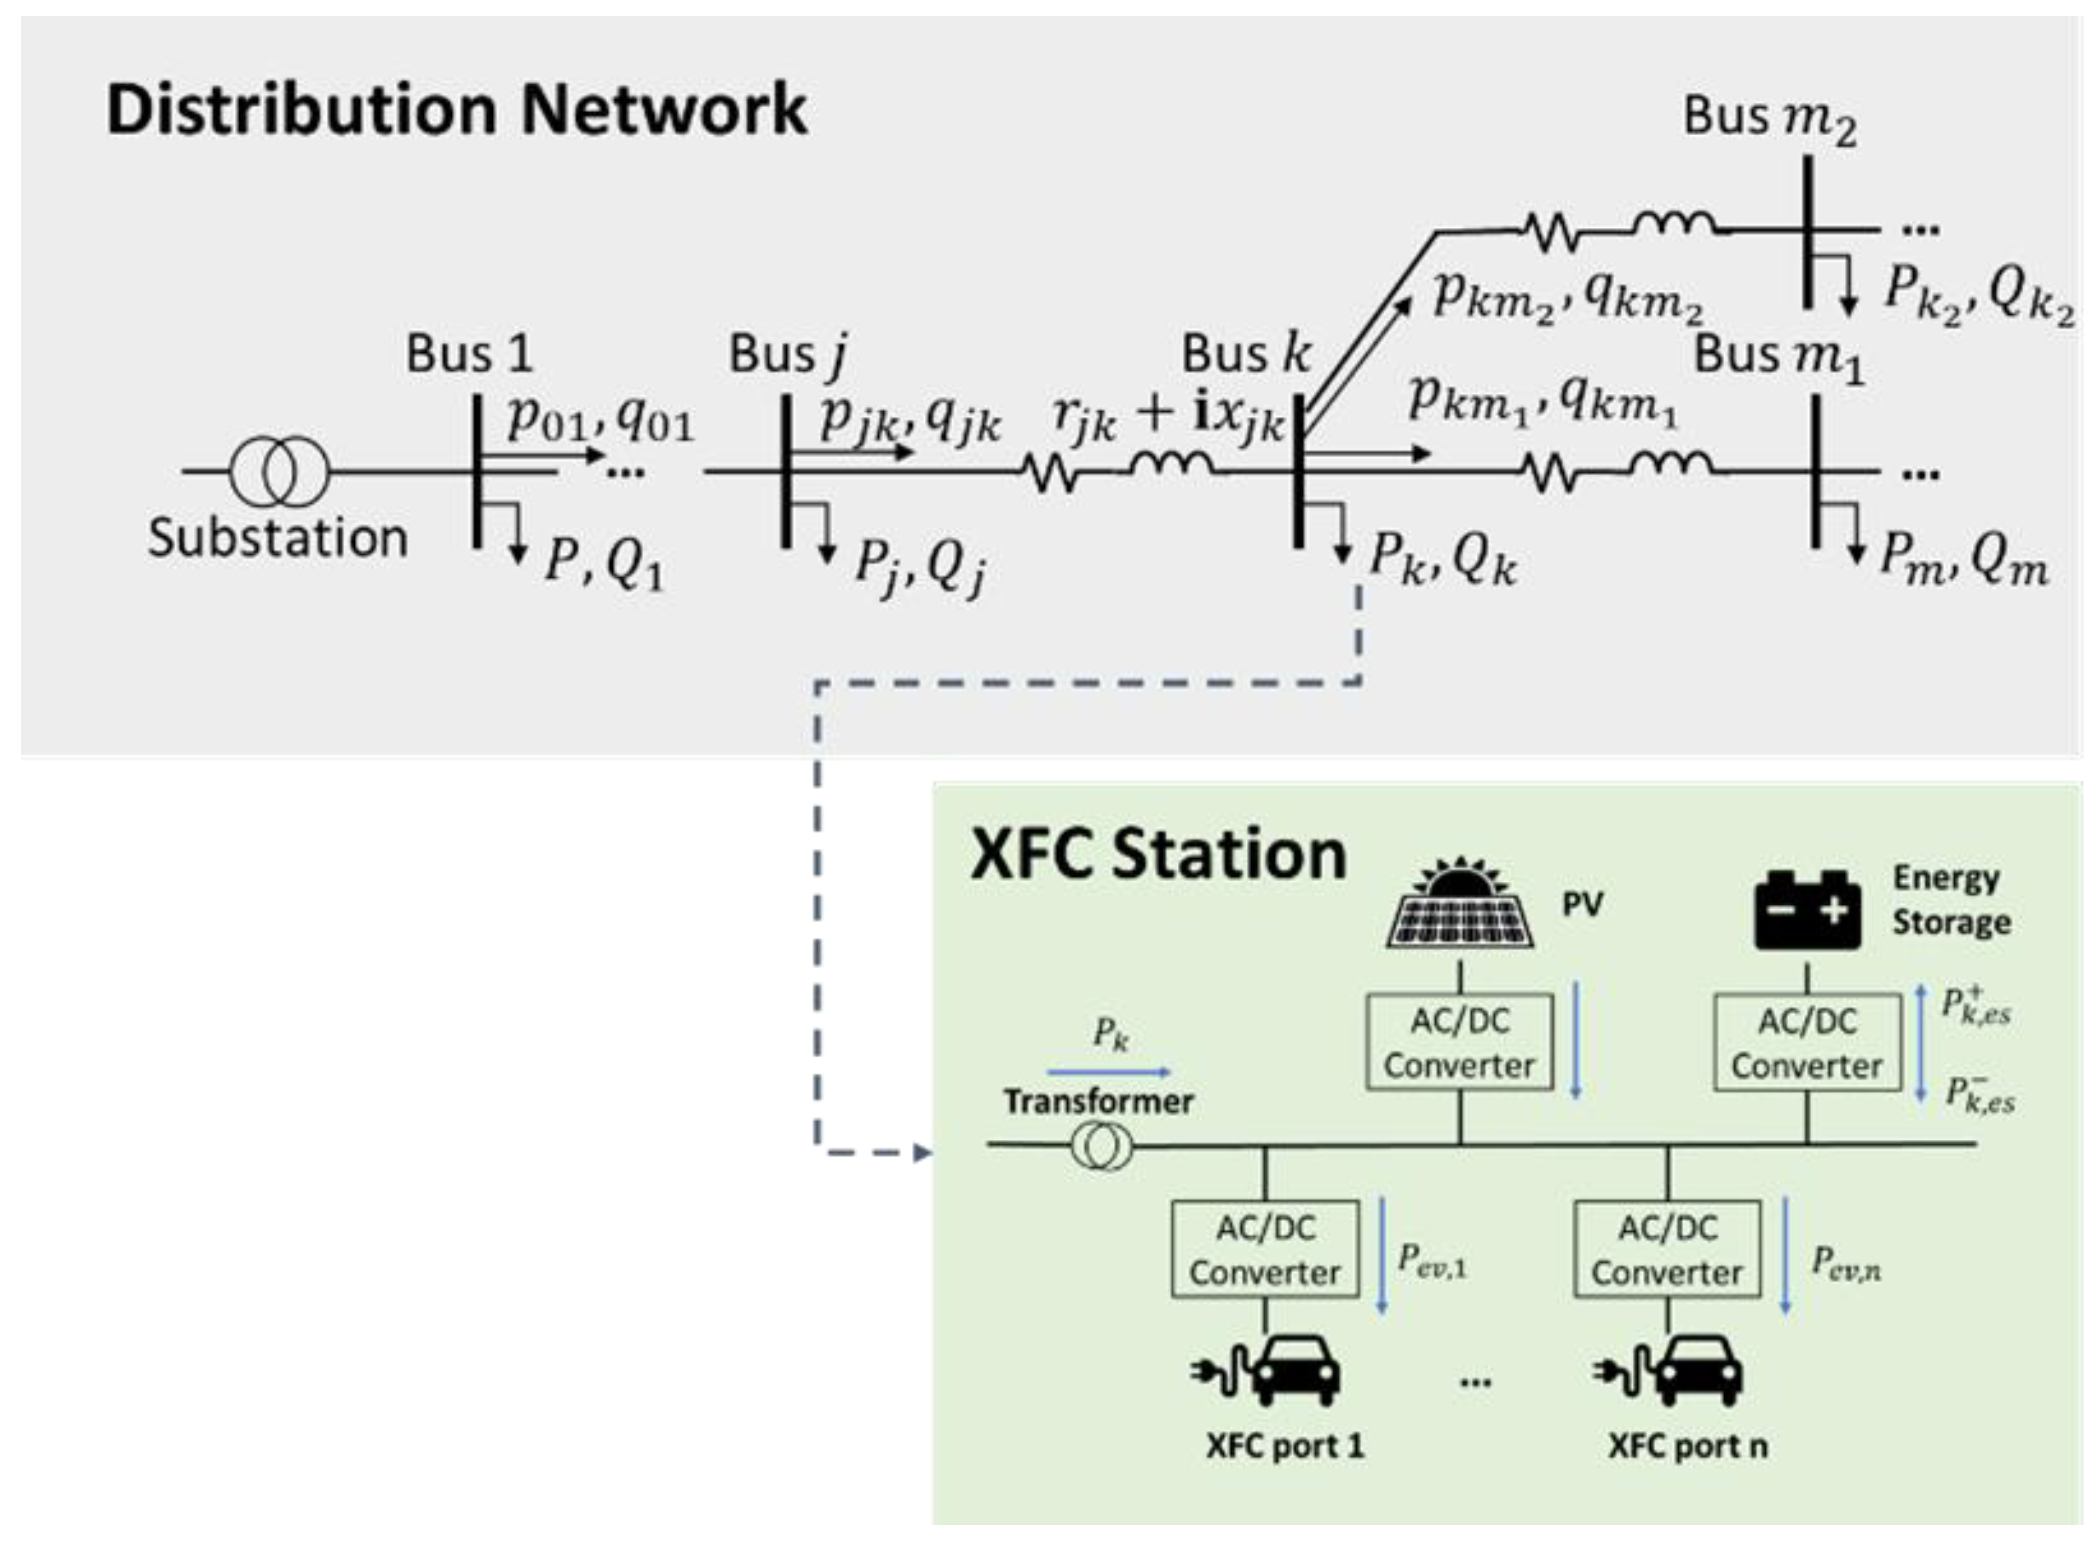
3.1. Distribution Network Power Flow

Considering the branch flow model as shown in Figure 5, the optimal power flow technique is frequently employed to guarantee the proper operation of the distribution network. For each node k K , let j be its parent node and m M k be its child nodes. The power flow equation can be formulated as:
p j k ( t ) I j k ( t ) r j k m M k p k m ( t ) = P k ( t )
q j k ( t ) I j k ( t ) x j k m M k q k m ( t ) = Q k ( t )
U k ( t ) U j ( t ) ( r j k 2 + x j k 2 ) I j k + 2 ( p j k ( t ) r j k + q j k ( t ) x j k ) = 0
I j k ( t ) = p j k ( t ) 2 + q j k ( t ) 2 U j ( t )
where p j k and q j k indicate the active and reactive power that are sent from node j to node k ; r j k and x j k denote the resistance and reactance between two nodes; U j k and I j k present the square magnitude of voltage and current; and P k and Q k are the active and reactive power of node k that draws from the distribution network. To avoid the non-convex optimization, the quadratic equalities in Equation (6) are relaxed to a second-order cone expression as below [37]:
2 p j k ( t ) 2 q j k ( t ) I j k ( t ) U k ( t ) 2 I j k ( t ) + U k ( t )
The constraints of the power flow optimization are listed below:
0 I j k ( t ) I max
U min U k ( t ) U max
where I m a x is the maximum squared value of the current magnitude, U m i n and U m a x are the minimum and maximum squared values of the voltage magnitude, respectively.

3.2. PV Model

PV panels are considered non-dispatchable emission-free power generators that depend on the conditions of solar irradiance and ambient temperature. For XFC stations, integrating PV panels is one of the best choices to improve the quality of the charging service and reduce the cost of electricity bills. The instant solar power P p v   is modeled as a discrete-time linear system [38].
P p v ( t ) = G ( t ) A p v P p v , r a t e d η p v 1 β T T C ( t ) T C , S T C
where G t is the solar radiance; A p v is the area of a PV cell; P p v , r a t e d is the nominal power of a PV cell, η p v is the power efficiency; β T is the PV temperature coefficient; T c t is the PV cell temperature; and T c , S T C is the cell temperature under standard test conditions [39].
The area of the PV panels is determined by the number of PV cells n p v and the area of a single PV cell A p v to be installed. Referenced to the roof area of gas stations in the suburbs, the maximum areas of PV panels, A p v m a x , are assumed to be 80   m 2 for 4-port XFC stations and 160   m 2 for 8-port XFC stations. The constraint of PV panel area can be formulated as:
n p v A p v A p v max

3.3. ESS Model

A stational ESS works as an energy buffer to store energy from the grid or PV in advance and release energy when EV charging demand is high. With the optimal charging and discharging control of an ESS, the non-dispatchable PV power can be fully utilized, the power required from the grid can be reduced to further improve the distribution network operation, and XFC electricity costs can be reduced based on the time-variant electricity price.
The charging/discharging process of a battery-based ESS can be formulated as:
S O C k , e s s ( t + Δ t ) = S O C k , e s s ( t ) + ϕ k , e s s + ( t ) η e s s P k , e s s + ( t ) Δ t E k , e s s + ϕ k , e s s ( t ) P k , e s s ( t ) Δ t η e s s E k , e s s
ϕ k , e s s + ( t ) + ϕ k , e s s ( t ) = 1
where S O C k , e s s is the battery state of charge at distribution node k ; η e s s is the charging/discharging efficiency of the battery-based ESS; E k , e s s is the battery capacity at distribution node k ; P k , e s s + is the battery charging power and P k , e s s is the battery discharging power. + and are binary variables to indicate the charging or discharging mode of ESS. Equation (13) ensures that the battery cannot be charged or discharged at the same time.
The charging and discharging rate are limited by the rated charging/discharging power P k , e s s rated . These can be expressed as Equations (14) and (15). Meanwhile, the SOC is limited to avoid overcharging and deep discharging as shown in Equation (16).
0 P k , e s s + ( t ) P k , e s s r a t e d
P k , e s s r a t e d P k , e s s ( t ) 0
10 % S O C k , e s s ( t ) 90 %
While operating the battery-based ESS, it must be fully charged at the beginning of each day to prepare for the daily high XFC charge demand. Let t 0 donates the beginning time slot of a day and t 0 + τ denotes the end time slot. The constraints of daily ESS operation can be further improved with:
S O C k , e s s ( t 0 ) = S O C k , e s s ( t 0 + τ ) = 90 %
Finally, the configuration of the ESSs within XFC stations is aimed to find the size of the battery-based ESS, including the rated power and energy capacity. The constraints can be formulated as:
P e s s min P k , e s s r a t e d P e s s max  
E e s s min E k , e s s E e s s max  
where P e s s min and P e s s max are minimal and maximal power to determine the range of rated power of a battery-based ESS, and E e s s min and E e s s max are minimal and maximal energy capacities that can be invested.

3.4. XFC Station Power Flow

As shown in Figure 5, the XFC station is connected to the distribution network node k   as a microgrid. The XFC station will absorb power from the distribution network to charge either the battery-based ESS or EVs. The feeding power from the XFC station node to the distribution network is not considered. The power flow of the XFC station can be formulated as:
P k ( t ) = ϕ k , e s s + ( t ) P k , e s s + ( t ) + ϕ k , e s s ( t ) P k , e s s ( t ) + n e v = 1 N e v P n , e v ( t ) n p v P p v ( t )
P k t P k max
Equation (21) indicates that the injected power to the node k is limited to the feeder capacity P k m a x .

3.5. Optimization Formulation

With a given number of charger ports in an XFC station and the locations of XFC stations in the distribution network, the goal of the optimal configuration is to quantify the power, energy capacity of ESS, and the number of PV cells that need to be configured within XFC stations. The optimization objective is to minimize the investment cost of ESSs and PV panels, the electricity purchase cost of XFC stations, and the cost of power losses in the distribution network. Based on the aforementioned constraints, the optimization problem of XFC stations in the distribution networks is formulated as:
min k = 1 K δ e s s c e s s , E E k , e s s + c e s s , P P k , e s s r a t e d + k = 1 K δ p v c p v n k , p v + t = 1 T k = 1 K λ ( t ) P k ( t ) Δ t + t = 1 T ( j , k ) L λ ( t ) r j k I j k ( t ) Δ t s . t . :   Distribution   network   ( 3 ) - ( 5 ) ,   ( 7 ) - ( 9 ) PV   ( 10 ) , ( 11 ) ESS   ( 12 ) - ( 19 ) XFC   station   ( 20 ) , ( 21 )
where c e s s , E and c e s s , P are the costs of energy and power capacity of the ESS; c p v is the cost of a single PV cell; n p v is the number of PV cells at the distribution network node k ; λ t presents the time-variant electricity price; and δ e s s and δ p v are the annual discount rate of ESS and PV investment costs, respectively. The annual discount rate δ . is shown in Equation (23) [40,41].
δ . = i 1 + i γ . 1 + i γ . 1
where i is the discount rate for the investment cost and γ is the lifespan of the ESS or PV panels. The lifespan of the ESS is assumed to be 20 years and the lifespan of the PV panels is 30 years. The first term of the objective function is the equivalent annual investment cost of the ESS, the second term shows the equivalent annual investment cost of the PV panels, the third term is the electricity cost of XFC stations, and the fourth term indicates the electricity cost of power losses in the distribution network.
The optimal configuration of ESSs and PV panels within XFC stations in the distribution network is formulated as mixed-integer programming with quadratic terms. The variables { n p v , P k , e s s rated , E k , e s s , P k , e s s + , P k , e s s , P k , Q k , p j k , q j k , U k , I k , } can be solved by a Gurobi or Cplex solver efficiently. The required PV panel area and size of the ESS, the charging/discharging operation of the ESS, and the optimal power flow of the distribution network can be generated simultaneously.

4. Case Study

A modified 33-bus system [42] is applied to simulate the presented optimal configuration of XFC stations in the distribution networks. As shown in Figure 6, the distribution nodes are categorized as either residential or commercial nodes and XFC station nodes with 12.88 kV nominal voltage. The voltage range is ±5% of the nominal voltage. Station XFC4 is located at node 30 and has four charging ports and station XFC8 is located at node 8 with eight charging ports. The feeder capacity of node 8 is chosen as 600 kW and the feeder capacity of node 30 is 300 kW. A total of 220 EVs are used in the MC simulation to estimate the charging load in these two XFC stations.

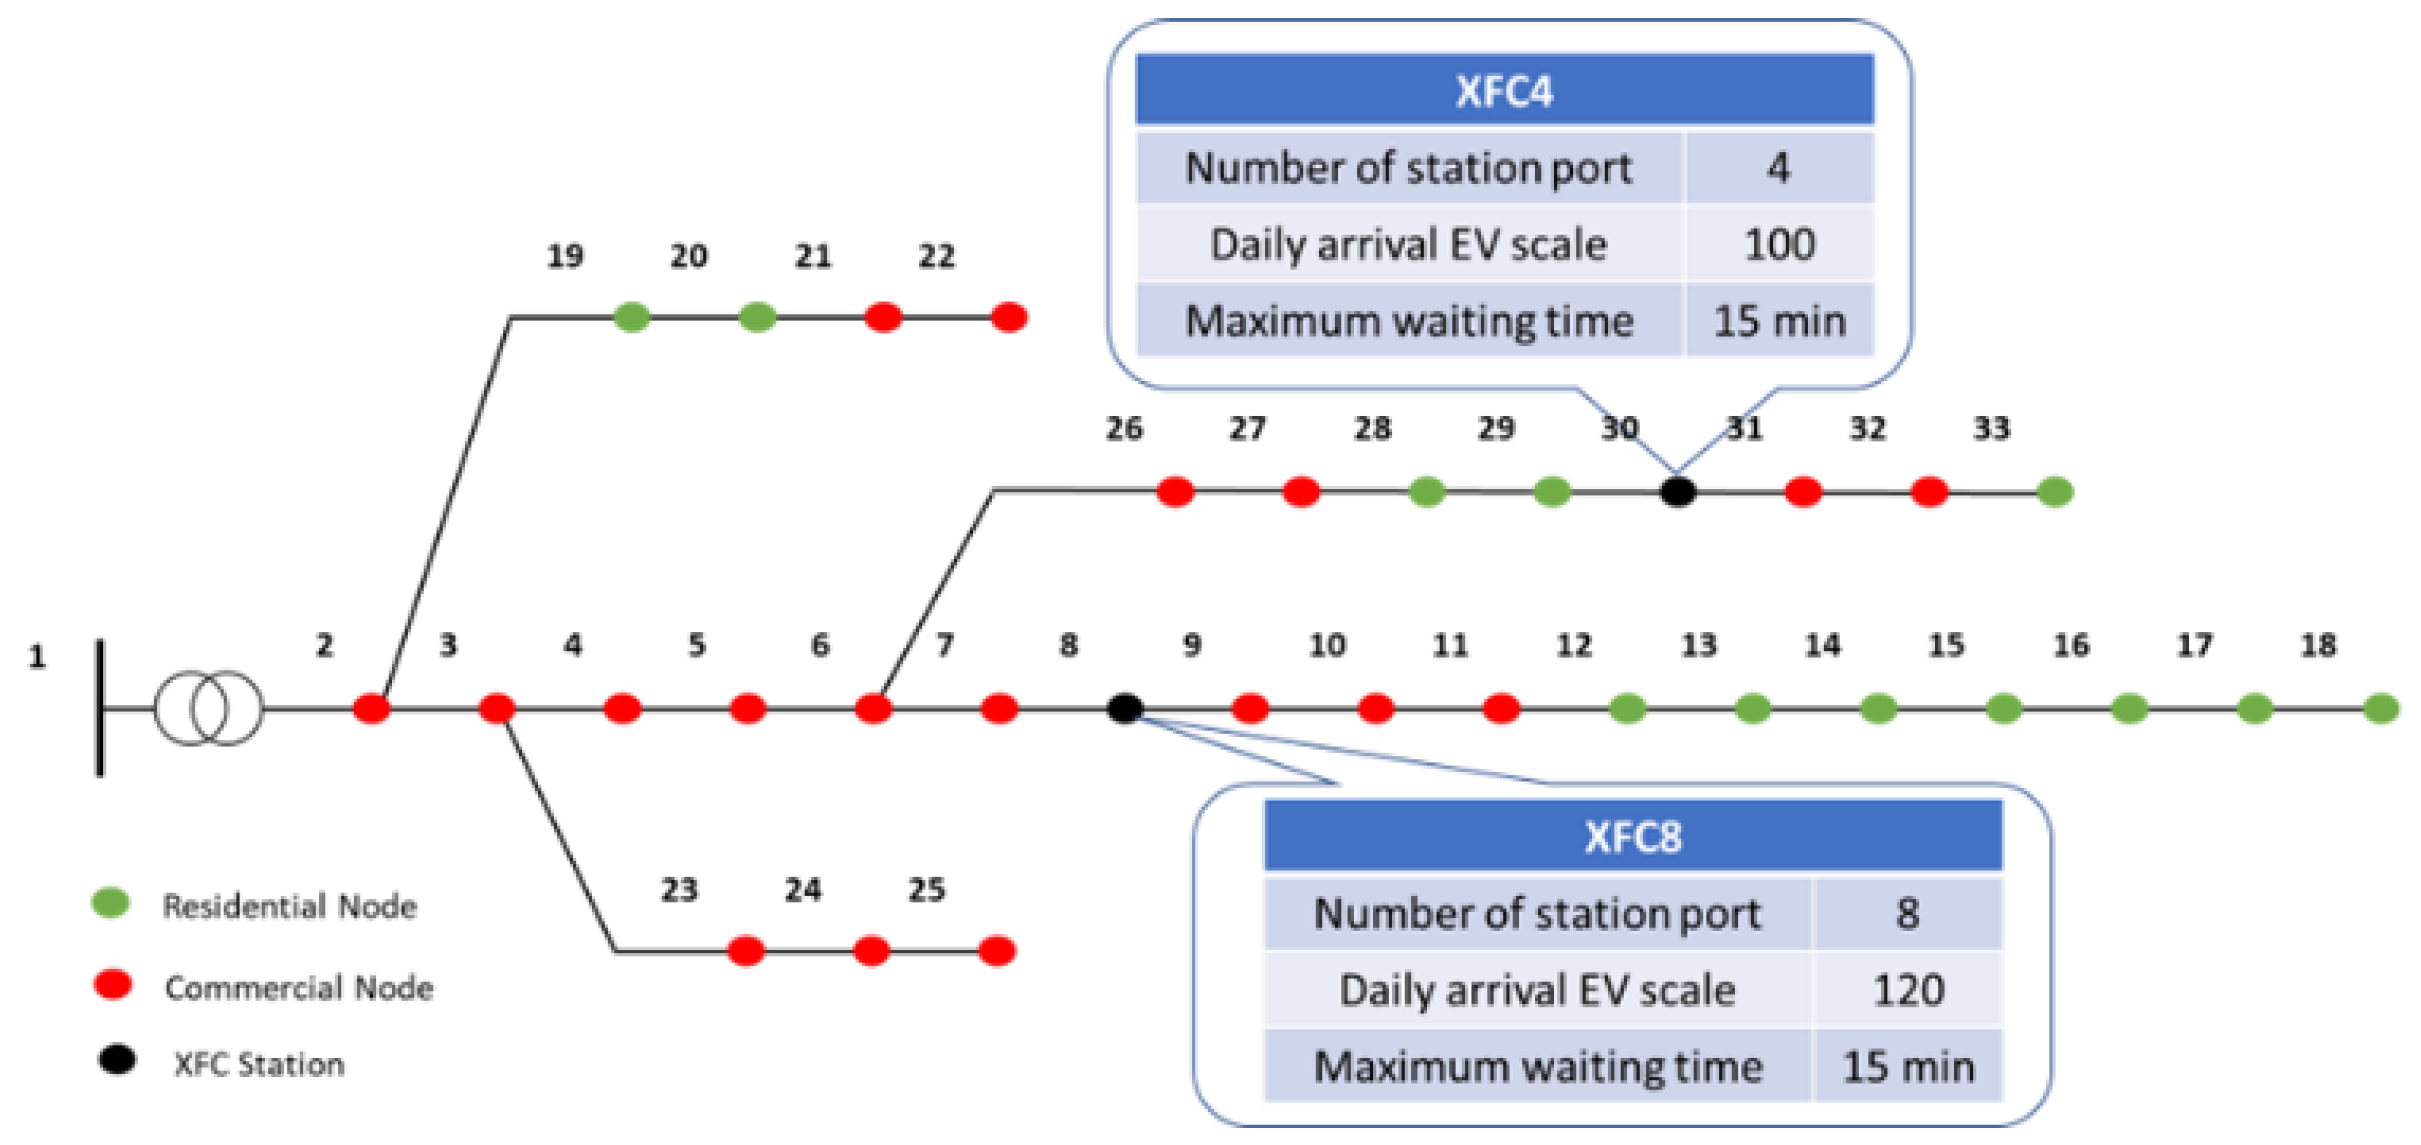
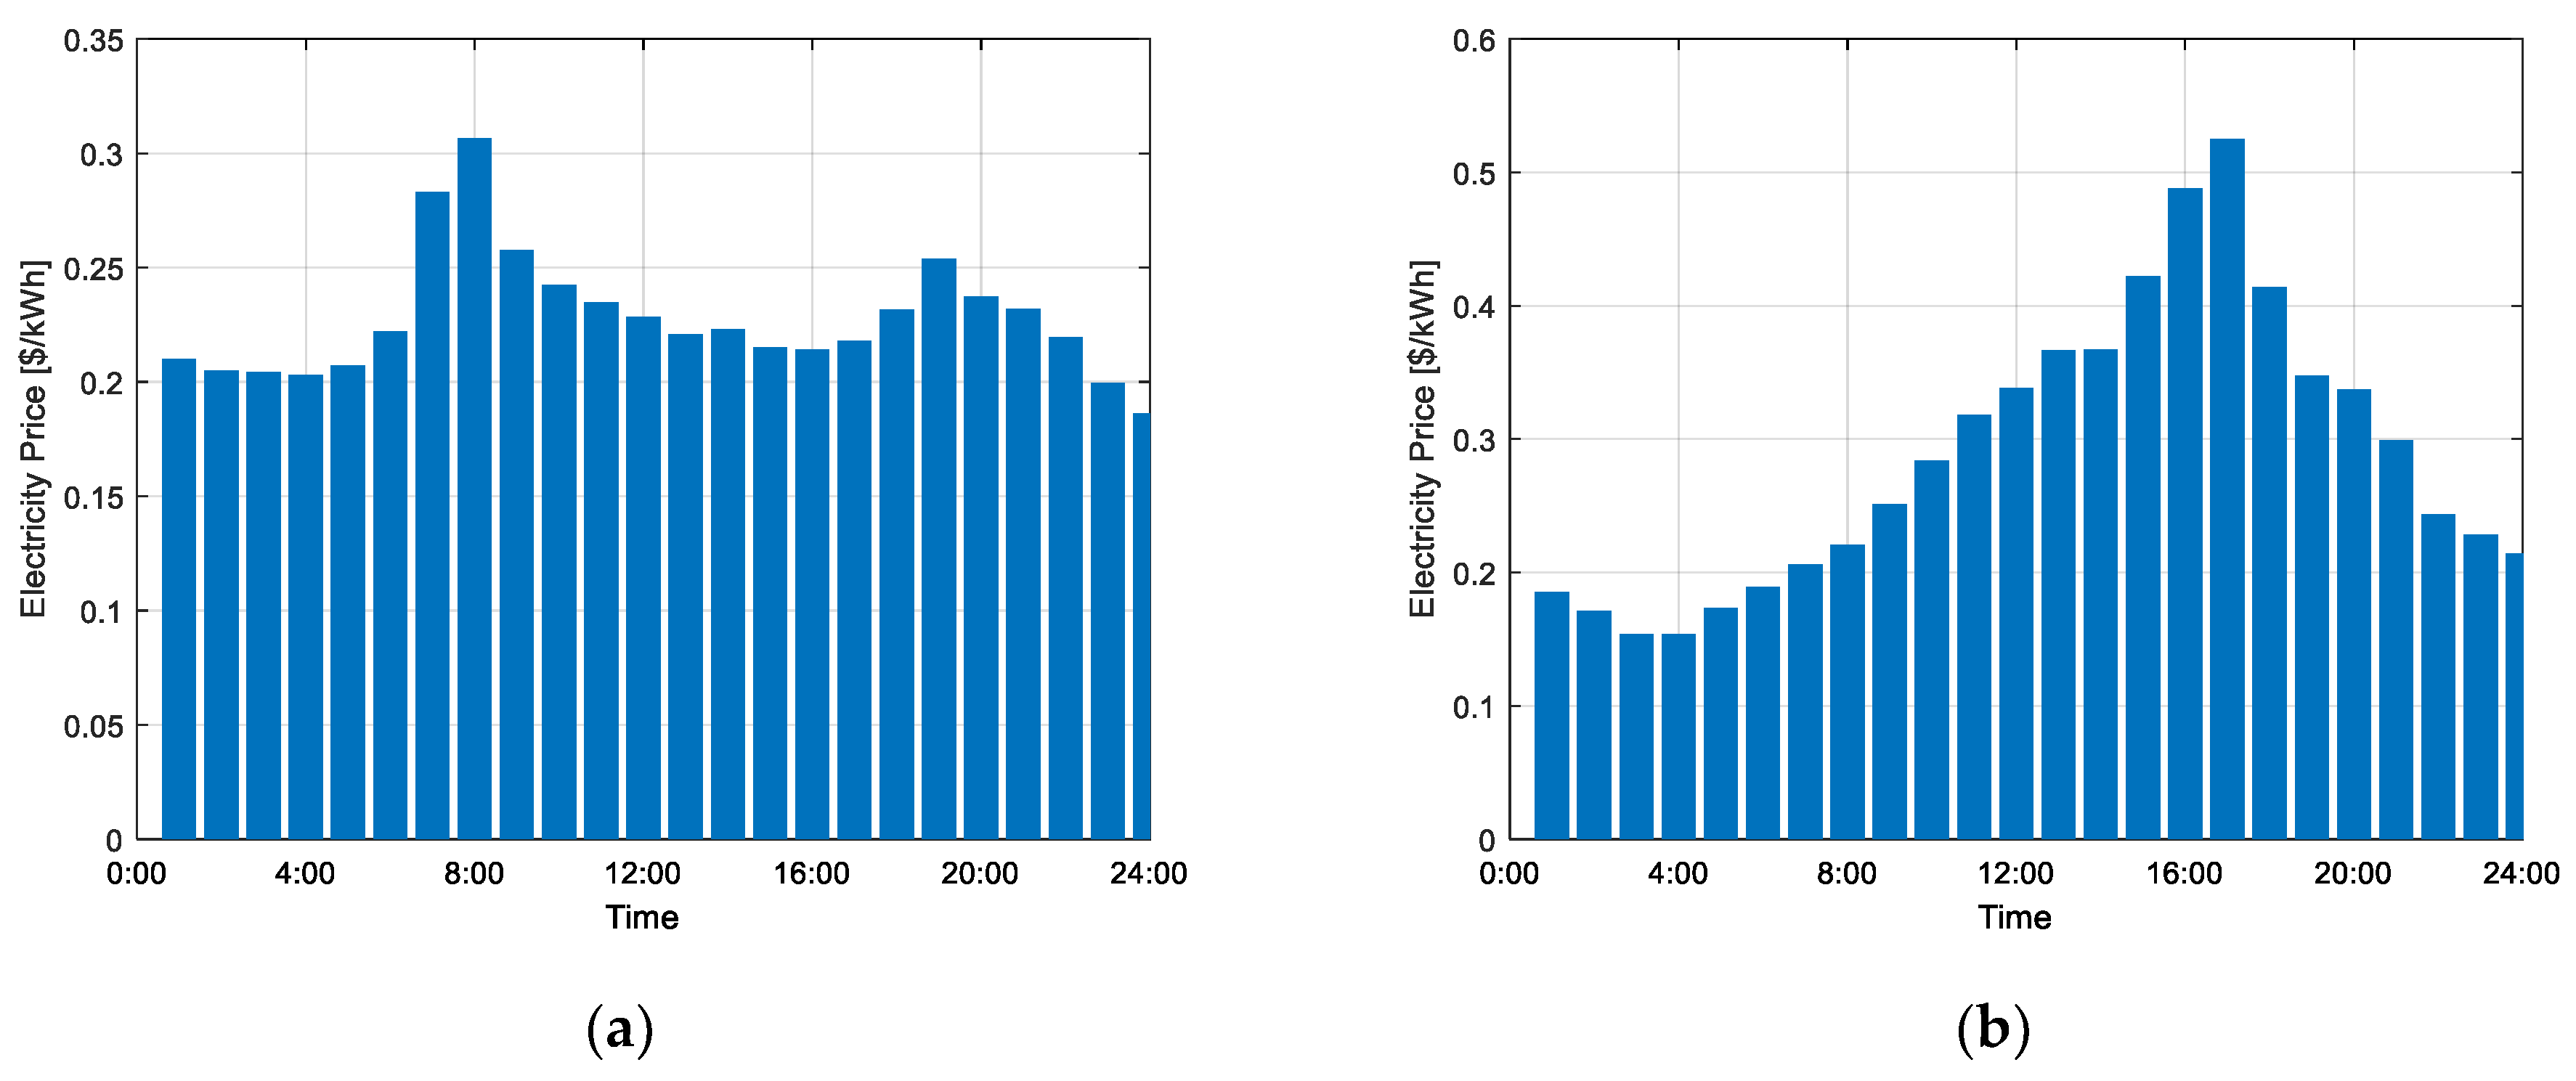
4.1. Basic Parameters

The battery size of different EV models in the simulation and the corresponding percentages of these models in the total simulated EVs are listed in Table 2. It is assumed that 100 EVs are expected to be charged daily at XFC4 and 120 EVs are expected to be charged daily at XFC8. The probability distribution of arrival SOC, arrival time, and charging characteristics are discussed in Section 2. The MC simulation is performed with a 1 min resolution over every 24 h period.
It is assumed that SunPower SPR-E20-327 [43] solar panels are used in the XFC stations. The detailed parameters of this solar panel are listed in Table 3. The historical data of ambient temperature and solar irradiance at Aurora, Illinois in 2018 are retrieved from Solcast [44].
The parameters of the ESS are listed in Table 4. The cost of power capacity is converted from the cost of energy capacity by multiplying by the hour duration [45]. For example, a 589 $/kWh, 2 h battery energy storage system would have a power capacity cost of 1178 $/kW.
The variety of building loads, such as supermarkets, offices, restaurants, houses, and apartments, are selected accordingly to simulate the commercial or residential nodes. The whole year hourly load profiles of buildings in Aurora, Illinois are retrieved from the U.S. Department of Energy’s Open Energy Data Initiative database [46]. The electricity prices are hourly real-time prices for the distribution network. The dataset is retrieved from the PJM dataset of the North Illinois hub [47]. This represents the full year of real-time electricity prices in 2018. The price curves of a typical winter day and a typical summer day are shown in Figure 7.
Different from the MC simulation of EV charging loads with a 1 min resolution, the historical data of solar irradiance, ambient temperature, building loads, and electricity price are hourly-based intervals for a whole year. The estimated EV charging load needs to be approximated in a 1 h resolution for analyzing the optimal configuration problem. Therefore, the average charging power of each hour from the MC simulation is approximated for the optimization. The optimal configuration problem formulated in Section 3 is performed with a 1 h resolution for 365 days.

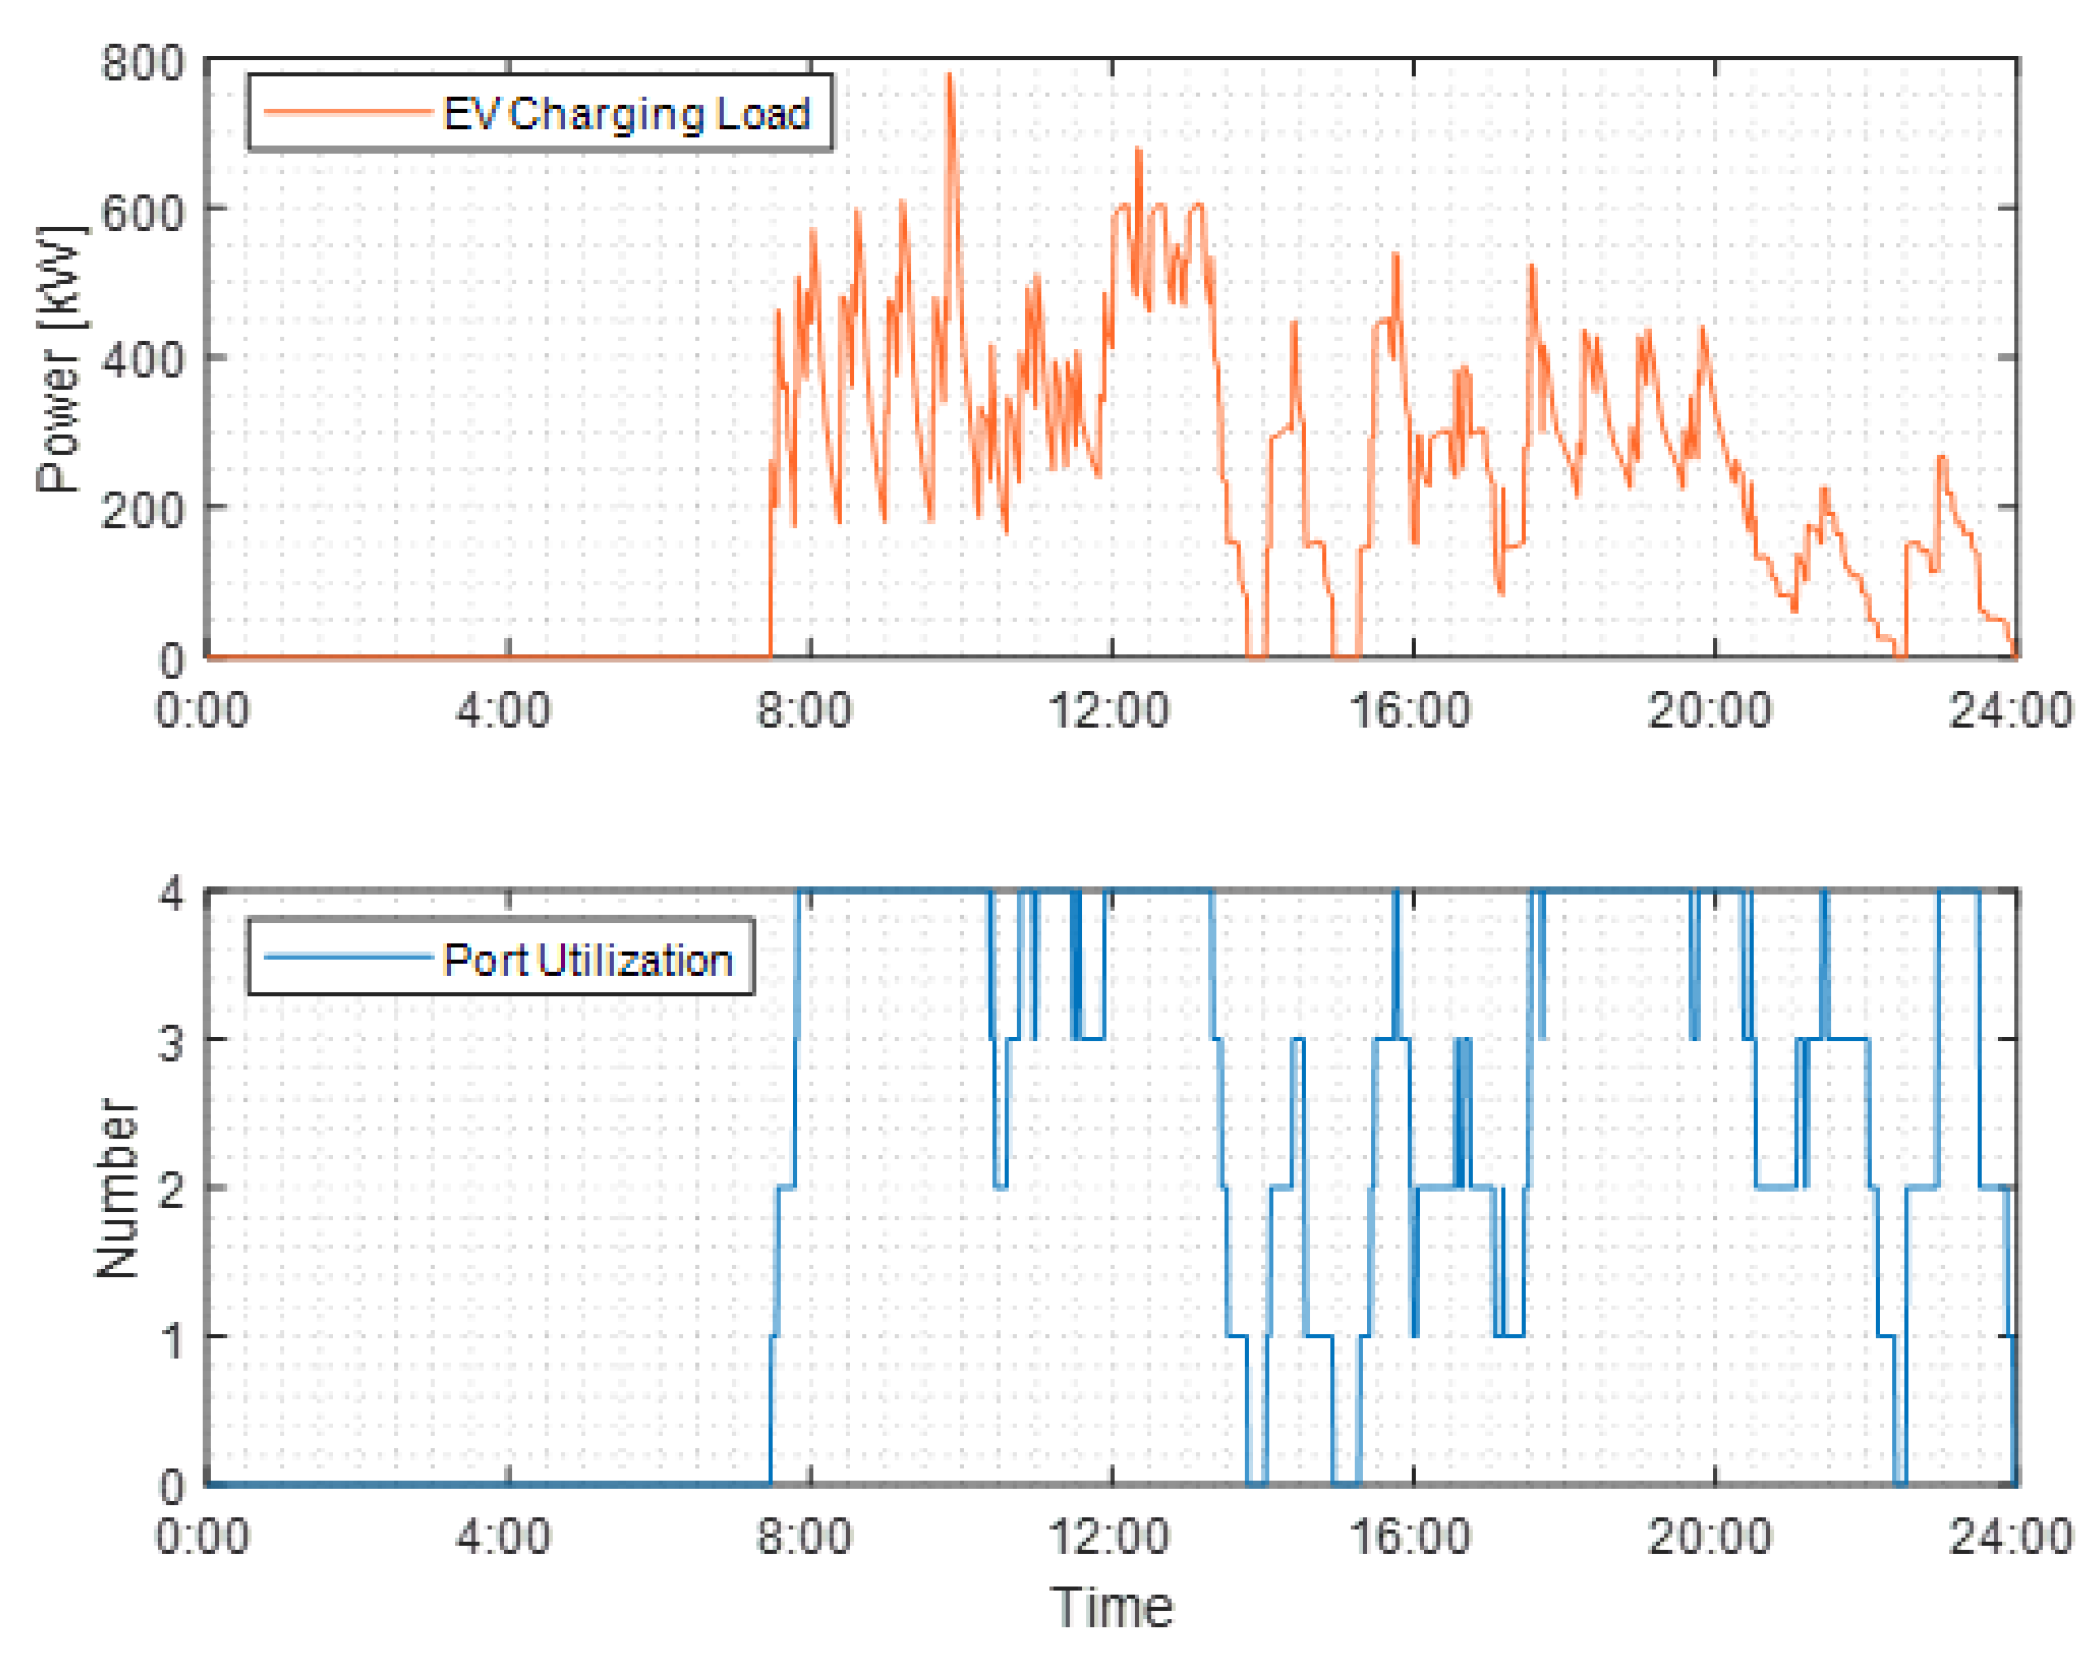
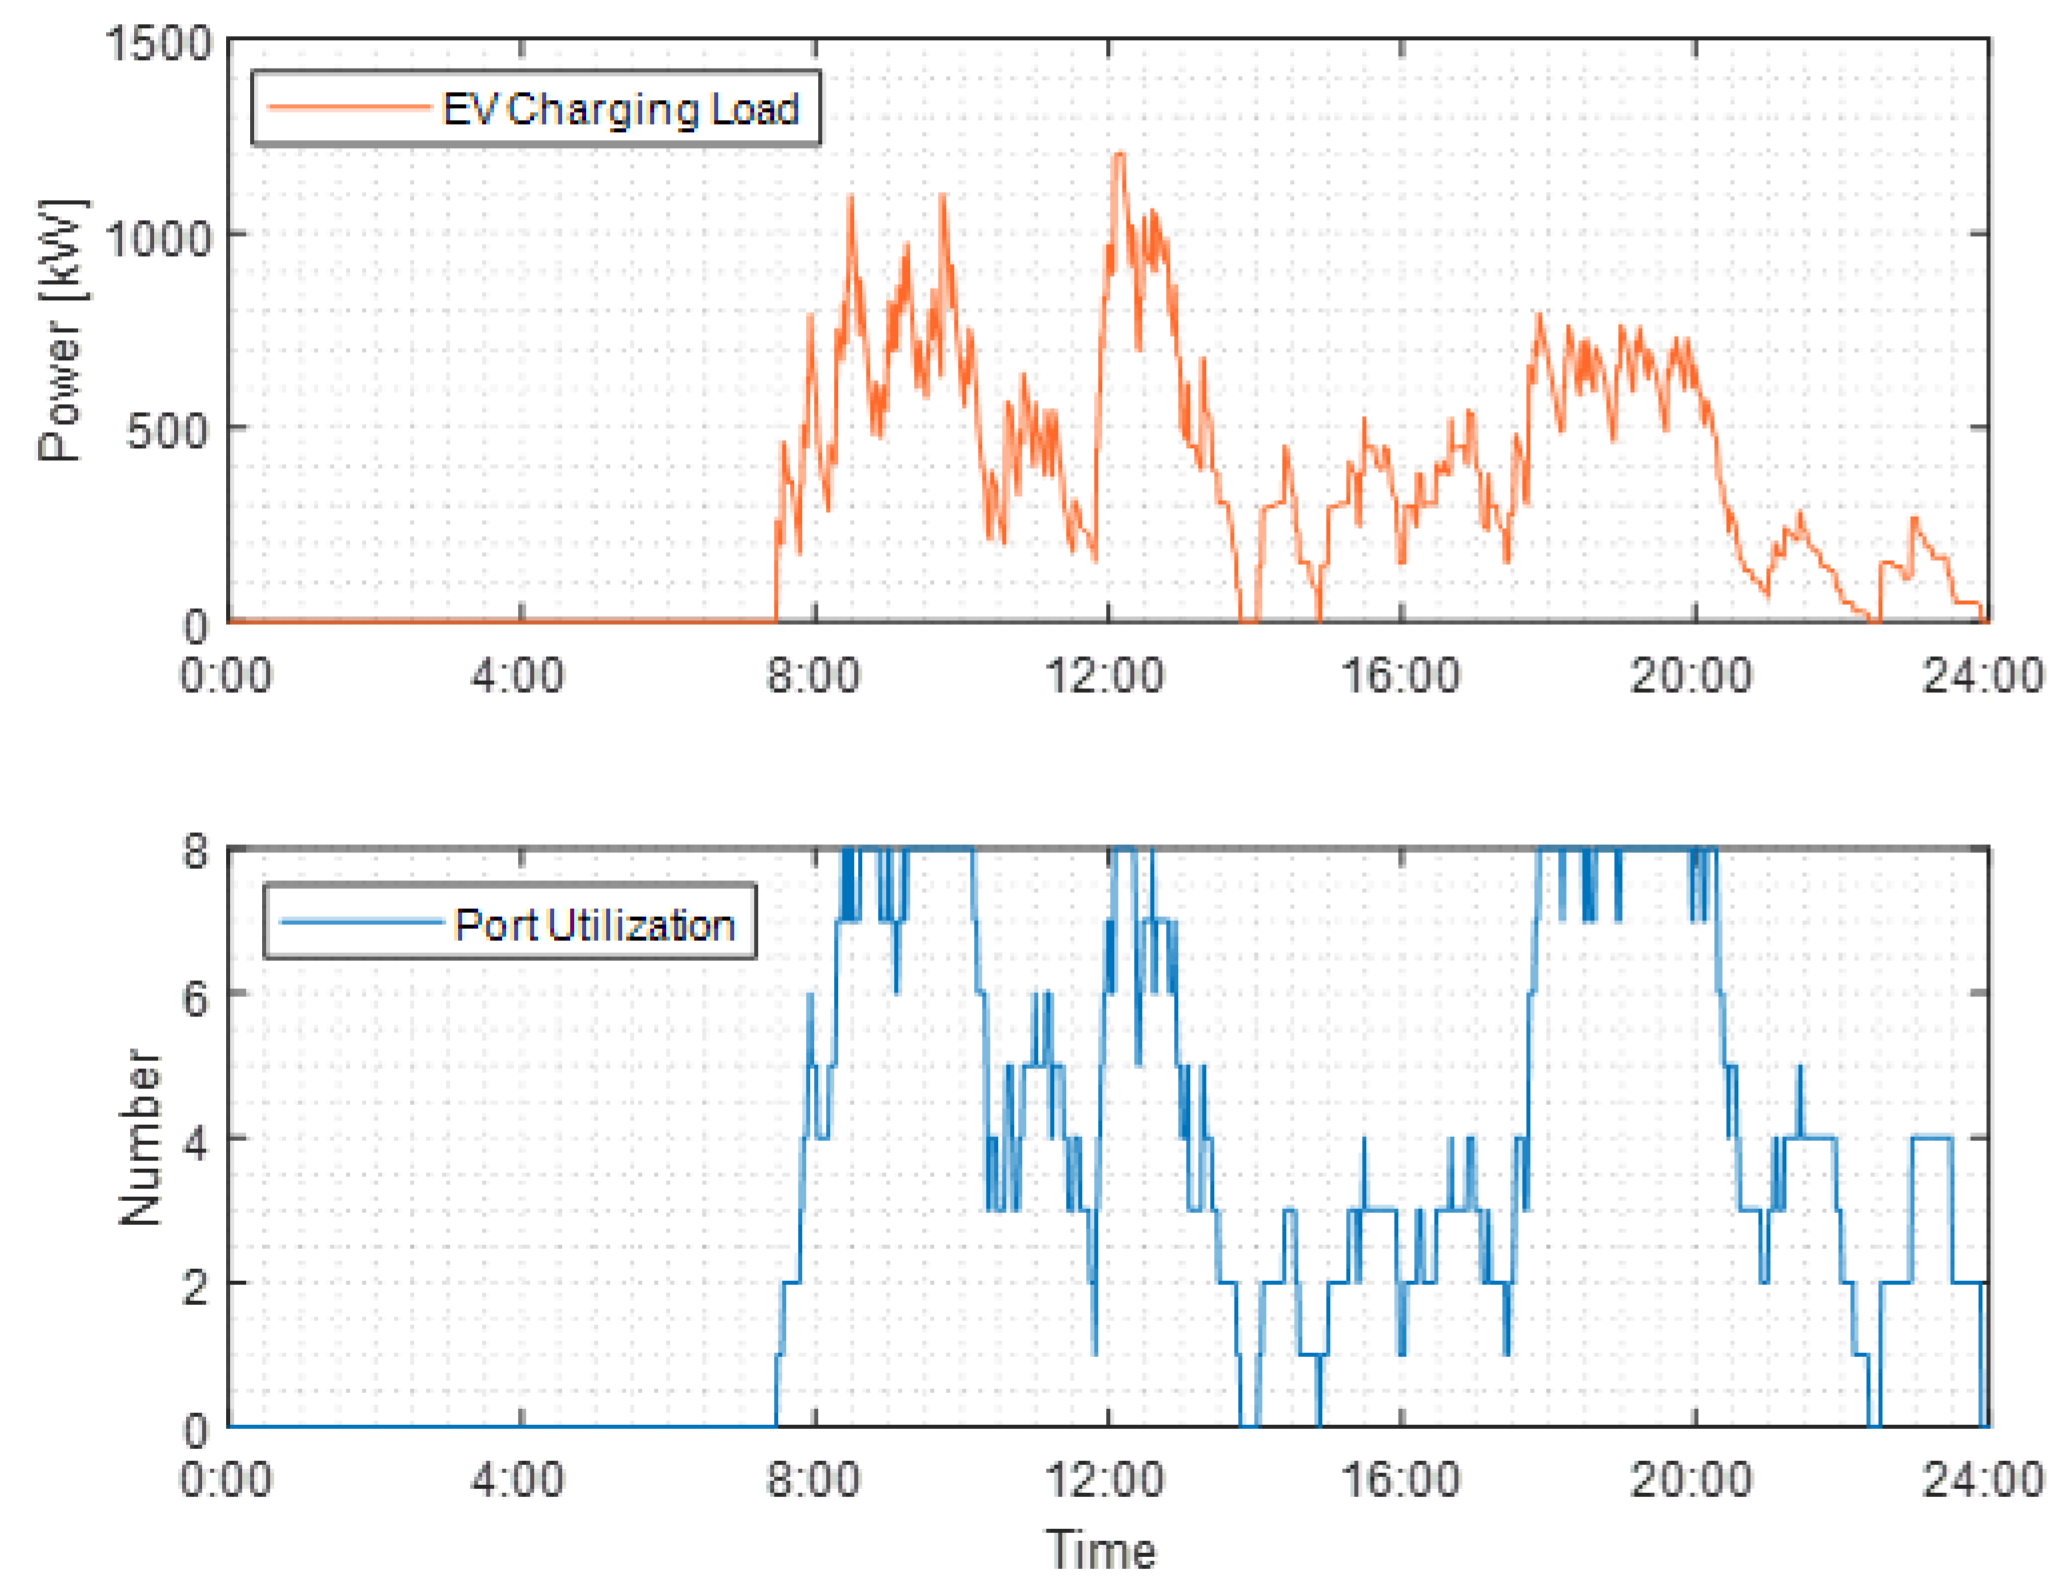
4.2. XFC EV Charging Load Estimation

Figure 8 shows a sample of the daylong time series of charging load for XFC4, which is representative of the growing demand for XFC stations. The plot clearly shows that XFC events can put a significant strain on the power grid, especially if the distribution network is not upgraded or equipped with renewable energy resources. As seen in the top plot, the daily peak load occurs during the morning and evening rush hours, which is not surprising given that many people commute during these times. The plot also indicates that the average charging event duration is around 15 min, which is consistent with the goal of fast charging. However, the power demand during these events is mostly above the feeder capacity of 300 kW, indicating that the feeder needs to be upgraded or combined with other solutions to avoid overloading. The bottom plot of Figure 8 illustrates the station port utilization of XFC4, with each charging port capable of providing 300 kW of power. The plot shows that the charging ports are in high utilization, which is a positive indication of the popularity and need for XFC stations. As the demand for XFC stations grows, it is imperative to consider the impact of these stations on the power grid.
Figure 9 shows a sample of the daylong time series of EV charging load for XFC8. As mentioned previously, XFC8 has eight charging ports, and each port is a 300 kW charger. The maximum waiting time is also 15 min. The average charging event duration is around 15 min, and the peak of daily power demand is about 1200 kW. This is dangerous if the feeder capacity is 600 kW. The bottom plot in Figure 9 shows the station port utilization of XFC8. Slightly different from XFC4, the eight ports are in medium utilization when 120 EVs are expected to be charged daily. Moreover, the results from Figure 8 and Figure 9 demonstrate that proper planning and design are essential to ensure that XFC stations can meet EV charging demand without overburdening the distribution network.
In summary, the presented MC simulation can generate approximate real-world XFC EV charging load profiles with proper assumptions. Changing input values, the corresponding charging loads and the station port utilization can be obtained. These simulation tools are valuable for understanding the possible effects of XFC on the power grid since little real-world XFC charging data is currently available.

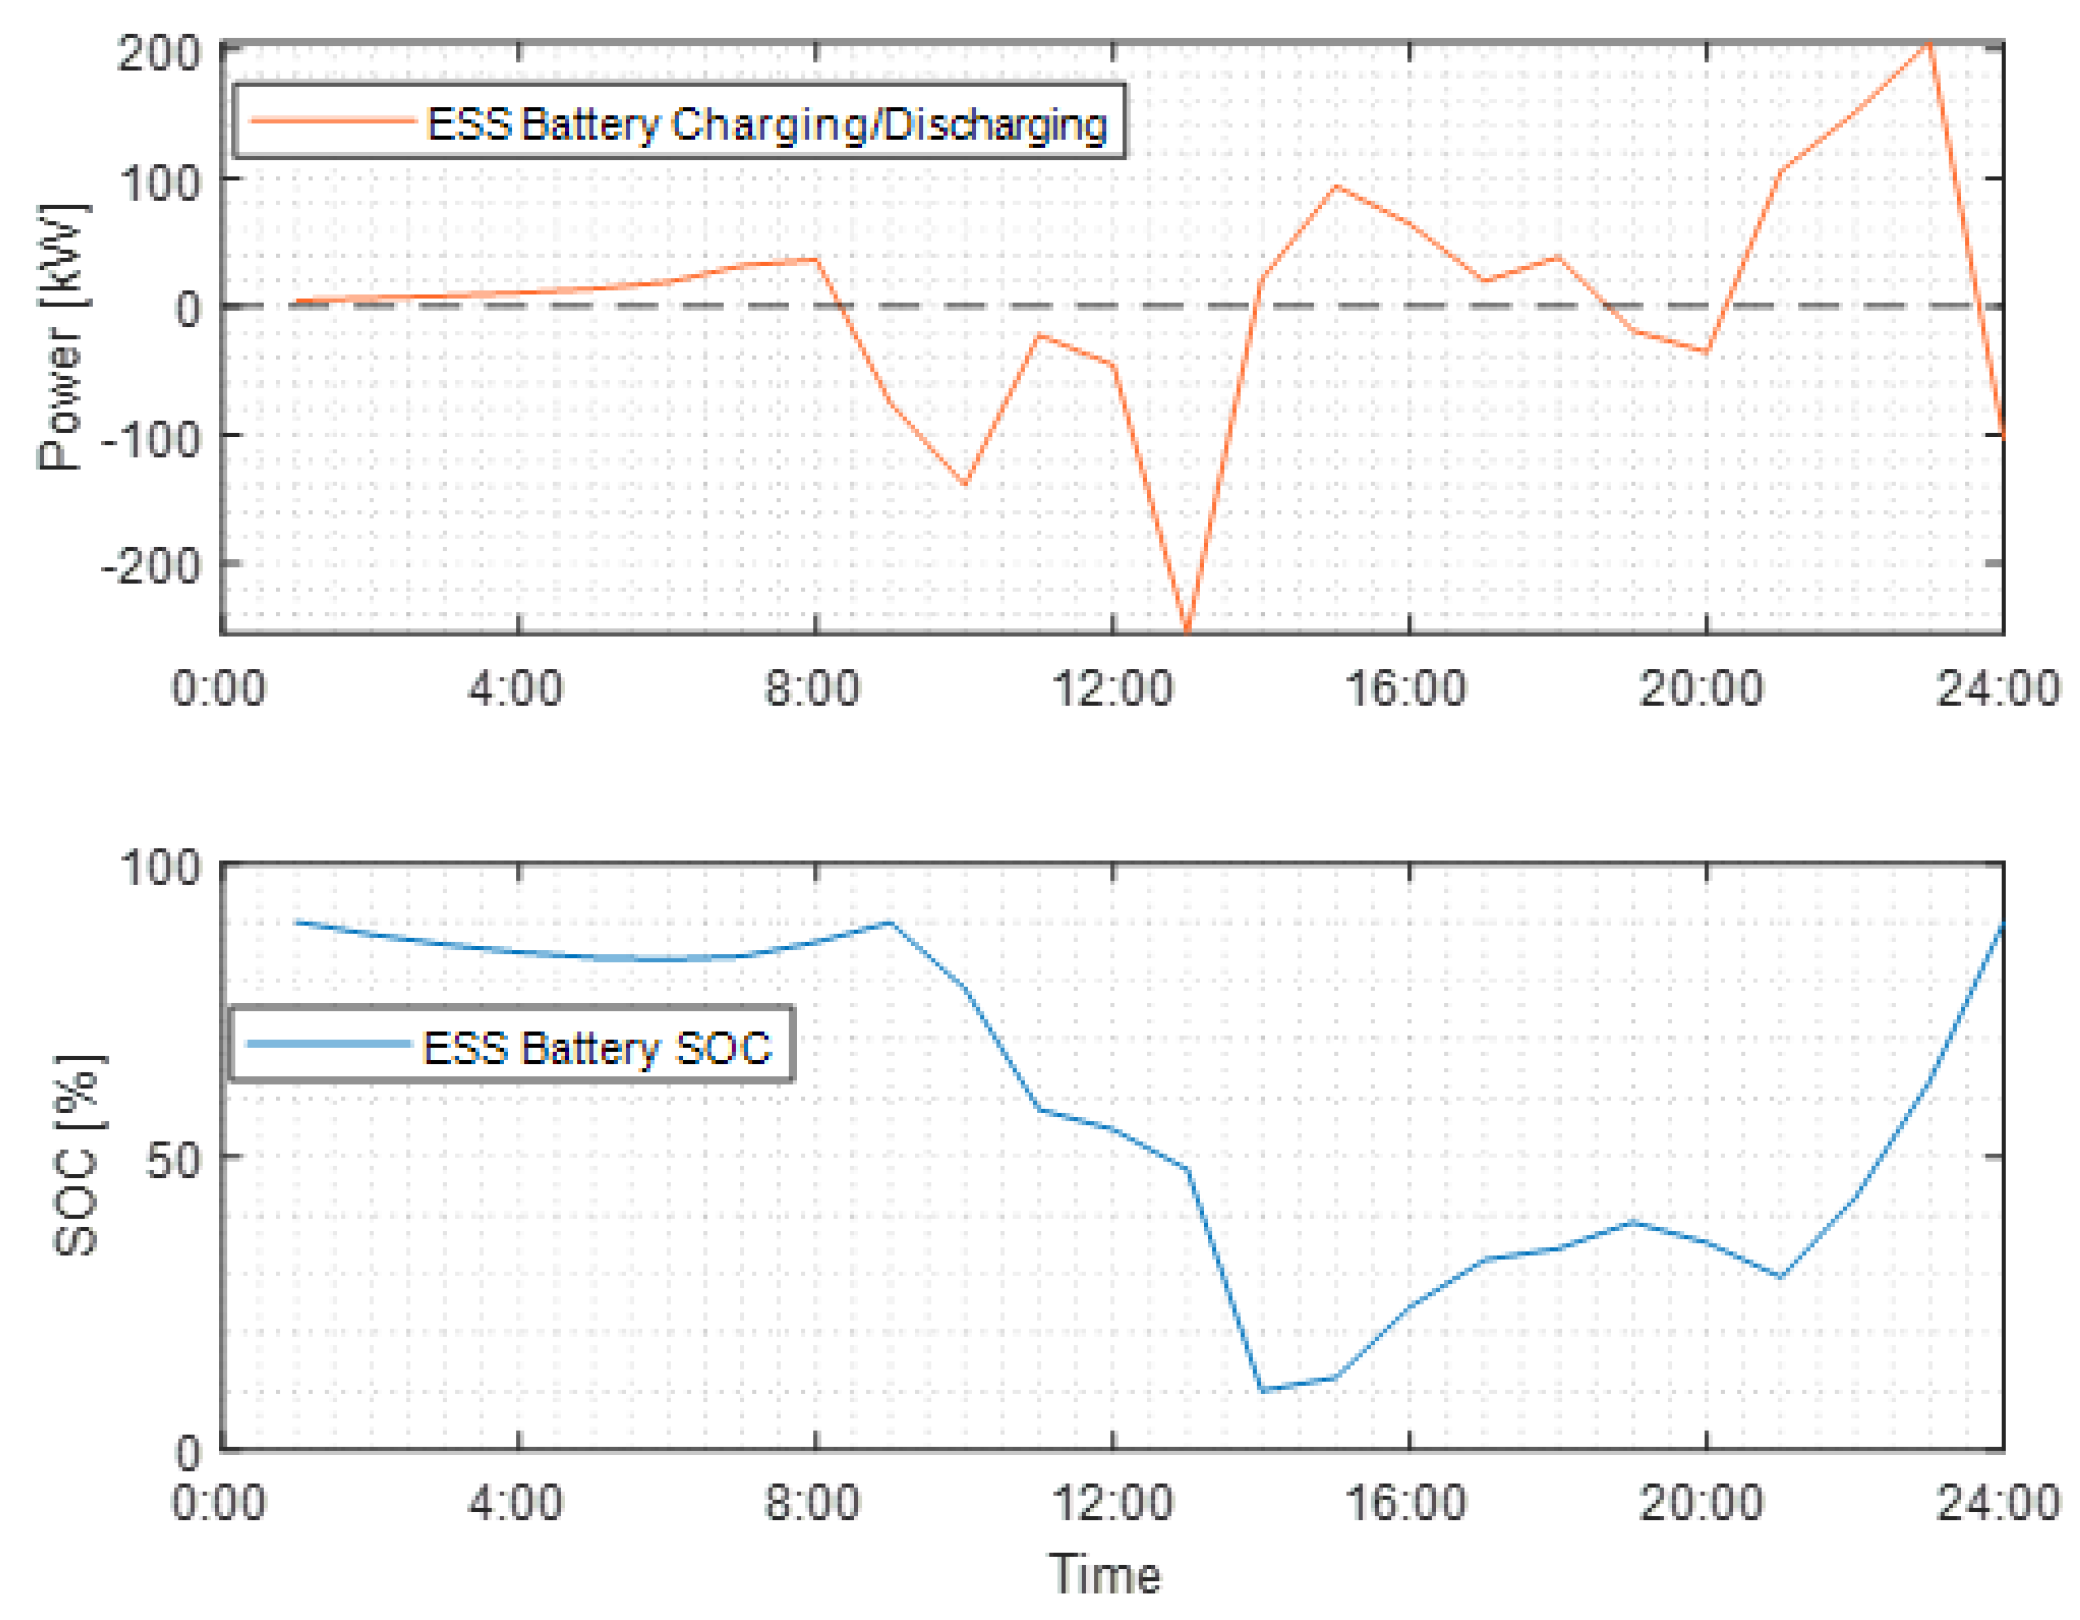
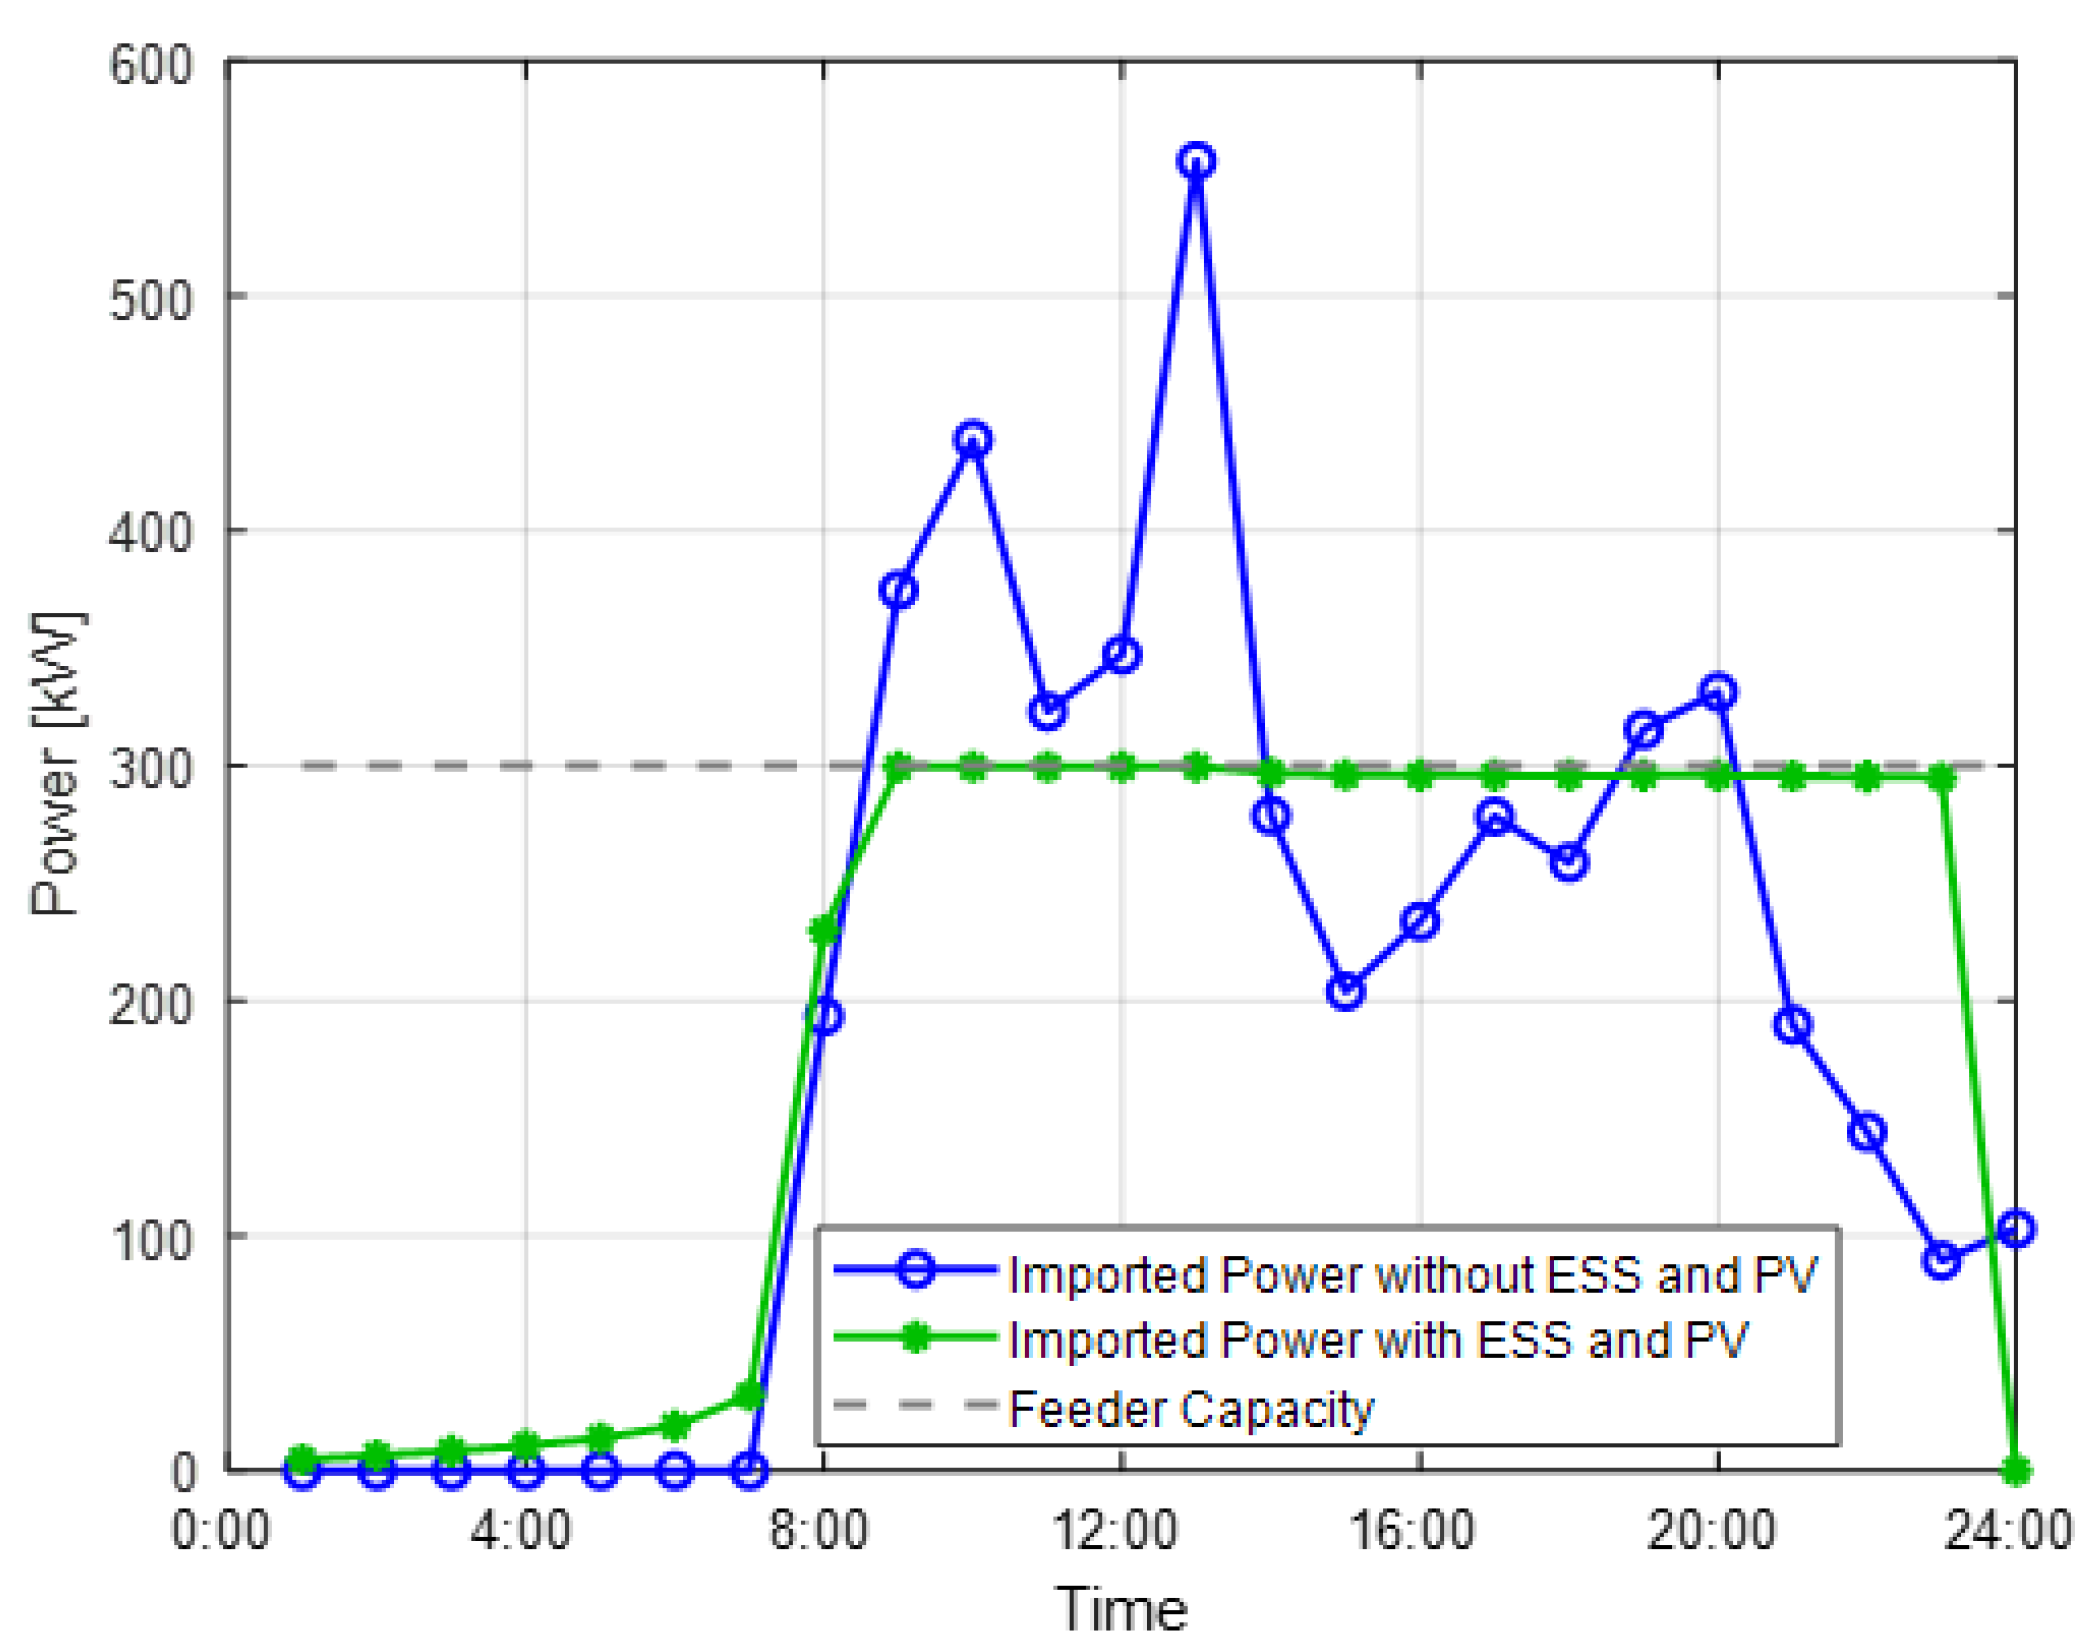
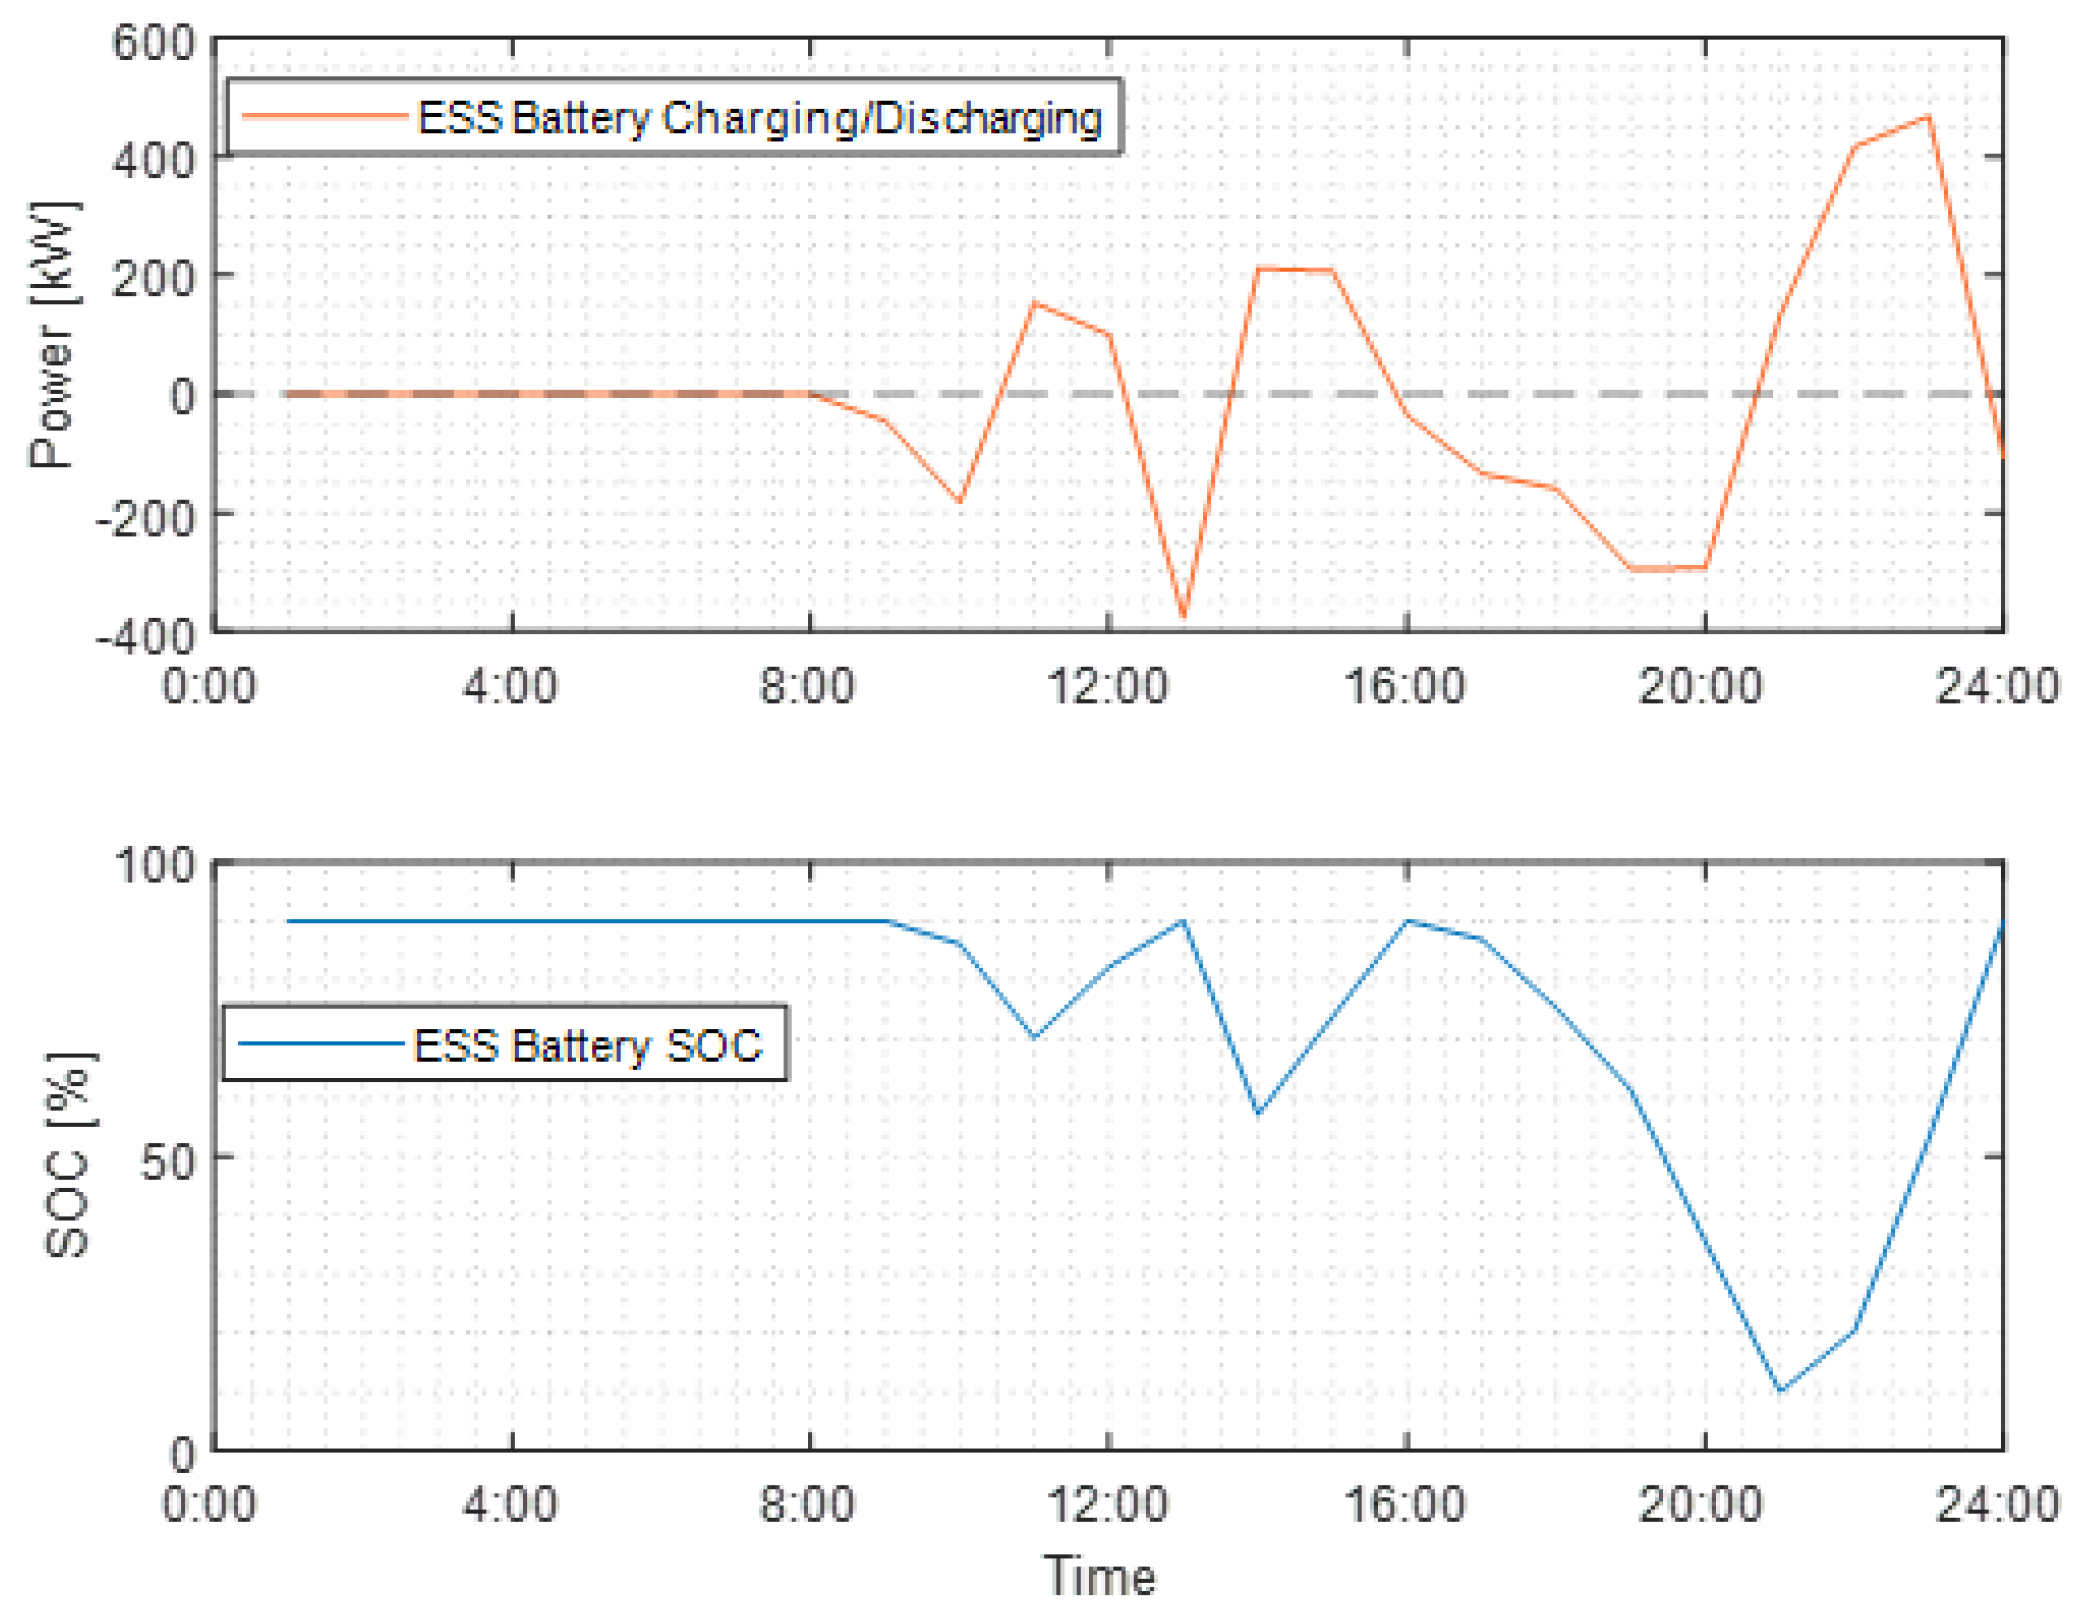
4.3. The Benefits of Optimal Configuration of XFC Stations Integrated with ESS and PV Panels

The benefits of an optimal configuration can be summarized in three aspects: the total annual cost of XFC stations, including the ESS and PV investment cost and the cost to purchase electricity from the utility, is significantly reduced; the power demand of XFC stations will not exceed the node feeder capacity; and undervoltage violation will be avoided, addressing the optimal power flow of the distribution network. Since the optimization is performed with a 1 h resolution for 365 days, the average charging power of each hour from the MC simulation is approximated.
The optimal configuration results of ESS energy capacity, ESS rated power, the number of PV cells, and the cost of two XFC stations are summarized in Table 5. If the XFC station is not fitted with an ESS and PV panels, the total annual cost is the electricity purchase cost from the utility. Otherwise, the total annual cost is the sum of the annual investment cost of ESS and PV panels and the expense of acquiring electricity from the utility. The results indicate that the integration of stational ESS and PV can significantly reduce the total annual cost for both XFC stations. Although the investment cost of ESSs and PV panels is expensive, the PV panels can generate clean energy and the ESS can work as an energy buffer to store electrical energy from the grid during low-price periods and output electrical energy to XFC stations during high-price periods. As shown in Figures 11 and 13, ESSs prefer to recharge themselves at midnight because of the lower electricity price, and then output the stored energy to support EV charging during the peak electricity price period during the daytime. Compared with XFC stations without ESSs and PVs, the electricity purchase cost is reduced significantly. Considering both the investment cost of ESSs and PV panels in addition to the electricity purchase cost, the overall annual cost for XFC4 is reduced by 26.55% and the total annual cost for XFC8 is decreased by 27.01%. The results demonstrate the potential of the proposed method to improve the economics and sustainability of XFC stations. Moreover, it is important to note that the optimal configuration of ESS energy capacity, ESS rated power, and the number of PV cells may vary depending on the specific characteristics of each XFC station and the local grid conditions.
Figure 10 shows the charging/discharging power and the battery-based ESS SOC at XFC4 on a winter’s day. Since XFC4 is in high usage, the ESS outputs power to support XFC events and reaches 10% SOC at 2:00 pm. Then, a short charging period of the ESS occurs in the afternoon to prepare for another peak XFC demand. Once the EV charging requirements are satisfied and the electricity price drops, the ESS recharges again. The SOC recovers to 90% by the end of the day. The ESS helps to regulate the power output and maintain the SOC within a safe range during high usage periods. This operation ensures that the ESS is ready to meet the next peak demand, providing smooth operation of the XFC station. The imported power of XFC4 with and without an ESS and PV panels on a winter’s day is shown in Figure 11. The EV charging demand at XFC4 will exceed the node feeder capacity during the peak period. By reducing the peak load, the optimal configuration reduces the stress on the local transformer and feeder. The maximum power demand of this XFC station is limited below the pre-defined feeder capacity. The optimal configuration can shave the peak load of EV charging. This will reduce the stress on the local transformer and feeder and enhance the reliability and sustainability of the XFC station.
Figure 12 shows the charging/discharging power and the battery-based ESS SOC at XFC8 on a summer’s day. As XFC8 is in medium utilization, a short charging period happens at around 11:00 a.m. when the electricity price and EV charging demand are relatively low. Although the EV charging demand at the evening peak is relatively lower than the peaks during the day, the ESS continuously outputs power to supply EV charging because of the higher electricity price. Figure 13 shows the imported power of this XFC station integrated with and without an ESS and PV panels on a summer’s day. The optimal configuration ensures that the total power demand remains below the pre-defined feeder capacity. Furthermore, with an optimal configuration, the ESS can import power from the grid during the low electricity price periods and output power to EV chargers during the high price periods. This can help shave the peak load of EV charging, reduce stress on the local transformer and feeder, and minimize the total annual cost.
The voltage profile is an important factor in the distribution network and maintaining it within acceptable limits is crucial. Figure 14 shows the voltage profiles on a typical winter’s day and a typical summer’s day, demonstrating that the voltage distortions are within 5%. No large voltage distortions are observed because of the coordination of the ESS and PV supply within the XFC stations. This suggests that the proposed optimal configuration can effectively manage the voltage profile, ensuring the stability of the distribution network. Figure 15 shows the voltage profile of node 18 with and without an ESS and PV panels on a summer’s day. Node 18 is the terminal node of the longest branch, so voltage violations are more likely to happen. Since the overall peak loads are much higher than those in winter, the undervoltage violations are observed at 1:00 p.m. and in the evening from 5:00 p.m. to 8:00 p.m. if the XFC stations are not fitted with ESSs and PV panels. Once the ESSs and PV panels are integrated with the XFC stations, the optimal configuration takes the constraints of the optimal power flow into account, ensuring that the overall voltage distortions remain within 5%. The optimal configuration guarantees the stability of the distribution network. These results demonstrate that the optimal configuration of XFC stations with ESSs and PV panels in the distribution network not only reduces the cost but also improves grid performance by managing the voltage profile within acceptable limits. The proposed method can ensure the stability and reliability of the distribution network.

5. Conclusions

This paper presents the development of a novel Monte Carlo simulation tool for estimating the EV charging demand at XFC stations based on distributions derived from a dataset of vehicle travel surveys. The estimation algorithm considers various factors, including EV scale, EV model, charging curves, XFC station port availability, and waiting time. The tool is valuable due to the current lack of an available XFC charging dataset. It can help to provide more accurate predictions of future charging demand and can be useful for planning and designing XFC stations and their associated infrastructure. Additionally, an optimal configuration method for multiple XFC stations at the distribution network level is presented to determine the optimal energy storage system (ESS) energy capacity, ESS rated power, and PV size integrated with XFC stations. By optimizing the size of these systems, it is possible to reduce investment and operation costs while still meeting the charging demand and operational constraints of the distribution network. This can help to reduce the amount of electricity that needs to be purchased from the grid, shave peak load, avoid voltage violations in the distribution network, and improve the overall efficiency and stability of both the XFC stations and the distribution network.
A case study is performed using public datasets, including the daily driving patterns of vehicles from the NHTS, the hourly load profiles of buildings from the U.S. Department of Energy’s Open Energy Data Initiative database, the hourly real-time electricity prices from PJM, and the hourly ambient temperature and solar irradiance from Solcast. The numerical results showed that the presented MC simulation tool can generate an approximate real-world XFC charging demand, and the optimal configuration method can determine the ESS energy capacity, ESS rated power, and PV size for multiple XFC stations in the distribution network. The simulation results also demonstrated the significant benefits of integrating ESSs and PV panels with XFC stations, including a total annual cost savings of 26.55% at XFC4 and 27.01% at XFC8 due to reduced electricity purchases from the grid. Additionally, the ESSs and PV systems helped to shave peak load below the capacity of the feeder for XFC stations and avoid voltage violations. These results illustrate the potential for ESS and PV integration to improve the efficiency, stability, and cost-effectiveness of both XFC charging infrastructure and the distribution network.
Assessing the robustness of the model is an important aspect to consider in future work. It is highly recommended to extend the proposed model with the consideration of transportation network dynamics since EV charging loads are dependent on the transportation network and driver’ behavior. Furthermore, the methodology can be extended to larger distribution networks. This can involve testing the approach on different sizes of networks with varying degrees of complexity.

Author Contributions

Conceptualization, Z.W.; methodology, Z.W. and B.C.; software, Z.W.; validation, Z.W. and P.K.B.; formal analysis, Z.W.; investigation, Z.W.; resources, B.C.; data curation, Z.W. and P.K.B.; writing—original draft preparation, Z.W.; writing—review and editing, Z.W., P.K.B. and B.C.; visualization, Z.W. and P.K.B.; supervision, B.C.; project administration, Z.W. All authors have read and agreed to the published version of the manuscript.

Funding

This research received no external funding.

Institutional Review Board Statement

Not applicable.

Informed Consent Statement

Not applicable.

Data Availability Statement

Not applicable.

Conflicts of Interest

The authors declare no conflict of interest.

References

  1. Bui, A.; Slowik, P.; Lutsey, N. Power Play: Evaluating the U.S. Position in the Global Electric Vehicle Transition. ICCT. 2021. Available online: https://theicct.org/publication/power-play-evaluating-the-u-s-position-in-the-global-electric-vehicle-transition/ (accessed on 5 June 2022).
  2. Meintz, A.; Zhang, J.; Vijayagopal, R.; Kreutzer, C.; Ahmed, S.; Bloom, I.; Burnham, A.; Carlson, R.B.; Dias, F.; Dufek, E.J.; et al. Enabling fast charging—Vehicle considerations. J. Power Source 2017, 367, 216–227. [Google Scholar] [CrossRef]
  3. Tu, H.; Feng, H.; Srdic, S.; Lukic, S. Extreme Fast Charging of Electric Vehicles: A Technology Overview. IEEE Trans. Transp. Electrif. 2019, 5, 861–878. [Google Scholar] [CrossRef]
  4. Wang, L.; Chen, B. Dual-level consensus-based frequency regulation using vehicle-to-grid service. Electr. Power Syst. Res. 2019, 167, 261–276. [Google Scholar] [CrossRef]
  5. Cao, C.; Wu, Z.; Chen, B. Electric Vehicle–Grid Integration with Voltage Regulation in Radial Distribution Networks. Energies 2020, 13, 1802. [Google Scholar] [CrossRef] [Green Version]
  6. Wu, Z.; Manne, N.N.; Harper, J.; Chen, B.; Dobrzynski, D. A Cloud-Based Simulation and Testing Framework for Large-Scale EV Charging Energy Management and Charging Control. SAE Int. J. Adv. Curr. Pr. Mobil. 2022, 4, 1492–1500. [Google Scholar] [CrossRef]
  7. Wu, Z.; Chen, B. Distributed Electric Vehicle Charging Scheduling with Transactive Energy Management. Energies 2022, 15, 163. [Google Scholar] [CrossRef]
  8. Wu, Z.; Cao, C.; Chen, B. Transactive Energy Based Approach for Large-Scale Plug-in Electric Vehicle Charging Control. In Proceedings of the 2019 IEEE PES Asia-Pacific Power and Energy Engineering Conference (APPEEC), Macao, China, 1–4 December 2019; pp. 1–5. [Google Scholar] [CrossRef]
  9. Cao, C.; Chen, B. Generalized Nash equilibrium problem based electric vehicle charging management in distribution networks. Int. J. Energy Res. 2018, 42, 4584–4596. [Google Scholar] [CrossRef]
  10. Wang, L.; Chen, B. Distributed control for large-scale plug-in electric vehicle charging with a consensus algorithm. Int. J. Electr. Power Energy Syst. 2019, 109, 369–383. [Google Scholar] [CrossRef]
  11. Chen, L.; Chen, B. Fuzzy Logic-Based Electric Vehicle Charging Management Considering Charging Urgency. In Proceedings of the 2019 IEEE Innovative Smart Grid Technologies—Asia (ISGT Asia), Chengdu, China, 21–24 May 2019; pp. 3441–3446. [Google Scholar] [CrossRef]
  12. Wang, L.; Cao, C.; Chen, B. Model-based micro-grid modeling and optimal PEV charging control. In Proceedings of the 2016 12th IEEE/ASME International Conference on Mechatronic and Embedded Systems and Applications (MESA), Auckland, New Zealand, 29–31 August 2016; pp. 1–6. [Google Scholar] [CrossRef]
  13. Chung, Y.-W.; Khaki, B.; Li, T.; Chu, C.; Gadh, R. Ensemble machine learning-based algorithm for electric vehicle user behavior prediction. Appl. Energy 2019, 254, 113732. [Google Scholar] [CrossRef]
  14. Dabbaghjamanesh, M.; Moeini, A.; Kavousi-Fard, A. Reinforcement Learning-Based Load Forecasting of Electric Vehicle Charging Station Using Q-Learning Technique. IEEE Trans. Ind. Inform. 2021, 17, 4229–4237. [Google Scholar] [CrossRef]
  15. Yi, Z.; Scoffield, D. A Data-Driven Framework for Residential Electric Vehicle Charging Load Profile Generation. In Proceedings of the 2018 IEEE Transportation Electrification Conference and Expo (ITEC), Long Beach, CA, USA, 13–15 June 2018; pp. 519–524. [Google Scholar] [CrossRef]
  16. Xydas, E.; Marmaras, C.; Cipcigan, L.M.; Jenkins, N.; Carroll, S.; Barker, M. A data-driven approach for characterising the charging demand of electric vehicles: A UK case study. Appl. Energy 2016, 162, 763–771. [Google Scholar] [CrossRef] [Green Version]
  17. Wang, S.; Du, L.; Ye, J.; Zhao, D. A Deep Generative Model for Non-Intrusive Identification of EV Charging Profiles. IEEE Trans. Smart Grid 2020, 11, 4916–4927. [Google Scholar] [CrossRef]
  18. Chang, M.; Bae, S.; Cha, G.; Yoo, J. Aggregated Electric Vehicle Fast-Charging Power Demand Analysis and Forecast Based on LSTM Neural Network. Sustainability 2021, 13, 13783. [Google Scholar] [CrossRef]
  19. Moradzadeh, M.; Abdelaziz, M.M.A. A New MILP Formulation for Renewables and Energy Storage Integration in Fast Charging Stations. IEEE Trans. Transp. Electrif. 2020, 6, 181–198. [Google Scholar] [CrossRef]
  20. Cao, C.; Wang, L.; Chen, B. Mitigation of the Impact of High Plug-in Electric Vehicle Penetration on Residential Distribution Grid Using Smart Charging Strategies. Energies 2016, 9, 1024. [Google Scholar] [CrossRef] [Green Version]
  21. Hussain, A.; Bui, V.; Kim, H. Optimal Sizing of Battery Energy Storage System in a Fast EV Charging Station Considering Power Outages. IEEE Trans. Transp. Electrif. 2020, 6, 453–463. [Google Scholar] [CrossRef]
  22. Bryden, T.S.; Hilton, G.; Dimitrov, B.; de León, C.P.; Cruden, A. Rating a Stationary Energy Storage System Within a Fast Electric Vehicle Charging Station Considering User Waiting Times. IEEE Trans. Transp. Electrif. 2019, 5, 879–889. [Google Scholar] [CrossRef] [Green Version]
  23. Fan, P.; Sainbayar, B.; Ren, S. Operation Analysis of Fast Charging Stations With Energy Demand Control of Electric Vehicles. IEEE Trans. Smart Grid 2015, 6, 1819–1826. [Google Scholar] [CrossRef]
  24. Ahmed, S.; Bloom, I.; Jansen, A.N.; Tanim, T.; Dufek, E.J.; Pesaran, A.; Burnham, A.; Carlson, R.B.; Dias, F.; Hardy, K.; et al. Enabling fast charging—A battery technology gap assessment. J. Power Sources 2017, 367, 250–262. [Google Scholar] [CrossRef]
  25. Hussain, A.; Bui, V.-H.; Baek, J.-W.; Kim, H.-M. Stationary Energy Storage System for Fast EV Charging Stations: Optimality Analysis and Results Validation. Energies 2020, 13, 230. [Google Scholar] [CrossRef] [Green Version]
  26. Ding, H.; Hu, Z.; Song, Y. Value of the energy storage system in an electric bus fast charging station. Appl. Energy 2015, 157, 630–639. [Google Scholar] [CrossRef]
  27. Alsaidan, I.; Khodaei, A.; Gao, W. A Comprehensive Battery Energy Storage Optimal Sizing Model for Microgrid Applications. IEEE Trans. Power Syst. 2018, 33, 3968–3980. [Google Scholar] [CrossRef]
  28. Schröder, M.; Abdin, Z.; Mérida, W. Optimization of distributed energy resources for electric vehicle charging and fuel cell vehicle refueling. Appl. Energy 2020, 277, 115562. [Google Scholar] [CrossRef]
  29. Aghamohammadi, M.R.; Abdolahinia, H. A new approach for optimal sizing of battery energy storage system for primary frequency control of islanded Microgrid. Int. J. Electr. Power Energy Syst. 2014, 54, 325–333. [Google Scholar] [CrossRef]
  30. Mouli, G.R.C.; Bauer, P.; Zeman, M. System design for a solar powered electric vehicle charging station for workplaces. Appl. Energy 2016, 168, 434–443. [Google Scholar] [CrossRef] [Green Version]
  31. Xie, R.; Wei, W.; Khodayar, M.E.; Wang, J.; Mei, S. Planning Fully Renewable Powered Charging Stations on Highways: A Data-Driven Robust Optimization Approach. IEEE Trans. Transp. Electrif. 2018, 4, 817–830. [Google Scholar] [CrossRef]
  32. Rehman, W.U.; Bo, R.; Mehdipourpicha, H.; Kimball, J.W. Sizing battery energy storage and PV system in an extreme fast charging station considering uncertainties and battery degradation. Appl. Energy 2022, 313, 118745. [Google Scholar] [CrossRef]
  33. NHTS Administration. National Household Travel Survey. Available online: https://nhts.ornl.gov/ (accessed on 6 June 2022).
  34. EV Consumer Behavior. Available online: https://www.fuelsinstitute.org/Research/Reports/EV-Consumer-Behavior/ (accessed on 15 June 2022).
  35. Fastned. Which Charger Should I Use? Available online: https://support.fastned.nl/ (accessed on 5 January 2022).
  36. Alternative Fuels Data Center: Alternative Fueling Station Locator. Available online: https://afdc.energy.gov/stations (accessed on 5 June 2022).
  37. Farivar, M.; Low, S.H. Branch Flow Model: Relaxations and Convexification—Part I. IEEE Trans. Power Syst. 2013, 28, 2554–2564. [Google Scholar] [CrossRef]
  38. Habib, M.A.; Said, S.A.M.; El-Hadidy, M.A.; Al-Zaharna, I. Optimization procedure of a hybrid photovoltaic wind energy system. Energy 1999, 24, 919–929. [Google Scholar] [CrossRef]
  39. IEC 61853-2:2016; Photovoltaic (PV) Module Performance Testing and Energy Rating—Part 2: Spectral Responsivity, Incidence Angle and Module Operating Temperature Measurements. IEC: Geneva, Switzerland, 2016.
  40. Junior, P.R.; Rocha, L.; Morioka, S.; Bolis, I.; Chicco, G.; Mazza, A.; Janda, K. Economic Analysis of the Investments in Battery Energy Storage Systems: Review and Current Perspectives. Energies 2021, 14, 2503. [Google Scholar] [CrossRef]
  41. Amrollahi, M.H.; Bathaee, S.M.T. Techno-economic optimization of hybrid photovoltaic/wind generation together with energy storage system in a stand-alone micro-grid subjected to demand response. Appl. Energy 2017, 202, 66–77. [Google Scholar] [CrossRef]
  42. Baran, M.E.; Wu, F.F. Network reconfiguration in distribution systems for loss reduction and load balancing. IEEE Trans. Power Deliv. 1989, 4, 1401–1407. [Google Scholar] [CrossRef]
  43. SunPower. SunPower E-Series Residential Solar Panels|E20-327. 2016. Available online: https://us.sunpower.com/sites/default/files/media-library/data-sheets/ds-e20-series-327-residential-solar-panels.pdf (accessed on 2 April 2022).
  44. Solcast. Solar Resource and Weather Data in Time Series, Typical Meteorological Year (TMY) and Monthly Averages. Available online: https://solcast.com/ (accessed on 5 April 2022).
  45. Cole, W.; Frazier, A.W.; Augustine, C. Cost Projections for Utility-Scale Battery Storage: 2021 Update. United States. 2021. Available online: https://www.osti.gov/biblio/1786976 (accessed on 5 June 2022).
  46. Ong, S.; Clark, N. Commercial and Residential Hourly Load Profiles for all TMY3 Locations in the United States; National Renewable Energy Laboratory: Golden, CO, USA, 2022. [Google Scholar] [CrossRef]
  47. ENGIE. Historical Electricity Pricing Information. Available online: https://www.engieresources.com/historical-pricing-data (accessed on 5 June 2022).
Figure 1. EV Charging demand estimation using Monte Carlo simulation.
Energies 16 02385 g001
Figure 2. The probability distribution of arrival SOC at XFC stations.
Energies 16 02385 g002
Figure 3. The probability distribution of arrival time at XFC stations.
Energies 16 02385 g003
Figure 4. EV charging curves at 300 kW chargers [35].
Energies 16 02385 g004
Figure 5. Schematic illustration of an XFC station with an ESS and PV panels connected to a distribution network.
Energies 16 02385 g005
Figure 6. 33-bus distribution system with XFC stations.
Energies 16 02385 g006
Figure 7. Electricity price curve on (a) a winter’s day and (b) a summer’s day.
Energies 16 02385 g007
Figure 8. EV charging load and port utilization of XFC4.
Energies 16 02385 g008
Figure 9. EV charging load and port utilization of XFC8.
Energies 16 02385 g009
Figure 10. ESS operation at XFC4 on a winter’s day.
Energies 16 02385 g010
Figure 11. Imported power of XFC4 on a winter’s day.
Energies 16 02385 g011
Figure 12. ESS operation at XFC8 on a summer’s day.
Energies 16 02385 g012
Figure 13. Imported power of XFC8 on a summer’s day.
Energies 16 02385 g013
Figure 14. Voltage profiles of the distribution network on (a) a winter’s day and (b) a summer’s day.
Energies 16 02385 g014
Figure 15. Voltage profiles of node 18 on a summer’s day.
Energies 16 02385 g015
Table 1. Parameters of EV Charging Demand Estimation.
Input Parameters
EV scaleDefine the number of EVs visiting the XFC station daily.
Number of station portsDefine the number of charging ports of the XFC station.
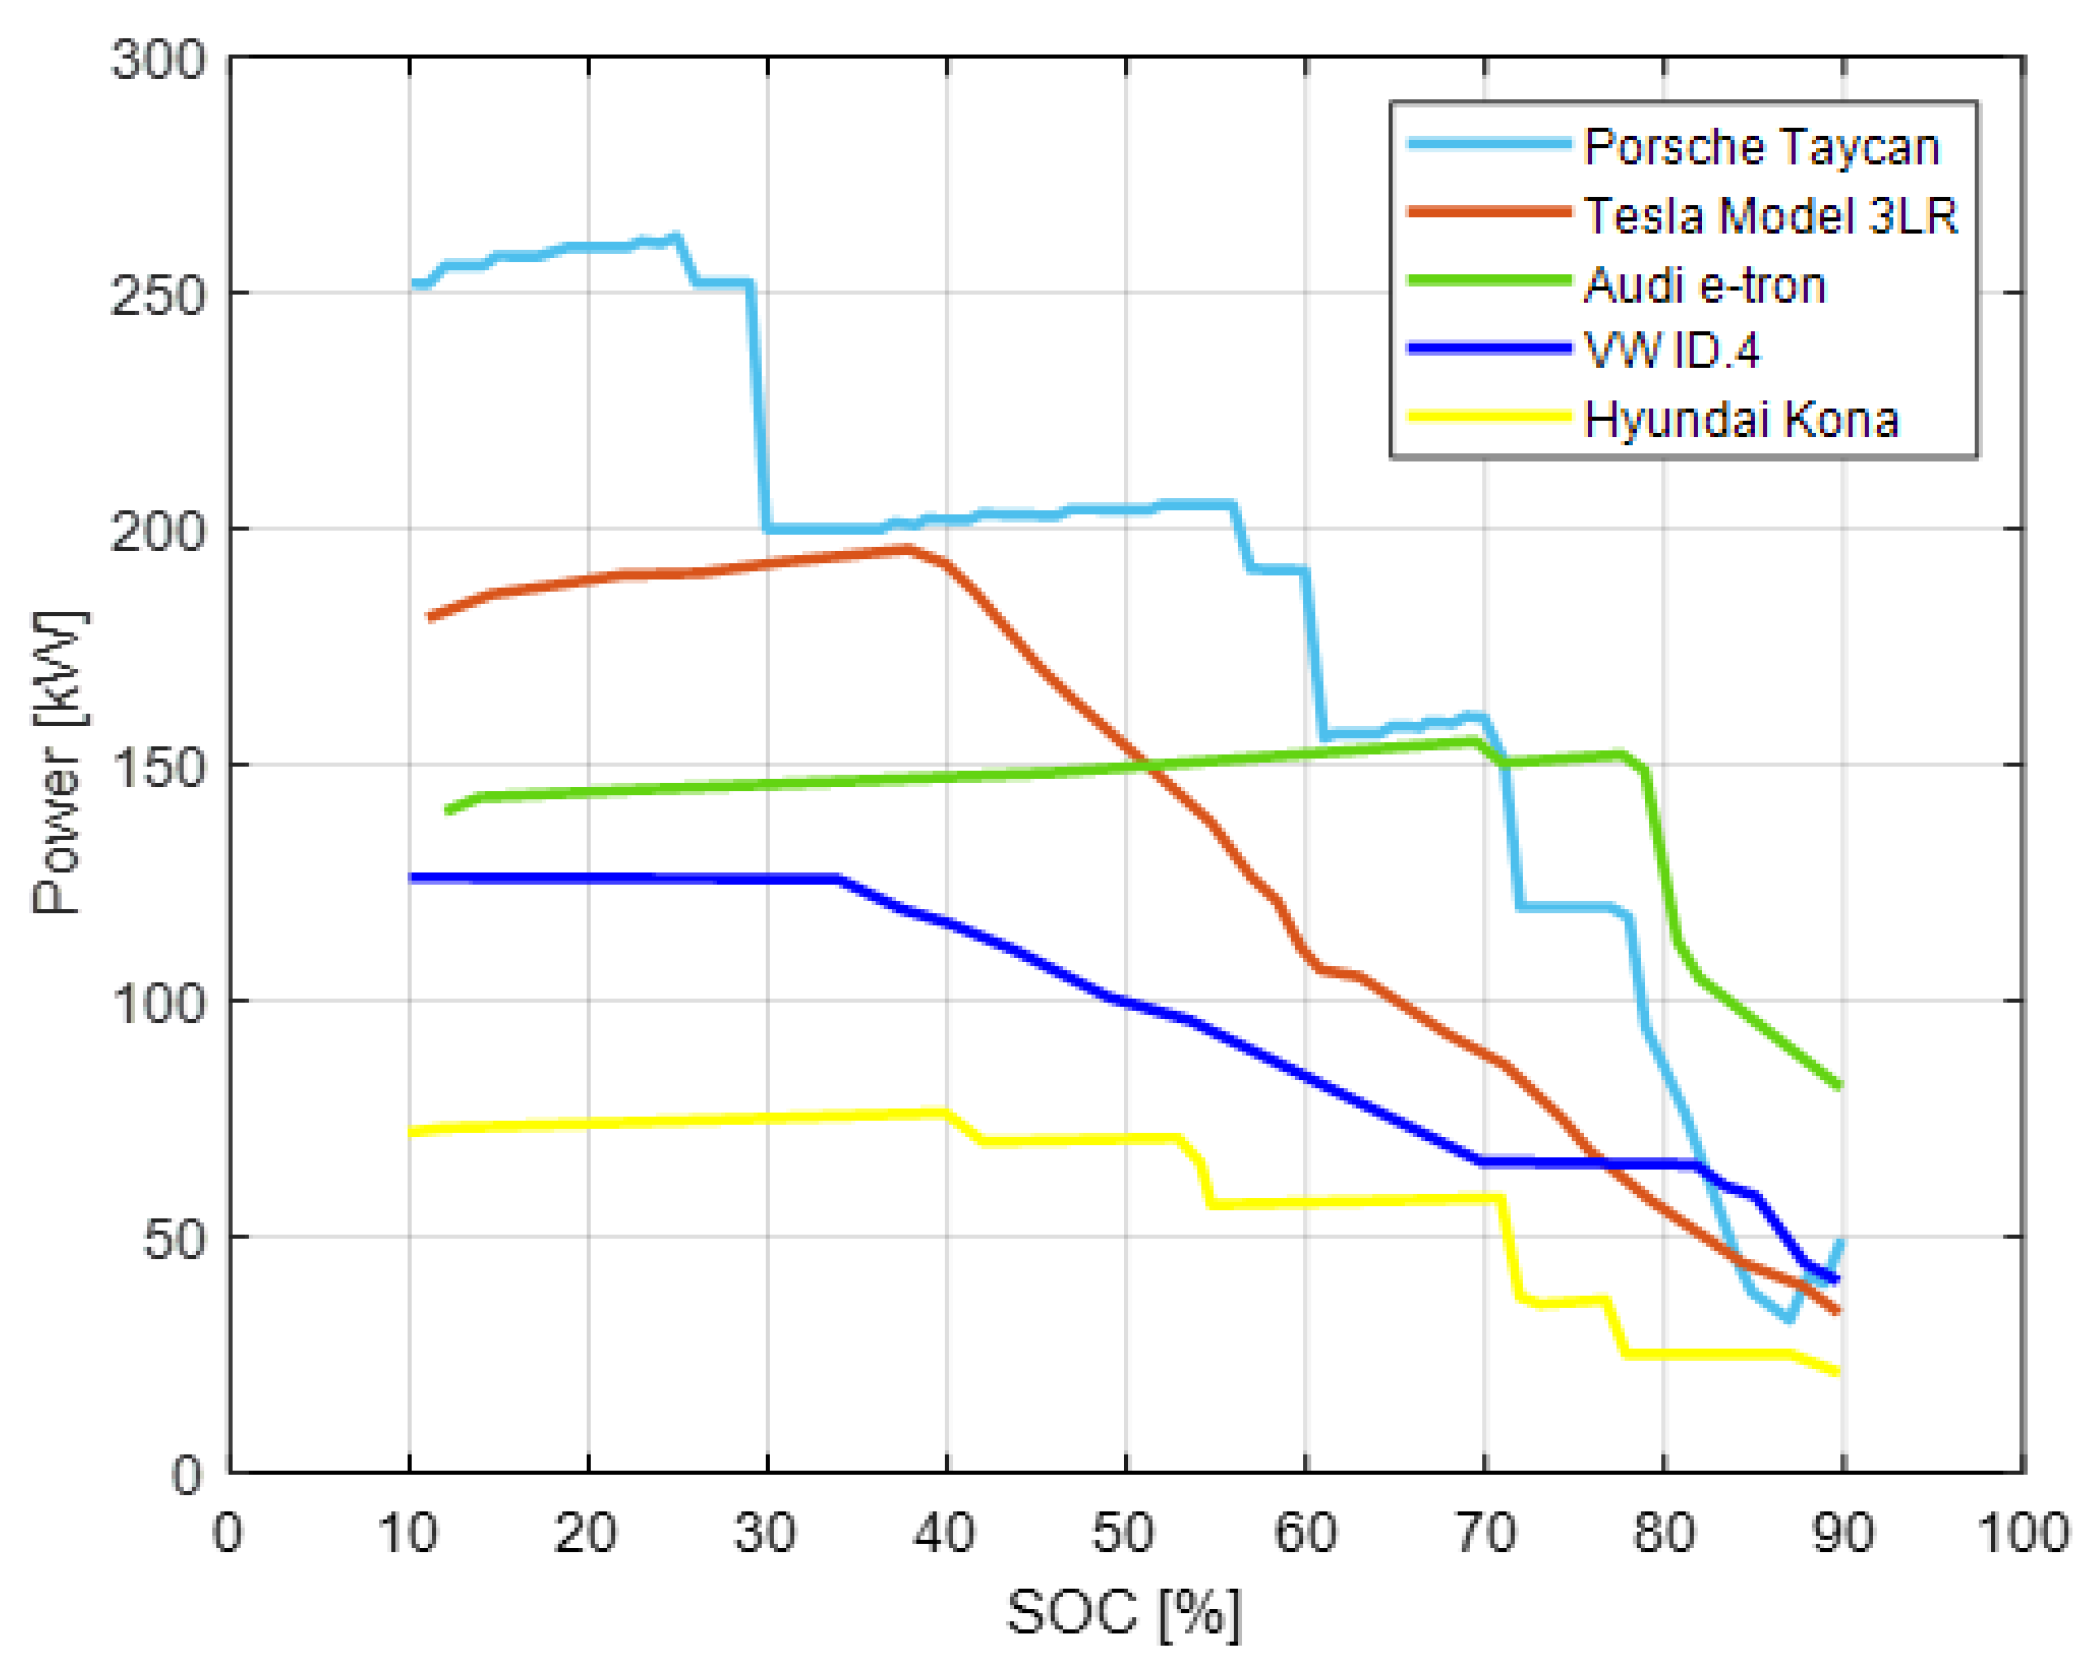
EV battery characteristicsDefine the battery size, percentage in the total simulated EVs (Table 2) and charging curves (Figure 4) of different EV models.
Maximum waiting timeDefine the maximum allowable waiting time of each EV at the XFC station. EVs will leave if the waiting time reaches the maximum waiting time.
Probability Distributions
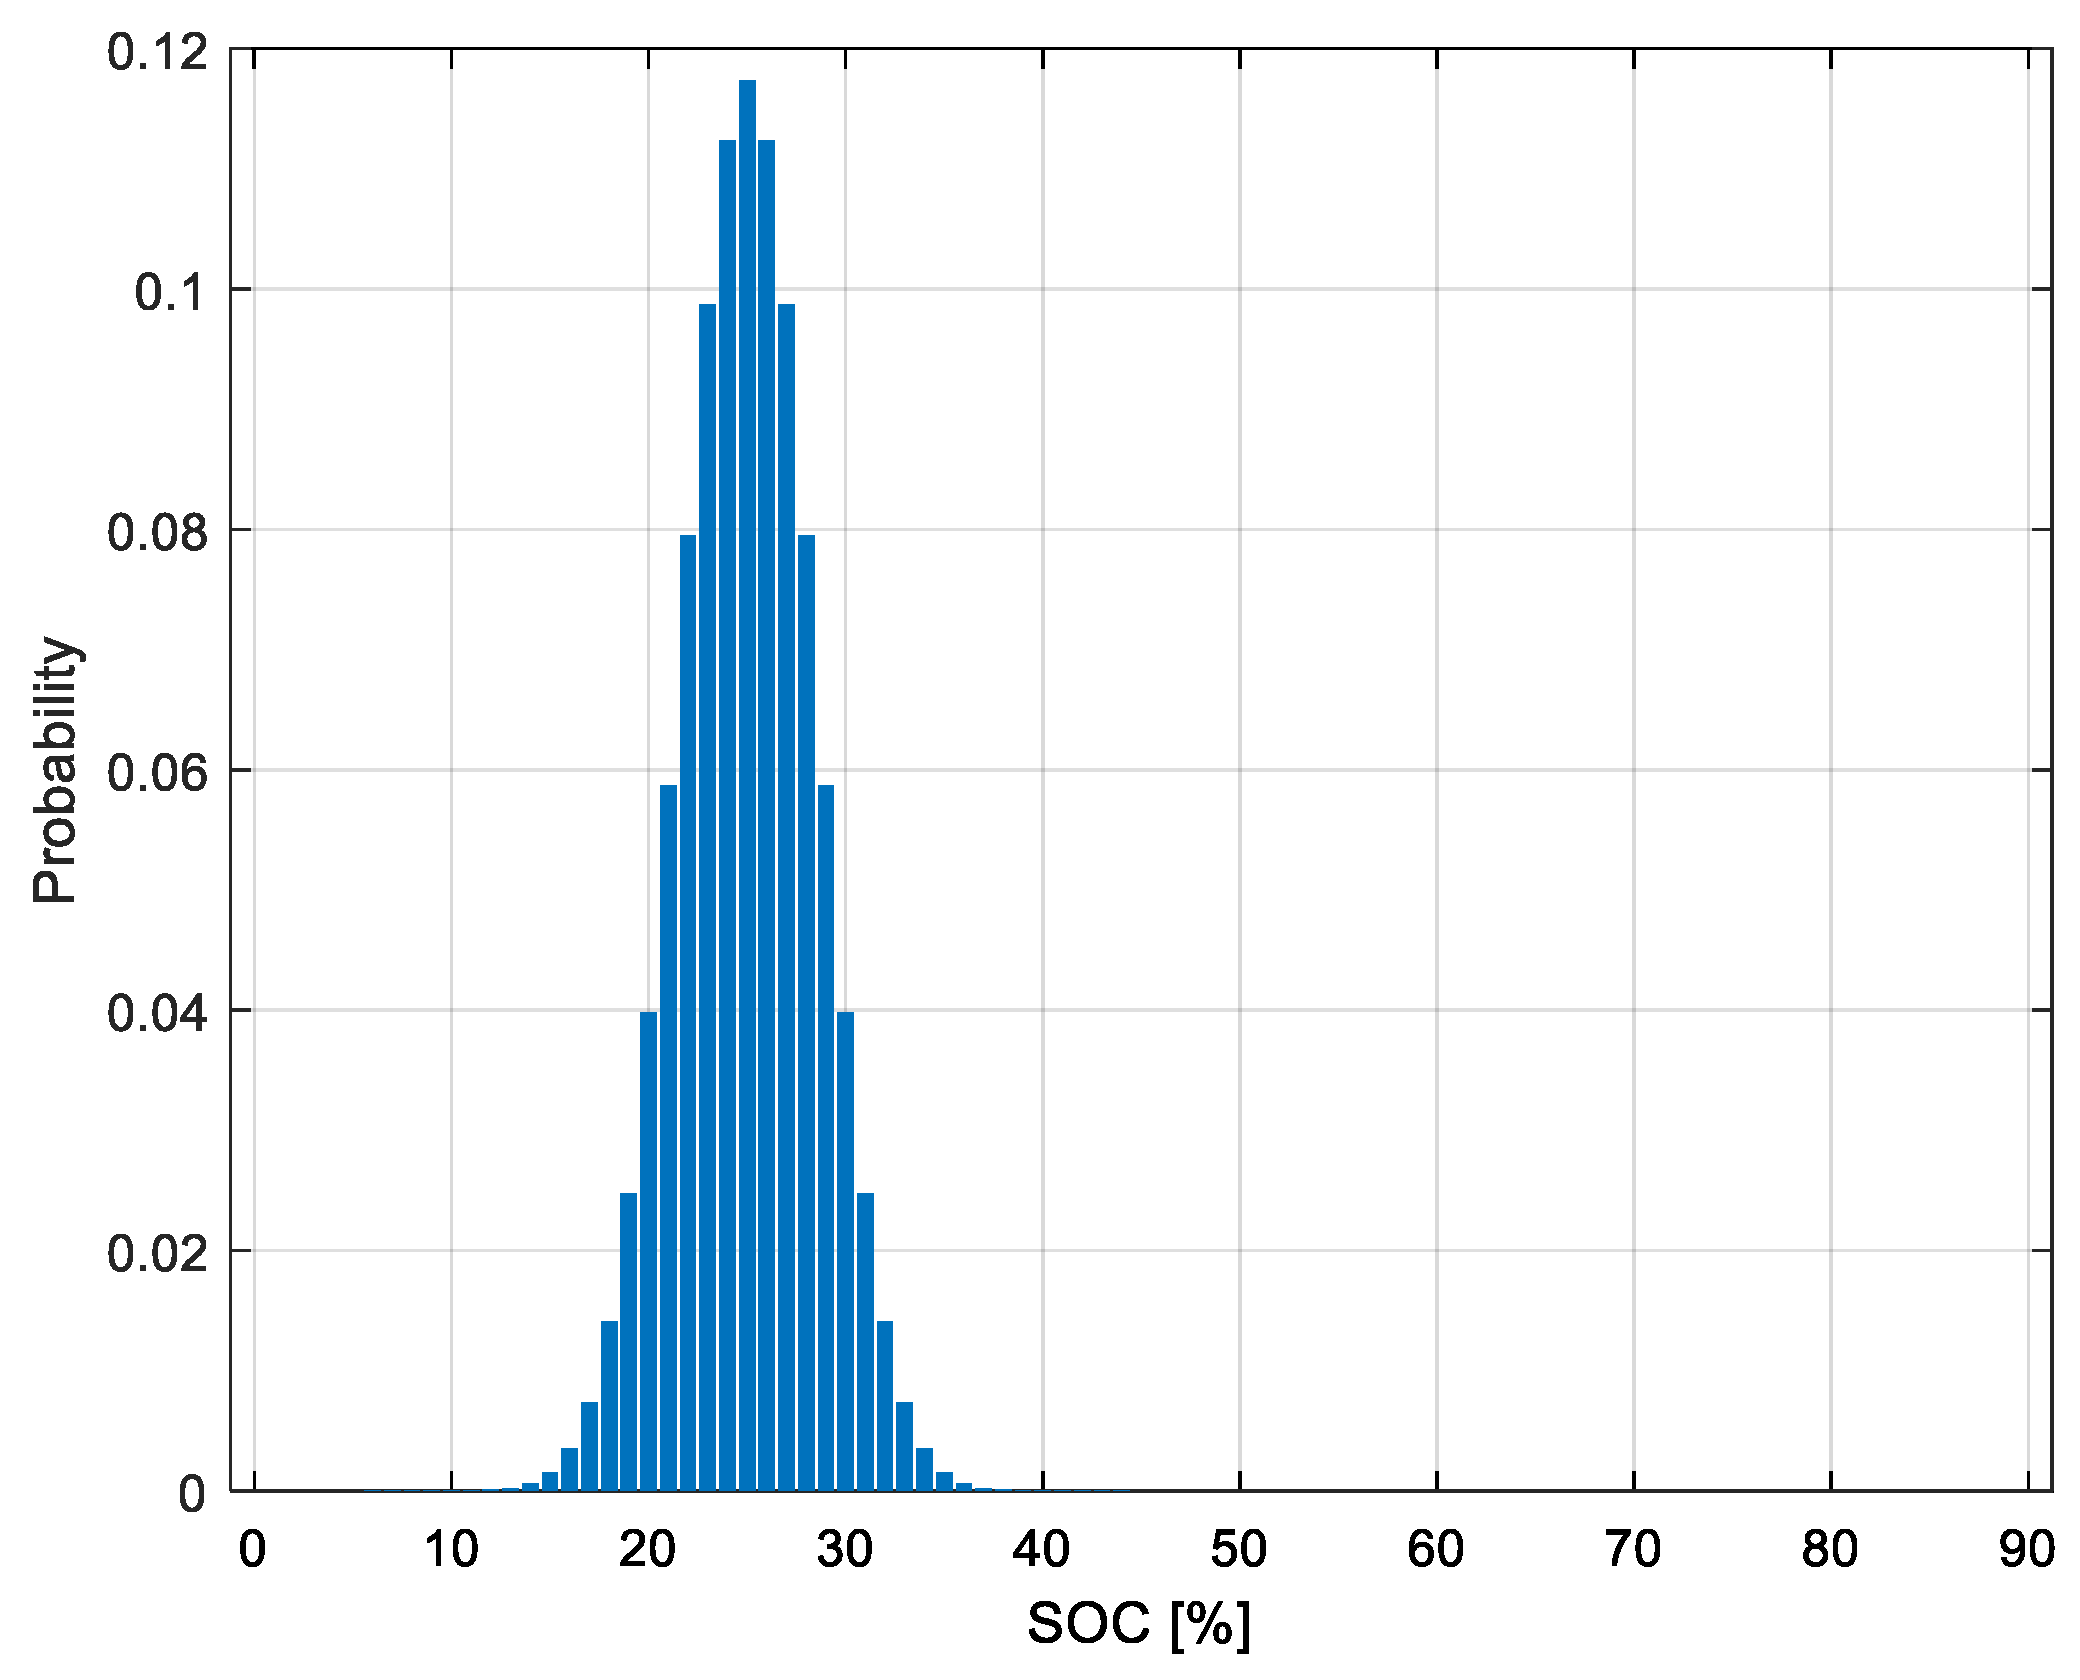
Arrival SOC at XFC stationThe probability distribution of SOC when EVs need to be charged.
Arrival time at XFC stationThe probability distribution of time when EVs visit the XFC station.
Table 2. Battery Size and Percentage of EV Models.
EV ModelBattery SizePercentage
Porsche Taycan79.3 kWh5%
Tesla Model 3LR82 kWh30%
Audi e-tron95 kWh25%
VW ID.482 kWh20%
Hyundai Kona64 kWh20%
Table 3. Parameters of PV Panels.
ParameterSymbolValue
Area A p v 1.559 × 1.064   m 2
Nominal power P p v , r a t e d 327 W
Power efficiency η p v 20.7%
Temperature coefficient β T –0.35%/°C
Cell temperature under standard operation condition T c , S T C 25 °C
Initial cost c p v $600
Table 4. Parameters of the ESS.
ParameterSymbolValue
Cost of energy capacity c e s s , E 589   $ / kWh
Cost of power capacity c e s s , P 589 × hour $/kW
Maximum energy capacity E e s s max 2 MWh
Minimum energy capacity E e s s min 0
Maximum charging/discharging rate P e s s max 1 MW
Minimum charging/discharging rate P e s s min 0
Table 5. Benefit to Two XFC Stations.
ParameterXFC4XFC8
ESS
Energy Capacity711.6 kWh1209.3 kWh
Power Capacity257.3 kW469.5 kW
Annual Investment Cost$108,562$184,487
PV
Number of PV Cells70110
Nominal Power22.89 kW35.97 kW
Annual Investment Cost$2732$4293
Electricity Purchase Cost
without ESS and PV$454,810$701,227
with ESS and PV$225,476$327,317
Cost Saving50.4%53.3%
Total Annual Cost
without ESS and PV$454,810$701,227
with ESS and PV$334,037$375,553
Cost saving26.55%27.01%
Disclaimer/Publisher’s Note: The statements, opinions and data contained in all publications are solely those of the individual author(s) and contributor(s) and not of MDPI and/or the editor(s). MDPI and/or the editor(s) disclaim responsibility for any injury to people or property resulting from any ideas, methods, instructions or products referred to in the content.

