Article

Thermohydraulic and Economic Evaluation of a New Design for Printed Circuit Heat Exchangers in Supercritical CO2 Brayton Cycle

by
Dora Villada-Castillo
1,
Guillermo Valencia-Ochoa
2 and
Jorge Duarte-Forero
2,*
1
Facultad de Ciencias Agrarias y del Ambiente, Universidad Francisco de Paula Santander, Avenida Gran Colombia No. 12E-96 Barrio Colsag, Cúcuta 540001, Colombia
2
Departamento de Ingeniería Mecánica, Facultad de Ingeniería, Universidad del Atlántico, Carrera 30 Número 8–49, Puerto Colombia, Barranquilla 080001, Colombia
*
Author to whom correspondence should be addressed.
Energies 2023, 16(5), 2326; https://doi.org/10.3390/en16052326
Submission received: 26 December 2022 / Revised: 16 February 2023 / Accepted: 23 February 2023 / Published: 28 February 2023
(This article belongs to the Section B: Energy and Environment)

Abstract

:
The present study focused on the analysis of a new geometrical modification of the conventional zig-zag channel for Printed Circuit Heat Exchangers. The research was carried out using OpenFOAM and Salome software, which were used for the CFD analysis and the construction of the computational domain. For the development of the study, three types of channel geometries were defined: a modified zig-zag channel, a conventional zig-zag channel, and a straight channel. The results show that the modified zig-zag channel achieves better thermal hydraulic performance compared to that of the conventional zig-zag channel, evidenced by a 7.6% increase in the thermal performance factor. The modified zig-zag channel proposed in the research caused a 1.5% reduction of the power consumption of supercritical Brayton cycle compressors. Additionally, the modified zig-zag channel achieves a maximum efficiency of 49.1%, which is 1.5% higher compared to that of the conventional zig-zag channel. The above results caused a 20.9% reduction of the operating costs of the supercritical Brayton cycle. This leads to a 5.9% decrease in the cost associated with using the PCHE compared to that of the conventional zig-zag channel. In general, the new geometric characteristics proposed for the conventional zig-zag channel minimize the high loss of the hydraulic performance without significantly compromising its heat transfer capacity. The geometric analysis of the proposed new zig-zag channel geometry was limited to evaluating the influence of the bend angle of 20–30°. Therefore, a more detailed geometric optimization process involving other geometric parameters of the channel is still needed. Future research will be focused on addressing this approach.

1. Introduction

The mitigation of the adverse effects of greenhouse emissions has become the central concern for governments and researchers in the last decade [1]. The new generation of power plants and sustainable energy systems promotes a clever perspective on reliable and eco-friendly energy transition [2]. Cogeneration [3], Concentrated Solar Power (CSP) [4], Thermoelectric Generators (TEG) [5], fuel cells [6], and Waste Heat Recovery (WHR) [7], among other technologies, stand as the mechanisms used to offset conventional energy sources. Indeed, these energy systems require advanced and complex equipment to foster high efficiency and minimize the carbon footprint [8]; heat exchangers represent a vital component since they stimulate energy conversion while operating as heaters, coolers, and regenerators [9,10]. Their continuous operation under high temperature/pressure conditions, while maintaining high efficiencies and reliability throughout the lifetime of the exchangers, overcomes different challenges for design conceptualization [11]. Printed Circuit Heat Exchangers (PCHE) have emerged as a promising technology that fulfills the mechanical and thermal hydraulic requirements of the most demanding power cycles [12]. These heat exchangers incorporate advanced manufacturing processes as the channels are chemically printed [13]. Technological advantages such as a high compactness, heat transfer efficiency, and temperature and pressure resistance make the PCHE a well-suited component to be integrated into power plants [14].
Power generation with supercritical carbon dioxide (sCO2) as a working fluid exhibits tremendous potential for PCHE applications since it can improve the performance of the energy conversion process [15,16,17,18,19,20]. Using heat exchangers for reheating stages in power cycles has proven to boost thermal efficiency by around 5–10%, reinforcing the necessity to investigate PCHE systematically [21]. High- and low-temperature regeneration has been studied in sCO2 power systems via computational methods to unravel the influence of the working conditions on the thermal hydraulic performance of PCHEs [22]. The selection of a specific numerical method depends on the application, model limitations, computational demands, reliability, and predictability, among other factors. Jiang et al. [23] implemented numerical methods to determine the optimal design of microtube recuperators employed for sCO2 transportation, while determining the optimal heat exchanger performance. Yang et al. [24] performed a CFD analysis to evaluate the thermal hydraulic performance of PCHEs with wavy channels in sCO2 power cycles. The cross-section area is significantly influenced by the heat transfer characteristics. Marchionni et al. [12] modeled the heat transfer process within PCHE channels with 1D and 3D models, considering a 630 kW recuperator. Dynamic simulations with transient flow conditions demonstrated that increasing the system pressure produces fluctuations between the sCO2 thermal expansion and the fast reduction of the flow density. De la Torre et al. [25] evaluated the influence of adverse temperature conditions and geometric patterns on the thermal stress of PCHEs. The bending radius was identified as the main objective design parameter to minimize thermal stress. Overall, CFD analysis assessments center on the exploration of design parameters to optimize the thermal hydraulic performance, structural design, and heat transfer phenomena of PCHEs. However, the economic features and cost assessments of prospective design proposals are not commonly explored, despite being a convenient tool to foster the integration of PCHEs in supercritical power cycles.
Normally, the PCHE is formed by a series of stacked plates with small hydraulic diameter flow channels [26]. Depending on the geometric shape of the flow channel, PCHEs can be classified as discontinuous flow channels or continuous flow channels. Many of the studies in the literature are focused on continuous channel configurations, such as the straight channel and the zig-zag channel. The latter one stands out due to its high heat transfer capabilities and compactness [27]. Despite the above, the zig-zag channel causes a deterioration in the hydraulic performance as a consequence of the consecutive alteration and deviation of the flow direction due to the geometrical shape of the channel. This results in a considerable increase in the formation of turbulence eddies in the flow.
Due to the above, changes in the channel design have been proposed to improve the hydraulic performance of PCHEs. Pressure drop losses due to the low hydraulic performance of the zig-zag channel lead to an increase in the work demand of the compression equipment, which ends up negatively affecting the efficiency of the supercritical Brayton cycle [23]. Ishizuka et al. [28] evaluated the ability of S-shaped channels to minimize the recirculation zones by inducing smooth directional flow changes and compared them to the conventional zig-zag channel. The results indicated that the S-shaped channel causes a significant increase in hydraulic performance of up to four times compared to that of the zig-zag channel. However, the thermal performance of the PCHE was reduced by 46% with the S-shaped channel. Similarly, Yoon et al. [29] investigated the use of aerodynamic fins to improve the hydraulic performance of PCHEs. The results indicated an up to a 10-fold larger improvement compared to the performance of the zig-zag channel. Despite this improvement, the heat transfer capacity was reduced by 40%. In general, the geometric alternatives for the channels in the PCHE described in the literature present an improvement in the hydraulic performance, however, this is achieved with a considerable deterioration in the thermal performance.
The geometric design of channels in Printed Circuit Heat Exchangers can result in a better balance between the heat transfer capacity and the hydraulic performance and increase the overall cycle performance. Due to the importance of the channel design in the PCHE, the present research aims to propose a new modification for conventional zig-zag channels in order to improve the thermo-hydraulic performance of the PCHE, as well as to achieve higher efficiency and lower operational costs in the supercritical CO2 Brayton cycle. The CFD simulation software OpenFOAM was used for the development of the research, in which the behavior of the modified zig-zag channel is analyzed. Additionally, the conventional zig-zag channel and straight channel geometries are studied and used as a line of comparison. The research involves the analysis of variables such as thermal performance, hydraulic performance, bending angle effect, heat transfer characteristics, and economic analysis. Additionally, the influence of different channels in the PCHE on the overall performance of the supercritical Brayton cycle is evaluated.

2. Computational Model

2.1. Geometric Characteristics

Three configurations were proposed to analyze the flow channel’s geometry effect on the printed circuit heat exchanger (PCHE) performance: the conventional zig-zag channel, the straight channel, and the modified zig-zag channel. Figure 1 shows the geometries of the proposed configurations.
Conventional zig-zag channel flow paths are generally employed because they encourage turbulent mass flow, which influences the heat transfer performance and minimizes the boundary layer growth, which affects the flow velocity close to the curved points of the channel [30]. This PCHE configuration allows the integration of multiple streams and increases the heat transfer between hot and cold flows with improved safety features, since welding processes are not necessary. As a result, the risks of leakage or incompatibility are significantly reduced [31]. The second PCHE configuration proposed a continuous straight flow channel as a promising array to improve the flow regime and the heat transfer coefficient that could benefit the overall performance [32]. Semicircular straight channels are generally applied to optimize the convection and heat transfer outputs of PCHEs [33]. This PCHE block configuration is composed of a funnel shape, a large diameter that decreases along with the distance, as shown in Figure 1b. The last PCHE configuration is presented in Figure 1c and combines the previously described channel features. In this arrangement, the working fluid is transported through an inclined channel, which enables a lower pressure drop due to minor geometry restrictions in comparison to that of the conventional zig-zag channel configuration [34].
For the development of the simulations, a series of considerations for the behavior of the PCHE were defined: (a) the heat transfer due to radiation from the environment is considered to be negligible, (b) there are no heat losses through the walls external to the PCHE, (c) the PCHE operates under steady-state conditions, and (d) the flow distribution is uniform in all channels. The mass, momentum, and energy transport equations used in the CFD simulations are shown below [35,36].
ρ ¯ u ˜ j x j = 0
ρ ¯ u ˜ j u ˜ i x j + P x i = τ i j ρ u i u j ¯ x j + ρ g i
ρ ¯ u ˜ j h ˜ x j = λ c p h ˜ x j x j
where ρ is the density, u is velocity, P is the pressure, τ i j is the viscous stress tensor, h is the enthalpy, λ is the thermal conductivity, and c p is the specific heat, respectively. The viscous stress tensor τ i j was calculated using Equation (4).
τ i j = μ u i x j + u j x i 2 δ i j 3 u k x k
To solve the previous equation system, the Shear Stress Transport k ω turbulence model was used, which uses two additional transport equations and involves the Boussinesq hypothesis. The equations of the turbulence model used are shown below.
ρ u i u j ¯ = μ t u ˜ i x j + u ˜ j x i 2 k δ i j 3
ρ u ˜ i k x i = x j μ + μ t σ k × k x j + G k Y k
ρ u ˜ i ω x i = x j μ + μ t σ ω × ω x j + G k Y ω + D ω

2.2. Boundary Conditions

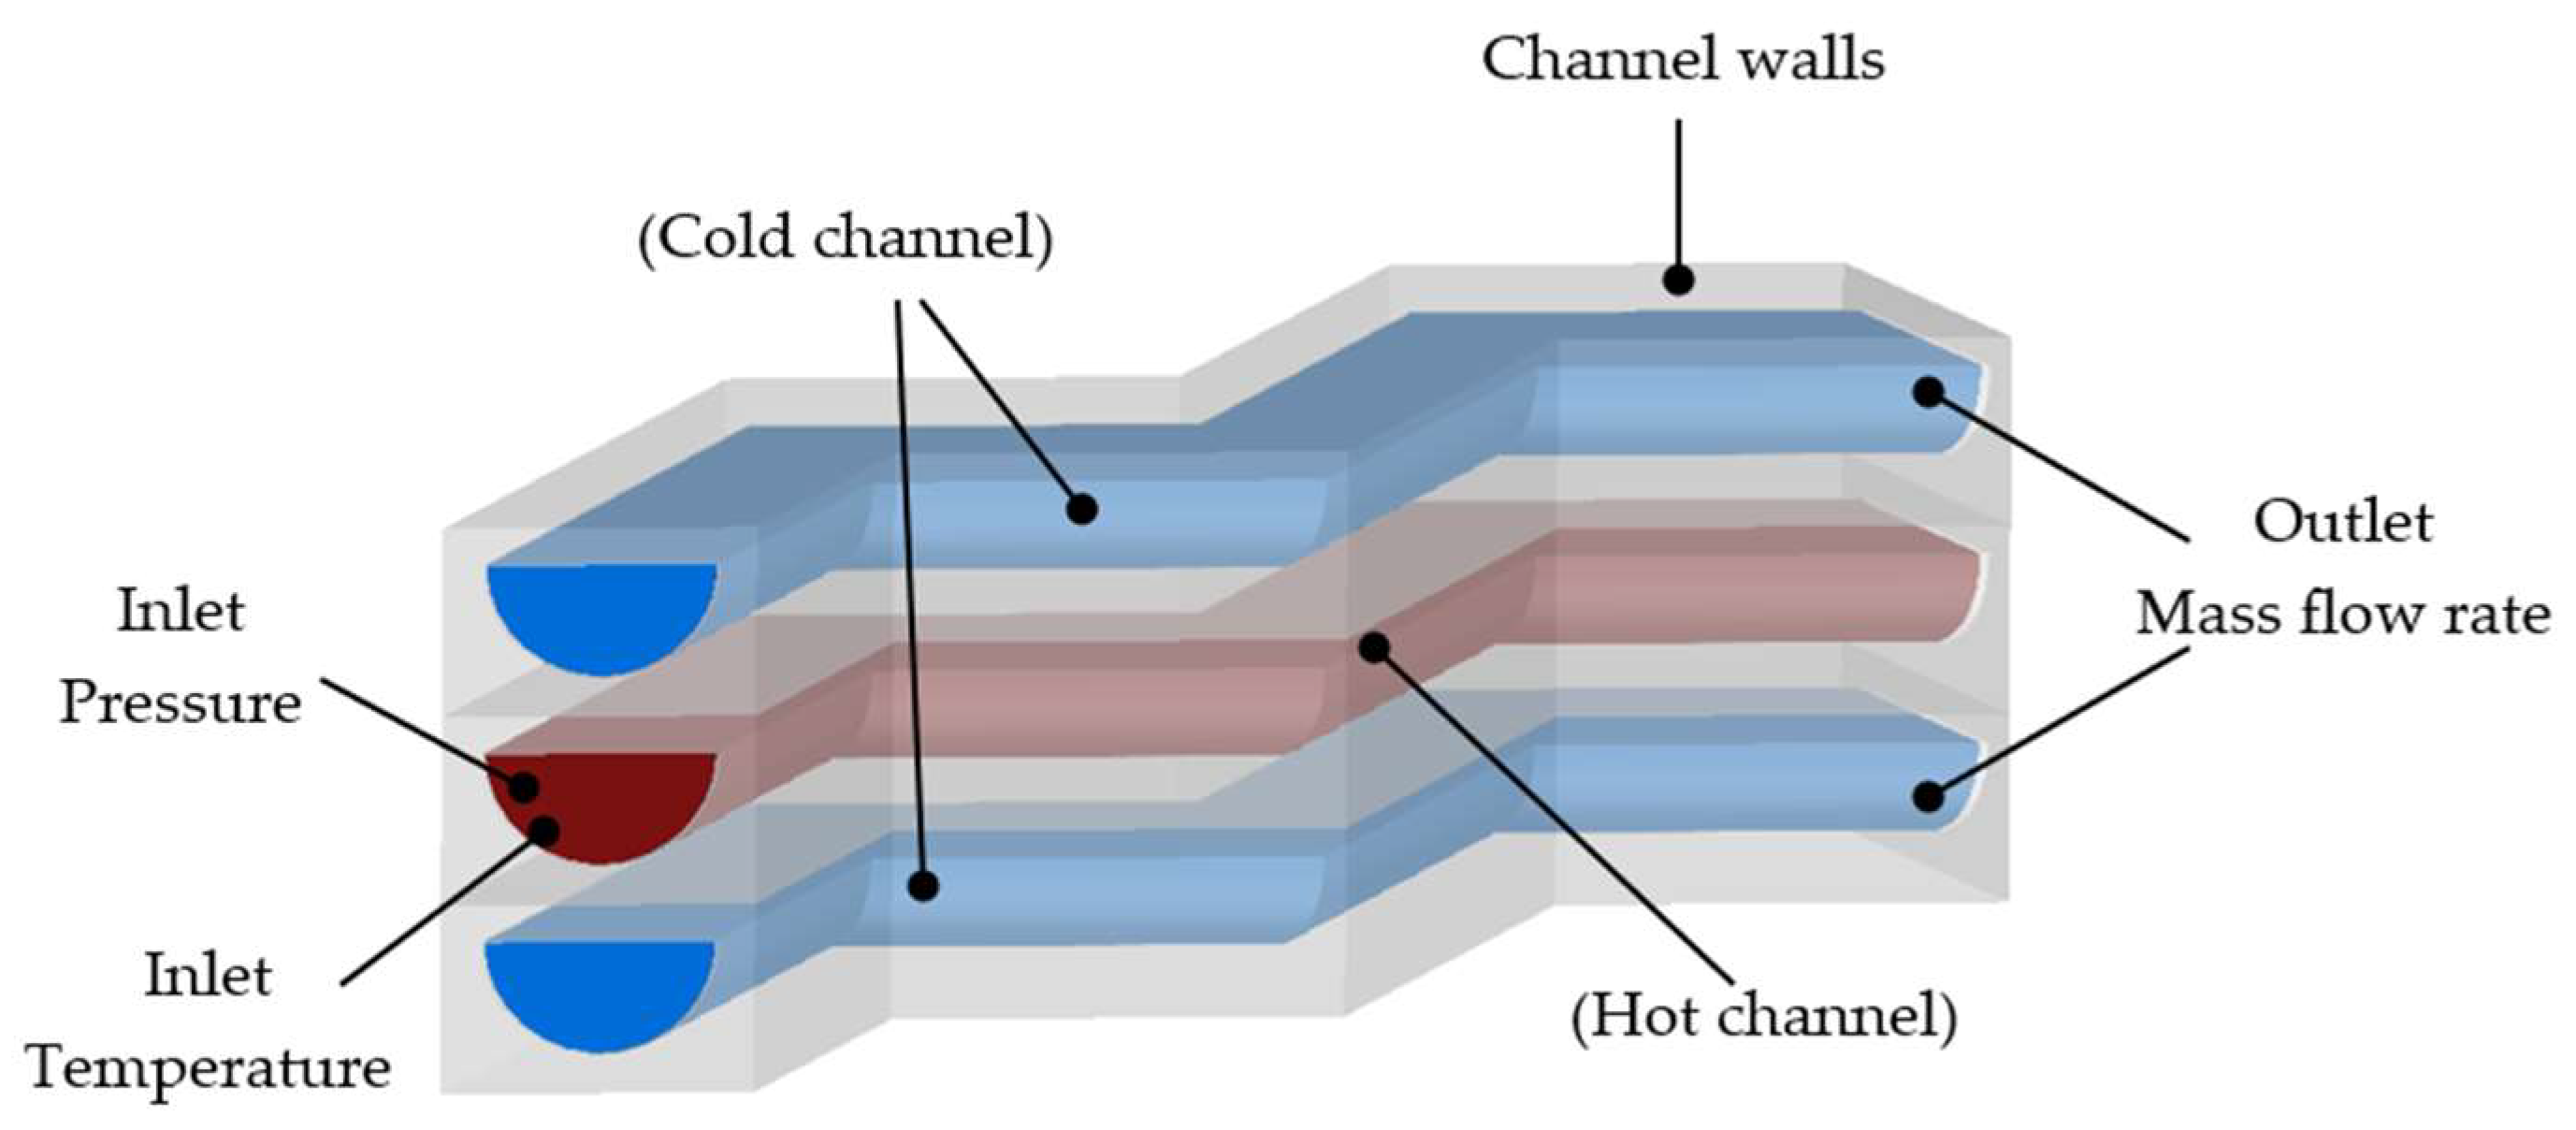
The CFD survey proposed in the study serves as a robust tool to solve the turbulence equations that describe the performance of PCHE and determine the flow behavior under supercritical conditions. In this sense, as mentioned above, PCHE configurations were modeled to establish the initial computational domain to assess a set of equations capable of calculating both the steady and transient states. Thus, each PCHE block geometry is characterized by the turbulent flow structure that influences the thermal hydraulic performance [37]. Figure 2 shows the details of the boundary conditions used to solve the computational domain.
A turbulence intensity value was established at the inlet of the channel, calculated by the ratio of the root mean square of the turbulence velocity fluctuations to the mean velocity. The turbulence intensity value was 0.35%, which is within the range recommended in the literature [38,39]. The supercritical CO2 database required for the numerical analysis in OpenFOAM is powered by the NIST Refprop® package, incorporating the fluid thermophysical properties under different working conditions [28]. On the other hand, stainless steel S316L was selected as the PCHE block material as it possesses an excellent performance during heat transfer when it is operating under supercritical working conditions [40]. This material is considered to be a chrome-nickel alloy with 2–3 percent molybdenum, which improves corrosion and wear resistance under high temperatures [41]. The main material properties are shown in Table 1.
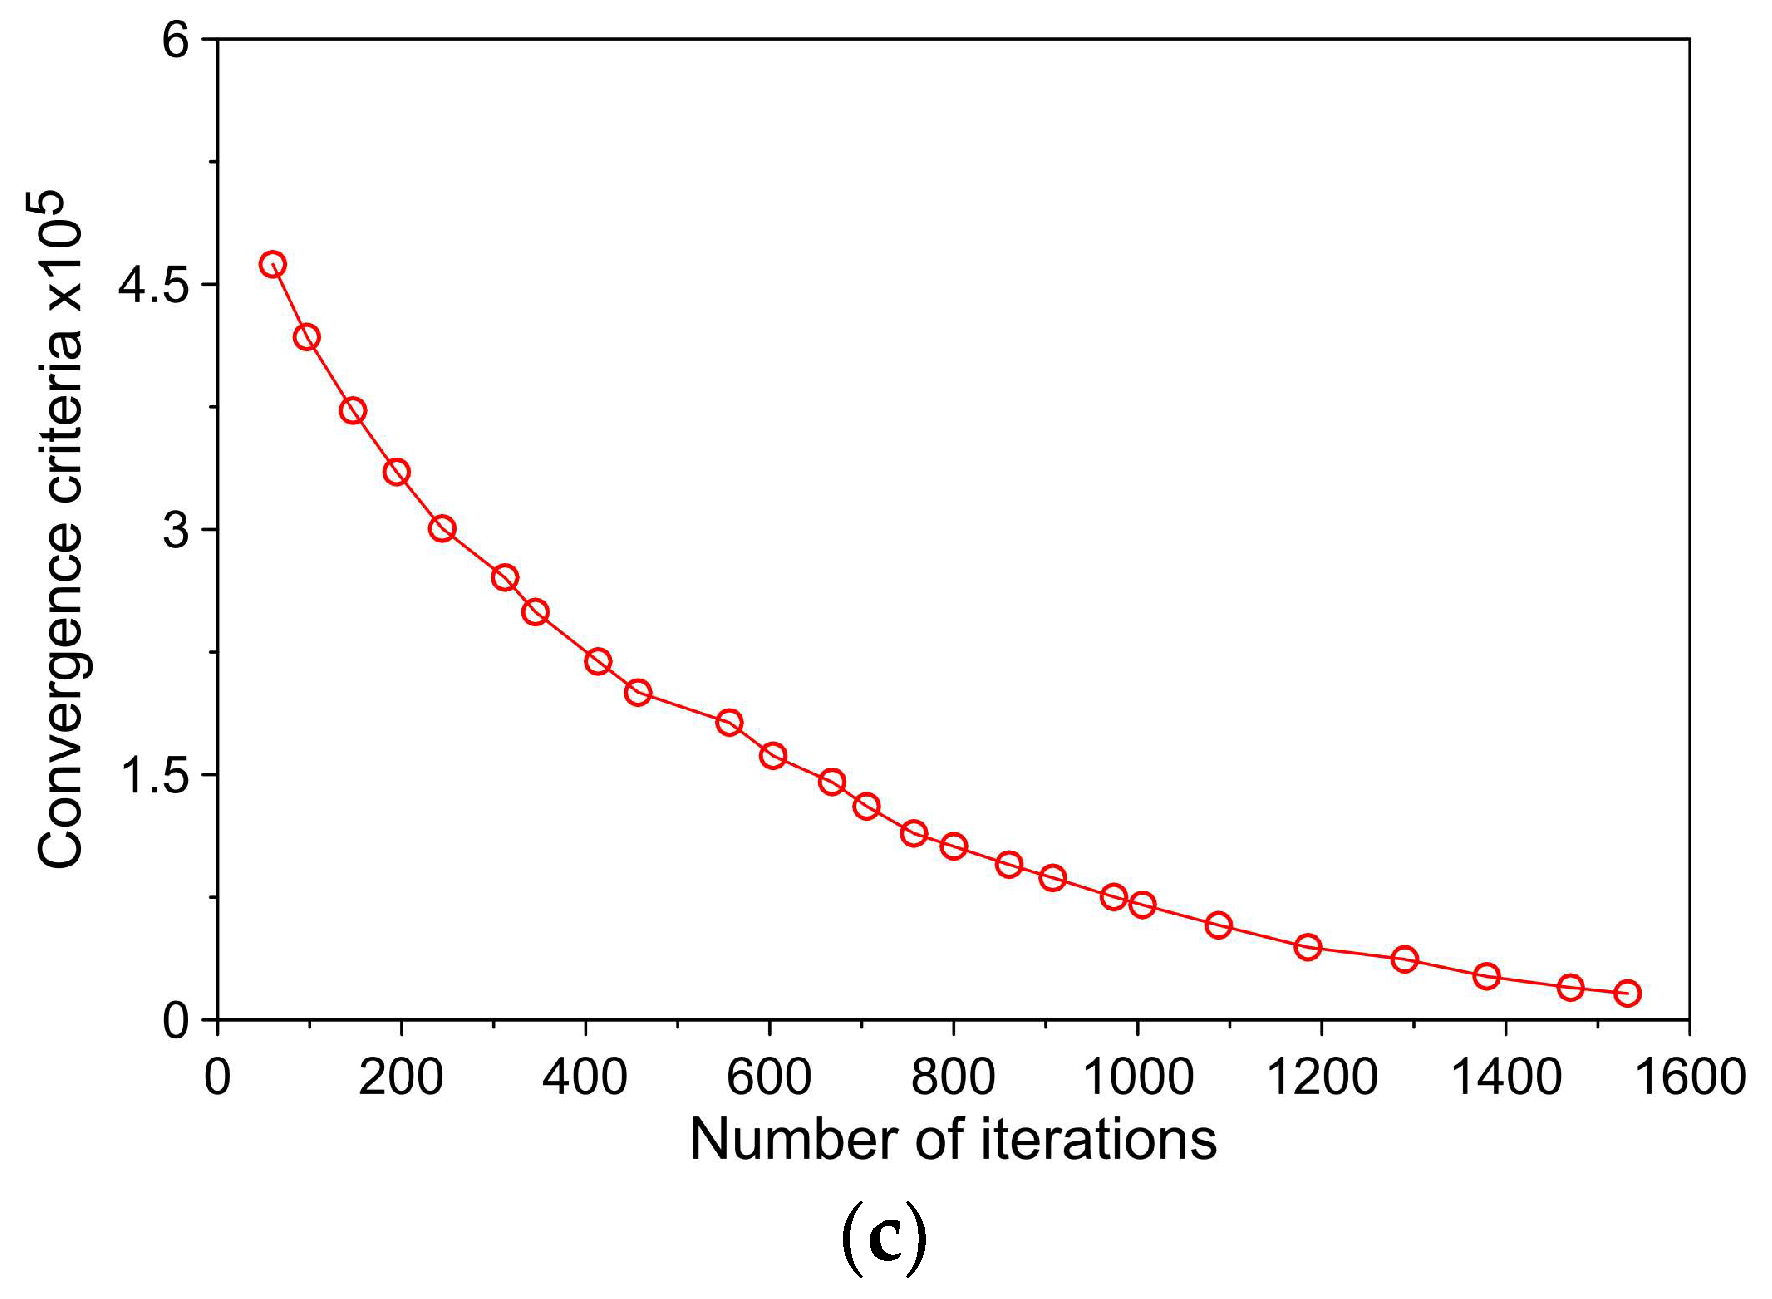
The convergence criterion of the numerical simulations was defined at a value of 10 6 in each of the residuals in order to achieve the best predictions of the flow characteristics and heat transfer rate. For the selection of the turbulence model, a comparison was made between three turbulence models: k ε , R N G   k ε , and S S T   k ω . The results of the comparison are shown in Figure 3.
Figure 3a shows the clear superiority of the convergence criteria reached by the S S T   k ω turbulence model compared to those of the k ε and R N G   k ε turbulence models. Therefore, this model was selected to estimate the turbulent quantities that describe the flow transport within the PCHE geometries due to the strong predictability of the test. Indeed, the results agreed with the findings of Bennett et al. [42], where this model demonstrated an improved performance as it accounts for adverse pressure gradients that influence heat transfer within the PCHE channels under steady-state conditions.

2.3. Mesh Independence

The mesh generation process is required during numerical processing. Specifically, a group of lines and nodes described the internal control volume of the PCHE and the interaction between the hot and cold flows. Appropriate mesh generation is fundamental to performing a correct CFD analysis, as it determines the virtual domain where the numerical analysis will take place [24]. Thus, Salome 8.3.0 software is a suitable tool to discretize the control volume, which was previously modeled with computer-aided design software [43].
The main features of the computational mesh domain are listed in Table 2. The skewness and orthogonal quality were evaluated to establish an optimal mesh array as a function of the number of elements and mesh nodes. Note that the mesh density of the PCHE channels required a better discretization process with a higher number of elements due to the geometry complexity, such as the curves and the dimensional difference between the inlet and outlet of the channels.
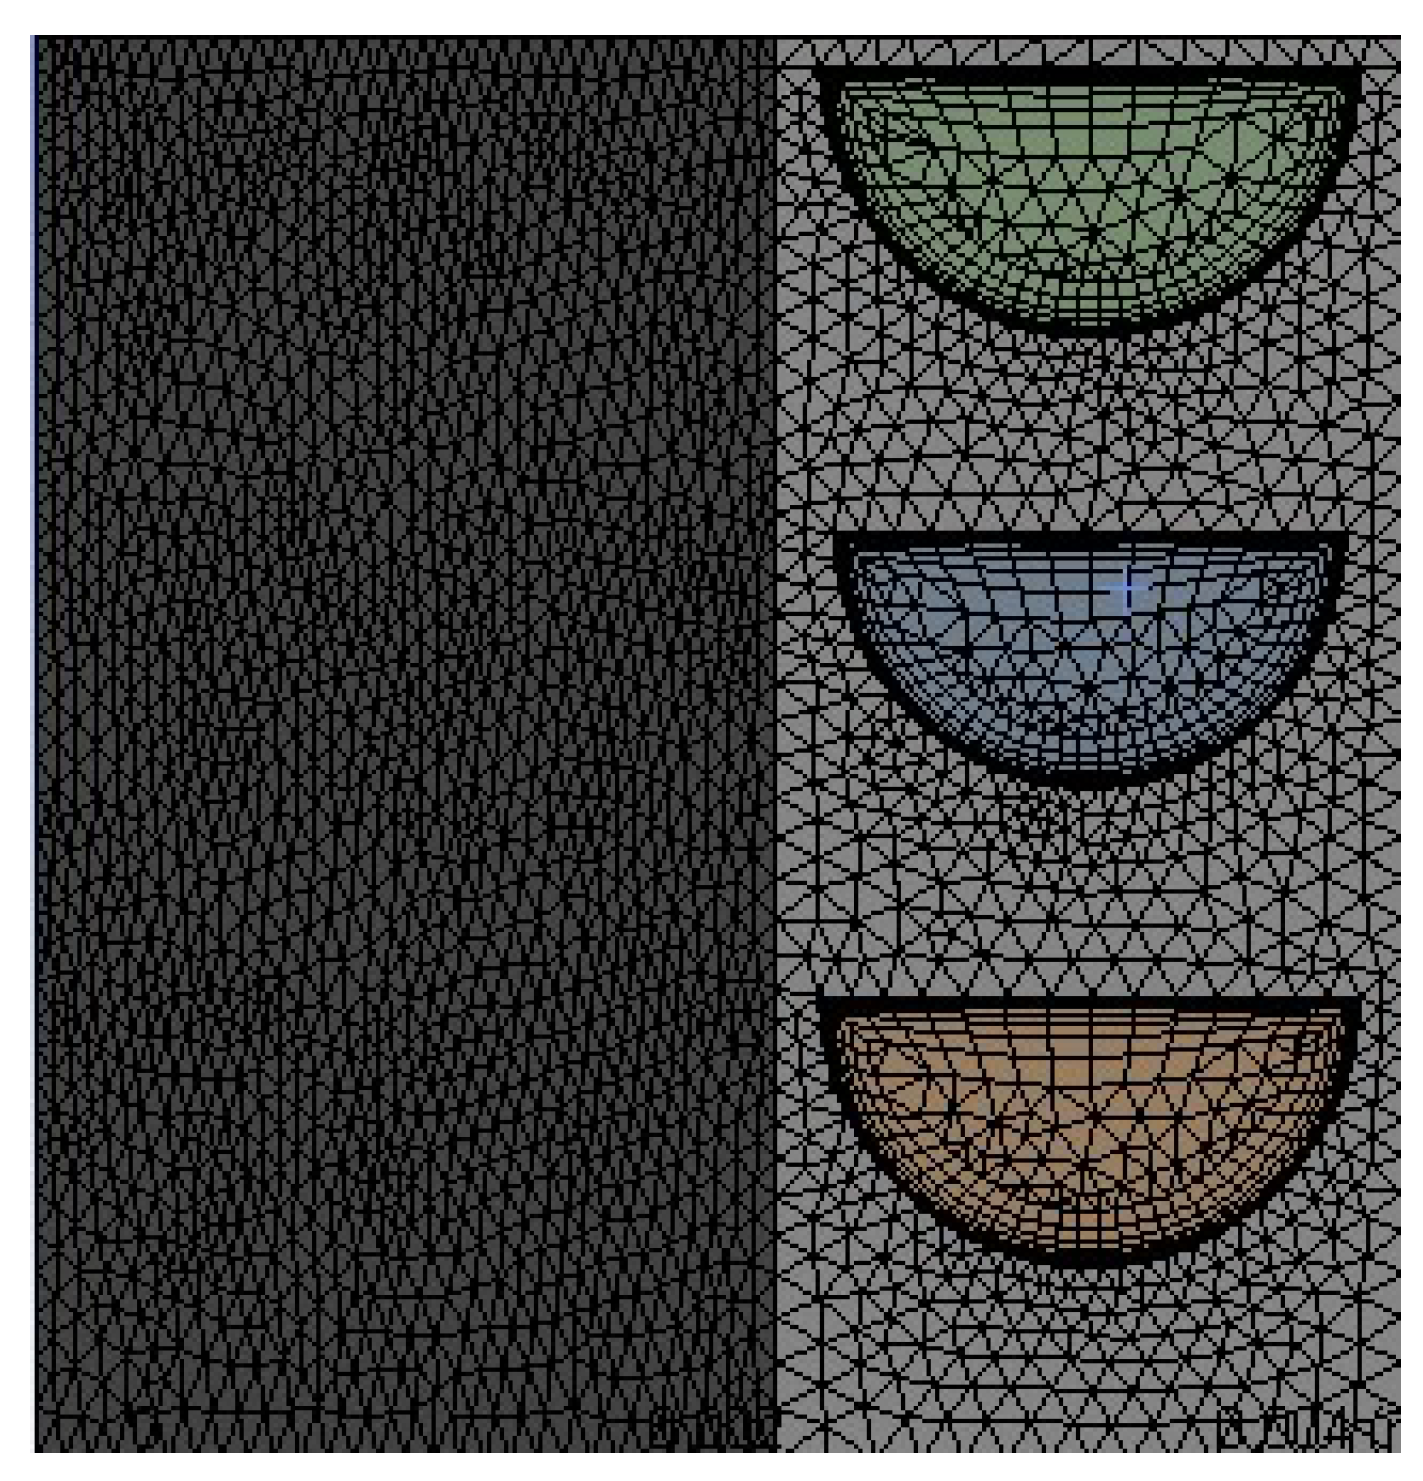
Figure 4 presents the visualization of the mesh generated for the control volume of the straight channel configuration. A mesh independence analysis was performed for each PCHE configuration (see Table 3) to estimate the number of minimum elements necessary to achieve the stability of the experimental results (insignificant deviation).
Mesh independence becomes crucial for optimizing the computational demand required to solve the partial differential equations with OpenFOAM. Therefore, the study centers on the mesh behavior with different density values of nodes and elements to discretize the computational domain for each PCHE configuration, as shown in Table 3. According to the results, the numerical model experiences clear stability of the temperature calculations when the number of elements reaches 9 × 10⁶ (deviation percentage is less than 0.5%). It is important to note that this discrete method application considers each channel arrangement’s main PCHE properties and simulates the turbulent flow’s main effects close to the domain walls that describe the heat transfer process. In order to correctly determine the heat transfer variations and flow behavior in the proximities of the fluid–solid interface, a value of y + < 1 was established in each turbulence model. This is based on the recommendations described in the literature for similar studies [44,45].

3. CFD Model Validation

The experimental validation helps to verify the predictability and performance of thermodynamic modeling and CFD models, while analyzing the heat transfer fluctuations within the heat exchanger under real working conditions. Figure 5 shows the scheme used to recreate the operating conditions of the sCO2 system, which is made up of heaters, coolers, and pressure and temperature gauges. This allows us to predict the interaction between the working fluids and the PCHE equipment when it works under the same conditions as a power plant does. Table 4 lists the main PCHE operating conditions that were configured.
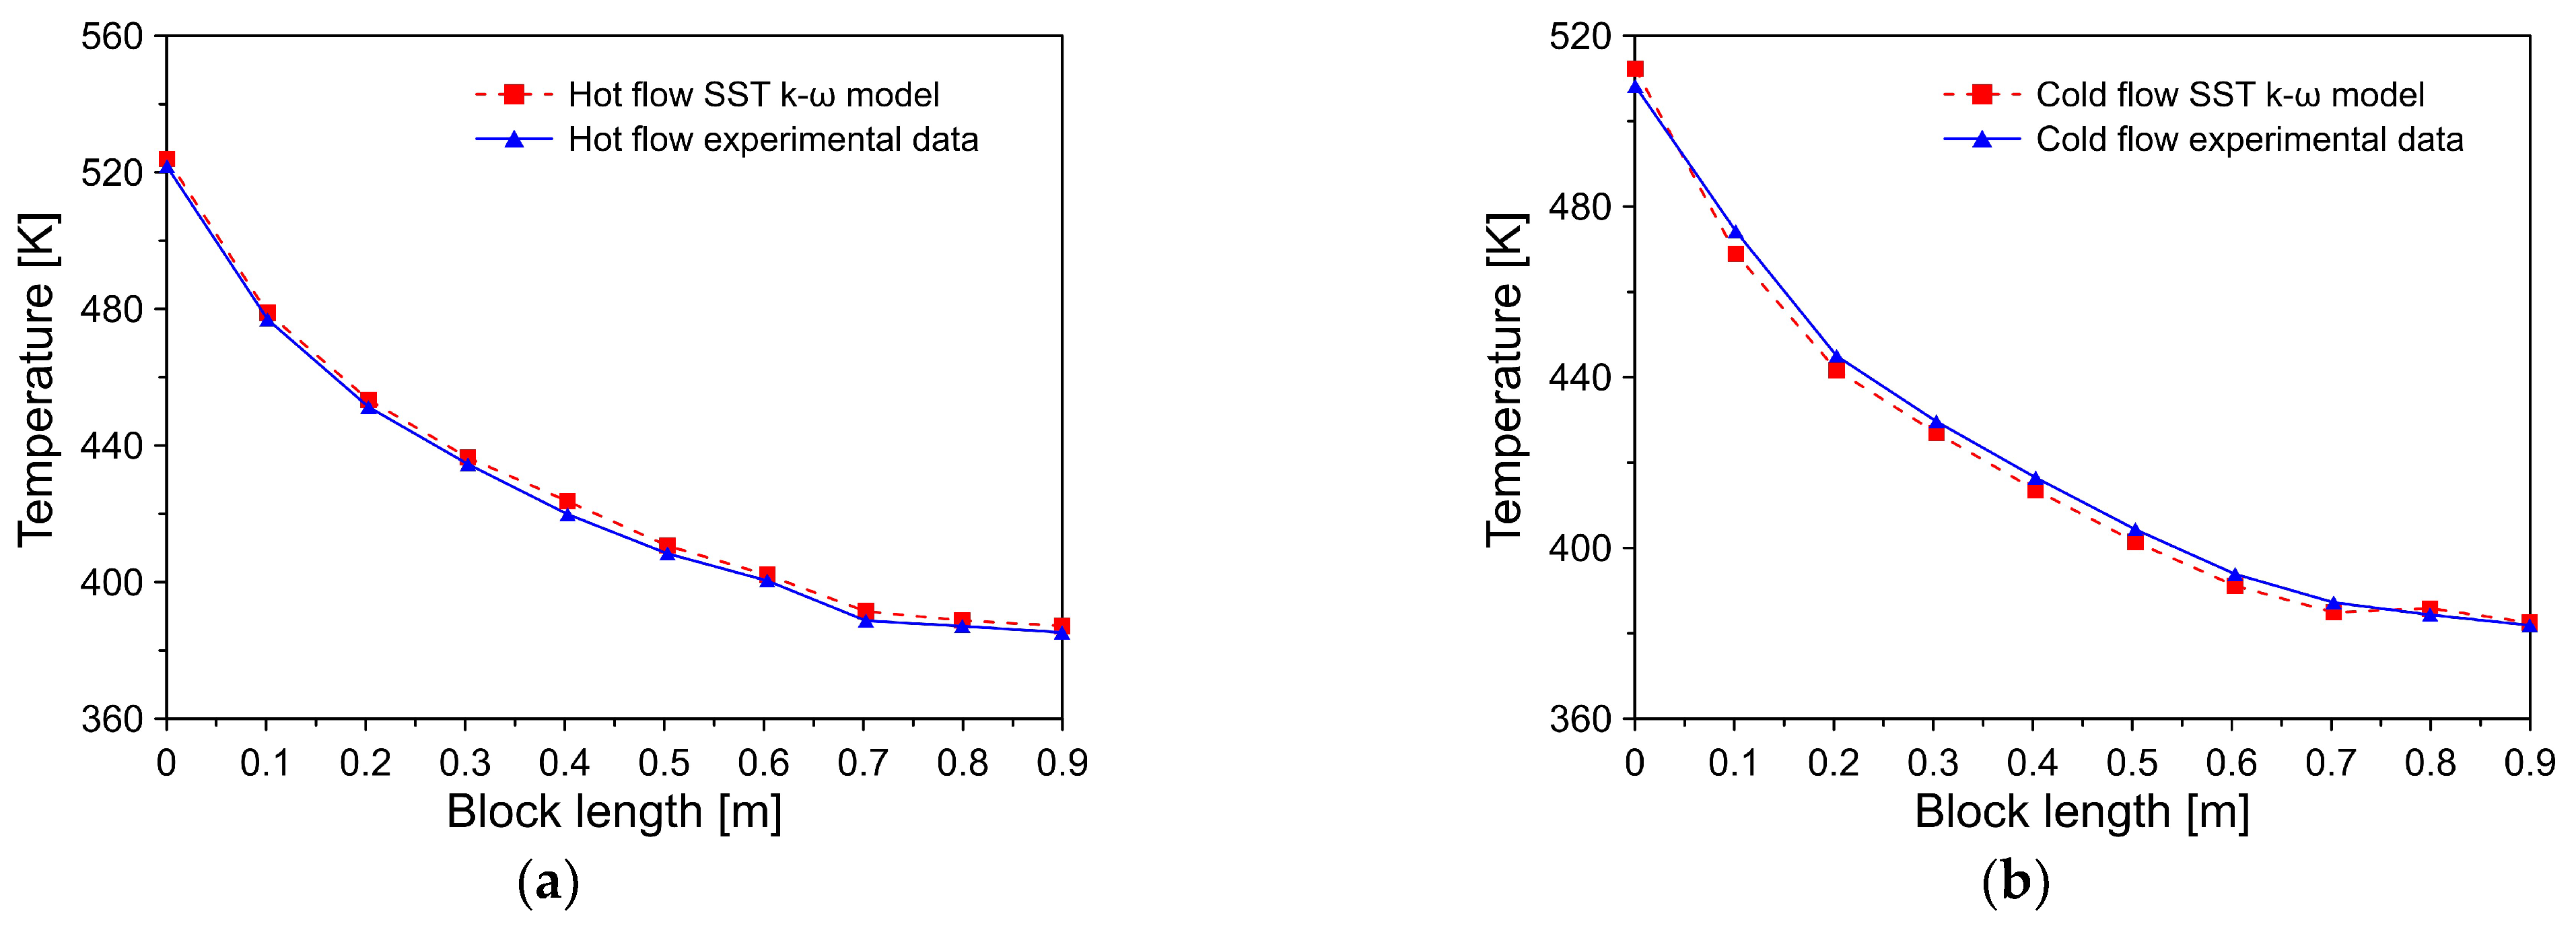
The experimental data reported by Saeed et al. [27] under steady-state conditions serve as the reference for the PCHE application. Table 5 shows the results of the SST k ω turbulent model flow analysis focused on the thermal and physical parameters of the PCHE configuration when we were comparing the experimental and numerical data.
Based on the results, a fairly good agreement was obtained (<7.27%) from the experimental validation, which reinforces the accuracy of the models proposed. This numerical validation is shown in Figure 6.
A good prediction of the flow temperature was reached with the SST k-ω model considering the turbulent viscosity and the inertial force application into the numerical computation of the Reynolds equations. The agreement of the results validated the numerical application of both methods when we were calculating the thermal properties of the turbulent flow within the PCHE control volume.

4. Results and Discussions

4.1. Thermal and Hydraulic Performance Analysis

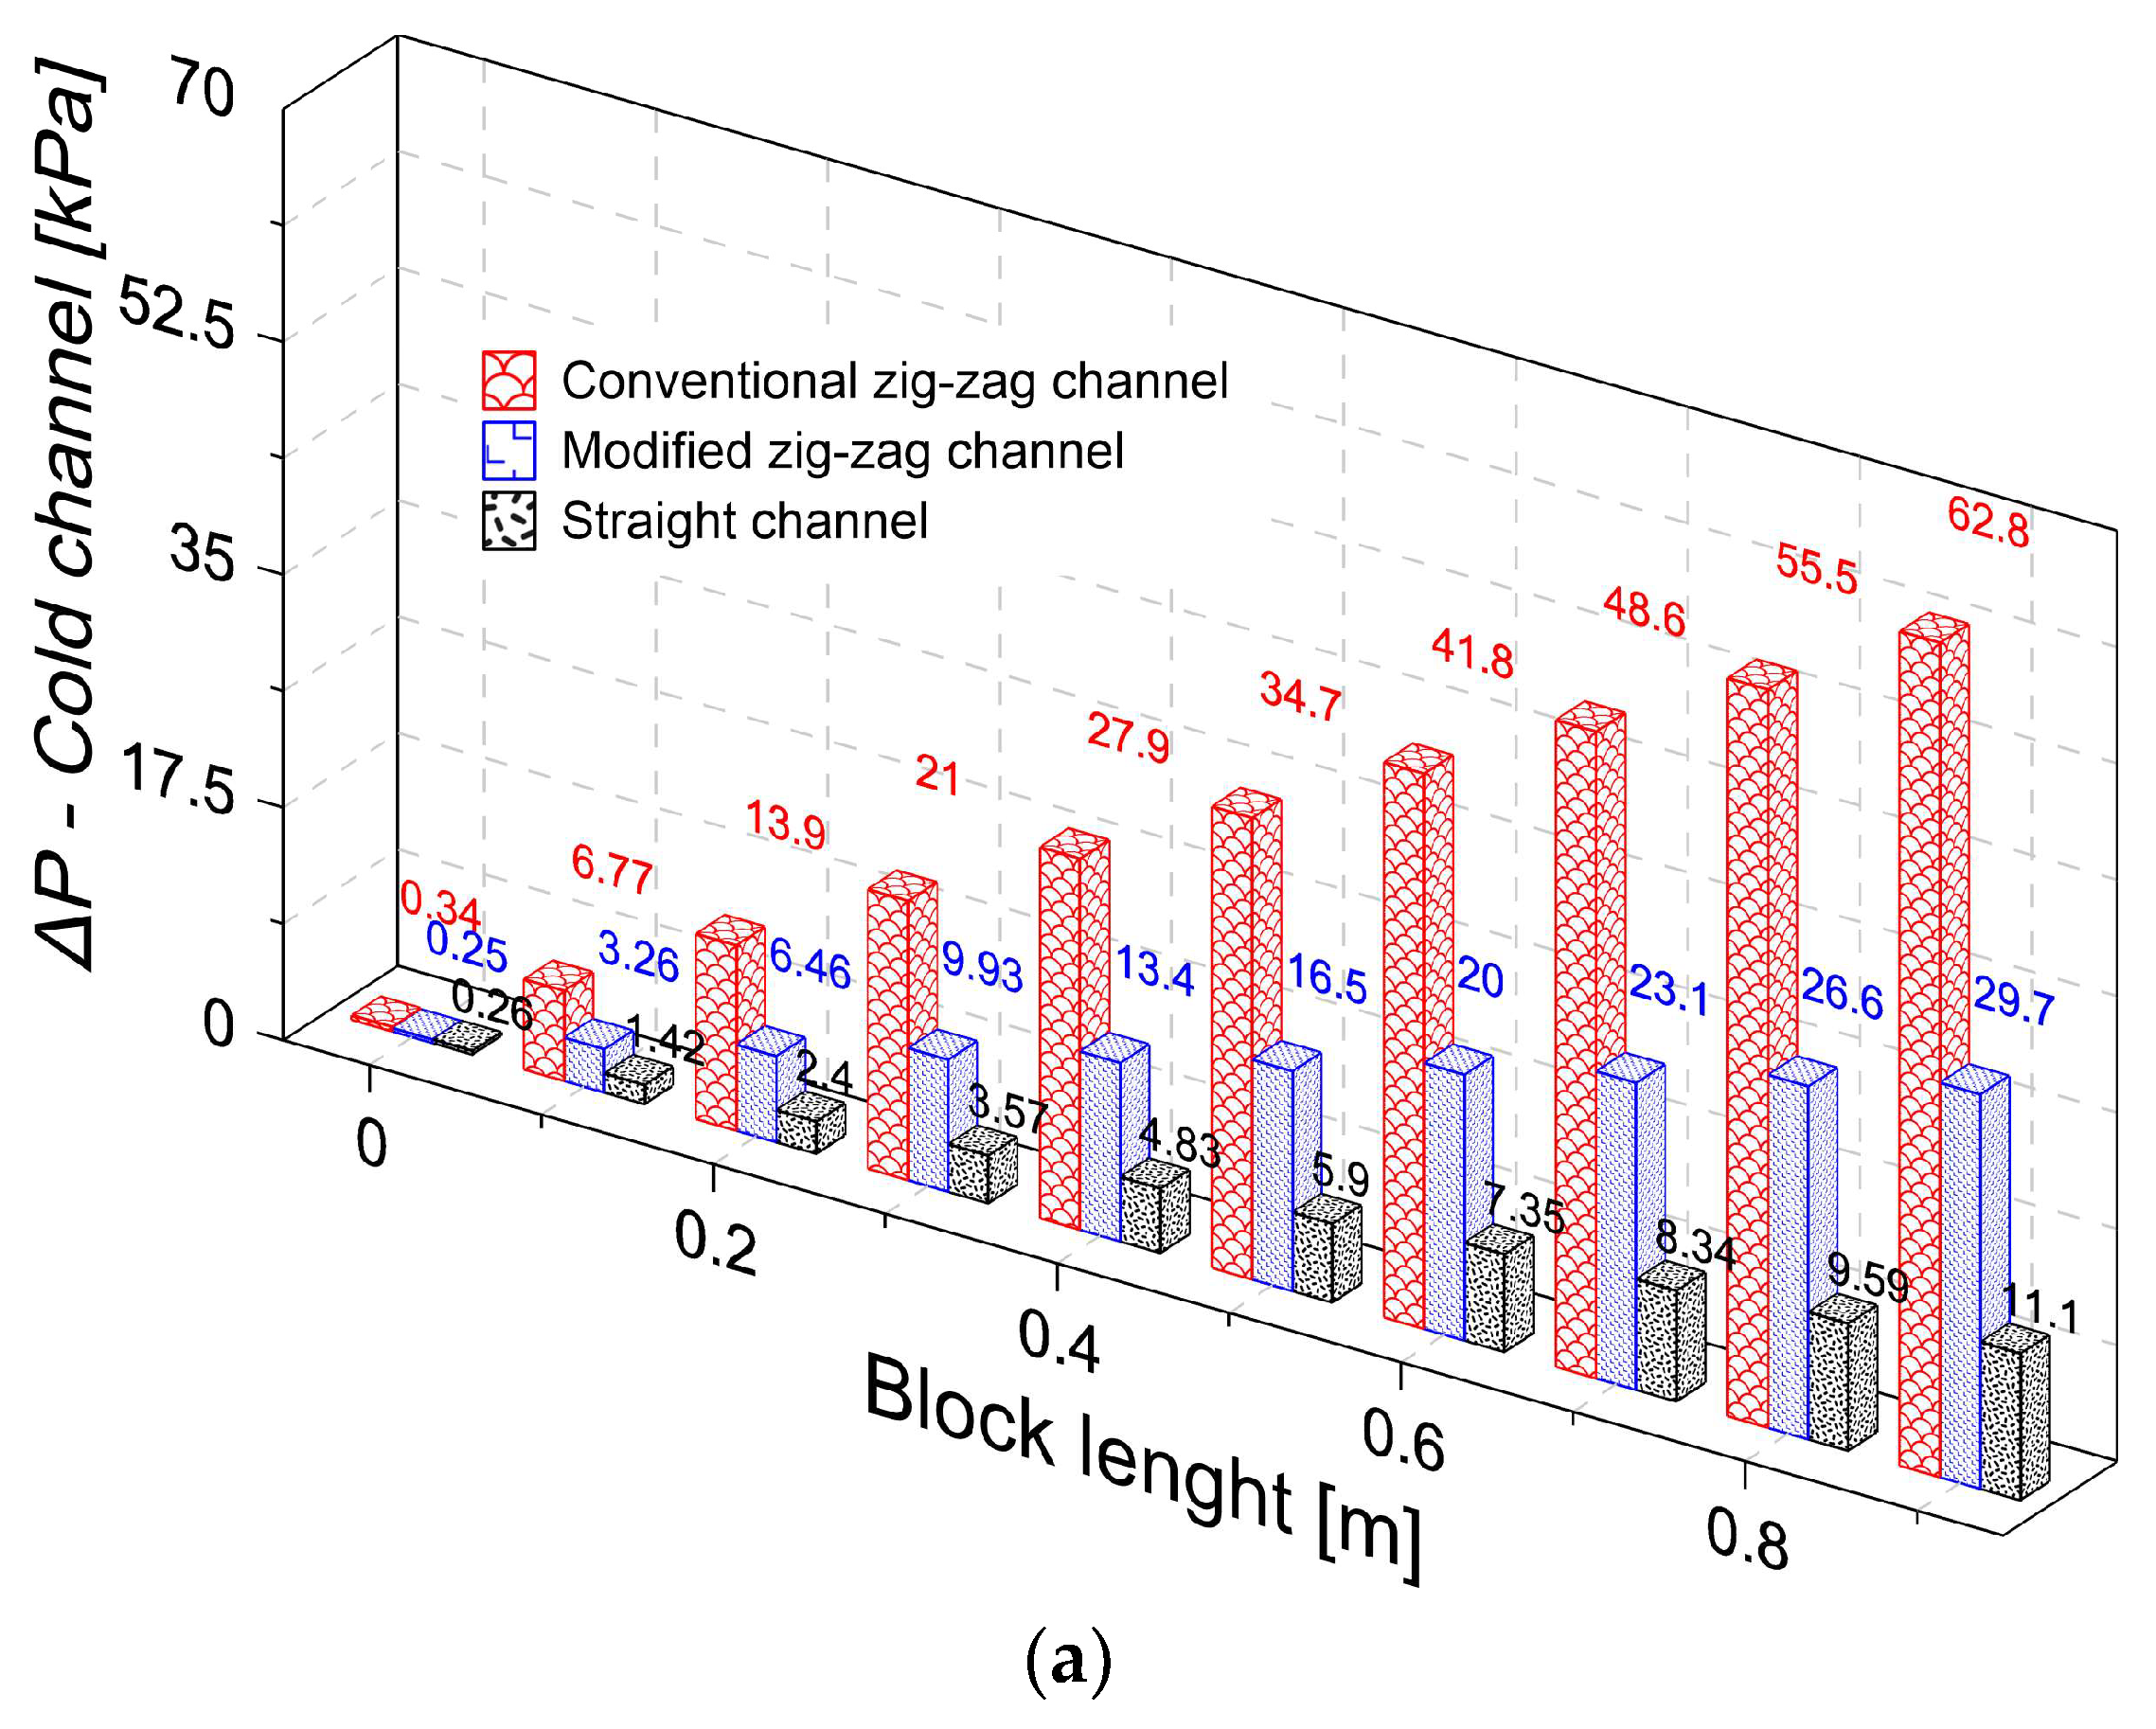
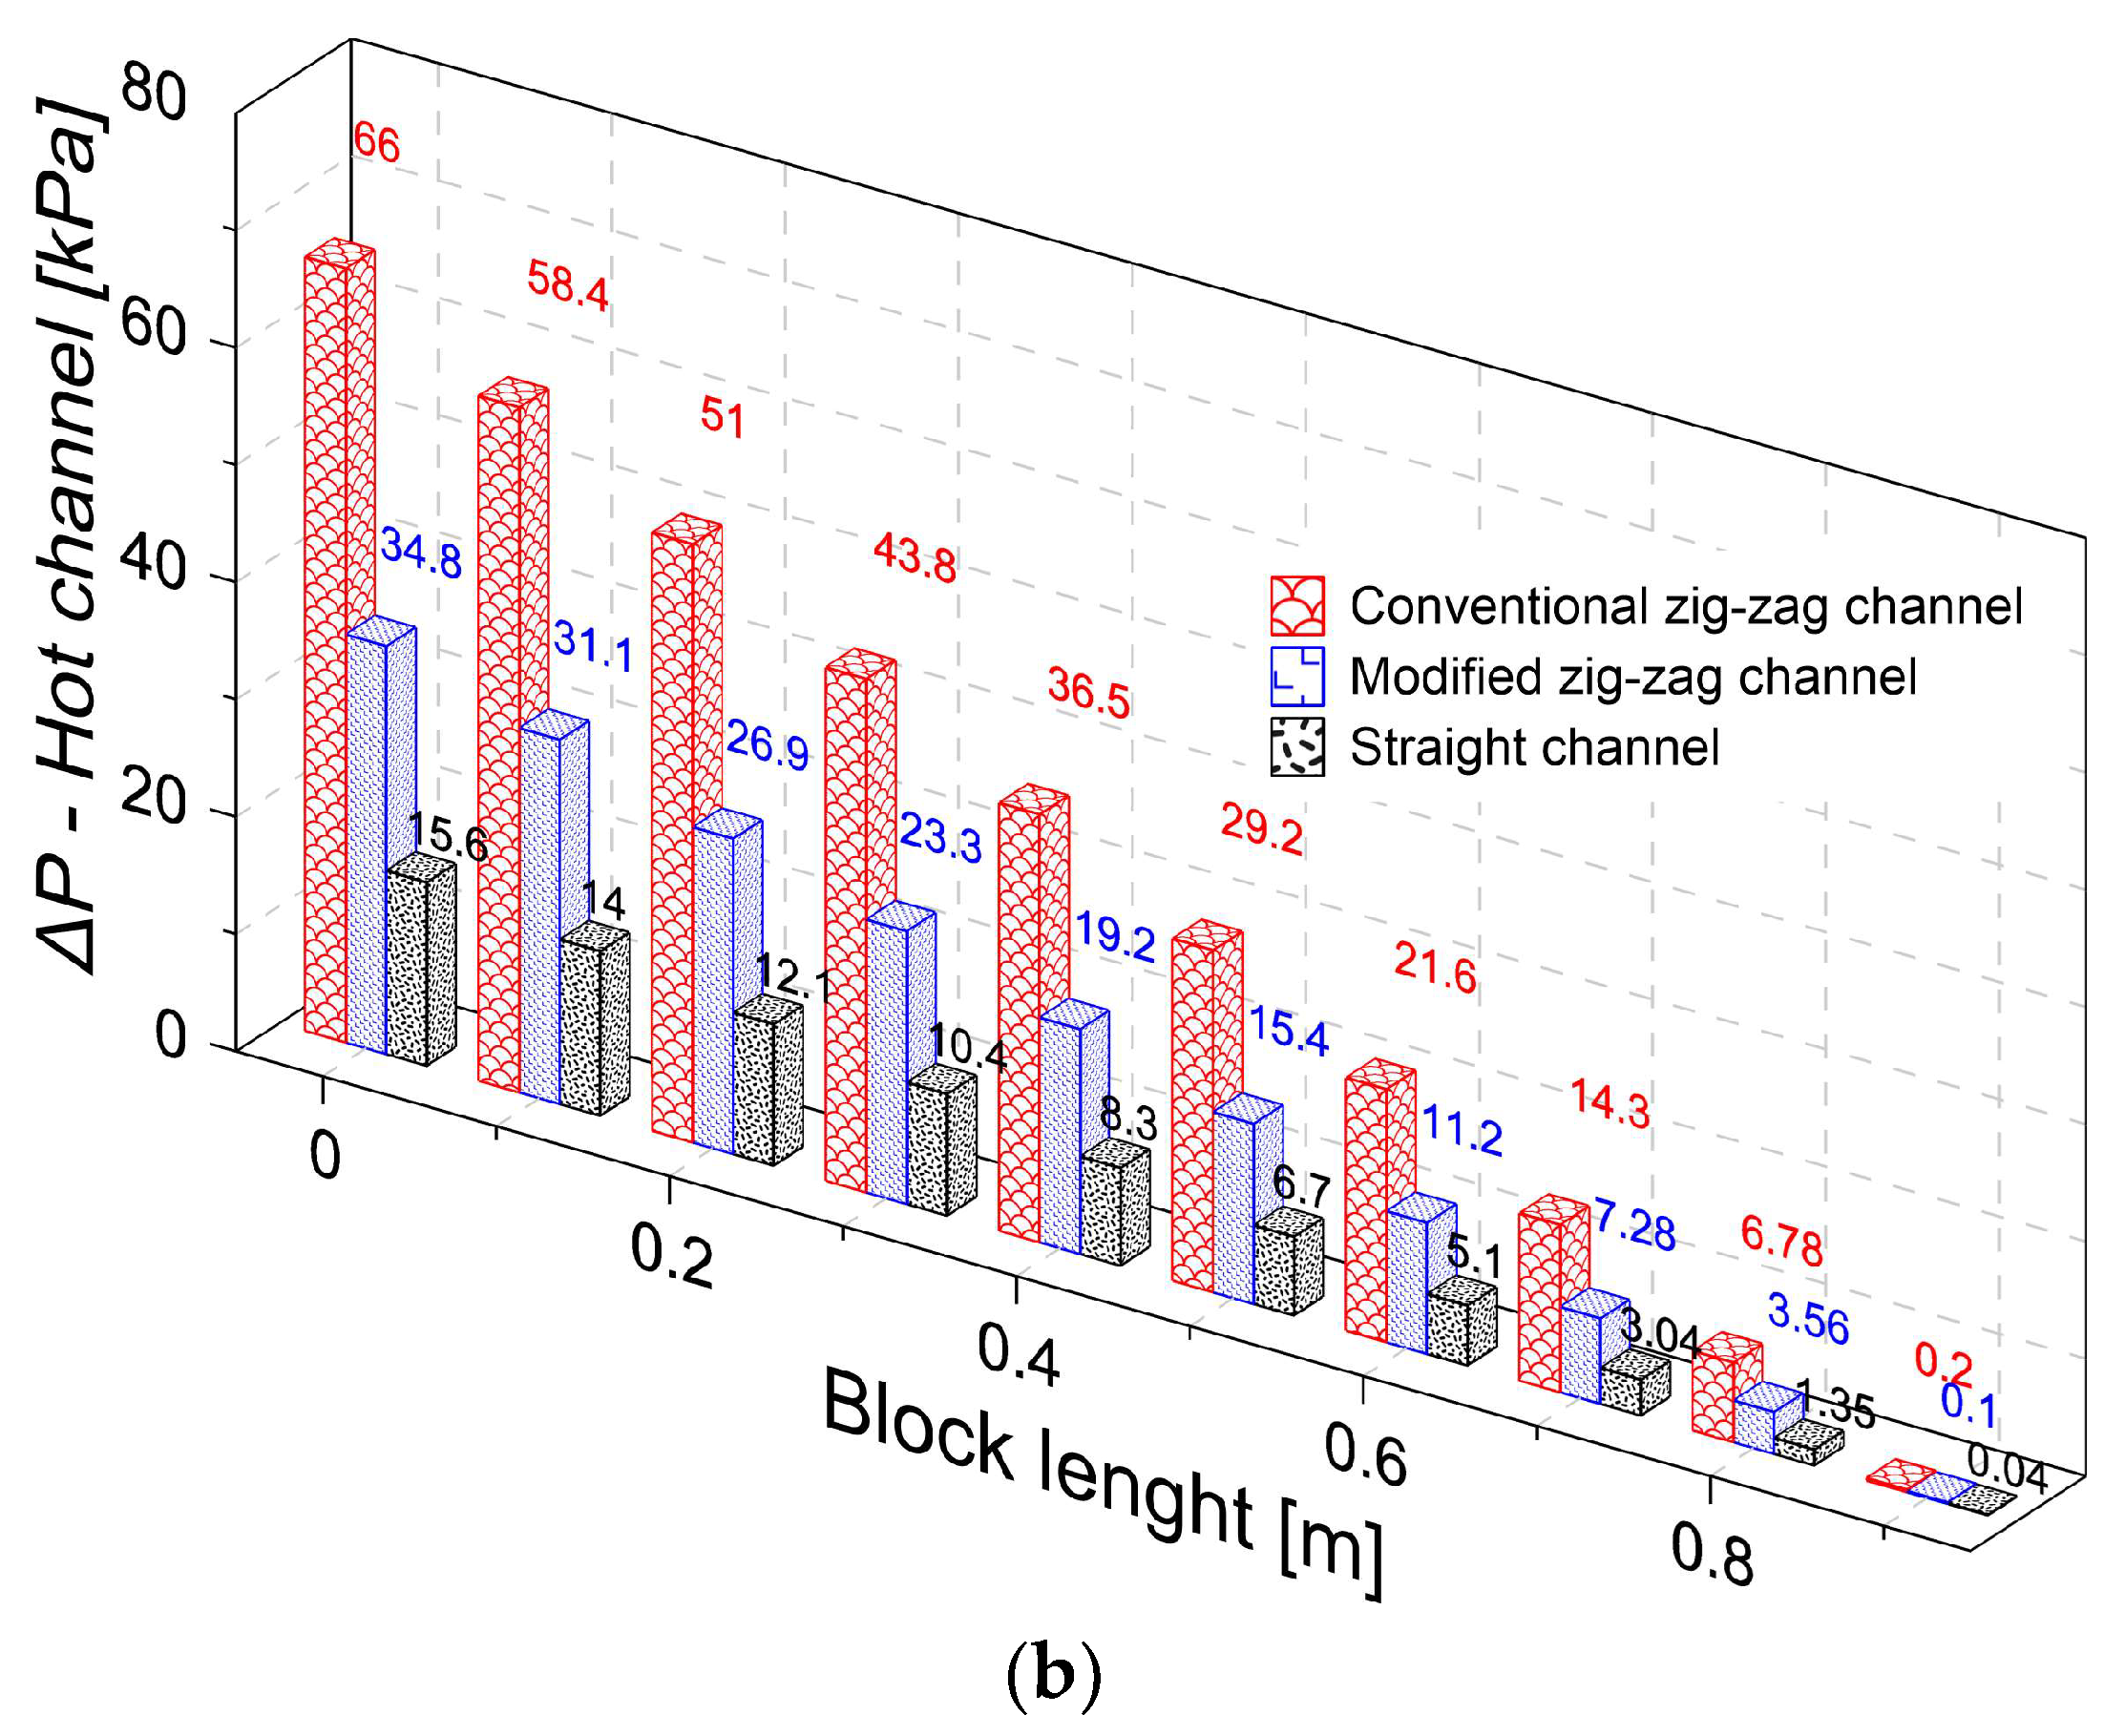
Figure 7 shows the relative differential pressure produced by the different flow channels. The maximum pressure drop values obtained were 66.0 kPa, 34.8 kPa, and 15.6 kPa for the conventional zig-zag channel, the modified zig-zag channel, and the straight channel. The results showed that the conventional zig-zag channel had the highest pressure drop in the PCHE block. In general, the conventional zig-zag channel pressure drop was 103% and 424% higher compared to those of the modified zig-zag channel and the straight channel, respectively. The reduction of the pressure drop due to the geometry of the modified zig-zag channel is associated with the reduction of the eddy zones and the decrease in backflow at the corners of the curvatures. The geometry of the straight channel presented the lowest pressure drop, which is directly related to the continuous flow pattern due to the total absence of curvatures.
Figure 8 shows the change of the friction factor in relation to the Reynolds number for the different channels of the PCHE.
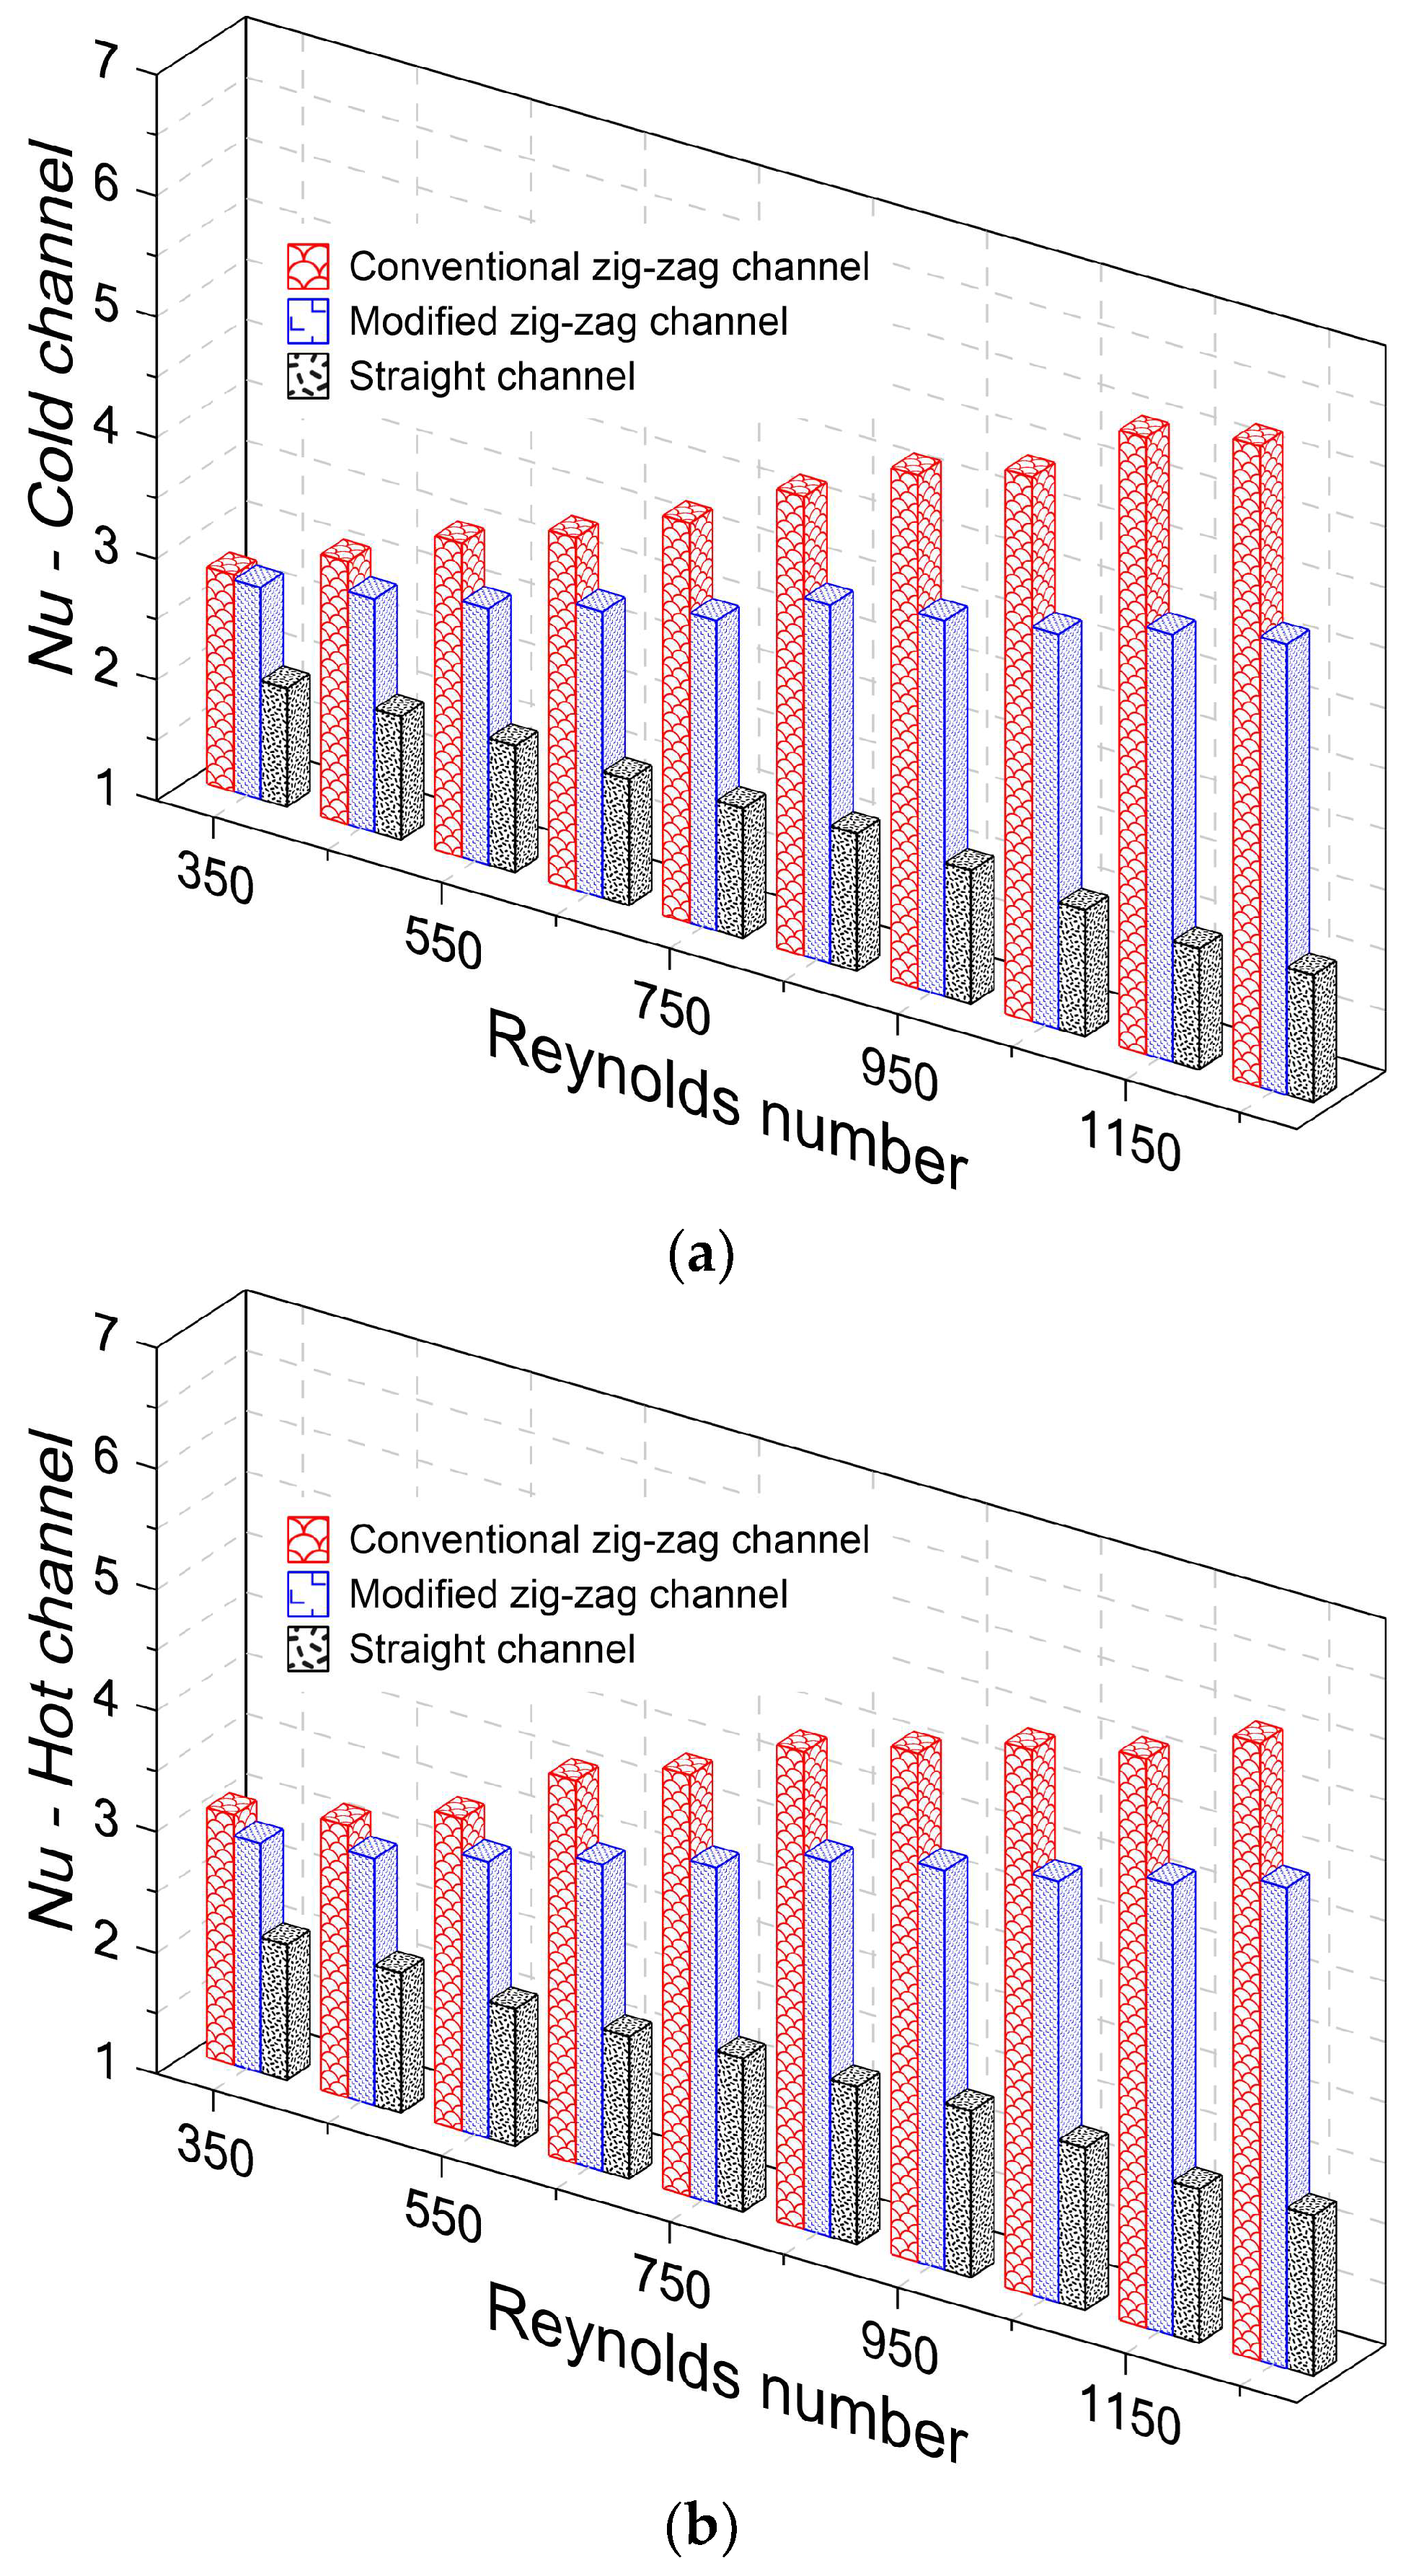
The results indicate a slight variation in the behavior of the friction factor for the hot and cold channels. In general, the friction factor increased 4.4 and 1.8 times in the conventional zig-zag channel and modified zig-zag channel compared to that of the straight channel. On the other hand, Figure 9 shows the behavior of the Nusselt number (Nu) in relation to the Reynolds number (Re).
The Nusselt number is associated with increased heat transfer from the surface of the cold and hot channels. To simultaneously consider the advantage of heat transfer and the penalty due to the pressure drop, the thermal performance factor (TPF) was calculated using Equation (8). The results in Figure 9 indicated an approximately linear increase in the Nusselt number relative to the Reynolds number for the conventional zig-zag channel and modified zig-zag channel, respectively. In the case of the straight channel, a constant Nusselt number was observed for the simulated conditions.
T P F = N u / N u s f / f s 1 / 3
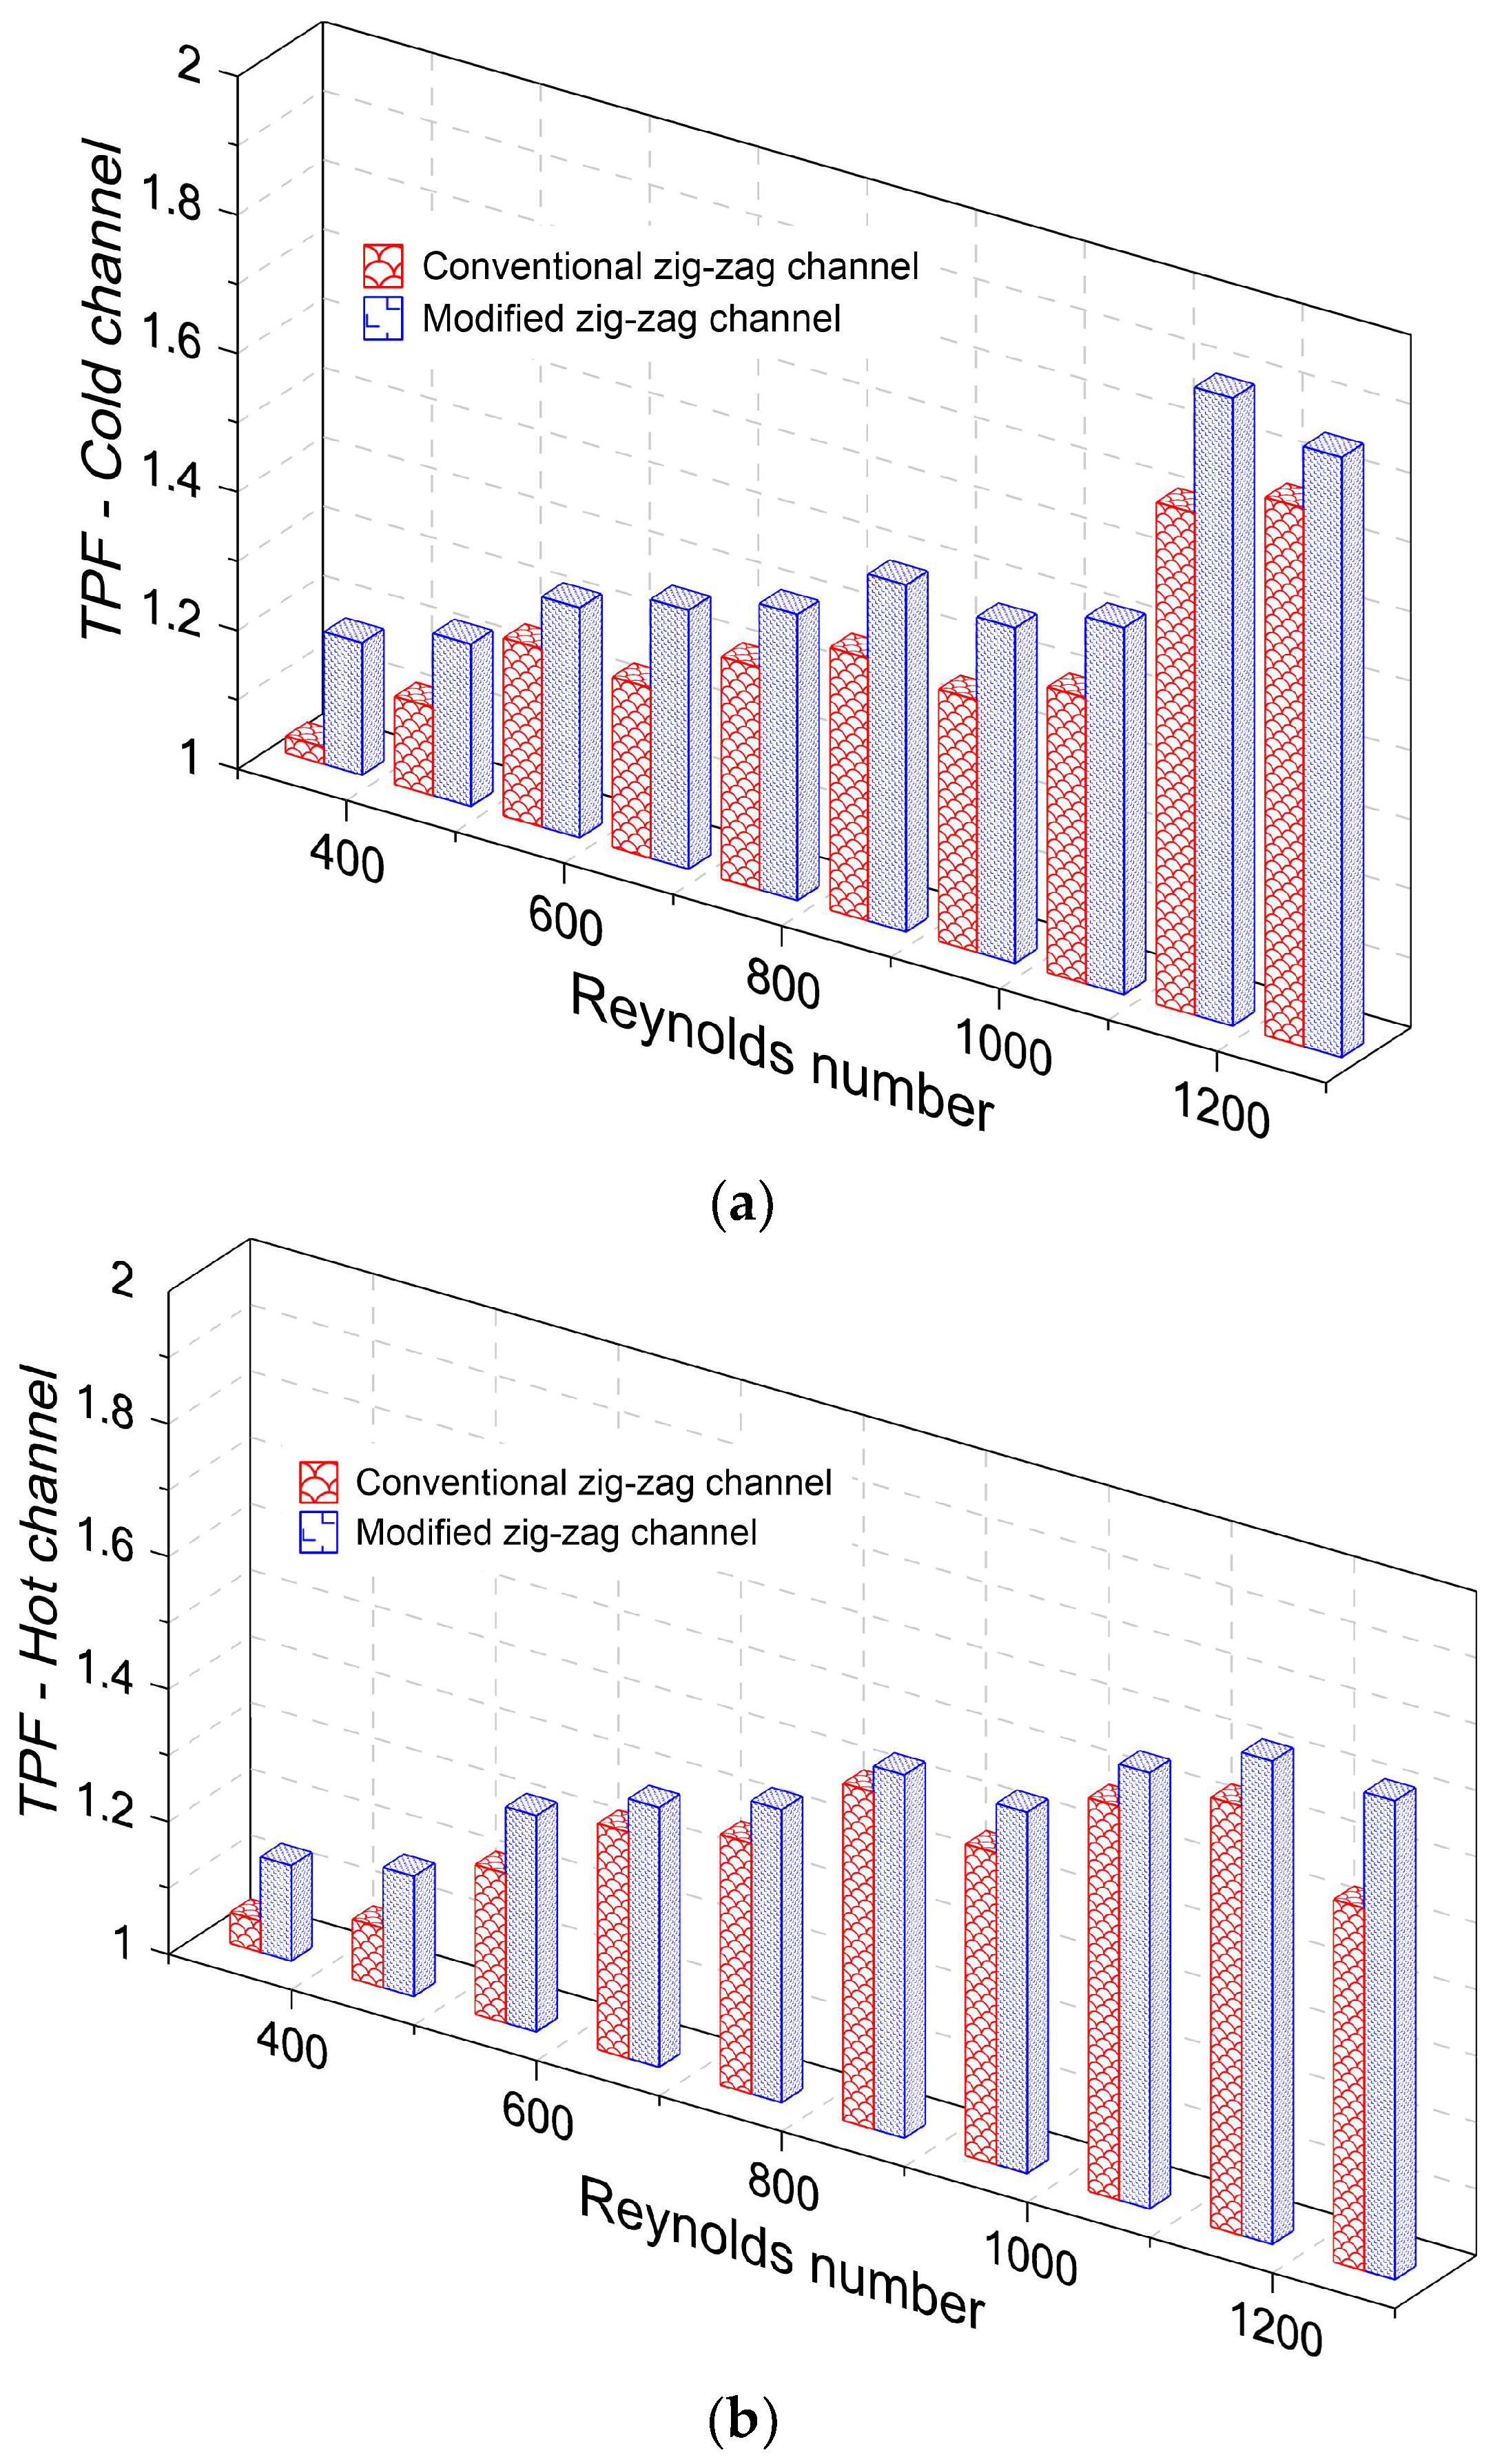
where N u s and f s are the Nusselt number and the friction factor corresponding to the straight channel, respectively. Figure 10 shows the behavior of the TPF for the conventional zig-zag channel and the modified zig-zag channel.
Figure 10 shows that the modified zig-zag channel presents a better thermal performance factor compared to that of the conventional zig-zag channel for a Reynolds number range of 300–1300, respectively. The TPF ranges were 1.02–1.78 and 1.19–1.91 for the conventional zig-zag channel and the modified zig-zag channel, respectively. For the simulated operating conditions, a 7.6% increase in the TPF was evidenced by the modified zig-zag channel compared to that of the conventional zig-zag channel. This is a consequence of the high pressure drop penalty caused by the zig-zag configuration in the cold and hot channels.
Figure 11 shows the temperature distribution of the hot and cold channels for each geometric configuration in the PCHE.
The data shown in Figure 11 represent the average fluid temperature along the cold channel and the hot channel. The analysis of the results shows that the configuration of the conventional zig-zag channel presents the largest temperature range compared to those of the modified zig-zag channel and straight channel, respectively. The foregoing result implies that the conventional zig-zag configuration resulted in a better thermal performance, which is associated with the interactions of the flow inside the hot and cold channels. On the contrary, the straight channel presents the smallest temperature range in the hot and cold channels. This behavior is attributed to the flow pattern that limits the heat transfer process in the PCHE.

4.2. Effect of Bend Angle on Channels

For the analysis of the bend angle (α) in the conventional zig-zag channel and modified zig-zag channel, three reference values were selected: 20°, 25°, and 30°, as shown in Figure 12.
Figure 13 shows the change in pressure drop for different flow conditions and different channel configurations. The results showed increases of 39% and 22% in the pressure drop when there was an increase of 5° in the bend angle of the conventional zig-zag channel and the modified zig-zag channel, respectively. In general, it is observed that the increase in the angle of curvature favors the increase in the pressure drop for the conventional zig-zag channel and the modified zig-zag channel.
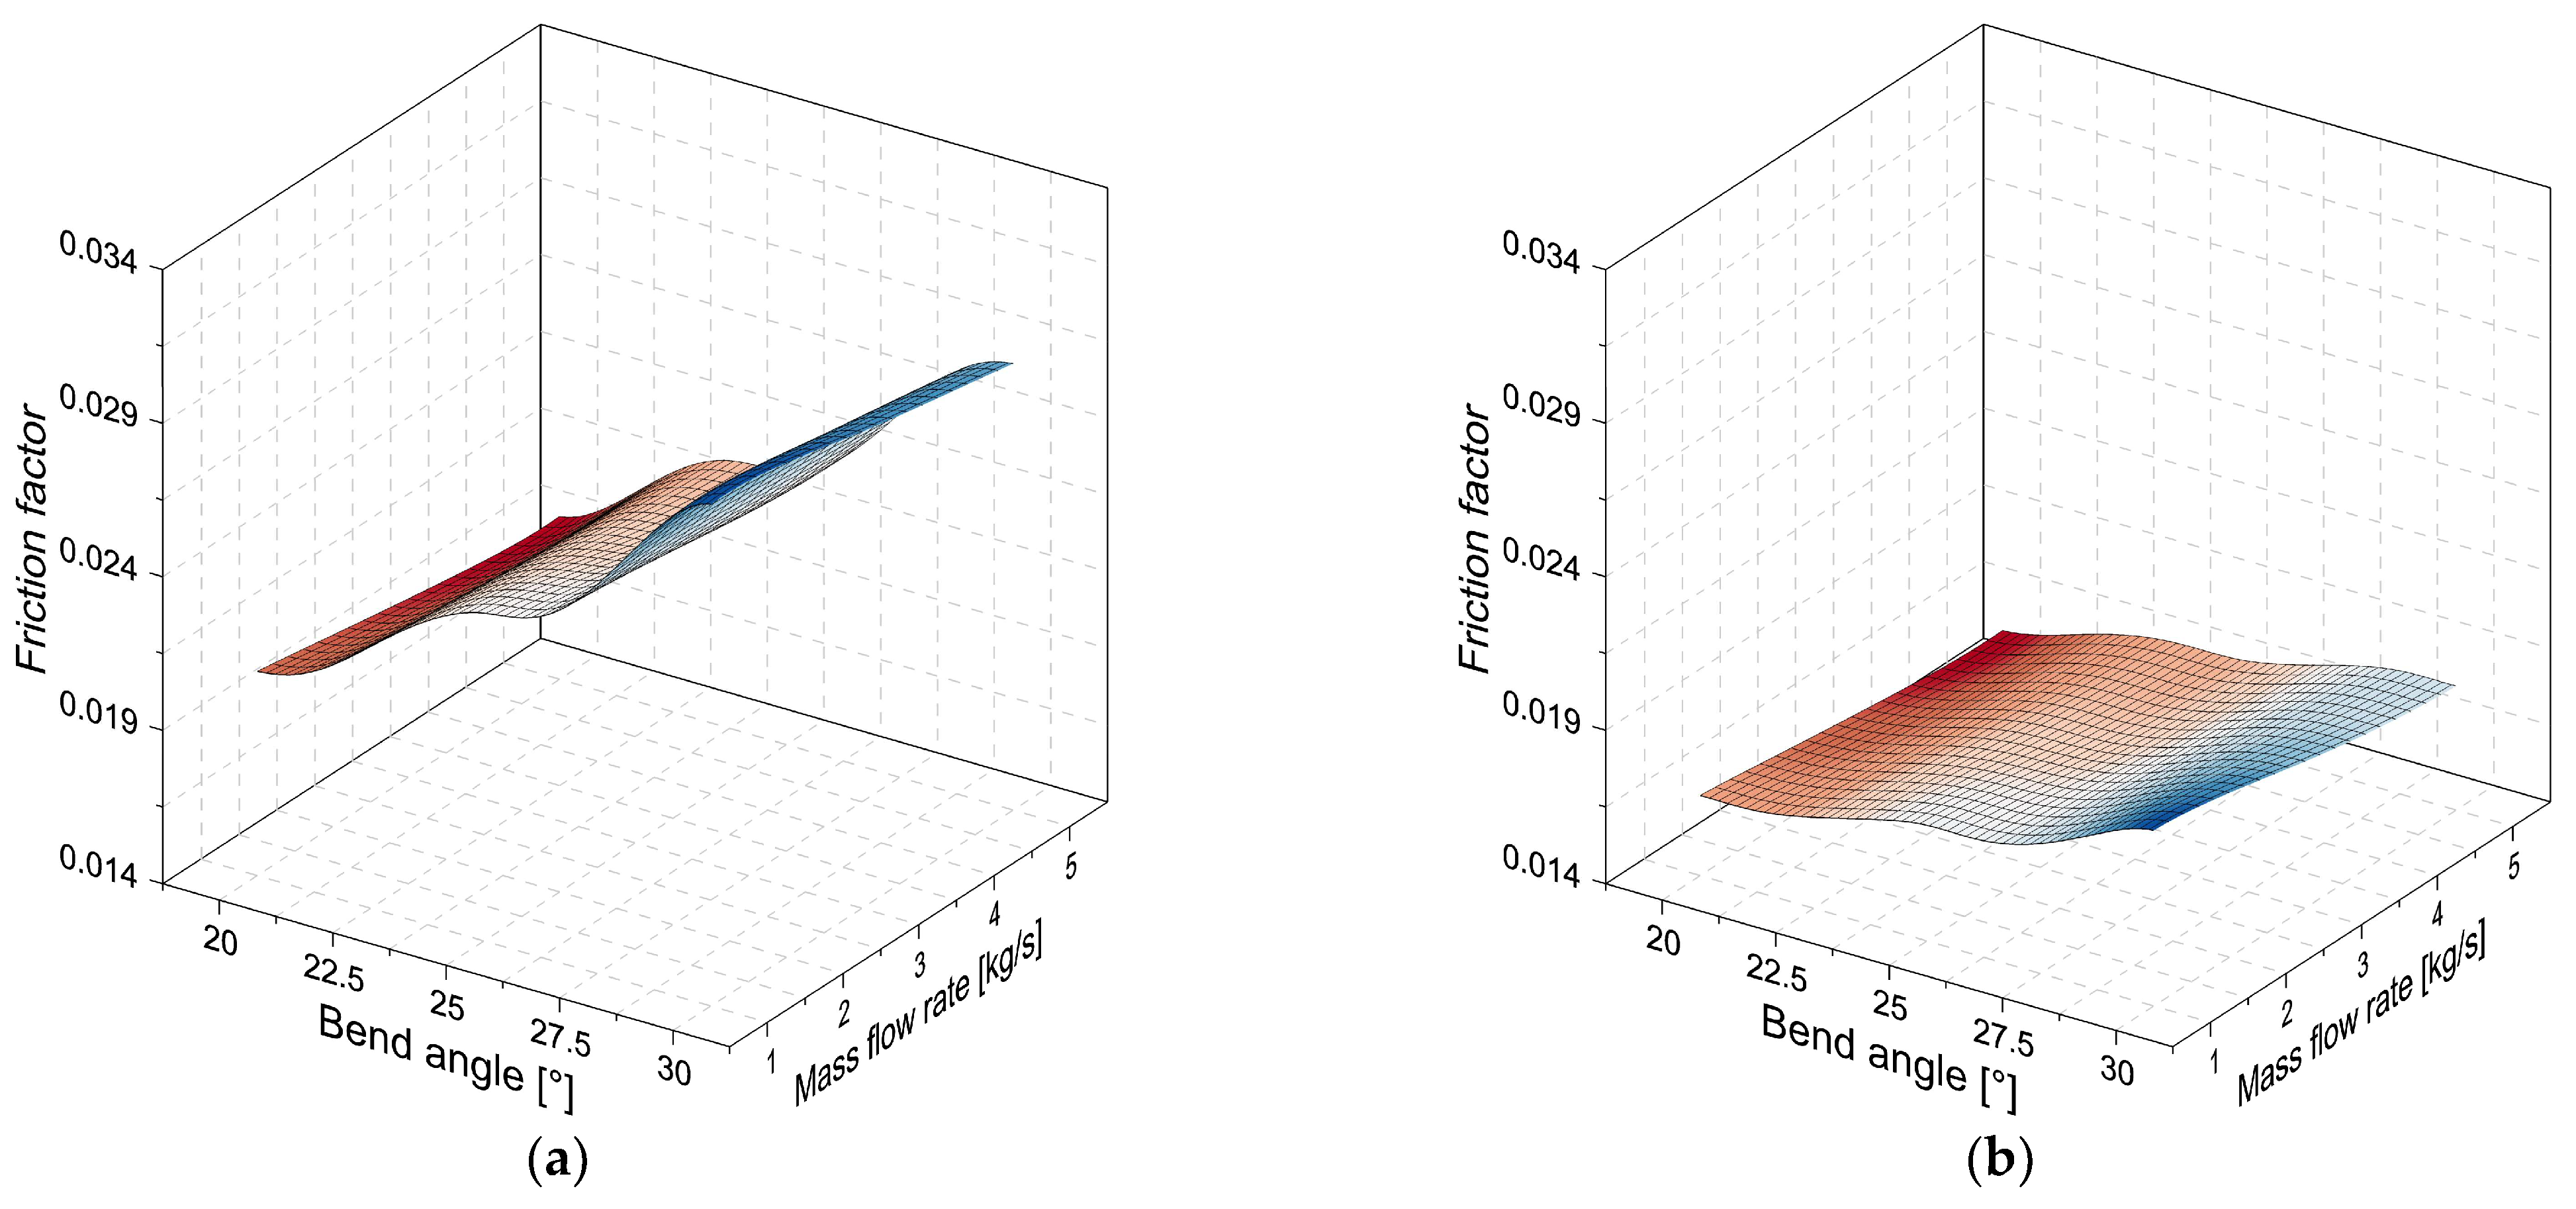
The change in the friction factor due to the bend angle is shown in Figure 14. Unlike the pressure drop, it was observed that the friction factor tends to decrease with the increasing mass flow. This result can be attributed to the flow regime in the PCHE channels. However, the increase in the bend angle tends to increase the friction factor in the conventional zig-zag channel and the modified zig-zag channel. This is a consequence of the greater difficulty for the flow to circulate inside the channels.
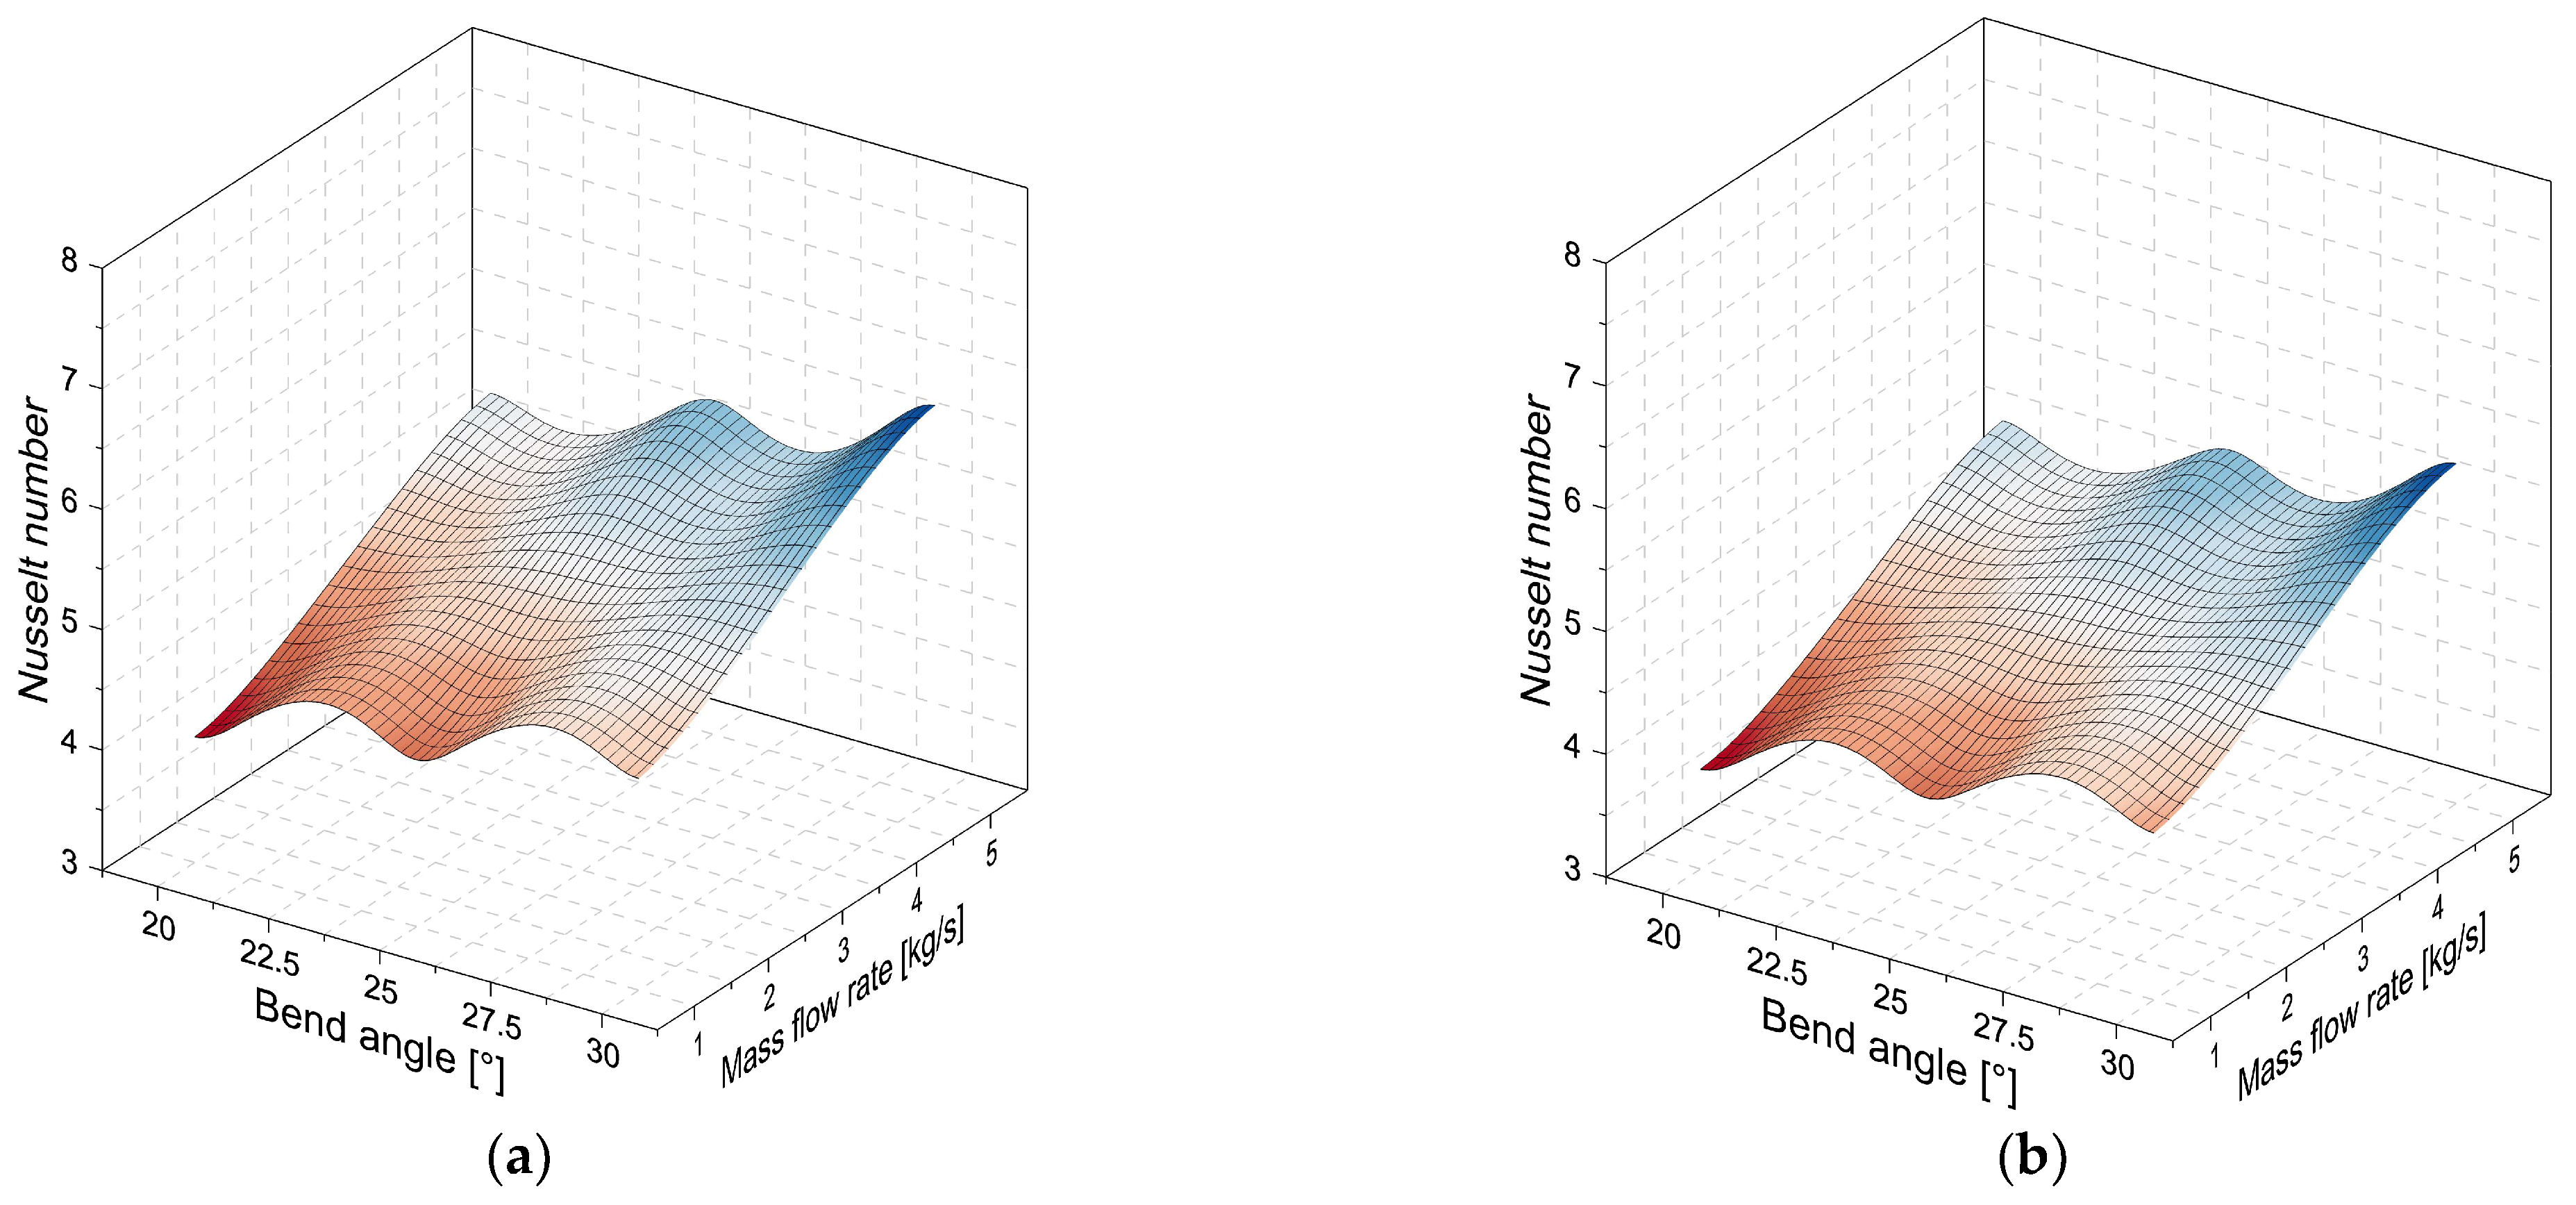
Additionally, the bend angle also influences the heat transfer process. To analyze this effect, the change in the Nusselt number was evaluated for the different angles of curvature. The results obtained are shown in Figure 15.
The results of Figure 15 show that the Nusselt number increases in relationship between the mass flow increase and the greater inclination angle. This behavior was obtained for the two-channel configurations. In general, a 5° increase in the bend angle causes 10% and 8% increases in the Nusselt number for the conventional zig-zag channel and the modified zig-zag channel, respectively.

4.3. Heat Transfer Analysis

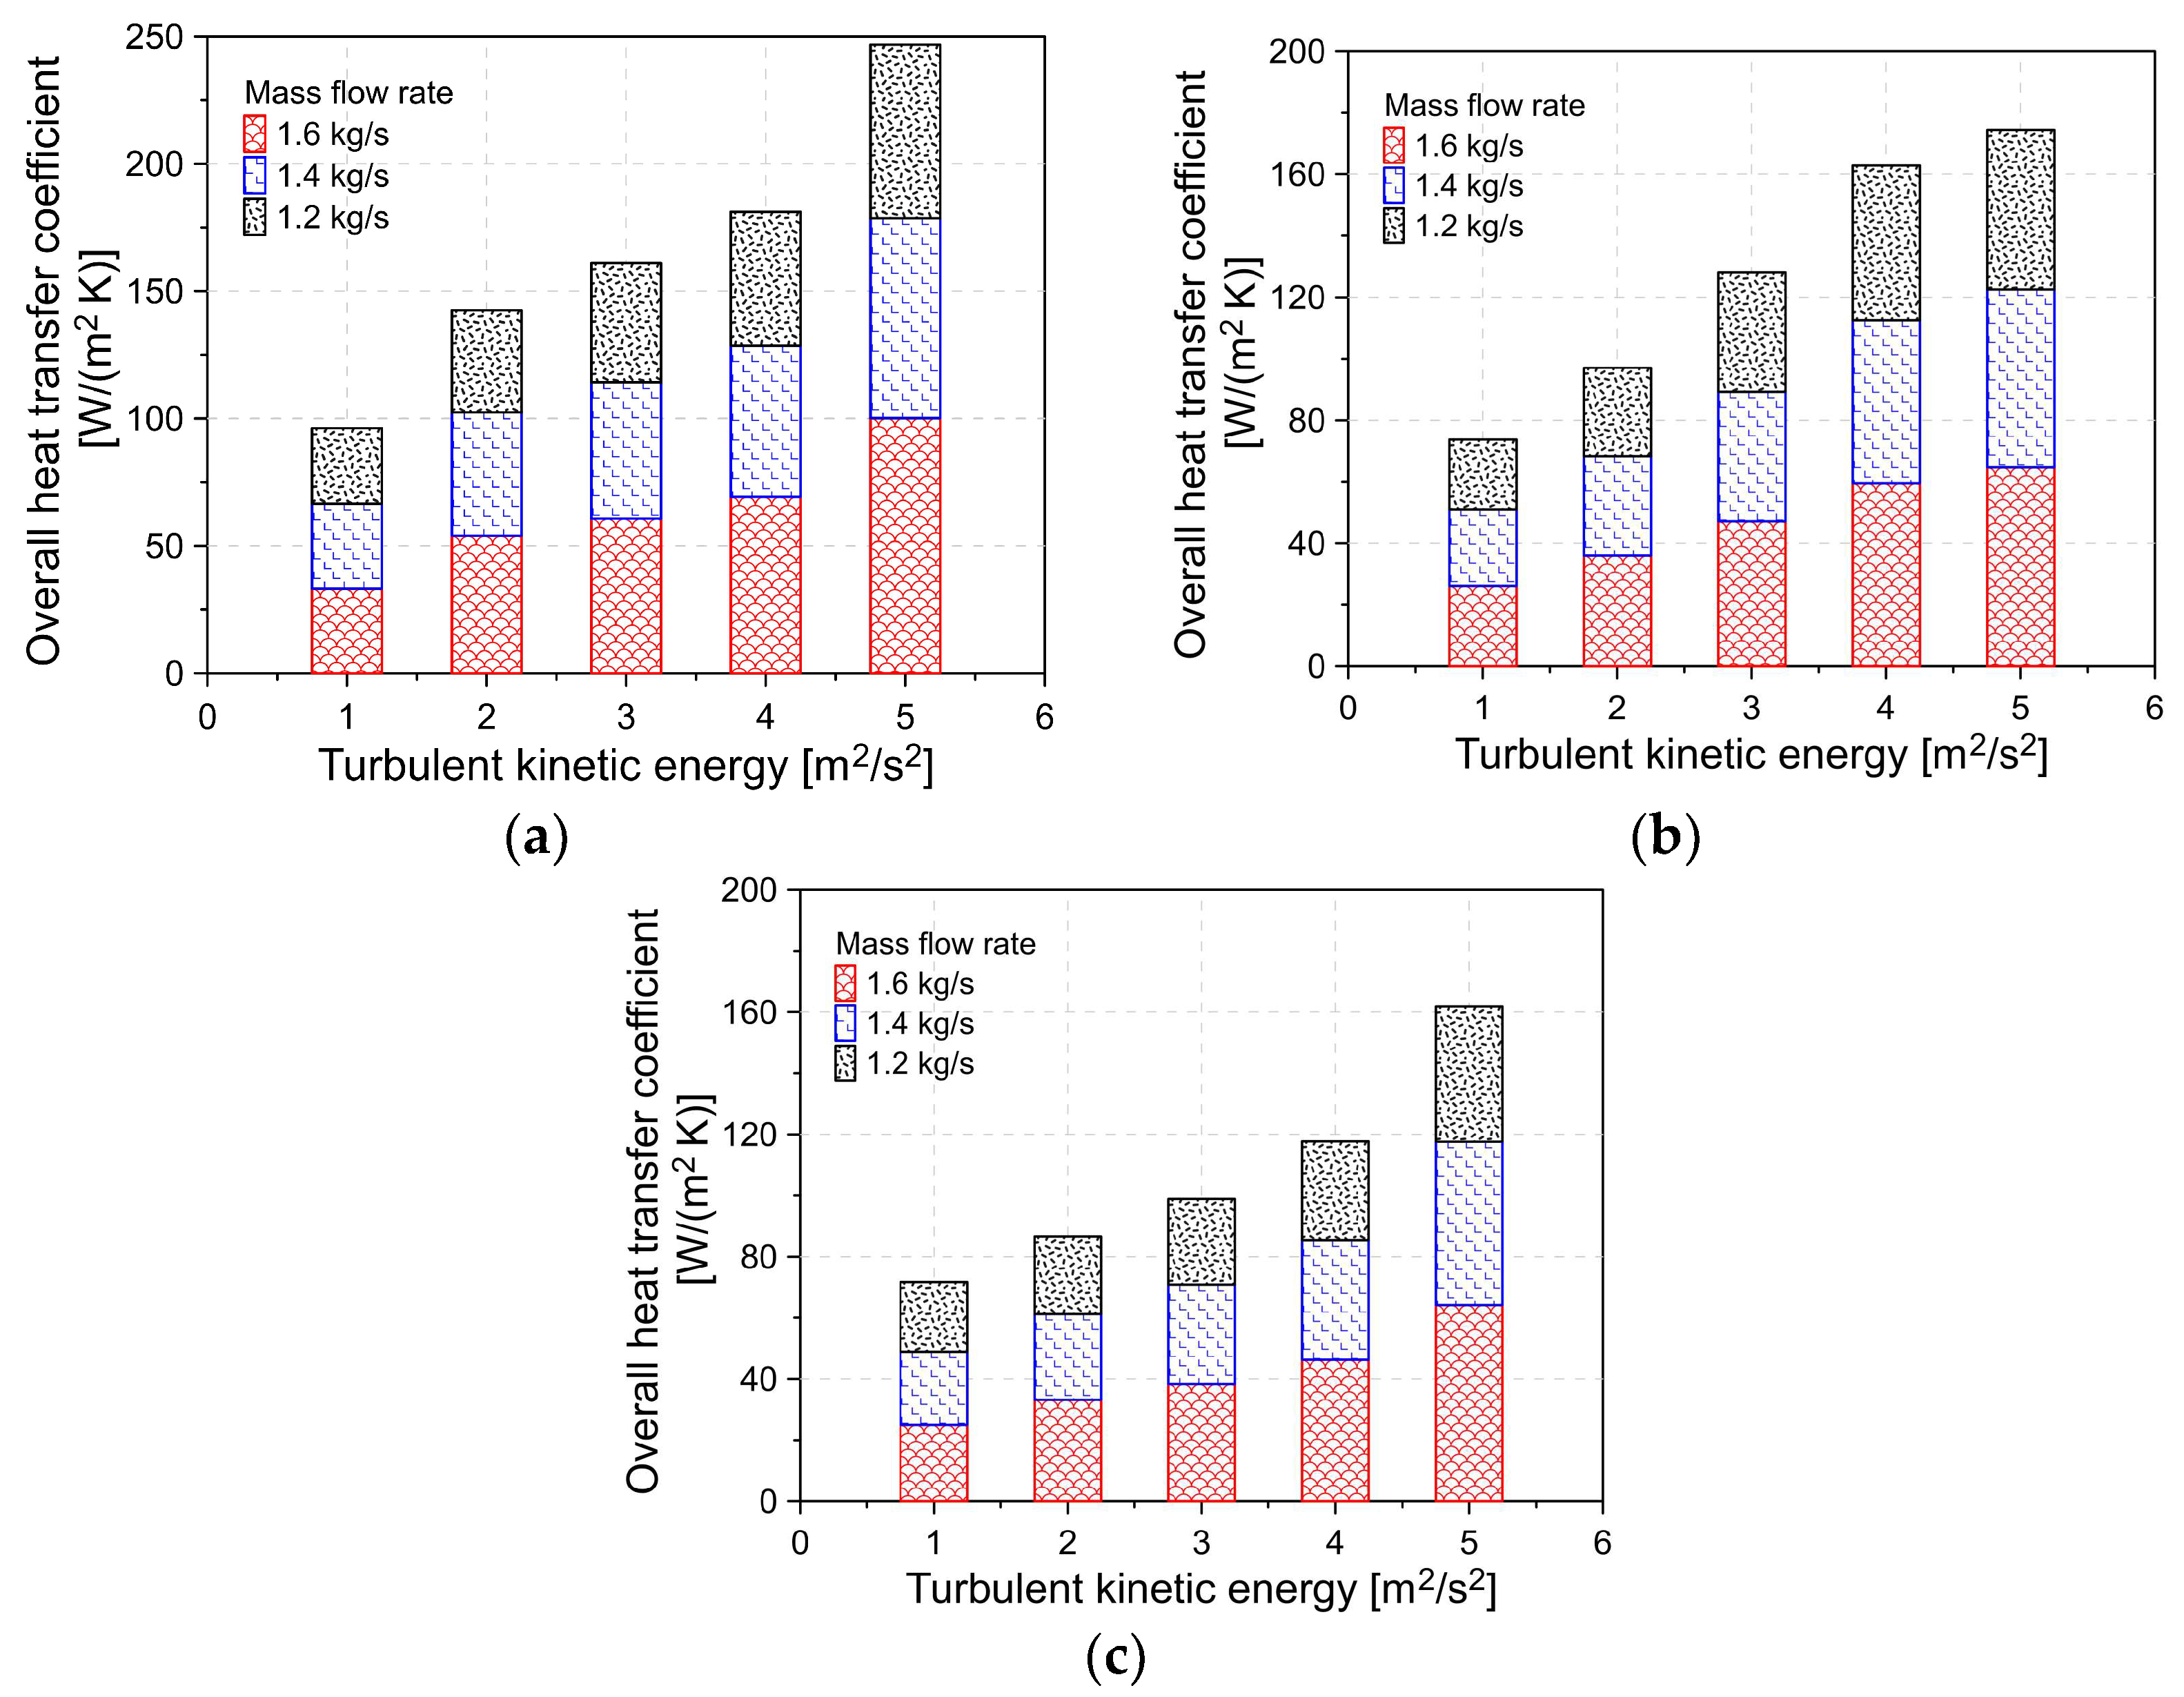
Figure 16 shows each channel configuration’s overall heat transfer coefficient (UA).
According to the results of Figure 16, the conventional zig-zag channel configuration experiences the highest heat transfer coefficient values, followed by the modified zig-zag channel, and lastly, the straight channel configurations. Moreover, it can be verified that higher mass flow rates contribute to increasing the heat transfer coefficient to 5–10% within the configurations.

4.4. Effect of PCHE Designs on the Supercritical CO2 Brayton Cycle

To analyze the influence of the different channel configurations in the PCHE on the performance parameters of the complete cycle, a Brayton cycle of recompression supercritical carbon dioxide (sCO2-BC) is designed, which is shown in Figure 17.
The sCO2-BC consists of the main compressor, recompressor, turbine, heater, precooler, high-temperature recuperator (HTR), and low-temperature recuperator (LTR). The outflow from the precooler is compressed in the main compressor (stage 1–stage 2) and then heated in the LTR (stage 2–stage 3). Subsequently, the flow is mixed with the flow coming from the recompressor. The mixed flow is heated as it passes through the HTR (stage 5–stage 6), and then undergoes more heating as it passes through the main heater (stage 6–stage 7). The working flow is expanded in the turbine (stage 7–stage 8). After the expansion process, the flow still has a high temperature, which is exploited by the HTR (stage 8–stage 9) and LTR (stage 9–stage 10). Subsequently, the working flow is split, a fraction of the flow is directed to the precooler (stage 10–stage 10a), and the rest of it is directed to the recompressor (stage 10–stage 10b). After recompression (stage 10b–stage 4), the flow is again combined, continuing the cycle. The HTR and LTR are modeled as the conventional zig-zag channel, modified zig-zag channel, and straight channel Printed Circuit Heat Exchangers.
Figure 18 shows the specific work by the main compressor, the recompressor, and the compression system in sCO2-BC.
The results show an increase in the specific work by the two compressors of the Brayton cycle: the main compressor and recompressor, when the Printed Circuit Heat Exchangers use a conventional zig-zag channel and modified zig-zag channel configurations compared to that of the straight channel, respectively. This behavior is associated with the higher hydraulic losses in the working flow due to the high-pressure drop of the conventional zig-zag channel and modified zig-zag channel configurations. For the simulated conditions, it is observed that the conventional zig-zag channel and modified zig-zag channel configurations in the PCHE cause increases of 3.5%, and 2.1% in the specific work of the main compressor, as well as increases of 3.3%, and 1.6% in the recompressor, respectively. This leads to increases of 3.4% and 1.9% in the specific work with the Brayton cycle compression equipment, respectively.
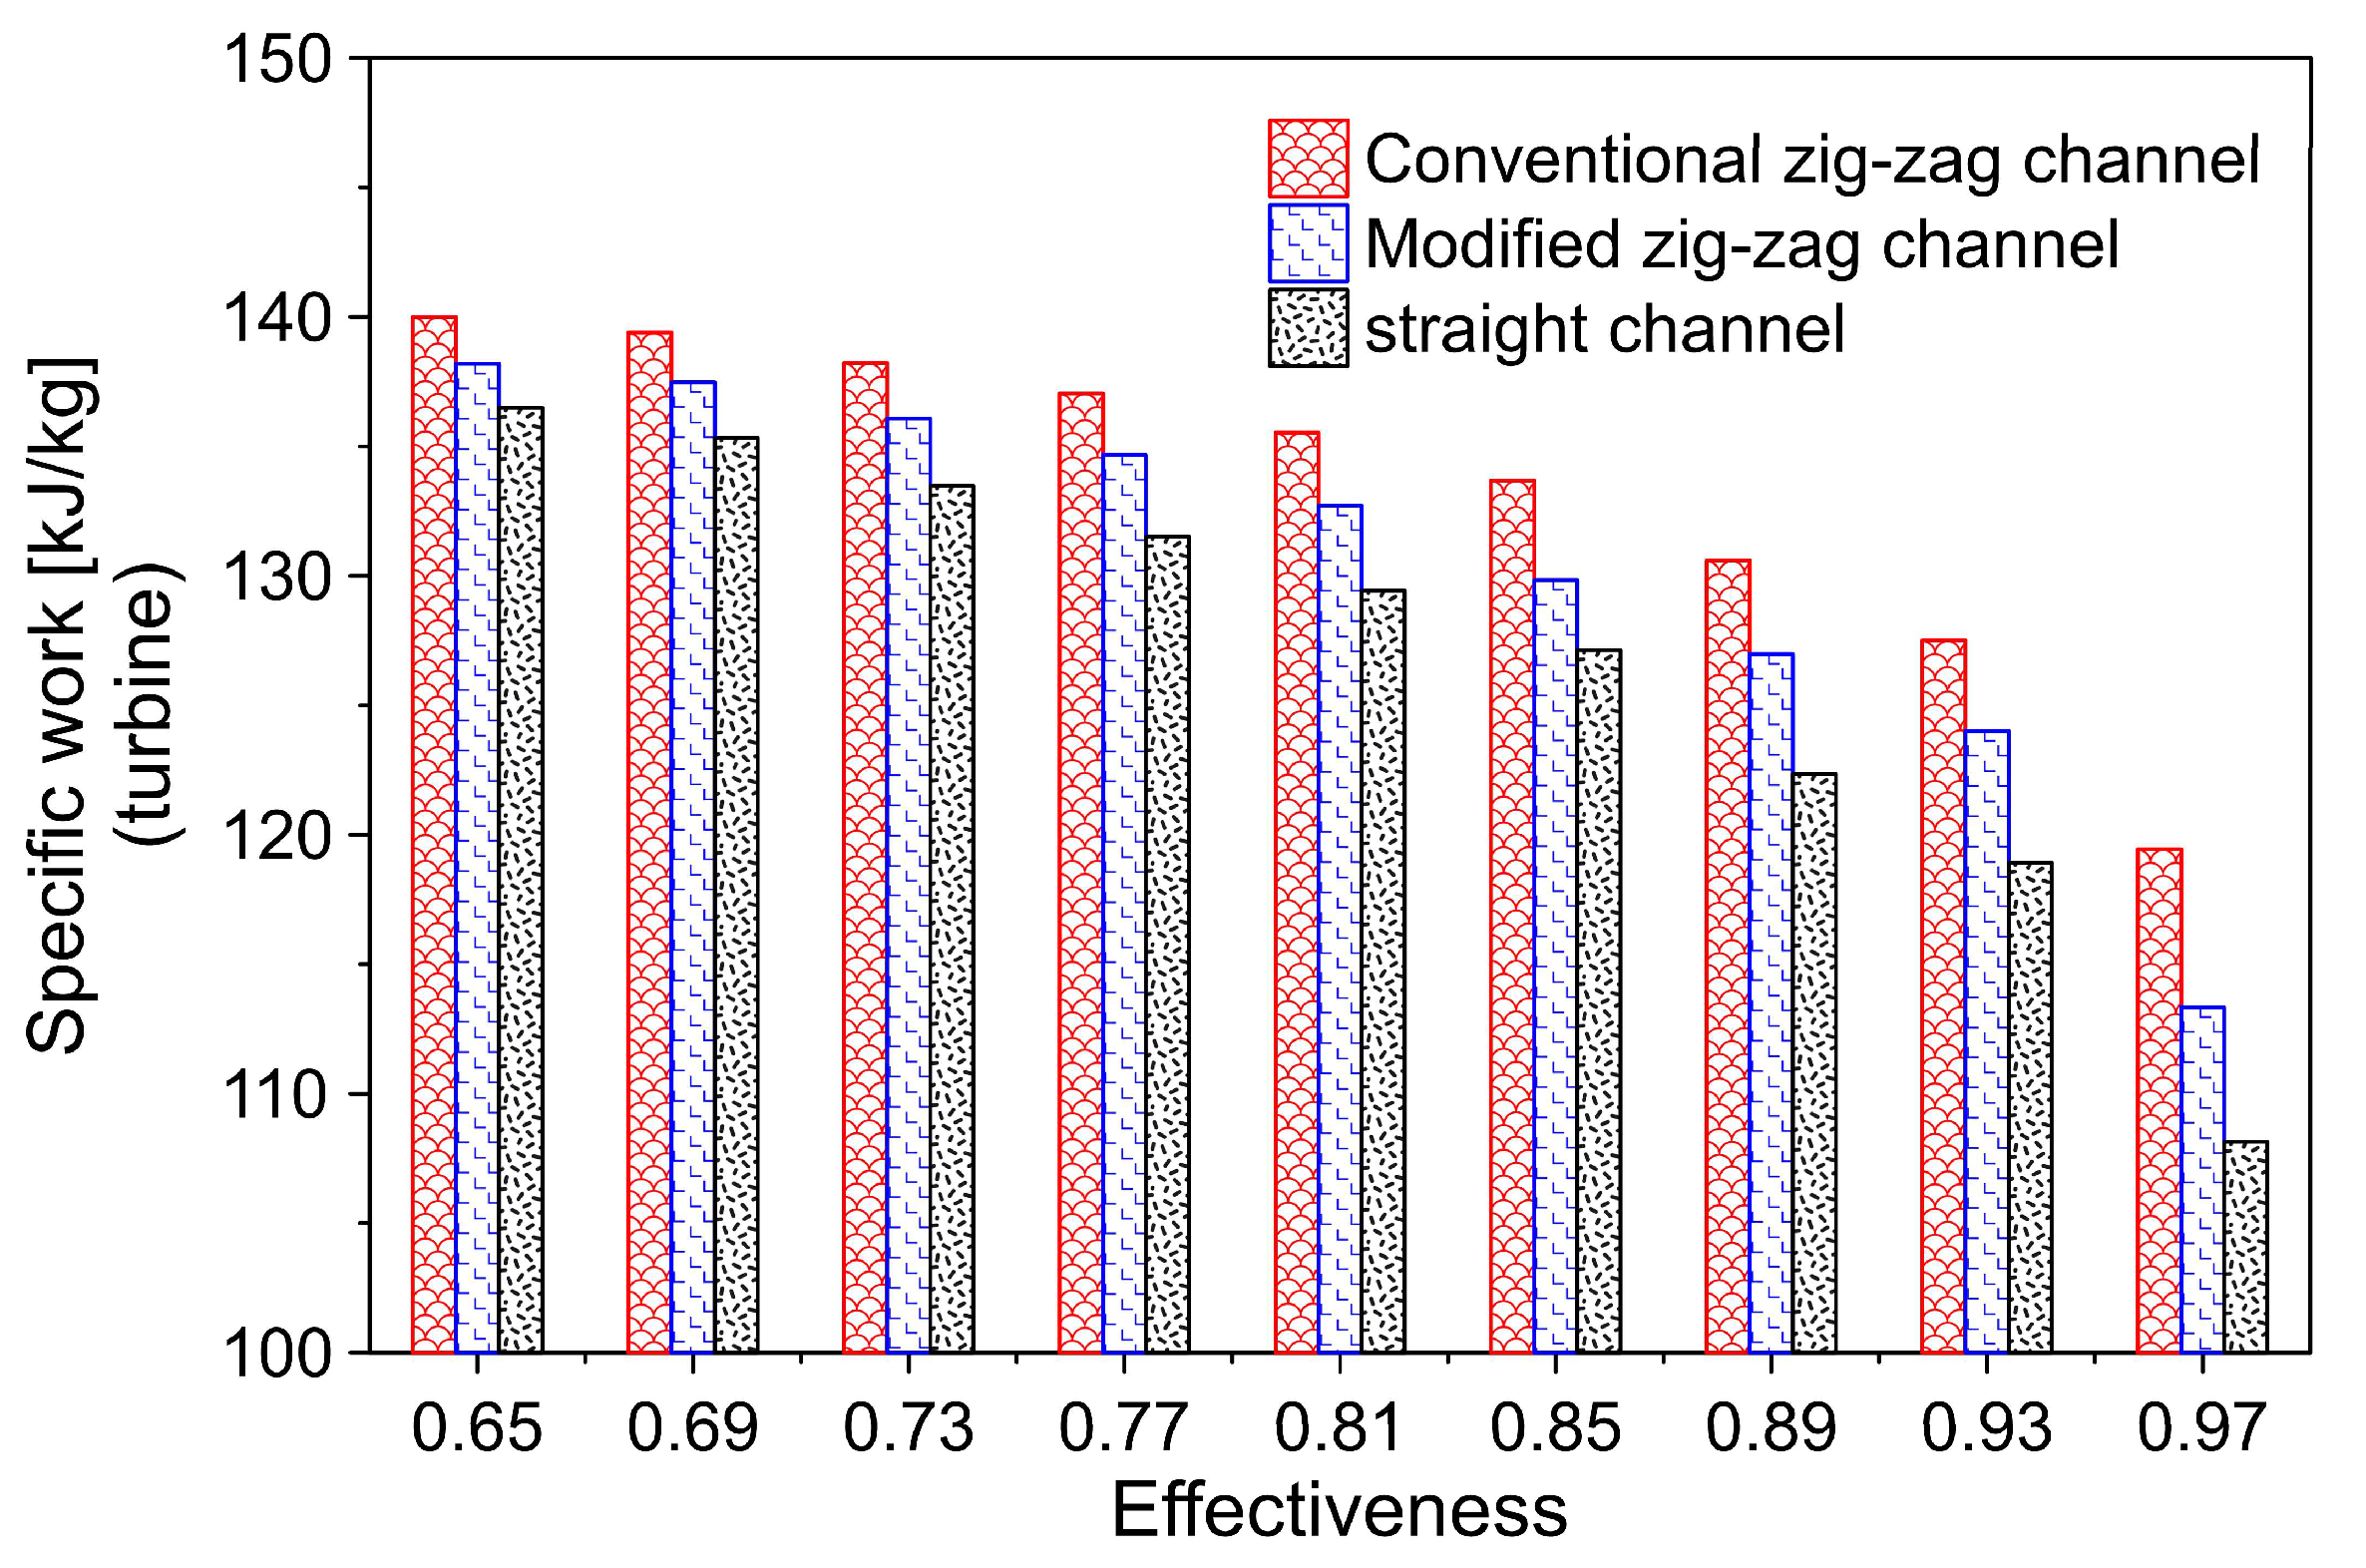
Although the conventional zig-zag channel and the modified zig-zag channel in the PCHE generate an increase in the consumption of the sCO2-BC compression system, the higher heat transfer capacity of these configurations results in increased turbine specific work, as shown in Figure 19. The results obtained show that the conventional zig-zag channel and the modified zig-zag channel configurations result in increases of 5.3% and 2.7% in the power output of the sCO2-BC, respectively, compared to that of the straight channel.
The overall efficiency of the recompression supercritical carbon dioxide Brayton cycle is shown in Figure 20 for a heat exchanger effectiveness range of 0.65–0.97 and with the different channel configurations.
The results obtained in Figure 20 indicate that the highest sCO2-BC cycle efficiency is achieved with the modified zig-zag channel configuration, followed by the conventional zig-zag channel and the straight channel, respectively. In all three channel configurations, a significant reduction of cycle efficiency is evident for heat exchanger effectiveness values greater than 0.93.
In general, the conventional zig-zag and modified zig-zag channels show increases of 1.9% and 3.1% in sCO2-BC cycle efficiency, respectively, compared to that of the straight channel. Additionally, maximum efficiency values of 49.1%, 48.4%, and 47% are observed for the modified zig-zag channel, the conventional zig-zag channel, and the straight channel, respectively. The above results are attributed to the better balance between the pressure drop and heat transfer capacity of the PCHE with the modified zig-zag channel compared to that of the other channel geometries.

4.5. Economic Analysis

The calculation of the capital and operating costs was carried out to analyze the economy of the PCHE under different geometric configurations in the channels. The capital cost C c is associated with manufacturing costs due to the volume and construction material of the PCHE. This cost was calculated from Equation (9) [46].
C c = c m × ρ × V × r × 1 + r N 1 + r N 1
where V is the volume of the PCHE, ρ is the density of the PCHE, c m is the cost per unit mass depending on the material, r is the interest rate, and N is the lifetime, respectively. The operating cost C p is associated with the pumping work due to the pressure drop in the PCHE, which was calculated using Equation (10).
C p = c p u m p × Δ P × V ˙
where c p u m p is the operating cost per pumping work, Δ P is the pressure drop in the PCHE, and V ˙ is the flow rate, respectively. The total cost C T was calculated from the sum of the capital cost C c and operating cost C p with Equation (11).
C T = C c + C p
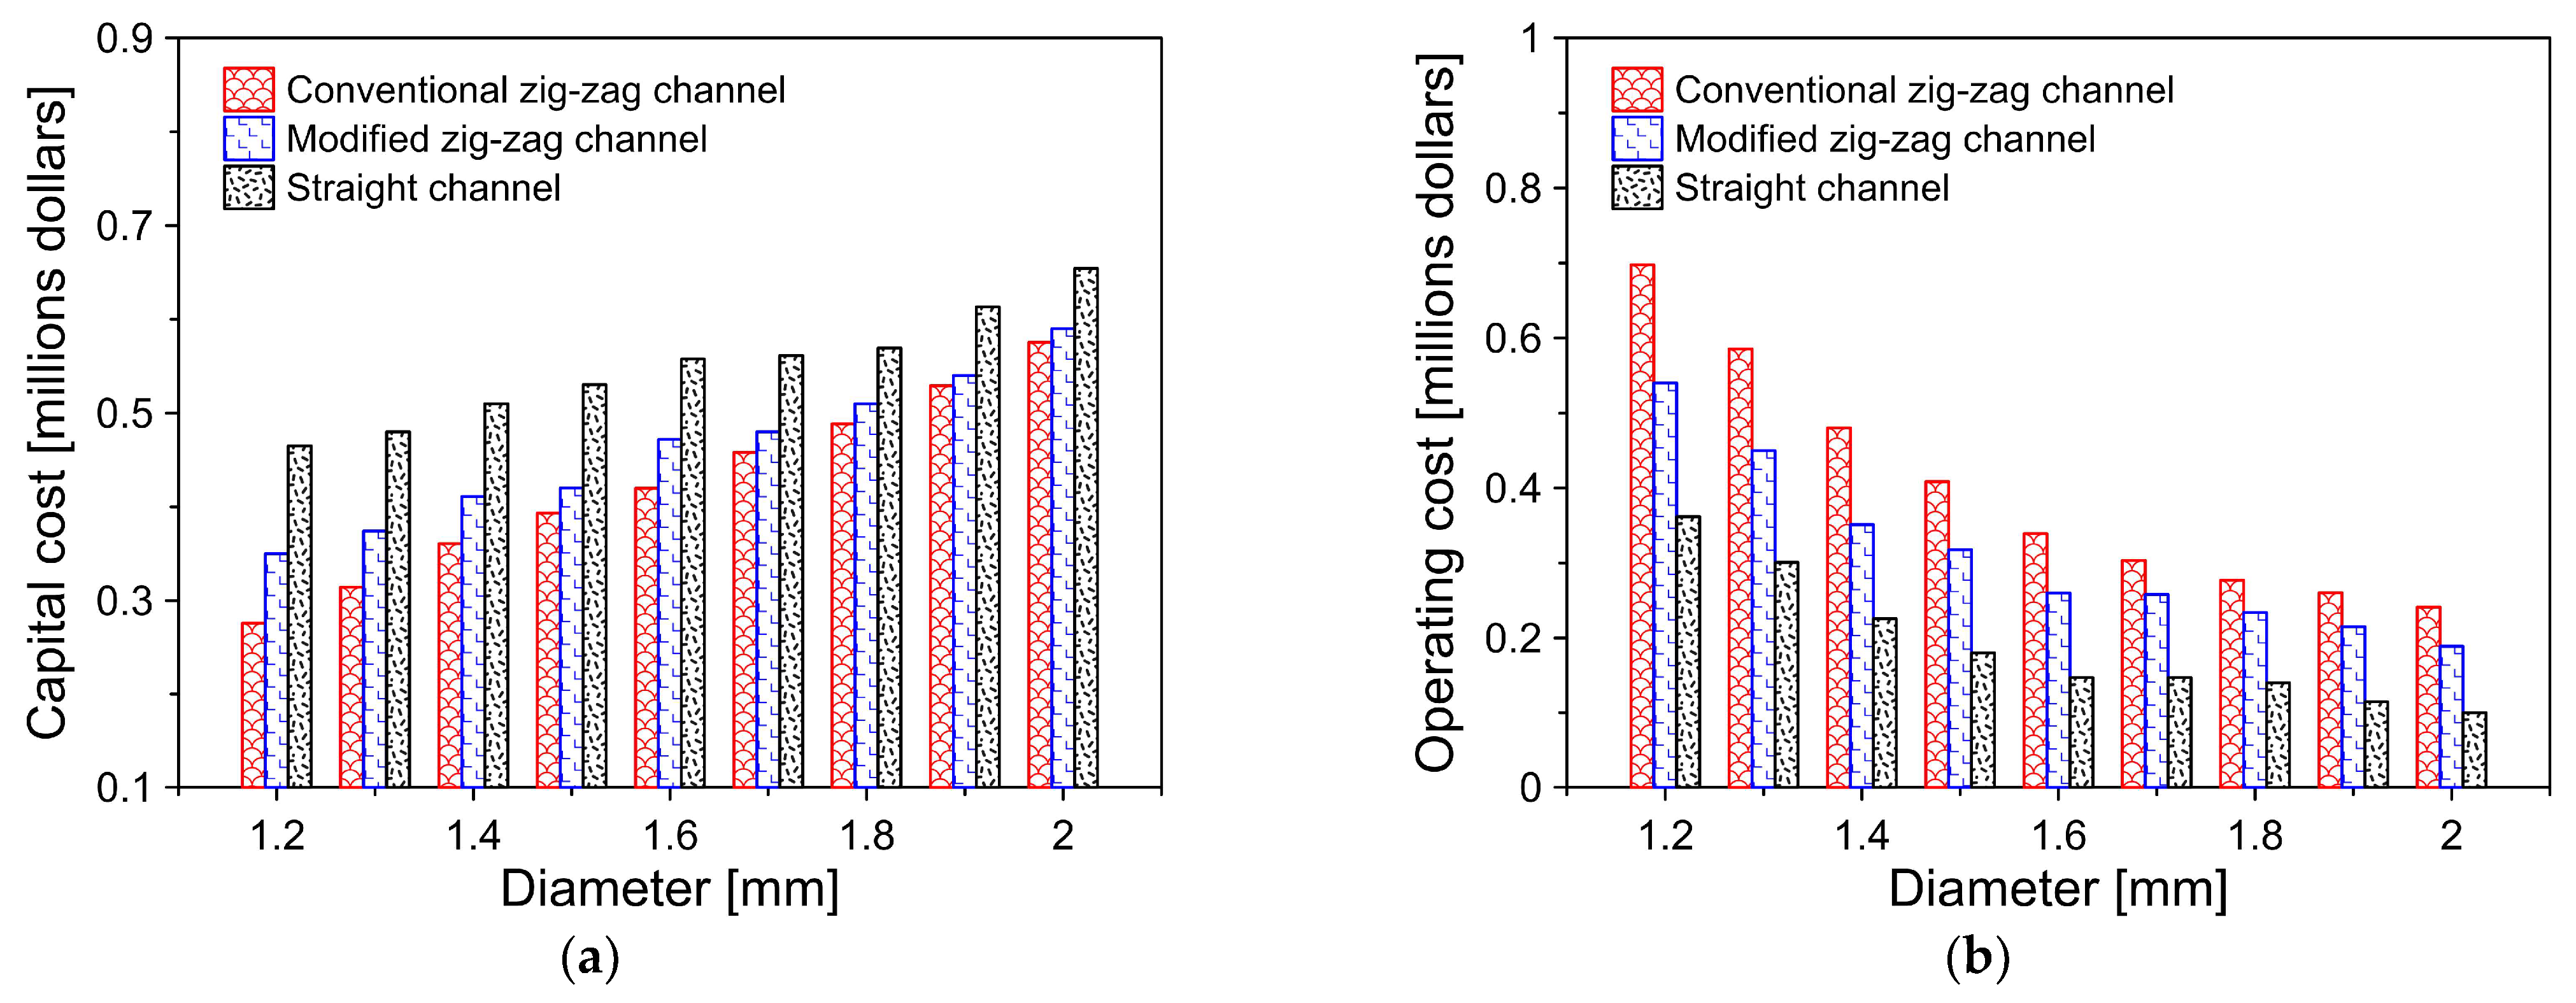
Figure 21 shows the analysis of the costs of the different channel configurations in relation to the tube diameter.
The results in Figure 21 show that the capital costs in the modified zig-zag channel increase 10.3% compared to those of the conventional zig-zag channel, which is a consequence of the greater complexity of the geometric characteristics of the channel. However, due to the reduced pumping work in the modified zig-zag channel, a 20.9% reduction of the operating costs is achieved. This leads to a 5.9% decrease in the cost associated with using the PCHE in the supercritical Brayton cycles compared to that of the conventional zig-zag channel.

4.6. Analysis of Geometric Parameters

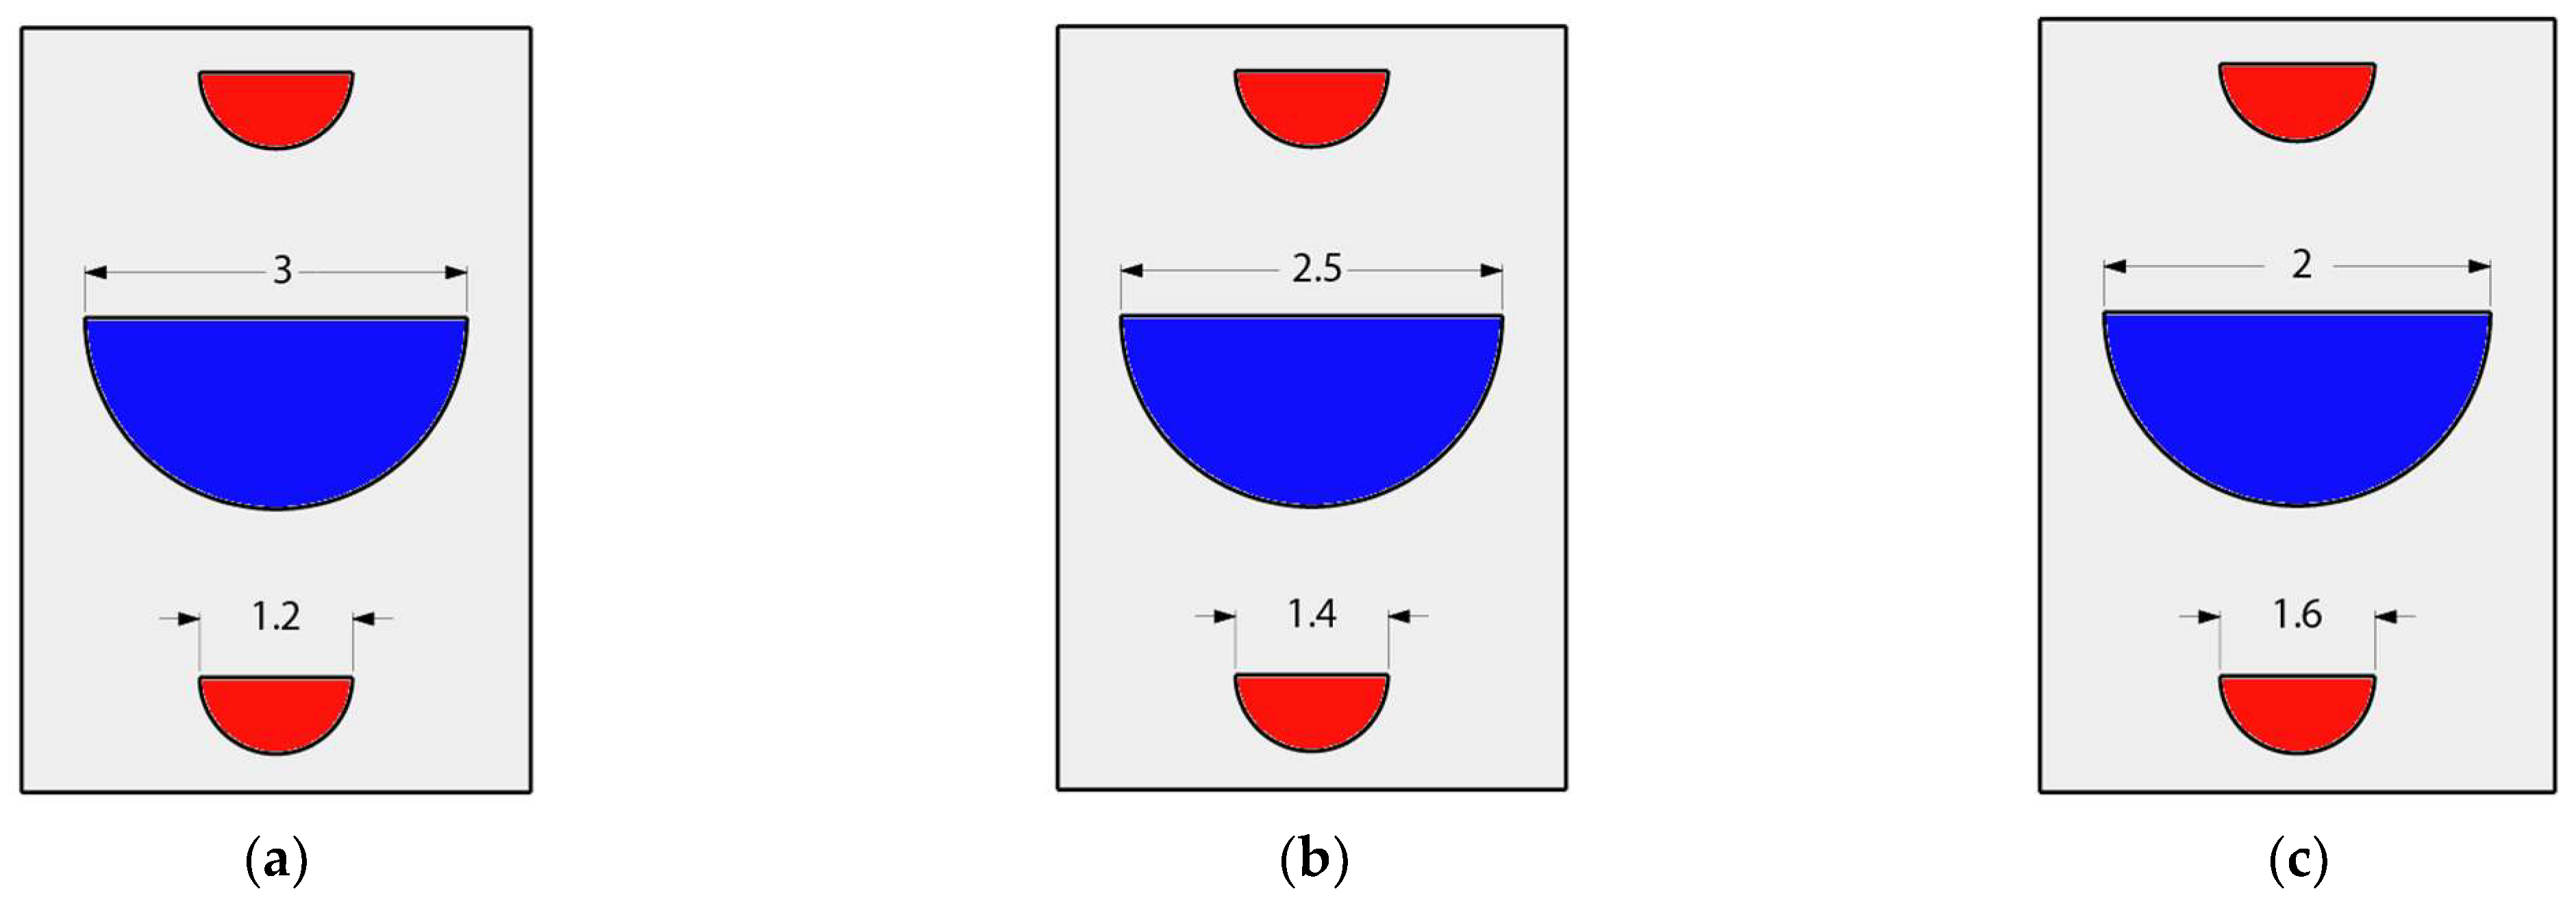
The analysis carried out in Section 4.1 shows that the modified zig-zag channel presents the best thermo-hydraulic performance due to the higher TPF values compared to that of the conventional zig-zag channel. Therefore, in this section, an optimization analysis of geometric patterns and an economic study are carried out, taking as the configuration of the modified zig-zag channel as a reference. The main objective of the numerical optimization is to analyze the influence of geometry patterns of the semi-circular diameter on the overall performance and total cost of the PCHE block [47]. Accordingly, Figure 22 shows the main modifications proposed for hot and cold modified zig-zag channel of the PCHE block, where the length of the channel remains unchanged from the previous domain, which corresponds to 846 mm.
Compressible and critical flow conditions are necessary to simulate the main fluctuations of the turbulent flow under different pressure values, which influence the flow velocity, and heat transfer coefficient of the working fluid under real working conditions. Figure 23 shows the results for each study case proposed for the modified zig-zag channel block, which relates the temperature, pressure drop, and turbulent kinetic energy in the PCHE.
According to the results, the fanning factor had an inverse correlation with the Reynolds number, whereas the Nusselt number increases proportionally as the Reynolds number increases. Note that the Nusselt number is calculated as a function of both the Reynolds and Prandtl numbers, while the fanning factor only depends on the Reynolds number. The results are in agreement with the overall behavior of previous CFD studies [27,48,49]. Case 1 experiences the highest friction interactions from the cases analyzed, and accordingly, the greatest Nusselt number, which relates to the temperature gradient that contributes to the heat transfer phenomena. On the contrary, case 2 remains at an intermediate level for both operational parameters, which can be positive, as it enhanced the heat transfer coefficient by the increased Nusselt number, while minimizing the undesired effects of high frictional losses within the channels that influence the swirl and reversed flow.
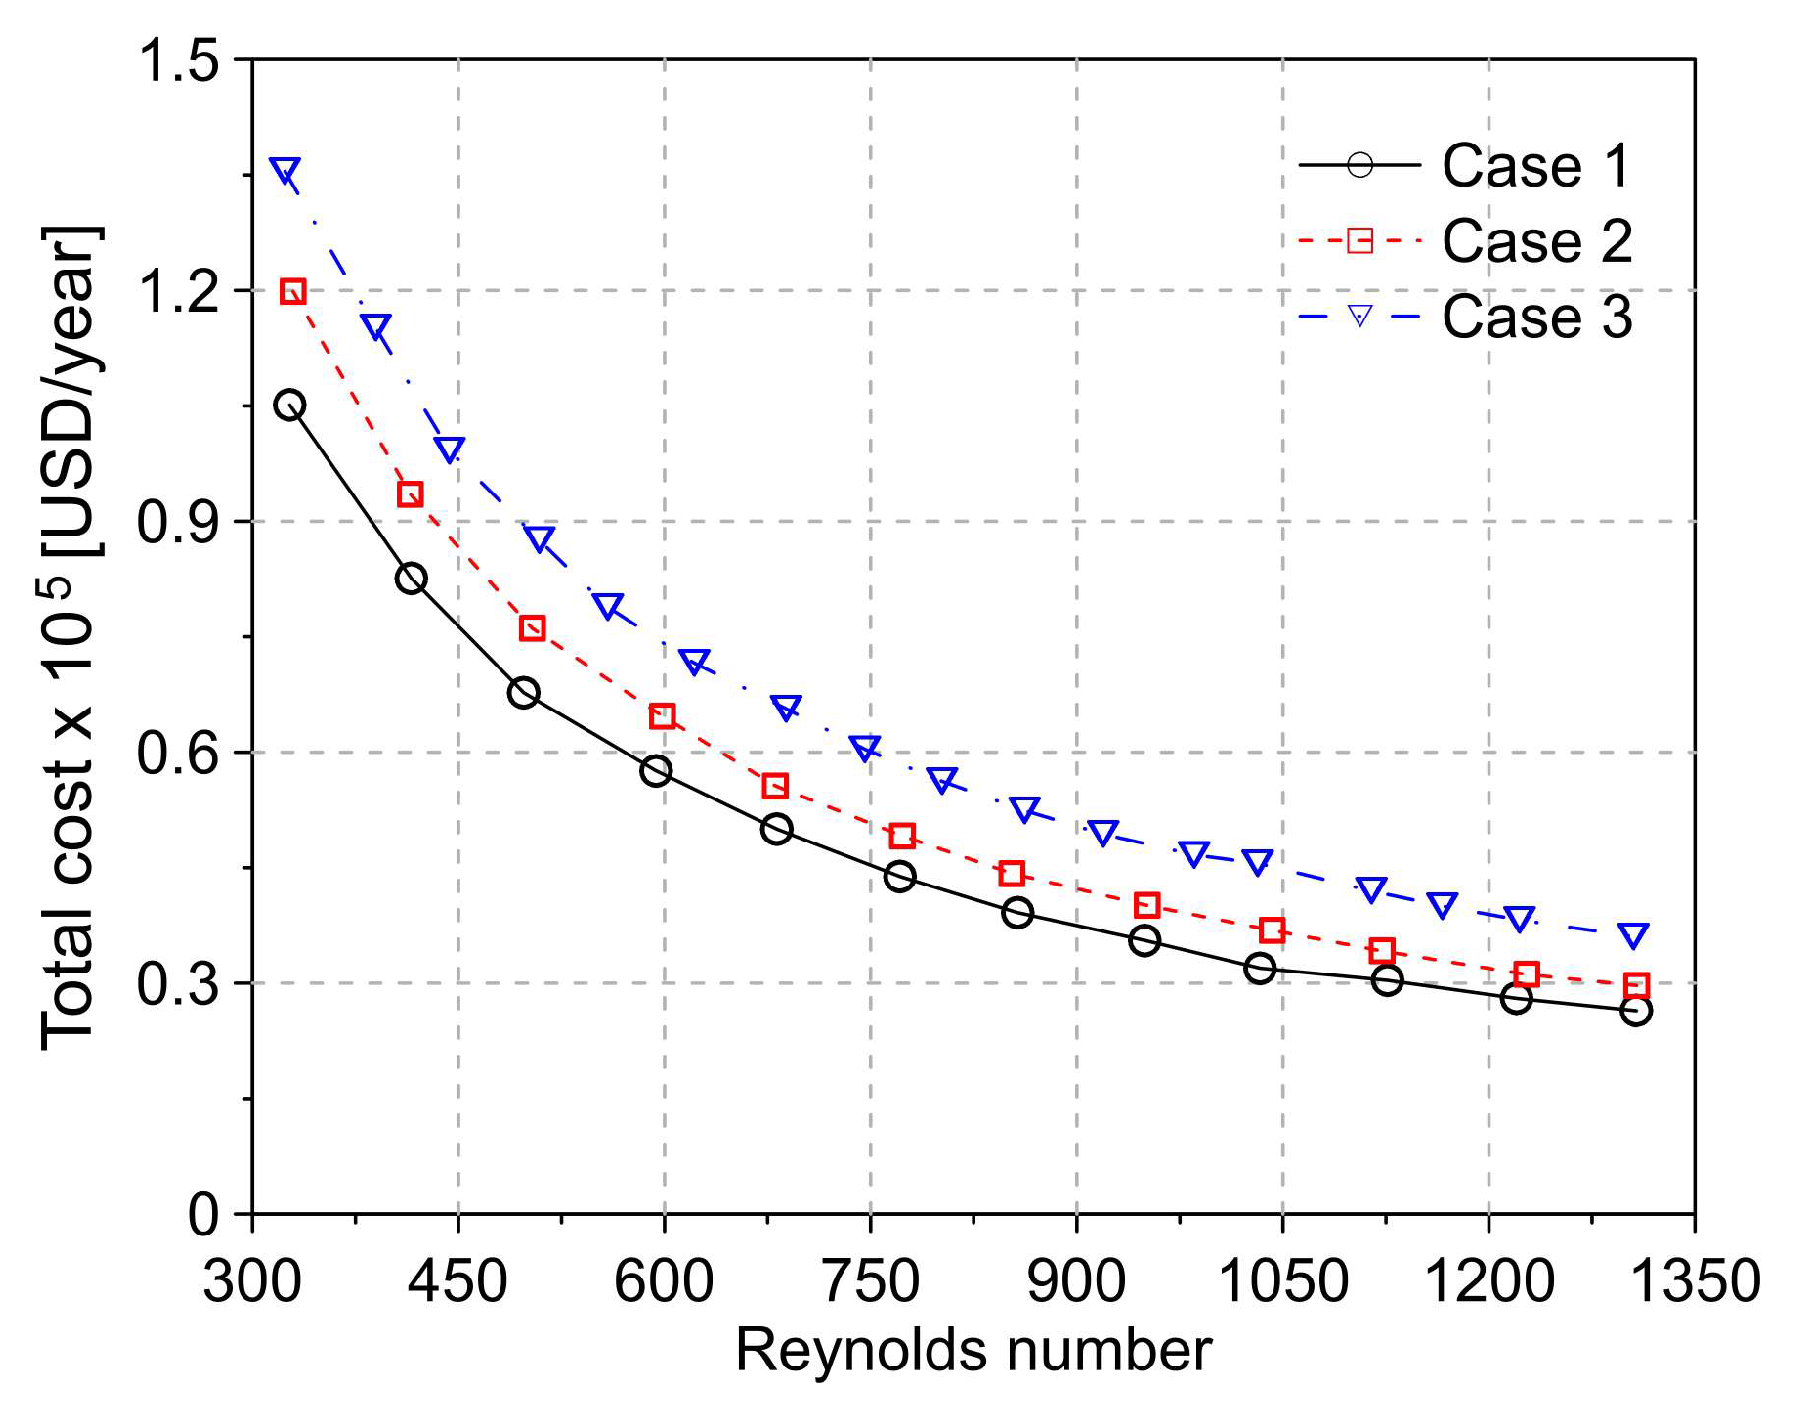
The section concludes with the economic assessment presented in Figure 24, which shows the contribution of the geometry patterns of each study case and the Reynolds number on the total cost of the PCHE.
Figure 24 shows that the Reynolds number displays an inverse correlation with the total cost per year of the PCHE, which agrees with the findings of the optimization study of Kim et al. [48]. Thus, the turbulent flow and reduced cross-sectional diameter significantly reduce the PCHE cost. In this sense, case 1 features the lowest overall cost share. However, as the flow becomes turbulent, the cost differential between case 1 and case 2 becomes insubstantial. Therefore, considering the improved performance of the latter one from the previous section and the allocation of the total cost, it can be concluded that the optimal performance from a thermal hydraulic and economic viewpoint is found using this geometry array for the modified zig-zag channel configuration.

5. Conclusions

The present study aimed to analyze the operating parameters describing the overall performance of the PCHE when they are integrated into a supercritical CO2 Brayton cycle by CFD analysis using OpenFOAM. The study proposes a new geometric modification for the zig-zag channel, which is based on the characteristics of the conventional zig-zag channel and the straight channel.
The results show that the conventional zig-zag channel has the highest heat capacity, which is evidenced by 28% and 53% increases in the heat transfer coefficient compared to those of the modified zig-zag channel and the straight channel, respectively. Despite the high heat transfer capacity of the conventional zig-zag channel, it is observed that this type of geometry leads to a bigger pressure drop. However, the proposed new geometry for the zig-zag channel causes a 50% reduction of the pressure drop. In general, the proposed new geometry results in a decrease in the formation of vortices and turbulence in the fluid due to less abrupt changes in the flow direction compared to that of the conventional zig-zag channel.
The proposed new channel geometry allows a 7.6% increase in TPF compared to that of the conventional zig-zag channel, implying a better thermo-hydraulic performance. Additionally, the geometric optimization process in the modified zig-zag channel results in a 3.2% increase in the low temperature and a 71.7% reduction of the pressure drop.
The modified zig-zag channel proposed in the research results in a 1.5% reduction of the energy consumption of the Brayton cycle supercritical compression equipment compared to that of the conventional zig-zag channel. This caused an improvement in the overall cycle efficiency in terms of 1.45% and 5.9% decreases in the total cost associated with the use of the PCHE compared to that of the conventional zig-zag channel.
In general, the new geometric features proposed for the conventional zig-zag flume favor the hydraulic performance of the PCHE without significantly compromising the heat transfer capacity. The modified zig-zag channel improves the overall efficiency of supercritical Brayton cycles, leading to a 20.9% decrease in the operating costs. Future research will focus on the geometrical optimization of the modified zig-zag channel, taking into account all the geometrical parameters characteristics of the structure of this type of channel.

Author Contributions

D.V.-C.: Methodology and Formal analysis. J.D.-F.: Conceptualization, Methodology, Software, Validation, Formal analysis, Investigation, and Writing—Original Draft Preparation. G.V.-O.: Methodology, Formal analysis, Investigation, Resources, Writing—Review and Editing, and Funding acquisition. All authors have read and agreed to the published version of the manuscript.

Funding

This research was supported by the Universidad Francisco de Paula Santander located in Cúcuta, Colombia and the Universidad del Atlántico located in Barranquilla, Colombia.

Data Availability Statement

Data is contained within the article.

Acknowledgments

The authors would like to acknowledge the Universidad del Atlántico for their support in developing this research. Likewise, the support of Engineer Daniel Maestre, Natalia Vasco, Julian Mendivil, and Jose Sanchez in the CAD design is acknowledged.

Conflicts of Interest

The authors declare no conflict of interest.

Nomenclature

CFDComputational fluid dynamics
CSPConcentrated Solar Power
TEGThermoelectric Generator
WHRWaste Heat Recovery
PCHEPrinted Circuit Heat Exchanger
sCO2Supercritical carbon dioxide
TPFThermal performance factor
N u s Nusselt number
C c Capital cost
V Volume
c m Cost per unit mass
r Interest rate
N Lifetime
C p Operating cost
c p u m p Operating cost per pumping work
Δ P Pressure drop
V ˙ Flow rate
C T Total cost
p Pressure
T Temperature
u Velocity
c p Specific heat
h Enthalpy
Greek symbol
ρ Density
f s Friction factor
τ i j Viscous stress tensor
μ Dynamic viscosity
λ Thermal conductivity

References

  1. Estrada, L.; Moreno, E.; Gonzalez-Quiroga, A.; Bula, A.; Duarte-Forero, J. Experimental assessment of performance and emissions for hydrogen-diesel dual fuel operation in a low displacement compression ignition engine. Heliyon 2022, 8, e09285. [Google Scholar] [CrossRef]
  2. Duarte-Forero, J.; Mendoza-Casseres, D.; Valencia-Ochoa, G. Energy, Exergy, and emissions (3E) assessment of a low-displacement engine powered by biodiesel blends of palm oil mill effluent (POME) and hydroxy gas. Therm. Sci. Eng. Prog. 2021, 26, 101126. [Google Scholar] [CrossRef]
  3. Espinel Blanco, E.; Valencia Ochoa, G.; Duarte Forero, J. Thermodynamic, Exergy and Environmental Impact Assessment of SCO2 Brayton Cycle Coupled with ORC as Bottoming Cycle. Energies 2020, 13, 2259. [Google Scholar] [CrossRef]
  4. Vasquez, R.; Chean, Y.; Too, S.; Benito, R.; Stein, W. Exergetic analysis of supercritical CO2 Brayton cycles integrated with solar central receivers. Appl. Energy 2015, 148, 348–365. [Google Scholar]
  5. Valencia Ochoa, G.; Acevedo Peñaloza, C.; Duarte Forero, J. Thermo-Economic Assessment of a Gas Microturbine-Absorption Chiller Trigeneration System under Different Compressor Inlet Air Temperatures. Energies 2019, 12, 4643. [Google Scholar] [CrossRef] [Green Version]
  6. Peng, M.Y.-P.; Chen, C.; Peng, X.; Marefati, M. Energy and exergy analysis of a new combined concentrating solar collector, solid oxide fuel cell, and steam turbine CCHP system. Sustain. Energy Technol. Assess. 2020, 39, 100713. [Google Scholar] [CrossRef]
  7. Valencia Ochoa, G.; Piero Rojas, J.; Duarte Forero, J. Advance Exergo-Economic Analysis of a Waste Heat Recovery System Using ORC for a Bottoming Natural Gas Engine. Energies 2020, 13, 267. [Google Scholar] [CrossRef] [Green Version]
  8. Gholamian, E.; Ahmadi, P.; Hanafizadeh, P.; Ashjaee, M. Dynamic feasibility assessment and 3E analysis of a smart building energy system integrated with hybrid photovoltaic-thermal panels and energy storage. Sustain. Energy Technol. Assess. 2020, 42, 100835. [Google Scholar] [CrossRef]
  9. Diaz, G.A.; Forero, J.D.; Garcia, J.; Rincon, A.; Fontalvo, A.; Bula, A.; Padilla, R.V. Maximum Power From Fluid Flow by Applying the First and Second Laws of Thermodynamics. J. Energy Resour. Technol. 2017, 139, 032903. [Google Scholar] [CrossRef]
  10. Guillin-Estrada, W.; Maestre-Cambronel, D.; Bula-Silvera, A.; Gonzalez-Quiroga, A.; Duarte-Forero, J. Combustion and Performance Evaluation of a Spark Ignition Engine Operating with Acetone–Butanol–Ethanol and Hydroxy. Appl. Sci. 2021, 11, 5282. [Google Scholar] [CrossRef]
  11. Duarte, N.; Arango, D.; Polanco, G.; Valencia, G.; Duarte-Forero, J. Experimental evaluation of low-displacement compression ignited engines operating with hydroxy gas as a supplementary gaseous fuel. Heliyon 2022, 8, e11545. [Google Scholar] [CrossRef]
  12. Marchionni, M.; Chai, L.; Bianchi, G.; Tassou, S.A. Numerical modelling and transient analysis of a printed circuit heat exchanger used as recuperator for supercritical CO2 heat to power conversion systems. Appl. Therm. Eng. 2019, 161, 114190. [Google Scholar] [CrossRef]
  13. Park, J.H.; Kwon, J.G.; Kim, T.H.; Kim, M.H.; Cha, J.-E.; Jo, H. Experimental study of a straight channel printed circuit heat exchanger on supercritical CO2 near the critical point with water cooling. Int. J. Heat Mass Transf. 2020, 150, 119364. [Google Scholar] [CrossRef]
  14. Sanaye, S.; Khakpaay, N.; Chitsaz, A. Thermo-economic and environmental multi-objective optimization of a novel arranged biomass-fueled gas engine and backpressure steam turbine combined system for pulp and paper mills. Sustain. Energy Technol. Assess. 2020, 40, 100778. [Google Scholar] [CrossRef]
  15. Jing, Q.; Xie, Y.; Zhang, D. Thermal hydraulic performance of printed circuit heat exchanger with various channel configurations and arc ribs for SCO2 Brayton cycle. Int. J. Heat Mass Transf. 2020, 150, 119272. [Google Scholar] [CrossRef]
  16. Duarte Forero, J.; Obregon, L.; Valencia, G. Comparative analysis of intelligence optimization algorithms in the thermo-economic performance of an energy recovery system based on Organic Rankine Cycle. J. Energy Resour. Technol. 2021, 1–18. [Google Scholar] [CrossRef]
  17. Stand, L.M.; Ochoa, G.V.; Forero, J.D. Energy and exergy assessment of a combined supercritical Brayton cycle-orc hybrid system using solar radiation and coconut shell biomass as energy source. Renew. Energy 2021, 175, 119–142. [Google Scholar] [CrossRef]
  18. Valencia Ochoa, G.; Acevedo Peñaloza, C.; Duarte Forero, J. Thermoeconomic Optimization with PSO Algorithm of Waste Heat Recovery Systems Based on Organic Rankine Cycle System for a Natural Gas Engine. Energies 2019, 12, 4165. [Google Scholar] [CrossRef] [Green Version]
  19. Herrera-Orozco, I.; Valencia-Ochoa, G.; Duarte-Forero, J. Exergo-environmental assessment and multi-objective optimization of waste heat recovery systems based on Organic Rankine cycle configurations. J. Clean. Prod. 2021, 288, 125679–125694. [Google Scholar] [CrossRef]
  20. Ochoa, G.V.; Prada, G.; Duarte-Forero, J. Carbon footprint analysis and advanced exergo-environmental modeling of a waste heat recovery system based on a recuperative organic Rankine cycle. J. Clean. Prod. 2020, 274, 122838–122857. [Google Scholar] [CrossRef]
  21. Valencia Ochoa, G.; Isaza-Roldan, C.; Forero, J.D. Economic and Exergo-Advance Analysis of a Waste Heat Recovery System Based on Regenerative Organic Rankine Cycle under Organic Fluids with Low Global Warming Potential. Energies 2020, 13, 1317. [Google Scholar] [CrossRef] [Green Version]
  22. Habibi, H.; Zoghi, M.; Chitsaz, A.; Javaherdeh, K.; Ayazpour, M.; Bellos, E. Working fluid selection for regenerative supercritical Brayton cycle combined with bottoming ORC driven by molten salt solar power tower using energy—exergy analysis. Sustain. Energy Technol. Assess. 2020, 39, 100699. [Google Scholar] [CrossRef]
  23. Jiang, Y.; Liese, E.; Zitney, S.E.; Bhattacharyya, D. Optimal design of microtube recuperators for an indirect supercritical carbon dioxide recompression closed Brayton cycle. Appl. Energy 2018, 216, 634–648. [Google Scholar] [CrossRef]
  24. Yang, D.; Khan, T.S.; Al-Hajri, E.; Ayub, Z.H.; Ayub, A.H. Geometric optimization of shell and tube heat exchanger with interstitial twisted tapes outside the tubes applying CFD techniques. Appl. Therm. Eng. 2019, 152, 559–572. [Google Scholar] [CrossRef]
  25. de la Torre, R.; François, J.-L.; Lin, C.-X. Assessment of the design effects on the structural performance of the Printed Circuit Heat Exchanger under very high temperature condition. Nucl. Eng. Des. 2020, 365, 110713. [Google Scholar] [CrossRef]
  26. Zhang, X.; Sun, X.; Christensen, R.; Anderson, M.; Carlson, M. Optimization of S-Shaped Fin Channels in a Printed Circuit Heat Exchanger for Supercritical CO2 Test Loop. In Proceedings of the 5th International Supercritical CO2 Power Cycles Symposium, San Antonio, TX, USA, 29–31 March 2016. [Google Scholar]
  27. Saeed, M.; Kim, M.H. Thermal and hydraulic performance of SCO2 PCHE with different fin configurations. Appl. Therm. Eng. 2017, 127, 975–985. [Google Scholar] [CrossRef]
  28. Ngo, T.L.; Kato, Y.; Nikitin, K.; Ishizuka, T. Heat transfer and pressure drop correlations of microchannel heat exchangers with S-shaped and zigzag fins for carbon dioxide cycles. Exp. Therm. Fluid Sci. 2007, 32, 560–570. [Google Scholar] [CrossRef]
  29. Yoon, S.H.; No, H.C.; Kang, G.B. Assessment of straight, zigzag, S-shape, and airfoil PCHEs for intermediate heat exchangers of HTGRs and SFRs. Nucl. Eng. Des. 2014, 270, 334–343. [Google Scholar] [CrossRef]
  30. Liu, G.; Huang, Y.; Wang, J.; Liu, R. A review on the thermal-hydraulic performance and optimization of printed circuit heat exchangers for supercritical CO2 in advanced nuclear power systems. Renew. Sustain. Energy Rev. 2020, 133, 110290. [Google Scholar] [CrossRef]
  31. Bone, V.; McNaughton, R.; Kearney, M.; Jahn, I. Methodology to develop off-design models of heat exchangers with non-ideal fluids. Appl. Therm. Eng. 2018, 145, 716–734. [Google Scholar] [CrossRef]
  32. Shin, C.W.; No, H.C. Experimental study for pressure drop and flow instability of two-phase flow in the PCHE-type steam generator for SMRs. Nucl. Eng. Des. 2017, 318, 109–118. [Google Scholar] [CrossRef]
  33. Chai, L.; Tassou, S.A. Numerical study of the thermohydraulic performance of printed circuit heat exchangers for supercritical CO2 Brayton cycle applications. Energy Procedia 2019, 161, 480–488. [Google Scholar] [CrossRef]
  34. Park, J.H.; Park, H.S.; Kwon, J.G.; Kim, T.H.; Kim, M.H. Optimization and thermodynamic analysis of supercritical CO2 Brayton recompression cycle for various small modular reactors. Energy 2018, 160, 520–535. [Google Scholar] [CrossRef]
  35. Zhao, Z.; Zhang, X.; Zhao, K.; Jiang, P.; Chen, Y. Numerical investigation on heat transfer and flow characteristics of supercritical nitrogen in a straight channel of printed circuit heat exchanger. Appl. Therm. Eng. 2017, 126, 717–729. [Google Scholar] [CrossRef]
  36. Li, X.L.; Tang, G.H.; Fan, Y.H.; Yang, D.L.; Wang, S.Q. Numerical analysis of slotted airfoil fins for printed circuit heat exchanger in SCO2 Brayton cycle. J. Nucl. Eng. Radiat. Sci. 2019, 5, 41303. [Google Scholar] [CrossRef]
  37. Wang, H.; Leung, L.K.H.; Wang, W.; Bi, Q. A review on recent heat transfer studies to supercritical pressure water in channels. Appl. Therm. Eng. 2018, 142, 573–596. [Google Scholar] [CrossRef]
  38. John, J.; Pane, E.A.; Suyitno, B.M.; Rahayu, G.H.N.N.; Rhakasywi, D.; Suwandi, A. Computational fluid dynamics simulation of the turbulence models in the tested section on wind tunnel. Ain Shams Eng. J. 2020, 11, 1201–1209. [Google Scholar]
  39. Djouimaa, S.; Messaoudi, L.; Giel, P.W. Transonic turbine blade loading calculations using different turbulence models—effects of reflecting and non-reflecting boundary conditions. Appl. Therm. Eng. 2007, 27, 779–787. [Google Scholar] [CrossRef]
  40. Lal, S.; Lucci, F.; Defraeye, T.; Poulikakos, L.D.; Partl, M.N.; Derome, D.; Carmeliet, J. CFD modeling of convective scalar transport in a macroporous material for drying applications. Int. J. Therm. Sci. 2018, 123, 86–98. [Google Scholar] [CrossRef]
  41. Jiao, Z.; Yuan, S.; Ji, C.; Mannan, M.S.; Wang, Q. Optimization of dilution ventilation layout design in confined environments using Computational Fluid Dynamics (CFD). J. Loss Prev. Process Ind. 2019, 60, 195–202. [Google Scholar] [CrossRef]
  42. Bennett, K.; Chen, Y. One-way coupled three-dimensional fluid-structure interaction analysis of zigzag-channel supercritical CO2 printed circuit heat exchangers. Nucl. Eng. Des. 2020, 358, 110434. [Google Scholar] [CrossRef]
  43. GNU; Lesser General Public License (LGPL). Salome. Available online: https://www.salome-platform.org/ (accessed on 25 January 2023).
  44. Bai, J.; Pan, J.; He, X.; Wang, K.; Tang, L.; Yang, R. Numerical investigation on thermal hydraulic performance of supercritical LNG in sinusoidal wavy channel based printed circuit vaporizer. Appl. Therm. Eng. 2020, 175, 115379. [Google Scholar] [CrossRef]
  45. Saeed, M.; Kim, M.-H. Thermal-hydraulic analysis of sinusoidal fin-based printed circuit heat exchangers for supercritical CO2 Brayton cycle. Energy Convers. Manag. 2019, 193, 124–139. [Google Scholar] [CrossRef]
  46. Thulukkanam, K. Heat Exchanger Design Handbook; CRC Press: Boca Raton, FL, USA, 2000. [Google Scholar]
  47. Abeykoon, C. Compact heat exchangers—Design and optimization with CFD. Int. J. Heat Mass Transf. 2020, 146, 118766. [Google Scholar] [CrossRef]
  48. Kim, I.H.; Zhang, X.; Christensen, R.; Sun, X. Design study and cost assessment of straight, zigzag, S-shape, and OSF PCHEs for a FLiNaK—SCO2 Secondary Heat Exchanger in FHRs. Ann. Nucl. Energy 2016, 94, 129–137. [Google Scholar] [CrossRef] [Green Version]
  49. Yang, Y.; Li, H.; Yao, M.; Gao, W.; Zhang, Y.; Zhang, L. Investigation on the effects of narrowed channel cross-sections on the heat transfer performance of a wavy-channeled PCHE. Int. J. Heat Mass Transf. 2019, 135, 33–43. [Google Scholar] [CrossRef]
Figure 1. Flow channel geometry: (a) conventional zig-zag channel; (b) straight channel; (c) modified zig-zag channel.
Energies 16 02326 g001
Figure 2. Boundary conditions.
Energies 16 02326 g002
Figure 3. Convergence criteria of turbulence models: (a) k ε , (b) R N G   k ε , and (c) S S T   k ω .
Energies 16 02326 g003aEnergies 16 02326 g003b
Figure 4. The structured mesh of the computational domain.
Energies 16 02326 g004
Figure 5. Scheme of operation of the PCHE equipment.
Energies 16 02326 g005
Figure 6. Numerical validation of the S S T   k ω model and thermodynamic model: (a) hot flow; (b) cold flow.
Energies 16 02326 g006
Figure 7. Pressure differential of PCHE blocks: (a) cold channel; (b) hot channel.
Energies 16 02326 g007aEnergies 16 02326 g007b
Figure 8. Friction factor for the different channel configurations: (a) cold channel; (b) hot channel.
Energies 16 02326 g008
Figure 9. Nusselt number for the different channel configurations: (a) cold channel; (b) hot channel.
Energies 16 02326 g009
Figure 10. Thermal performance factor for the different channel configurations: (a) cold channel; (b) hot channel.
Energies 16 02326 g010
Figure 11. Flow temperature values of PCHE blocks: (a) hot channel; (b) cold channel.
Energies 16 02326 g011
Figure 12. Bend angle for: (a) conventional zig-zag channel; (b) modified zig-zag channel.
Energies 16 02326 g012
Figure 13. Effect of bend angle on pressure drop: (a) conventional zig-zag channel; (b) modified zig-zag channel.
Energies 16 02326 g013
Figure 14. Effect of bend angle on friction factor: (a) conventional zig-zag channel; (b) modified zig-zag channel.
Energies 16 02326 g014
Figure 15. Effect of bend angle on Nusselt number: (a) conventional zig-zag channel; (b) modified zig-zag channel.
Energies 16 02326 g015
Figure 16. Flow Turbulent kinetic energy description of PCHE blocks: (a) conventional zig-zag channel; (b) modified zig-zag channel; (c) straight channel.
Energies 16 02326 g016
Figure 17. Schematic of the Brayton cycle of recompression supercritical carbon dioxide.
Energies 16 02326 g017
Figure 18. Specific work: (a) main compressor and recompressor; (b) compression system.
Energies 16 02326 g018
Figure 19. Specific work by the supercritical Brayton cycle turbine.
Energies 16 02326 g019
Figure 20. Efficiency of sCO2-BC cycle.
Energies 16 02326 g020
Figure 21. The economic cost for different channel configurations in the PCHE: (a) capital cost; (b) operating cost; (c) total cost.
Energies 16 02326 g021aEnergies 16 02326 g021b
Figure 22. PCHE block optimization: (a) case 1; (b) case 2; (c) case 3 (units in mm).
Energies 16 02326 g022
Figure 23. Thermodynamic performance of the modified zig-zag channel under critical conditions: (a) flow temperature; (b) pressure drop.
Energies 16 02326 g023
Figure 24. Total cost of PCHE vs. Reynolds number.
Energies 16 02326 g024
Table 1. Thermodynamic properties of the stainless steel S316L.
ParameterFlow DensityThermal ConductivitySpecific Heat
Unitskg/m3W/(m K)J/(kg K)
Value803016.27502.47
Table 2. Mesh features of the computational domain.
ConfigurationNodesElementsOrthogonal QualityCell Shape
SkewnessAspect RatioSquish Index
Conventional zig-zag channel4,475,2539,648,6330.780440.261.300.35
Straight channel2,996,01110,560,8810.775770.241.360.41
Modified zig-zag channel4,426,3278,542,6930.7901560.261.310.37
Table 3. Mesh independence analysis for channel configurations of the PCHE (temperature at the cold channel outlet).
Number of Elements
× 10 6
Conventional Zig-Zag ChannelModified Zig-Zag ChannelStraight Channel
Temperature [K]Deviation [%]Temperature [K]Deviation [%]Temperature [K]Deviation [%]
2.25557.30[-]531.50[-]501.02[-]
3545.262.16512.723.53505.070.81
3.75533.622.14494.723.51508.590.70
4.5525.861.45492.270.49510.170.31
5.25521.080.91495.800.72510.710.11
6515.531.07499.190.68511.380.13
6.75516.460.18505.441.25512.050.13
7.5518.290.36512.721.44513.370.26
8.25520.260.38516.240.69514.160.16
9519.890.07517.040.16513.540.12
9.75520.300.08517.580.10513.500.01
10.5520.200.02517.600.00513.970.09
11.25520.090.02517.100.10513.730.05
12519.850.05517.260.03513.890.03
Table 4. Technical data of Printed Circuit Heat Exchanger.
ParameterUnitsValue
Maximum pressurekPa8350
Flow temperatureK383–523
Corrosion risk%75
PCHE cost%50
Leakage risk%0
Gas compatibility%100
Table 5. Experimental and numerical results of PCHE models.
ParameterLocationExperimental Data [24]SST k-ω ModelError (%)
Pressure drop between inlet and outlet
[kPa]
Cold channel67.8962.957.27
Hot channel66.9865.921.58
Temperature differential between inlet and outlet
[K]
Cold channel130.53126.642.98
Hot channel139.58137.111.76
Disclaimer/Publisher’s Note: The statements, opinions and data contained in all publications are solely those of the individual author(s) and contributor(s) and not of MDPI and/or the editor(s). MDPI and/or the editor(s) disclaim responsibility for any injury to people or property resulting from any ideas, methods, instructions or products referred to in the content.