Article

The Impact of Windows Replacement on Airtightness and Energy Consumption of a Single Apartment in a Multi-Family Residential Building in Montenegro: A Case Study

Faculty of Mechanical Engineering, University of Montenegro, Džordža Vašingtona bb, 81000 Podgorica, Montenegro
*
Author to whom correspondence should be addressed.
Energies 2023, 16(5), 2208; https://doi.org/10.3390/en16052208
Submission received: 3 January 2023 / Revised: 19 February 2023 / Accepted: 19 February 2023 / Published: 24 February 2023
(This article belongs to the Topic Building Energy Efficiency)

Abstract

:
One of the important factors influencing the thermal performance of buildings is the leakage of the envelope. When it comes to Montenegro, although there is a formal airtightness requirement, air permeability tests are not mandatory and therefore there is a lack of data in this regard. This paper reports the results of fan pressurization tests on a single apartment in a multi-family residential building before and after replacing the windows. The replacement of old wooden windows with new UPVC ones, provided that the installation is carefully supervised, proved to be an effective air tightening measure, as it resulted in a reduction of air change rate at the reference building pressure from 6.25 h−1 to 0.77 h−1, or by nearly 90%. The energy impact of air leakage was evaluated using the national software for calculating the energy performance of buildings based on the DIN V 18599 methodology. Calculations showed that by reducing infiltration, significant energy savings for heating can be achieved, while savings for cooling are practically negligible. Savings in relative terms were greater when the façade walls were thermally insulated and when the building was located in a colder climate zone. Savings in delivered energy ranged from 13 to 25 kWh/m2·year, depending on the climate zone.

1. Introduction

Concerns about global warming have prompted various activities at the local, regional, and global levels. The European Union stands out with its adopted legal framework, showing a clear commitment to reducing greenhouse gas emissions. The recently adopted European Green Deal has the ultimate goal of making the European Union climate neutral by 2050, by achieving the target of net-zero greenhouse gas emissions. The building sector is crucial for achieving energy and environmental goals since it is recognized as the single largest energy consumer in Europe. It is estimated that buildings are responsible for 40% of EU energy consumption and 36% of energy-related greenhouse gas emissions [1]. These facts are recognized in the Energy Performance of Buildings Directive (EPBD) [2]. In its recent amendments, the focus is on achieving a nearly zero-energy standard for new buildings, as well as on establishing long-term renovation strategies for the building sector.
Increasingly stringent requirements for energy efficiency of buildings can no longer be achieved by simply increasing the thickness of thermal insulation or by installing more efficient heating and cooling equipment. It is now necessary to pay more attention to the ventilation systems and to the airtightness of the building envelope. Some countries have already adopted minimum requirements for the airtightness of building envelopes. The current Montenegrin rulebook [3] on minimum energy efficiency requirements, which should be revised soon, stipulates that the number of air changes per hour at a pressure difference between the interior and exterior of a building of 50 Pa must not exceed 3 h−1 for buildings without mechanical ventilation, or 1.5 h−1 for buildings with mechanical ventilation. The specified values correspond to the requirements valid in Germany. However, in some European countries the requirements are stricter; in others they are looser, while some countries do not prescribe any requirements [4]. Defining airtightness requirements imposes the need to measure it in order to check the fulfilment of the requirements and in order to check the quality of craftsmanship in the building envelope before commissioning. Mandatory airtightness testing of new and renovated buildings can be an effective measure that forces building professionals to pay more attention to details and to take site supervision and follow-up more seriously. Here, it should be kept in mind that it is much easier to build an airtight building than to tighten an existing building.
A building’s airtightness significantly affects the building’s energy consumption due to air infiltration. Many software programs for calculating the energy performance of buildings take into account the state of the building envelope in terms of airtightness. MEEC (Montenegrin Energy Efficiency Certification) software was recently introduced in Montenegro for the calculation of the energy performance of buildings, which is intended for both energy certification and energy audits [5]. The software was developed by the Fraunhofer Institute for Building Physics and the calculation methodology itself is based on German standard DIN V 18599 [6] that meets the requirements of EPBD directive. Infiltration is defined in the software based on the location of the building (open, moderately open, very sheltered) and based on the visual condition of the building envelope, i.e., windows and façade (poor condition, normal condition, well-sealed). Also, it is possible to define the infiltration based on the measurement of airtightness using the blower door test. It is clearly not practical to perform a blower door test for every single building that is calculated in the software. Nevertheless, statistical data for a large number of typical buildings (categorized depending on the time and type of construction, type of windows, etc.) are desirable in order to have the most realistic idea of airtightness and to make the energy calculation as accurate as possible. Systematic measurement of airtightness by blower door fans was not carried out in Montenegro, so there are no data for either old or new buildings and energy auditors are at a loss as to which values to use in calculations both for the existing state and for the state after the application of energy efficiency measures.
Furthermore, poor airtightness can be the cause of unacceptable thermal comfort, transport of airborne contaminants and dust, poor sound insulation, vapor transfer through the envelope and occurrences of condensation and mold. However, buildings with good airtightness require special attention to adequate air exchange, either by occasionally opening windows, or even better by mechanical ventilation. Otherwise, the users of the building face the problem of poor indoor air quality, condensation, and the appearance of mold on the walls. This gives full meaning to the motto “build tight, ventilate right”.

1.1. Literature Review on Airtightness Measurement

Airtightness has received much more attention in countries with colder climates (primarily in the USA, Canada, and Northern Europe) both at the research level and at the regulatory and professional level. Airtightness of building envelopes has been developed as an area of research in the USA for several decades [7,8]. Comprehensive databases of thousands of fan pressurization tests and a number of different infiltration models have been developed [9].
The airtightness of buildings is extensively regulated in the countries of northern and central Europe. An interesting study conducted in Ireland [10] reported air permeability test results of 28 single-family houses built from 1944 to 2008, among which there were also new and retrofitted ones. Interestingly, the study pointed to the misconception that newer houses are inherently more airtight than old ones. A Finnish study [11] conducted on 170 detached houses showed a significant influence of the type of construction on airtightness—buildings made of concrete and brick are more airtight than those made of timber frame and log. A similar conclusion was reported in a UK study based on the airtightness test results of 287 post-2006 new-build dwellings [12].
However, in countries with a warmer climate like Montenegro, the problem of airtightness is given much less attention. Airtightness is neglected mainly for two reasons. First, the temperatures are not that low in winter, so that heat loss due to infiltration is not relatively large. Furthermore, opening windows is a traditional way to provide fresh air, but also for cooling during the summer months. Only recently have several studies been published on airtightness measurements in some countries of Mediterranean Europe. The results of measurements carried out in France, presented in the document by Carrié et al. [13] indicated that multi-family apartment buildings are more airtight than single-family houses. An analysis of the pressurization test results on a limited sample of 20 houses in Greece [14] showed a linear correlation between air change rate at the reference pressure difference of 50 Pa and the so-called frame length factor, which is defined as the total frame length of windows divided by the net volume of the building. An experimental study of 20 residential buildings in southern Italy [15] showed that the measured air change rate values are quite high, especially for buildings dating before 1970s, and that windows with roller shutter boxes are one of the most significant causes of poor airtightness. The experimental results of this study showed that the airtightness contribution of the windows ranges from 3.64% to 37.4%, indicating the possibility to significantly reduce heat losses with a simple retrofit of the frame. Villi et al. [16] presented the results of a study conducted on a renovated three-story, six-unit, multi-family building in Italy in order to assess the contribution of infiltration to meeting ventilation needs and the corresponding energy costs. In order to predict the infiltration rate, a model was developed in the EnergyPlus software, and blower door measurements were used as input data. The results of the simulations showed that with increased airtightness, the energy consumption is lower, but that the infiltration rates were lower than what is required by the ventilation recommendations. One of the conclusions of the air permeability tests carried out in Portugal [17] in five flats of the same size, in the same building, with apparently identical construction characteristics and with the same envelope components is that the air permeability values showed a wide variation. It is assumed that the cause is the variation in the dimensions of the gaps surrounding the roller shutter boxes. The results of the blower door measurements on traditional residential Portuguese buildings [18] indicated a correlation between building typology, airtightness, and ventilation rate. The most comprehensive study on airtightness in Spain [19] has established a database of more than 400 dwellings of different ages and typologies, of which about half are in the Mediterranean region. It was shown that, on average, dwellings in the Mediterranean area performed worse in terms of airtightness than those located in the north of Spain.
Studies on the effectiveness of replacing windows to increase airtightness are scarce. D’Ambrosio Alfano et al. [20] analyzed the results of blower door test carried out in three residential buildings located in the Mediterranean region before and after replacement of windows. Surprisingly, the analysis demonstrated a high variability of the building airtightness after replacement of windows, despite the fact that air tight-certified windows were used. In one building, airtightness is significantly improved, in another marginally, while in the third it was even worse due to improper installation.

1.2. Literature Review on Energy Impact of Airtightness

Leaks in the building envelope contribute significantly to the overall heating and cooling loads. Again, there are more studies analyzing the impact of building airtightness on energy consumption in cold than in temperate and warm climate countries. Jokisalo et al. [11] studied the effect of airtightness on heating energy consumption in cold climate regions. According to the results of simulations on a sample of 170 detached houses in Finland, infiltration is the cause of 15–30% of energy use for heating in typical houses (n50 = 3.9 h−1), while this contribution is as much as 30–50% in poorly sealed houses (n50 = 10 h−1). Furthermore, the results showed that by increasing the air change rate at 50 Pa from 1 to 10 h−1, the energy consumption for heating increases almost linearly from 4 to 21%. Gillot et al. [21] investigated the effectiveness of various energy efficiency measures applied to the retrofitted test dwelling in England. About 9% of total energy savings is due to relatively inexpensive weather proofing measures, while the rest is due to thermal insulation and improvement of heating and ventilation system. A Lithuanian study of airtightness and thermal energy losses of mid-sized terraced houses built of different materials [22] concluded that the end units are up to 20% less airtight compared to the inside units and therefore exceed the heat loss limits prescribed for the energy class of the building as a whole.
Balaras et al. [23] estimated that in the case of Greece, even a low-cost measure of weatherproofing (sealing) of openings of all buildings constructed before 1990 and 10% of buildings constructed during the 1990s would yield 16 to 21% savings in space heating energy. Poza-Casado et al. [24] and Feijó-Muñoz et al. [25] assessed the energy impact of infiltration on residential buildings in Spain and reported that, in the Mediterranean provinces, it is in the range 8.61–16.44 kWh/m2·y for heating and significantly lower for cooling.
The two goals of this study were: to determine by blower door test how much airtightness can be improved in a selected type of building by carefully supervised windows replacement, and to assess the impact of increasing the building airtightness on energy consumption. The paper presented the results of measuring the airtightness of the same apartment before and after the replacement of the windows, as well as the results of calculating its energy consumption for heating and cooling for different degrees of airtightness.

2. Materials and Methods

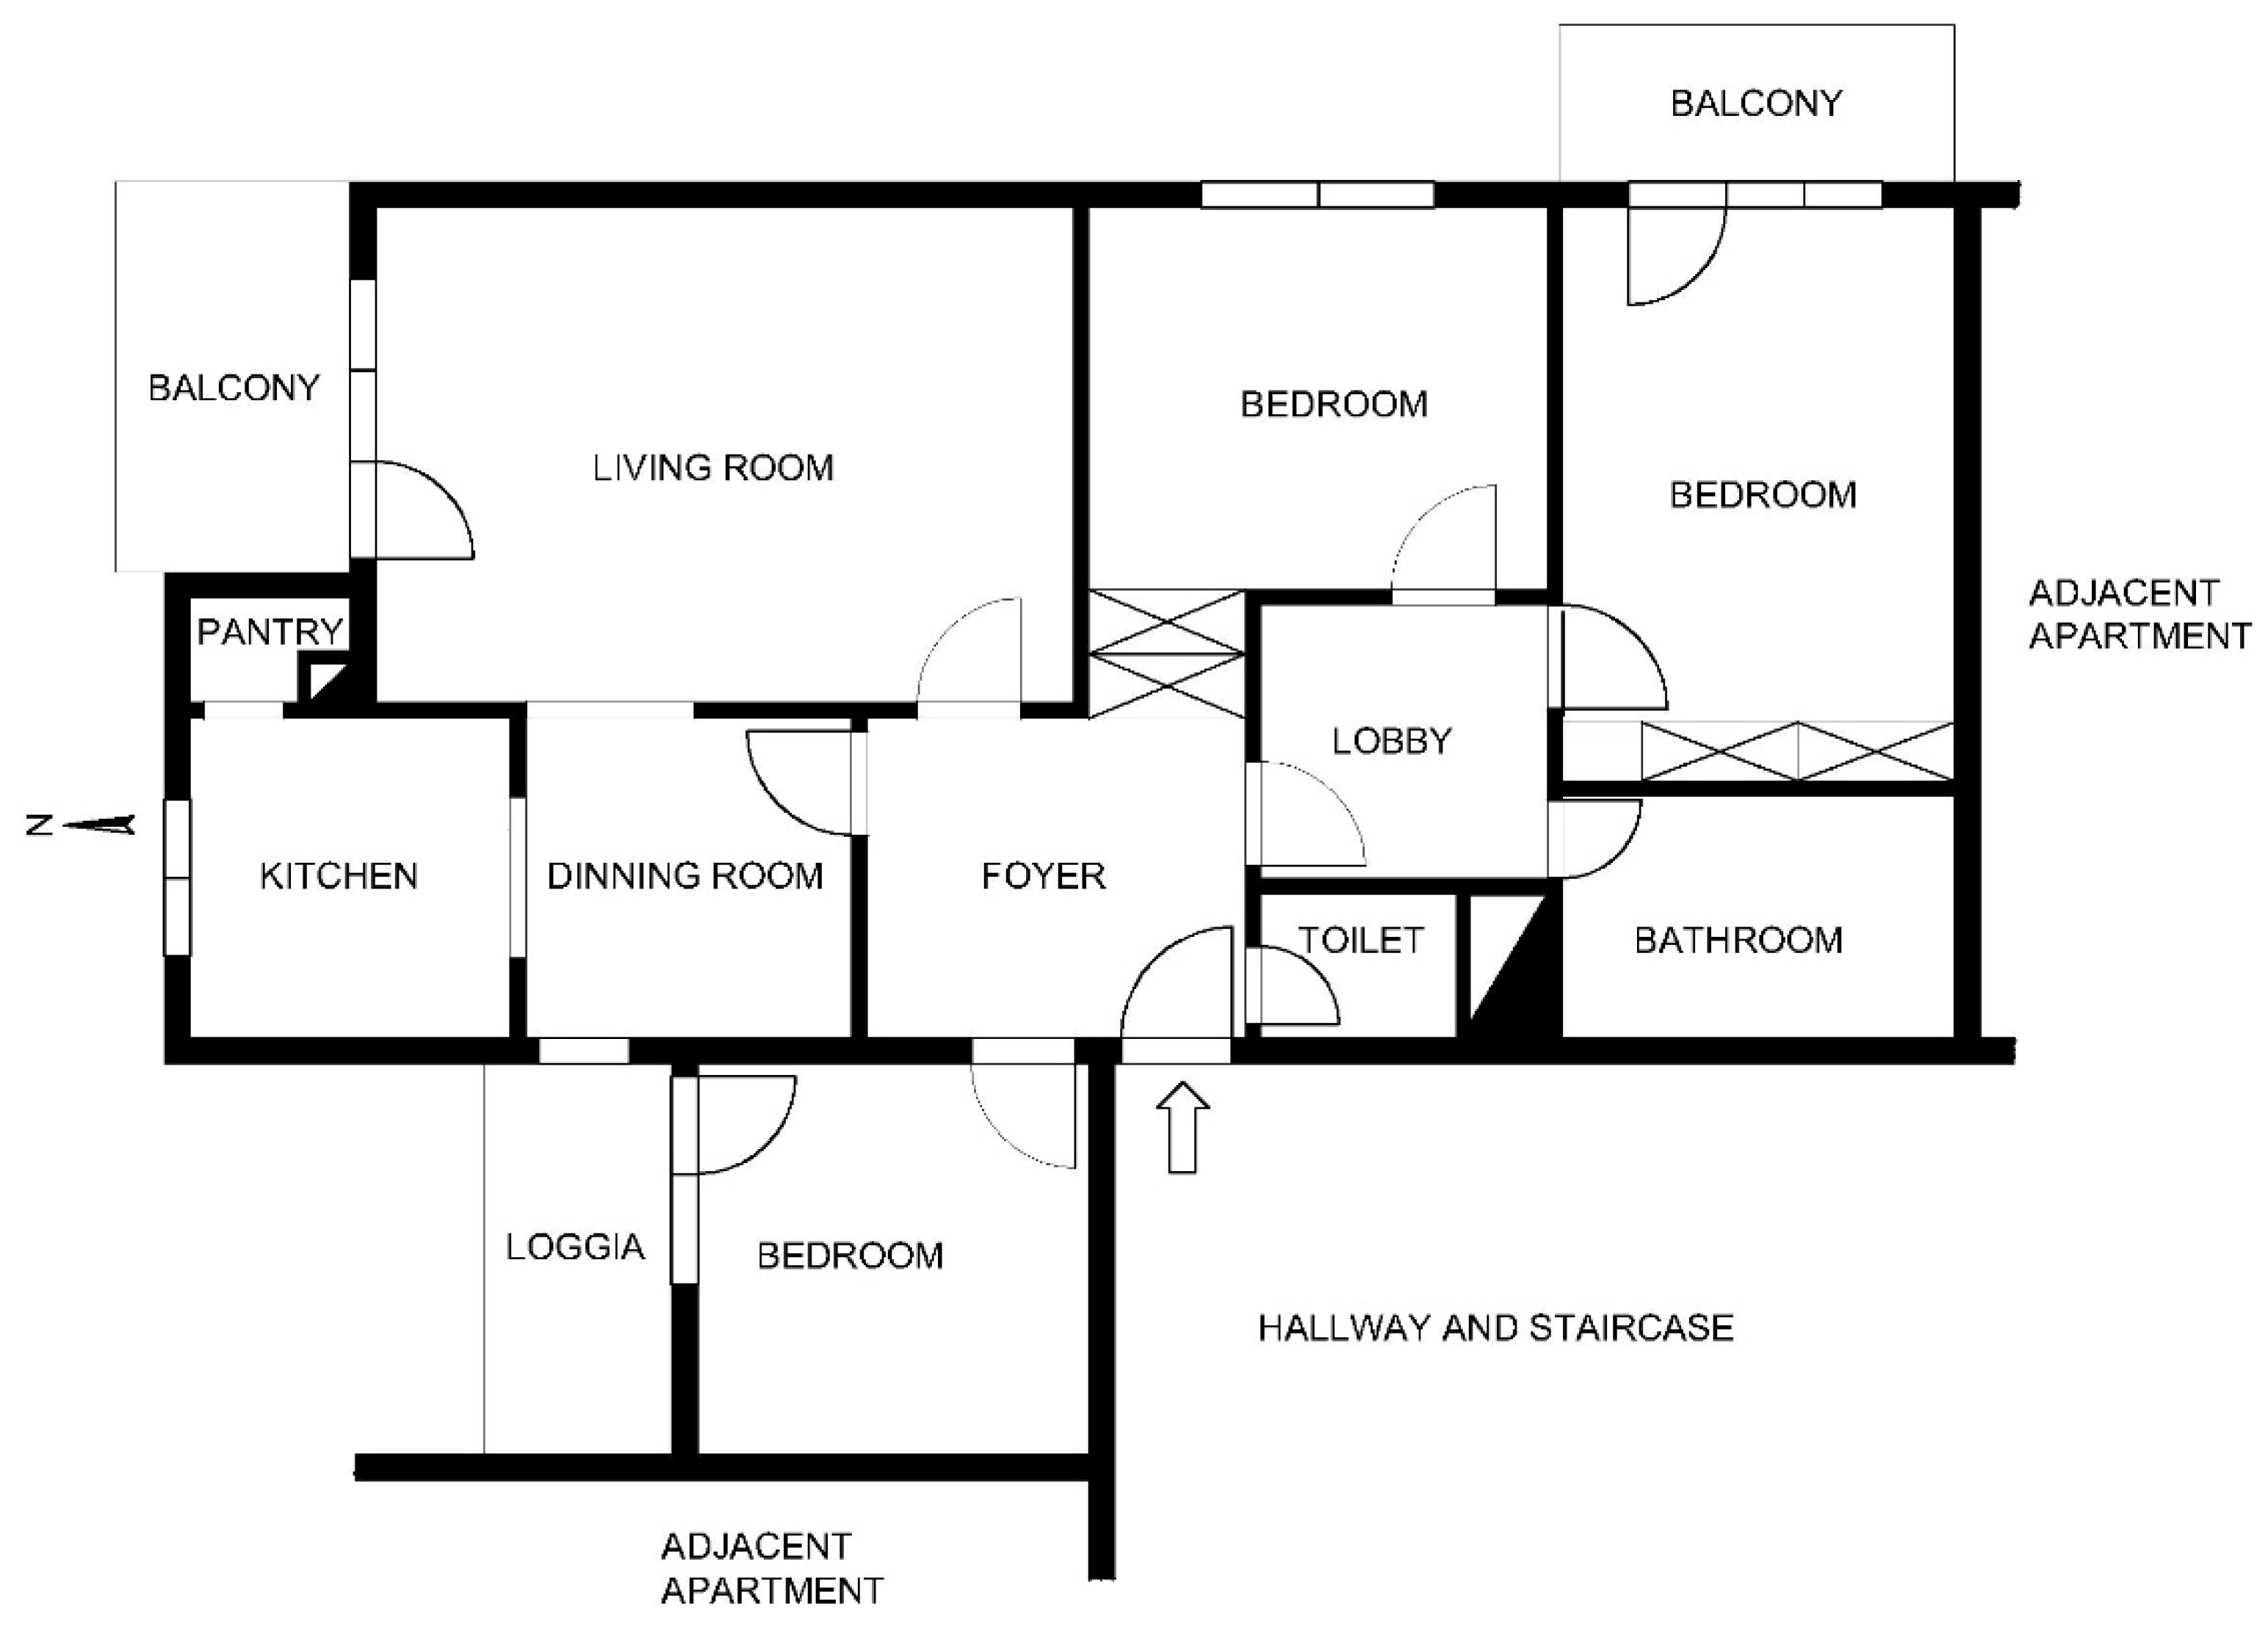
2.1. About the Apartment Being Tested for Airtightness

The measurement of airtightness was performed on a three-bedroom apartment in a multi-family residential building built in the mid-1980s. The building is located in the capital Podgorica (42°26′52.48″ N; 19°14′17.34″ E), which belongs to climate zone I. This choice for the case study is not arbitrary: the majority of the population of Montenegro lives in this climate zone, namely in buildings of the same type built from the beginning of 1970s to the end of 20th century. Therefore, this case is significant for the analysis from the point of view of energy consumption. In addition, this apartment was chosen because the authors had the freedom to influence and disrupt the order and dynamics of the renovation works, to choose the windows to be installed and to supervise the quality of their installation. The apartment is positioned on the first floor, on the northeast-oriented corner, and on the west side it is sheltered by another wing of the same building. A one-bedroom apartment and commercial space are located below, while there is also a three-bedroom apartment above. Towards the interior of the building, the apartment is surrounded by two neighboring apartments, a corridor, and a staircase. The layout of the apartment is shown in Figure 1.
The materialization of the building was carried out in a way that was typical for the period from the beginning of the 70s to the end of 90s. The external walls are made of cast-in-place reinforced concrete, except for the walls of the rooms with balconies (the living room and two bedrooms), which are built of hollow clay bricks. The wall thickness is about 20 cm. There is no thermal insulation, but only a layer of foam concrete plaster. The horizontal partitions are also made of cast-in-place reinforced concrete.
All former windows and doors were wooden, casement type, double-glazed, where each pane was in its own sash mounted on its own hinges and operated (open/close and lock) independently. About half of the windows and doors had roller shutters housed in wooden boxes. Windows and doors did not have rubber seals. They were fully functional, although they were not regularly maintained.
The renovation measure that has the greatest impact on increasing the airtightness of the apartment is the replacement of windows and doors. The old wooden windows were replaced by UPVC windows manufactured by a reputable local company with many years of experience and positive reviews. Windows are made of Softline 70 AD profiles, product of VEKA AG, Germany. The profiles were 5-chamber with a standard installation depth of 70 mm with two seals, one around the sash and the other around the outer frame. Unlike the original situation, after the renovation, all windows and doors were equipped with appropriate roller shutters VEKAVARIANT 2.0 from the same manufacturer. Adhering to professional recommendations when installing windows is essential for achieving good airtightness. A common bad practice is to leave a larger gap between the window frame and the opening on the wall that is not completely filled with a suitable sealant after installing the windows using wooden chokes. These gaps are not obvious once the edges are finished but could potentially appear as air leakages. In this case the windows are not installed strictly according to the RAL guidelines [26], which are considered to be state-of-the-art technology. However, the gaps between the window frames and the carcass opening were carefully sealed with polyurethane foam, and the edges were finished by plasterers and tilers.

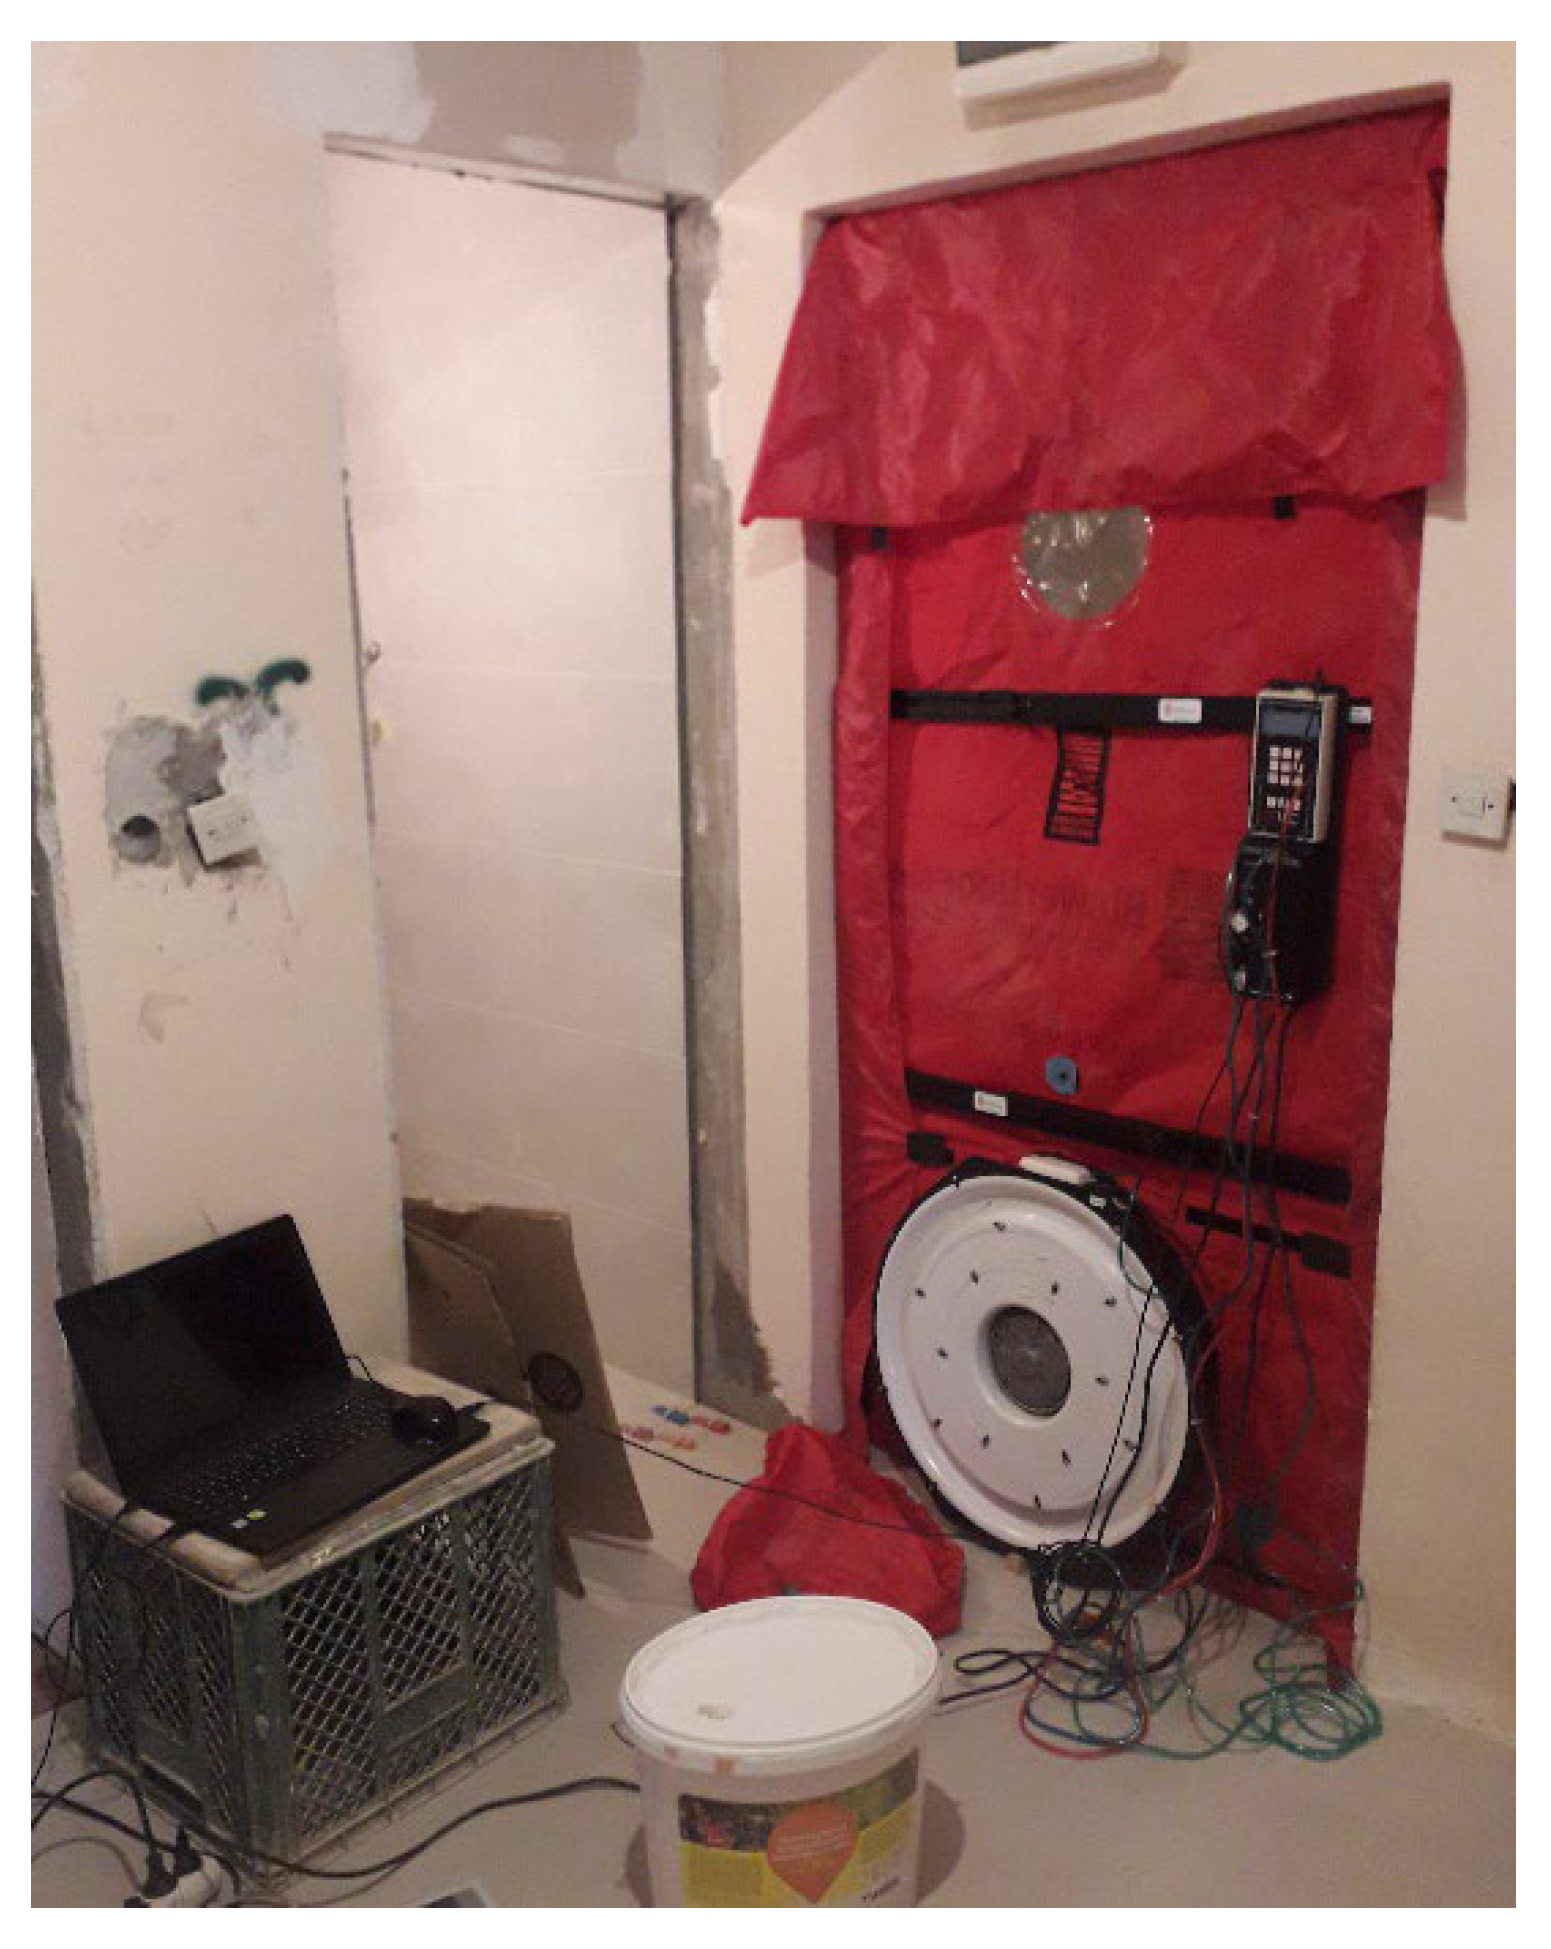
2.2. Airtightness Measurement

The standard procedure for determining the airtightness of buildings is the fan pressurization method, most commonly known as blower door test. The fan extracts air out of the building, lowering the pressure inside, which results in outside air being sucked in through all unsealed cracks and openings. The procedure is described in principle in a similar way in several standards [27,28,29].
The blower door test involves mounting a fan on a door, which induces a pressure difference across the building envelope. The airflow which is required to achieve and maintain the given pressure difference is recorded—the flow is greater if the building envelope is leakier. The airflow rates are usually measured at a series of pressure differences ranging from 10 to 75 Pa. Measurements are usually not performed at pressure differences of less than 10 Pa due to the significant influence of wind and temperature differences. The pressure difference of 50 Pa was adopted as a reference because it is both low enough to be achieved relatively easily in most buildings using blower door fans, and large enough that the measurement is not affected by the weather conditions (wind and stack effect). The measured data (airflow vs. pressure difference across the building envelope) fit a power law that has the form
V ˙ = c L Δ p n .
where V ˙ in m3/h is the air leakage rate, Δ p in Pa is the pressure difference, c L in m3/h/Pan is the air leakage coefficient and n is the air flow exponent obtained by least squares fitting of the entire set of experimental points ( Δ p , V ˙ ).
When the air leakage coefficient and the air flow exponent are obtained in the blower door procedure by fitting a series of pairs ( Δ p , V ˙ ), then it is possible to calculate the air leakage at the reference pressure difference in m3/s. In order to obtain metrics that can be used to compare buildings in terms of airtightness, it is desirable to normalize the air leakage at the reference pressure difference with something that scales with the size of the building.
Table 1 summarizes the most commonly used air leakage metrics with their definitions, calculation formulas and units.
The assessment of the apartment airtightness before and after replacement of the windows and doors was approached by means of the fan pressurization method, according to ISO 9972:2015. Standard ISO 9972:2015 describes three types of test methods, depending on the purpose, whether it is testing the building in use (method 1), testing the building envelope (method 2) or testing the building for a specific purpose (method 3). As the testing of the apartment envelope was of interest in this case, all intentional openings in the envelope were closed or sealed in accordance with the description of the measurement procedure in the standard.
The blower door tests were performed with the Minneapolis Blower Door Model 4.1, product of BlowerDoor GmbH which has a flow range from 25 to 7800 m3/h at 50 Pa. The fan was mounted on the front door of the apartment as shown in Figure 2, while the front door of the building was left open so that the pressure in the hallway outside the apartment was as close as possible to the atmospheric pressure.
Both before and after the replacement of the windows and doors, the apartment was depressurized for a prolonged period of time during which a visual, hand, and smoke pen inspection of the envelope was performed in order to identify the most contributing leak locations. Thermal imaging of the envelope for the purpose of leak detection was not possible because the apartment at the time of measurement did not have a heating/cooling system that would create the necessary temperature difference.
During both measurements, the requirements of the ISO 9972:2015 standard were met: the wind speed was less than 6 m/s and the product of the building’s height, and the indoor-outdoor temperature difference was less than 250 m·K. The calibrated fan was connected to the speed controller, which was further connected to the digital pressure gauge DG700 and a computer. The test was fully automated by the accompanying TECTITE Express software installed on the computer. The software processed the data, fit the regression curve through a set of points ( Δ p , V ˙ ), plotted the charts, and calculated the airtightness metrics.

2.3. Calculation of Energy Consumption for Heating and Cooling

Energy use for heating/cooling was calculated using the national MEEC software for calculating the energy performance of buildings, developed by the Fraunhofer Institute for Building Physics. The methodology of MEEC software is following the German calculation procedure of the net, final and primary energy demand for heating, cooling, ventilation, domestic hot water, and lighting described in DIN V 18599. Space heating and cooling demands were calculated by solving a monthly energy balance that included all heat sources (internal gains, solar gains, etc.) and sinks (transmission, ventilation, etc.). The energy impact of infiltration was calculated in the usual way, based on the amount of infiltrated air and the indoor and outdoor temperatures. Heat sources and sinks due to infiltration were calculated using the following equations:
Q V , i n f = n i n f V c p , a ρ a θ i θ e t when   θ i > θ e ( heat   sink )   and Q V , i n f = n i n f V c p , a ρ a θ e θ i t when   θ i < θ e ( heat   source ) ,
where:
n i n f —is the daily mean infiltration air change rate;
V —is the net volume of the space;
c p , a —is the specific heat capacity of air;
ρ a —is the density of air;
θ i and θ e —are reference indoor and outdoor temperatures for calculating the energy need for heating/cooling;
t —is the calculation period.
A value of c p , a ρ a is set to 0.34 Wh/(m3·K). The reference indoor temperature for calculating the energy need for heating takes into account any reduction in heat output at night, or during weekends or holiday periods. The infiltration air change rate is determined as a daily mean value calculated on the basis of airtightness of the building at the pressure difference of 50 Pa. Where no mechanical ventilation is used, the mean daily infiltration air change rate is determined according to:
n i n f = n 50 e ,
where e is the wind shielding coefficient for which the default value of 0.07 is assumed which corresponds to a moderately sheltered building with more than one façade exposed to the wind.
There was no information on how the apartment was used before the renovation in order to calibrate the model in the software according to the monthly electricity bills in the previous period. Therefore, the default settings for the user profile for residential buildings were selected. The delivered energy (energy that is actually paid for) is highly dependent on technical systems and their losses. In order to analyze the energy impact of airtightness, the following heating and cooling systems were adopted in the calculations: central radiator heating system with biomass boiler and multi-split cooling system. These systems of providing heating and cooling have recently become a common practice in Montenegro.
The aim of the energy consumption analysis was to determine the effect of infiltration on the delivered energy for heating and cooling. Furthermore, it was also of interest to determine the influence of the climate zone and the heat transfer coefficient of the building envelope on the reduction of energy consumption due to the increase in airtightness.

3. Results and Discussion

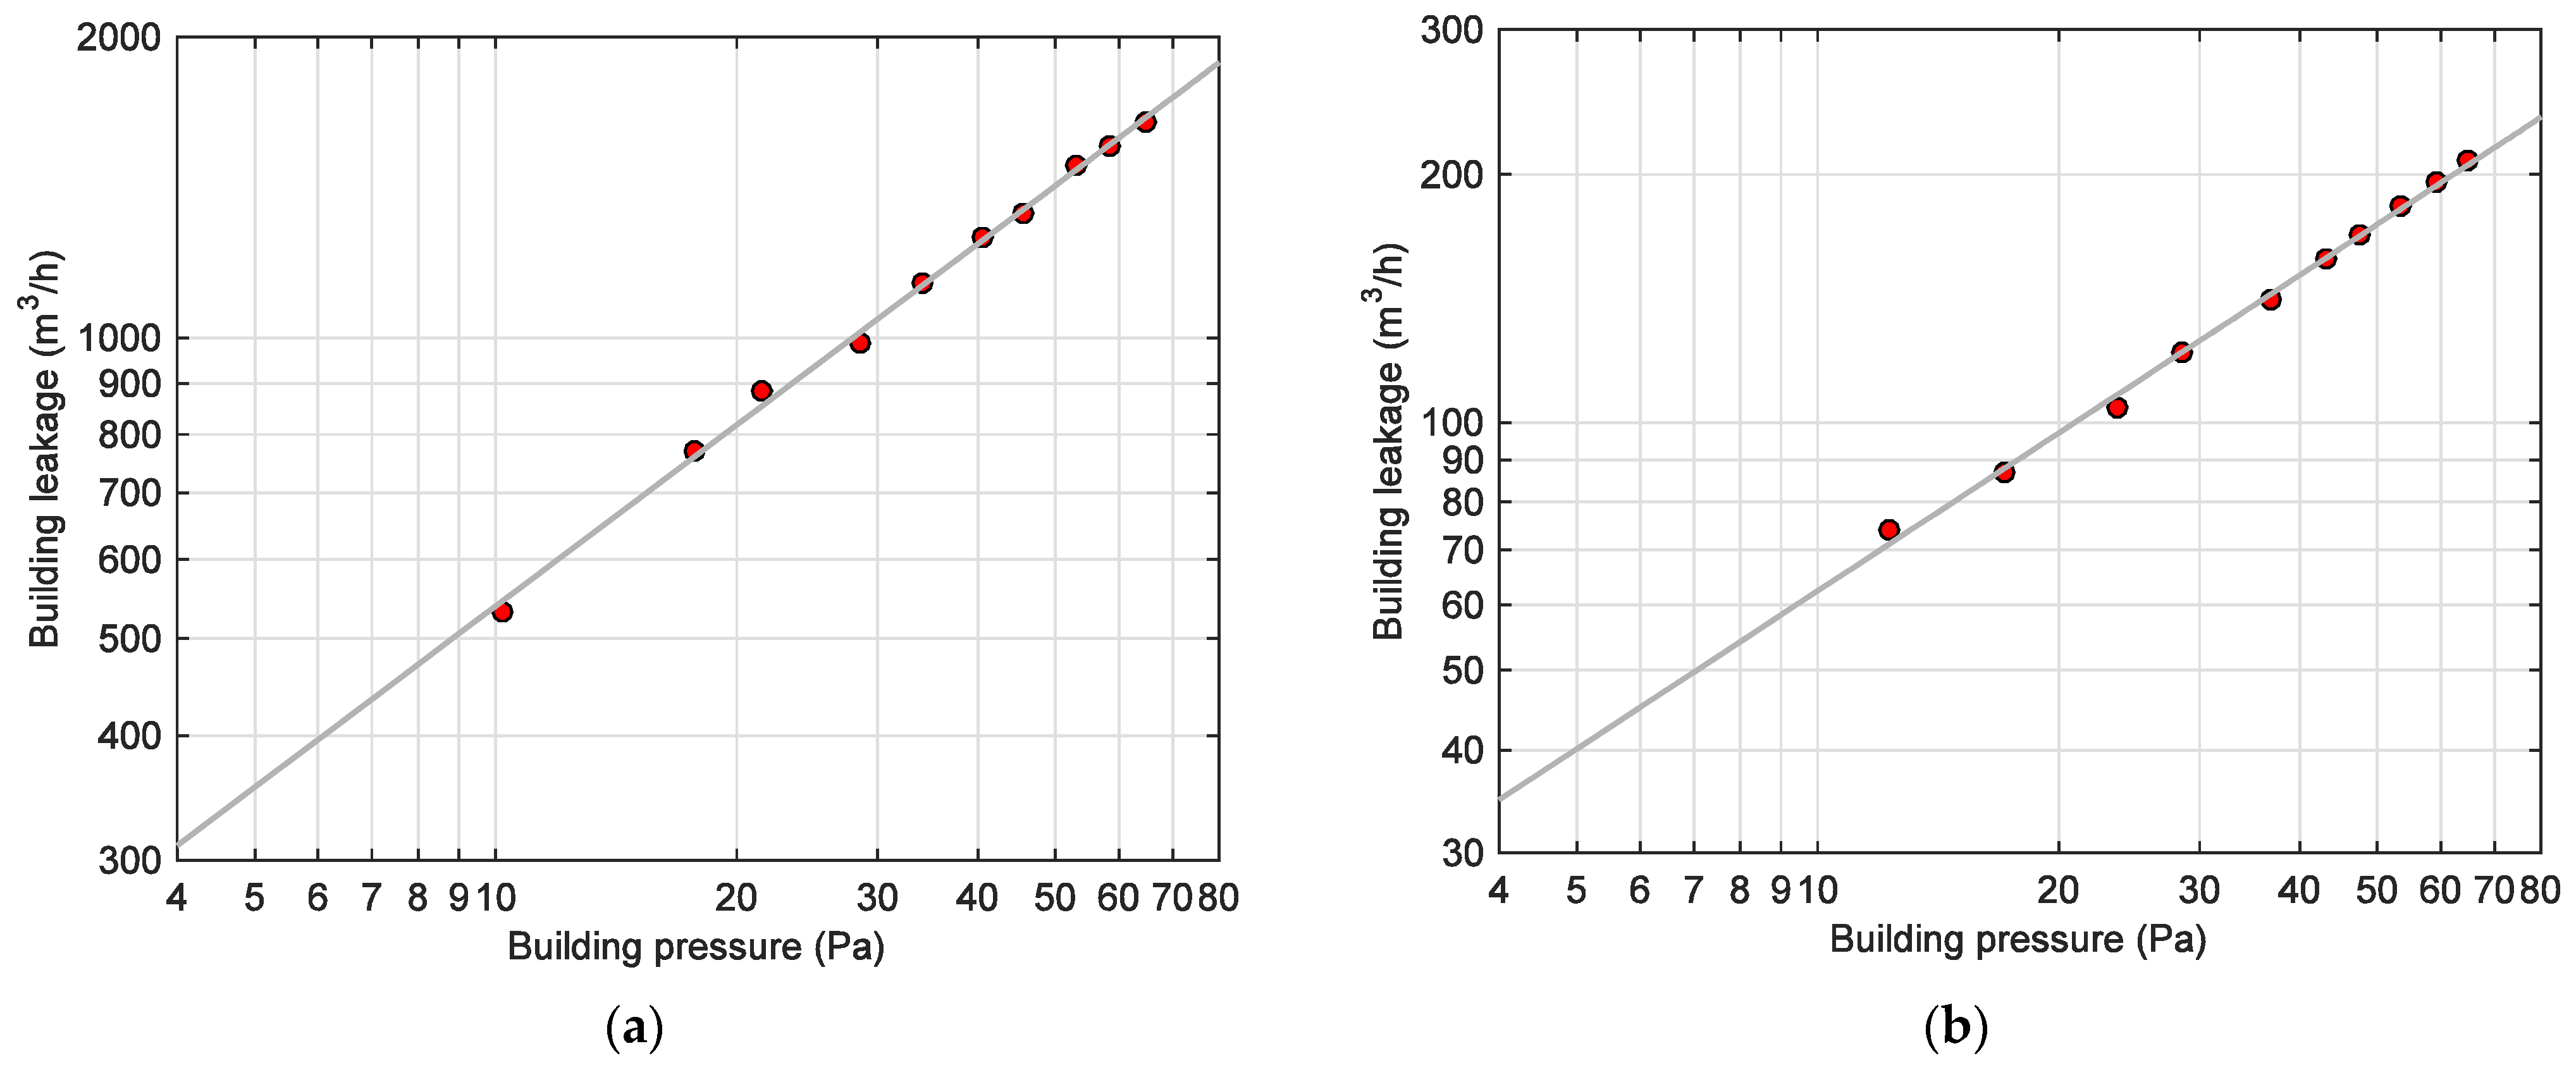
3.1. Results of Blower Door Tests

The blower door test before windows replacement was carried out in the spring (6 April 2022), while the blower door test after windows replacement was carried out in the summer (21 July 2022). Air leakage graphs are shown in Figure 3.
The difference in the limit values of the ordinate representing leakage in m3/h on those two graphs clearly indicates that the airtightness of the apartment was drastically improved by replacing the windows. The air leakage rate at the reference pressure difference of 50 Pa decreased from 1418 m3/h to 174 m3/h, or by approximately 88%.
The air change rate at the reference pressure difference of 50 Pa, which is most often used as an airtightness metric, decreased from 6.25 h−1 to 0.77 h−1. With the old windows, the n 50 value was far higher than the threshold value prescribed by the Montenegrin rulebook on minimum energy efficiency requirements, which is 3 h−1. By replacing the windows, the n 50 value came significantly closer to the requirement for passive houses, which is set at 0.6 h−1 in most countries.
The value of the air flow exponent indicates the size and shape of the dominant leaks. The air flow exponent has physically meaningful limit values of 0.5 and 1, depending on size and shape of dominant leaks. With short and relatively large openings, the Reynolds numbers are high, friction is negligible, and the leak can be viewed as an orifice, so that the flowrate is proportional to the square root of the pressure difference and thus the air flow exponent has its lower limit value as 0.5. With long and relatively narrow leaks, the Reynolds numbers are low, the flow is laminar, so that the flowrate is linearly proportional to the pressure difference and thus the air leakage exponent has its upper limit of 1. In this case, its value increased from 0.602 to 0.637, which clearly indicates that due to the replacement of the windows there was a transition from leakage through short and relatively large openings to long and relatively narrow leaks.
Summary of the blower door test results with calculated airtightness metrics is given in Table 2. Air change rate n50, air permeability q50 and specific leakage rate w50 were calculated by dividing the air leakage rate by the internal volume of 227 m3, envelope area of 123 m2 and net floor area of 85 m2, respectively.
Considering that there were no other significant interventions on the envelope of the apartment, it is clear that almost all the improvement in airtightness of almost 90% was the result of the replacement of windows and doors. This was expected, considering that during the smoke pen test before the renovation, most of the leaks were detected around the windows. The main air pathways were the gaps due to the weak abutment of the sash on the frame, as well as between the frame and carcass opening. In addition, significant leaks were recorded around the wooden shutter boxes. Those observations are in line with conclusions of the studies [14,15]. The high infiltration can be attributed to the fact that the old wooden windows dating from the time of the building construction were not of good quality per se, as they had large gaps and did not have rubber seals. Another cause was poor workmanship and lack of attention to details during installation, and ultimately, neglect of windows maintenance. No significant infiltration was found through the walls and through the horizontal partitions, which is not surprising since these envelope elements are made mainly of cast-in-place reinforced concrete.
The results of the blower door test after the replacement of the windows showed that with this type of construction, the airtightness can be improved almost to the requirement set for passive buildings just by replacing the windows. We emphasize that careful supervision of installation is mandatory for this outcome. This claim is in line with the results of similar tests carried out on three buildings in Italy [20], where it turned out that the airtightness of one building was even significantly worsened, despite the fact that certified high-performance windows were installed.
It should be emphasized here that the goal was not to test the airtightness of the entire building, nor to draw any conclusions about it based on measurement of the airtightness of a single apartment. When measuring the airtightness of the entire building, a number of practical limitations would arise: often the building is too large to be depressurized using a small blower door fan, there can be many leaks in corridors and stairwells that are difficult to detect and control (elevator shaft, fire escape doors, basement etc.) and finally, if the building is already in use, it is often not possible to access each individual apartment. On the other hand, based on the measurement of airtightness of a single apartment, a general valid conclusion cannot be made about the airtightness of the entire building, because possible leaks that are not through the outer envelope but from the adjacent apartment or staircase would be taken into account even multiple times.

3.2. Energy Impact of Airtightness

Montenegro, although small in area, has significant differences in temperature and solar radiation across its territory. According to the Köppen classification [30], the climate of Montenegro is dominated by Csa (hot-summer Mediterranean), Csb (warm-summer Mediterranean) and Dfb (warm-summer humid continental) climate types. For the purpose of calculating energy consumption for heating and cooling, Montenegro is divided into three climate zones. The warmest is Climate zone I, which covers the coast, and which has a design day temperature of −6 °C. The coldest is Climate zone III, which covers the north and for which the design day temperature is −18 °C. Average monthly temperatures for all three climate zones are given in Figure 4.
The existing thermal envelope has high U values and does not comply with the current rulebook on the minimum energy efficiency requirements of buildings. Almost 80% of external walls are made of reinforced concrete with U-value over 2 W/m2·K. The rest of the external walls are made of hollow clay blocks and have a U-value over 1 W/m2·K. Existing double-glazed wooden windows have a U-value of 2.5 W/m2·K. The rulebook on minimum energy efficiency requirements of buildings stipulates that the U-value of walls must not exceed 0.6 W/m2·K in Climate zones I and II and 0.45 W/m2·K in Climate zone III. As for the windows, the requirement is the same for all three climate zones—the U-value must not exceed 2 W/m2·K.
For the Climate zone I, with the existing building envelope, before replacement of windows and doors, the delivered energy for heating (including auxiliary energy for the burner, circulation pump etc.) and cooling was 155.44 kWh/m2·year. By replacing windows and doors, energy consumption for heating and cooling was reduced to 142.63 kWh/m2·year, i.e., by 12.81 kWh/m2·year or 8.2%. Considering separately the delivered energy for heating (including auxiliary energy), it decreased from 133.66 kWh/m2·year to 120.9 kWh/m2·year, i.e., by 12.76 kWh/m2·year or 9.5%. On the other hand, the delivered energy for cooling was reduced from 21.78 kWh/m2·year to 21.73 kWh/m2·year, that is, by only 0.2%. Thus, by increasing airtightness, significant energy savings for heating were achieved, while savings for cooling are negligible. The reason for this seemingly unexpected result is that the infiltration heat gains in summer are relatively small compared to the total heat gains (transmission, solar radiation irradiated on walls and transmitted through windows). These results are qualitatively in line with the conclusion of the study on energy impact of infiltration in residential buildings in Mediterranean area of Spain [25]. The monthly delivered energy for heating and cooling for the apartment in question in Climate zone I, with the existing thermal envelope, before and after the application of measures to improve airtightness is given in Figure 5a.
In order to determine the relative contribution of increasing airtightness to reducing the energy consumption of a building with an improved thermal envelope, the previous calculations were repeated for the case when the U-values of the building envelope barely meet the minimum requirements. With the improved thermal envelope, and with the same airtightness, the energy consumption for heating and cooling is reduced to 78.95 W/m2·K, i.e., by 49.2%. It is interesting to see how much additional savings would be achieved if, in addition to the improvement of the thermal envelope, airtightness was also increased. By reducing n50 of the insulated building from 6.25 to 0.77, the delivered energy for heating and cooling is further reduced to 66.61 kWh/m2·year, i.e., by an additional 12.34 kWh/m2·year or 15.6%. Therefore, the relative reduction of energy consumption through the improvement of airtightness is greater in the case when the envelope of the apartment is thermally insulated. The monthly delivered energy for heating and cooling for the apartment in question in climate zone I, with an improved thermal envelope, before and after the application of measures to improve airtightness is given in Figure 5b.
Increasing airtightness, while keeping the poor thermal envelope is a double-edged sword. Namely, as a result, there may be an increase in the relative humidity of the indoor air, which potentially leads to poor thermal comfort and the appearance of condensation and mold on the inside of the walls if their temperatures are below the dew point. Because of the above, it is necessary to take care of the regular airing of the apartment. Nevertheless, experience with renovation of existing buildings proved that users rarely changed their habits after improving airtightness. This problem would be less pronounced in a situation when external walls are thermally insulated. We emphasize that when calculating energy consumption, the software adjusts the air change rate due to window airing as a function of infiltration and does not allow the total air change rate (infiltration plus window airing) to go below the value of 0.5 h−1, which is widely accepted as a threshold value bellow which the perception of poor indoor air quality can occur.
The possibility of energy saving is even more appealing when energy consumption is high, and this is certainly the case in regions with a colder climate, such as the north of Montenegro (Climate zone III). If the same building were located in the north of Montenegro, the delivered energy for heating and cooling would be 258.21 kWh/m2·year, where the need for cooling is practically negligible. By reducing n50 from 6.25 to 0.77, the delivered energy for heating and cooling is reduced to 233.26 kWh/m2·year, i.e., by 24.95 kWh/m2·year or 9.6%. The monthly delivered energy for heating and cooling for the apartment in question in climate zone III, with the existing thermal envelope, before and after the application of measures to improve airtightness is given in Figure 6a.
By improving the thermal envelope so that it barely meets the minimum requirements, and without improving the airtightness, the delivered energy is reduced to 117.66 kWh/m2·year or by as much as 54.5%. Finally, by increasing the airtightness of the building envelope, the delivered energy for heating and cooling is further reduced to 93.11 kWh/m2·year, i.e., by an additional 24.55 kWh/m2·year or 20.9%. The monthly delivered energy for heating and cooling for the apartment in question in climate zone III, with an improved thermal envelope, before and after the application of measures to improve airtightness is given in Figure 6b.
Delivered energy savings due to the increase in airtightness are in the range of 13 kWh/m2·year in climate zone I to 25 kWh/m2·year in climate zone III. Based on the previously presented results it is clear that the relative reduction of delivered energy for heating and cooling through an increase in airtightness is greater in the case when the building is thermally insulated and when it is located in colder climates. In this case study, the relative energy savings range from 8.2% for an uninsulated to 15.6% for an insulated building in climate zone I, or from 9.7% for an uninsulated to 20.9% for an insulated building in climate zone III. This would be even more evident in concrete figures if the considered building had a more energy-efficient thermal envelope, and not, as discussed here, an envelope that barely meets the minimum requirements of the regulation.
The results of the calculation of delivered energy for heating and cooling before and after application of measures to improve the thermal envelope and airtightness are given for all three climate zones in Table 3 and Figure 7.
It is interesting to investigate the effect of different degrees of airtightness of the same apartment on energy consumption for heating and cooling. In order to do this, the calculation of the delivered energy for heating and cooling was done consecutively, with a gradual increase in airtightness from the minimum value of n50 = 1 to the maximum value of n50 = 15. This range for n50 was adopted based on an analysis of published studies reporting the results of blower door measurement on large samples of buildings in Mediterranean countries. For example, an Italian study [15] reported values as high as 23 h−1. Delivered energy vs. n50 is shown in Figure 8.
It can be noticed that with the increase of air change rate at the reference pressure difference of 50 Pa, energy consumption increases linearly. The slope of the lines indicates the previous conclusion that the influence of infiltration on energy consumption is more pronounced in colder climates. With an increase of n50 by a unit value, the delivered energy for heating and cooling increases by 2.3 kWh/m2·year in Climate zone I, by 3.6 kWh/m2·year in Climate zone II and by 4.6 kWh/m2·year in Climate zone III.

4. Conclusions

The paper emphasized that the problem of airtightness of buildings is still quite ignored in Montenegro, partly due to the mild climate and partly due to cheap energy. Nevertheless, infiltration will need to be properly addressed, especially in the context of the introduction of energy certification of buildings and the planned transition of the building stock towards the nearly zero-energy building standard.
The objectives of the case study presented here were to: obtain a rough idea of the airtightness of apartments in the analyzed type of buildings, and determine the real potential of increasing the airtightness by replacing the windows and finally to quantify the effect of uncontrolled airflow through the envelope on energy consumption for heating and cooling.
Analysis of blower door test results before and after window replacement led to the following conclusions:
  • The air change rate at the reference pressure difference of 50 Pa is reduced by replacing the windows by almost 90%. This points to the fact that with this type of construction, windows are the weakest link in the envelope as far as airtightness is concerned. The rest of the envelope is very airtight, which is to be expected considering that it is mostly made of cast-in-place reinforced concrete and that there are no visible leaks around penetrations for water and sewer pipes and electrical installations. Therefore, with this type of construction, windows replacement proves to be an effective measure with which airtightness can be improved almost to the standard of a passive house;
  • By replacing the windows, the air flow exponent increases indicating a change in the character of the leakage from leakage through short and relatively large openings to leakage through long and relatively narrow passages.
Analysis of energy consumption before and after window replacement led to the following conclusions:
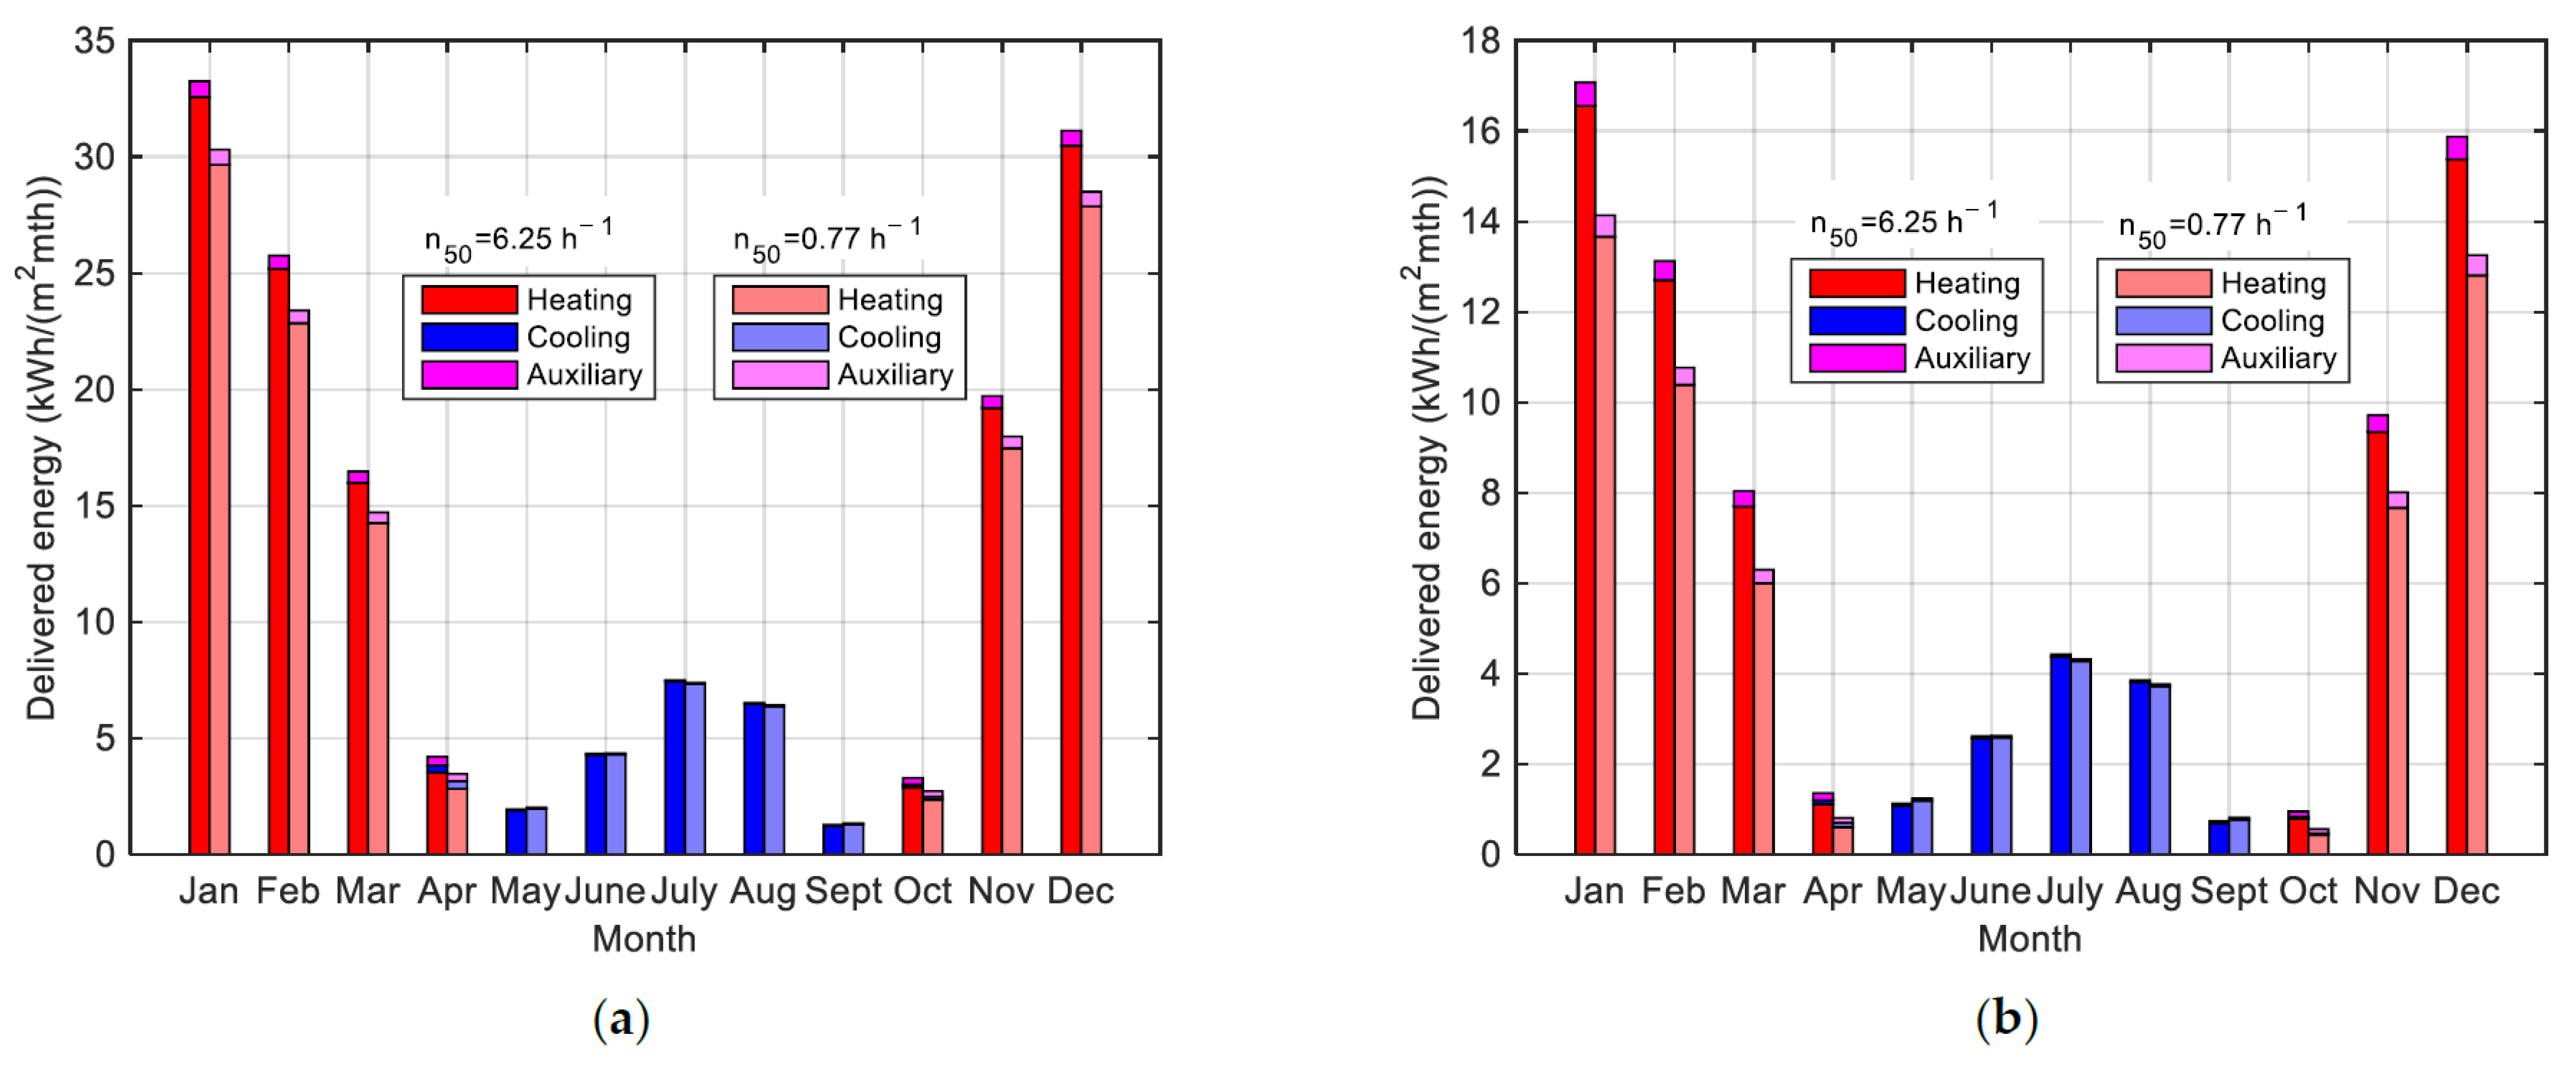
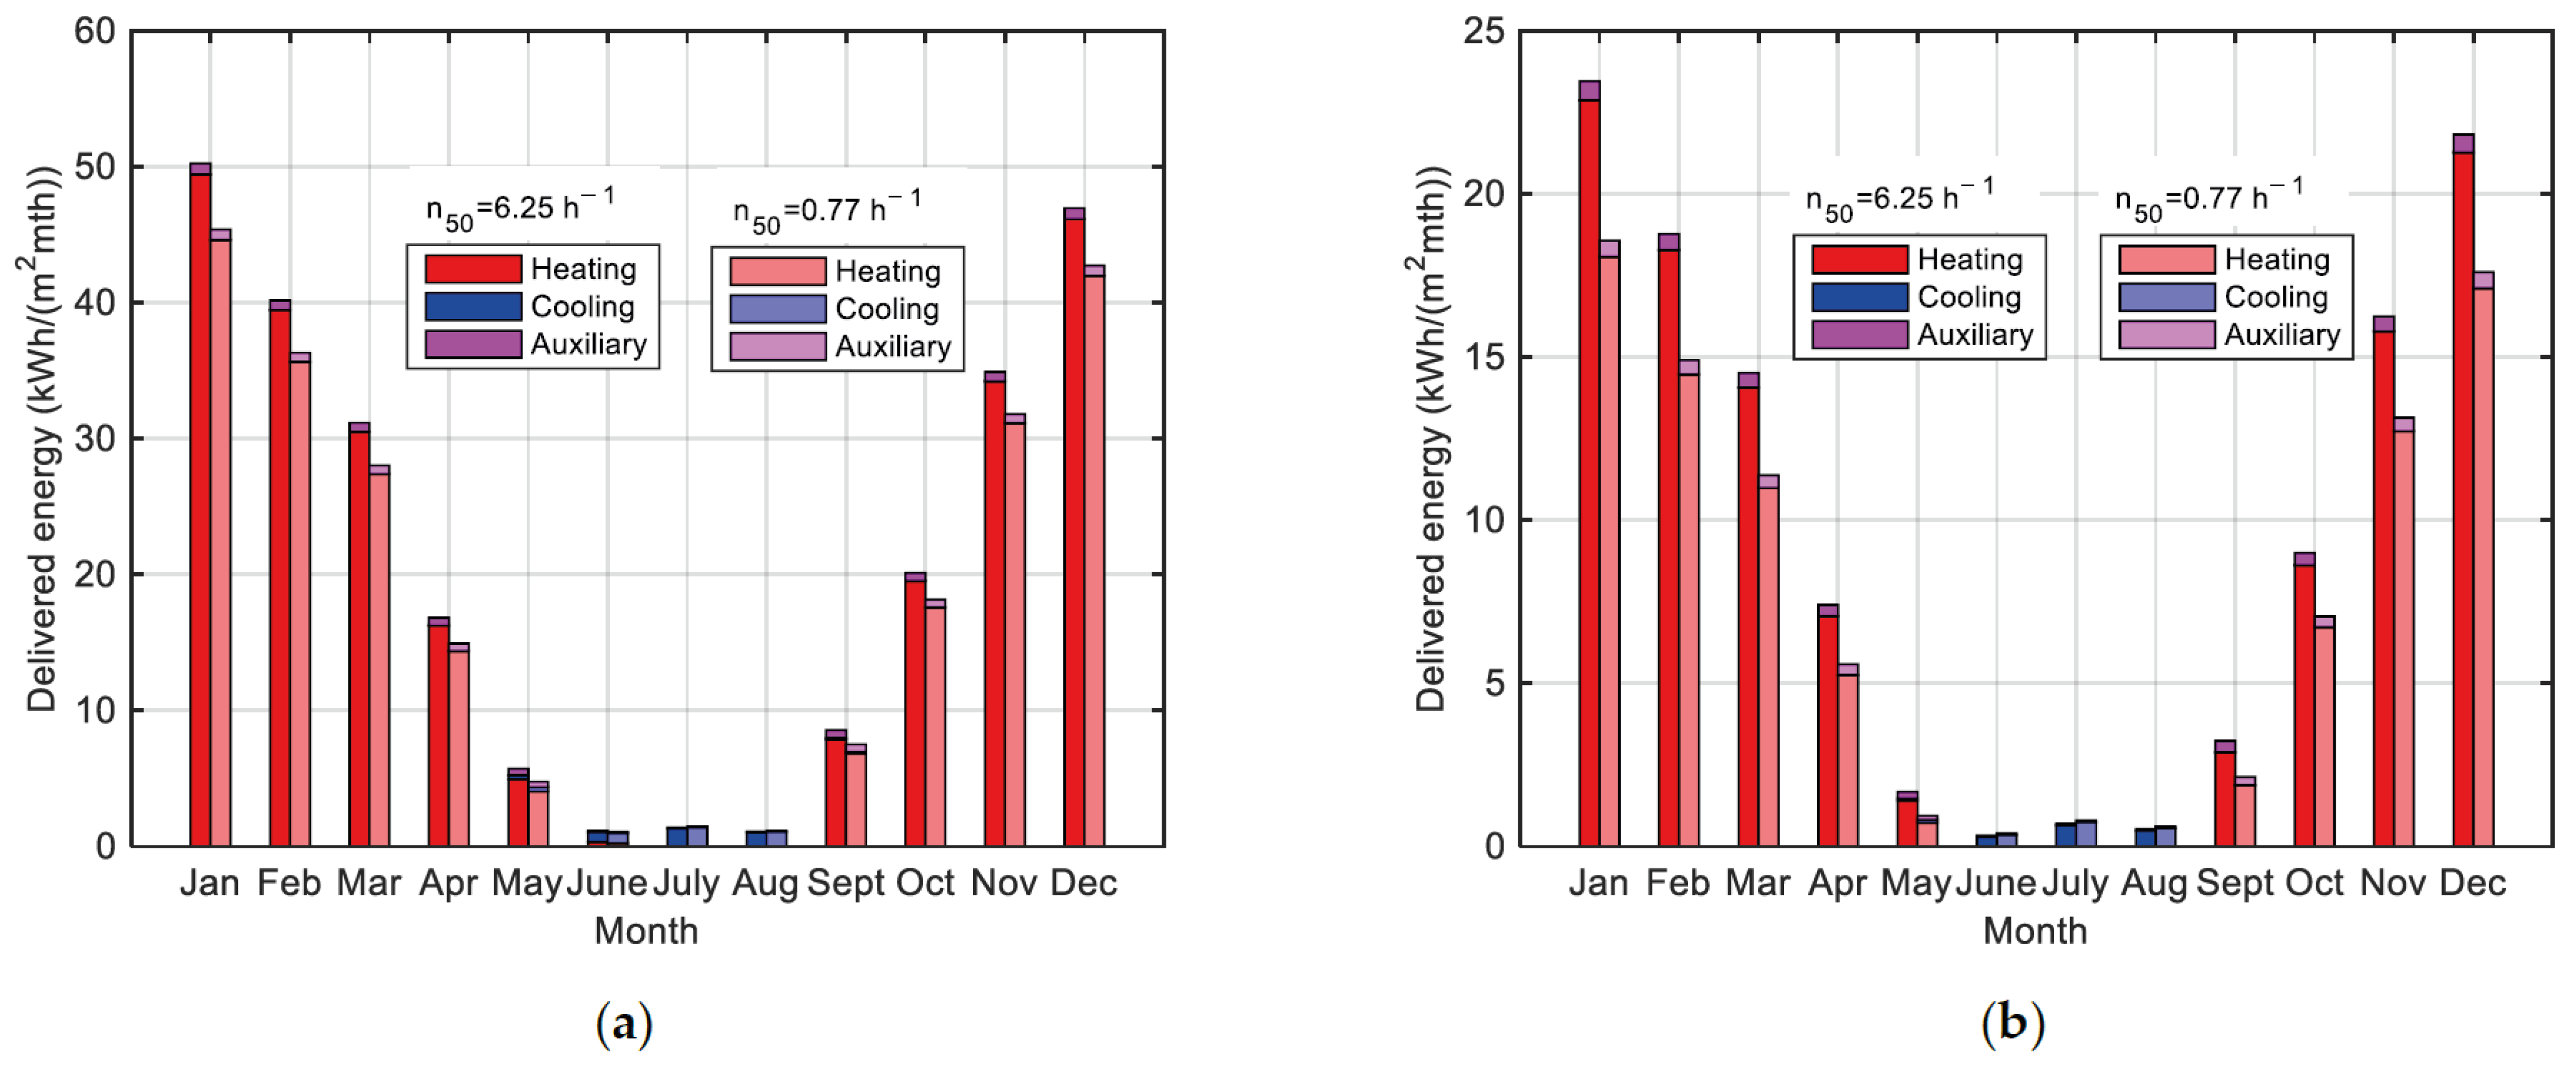
  • By increasing airtightness through windows replacement, energy consumption for heating is significantly reduced, while the reduction in energy consumption for cooling is practically negligible;
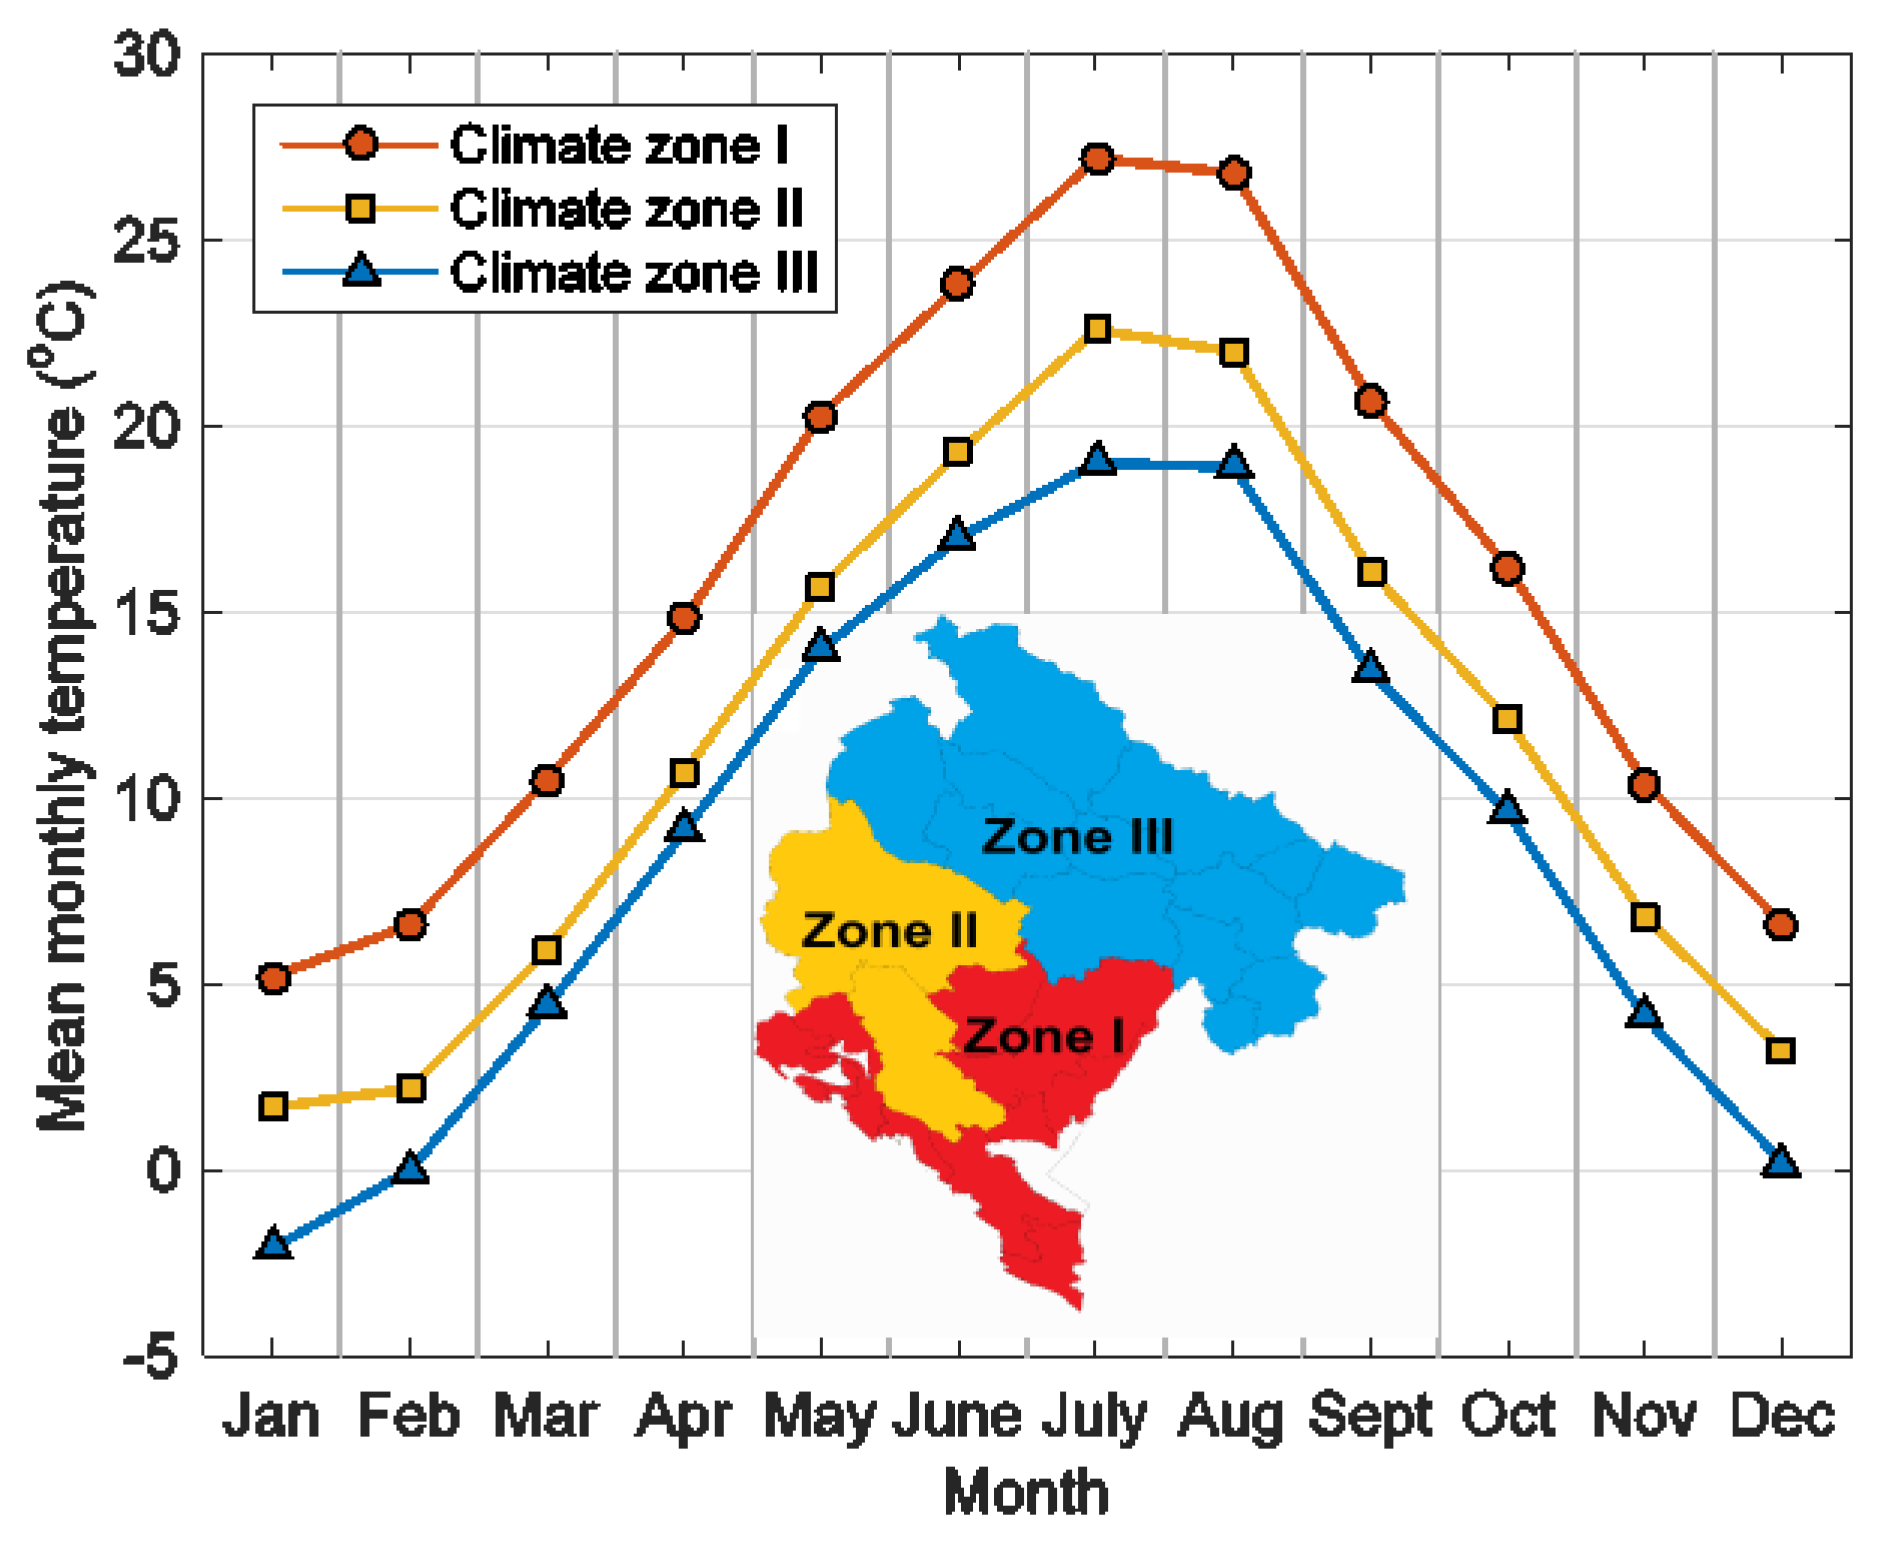
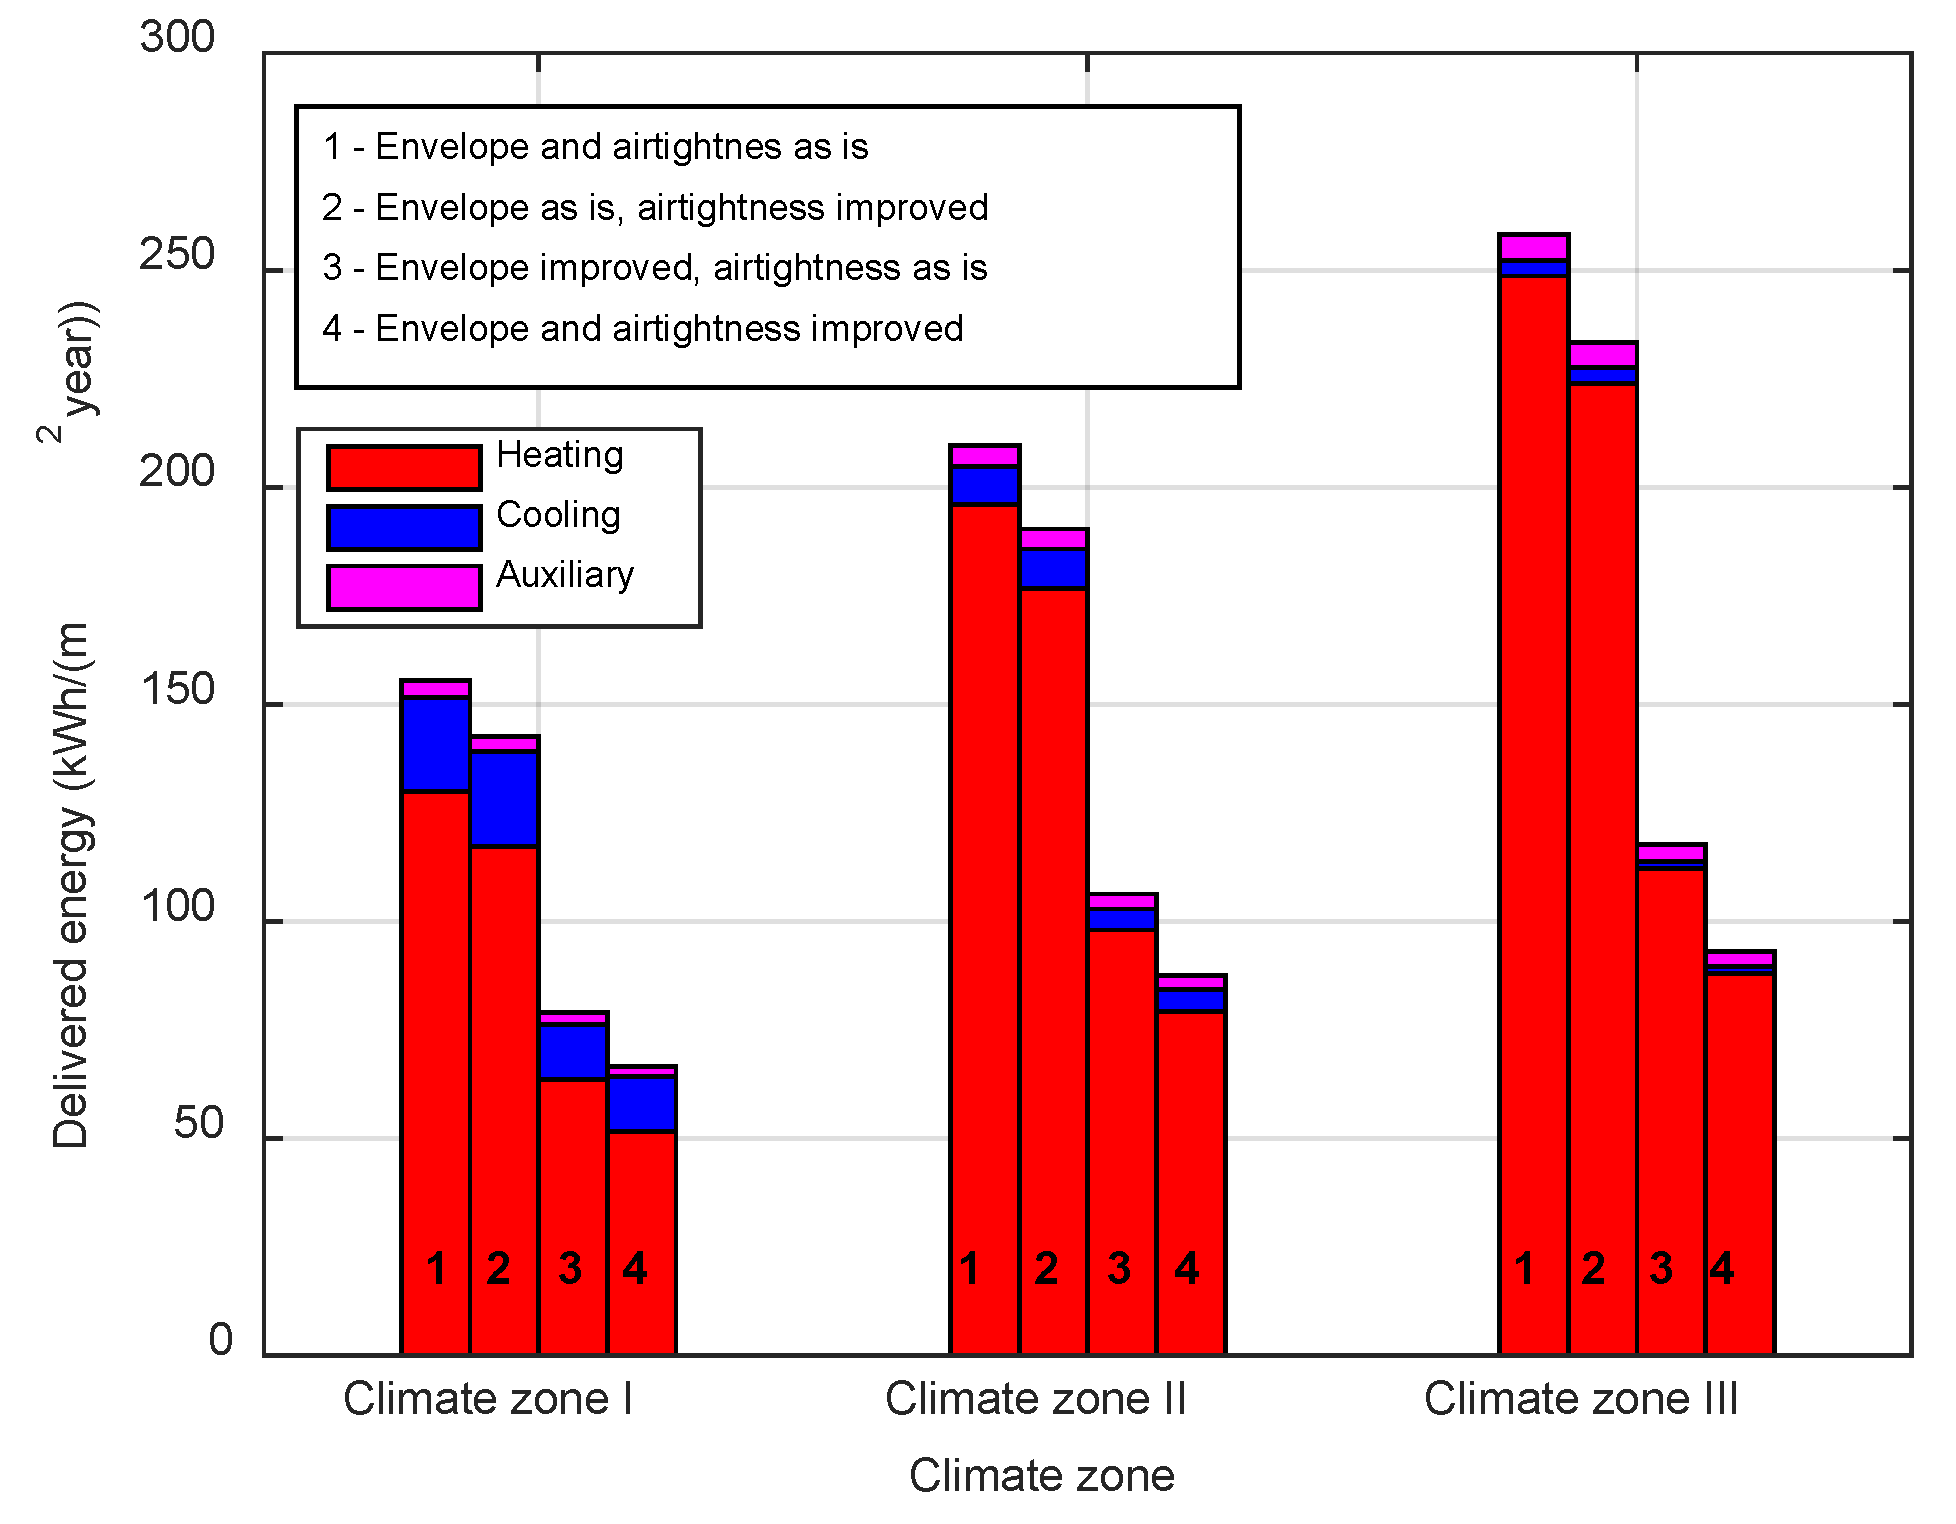
  • In relative terms, the reduction in energy consumption due to the increase in airtightness is more pronounced in colder climates and when the thermal envelope is improved so that heat transfer losses through the envelope are reduced;
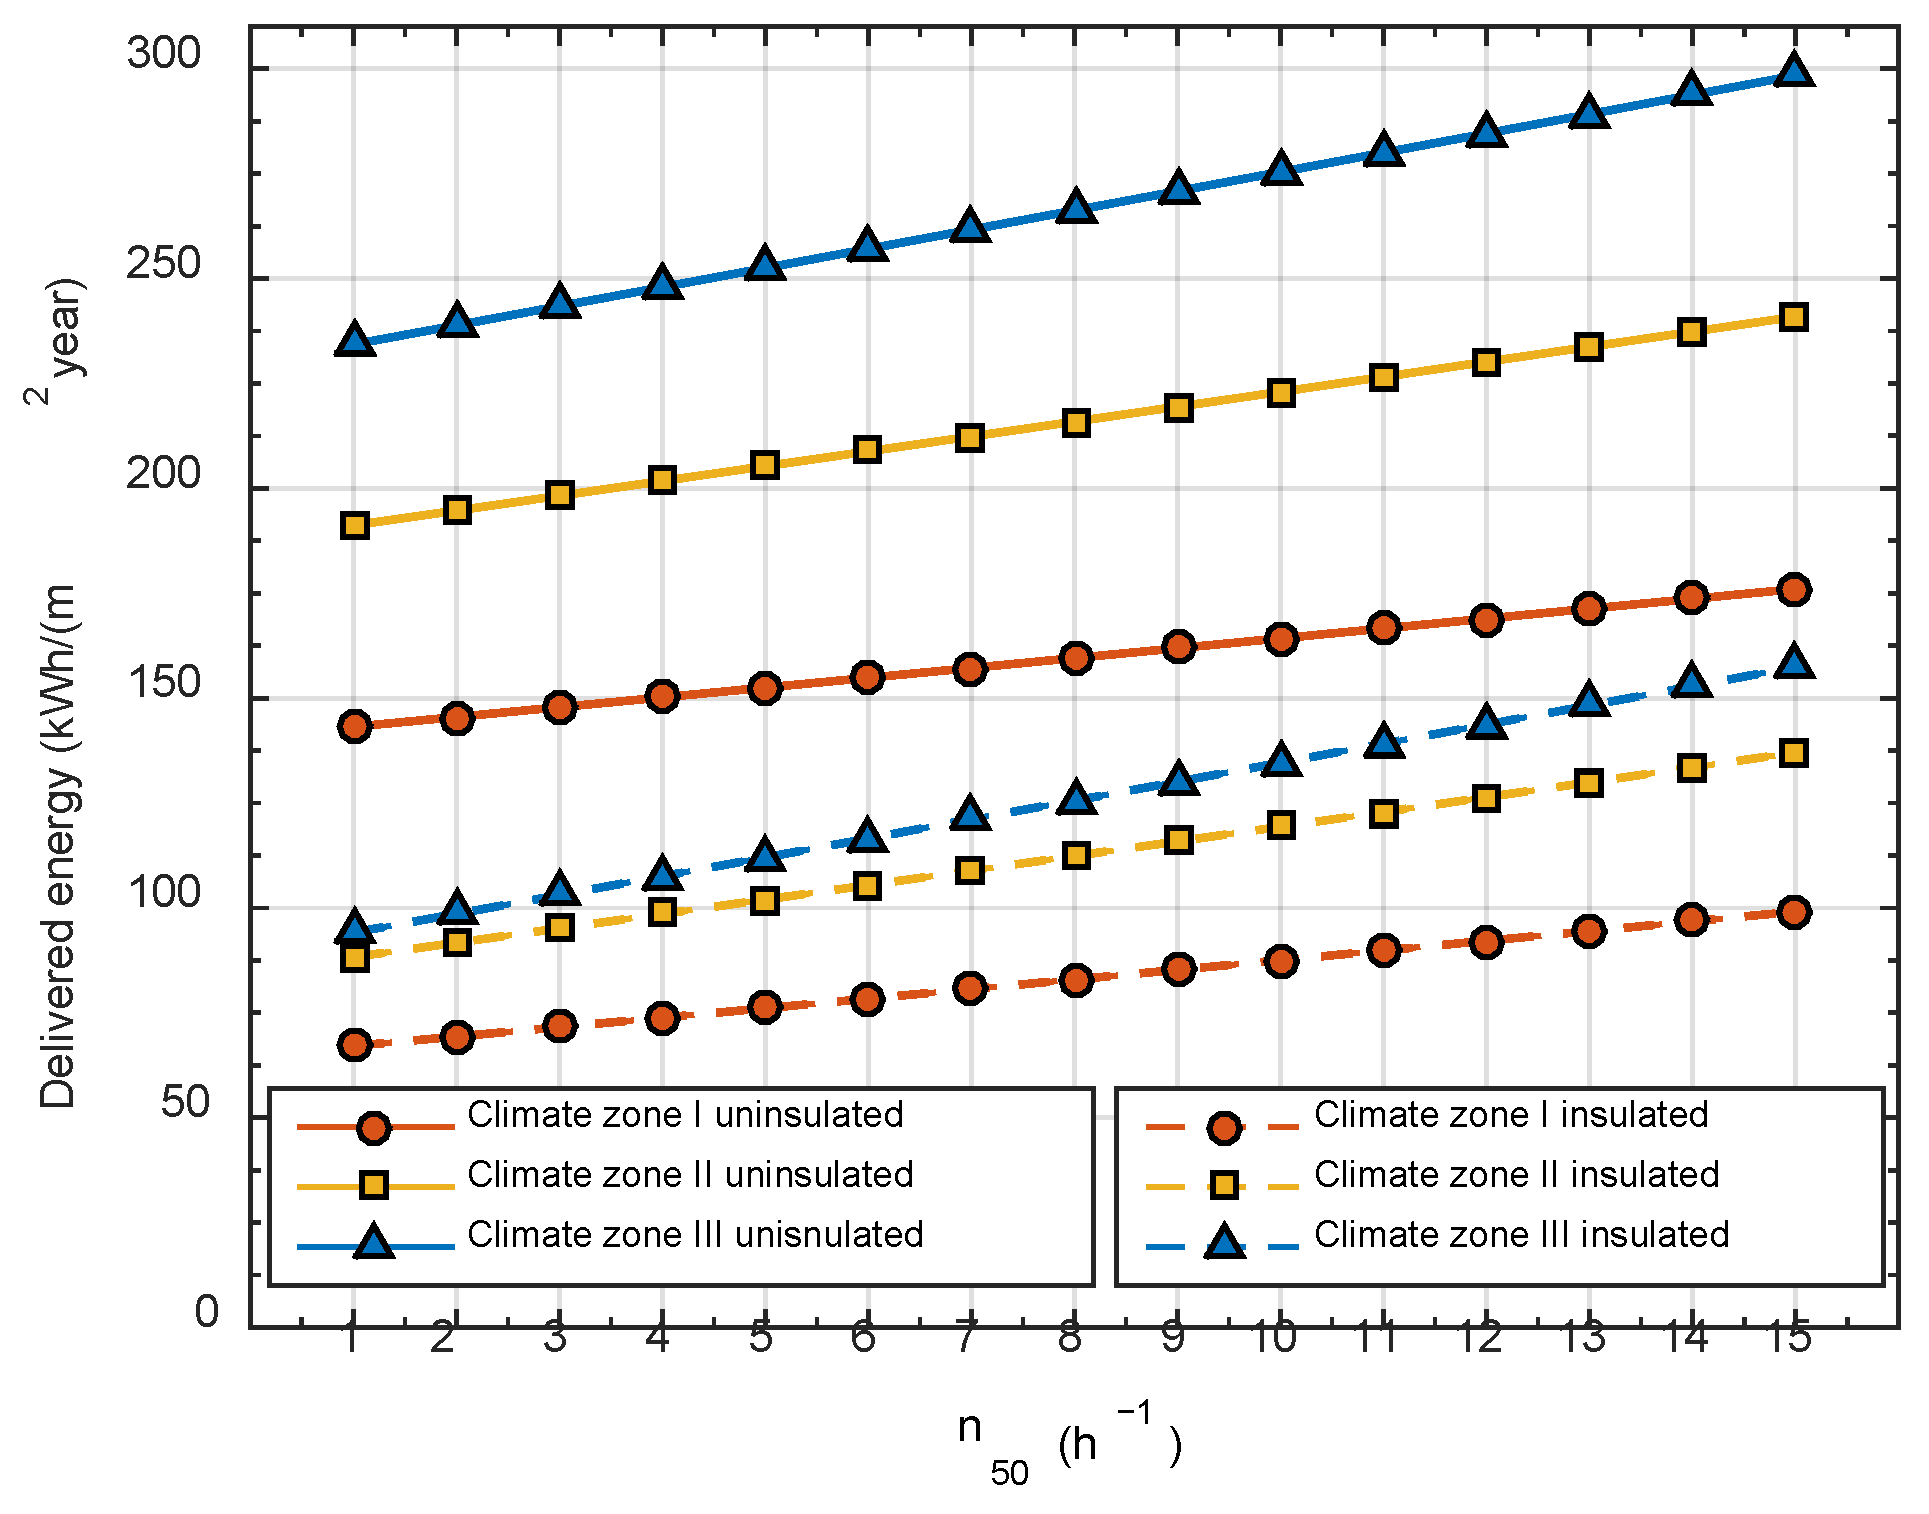
  • Energy consumption increases linearly with increasing air leakage rate. When n50 increases by a unit value, energy consumption increases from 2.3 kWh/m2·year in Climate zone I to 4.6 kWh/m2·year in Climate zone III.
Although the analyzed building can be considered representative for the period of the last quarter of the 20th century, to which a significant part of the building stock of Montenegro belongs, in order to obtain statistically credible results, a larger sample of buildings should be considered. Data obtained in this way would provide recommendations for airtightness values in the software for calculating the energy performance of buildings and would be the basis for future updates of the existing regulation on minimum energy efficiency requirements. Another direction of future research would include the use of the whole-building energy simulation software such as EnergyPlus to simulate the time variation of infiltration rates and its impact on indoor air quality.

Author Contributions

Conceptualization, E.T. and I.V.; methodology, E.T and I.V.; software, E.T.; validation, E.T. and M.Š.; formal analysis, I.V.; investigation, E.T. and M.Š.; resources, E.T.; writing—original draft preparation, E.T.; writing—review and editing, I.V. and M.Š.; visualization, E.T.; supervision, E.T. All authors have read and agreed to the published version of the manuscript.

Funding

This research received no external funding.

Data Availability Statement

Data sharing not applicable.

Conflicts of Interest

The authors declare no conflict of interest.

References

  1. European Commission. In Focus: Energy Efficiency in Buildings. Available online: http://commission.europa.eu/news/focus-energy-efficiency-buildings-2020-02-17_en (accessed on 21 December 2022).
  2. European Parliament. Directive 2010/31/EU of the European Parliament and of the Council of 19 May 2010 on the Energy Performance of Buildings (Recast). 2010/31/EU. Off. J. Eur. Union 2010, 153, 13. Available online: http://eur-lex.europa.eu/LexUriServ/LexUriServ.do?uri=OJ:L:2010:153:0013:0035:EN:PDF (accessed on 21 December 2022).
  3. Government of Montenegro. Rulebook on Minimum Energy Efficiency Requirements of Buildings. Official Gazette of Montenegro, No. 75/15. Available online: https://www.gov.me/en/documents/bebd6764-d23f-4a05-8e3a-349716321483 (accessed on 21 December 2022).
  4. Cardoso, V.E.M.; Pereira, P.F.; Ramos, N.M.M.; Almeida, R.M.S.F. The Impacts of Air Leakage Paths and Airtightness Levels on Air Change Rates. Buildings 2020, 10, 55. [Google Scholar] [CrossRef] [Green Version]
  5. Fraunhofer Institute of Building Physics. MEEC—Montenegrin Energy Efficiency Certification. Available online: https://www.meec.me/index.php/en/ (accessed on 21 December 2021).
  6. DIN Standard V 18599-1:2018-09; Energy Efficiency of Buildings—Calculation of the Net, Final and Primary Energy Demand for Heating, Cooling, Ventilation, Domestic hot Water and Lighting—Part 1: General Balancing Procedures, Terms and Definitions, Zoning and Evaluation of Energy Sources. German Institute for Standardization: Berlin, Germany, 2018.
  7. Sherman, M.H.; Chan, W.R. Building Air Tightness: Research and Practice. In Building Ventilation: The State of the Art, 1st ed.; Santamouris, M., Wouters, P., Eds.; Earthscan: London, UK, 2006; pp. 137–156. [Google Scholar]
  8. Sherman, M.H.; Dickerhoff, D. Airtightness of U.S. dwellings. ASHRAE Trans. 1998, 104, 1359–1367. [Google Scholar]
  9. McWilliams, J.; Jung, M. Development of a Mathematical Air-Leakage Model from Measured Data. Ernest Orlando Lawrence Berkeley National Laboratory. 2006. Available online: https://osti.gov/servlets/purl/883786 (accessed on 21 December 2022).
  10. Sinnott, D.; Dyer, M. Air-tightness field data for dwellings in Ireland. Build. Environ. 2012, 51, 269–275. [Google Scholar] [CrossRef]
  11. Jokisalo, J.; Kurnitski, J.; Korpi, M.; Kalamees, T.; Vinha, J. Building leakage, infiltration, and energy performance analyses for Finnish detached houses. Build. Environ. 2009, 44, 377–387. [Google Scholar] [CrossRef]
  12. Pan, W. Relationships between airtightness and its influencing factors of post-2006 new-build dwellings in the UK. Build. Environ. 2010, 45, 2387–2399. [Google Scholar] [CrossRef]
  13. Carrié, R.; Jobert, R.; Fournier, M.; Berthault, S. Perméabilité à l’air del’enveloppe des Batiments. Generalites et Sensibilization; CETE de Lyon: Lyon, France, 2006. [Google Scholar]
  14. Sfakianaki, A.; Pavlou, K.; Santamouris, M.; Livada, I.; Assimakopoulos, M.N.; Mantas, P.; Christakopoulos, A. Air tightness measurements of residential houses in Athens, Greece. Build. Environ. 2008, 43, 398–405. [Google Scholar] [CrossRef]
  15. D’Ambrosio Alfano, F.R.; Dell’Isola, M.; Ficco, G.; Tassini, F. Experimental analysis of air tightness in Mediterranean buildings using the fan pressurization method. Build. Environ. 2012, 53, 16–25. [Google Scholar] [CrossRef]
  16. Villi, G.; Peretti, C.; Graci, S.; De Carli, M. Building leakage analysis and infiltration modelling for an Italian multi-family building. J. Build. Perform. Simul. 2013, 6, 98–118. [Google Scholar] [CrossRef]
  17. Pinto, M.; Viegas, J.; de Freitas, V.P. Air permeability measurements of dwellings and building components in Portugal. Build. Environ. 2011, 46, 2480–2489. [Google Scholar] [CrossRef] [Green Version]
  18. Salehi, A.; Torres, I.; Ramos, A. Experimental analysis of building airtightness in traditional residential Portuguese buildings. Energy Build. 2017, 151, 198–205. [Google Scholar] [CrossRef]
  19. Feijó-Muñoz, J.; Poza-Casado, I.; González-Lezcano, R.A.; Pardal, C.; Echarri, V.; Assiego De Larriva, R.; Fernández-Agüera, J.; Dios-Viéitez, M.J.; Del Campo-Díaz, V.J.; Montesdeoca Calderín, M.; et al. Methodology for the Study of the Envelope Airtightness of Residential Buildings in Spain: A Case Study. Energies 2018, 11, 704. [Google Scholar] [CrossRef] [Green Version]
  20. D’Ambrosio Alfano, F.R.; Dell’Isola, M.; Ficco, G.; Palella, B.I.; Riccio, G. Experimental Air-Tightness Analysis in Mediterranean Buildings after Windows Retrofit. Sustainability 2016, 8, 991. [Google Scholar] [CrossRef] [Green Version]
  21. Gillott, M.C.; Loveday, D.L.; White, J.; Wood, C.J.; Chmutina, K.; Vadodaria, K. Improving the airtightness in an existing UK dwelling: The challenges, the measures and their effectiveness. Build. Environ. 2016, 95, 227–239. [Google Scholar] [CrossRef] [Green Version]
  22. Paukštys, V.; Cinelis, G.; Mockienė, J.; Daukšys, M. Airtightness and Heat Energy Loss of Mid-Size Terraced Houses Built of Different Construction Materials. Energies 2021, 14, 6367. [Google Scholar] [CrossRef]
  23. Balaras, C.A.; Gaglia, A.G.; Georgopoulou, E.; Mirasgedis, S.; Sarafidis, Y.; Lalas, D.P. European residential buildings and empirical assessment of the Hellenic building stock, energy consumption, emissions and potential energy savings. Build. Environ. 2007, 42, 1298–1314. [Google Scholar] [CrossRef]
  24. Poza-Casado, I.; Meiss, A.; Padilla-Marcos, M.Á.; Feijó-Muñoz, J. Airtightness and energy impact of air infiltration in residential buildings in Spain. Int. J. Vent. 2021, 20, 258–264. [Google Scholar] [CrossRef]
  25. Feijó-Muñoz, J.; Pardal, C.; Echarri, V.; Fernández-Agüera, J.; Assiego de Larriva, R.; Montesdeoca Calderín, M.; Poza-Casado, I.; Padilla-Marcos, M.A.; Meiss, A. Energy impact of the air infiltration in residential buildings in the Mediterranean area of Spain and the Canary Islands. Energy Build. 2019, 188–189, 226–238. [Google Scholar] [CrossRef]
  26. RAL-Gütegemeinschaft Fenster, Fassaden und Haustüren e.V. Frankfurt; ift Institut für Fenstertechnik Rosenheim. Leitfaden zur Planung und Ausführung der Montage von Fenstern und Haustüren für Neubau und Renovierung; RAL-Gütegemeinschaft Fenster, Fassaden und Haustüren e.V. Frankfurt: Frankfurt am Main, Germany, 2020. [Google Scholar]
  27. CAN/CGSB Standard 149.10-2019; Determination of the Air Tightness of Building Envelopes by the Fan Depressurization Method. Canadian General Standard Board: Ottawa, ON, Canada, 2019.
  28. ASTM Standard E779-19; Standard Test Method for Determining Air Leakage Rate by Fan Pressurization. American Society of Testing and Materials: West Conshohocken, PA, USA, 2019.
  29. ISO Standard 9972:2015; Thermal Performance of Buildings—Determination of Air Permeability of Buildings—Fan Pressurization Method. International Organization for Standardization: Geneva, Switzerland, 2015.
  30. Kottek, M.; Grieser, J.; Beck, C.; Rudolf, B.; Rubel, F. World Map of the Köppen-Geiger climate classification updated. Meteorol. Z 2006, 15, 259–263. [Google Scholar] [CrossRef] [PubMed]
Figure 1. Apartment layout.
Energies 16 02208 g001
Figure 2. Airtightness measurement using blower door fan.
Energies 16 02208 g002
Figure 3. Air leakage graph: (a) before windows replacement; and (b) after windows replacement.
Energies 16 02208 g003
Figure 4. Mean monthly temperatures for three climatic zones in Montenegro.
Energies 16 02208 g004
Figure 5. Monthly delivered energy for heating and cooling before and after windows replacement, Climate zone I: (a) existing thermal envelope; and (b) improved thermal envelope.
Energies 16 02208 g005
Figure 6. Monthly delivered energy for heating and cooling before and after windows replacement, Climate zone III: (a) existing thermal envelope; and (b) improved thermal envelope.
Energies 16 02208 g006
Figure 7. Delivered energy for heating and cooling before and after application of measures to improve the thermal envelope and airtightness.
Energies 16 02208 g007
Figure 8. Delivered energy vs. n50.
Energies 16 02208 g008
Table 1. Summary of air leakage metrics.
Metric and DefinitionEquationUnit
Air leakage rate at the reference pressure difference of 50 Pa, V ˙ 50 V ˙ 50 = C L 50   Pa n m3/h
Air change rate at the reference pressure difference of 50 Pa, n 50 n 50 = V ˙ 50 V 1/h
The air change rate at the reference pressure difference of 50 Pa, n 50 , is calculated by dividing the air leakage rate at 50 Pa, V ˙ 50 , by the internal volume, V .
Air permeability at the reference pressure difference, q 50 q 50 = V ˙ 50 A E m3/h/m2
The air permeability at the reference pressure difference of 50 Pa is calculated by dividing the air leakage rate at 50 Pa, V ˙ 50 , by the envelope area AE.
Specific leakage rate at the reference pressure difference, w50 w 50 = V ˙ 50 A F m3/h/m2
The specific leakage rate at the reference pressure difference of 50 Pa is calculated by dividing the air leakage rate at 50 Pa by the net floor area AF.
Effective leakage area, ELA E L A = c L 4 n 0.5 ρ 2 m2
Effective leakage area is the area of a fictitious orifice that allows the same air flow as the building envelope at the pressure difference of 4 Pa.
Table 2. Summary of the blower door test results before and after windows replacement.
ValueBeforeAfter
Air leakage rate, V ˙ 50 (m3/h)1418174
Air change rate, n 50   (1/h)6.250.77
Air permeability, q 50 (m3/h/m2)11.531.41
Specific leakage rate, w 50 (m3/h/m2)16.692.05
Effective leakage area, ELA (cm2)334.537.5
Building Leakage Curve
 Air leakage coefficient, c L (m3/h/Pan)134.814.4
 Air flow exponent, n 0.6020.637
Table 3. Delivered energy for heating and cooling before and after replacement of windows with existing and improved thermal envelope.
Climate ZoneBuilding Envelopen50 (h−1)Delivered Energy (kWh/m2·year)
HeatingCoolingAuxiliaryTotal
IExisting
thermal envelope
6.25129.8421.783.82155.44
0.77117.3221.733.58142.63
Improved
thermal envelope
6.2563.6012.672.6878.95
0.7751.5712.672.3766.61
IIExisting
thermal envelope
6.25196.018.844.85209.70
0.77176.709.064.61190.37
Improved
thermal envelope
6.2598.024.853.43106.30
0.7779.285.133.1187.52
IIIExisting
thermal envelope
6.25248.673.506.04258.21
0.77223.853.685.73233.26
Improved
thermal envelope
6.25112.251.493.92117.66
0.7787.951.753.4193.11
Disclaimer/Publisher’s Note: The statements, opinions and data contained in all publications are solely those of the individual author(s) and contributor(s) and not of MDPI and/or the editor(s). MDPI and/or the editor(s) disclaim responsibility for any injury to people or property resulting from any ideas, methods, instructions or products referred to in the content.

