
A Battery Capacity Configuration Method of a Photovoltaic and Battery System Applied in a Building Complex for Increased Self-Sufficiency and Self-Consumption

Abstract
1. Introduction
- (1)
- A distributed storage scheme and centralized storage scheme of a building complex are proposed in this paper. The strengths of each scheme are compared based on the evaluation indicators.
- (2)
- The optimal allocation ratio of battery capacity with a distributed storage scheme is applied to the building complex.
- (3)
- A battery having a suitable size should be equipped to achieve high SSR and SCR for the centralized distributed scheme under different PV penetrations.
- (4)
- Evaluation criteria between SSR and SCR are selected while determining the battery configuration size of a building complex.
2. Materials and Methods
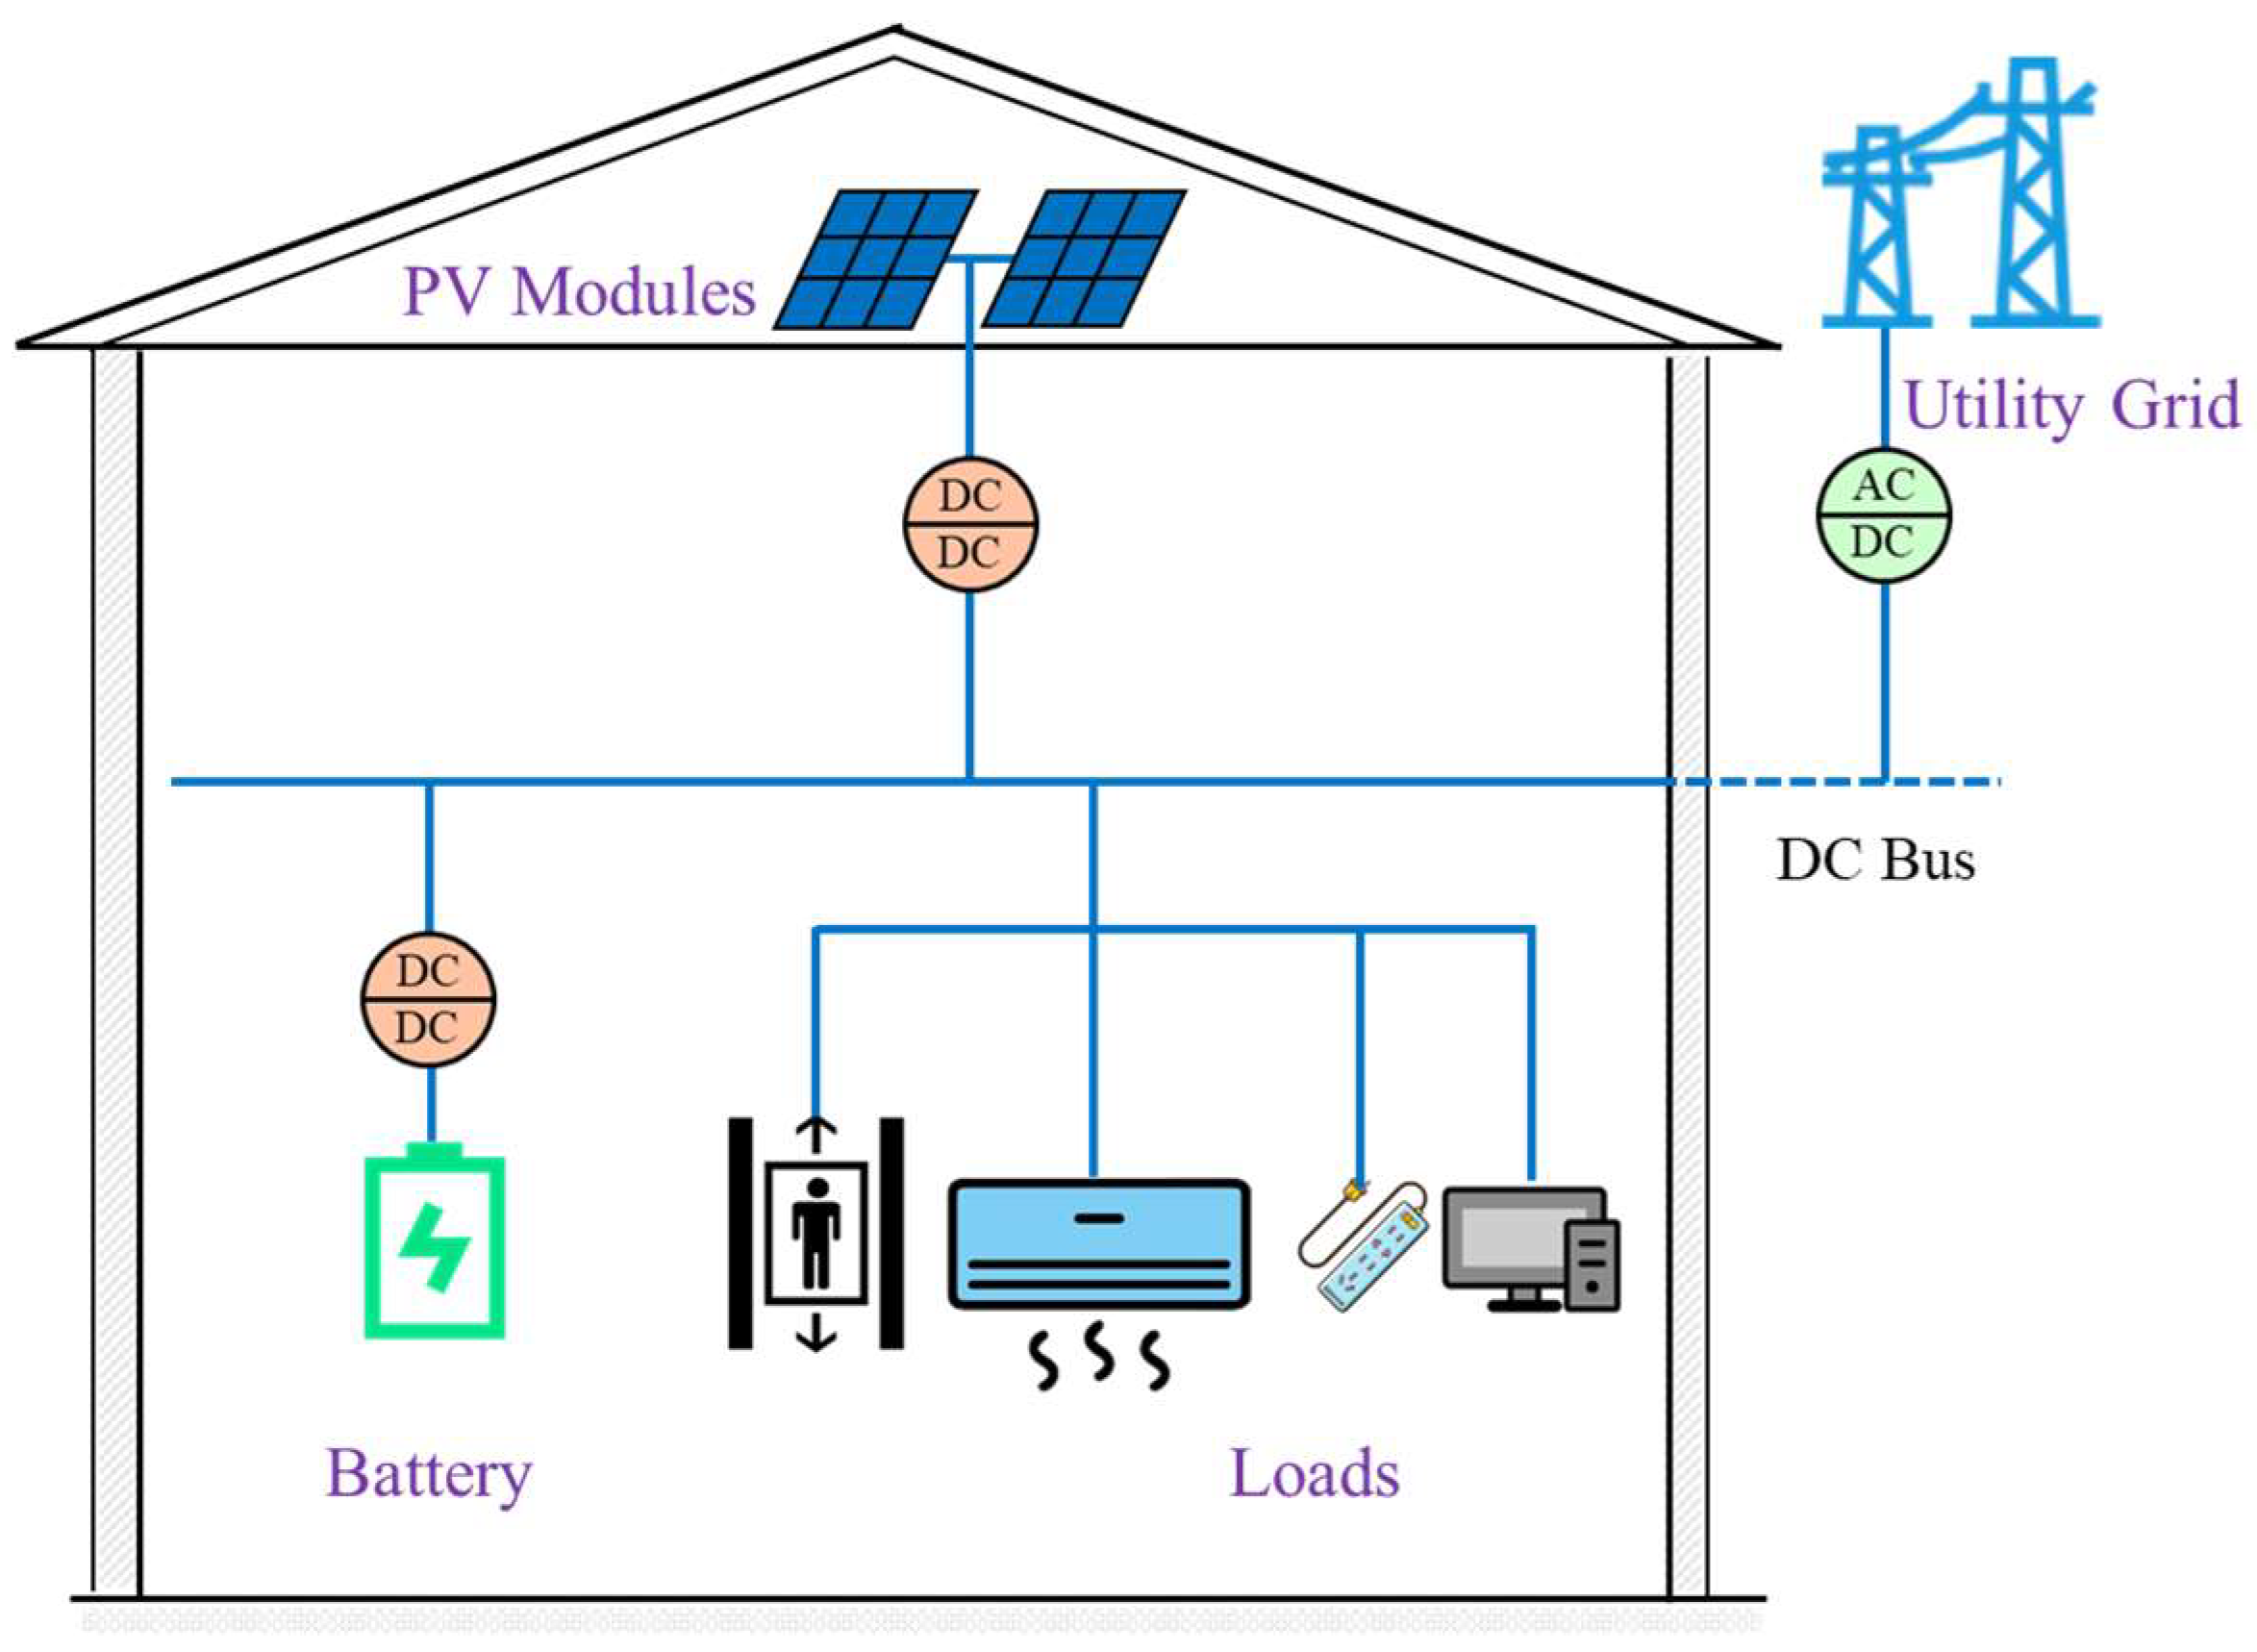
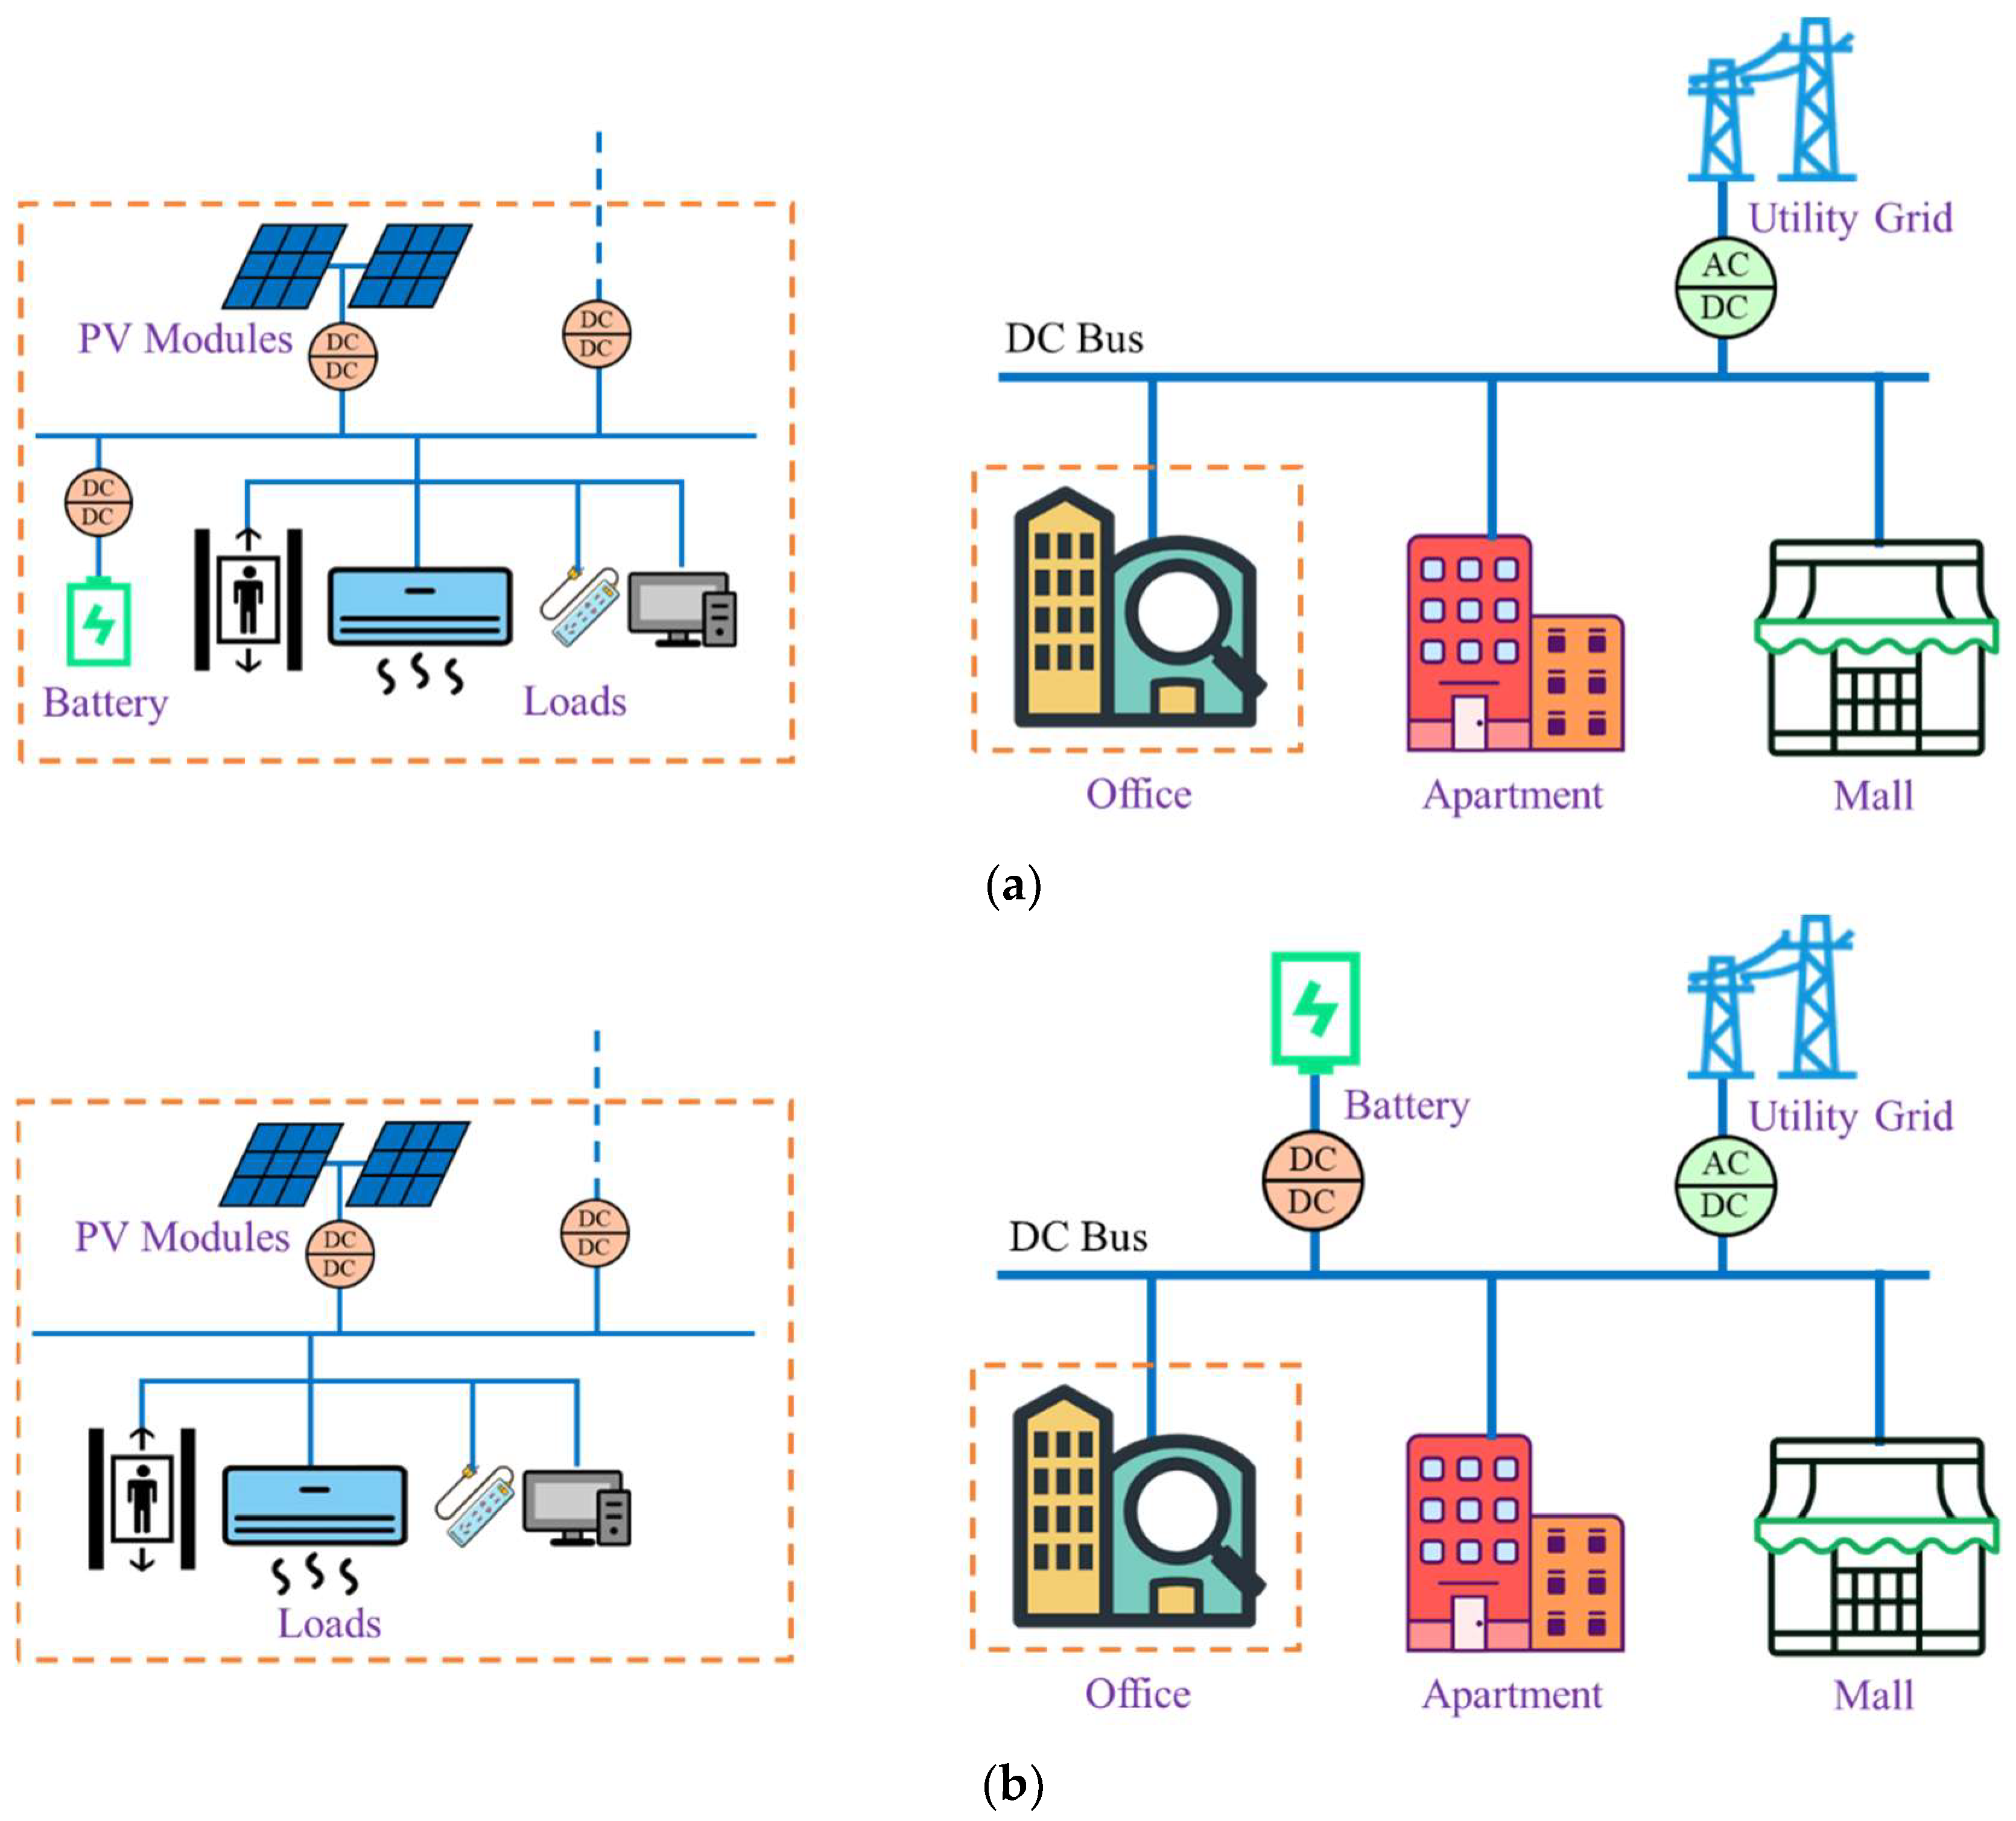
2.1. System Layout
2.2. System Model
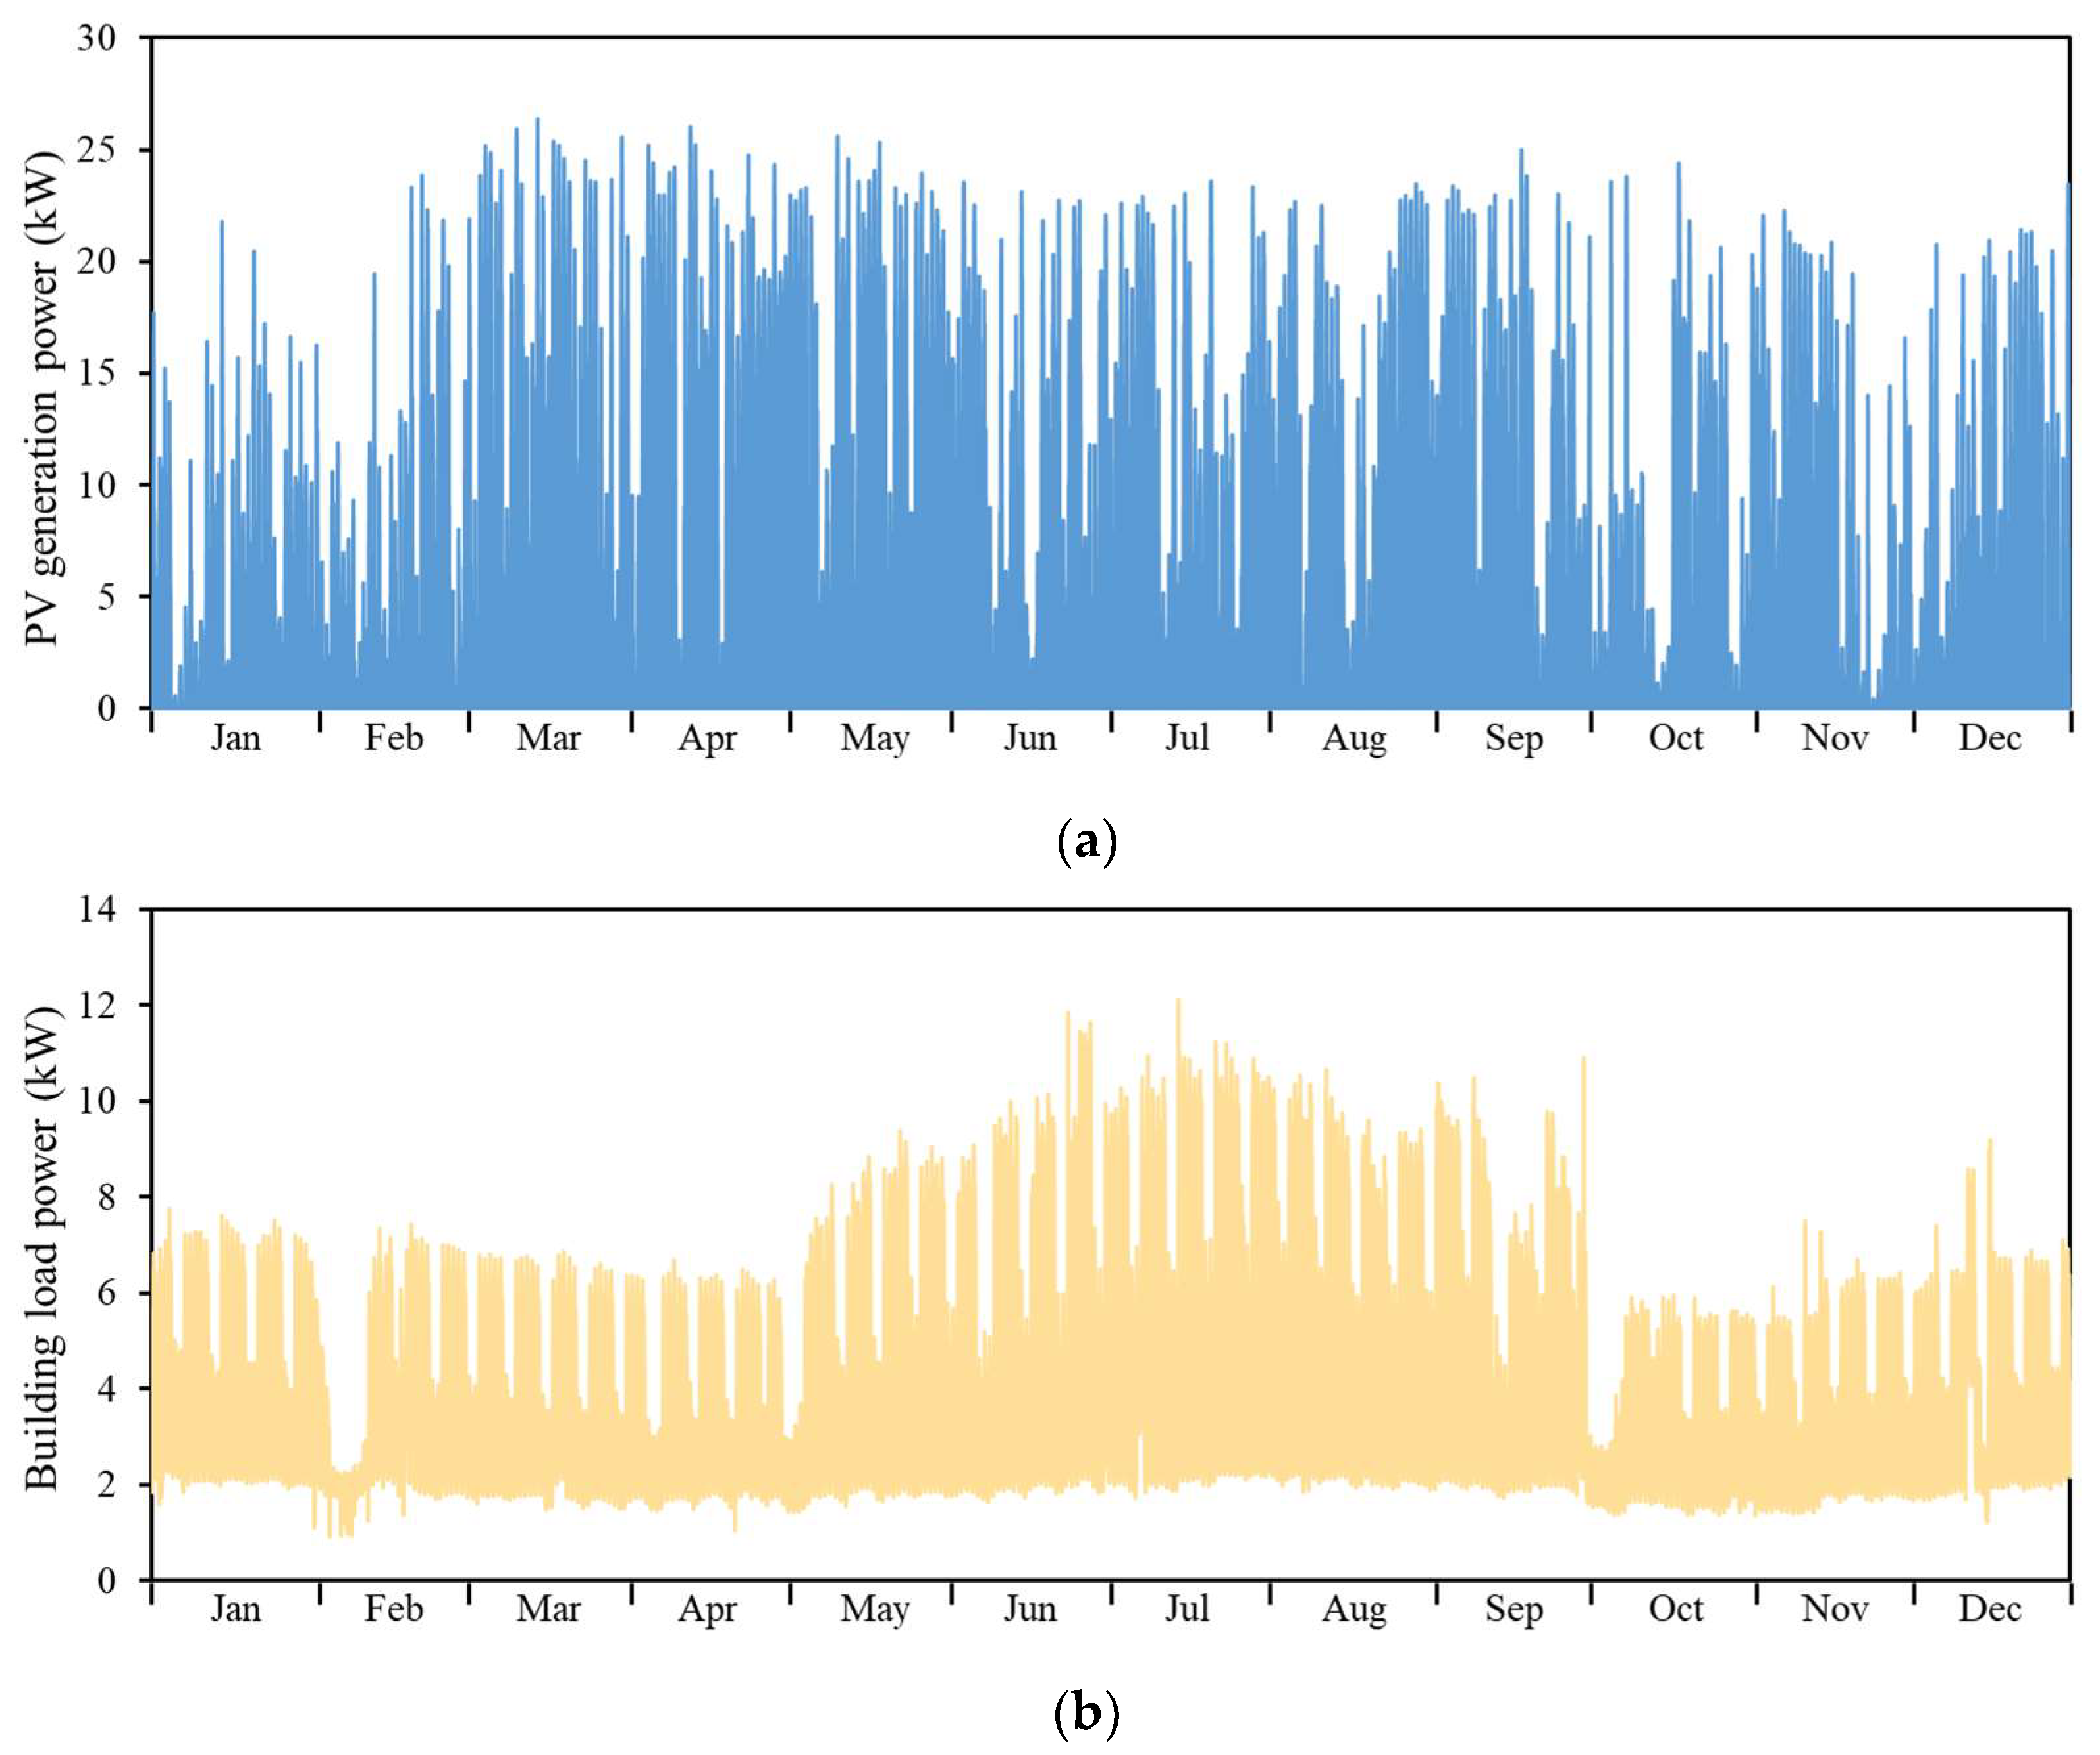
2.2.1. PV Generation
2.2.2. Battery System Model
2.3. Evaluation Indicators
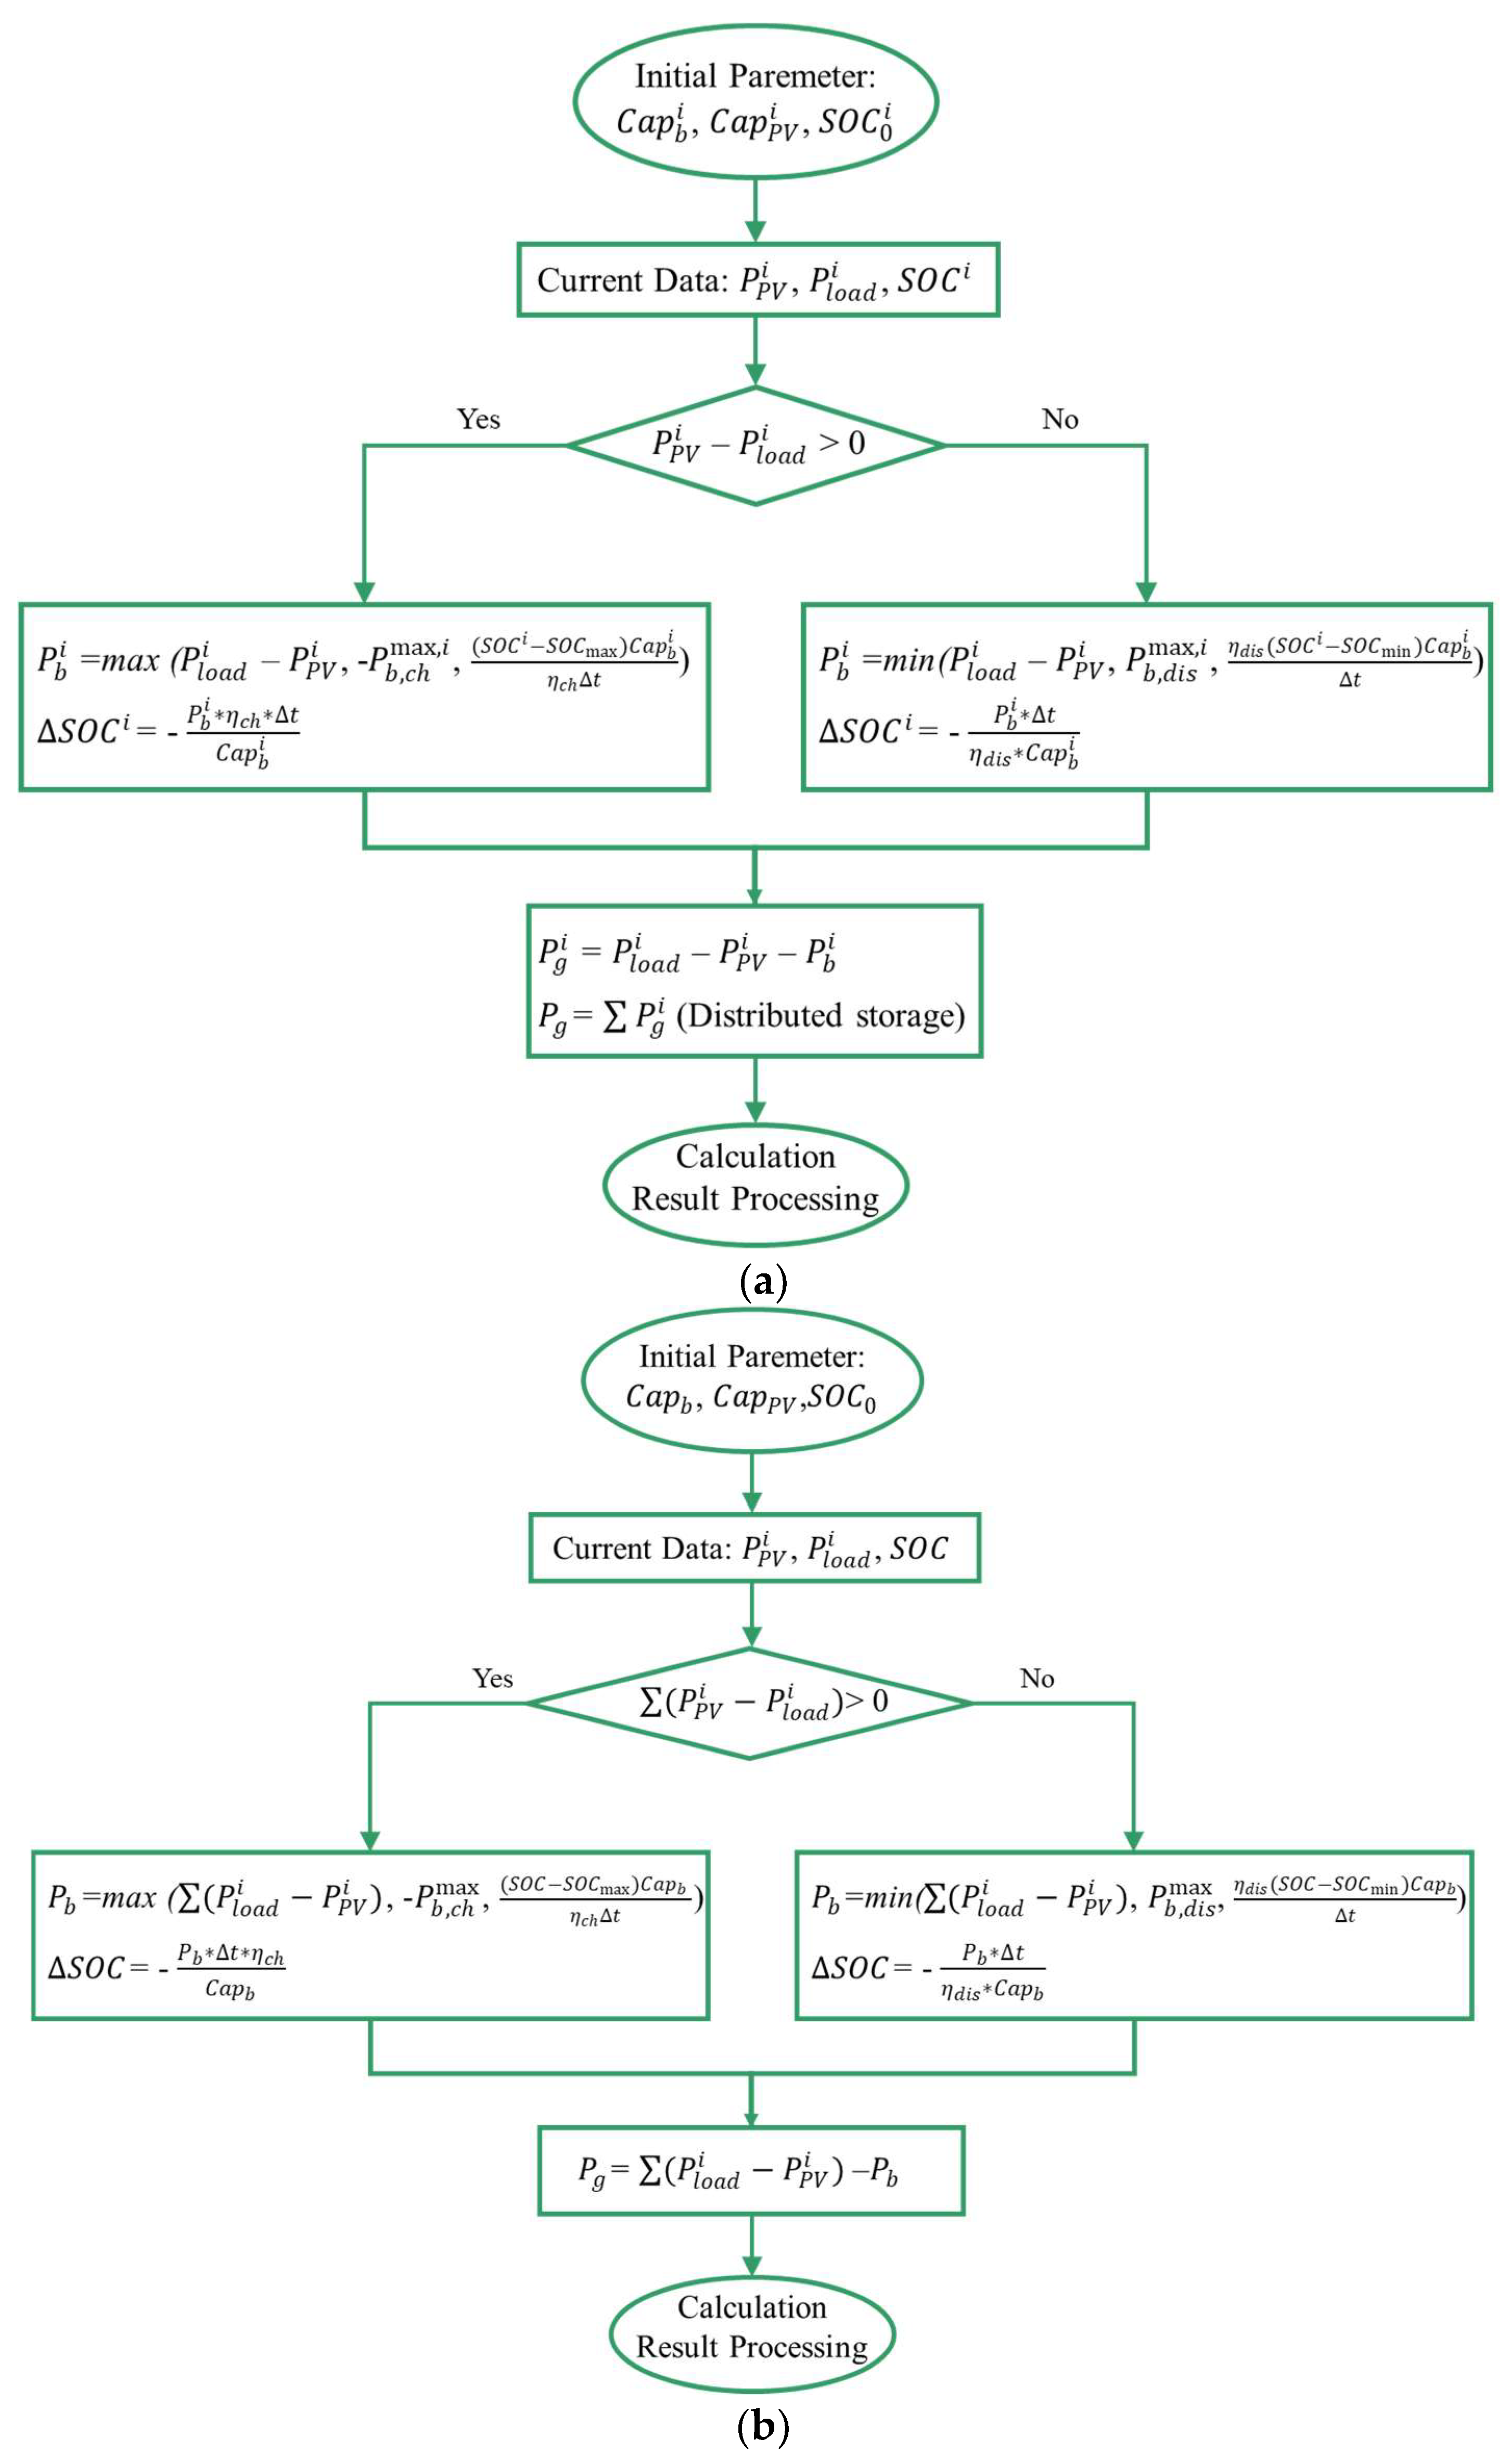
2.4. System Operation Strategy
3. Results
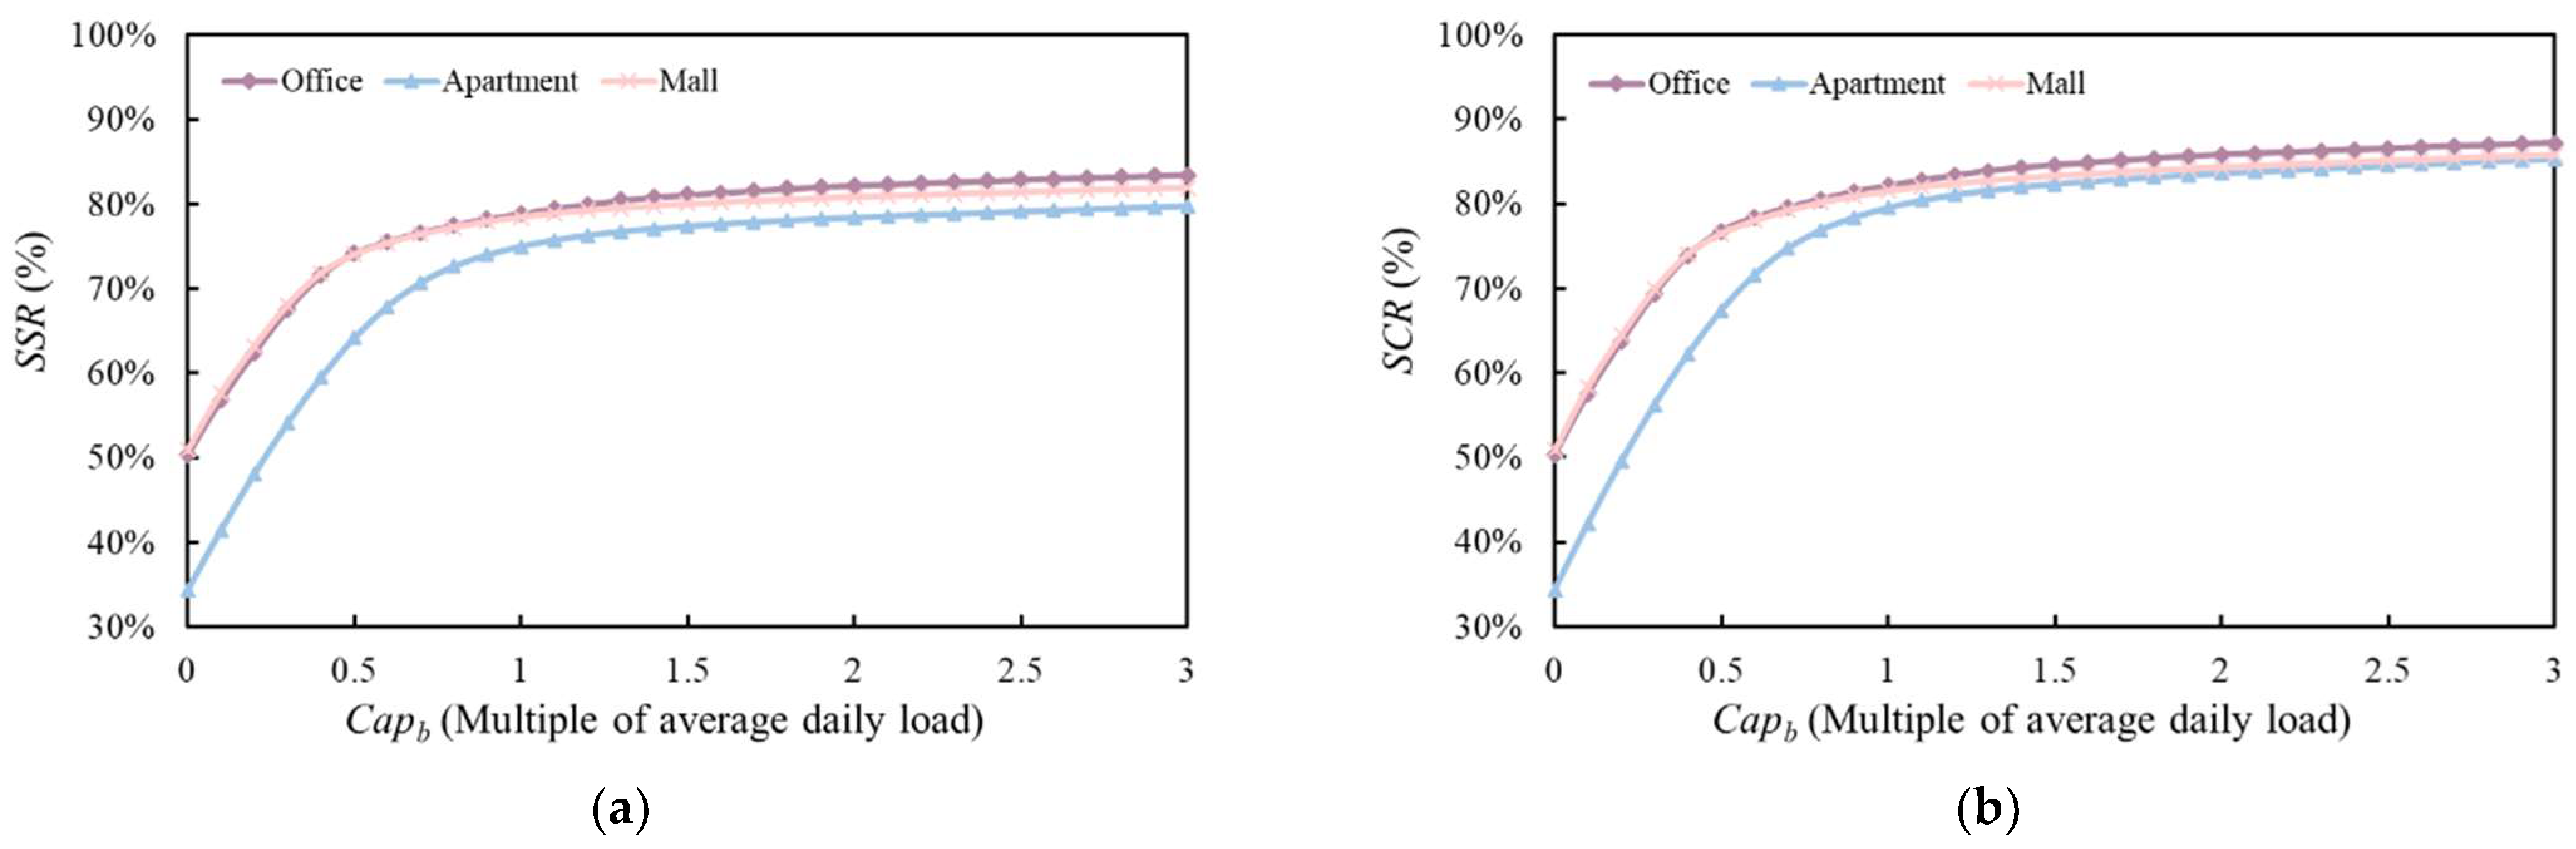
3.1. Single Building
3.2. Building Complex
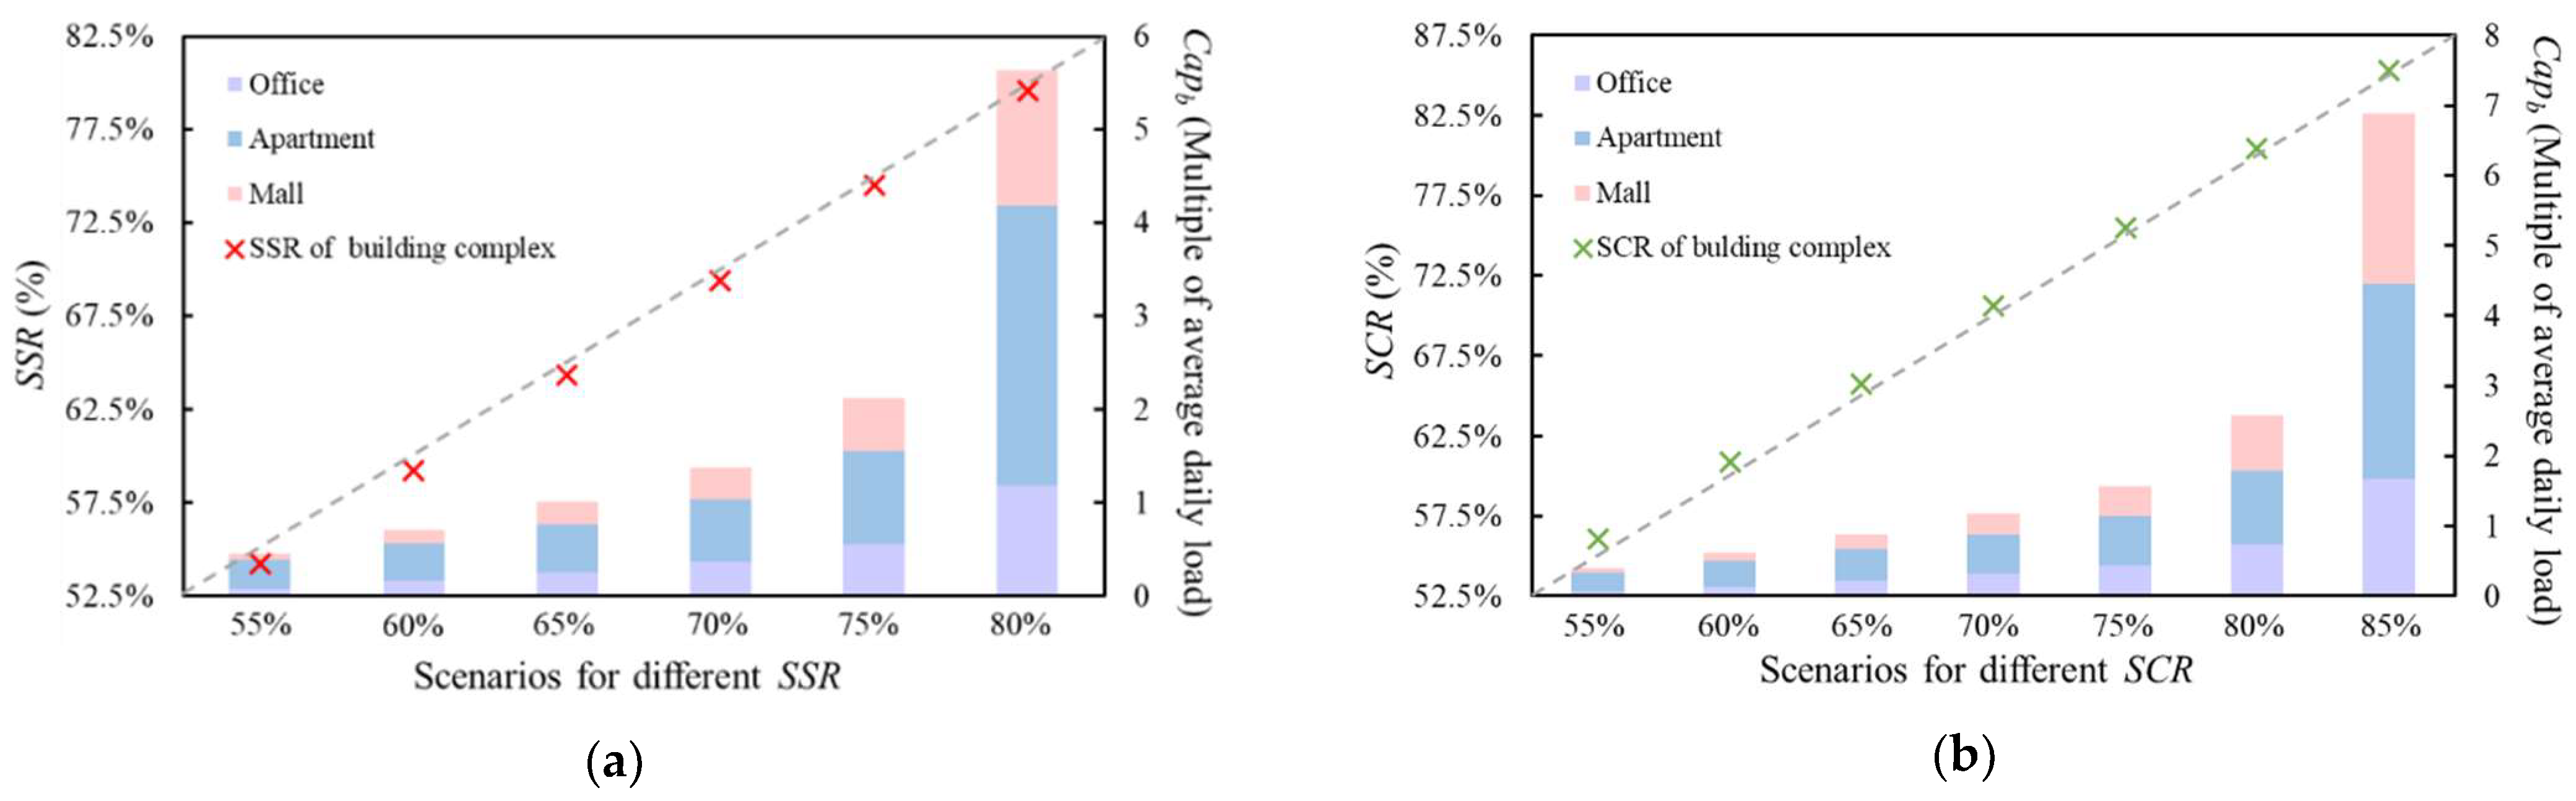
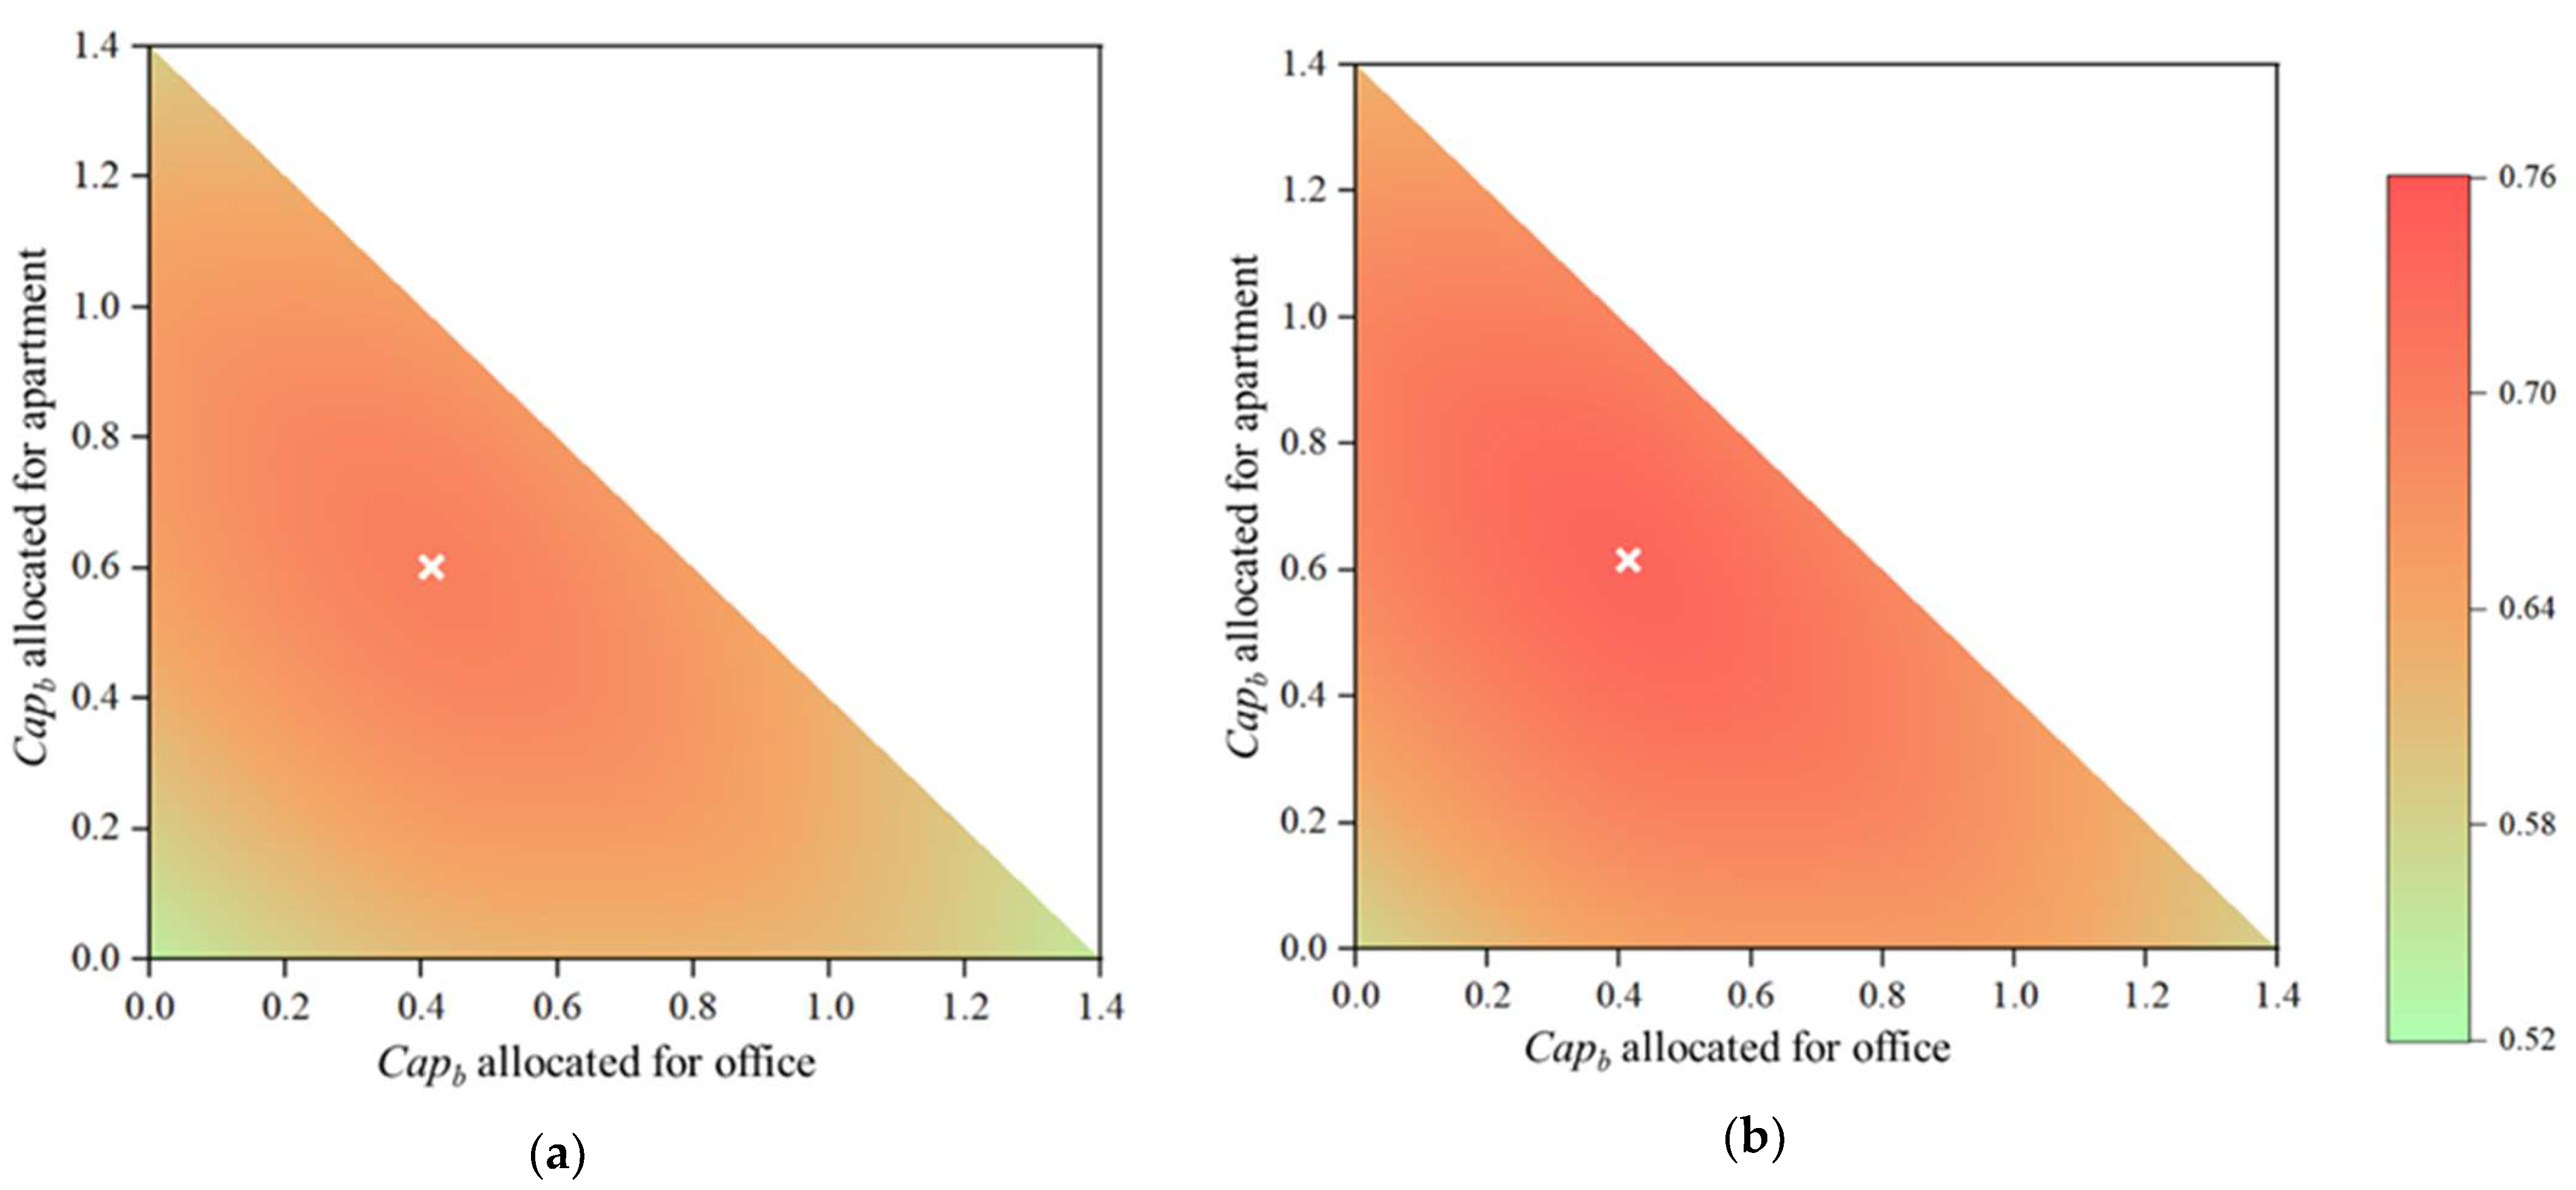
3.2.1. Distributed Storage
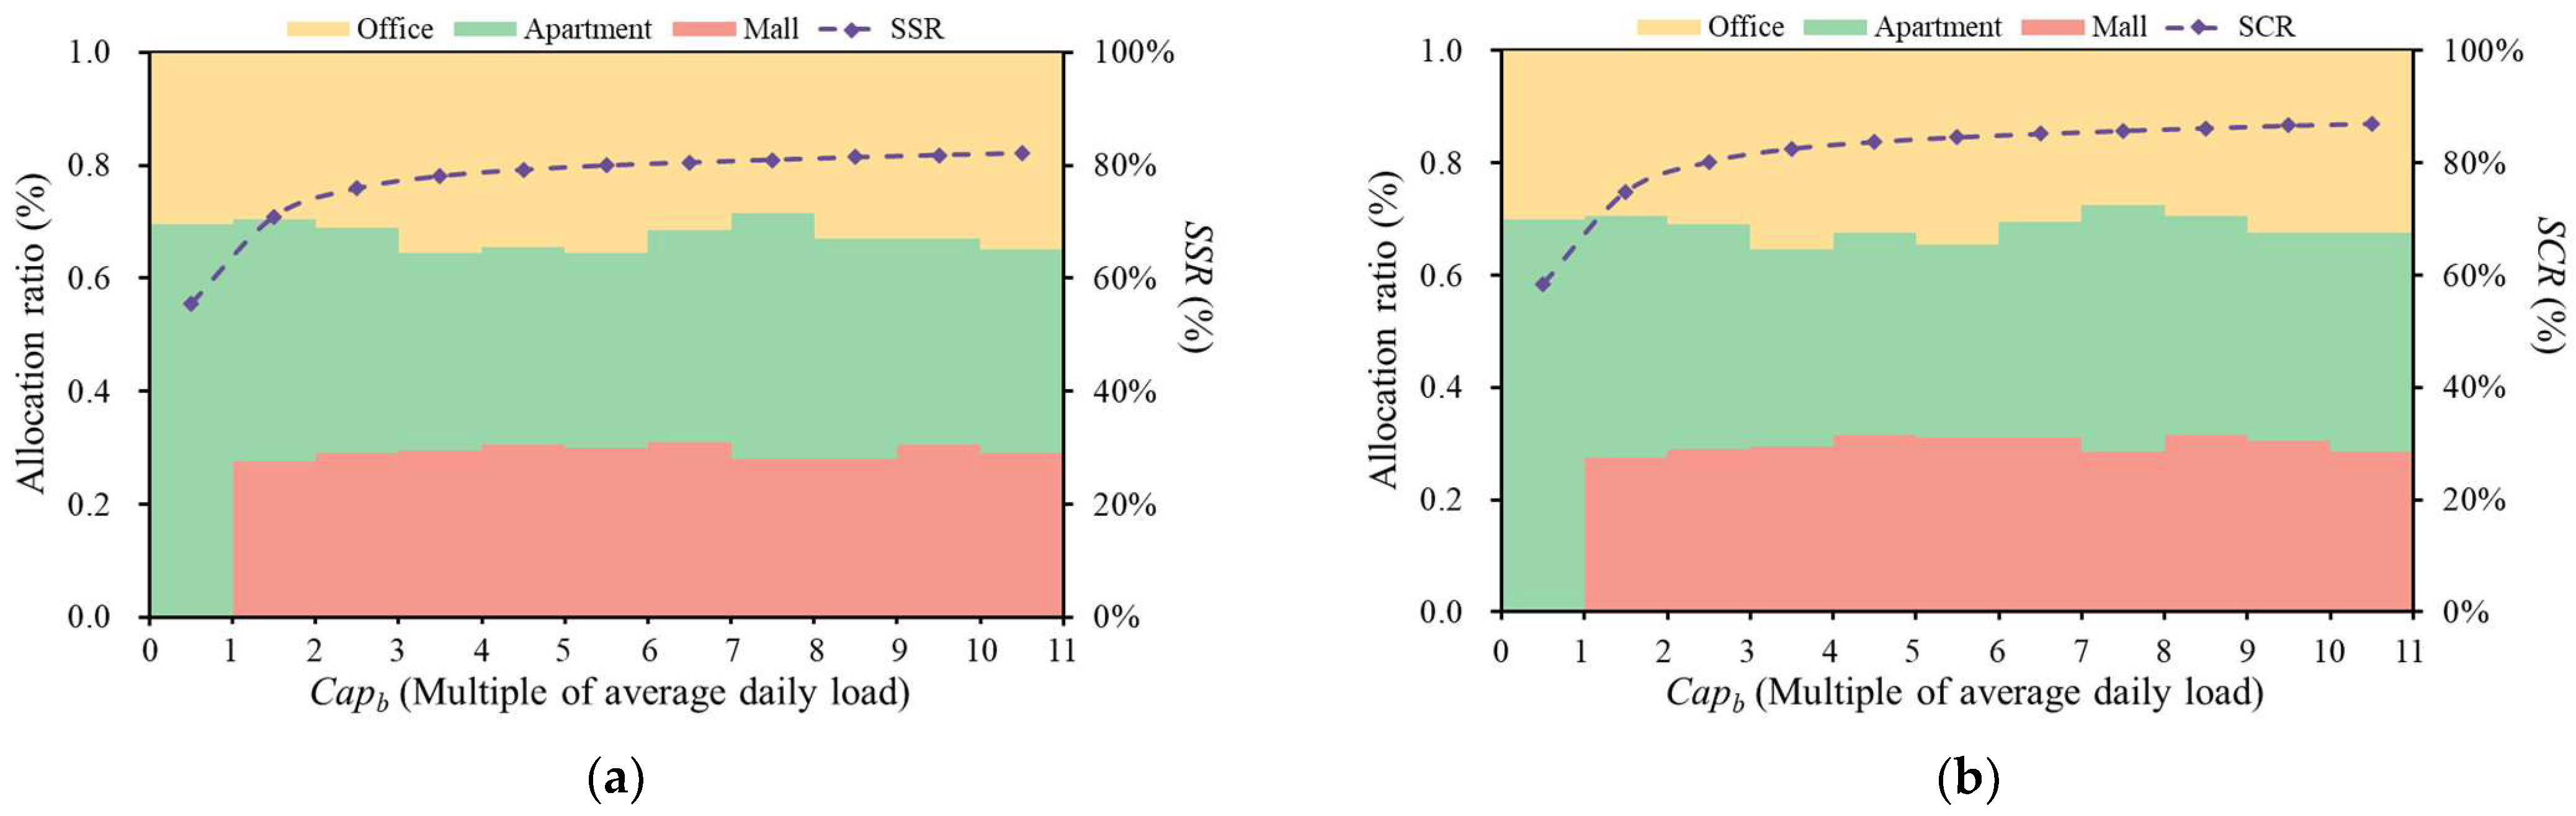
3.2.2. Centralized Storage
3.3. Comparison of Different Configuration Way
4. Discussions
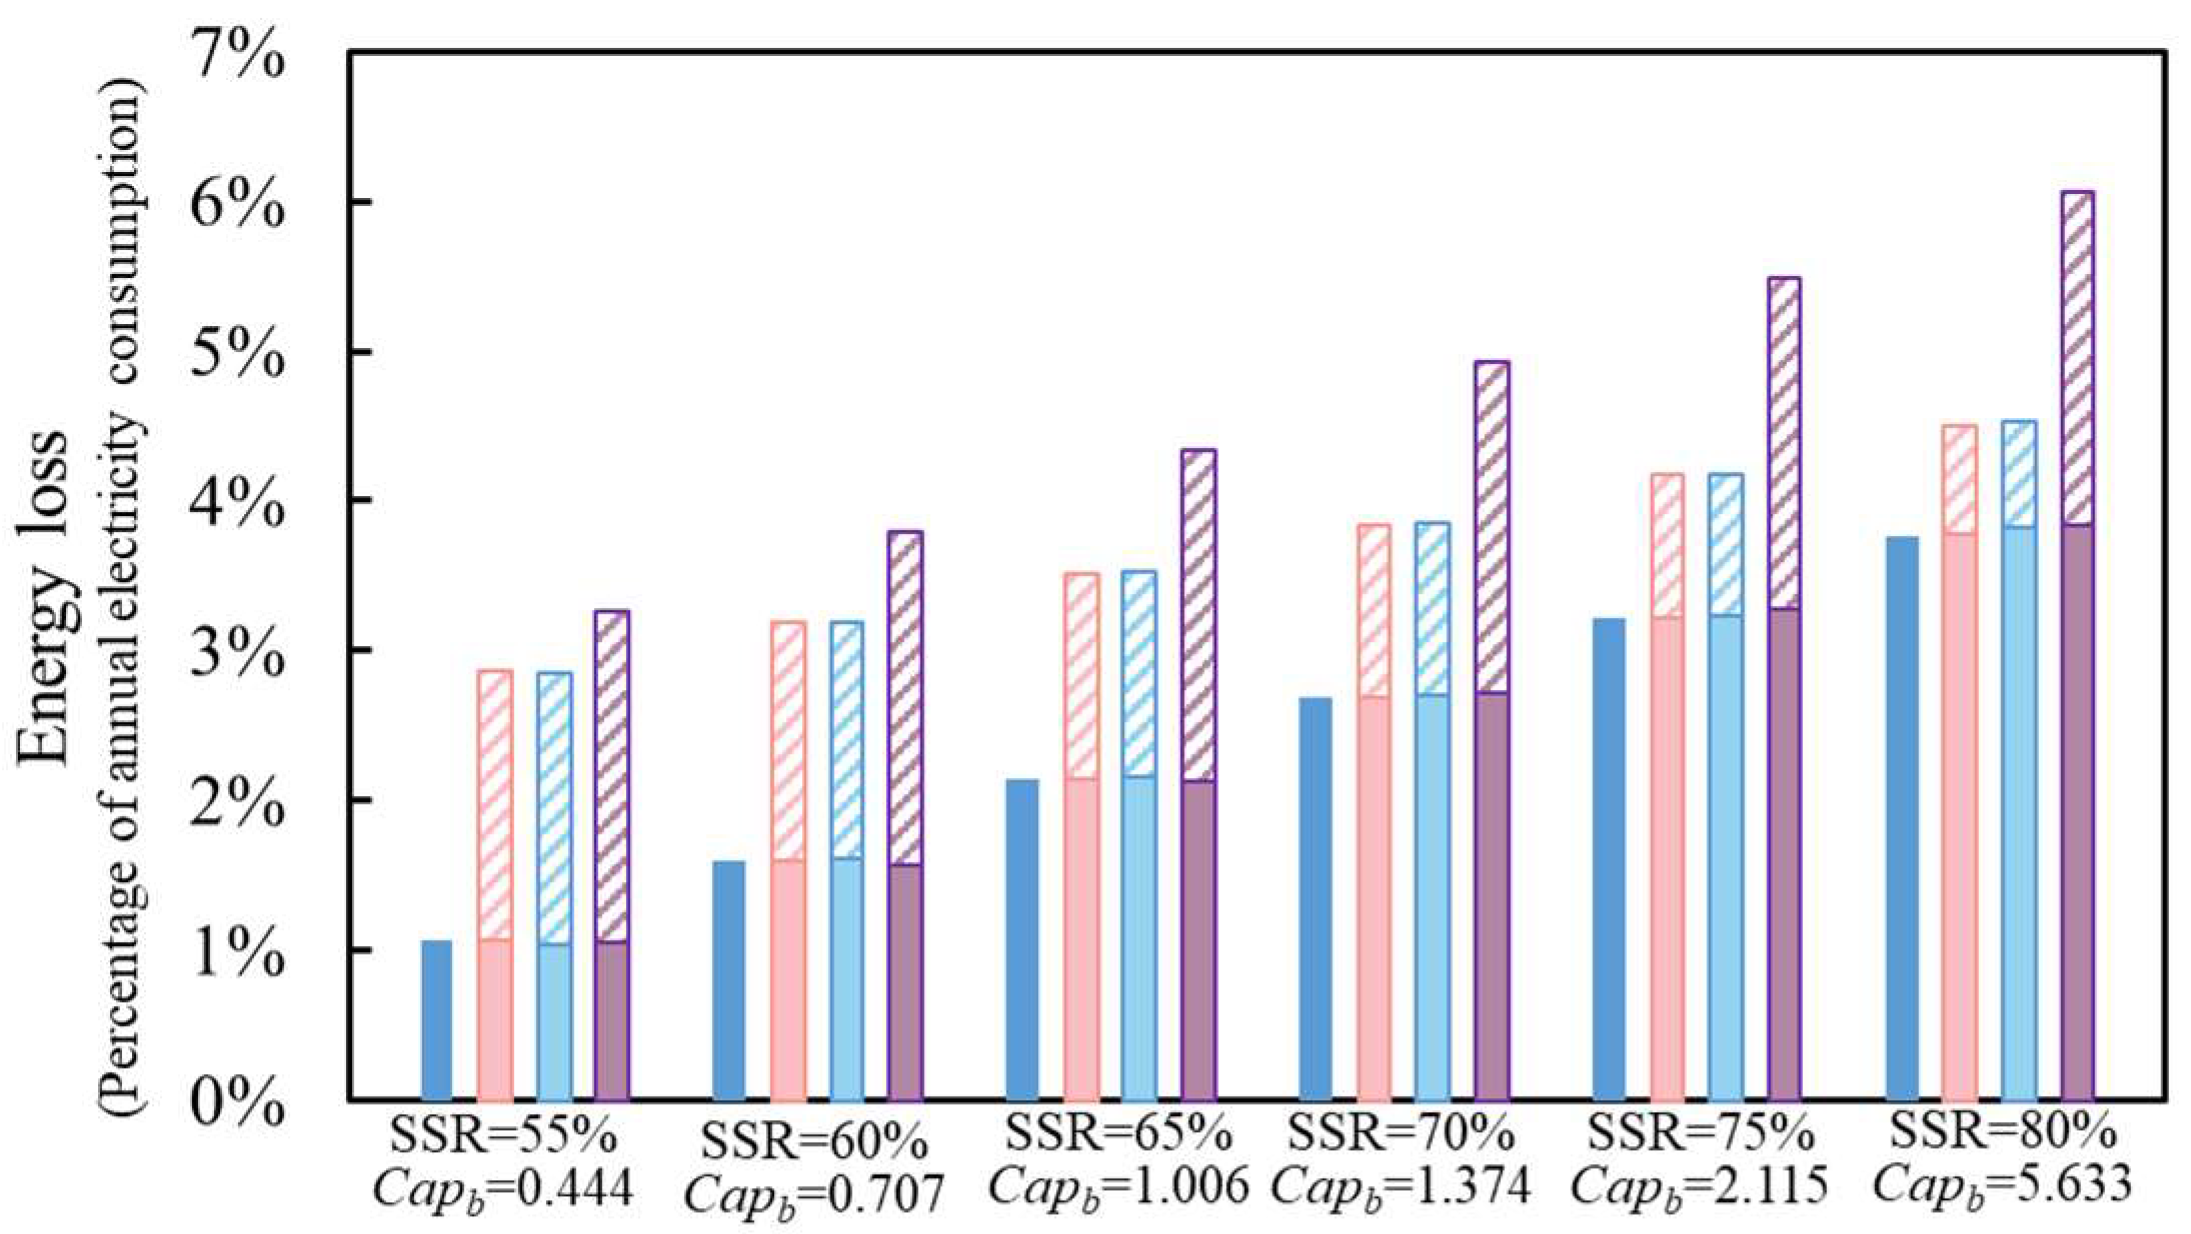
4.1. Energy Loss
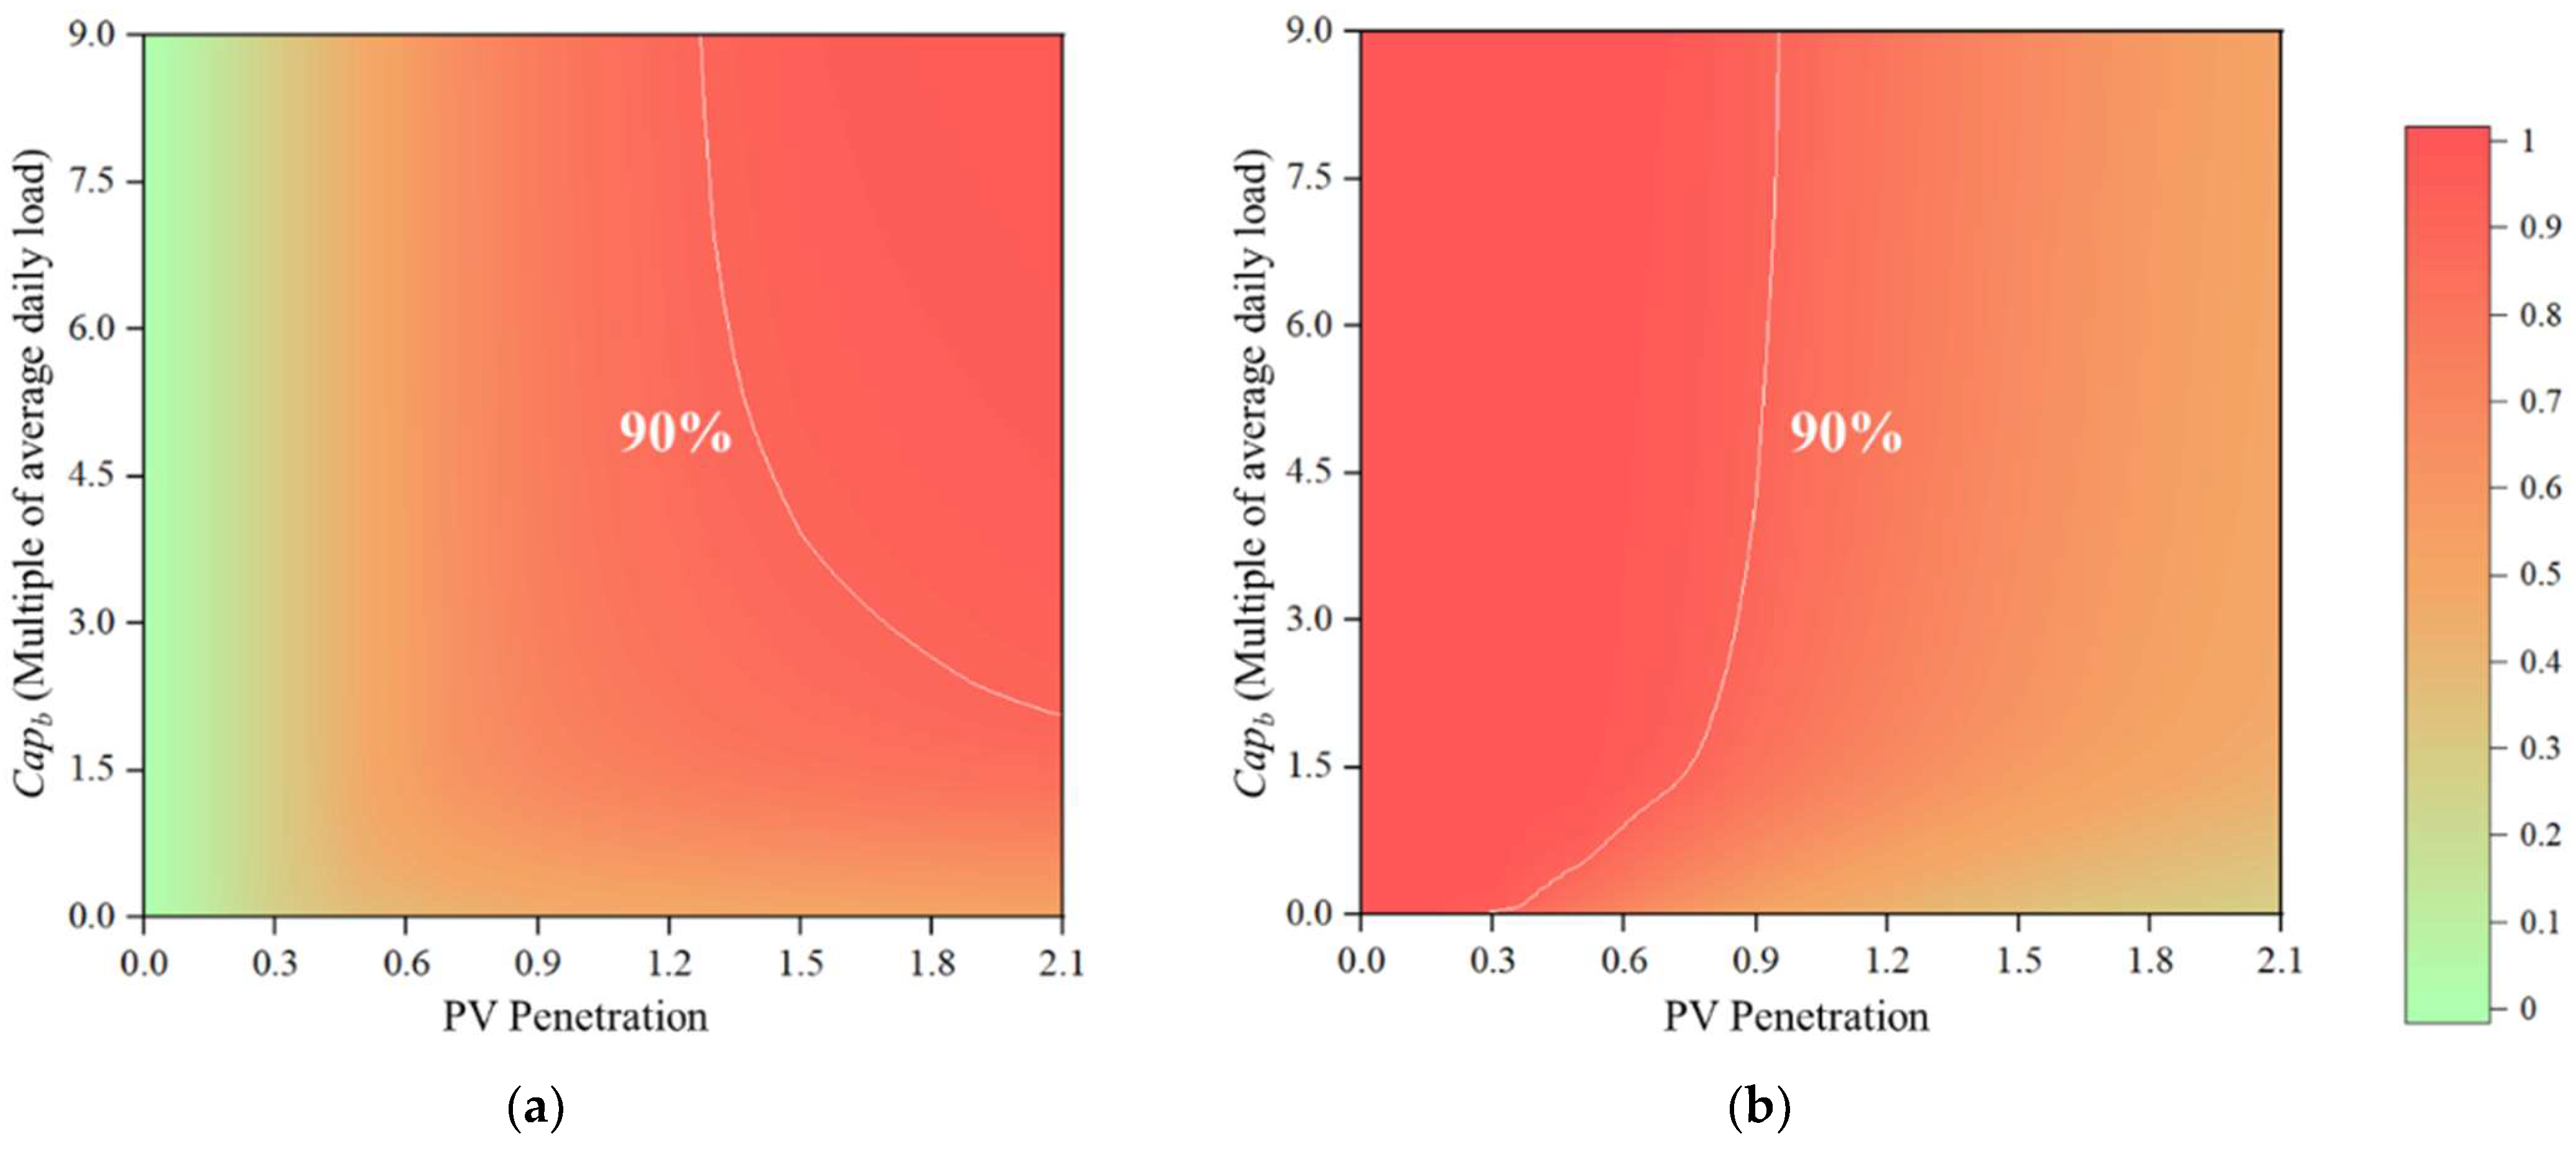
4.2. Effect of PV Penetration
4.3. Limitation and Outlook
5. Conclusions
- (1)
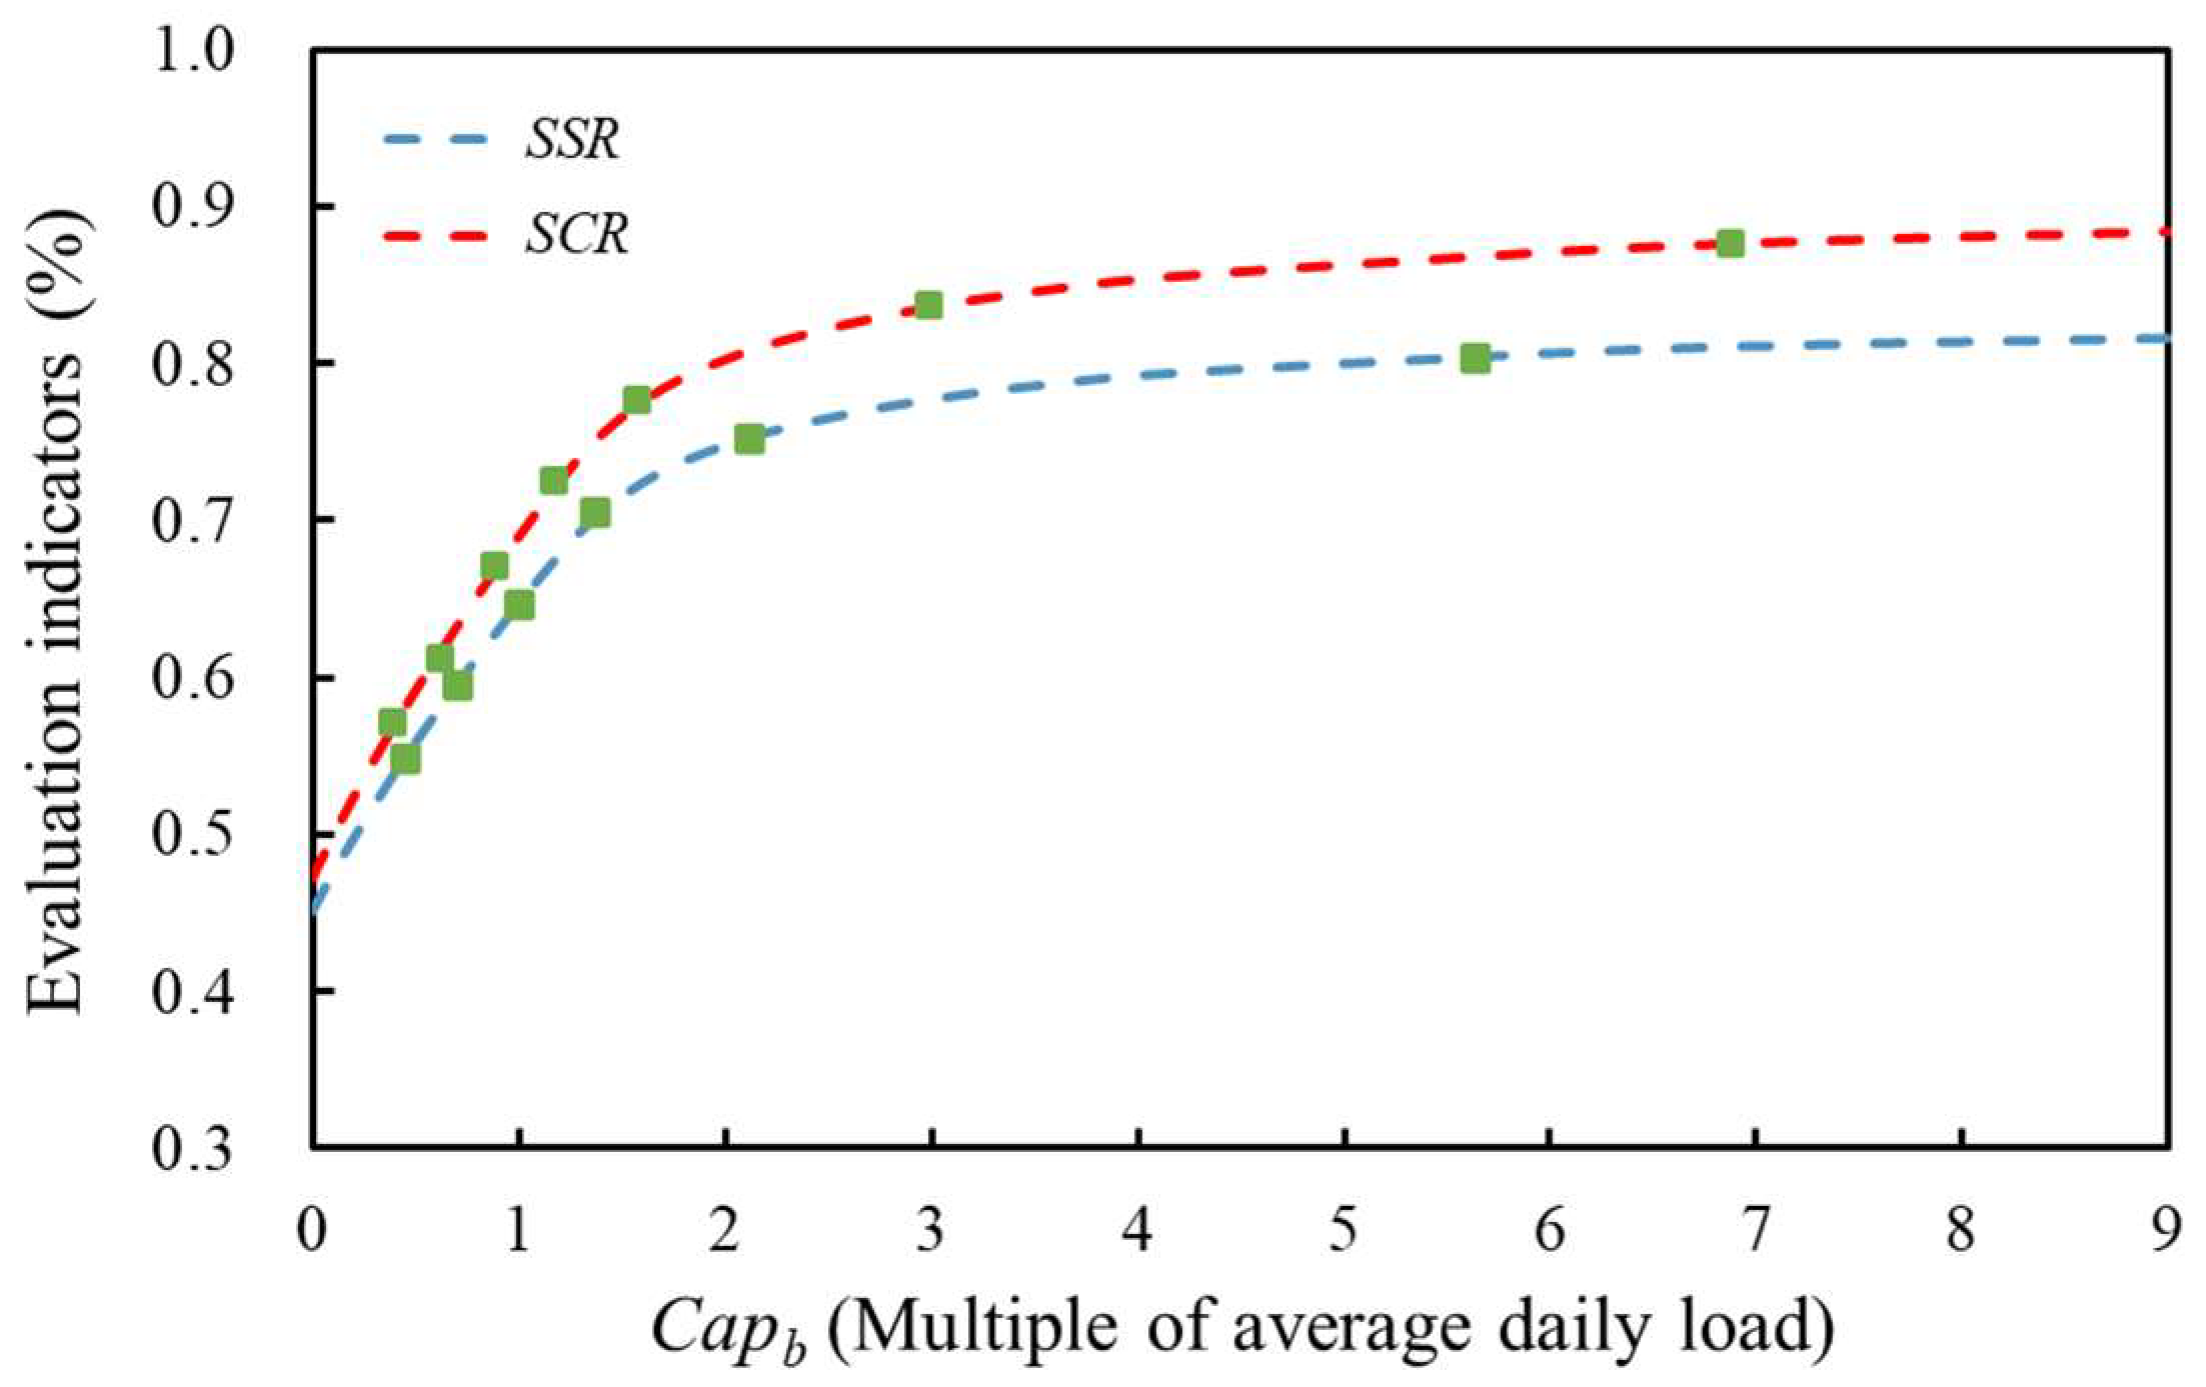
- The centralized storage scheme usually shows a greater system performance than a distributed storage scheme. The technical indicator SSR is more sensitive to the PV capacity than SCR. The SCR of centralized storage is consistently higher than that of distributed storage for different battery capacities and PV penetrations. The SSR of centralized storage is only lower than that of distributed storage in the low PV penetration conditions when the converter loss dominates the benefits of centralized storage.
- (2)
- There is a slight difference between the optimal allocation ratios achieved by the SSR and SCR considering that they have the same total battery capacity when equipped with a distributed storage scheme. The optimal allocation ratio for a building complex is determined based on the characteristics of a single building in the battery arrangement. The allocation ratios to achieve the maximal SSR under different battery and PV capacities are also tabulated. The SCR values of different combinations of battery and PV capacities are also shown.
- (3)
- Converter loss decreases the SSR and increases the SCR of the PVB system in a building complex. The effect of complementarity in load curves and centralized batteries is conducive to increasing SSR and SCR, especially in the centralized storage scheme. The adoption of a high-efficiency converter can achieve a greater SSR for building complexes while reducing the battery capacity configuration.
Author Contributions
Funding
Data Availability Statement
Conflicts of Interest
Nomenclature
| Greek symbols | |
| α | A binary number |
| β | Installation angle of PV panels |
| γ | Temperature power coefficient (1/°C) |
| η | Efficiency (%) |
| Δt | Time increment |
| Abbreviations | |
| PV | Photovoltaic |
| PVB | Photovoltaic and battery |
| Cap | Capacity (kWh) |
| P | Power (kW) |
| NOCT | Nominal operating cell temperature (°C) |
| T | Temperature (°C) |
| SOC | State of charge |
| E | Total energy (kWh) |
| SSR | Self-sufficiency rate (%) |
| SCR | Self-consumption rate (%) |
| Subscripts | |
| a | Ambient air |
| b | Battery |
| grid | Utility grid |
| load | Building load |
| dis | Discharge process of battery |
| ch | Charge process of battery |
| im | Electricity imported from the utility grid |
| ex | Electricity exported from the utility grid |
| max | Maximum |
| min | Minimum |
| Other variables | |
| It | Solar radiation intensity incident on PV panels (W/m2) |
| Idir | Direct solar radiation intensity on the horizontal plane (W/m2) |
| Idif | Diffuse solar radiation intensity on the horizontal plane (W/m2) |
| I | Global solar radiation intensity on the horizontal plane (W/m2) |
| PPV,rated | Rated PV generation power (kW) |
| Rdir | Ratio of direct solar radiation on the inclined plane to the horizontal plane (%) |
Appendix A


References
- Chen, Q.; Kuang, Z.; Liu, X.; Zhang, T. Transforming a solar-rich county to an electricity producer: Solutions to the mismatch between demand and generation. J. Clean. Prod. 2022, 336, 130418. [Google Scholar] [CrossRef]
- Khattak, S.I.; Ahmad, M.; Khan, Z.U.; Khan, A. Exploring the impact of innovation, renewable energy consumption, and income on CO2 emissions: New evidence from the BRICS economies. Env. Sci. Pollut. Res. Int. 2020, 27, 13866–13881. [Google Scholar] [CrossRef] [PubMed]
- Jiang, Q.; Khattak, S.I.; Rahman, Z.U. Measuring the simultaneous effects of electricity consumption and production on carbon dioxide emissions (CO2e) in China: New evidence from an EKC-based assessment. Energy 2021, 229, 120616. [Google Scholar] [CrossRef]
- Ahmed Ali, K.; Ahmad, M.I.; Yusup, Y. Issues, Impacts, and Mitigations of Carbon Dioxide Emissions in the Building Sector. Sustainability 2020, 12, 7427. [Google Scholar] [CrossRef]
- Mishra, S.; Saini, G.; Saha, S.; Chauhan, A.; Kumar, A.; Maity, S. A survey on multi-criterion decision parameters, integration layout, storage technologies, sizing methodologies and control strategies for integrated renewable energy system. Sustain. Energy Technol. Assess. 2022, 52, 102246. [Google Scholar] [CrossRef]
- Yang, J.; Yang, Z.; Duan, Y. Capacity optimization and feasibility assessment of solar-wind hybrid renewable energy systems in China. J. Clean. Prod. 2022, 368, 133139. [Google Scholar] [CrossRef]
- Sharma, S.; Sengar, N. Review of solar PV training manuals and development of survey based solar PV system training formats for beginners. Sol. Energy 2022, 241, 72–84. [Google Scholar] [CrossRef]
- Qiu, T.; Wang, L.; Lu, Y.; Zhang, M.; Qin, W.; Wang, S.; Wang, L. Potential assessment of photovoltaic power generation in China. Renew. Sustain. Energy Rev. 2022, 154, 111900. [Google Scholar] [CrossRef]
- Stainsby, W.; Zimmerle, D.; Duggan, G.P. A method to estimate residential PV generation from net-metered load data and system install date. Appl. Energy 2020, 267, 114895. [Google Scholar] [CrossRef]
- Gul, E.; Baldinelli, G.; Bartocci, P.; Bianchi, F.; Domenghini, P.; Cotana, F.; Wang, J. A techno-economic analysis of a solar PV and DC battery storage system for a community energy sharing. Energy 2022, 244, 123191. [Google Scholar] [CrossRef]
- Gerber, D.L.; Vossos, V.; Feng, W.; Marnay, C.; Nordman, B.; Brown, R. A simulation-based efficiency comparison of AC and DC power distribution networks in commercial buildings. Appl. Energy. 2018, 210, 1167–1187. [Google Scholar] [CrossRef]
- Ge, J.; Shen, C.; Zhao, K.; Lv, G. Energy production features of rooftop hybrid photovoltaic–wind system and matching analysis with building energy use. Energy Convers. Manag. 2022, 258, 15485. [Google Scholar] [CrossRef]
- Zhang, K.; Prakash, A.; Paul, L.; Blum, D.; Alstone, P.; Zoellick, J.; Brown, R.; Pritoni, M. Model predictive control for demand flexibility: Real-world operation of a commercial building with photovoltaic and battery systems. Adv. Appl. Energy 2022, 7, 100099. [Google Scholar] [CrossRef]
- Bird, L.; Lew, D.; Milligan, M.; Carlini, E.M.; Estanqueiro, A.; Flynn, D.; Gomez-Lazaro, E.; Holttinen, H.; Menemenlis, N.; Orths, A.; et al. Wind and solar energy curtailment: A review of international experience. Renew. Sustain. Energy Rev. 2016, 65, 577–586. [Google Scholar] [CrossRef]
- Chaibi, Y.; Allouhi, A.; Salhi, M.; El-jouni, A. Annual performance analysis of different maximum power point tracking techniques used in photovoltaic systems. Prot. Control Mod. Power Syst. 2019, 4, 1–10. [Google Scholar] [CrossRef]
- Zhu, Y.; Xu, X.; Yan, Z.; Lu, J. Data acquisition, power forecasting and coordinated dispatch of power systems with distributed PV power generation. Electr. J. 2022, 35, 107133. [Google Scholar] [CrossRef]
- Hao, D.; Qi, L.; Tairab, A.M.; Ahmed, A.; Azam, A.; Luo, D.; Pan, Y.; Zhang, Z.; Yan, J. Solar energy harvesting technologies for PV self-powered applications: A comprehensive review. Renew. Energy 2022, 188, 678–697. [Google Scholar] [CrossRef]
- Ma, T.; Zhang, Y.; Gu, W.; Xiao, G.; Yang, H.; Wang, S. Strategy comparison and techno-economic evaluation of a grid-connected photovoltaic-battery system. Renew. Energy 2022, 197, 1049–1060. [Google Scholar] [CrossRef]
- Li, Y.; Peng, J.; Jia, H.; Zou, B.; Hao, B.; Ma, T.; Wang, X. Optimal battery schedule for grid-connected photovoltaic-battery systems of office buildings based on a dynamic programming algorithm. J. Energy Storage 2022, 50, 104557. [Google Scholar] [CrossRef]
- Chellaswamy, C.; Ganesh Babu, R.; Vanathi, A. A framework for building energy management system with residence mounted photovoltaic. Build. Simul. 2021, 14, 1031–1046. [Google Scholar] [CrossRef]
- Hesse, H.; Martins, R.; Musilek, P.; Naumann, M.; Truong, C.; Jossen, A. Economic Optimization of Component Sizing for Residential Battery Storage Systems. Energies 2017, 10, 835. [Google Scholar] [CrossRef]
- Chang, L.; Ma, C.; Zhang, Y.; Li, H.; Xiao, L. Experimental assessment of the discharge characteristics of multi-type retired lithium-ion batteries in parallel for echelon utilization. J. Energy Storage 2022, 55, 105539. [Google Scholar] [CrossRef]
- Khezri, R.; Mahmoudi, A.; Whaley, D. Optimal sizing and comparative analysis of rooftop PV and battery for grid-connected households with all-electric and gas-electricity utility. Energy 2022, 251, 123876. [Google Scholar] [CrossRef]
- Argyrou, M.C.; Marouchos, C.C.; Kalogirou, S.A.; Christodoulides, P. A novel power management algorithm for a residential grid-connected PV system with battery-supercapacitor storage for increased self-consumption and self-sufficiency. Energy Convers. Manag. 2021, 246, 114671. [Google Scholar] [CrossRef]
- Jiang, Y.; Kang, L.; Liu, Y. A unified model to optimize configuration of battery energy storage systems with multiple types of batteries. Energy 2019, 176, 552–560. [Google Scholar] [CrossRef]
- Li, J.; Zhang, Z.; Shen, B.; Gao, Z.; Ma, D.; Yue, P.; Pan, J. The capacity allocation method of photovoltaic and energy storage hybrid system considering the whole life cycle. J. Clean. Prod. 2020, 275, 122902. [Google Scholar] [CrossRef]
- Zou, B.; Peng, J.; Yin, R.; Li, H.; Li, S.; Yan, J.; Yang, H. Capacity configuration of distributed photovoltaic and battery system for office buildings considering uncertainties. Appl. Energy 2022, 319, 119243. [Google Scholar] [CrossRef]
- Li, S.; Zhang, T.; Liu, X.; Xue, Z.; Liu, X. Performance investigation of a grid-connected system integrated photovoltaic, battery storage and electric vehicles: A case study for gymnasium building. Energy Build. 2022, 270, 112255. [Google Scholar] [CrossRef]
- Mohamad, F.; Teh, J.; Lai, C.-M. Optimum allocation of battery energy storage systems for power grid enhanced with solar energy. Energy 2021, 223, 120105. [Google Scholar] [CrossRef]
- Anuradha, K.B.J.; Jayatunga, U.; Perera, H.Y.R. Loss-Voltage Sensitivity Analysis Based Battery Energy Storage Systems Allocation and Distributed Generation Capacity Upgrade. J. Energy Storage 2021, 36, 102357. [Google Scholar] [CrossRef]
- Su, D.; Lei, Z. Optimal configuration of battery energy storage system in primary frequency regulation. Energy Reports. 2021, 7, 157–162. [Google Scholar] [CrossRef]
- Kusakana, K. Optimal energy management of a grid-connected dual-tracking photovoltaic system with battery storage: Case of a microbrewery under demand response. Energy 2020, 212, 102357. [Google Scholar] [CrossRef]
- Paul Ayeng’o, S.; Axelsen, H.; Haberschusz, D.; Sauer, D.U. A model for direct-coupled PV systems with batteries depending on solar radiation, temperature and number of serial connected PV cells. Sol. Energy 2019, 183, 120–131. [Google Scholar] [CrossRef]


| Parameters | Value |
|---|---|
| SOCmax | 0.95 |
| SOCmin | 0.1 |
| Max charging/discharging rate (Rateb) | 0.5 C |
| / | 95% |
| Cycle times | 6000 |
| Service life | 15 years |
| SSR | Capb | SCR | Capb | ||||||
|---|---|---|---|---|---|---|---|---|---|
| Office | Apartment | Mall | Sum | Office | Apartment | Mall | Sum | ||
| 55% | 0.070 | 0.316 | 0.058 | 0.444 | 55% | 0.063 | 0.281 | 0.052 | 0.396 |
| 60% | 0.156 | 0.410 | 0.141 | 0.707 | 60% | 0.139 | 0.361 | 0.126 | 0.626 |
| 65% | 0.249 | 0.520 | 0.237 | 1.006 | 65% | 0.222 | 0.452 | 0.210 | 0.884 |
| 70% | 0.358 | 0.670 | 0.346 | 1.374 | 70% | 0.313 | 0.558 | 0.302 | 1.173 |
| 75% | 0.553 | 0.994 | 0.568 | 2.115 | 75% | 0.432 | 0.709 | 0.432 | 1.573 |
| 80% | 1.188 | 2.993 | 1.452 | 5.633 | 80% | 0.746 | 1.046 | 0.782 | 2.574 |
| 85% | 1.663 | 2.784 | 2.436 | 6.883 | |||||
| Reference SSR | Capb of Distributed Storage | SSR | Capb of Centralized Storage | SSR | ||
|---|---|---|---|---|---|---|
| Office | Apartment | Mall | ||||
| 55% | 0.070 | 0.316 | 0.058 | 55.14% | 0.444 | 55.86% |
| 60% | 0.156 | 0.410 | 0.141 | 60.04% | 0.707 | 60.77% |
| 65% | 0.249 | 0.520 | 0.237 | 65.02% | 1.006 | 65.92% |
| 70% | 0.358 | 0.670 | 0.346 | 70.02% | 1.374 | 71.32% |
| 75% | 0.553 | 0.994 | 0.568 | 75.01% | 2.115 | 76.29% |
| 80% | 1.188 | 2.993 | 1.452 | 80.00% | 5.633 | 81.51% |
| Reference SCR | Capb of Distributed Storage | SCR | Capb of Centralized Storage | SCR | ||
|---|---|---|---|---|---|---|
| Office | Apartment | Mall | ||||
| 55% | 0.063 | 0.281 | 0.052 | 55.17% | 0.396 | 55.83% |
| 60% | 0.139 | 0.361 | 0.126 | 60.05% | 0.626 | 60.69% |
| 65% | 0.222 | 0.452 | 0.210 | 65.02% | 0.884 | 65.75% |
| 70% | 0.313 | 0.558 | 0.302 | 70.02% | 1.173 | 71.02% |
| 75% | 0.432 | 0.709 | 0.432 | 75.01% | 1.573 | 76.18% |
| 80% | 0.746 | 1.046 | 0.782 | 80.01% | 2.574 | 81.23% |
| 85% | 1.663 | 2.784 | 2.436 | 85.00% | 6.883 | 86.51% |
| PV Penetration | Capb | SSR | SCR | ||
|---|---|---|---|---|---|
| Optimal Allocation | Centralized Storage | Optimal Allocation | Centralized Storage | ||
| 0.5 | 2 | 47.25% | 47.11% | 99.31% | 99.81% |
| 4 | 47.62% | 47.19% | 99.99% | 100% | |
| 6 | 47.68% | 47.19% | 100% | 100% | |
| 1 | 2 | 74.10% | 74.75% | 78.26% | 80.23% |
| 4 | 78.73% | 79.21% | 83.24% | 85.33% | |
| 6 | 80.24% | 80.64% | 84.90% | 87.08% | |
| 8 | 81.20% | 81.37% | 85.98% | 88.05% | |
| 10 | 81.76% | 81.81% | 86.83% | 88.70% | |
| 1.5 | 2 | 83.35% | 84.51% | 59.12% | 60.98% |
| 4 | 89.30% | 90.14% | 63.41% | 65.25% | |
| 6 | 91.75% | 92.54% | 65.22% | 67.13% | |
| 8 | 93.35% | 94.02% | 66.42% | 68.33% | |
| 10 | 94.41% | 95.09% | 67.24% | 69.23% | |
| PV Penetration | Capb | Allocation Ratio (Optimization for SSR) | Allocation Ratio (Optimization for SCR) | ||||
|---|---|---|---|---|---|---|---|
| Office | Apartment | Mall | Office | Apartment | Mall | ||
| 0.5 | 2 | 30.0% | 40.5% | 29.5% | 30.0% | 40.5% | 29.5% |
| 4 | 40.0% | 30.5% | 29.5% | 40.0% | 30.5% | 29.5% | |
| 6 | 39.0% | 28.5% | 32.5% | — | — | — | |
| 1 | 2 | 28.0% | 43.0% | 29.0% | 28.0% | 43.5% | 28.5% |
| 4 | 35.0% | 34.5% | 30.5% | 35.0% | 35.5% | 29.5% | |
| 6 | 33.0% | 36.0% | 31.0% | 33.0% | 36.0% | 31.0% | |
| 8 | 33.0% | 40.5% | 26.5% | 29.5% | 41.5% | 29.0% | |
| 10 | 34.5% | 36.5% | 29.0% | 31.5% | 39.0% | 29.5% | |
| 1.5 | 2 | 28.0% | 44.0% | 28.0% | 28.0% | 44.0% | 28.0% |
| 4 | 33.5% | 40.5% | 26.0% | 33.5% | 40.5% | 26.0% | |
| 6 | 30.5% | 39.5% | 30.0% | 30.5% | 39.5% | 30.0% | |
| 8 | 31.5% | 39.0% | 29.5% | 31.0% | 39.0% | 30.0% | |
| 10 | 31.5% | 40.0% | 28.5% | 30.0% | 41.5% | 28.5% | |
Disclaimer/Publisher’s Note: The statements, opinions and data contained in all publications are solely those of the individual author(s) and contributor(s) and not of MDPI and/or the editor(s). MDPI and/or the editor(s) disclaim responsibility for any injury to people or property resulting from any ideas, methods, instructions or products referred to in the content. |
© 2023 by the authors. Licensee MDPI, Basel, Switzerland. This article is an open access article distributed under the terms and conditions of the Creative Commons Attribution (CC BY) license (https://creativecommons.org/licenses/by/4.0/).
Share and Cite
Li, S.; Zhang, T.; Liu, X.; Liu, X. A Battery Capacity Configuration Method of a Photovoltaic and Battery System Applied in a Building Complex for Increased Self-Sufficiency and Self-Consumption. Energies 2023, 16, 2190. https://doi.org/10.3390/en16052190
Li S, Zhang T, Liu X, Liu X. A Battery Capacity Configuration Method of a Photovoltaic and Battery System Applied in a Building Complex for Increased Self-Sufficiency and Self-Consumption. Energies. 2023; 16(5):2190. https://doi.org/10.3390/en16052190
Chicago/Turabian StyleLi, Shaojie, Tao Zhang, Xiaochen Liu, and Xiaohua Liu. 2023. "A Battery Capacity Configuration Method of a Photovoltaic and Battery System Applied in a Building Complex for Increased Self-Sufficiency and Self-Consumption" Energies 16, no. 5: 2190. https://doi.org/10.3390/en16052190
APA StyleLi, S., Zhang, T., Liu, X., & Liu, X. (2023). A Battery Capacity Configuration Method of a Photovoltaic and Battery System Applied in a Building Complex for Increased Self-Sufficiency and Self-Consumption. Energies, 16(5), 2190. https://doi.org/10.3390/en16052190