Article

Risk Dependence and Risk Spillovers Effect from Crude Oil on the Chinese Stock Market and Gold Market: Implications on Portfolio Management

1
Guangzhou Institute of International Finance, Guangzhou University, Guangzhou 510006, China
2
Business School, Hunan First Normal University, Changsha 410205, China
3
School of Economics, Jinan University, Guangzhou 510006, China
*
Author to whom correspondence should be addressed.
Energies 2023, 16(5), 2141; https://doi.org/10.3390/en16052141
Submission received: 10 January 2023 / Revised: 9 February 2023 / Accepted: 9 February 2023 / Published: 22 February 2023

Abstract

:
We analyze crude oil’s dependence and the risk spillover effect on the Chinese stock market and the gold market. We compare both static and dynamic copula functions and calculate the average upward and downward spillover effect using the time-varying Copula model and the conditional value-at-risk approach. By utilizing daily data on crude oil prices, China’s stock market, and the gold market, we observe an asymmetric spillover effect: the downside spillover effects from crude oil prices on the Chinese stock market and gold market are larger than the upside spillover effect. We then identify changes in the structure of the sample periods and calculate the dynamic conditional correlation between them. In addition, we explore the optimal weight and hedge ratios in diversified portfolios to mitigate potential risks. Our results suggest that investors and portfolio managers should frequently adjust their portfolio strategies, particularly during extreme events like COVID-19, when financial assets become more volatile. Furthermore, crude oil can help reduce the risk in the Chinese stock market and gold market to some extent during different sub-periods.

1. Introduction

In 2020, the global community was greatly impacted by the COVID-19 pandemic, resulting in a widespread suspension of economic activity and a significant drop in the demand for crude oil. On 22 April 2020, a historic event occurred as crude oil prices dipped into negative territory, indicating a profound shock to the worldwide financial system. As the largest importer of crude oil globally, China’s economy and enterprise operations are susceptible to fluctuations in the global crude oil market, which in turn affects China’s stock market [1,2,3,4,5]. Additionally, China’s launch of crude oil futures in 2018 has further connected its financial market, including the stock market, to the global crude oil market. To mitigate risk, investors have increasingly incorporated gold into their portfolios as a safe-haven asset. As such, it is important to consider the extent to which global crude oil price shocks impact China’s financial market and gold market. In this study, we aim to examine the dynamic dependence between the global crude oil market, the Chinese stock market, and the gold market. We also aim to analyze the risk spillover from the international crude oil market to China’s stock market and gold market. The results of our analysis can provide financial investors with insights into how to construct portfolios comprising crude oil, stock, and gold assets to hedge against market risks in the face of extreme market conditions.
Recently, the global oil price presents an extreme risk. Figure 1 presents the historical trends of West Texas Intermediate (WTI) prices, the Shanghai Composite Index (SHCI), and China’s gold futures price (GOLD). As Figure 1 shows, China’s stock market shows similar trends to the global oil price at most times, while the gold price shows a reverse movement with the global oil price. The dependence characteristics among the global oil price, China’s stock market, and China’s gold market may change in different periods.
This paper aims to identify dynamic dependencies and capture extreme risk dependencies among global oil prices, China’s stock market, and China’s gold market. It not only offers the government practical guidance in dealing with shocks from the global crude oil market but also provides more information for investors to optimize their portfolios and evade market risks.
The rest of this paper is organized as follows. Section 2 reviews relevant literature. Section 3 illustrates the methodology applied in this paper. Section 4 provides the data and summary statistics. Section 5 offers the main empirical evidence. Section 6 concludes the paper and discusses some implications of the empirical results.

2. Literature Review

This paper follows three strands of literature. The first strand is the relationship between oil prices and stock markets, which has always been a hot topic in the field of energy finance [6]. The international crude oil price and international stock markets have a long-running relationship [7,8,9].
The global oil market has a significant impact on China’s stock market through macroeconomic channels [5,10,11,12,13,14,15,16]. The long-term connections between the international crude oil market and China’s stock market vary dramatically at different market regimes and are enhanced greatly with the adjustments in the refined oil pricing mechanism in China after launching China’s crude oil futures market. It is found that the global oil market has a significant unidirectional return spillover effect on China’s stock market, which indicates a strong dependence of the Chinese stock market on the global oil market [17]. Zhao et al. [18] find empirical evidence for the bilateral contagion effect of bubbles between oil markets and the Chinese stock market. The first bubble direction of contagion is from stock to oil market and the second is from oil to stock. Tiwari et al. [19] reveal that a robust lagged dependence exists from the oil market on the Chinese stock market. Ji et al. [2] find that the multidimensional dependence of the global oil market and the Chinese stock market has been altered as a result of the 2008 global financial crisis.
The second strand is the relationship between oil prices and the gold market. Some studies concentrated on the investment performance of oil and gold combined with stocks have shown that crude oil and gold can serve as an eligible diversifier [20,21], hedge [15,22,23], and safe haven [24]. It is found that the dynamic gold-oil relationship is always positive, and a long-term dependence exists between crude oil markets and the gold market [25]. Dai et al. [26], employing the wavelet method and a time-varying tri-variate vine-copula model, find that the oil market is more sensitive to the upside and downside risk contagion of the gold market in the short-run time scales. Junttila et al. [27] analyze the correlations between gold and oil market futures in the aggregate US market, finding that the correlations between gold and oil market futures and equity returns in the aggregate US market have changed strongly during the stock market crisis periods. Lin et al. [28] find a single direction of risk contagion running from the Brent crude oil market and the London gold market to the Chinese stock markets. Meanwhile, bidirectional risk contagion among the Brent crude oil market, London gold market, and Chinese stock markets are found in extreme events. Gharib et al. [29] find a bilateral contagion effect of bubbles in oil and gold markets during the recent COVID-19 outbreak.
The third strand is the methodology that reveals the risk dependence between the global crude oil market and other financial markets. Li and Wei [30], combining the variational mode decomposition (VMD) method with various static and time-varying copulas, examine the dependence structure between the crude oil market and Chinese stock market over different investment horizons, before and after the recent financial crisis, and conclude that the recent financial crisis enhances the dependences between the crude oil market and Chinese stock market, and the long-run dependence increases more significantly than that of short-run. Ahmed and Huo [17] use a trivariate VAR-BEKK-GARCH model to investigate the dynamic relationship between the Chinese stock market, commodity markets, and global oil prices. They find a significant unidirectional return spillover effect from the oil market to the stock market, suggesting a strong dependence on the Chinese stock market on the oil market. Li et al. [31] use the BK method to find the dynamic connectedness between different financial markets at different investment horizons. Aloui and Jammazi [32] develop a two-regime Markov-switching EGARCH model [33], finding that oil price rises have a significant role in determining the volatility of stock returns. In this paper, we utilize the copula family to calculate the CoVaR value in the copula model since it has the advantage of calculating the average, upper, and lower tail dependence and describing the dependence structure among stochastic variables.
Based on the analysis above, it is important to analyze the impact of the crude oil market on the Chinese stock market and the global gold market. In addition, the GARCH and copula models have been widely used in analyzing the spillover effect of the crude oil market on other financial markets. However, fewer studies have examined the risk dependence between the global crude oil market and the Chinese gold market or the structural changes among them. Our contribution is as follows: (i) We not only apply the ARMA-GJR-GARCH framework but also apply the time-varying and static bivariate copula family finding the best-fit copula, and then compute the CoVaR and ∆CoVaR, which are helpful to analyze the asymmetric risk spillover effect from crude oil to China’s stock market and gold market. (ii) The dynamic relationship between oil and the stock market and the gold market could help investors and portfolio managers control risks more effectively among the crude oil market, stock market, and gold market and adjust their diversified portfolios by the evaluation of the correlation.

3. Econometric Modeling Framework

3.1. The Marginal Distribution and Copula Models

Motivated by [34,35], we consider the ARMA (p, q) and the GJR-GARCH model together in the following analysis. We utilize ARMA (p, q) to depict the marginal densities of the stock index and the gold price:
r t = c + i = 1 p α i r t i + i = 0 q β i ε t i
ε t = σ 1 / 2 v t
where r t represents the stock market return or the gold market return, p and q are non-negative integers,   α i and β i are the autoregressive (AR) and moving average (MA) parameters. According to the GJR-GARCH model [34], ε t is the errors, v t is the standardized residuals, and σ t is the conditional variance, their relationship is as follows:
σ t 2 = ψ + φ ε t 1 2 + η ε t 1 2 d t 1 + γ σ t 1 2
where   ψ is a constant, σ t 1 2 is the GARCH component; ε t 1 is the ARCH component; if ε t 1 < 0 ,   d t 1 = 1 , otherwise, d t 1 = 0 .   η depicts asymmetric effects. If ε t 1 > 0 , a shock of φ is produced by “good news”, while if ε t 1 < 0 , a shock of φ + η is produced by “bad news”. So, it shows a different impact on conditional variance [36,37]. The bigger the η value is, the greater the asymmetric effect [38,39]. To capture different features of dependence between crude oil prices and China’s stock market and gold market, nine copula specifications and time-varying dependence are used [8,40,41,42].
Copula models are generally divided into two types: static and dynamic. For static copula functions [43], the form of each copula function can be found in Patton [44]. Since the function form of the time-varying copula remains unchanged, only the parameters of the copula function in the model are time-varying. Therefore, when using the time-varying correlation copula model to study the dynamics between variables, the modeling of the marginal distribution of variables may not be considered in the correlation relationship. This paper mainly selects one from the time-varying copula functions under the three criteria of LL, AIC, and BIC to describe the dynamic correlation structure between them.
Taking the time-varying normal copula model as an example, the probability distribution function of the binary time-varying normal copula function is:
C u , v , ρ t = Φ 1 u Φ 1 v 1 2 π 1 ρ t 2 e x p r 2 + s 2 2 ρ t r s 2 1 ρ t 2 d r d s
where Φ 1 · is the inverse function of the standard normal distribution function. ρ t 1 ,   1 is the relevant parameter. Considering that the relevant parameter is time-varying, it is described by the following evolution equation:
ρ t = Λ w ρ + β ρ ρ t 1 + α ρ × 1 q i = 1 q Φ 1 u t i Φ 1 v t i
where Λ x = 1 e x 1 + e x is to ensure that ρ t is always in the interval [0, 1], and the general lag order is less than 10.
After determining the type of marginal distribution, according to the probability integral transformation, the standardized residual distribution can be transformed into a uniform distribution on [0, 1]. Then the long-term memory-eliminated oil market and stock market time series are brought into the copula function for correlation modeling analysis. Finally, the best-fitting copula function is selected according to the AIC criterion. In this section, we use static and dynamic copula models to test the possible tail risk dependencies between the crude oil market, the Chinese stock market, and the gold market. Table 1 lists some commonly used binary copula functions and their main tails relationship features.
The purpose of applying copulas is to capture various dependence structures [45]. A two-step procedure called the inference function for margins can be used to estimate the marginal density parameters and copula. The joint probability density f X Y x , y can be shown as:
f X Y x , y = c u , v f Y y f X x
where f X x and   f Y y are the marginal densities of variables X and Y, respectively, and c u , v is the copula density. c u , v is the joint function of copula; u = F X t i C o V a R α , t i , v = F X t j V a R α , t j . F X t i and F X t j   are the marginal distribution functions calculated by the ARMA-GJRGARCH as mentioned above.

3.2. Risk Spillover Effects

In this part, we apply the conditional value-at-risk (CoVaR) measurement [46,47] to calculate the spillover effect. The CoVaR for asset i is the VaR for asset i in the condition of price changes in asset j. For example, set r t O   be the returns for crude oil prices, r t S   be the returns of the Chinese stock market. The downside risk spillover effect from the international oil market to China’s stock market can be described as:
Pr r t S C o V a R β , t S r t O V a R α , t O = β
where C o V a R β , t S denotes the conditional VaR of the Chinese stock market return with a confidence level (1 − β ), in which β means the quantile of the conditional distribution of r t O , and V a R α , t O is the αth quantile of the return’s distribution of crude oil. The upside risk spillover effect from the international oil market to China’s stock market can be measured as follows:
Pr r t S C o V a R β , t S r t O V a R 1 α , t O = β
where the upside risk of   V a R 1 α , t O means the (1 − α)th quantile of the crude oil returns. C o V a R β , t S   denotes the conditional VaR of Chinese stock market returns in the upside condition.
Then the CoVaR in Equations (5) and (6) can be rewritten by the copula representation, respectively:
C F r t S C o V a R β , t S ,   F r t O V a R α , t O = α β
1 F r t S C o V a R β , t S F r t O V a R α , t O + C F r t S C o V a R β , t S ,   F r t O V a R 1 α , t O = α β
where F r t S , and F r t O   are the marginal distributions of the Chinese stock market, and crude oil market, respectively.
Based on [48], the systemic risk contribution of the Chinese stock market (S) under the impact of global crude oil is depicted as the ∆CoVaR, which is the difference between the VaR of the Chinese stock market conditional on the distressed state of Chinese stock market S ( R t S V a R α , t S ) and the VaR of China’s stock market or gold market under the condition of the based condition of global crude oil market O. Therefore, based on the global crude oil market O, the systemic risk contribution of Chinese stock market S can be measured as:
C o V a R t S / O = C o V a R β , t S / O C o V a R β , t S / O ,   α = 0.5 C o V a R β , t S / O ,   α = 0.5
Similarly, it is also adapted to calculate VaR, upside CoVaR, downside CoVaR, and the ∆CoVaR of China’s gold market. By applying ∆CoVaR we can capture the spillover risk’s marginal contribution from the crude oil market to China’s stock market and gold market.

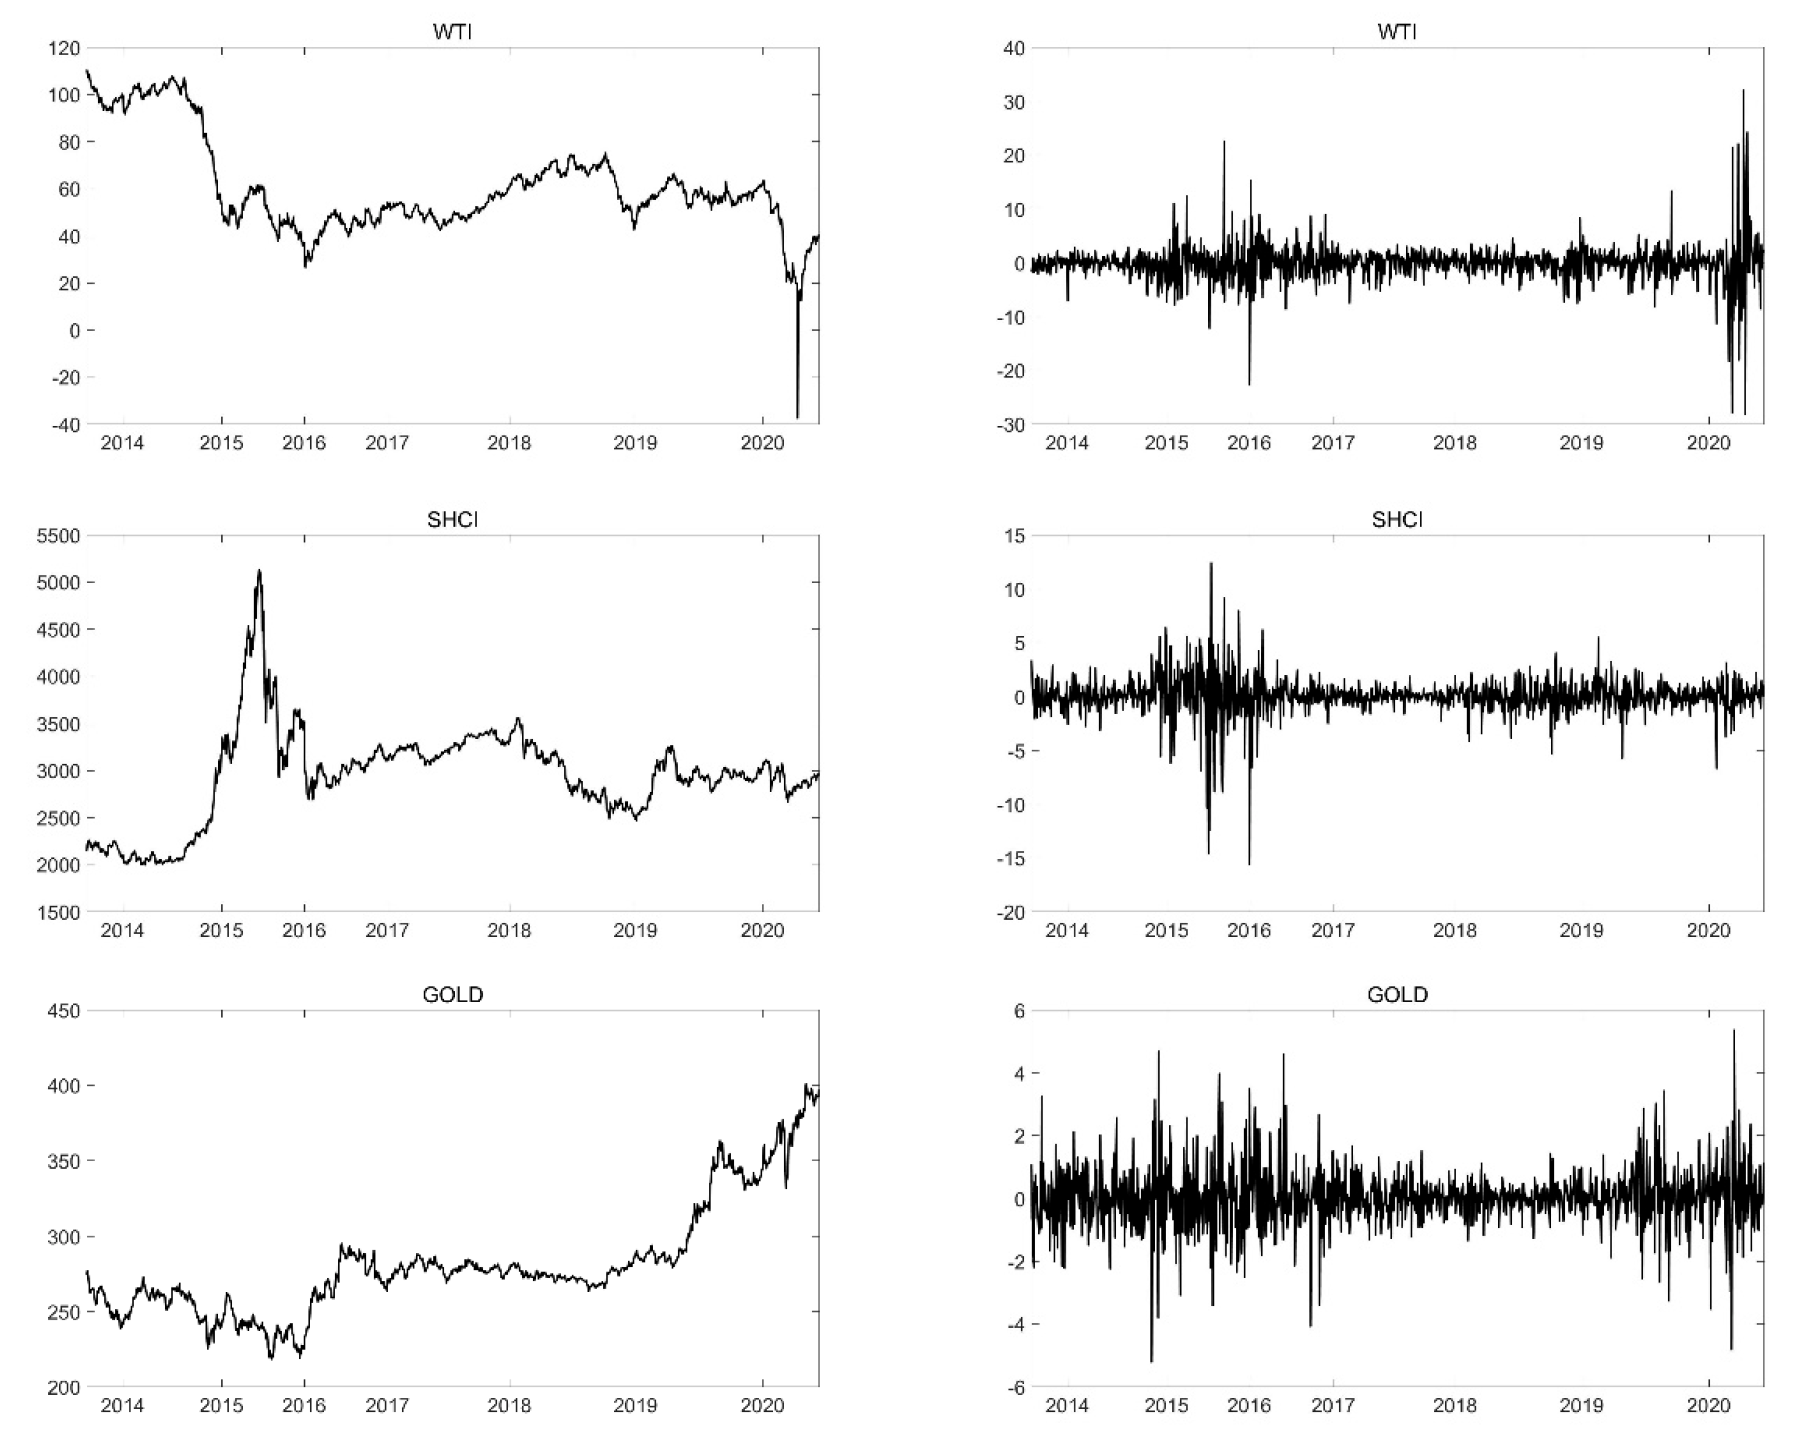
4. Data and Summary Statistics

In this study, we focus on the measurement of the spillover effect of crude oil on the Chinese stock market and China’s gold market based on daily data. The Shanghai Composite Index and the gold futures index are used to represent Chinese stock market prices and gold market prices, respectively. West Texas Intermediate (WTI) oil prices are considered to calculate the global crude oil price. WTI crude oil prices are from the Energy Information Administration (EIA). We obtained 1357 observations from the daily dataset from 9 September 2013 to 22 June 2020. It should be noted that, we use time series data, which better reflects the macro situation [49,50,51] and is more suitable than panel data [52,53].
The statistical description of all the data is shown in Table 2. The crude oil’s standard deviation is the highest among the three series. The skewness of WTI and GOLD is positive, while the skewness of SHCI is negative.
So, the peak of SHCI slopes to the left. The Jarque–Bera test shows that all return series do not follow normality. The ADF test shows that all series are shown stable and perform autocorrelation characters, as with the Ljung–Box test. In addition, in the Engle test, a strong ARCH effect is shown in all series.

5. Empirical Analysis

5.1. Marginal Model Analysis

In this part, we use the ARMA-GJR-GARCH model to analyze the volatility of each series. The asymmetric analysis results are shown in Table 3. Neither the Ljung–Box test nor the ARCH LM test finds significant serial correlation or ARCH effects tested by diagnostic methods. Regarding the mean equation, at the 1% level of the null hypothesis, all coefficients are significantly rejected. For WTI, SHCI, and GOLD, the GJR coefficients are significant and positive. This means that WTI, SHCI, and GOLD show different responses to positive and negative return shocks. Then leverage effects are produced.

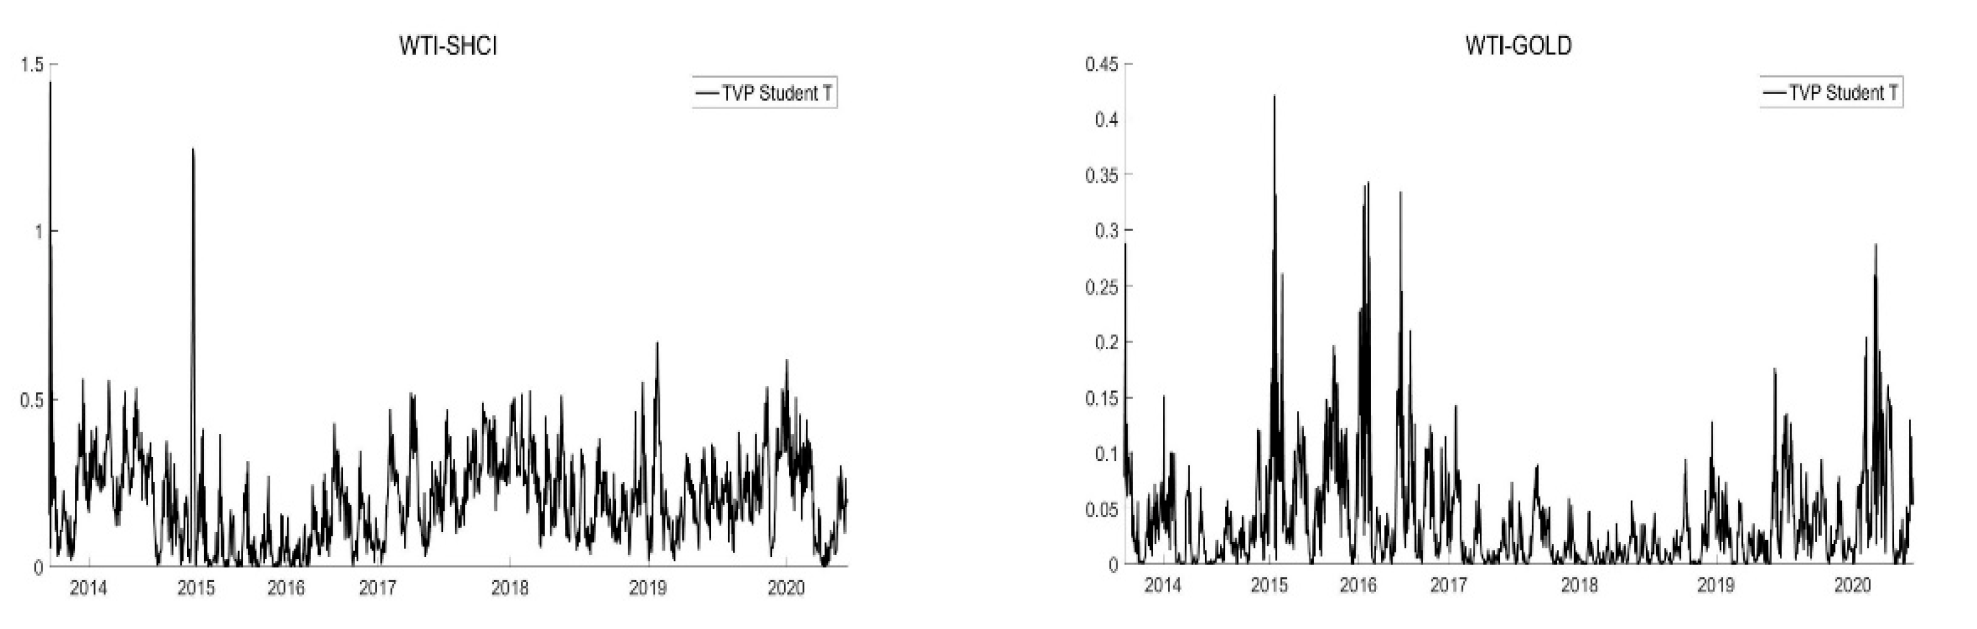
5.2. Copula Model Results

After estimating the ARMA-GJR-GARCH model, we calculate the parameters in the static copula model and in the time-varying copula models for the global crude oil market, China’s stock market, and the gold market.
The left part of Table 4 presents the estimated parameters of the static copula models for nine combinations of pairs comprising the series of the global crude oil return, China’s stock market, and gold market returns. All the dependence parameters are positive. Especially, WTI turns out a higher dependence on SHCI compared to the dependence on GOLD, according to the static copula condition. This likely reflects the wide use of products in the crude oil industry chain in China’s industry companies [54,55,56,57], which are the major listed companies on the Chinese stock market. So, China’s stock market shows a closer relationship with the global crude oil market, compared with China’s gold market. It also shows heterogeneity of dependence degree between the international crude oil market and China’s stock market and that between crude oil and the gold market. As the international crude oil market changes, the SHCI and the GOLD may show coordinated changes to varying degrees.
The right part of Table 4 shows the estimated parameters of the time-varying copula models for six combinations of pairs comprising the series of the global crude oil return, China’s stock market, and gold market returns. The parameters ψ 0 and ω are the degree of persistence, ψ 2 and α capture the adjustment in the dependence process, and ψ 1 and β   measures the dependence level. The time-varying copula model results are different from the static copula model results. On the one hand, most of the parameters obtained from the time-varying copula illustrate that China’s gold market (GOLD) is more dependent on crude oil prices than the Chinese stock market (SHCI), as shown by ψ 1 or β . On the other hand, ψ 2 and α values show a significantly different dependence on crude oil on the Chinese stock market and gold market. Overall, the results describe the difference in conditional dependence and the extent of variation.
Then we can obtain the best-fitting copula function according to the AIC criterion as shown in Table 5. Based on the Compared to the AIC values of the static copula with the time-varying copula, the time-varying copula model is more suitable to reveal the dependence structure. The best-fit copula and its dependence structure for WTI-SHCI and WTI-GOLD are shown in Figure 2.

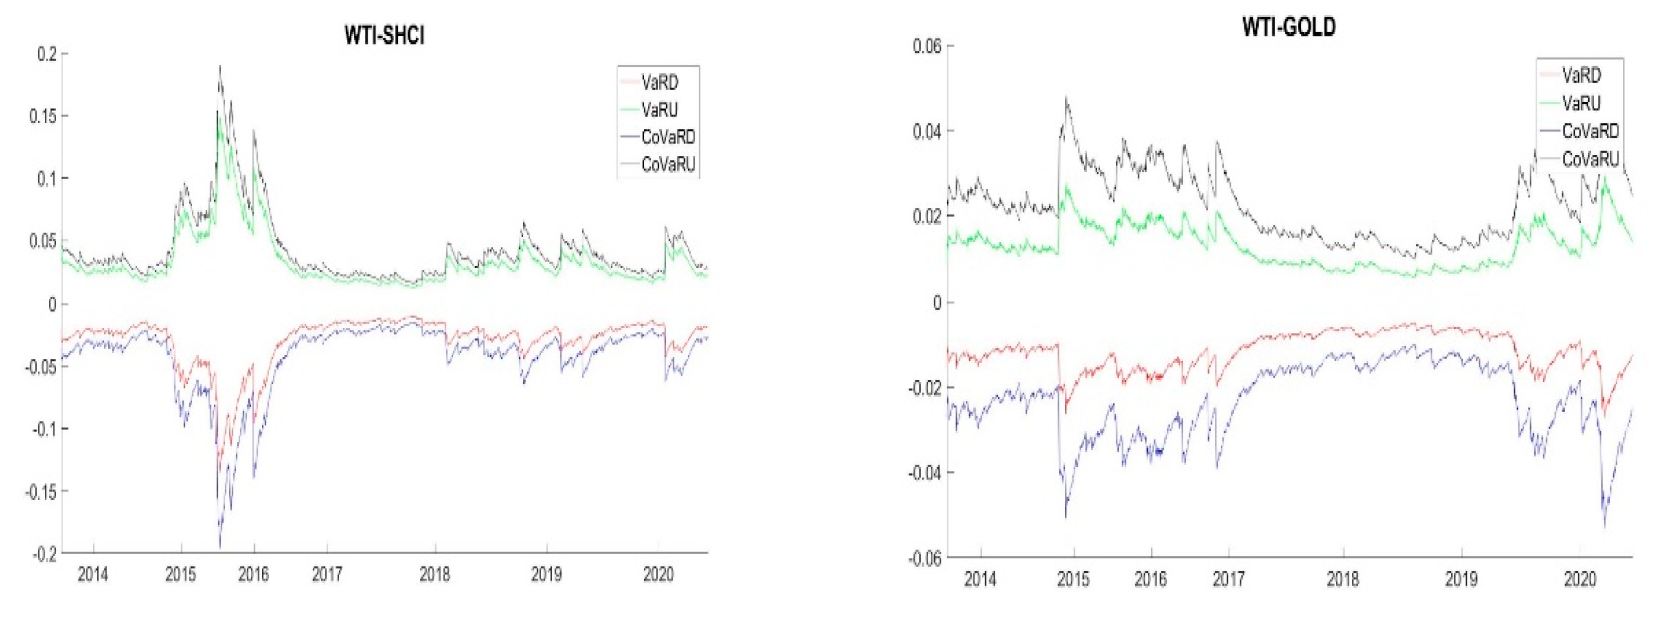
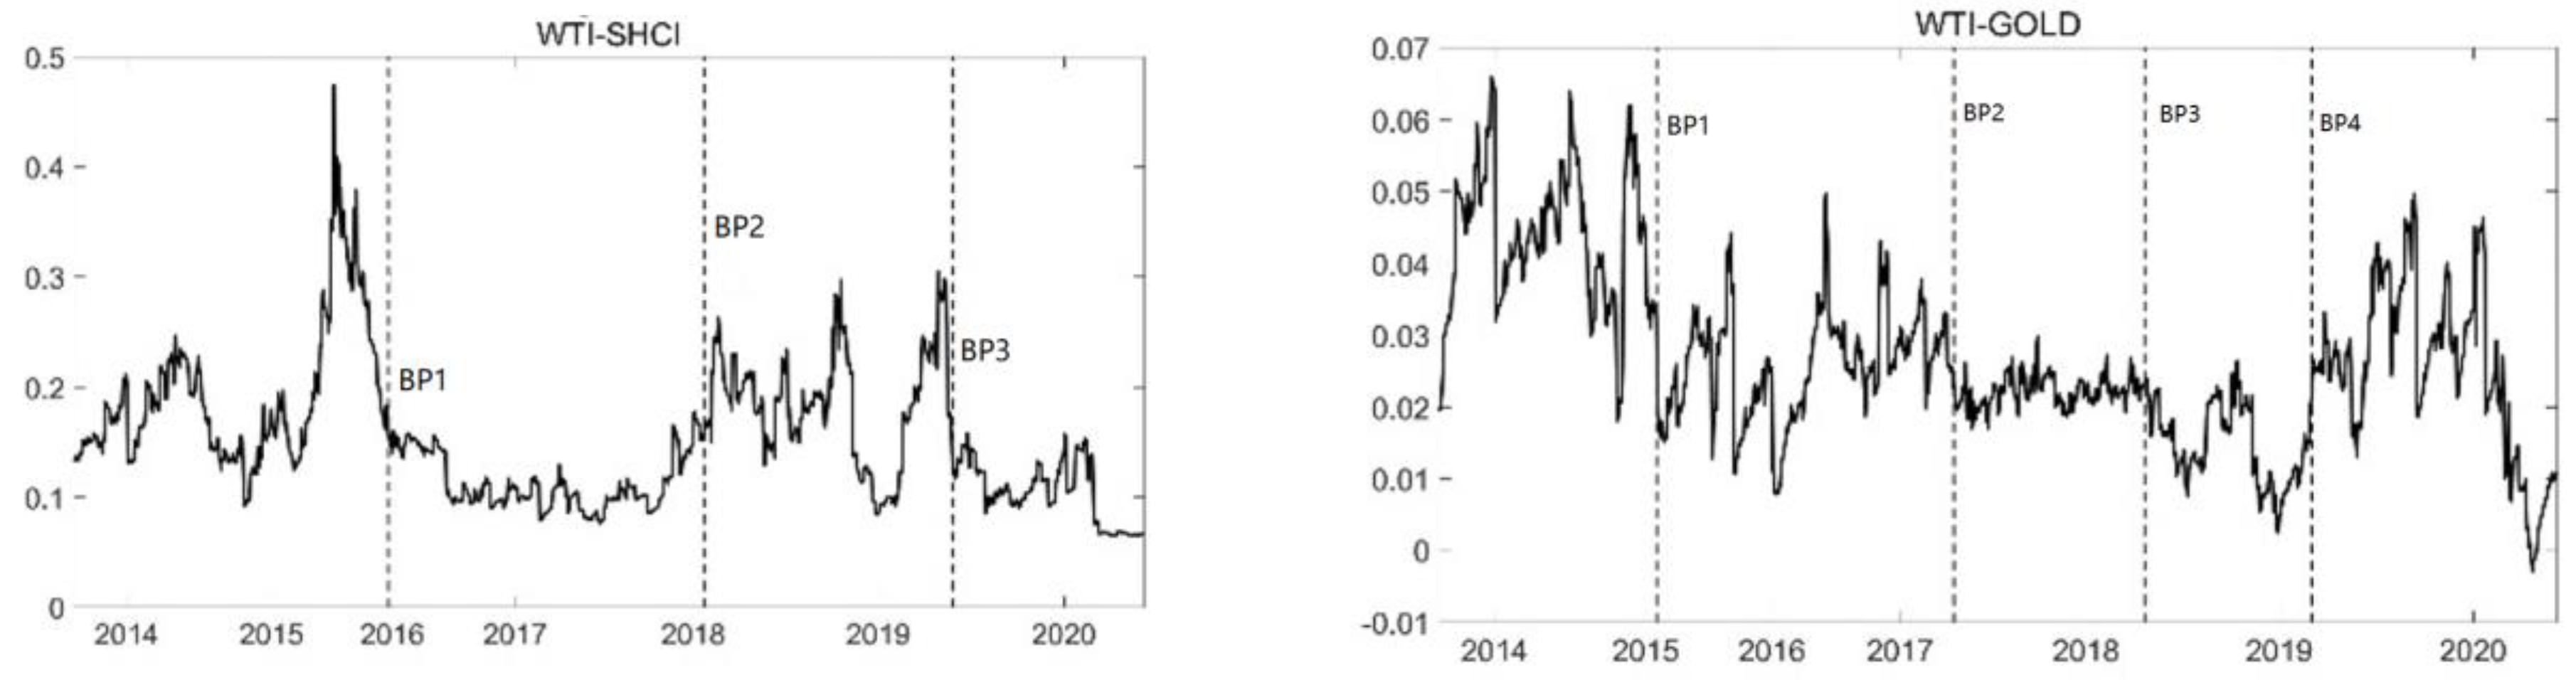
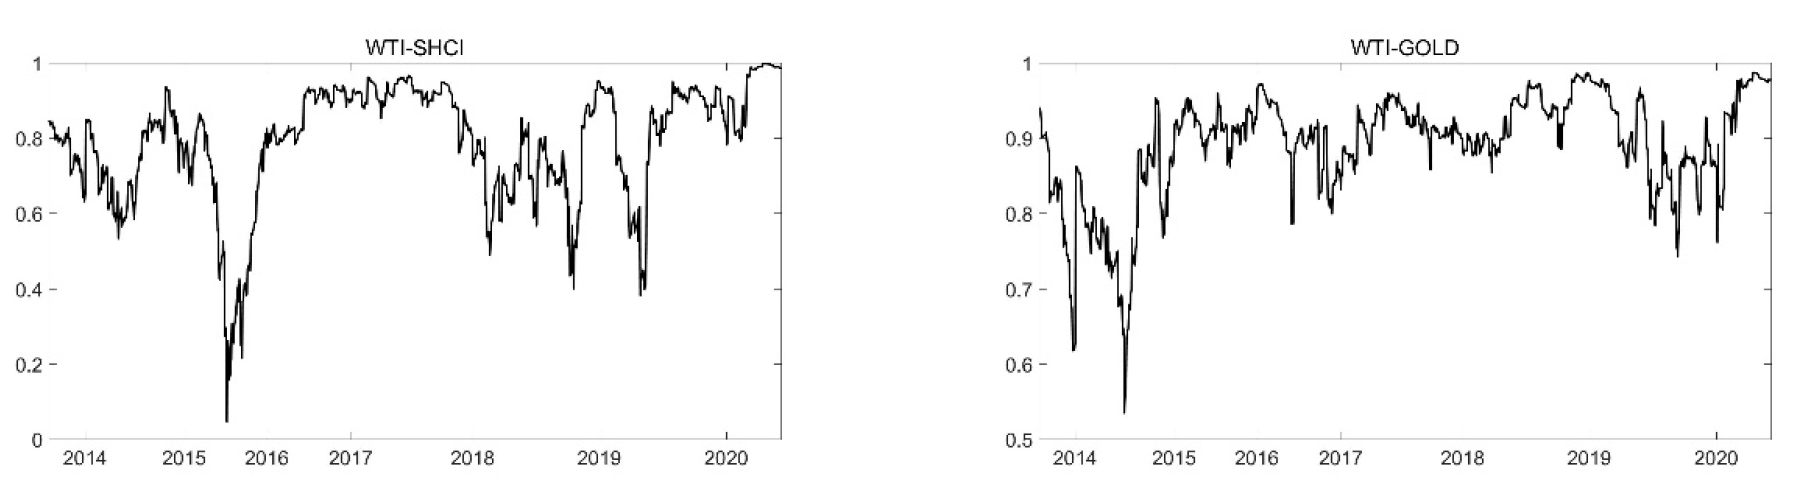
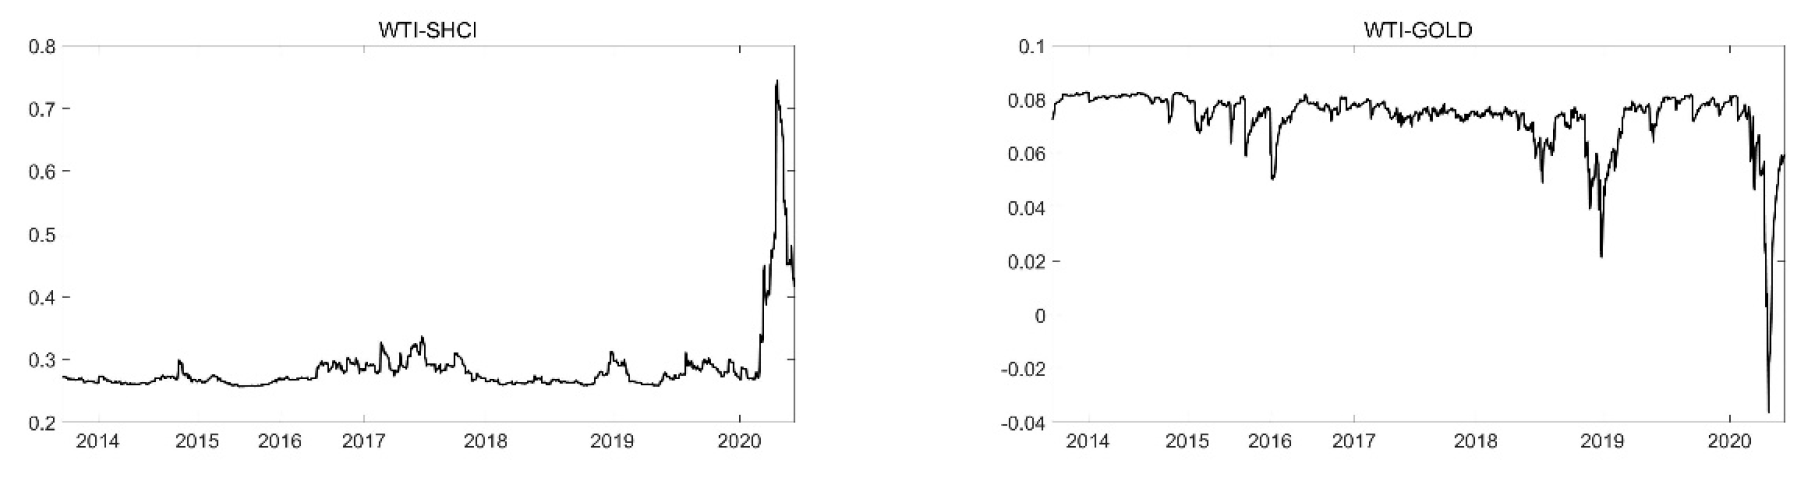
5.3. Spillover Effect Analysis

By using the marginal model and the best-fit copula, the downside CoVaR value of SHCI and GOLD at the confidence level of 95% ( β = 0.05) are calculated under the condition of the VaR value of the WTI at the confidence level of 95% ( α = 0.05). Then the C o V a R values shown in Figure 3 and Figure 4 are quantified. The CoVaR values for China’s stock market and the gold market in the sample period vary with time. The downside CoVaR value is always smaller than the VaR value. From May 2015 to September 2015, the crude oil price fell sharply, and the decline in CoVaR in China’s stock market exceeded the decline in VaR. While China’s gold market shows the reaction in another period, from September 2014 to November 2014, and from March 2020 to June 2020. The collapse of crude oil prices may lead to a greater drop in China’s stock market and gold market, which is consistent with the conclusion of Meng et al. [57]. In addition, when a rapid rise happened in the crude oil price, the upside CoVaR value turns out to be bigger than the VaR value. Figure 4 shows that both the downside ∆CoVaR value of the Chinese stock market and the gold market are greater than the upward ∆CoVaR value. Therefore, it can be explained that the fluctuation in crude oil prices affects the upward and downward conditions of China’s stock market and the gold market. In addition, this effect differs in the upward and downward stages. This conclusion is verified by the statistical description in Table 6.
The empirical results show that, under the condition of downward causation, the Chinese stock market and the gold market show different CoVaR and VaR values. In fact, in recent years, the collapse in crude oil prices has had a greater spillover effect on the Chinese gold market than on the Chinese stock market. For example, for China’s stock market, during the period from May 2015 to January 2016, the crude oil upside spillover effect was longer than the downside spillover effect, since the lowest in history was in March 2020; while the spillover effect from the crude oil market’s collapse to China’s gold markets in 2020 is greater than that from 2014 to 2015. This indicates that China’s gold market is more vulnerable to falling crude oil prices than China’s stock market. This conclusion can be explained by the safe-haven function of gold is stimulated when the temporary drop in crude oil prices occurs in 2020. Our findings are important extensions of the point view of Jiang et al. [58], who hold that the spillover effect from financial assets, including crude oil and gold, on stock indexes varies with time frequencies and quantiles.

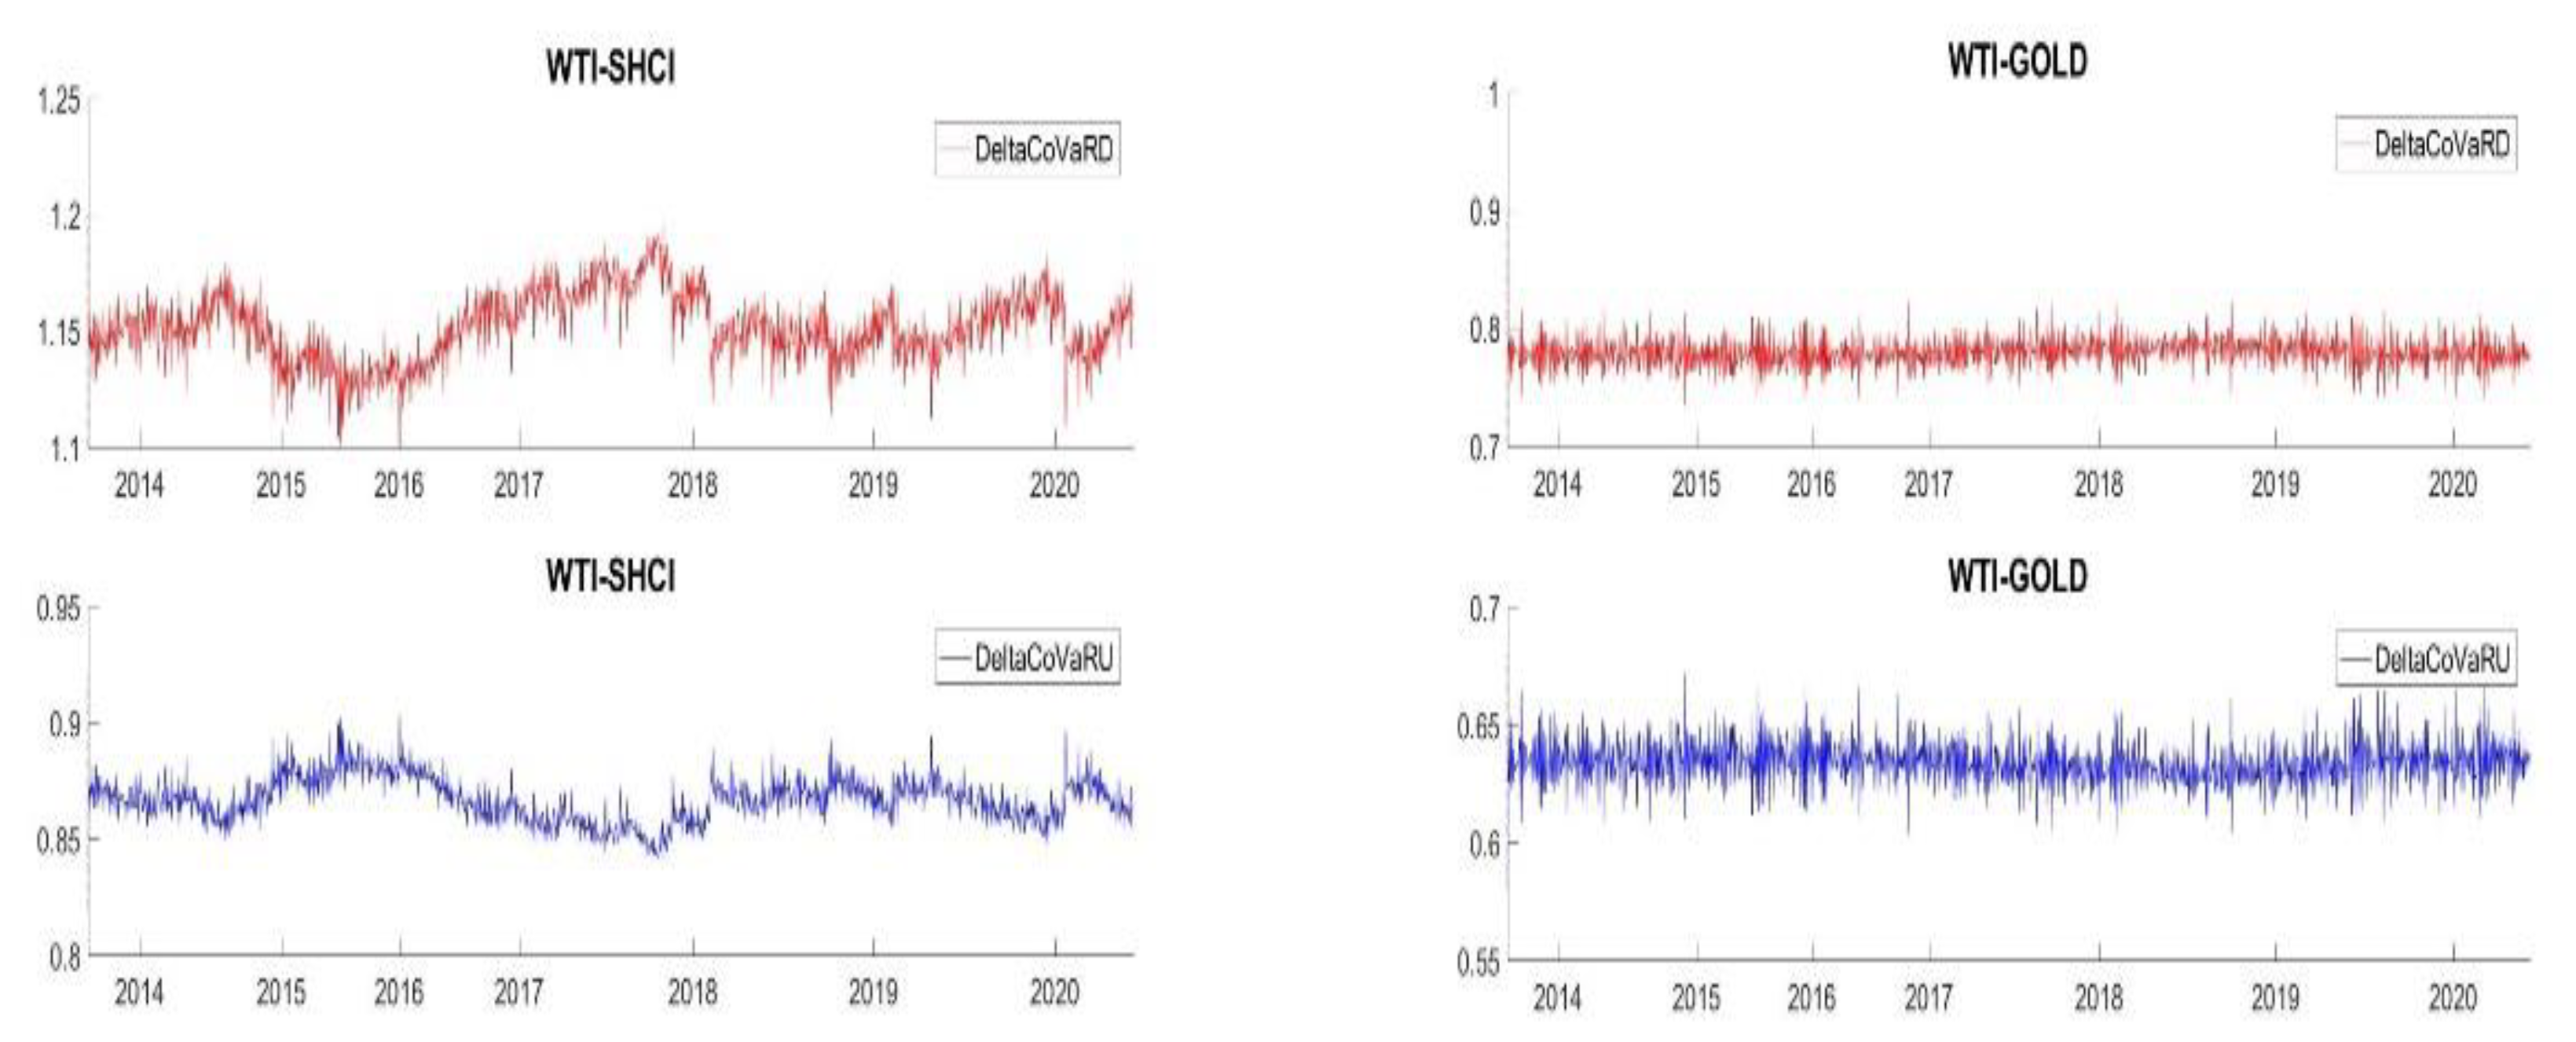
5.4. Asymmetric Risk Spillovers

In this section, we further utilize the KS test to see whether the upper and lower sides of VaR and CoVaR are different and whether there is an asymmetry in the risk spillover effect. The results are presented in Table 7. The first two columns show the results with a null hypothesis of H 0 :   C o V a R D = V a R D and H 0 :   C o V a R U = V a R U , respectively. Column 3 shows the results with the null hypothesis H 0 : C o V a R V a R D = C o V a R V a R U . Column 4 shows the results with the null hypothesis H 0 : C o V a R D o w n = C o V a R U p . We can obtain the following meaningful conclusions. First, the upward or downward oil prices may cause differences in the CoVaR and VaR values of the Chinese stock market and the gold market. In addition, the international crude oil market has asymmetry in the upward and downward risk spillover effects of China’s stock and gold markets. What is more, the spillover effect shows that there is also an asymmetry between the downward and upward ∆CoVaR. In general, no matter the upward or downward conditions, the international crude oil market will have an asymmetric risk spillover effect on the Chinese stock market and the gold market. Investors should pay more attention to the risks brought by the decline in crude oil prices in their investment portfolios since the downside risk spillover effect is higher.

5.5. Portfolio Implications

To further analyze how to use the portfolio to reduce downturn risk from crude oil, we first analyze their dynamic conditional correlation. Figure 5 shows that the dynamic corrections fluctuate during our data period. And we can divide the conditional correlation of WTI and SHCI into four subperiods. This shows that, from September 2013 to December 2015, China’s stock market shows a high correlation with the global crude oil market. Hence, the policymaker should be aware of the outside risks from the crude oil market to maintain the stability of China’s stock market. Conversely, from January 2016 to November 2017, the correlation between China’s stock market and the crude oil market is at a low level and low fluctuation. After December 2017, the correlation is still below 0.3. However, the fluctuation is more enlarged. Before January 2015, it shows a high level of up to 0.07 and high frequency. From February 2015 to April 2017, the correlation falls to an average level of 0.03. the correlation fluctuation keeps steady for one year after April 2018. After March 2019, the correlation raises with a greater fluctuation. The empirical results of the structural break test are shown in Table 8.
We construct portfolios including the stock market and gold market to analyze the potential risk reduction in diversified portfolios. In terms of the composition of oil and stock indexes or oil and gold prices, in a diversified investment portfolio, the risk is minimized based on the expected return remaining unchanged. Following [59], the optimal weight for oil in portfolio III with oil and stock at time t can be given by:
ω o s , t = h s , t h o s , t h o , t 2 h o s , t + h s , t ,   with ω o s , t = 0 ,                           i f     ω o s , t < 0   ω o s , t ,                         i f   0 < ω o s , t < 1 1 ,                           i f     ω o s , t > 1
where h o , t , h s , t , and h o s , t are the conditional variance of oil, the stock index, and the conditional variance of oil and the stock index, respectively. ω o s , t is the crude oil weight in a portfolio, and 1   ω o s , t is the optimal weight of the stock index.
The results of optimal portfolio weights shown in Figure 6 shows that to reduce the stock market and gold market risks of China, a highly fluctuated optimal weight of oil can be observed. In addition, the optimal weights differ with time, which indicates that we need to adjust the optimal strategy dynamically. In the portfolio of WTI and SHCI, before November 2015, the optimal weight became lower as the conditional correlation increased. From August 2014 to May 2015, China’s stock index jumped 200%. In this condition, it is wiser to increase the weight of the stock index. We can see a declined oil weight with a minimum value (0.05), which means that we only consider 5% of crude oil and 95% of China’s stock market in our portfolio. while as the stock index dropped after August 2015, the weight of oil needs to increase to maximize the yield. Therefore, investors and portfolio managers need to adjust the proper portfolio strategy according to the market environment.
Figure 7 shows the dynamic hedge ratios of the crude oil market and stock market or oil and the gold market in China with a changing path. The time-varying characteristics of the hedging ratio indicate that in different subperiods, investors should adjust their investment strategies to minimize risks. For instance, as for WTI-GOLD, from 2016 to 2018, the short position of GOLD showed a steady ratio of 0.07 and lasted for about two years, which means that we only need less than one unit of gold short position and one unit of crude oil long position to hedge risks. While after 2019, it fluctuated more frequently; and as crude oil dropped to −43 dollars per barrel in 2020, when COVID-19 happened, the short position in gold changed into a minus value, which means that investors need more than one unit of crude oil long position to hedge risks. It can be concluded that the hedge ratio could be adjusted according to the fluctuation of crude oil and the economic situation; and the portfolio managers need to improve their strategies in different market (bear or bull market) conditions accordingly.
Table 9 reports the parameters of the average time-varying conditional correlations, optimal portfolio weights, hedge ratios, and risk reduction effectiveness (RRE). The conditional correlation between crude oil and China’s stock market is positive and the level is higher than that between crude oil and China’s gold market. As for the optimal portfolio weights, the standard deviation is at a high level, which means that the investors should change portfolio ratios based on price fluctuation. In different subperiods of the WTI-SHCI investment portfolio, it is found that the average optimal weight of crude oil is relatively high, so crude oil plays a role in reducing the risk in China’s stock market. In addition, investors need to change their portfolio ratios as the conditional correlations and economic surroundings change, especially the extremely uncertain events such as COVID-19. Furthermore, we calculate the risk reduction effectiveness to compare the risk reduction degree in different periods. Several implications can be concluded as follows. The effect of diversified portfolios reducing risks shows different performances. For the full period, WTI-SHCI shows a better but less steady risk-reducing effect compared to the WTI-GOLD portfolio. During different subperiods, the risk reduction performances vary dramatically in the WTI-SHCI portfolio. This indicates that investors should change their portfolios in different periods.

6. Implications and Conclusions

In this study, we apply the relative risk measurement models to determine the upside and downside of CoVaR and VaR and examine the risk spillover effect from crude oil prices on China’s stock market and gold market. The daily dataset covers the period from 9 September 2013 to 22 June 2020. To better analyze the dynamic spillover effect, we divide the full periods into four subperiods for the crude oil price and China’s stock market portfolio and five subperiods for the crude oil price and China’s gold market portfolio. The portfolio and hedge strategies are included to suggest a varying portfolio ratio according to the volatility of prices and economic environments.
As for the dependence relation, the crude oil price has a higher dependence on the stock market. In addition, the impacts of the crude oil market on China’s stock market and gold market are asymmetric. When the volatility of crude oil prices intensifies, the downward impact of crude oil prices on the stock market and the gold market is greater than the upward impact of crude oil prices on them. As for portfolios, not only the optimal portfolio weights but also the hedge ratios differ in the sample period, which indicates that investors and portfolio managers should adjust their portfolio strategies frequently, especially under some extreme events, like COVID-19, when the volatility in financial assets will increase. In addition, in the different subperiods, crude oil can help reduce the risk of China’s stock market and gold market by a degree, which is consistent with the risk reduction effectiveness indicator. Several important policy implications can also be concluded from our results. First, both the Chinese stock market and the gold market are positively correlated with the crude oil market. Therefore, policymakers can control the shock of the international crude oil market by formulating effective measures and appropriately adjusting the investment ratio, which is conducive to the stability of the Chinese stock market and gold futures market. Secondly, a further discussion on the correlation between the crude oil market and the stock market or between the crude oil market and the gold market in China has some important implications for investors and portfolio managers. They can improve their portfolio strategies by adjusting the optimal portfolio ratios and hedge ratios.
There are also some limitations of this study to be improved. First, the methodology can be updated to further analyze the related issue. Secondly, this paper only analyzes the spillover effects from the stock index and gold market level. We can further analyze the spillover effect from crude oil to the listed companies in gold-related industries.

Author Contributions

Conceptualization, G.W. and J.M.; methodology, B.M., G.W. and J.M.; Software, B.M.; formal analysis, B.M., G.W. and J.M.; investigation, B.M., G.W. and J.M.; data curation, B.M.; writing—original draft preparation, G.W.; writing—review and editing, B.M. and J.M.; project administration, B.M.; funding acquisition, B.M. All authors have read and agreed to the published version of the manuscript.

Funding

This research is funded by the National Natural Science Foundation for Young Scholars of China (Grant No.72101063) and the Hunan Provincial Department of Education (21B0813).

Data Availability Statement

Not applicable.

Conflicts of Interest

The authors declare no conflict of interest.

References

  1. Fang, S.; Lu, X.; Egan, P.G. Reinvestigating the Oil Price–Stock Market Nexus: Evidence from Chinese Industry Stock Returns. China World Econ. 2018, 26, 43–62. [Google Scholar] [CrossRef]
  2. Ji, H.; Wang, H.; Zhong, R.; Li, M. China’s liberalizing stock market, crude oil, and safe-haven assets: A linkage study based on a novel multivariate wavelet-vine copula approach. Econ. Model. 2020, 93, 187–204. [Google Scholar] [CrossRef]
  3. Wei, Y.; Qin, S.; Li, X.; Zhu, S.; Wei, G. Oil price fluctuation, stock market and macroeconomic fundamentals: Evidence from China before and after the financial crisis. Financ. Res. Lett. 2019, 30, 23–29. [Google Scholar] [CrossRef]
  4. Peng, Y.; Chen, W.; Wei, P.; Yu, G. Spillover effect and Granger causality investigation between China’s stock market and international oil market: A dynamic multiscale approach. J. Comput. Appl. Math. 2020, 367, 112460. [Google Scholar] [CrossRef]
  5. Zhong, J.; Wang, M.; Drakeford, B.; Li, T. Spillover effects between oil and natural gas prices: Evidence from emerging and developed markets. Green Financ. 2019, 1, 30–45. [Google Scholar] [CrossRef]
  6. Lin, L.; Kuang, Y.; Jiang, Y.; Su, X. Assessing risk contagion among the Brent crude oil market, London gold market and stock markets: Evidence based on a new wavelet decomposition approach. N. Am. Econ. Financ. 2019, 50, 101035. [Google Scholar] [CrossRef]
  7. Miller, J.I.; Ratti, R.A. Crude oil and stock markets: Stability, instability, and bubbles. Energy Econ. 2009, 31, 559–568. [Google Scholar] [CrossRef] [Green Version]
  8. Liu, K.; Luo, C.; Li, Z. Investigating the risk spillover from crude oil market to BRICS stock markets based on Copula-POT-CoVaR models. Quant. Financ. Econ. 2019, 3, 754–771. [Google Scholar] [CrossRef]
  9. Awan, T.M.; Khan, M.S.; Haq, I.U.; Kazmi, S. Oil and stock markets volatility during pandemic times: A review of G7 countries. Green Financ. 2021, 3, 15–27. [Google Scholar] [CrossRef]
  10. Yousaf, I.; Hassan, A. Linkages between crude oil and emerging Asian stock markets: New evidence from the Chinese stock market crash. Financ. Res. Lett. 2019, 31. [Google Scholar] [CrossRef]
  11. Huang, J.; Li, Z.; Xia, X. Network diffusion of international oil volatility risk in China’s stock market: Quantile interconnectedness modelling and shock decomposition analysis. Int. Rev. Econ. Financ. 2021, 76, 1–39. [Google Scholar] [CrossRef]
  12. Mo, B.; Li, Z.; Meng, J. The dynamics of carbon on green energy equity investment: Quantile-on-quantile and quantile coherency approaches. Environ. Sci. Pollut. Res. 2022, 29, 5912–5922. [Google Scholar] [CrossRef]
  13. Jiang, K.; Ye, W. Does the asymmetric dependence volatility affect risk spillovers between the crude oil market and BRICS stock markets? Econ. Model. 2022, 117, 106046. [Google Scholar] [CrossRef]
  14. Zhu, P.; Tang, Y.; Wei, Y.; Lu, T. Multidimensional risk spillovers among crude oil, the US and Chinese stock markets: Evidence during the COVID-19 epidemic. Energy 2021, 231, 120949. [Google Scholar] [CrossRef]
  15. Mensi, W.; Al Rababa’a, A.R.; Vo, X.V.; Kang, S.H. Asymmetric spillover and network connectedness between crude oil, gold, and Chinese sector stock markets. Energy Econ. 2021, 98, 105262. [Google Scholar] [CrossRef]
  16. Özdurak, C. Nexus between crude oil prices, clean energy investments, technology companies and energy democracy. Green Financ. 2021, 3, 337–350. [Google Scholar] [CrossRef]
  17. Ahmed, A.D.; Huo, R. Volatility transmissions across international oil market, commodity futures and stock markets: Empirical evidence from China. Energy Econ. 2021, 93, 104741. [Google Scholar] [CrossRef]
  18. Zhao, Z.; Wen, H.; Li, K. Identifying bubbles and the contagion effect between oil and stock markets: New evidence from China. Econ. Model. 2021, 94, 780–788. [Google Scholar] [CrossRef]
  19. Tiwari, A.K.; Trabelsi, N.; Alqahtani, F.; Hammoudeh, S. Analysing systemic risk and time-frequency quantile dependence between crude oil prices and BRICS equity markets indices: A new look. Energy Econ. 2019, 83, 445–466. [Google Scholar] [CrossRef]
  20. Arouri, M.E.H.; Jouini, J.; Nguyen, D.K. Volatility spillovers between oil prices and stock sector returns: Implications for portfolio management. J. Int. Money Financ. 2011, 30, 1387–1405. [Google Scholar] [CrossRef]
  21. Adewuyi, A.O.; Awodumi, O.B.; Abodunde, T.T. Analysing the gold-stock nexus using VARMA-BEKK-AGARCH and Quantile regression models: New evidence from South Africa and Nigeria. Resour. Policy 2019, 61, 348–362. [Google Scholar] [CrossRef]
  22. Basher, S.A.; Sadorsky, P. Hedging emerging market stock prices with oil, gold, VIX, and bonds: A comparison between DCC, ADCC and GO-GARCH. Energy Econ. 2016, 54, 235–247. [Google Scholar] [CrossRef] [Green Version]
  23. Antonakakis, N.; Cunado, J.; Filis, G.; Gabauer, D.; de Gracia, F.P. Oil and asset classes implied volatilities: Investment strategies and hedging effectiveness. Energy Econ. 2020, 91, 104762. [Google Scholar] [CrossRef]
  24. Elie, B.; Naji, J.; Dutta, A.; Uddin, G.S. Gold and crude oil as safe-haven assets for clean energy stock indices: Blended copulas approach. Energy 2019, 178, 544–553. [Google Scholar] [CrossRef]
  25. Mo, B.; Nie, H.; Jiang, Y. Dynamic linkages among the gold market, US dollar and crude oil market. Phys. A 2018, 491, 984–994. [Google Scholar] [CrossRef]
  26. Dai, X.; Wang, Q.; Zha, D.; Zhou, D. Multi-scale dependence structure and risk contagion between oil, gold, and US exchange rate: A wavelet-based vine-copula approach. Energy Econ. 2020, 88, 104774. [Google Scholar] [CrossRef]
  27. Junttila, J.; Pesonen, J.; Raatikainen, J. Commodity market based hedging against stock market risk in times of financial crisis: The case of crude oil and gold. J. Int. Financ. Mark. Inst. Money 2018, 56, 255–280. [Google Scholar] [CrossRef]
  28. Lin, B.; Su, T. Mapping the oil price-stock market nexus researches: A scientometric review. Int. Rev. Econ. Financ. 2020, 67, 133–147. [Google Scholar] [CrossRef]
  29. Gharib, C.; Mefteh-Wali, S.; Jabeur, S.B. The bubble contagion effect of COVID-19 outbreak: Evidence from crude oil and gold markets. Financ. Res. Lett. 2021, 38, 101703. [Google Scholar] [CrossRef]
  30. Li, X.; Wei, Y. The dependence and risk spillover between crude oil market and China stock market: New evidence from a variational mode decomposition-based copula method. Energy Econ. 2018, 74, 565–581. [Google Scholar] [CrossRef]
  31. Li, Z.; Mo, B.; Nie, H. Time and frequency dynamic connectedness between cryptocurrencies and financial assets in China. Int. Rev. Econ. Financ. 2023, in press. [CrossRef]
  32. Aloui, C.; Jammazi, R. The effects of crude oil shocks on stock market shifts behaviour: A regime switching approach. Energy Econ. 2009, 31, 789–799. [Google Scholar] [CrossRef]
  33. Henry, O.T. Regime switching in the relationship between equity returns and short-term interest rates in the UK. J. Bank Financ. 2009, 33, 405–414. [Google Scholar] [CrossRef] [Green Version]
  34. Glosten, L.R.; Jagannathan, R.; Runkle, D.E. On the relation between the expected value and the volatility of the nominal excess return on stocks. J. Financ. 1993, 48, 1779–1801. [Google Scholar] [CrossRef]
  35. Drost, F.C.; Werker, B.J. Closing the GARCH gap: Continuous time GARCH modeling. J. Econom. 1996, 74, 31–57. [Google Scholar] [CrossRef] [Green Version]
  36. Bae, K.-H.; Karolyi, G.A. Good news, bad news and international spillovers of stock return volatility between Japan and the US. Pac.-Basin Financ. J. 1994, 2, 405–438. [Google Scholar] [CrossRef]
  37. Braun, P.A.; Nelson, D.B.; Sunier, A.M. Good news, bad news, volatility, and betas. J. Financ. 1995, 50, 1575–1603. [Google Scholar] [CrossRef]
  38. Mohamed, A.; Rubi, A. Return performance and leverage effect in Islamic and socially responsible stock indices evidence from Dow Jones (DJ) and Financial Times Stock Exchange (FTSE). Afr. J. Bus. Manag. 2011, 5, 6927–6939. [Google Scholar]
  39. Jiang, Y.; Jiang, C.; Nie, H.; Mo, B. The time-varying linkages between global oil market and China’s commodity sectors: Evidence from DCC-GJR-GARCH analyses. Energy 2019, 166, 577–586. [Google Scholar] [CrossRef]
  40. Medovikov, I. When does the stock market listen to economic news? New evidence from copulas and news wires. J. Bank Financ. 2016, 65, 27–40. [Google Scholar] [CrossRef] [Green Version]
  41. Boubaker, H.; Sghaier, N. Portfolio optimization in the presence of dependent financial returns with long memory: A copula based approach. J. Bank Financ. 2013, 37, 361–377. [Google Scholar] [CrossRef]
  42. Delatte, A.-L.; Lopez, C. Commodity and equity markets: Some stylized facts from a copula approach. J. Bank Financ. 2013, 37, 5346–5356. [Google Scholar] [CrossRef] [Green Version]
  43. Nelsen, R.B. Lecture Notes in Statistics. In An Introduction to Copulas; Springer: Berlin/Heidelberg, Germany, 1999; Volume 139, pp. 414–422. [Google Scholar]
  44. Patton, A.J. Estimation of multivariate models for time series of possibly different lengths. J. Appl. Econom. 2006, 21, 147–173. [Google Scholar] [CrossRef]
  45. Joe, H. Multivariate Models and Multivariate Dependence Concepts; CRC Press: Boca Raton, FL, USA, 1997. [Google Scholar]
  46. Tobias, A.; Brunnermeier, M.K. CoVaR. Am. Econ. Rev. 2016, 106, 1705. [Google Scholar]
  47. Jiang, Y.; Mu, J.; Nie, H.; Wu, L. Time-frequency analysis of risk spillovers from oil to BRICS stock markets: A long-memory Copula-CoVaR-MODWT method. Int. J. Financ. Econ. 2022, 27, 3386–3404. [Google Scholar] [CrossRef]
  48. Girardi, G.; Ergün, A.T. Systemic risk measurement: Multivariate GARCH estimation of CoVaR. J. Bank Financ. 2013, 37, 3169–3180. [Google Scholar] [CrossRef]
  49. Li, Z.; Ao, Z.; Mo, B. Revisiting the valuable roles of global financial assets for international stock markets: Quantile coherence and causality-in-quantiles approaches. Mathematics 2021, 9, 1750. [Google Scholar] [CrossRef]
  50. Lssifuah-Nunoo, E.; Junior, P.O.; Adam, A.M.; Bossman, A. Assessing the safe haven properties of oil in African stock markets amid the COVID-19 pandemic: A quantile regression analysis. Quant. Financ. Econ. 2022, 6, 244–269. [Google Scholar] [CrossRef]
  51. Li, Z.; Chen, L.; Dong, H. What are bitcoin market reactions to its-related events? Int. Rev. Econ. Financ. 2021, 73, 1–10. [Google Scholar] [CrossRef]
  52. Li, Z.; Chen, H.; Mo, B. Can digital finance promote urban innovation? Evidence from China. Borsa Istanb. Rev. 2022, in press. [CrossRef]
  53. Li, Z.; Zou, F.; Mo, B. Does mandatory CSR disclosure affect enterprise total factor productivity? Ekon. Istraz. 2022, 35, 4902–4921. [Google Scholar] [CrossRef]
  54. Zhang, C.; Chen, X. The impact of global oil price shocks on China’s bulk commodity markets and fundamental industries. Energy Policy 2014, 66, 32–41. [Google Scholar] [CrossRef] [Green Version]
  55. Chen, P. Global oil prices, macroeconomic fundamentals and China’s commodity sector comovements. Energy Policy 2015, 87, 284–294. [Google Scholar] [CrossRef]
  56. Luo, J.; Ji, Q. High-frequency volatility connectedness between the US crude oil market and China’s agricultural commodity markets. Energy Econ. 2018, 76, 424–438. [Google Scholar] [CrossRef]
  57. Meng, J.; Nie, H.; Mo, B.; Jiang, Y. Risk spillover effects from global crude oil market to China’s commodity sectors. Energy 2020, 202, 117208. [Google Scholar] [CrossRef]
  58. Jiang, Y.; Tian, G.; Mo, B. Spillover and quantile linkage between oil price shocks and stock returns: New evidence from G7 countries. Financ. Innov. 2020, 6, 42. [Google Scholar] [CrossRef]
  59. Kroner, K.F.; Ng, V.K. Modeling asymmetric comovements of asset returns. Rev. Financ. Stud. 1998, 11, 817–844. [Google Scholar] [CrossRef]
Figure 1. Time series plot of prices and return.
Energies 16 02141 g001
Figure 2. Time-series plots of the best copula parameter between crude oil and China’s stock market and that between crude oil on China’s gold market. WTI, SHCI, and GOLD represent the global crude oil market, the Chinese stock market (here we use the Shanghai Composite Index), and the gold futures index in China, respectively.
Energies 16 02141 g002
Figure 3. Time-series plots of the downside VaR, upside VaR, and CoVaR for China’s stock market and gold market. WTI, SHCI, and GOLD represent the global crude oil market, the Chinese stock market (here we use the Shanghai Composite Index), and the gold futures index in China, respectively.
Energies 16 02141 g003
Figure 4. Time-series plots of the downside and upside ∆CoVaR of China’s stock market and gold market. WTI, SHCI, and GOLD represent the global crude oil market, the Chinese stock market (here we use the Shanghai Composite Index), and the gold futures index in China, respectively.
Energies 16 02141 g004
Figure 5. Time-varying conditional correlations.
Energies 16 02141 g005
Figure 6. Time-varying optimal portfolio weights.
Energies 16 02141 g006
Figure 7. Time-varying hedge ratios.
Energies 16 02141 g007
Table 1. Bivarate Copula Functions.
Copula NameFormulaTail Dependence
Normal C N u , v , ρ = Φ Φ 1 u , Φ 1 v zero tail dependence
Student-t C T u , v , ρ , v = T t v 1 u , t v 1 v symmetric tail dependence
Clayton C C L u , v ; δ = max { ( u δ + v δ 1 ) 1 / δ , 0 } lower tail dependence
Gumbel C G u , v ; δ = exp ( ( ( log u ) δ + ( log v ) δ ) 1 / δ ) upper tail dependence
Rotated Gumbel C R G u , v ; δ = u + v 1 + C G 1 u , 1 v ; δ lower tail dependence
Frank C F u , v ; δ = δ log ( [ 1 e δ ( 1 e δ u ) 1 e δ v ) / 1 e δ ) zero tail dependence
Placket C P u , v ; θ = 1 2 θ 1 1 + θ 1 u + v zero tail dependence
SJC C S J C ( u , v ; λ U , λ L = 0.5 ( C J C u , v ; λ U , λ L + C J C 1 u , 1 v ; λ U , λ L + u + v 1
C J C u , v ; λ U , λ L = 1 ( 1 { [ 1 ( 1 u ) k ] γ + [ 1 ( 1 v ) k ] γ 1 } 1 / γ ) 1 / k
upper and lower tail dependence
Note: u   and v are marginal distribution functions, λ U and λ L represent the upper tail and lower tail correlation coefficients respectively; Φ 1 · represents the inverse function of the standard normal distribution function. As for SJC copula, k = 1 l o g 2 2 λ U ,   γ = 1 log 2 λ L   .
Table 2. Summary statistics for the return series.
WTISHCIGOLD
Mean−0.02970.02400.0274
Median0.11590.05460.0315
Max31.963412.40485.3570
Min−28.1796−15.6188−5.2213
S. D.3.44621.69070.9229
Skew0.5871−1.44670.0830
Kurt25.079321.23587.7263
Max27,601.11 ***19,275.95 ***1264.6 ***
Q (10)60.4400 ***24.309 **7.1560
[0.0000][0.0068][0.7106]
Q2 (10)666.7100 ***416.4287 ***178.3176 ***
[0.0000][0.0000][0.0000]
ARCH (10)200.5658 ***209.6522 ***100.1241 ***
[0.0000][0.0000][0.0000]
ADF−36.7195 ***−39.3499 ***−37.5984 ***
PP−36.796 ***−39.2612 ***−37.597 ***
KPSS0.1140270.1266580.302704
correlation-0.1342 ***0.0203 ***
Note: WTI, SHCI, and GOLD represent the global crude oil market, the Chinese stock market (here we use the Shanghai Composite Index), and the gold futures index in China, respectively. *** and ** indicate rejection of the null hypothesis at a 1% and 5% level, separately.
Table 3. The estimates of the ARMA-GJR-GARCH model.
WTISHCIGOLD
(p, q)(1,2)(2,2)(1,2)
c −0.05040.042 *0.0104
(0.0678)(0.0678)(0.0678)
α 1 0.9511 ***−0.0649−0.3187
(0.0159)(3.3695)(0.2943)
α 2 0.026
(1.0275)
β 1 −0.9761 ***0.06140.3025
(0.0333)(3.3664)(0.2944)
β 2 0.0317−0.01560.0158
(0.0292)(1.1188)(0.0267)
ψ 0.0757 ***0.0139 *0.0032
(0.0285)(0.0072)(0.0021)
γ 0.01160.0773 ***0.0421 **
(0.0189)(0.0169)(0.0185)
φ 0.9327 ***0.9278 ***0.9523 ***
(0.0152)(0.0116)(0.0153)
η 0.1113 ***−0.00460.0108
(0.0283)(0.0272)(0.0185)
Asy−0.1449 ***−0.0145−0.0184
(0.0346)(0.0334)(0.0314)
Tail3.4338 ***3.5077 ***4.2185 ***
(0.4088)(0.3763)(0.4838)
Q (10)7.729411.47982.5773
[0.3570][0.0746][0.9211]
Q2 (10)5.68279.155114.3853
[0.6827][0.3293][0.0722]
ARCH (10)0.57650.93491.4388
[0.8342][0.4998][0.1575]
Note: WTI, SHCI, and GOLD represent the global crude oil market, the Chinese stock market (here we use the Shanghai Composite Index), and the gold futures index in China, respectively. p and q are the lag orders of r and ε in Equation (1), and the values of p and q in the demonstration are the results obtained according to the AIC criterion. c , α i and β i represent the constant term, AR and MA in Equation (1), respectively. ψ , γ , φ ,   and η are the constant term, the parameter of GARCH, ARCH, and the GJR item. In addition, the Asy and Tail items are the results obtained by setting the distribution of each variable as a skewed student. Q (20) and Q2 (20) refer to the empirical statistics of the Ljung-Box test for autocorrelation of the returns and squared returns series with 20 lags, respectively. ARCH is Engle’s LM test, which is used to test the ARCH effect with the highest 20-order residual. The standard error values are shown in parentheses. p-values of the estimation are shown in square brackets. ***, **, and * indicates rejection of the null hypothesis at 1%, 5%, and 10% levels, respectively.
Table 4. Copula estimates for crude oil, China’s stock market, and the gold market.
WTI-SHCIWTI-GOLD WTI-SHCIWTI-GOLD
Normal ρ 0.093 ***0.0526 *Time-varying normal ψ 0 0.3269 ***0.1308 ***
(0.0270)(0.0271) (0.0244)(0.0167)
AIC−11.7771−3.7633 ψ 1 −0.08060.1677 **
Clayton α 0.1551 ***0.0782 ** (0.0904)(0.0788)
(0.0436)(0.0356) ψ 2 −1.3134 ***−0.9195 ***
AIC−26.7061−7.5171 (0.1943)(0.2484)
Rotated Clayton α 0.0955 **0.0757 ** AIC−12.1243−5.5614
(0.0399)(0.0374)Time-varying rotated Gumbel ω L 0.00100.6195
AIC−10.2425−6.5720 (0.0822)(4.3291)
Plackett δ 1.3936 **1.2058 *** α L 0.4885 ***−0.3382
(0.5823)(0.4191) (0.1197)(4.0651)
AIC−13.2232−4.4562 β L −0.7138 ***−0.0851
Frank δ 0.57720.3378 (0.1829)(0.1319)
(1.0747)(1.0457) AIC−42.9376−13.6182
AIC−11.4063−4.0183Time-varying SJC ω U −18.1697 ***3.1519 ***
Gumbel δ 1.1000 ***1.1000 *** (0.0009)(1.0540)
(0.0160)(0.0161) α U −1.8517 ***−25.0000 ***
AIC−19.5484−5.5451 (0.0001)(4.7500)
Rotated Gumbel δ 1.1000 ***1.1000 *** β U −0.0071 ***−5.0837 ***
(0.0145)(0.0158) (0.0000)(1.7284)
AIC−34.3998−7.1905 ω L 2.7231 ***−13.8260 ***
Student’s t ρ 0.0911 ***0.0590 *** (0.0000)(0.1762)
(0.0000)(0.0000) α L −16.3463 ***25.0000 ***
ν 3.6122 ***4.8238 *** (0.0000)(0.3181)
(0.0000)(0.0006) β L −4.4404 ***−18.4485 ***
AIC−85.8457−48.2914 (0.0000)(0.1569)
SJC λ U 0.00000.0001 AIC−41.2246−21.6513
(0.4740)(0.0002)Time-varying Gumbel ω −0.5174 ***1.9783 ***
λ L 0.06390.0090 (0.0566)(0.0513)
(0.3039)(0.0062) α 0.8854 ***−1.0160 ***
AIC−32.0104−10.6824 (0.0567)(0.0545)
β −0.4550 ***−2.2179 ***
(0.1460)(0.0666)
AIC−34.6333−21.1931
Time-varying T-copula ψ 0 0.2976 ***0.0626 ***
(0.0348)(0.0169)
ψ 1 −0.06900.2672 ***
(0.0792)(0.0944)
ψ 2 −1.0707 ***−0.8110 ***
(0.3275)(0.2781)
AIC−88.4969−48.2839
Time-varying Clayton ω 1.3950 ***−0.3872
(0.1258)(0.4323)
α −0.6358 ***−1.2148
(0.2111)(0.8361)
β −2.8353 ***1.8647 **
(0.3542)(0.9663)
AIC−34.9863−8.3209
Note: WTI, SHCI, and GOLD represent the global crude oil market, the Chinese stock market (here we use the Shanghai Composite Index), and the gold futures index in China, respectively. We estimate the parameters of each return and calibrate them. λ U represent the right (upper) tail dependence.   λ L represents the left (lower) tail dependence. λ U and λ L are within [0, 1]. The AIC values adjusted for the small-sample bias are provided for different copula models. For the TVP copulas, q is set to 10. The standard error values are given in parentheses. ***, **, and * indicates rejection of the null hypothesis at 1%, 5%, and 10% levels, respectively.
Table 5. The best-fit copula and dependence structure.
Best-Fit CopulaDependence Structure
WTI-SHCITVP-Student-tSymmetric tail dependence
WTI-GOLDTVP-Student-tSymmetric tail dependence
Note: WTI, SHCI, and GOLD represent the global crude oil market, the Chinese stock market (here we use the Shanghai Composite Index), and the gold futures index in China, respectively. It describes the relationship between crude oil and China’s stock market and the gold market throughout the whole sample period.
Table 6. Descriptive statistics of VaR, CoVaR, and ∆CoVaR from crude oil to China’s stock market and gold market.
DownUp
VaRCoVaR∆CoVaRVaRCoVaRCoVaR
WTI-SHCI−2.9520−4.31131.14913.35504.29490.8663
(1.9744)(2.8680)(0.1080)(2.1797)(2.7977)(0.0178)
WTI-GOLD−1.1741−2.33400.78101.29152.29210.6336
(0.4445)(0.8769)(0.0816)(0.4800)(0.8530)(0.0138)
Note: This table shows the average values for VaR, CoVaR, and ∆CoVaR. Standard errors are in brackets. WTI, SHCI, and GOLD represent the global crude oil market, the Chinese stock market (here we use the Shanghai Composite Index), and the gold futures index in China, respectively.
Table 7. Asymmetric risk spillover effects from crude oil price to China’s stock market and gold market.
H0: C o V a R D = V a R D
H1: C o V a R D V a R D
H0: C o V a R U = V a R U
H1: C o V a R U V a R U
H0: C o V a R V a R D = C o V a R V a R U
H1: C o V a R V a R D C o V a R V a R U
H0: C o V a R D = C o V a R U
H1: C o V a R D   C o V a R U
WTI-SHCI0.37650.26231.00000.9992
(0.0000)(0.0000)(0.0000)(0.0000)
WTI-GOLD0.56960.52830.99850.9985
(0.000)(0.000)(0.000)(0.0000)
Note: WTI, SHCI, and GOLD represent the global crude oil market, the Chinese stock market (here we use the Shanghai Composite Index), and the gold futures index in China, respectively. We show the p-values of the KS test in brackets.
Table 8. Empirical results of the structural break tests.
WTI-SHCIF StatisticsWTI-GOLDF Statistics
Number of breaks selected3 breaks 4 breaks
Break date4 December 2015319.3474 ***27 January 20151092.582 ***
22 November 2017126.5677 ***28 April 201759.99245 ***
30 May 2019383.1022 ***25 April 201891.64415 ***
06 March 201984.37587 ***
Note: We sequentially test for the hypothesis of k breaks vs. k + 1 breaks, employing F statistics. Lag length selection is based on SIC in the test. *** indicate rejection of the null hypothesis at a 1% level.
Table 9. The average time-varying conditional correlations, optimal portfolio weights, hedge ratios, and risk reduction effectiveness (RRE).
WTI-SHCI
Full PeriodBegin-BP1BP1-BP2BP2-BP3BP3-End
ρ 0.15070.19190.10890.17910.1035
(0.0611)(0.0656)(0.0219)(0.0491)(0.0273)
ω 0.79090.68710.89750.71800.9092
(0.1562)(0.1707)(0.0507)(0.1302)(0.0608)
ξ 0.28560.26560.28850.26780.3402
(0.0569)(0.0065)(0.0151)(0.0106)(0.1157)
RRE0.25130.35380.07480.1954−0.1122
WTI-GOLD
Full PeriodBegin-BP1BP1-BP2BP2-BP3BP3-BP4BP4-End
ρ 0.02670.04350.02570.02220.01470.0249
(0.0123)(0.0100)(0.0074)(0.0022)(0.0056)(0.0120)
ω 0.89100.80090.90410.91270.95260.8961
(0.0711)(0.0855)(0.0368)(0.0238)(0.0250)(0.0607)
φ 0.07300.08050.07510.07440.06370.0692
(0.0119)(0.0019)(0.0054)(0.0014)(0.0109)(0.0199)
RRE0.18710.24380.16840.15070.10210.1771
Note: ρ , ω , and φ are the conditional correlation parameter, the optimal portfolio weight, and the hedge ratio, respectively. The standard error values are in parentheses. The full period is from 9 September 2013 to 22 June 2020. In the portfolio of WTI-SHCI, the first subperiod is from 9 September 2013 to 4 December 2015, the sec subperiod is from 5 December 2015 to 22 November 2017, the third subperiod is from 23 November 2017 to 30 May 2019, and the last subperiod is from 1 June 2019 to 22 June 2020. In the portfolio of WTI-GOLD, the first subperiod is from 9 September 2013 to 27 January 2015, the second subperiod is from 28 January 2015 to 28 April 2017, the third subperiod is from 29 April 2017 to 25 April 2018, the fourth subperiod is from 26 April 2018 to 6 March 2019, and the last subperiod is from 7 March 2019 to 22 June 2020.
Disclaimer/Publisher’s Note: The statements, opinions and data contained in all publications are solely those of the individual author(s) and contributor(s) and not of MDPI and/or the editor(s). MDPI and/or the editor(s) disclaim responsibility for any injury to people or property resulting from any ideas, methods, instructions or products referred to in the content.

