Article

Research on Hierarchical Control Strategy of ESS in Distribution Based on GA-SVR Wind Power Forecasting

1
Economic and Technological Research Institute, State Grid Henan Electric Power Company, Zhengzhou 450015, China
2
School of Electric Power Engineering, Nanjing Institute of Technology, Nanjing 211100, China
3
Faculty of Engineering and Architecture, Kore University of Enna, 94100 Enna, Italy
*
Author to whom correspondence should be addressed.
Energies 2023, 16(4), 2079; https://doi.org/10.3390/en16042079
Submission received: 5 January 2023 / Revised: 13 February 2023 / Accepted: 14 February 2023 / Published: 20 February 2023
(This article belongs to the Special Issue Volume II: Situation Awareness for Smart Distribution Systems)

Abstract

:
In recent years, the world has been actively promoting the development of wind power, photovoltaic, and other new energy. The inherent randomness and intermittency of wind power output have led to the reduction of supply-side controllability and stability, and the power system is facing severe challenges. Aiming at the irregular fluctuation of wind power output and the restriction between the charge and discharge depth and service life of hybrid energy storage equipment, a hierarchical control strategy for a hybrid energy storage system based on improved GA-SVR wind power prediction is proposed. First of all, the short-term prediction of wind power output is carried out using Support Vector Regression (SVR), and the improved genetic algorithm is used for optimization. Then, the result obtained from the prediction calculation is used as the wind power output, and the internal initial power of each energy storage element is obtained through the hybrid energy storage capacity configuration method and further controlled through hierarchical control regulation. Finally, a simulation experiment is carried out on the proposed control strategy. The simulation algorithm shows that the proposed method can not only enhance the effective output of new energy but also extend the service life of energy storage and ensure the safe and stable operation of the power system.

1. Introduction

In the past few years, in order to change the energy pattern dominated by fossil energy, it has become imperative to promote the development of new energy sources [1]. Under the strategic goal of “carbon peak and carbon neutralization”, wind power generation, as a renewable environmentally friendly power source, has been increasing its share in the power resources. However, with the gradual increase in the installed scale of wind power generation, the volatility and randomness of large-scale wind power grid connection due to climatic conditions have aggravated the uncertainty of power system operation [2,3]. At the same time, inherent characteristics, such as irregular fluctuation, of wind power output power also bring great “negative effects” on the power quality of the system, often resulting in voltage fluctuation and flicker, waveform distortion and frequency deviation, etc. [4]. Therefore, it is necessary to study the control of charge and discharge power of hybrid energy storage systems after wind power output prediction to effectively reduce the random fluctuation of wind power output and ensure the reliability and economy of power grid operation.
At present, energy storage devices have been increasingly applied to stabilize the power fluctuation caused by wind power integration. Due to the finite capacity of energy storage equipment and the significant fluctuation of wind power, it is necessary to apply control to the energy storage system by taking into account not only the stabilization effect but also the risk of overcharging, over-discharging, or poor working conditions when fluctuations are stabilized [5,6]. In references [7,8,9], the power initially allocated to the storage element is adjusted twice according to the magnitude of the real-time feedback from the State of Charge (SOC) of the storage element, so that the corresponding overcharge and overdischarge protection can be performed while effectively suppressing the wind farm output power fluctuations. A coordinated control strategy of hybrid energy storage components based on wavelet packet decomposition was proposed in references [10], and the charging and discharging power of the storage battery and supercapacitor is modified according to the controlled power instruction. References [11,12] modified the charging and discharging power of batteries and supercapacitors according to the fuzzy control rules established by the SOC of energy storage elements. The output of the battery energy storage system should not change frequently, and this key point is not taken into account in the above research, which may lead to too many battery charge–discharge state switches and affect the service life of the battery. On the other hand, the fluctuation of wind power output is not strong. In order to smooth the coming fluctuations the first time, reliable and effective wind power prediction is particularly important. Wind power output prediction and the ESS control strategy are combined to achieve advanced control of ESS energy management [13]. In reference [14], five control factors were proposed for the ultra-short-term prediction of wind power output, and on this basis, an ESS control strategy was established, and this particle swarm optimization algorithm was used to optimize the five control factors in real time. In reference [15], an improved cuckoo algorithm was employed to optimize the support vector machine for ultra-short-term prediction of wind power output, and fuzzy control rules were established to restrict the SOC of the battery to reduce the number of charging and discharging and prolong the cycle life. In reference [16], a Kalman filter algorithm was adopted to improve the prediction accuracy of ultra-short-term wind power, and a wind storage system optimal control strategy was proposed by integrating prediction enhancement processing and advanced rolling optimization. In reference [17], a short-term wind-speed forecasting model combining wavelet analysis and support vector machine (SVM) was established to produce an excellent performance in making predictions. However, it was relatively difficult to select a wavelet basis function and determine a decomposition scale in the decomposition process. In reference [18], the grid-connected power was obtained by using a model forecast control algorithm, due to which it is not easy to observe the impact of system parameters on the control performance directly. In reference [19], a wavelet packet was applied to wind power decomposition. It is necessary to select a basis function during decomposition, and the decomposition result varies with the selection of the basis function. In reference [20], a method was proposed to stabilize the wind power output by using an energy storage system based on empirical mode decomposition (EMD). However, the EMD is prone to boundary effects and mode mixing problems, with the maximum charge and discharge power constraints ignored. Only when the wind power output is determined can the above methods meet the requirements of grid connection, which leads to the lack of universal applicability. According to the above research and analysis, it is concluded that the control strategy of the hybrid energy storage system should meet two conditions: First, the output of the wind power through the energy storage system should meet the requirements of the grid connection; second, the charge and discharge power and SOC of the energy storage equipment must be within a safe range.
In summary, this paper proposes a hierarchical control strategy for a hybrid energy storage system based on improved GA-SVR wind power prediction for the characteristics of irregular fluctuation of wind power output and the problem of charging and discharging control of the energy storage system. First of all, the historical wind power output data of a certain day are selected as the training data of the prediction model, and the results predicted by the improved GA-SVR model are taken as the wind power output. Subsequently, EEMD decomposition and Hilbert transform are used to distribute high-frequency and low-frequency power to supercapacitors and batteries, respectively, and the control is further adjusted by limiting control and coordinated control. Finally, the simulation test of the proposed control strategy is carried out, and the charge state curve and charge–discharge power curve of each energy storage device before and after control are compared to verify the effect of the proposed control strategy.

2. Short-Term Forecasting of Wind Power Based on Improved GA-SVR

2.1. Support Vector Regression

Support Vector Regression (SVR) can be expressed as (xi,yi), and xi∈R is the input index vector and yi∈R is the output index vector. y can be any real number.
In the regression, the linear problem is solved with the help of ε. In order to solve the original problem of ε SVR, the relaxation variable ξi, ξ i * and penalty function C are introduced, so the convex quadratic programming is:
min ω , b 1 2 | | ω | | 2 + C i = 1 n ( ξ i + ξ i * ) s . t . { ( ω x i ) + b ε + ξ i + y i y i ( ε + ξ i * ) ( ω x i ) + b
where i∈{1,2,3,…,n}; the relaxation variable is ξi ≥ 0 and ξ i * ≥ 0. To solve the dual problem, the Lagrange function is introduced:
L ( ω , b , ξ * , α * , η * ) = 1 2 | | ω | | 2 + C i = 1 n ( ξ i + ξ i * ) i = 1 n ( η i ξ i + η i * ξ i * ) i = 1 n α i ( ε + ξ i + y i ( ( ω x i ) + b ) ) i = 1 n α i * ( ε + ξ i * y i + ( ω x i ) + b )
where α* and η* are Lagrange multiplier vectors. If Lagrangian vectors are adopted, the dual form of the optimization problem is:
min α * R 1 2 i , j = 1 n ( α i * α i ) ( α j * α j ) ( x i x j ) + ε i = 1 n ( α i * + α i ) i = 1 n y i ( α i * α i ) s . t . i = 1 n ( α i α i * ) = 0
where 0 ≤ α* iC and i∈{1,2,3,…,n}. After calculation, it is obtained that α* = (α1, α 1 * ,…,αn, α n * )T, and αj and α k * of the α* component in the open interval (0,C) are selected.
Finally, the regression function is obtained:
y = i = 1 n ( α i * α i ) ( x i x ) + b *
In this work, the Gaussian radial basis kernel function is selected when seeking the local performance optimization, and the kernel function is as follows in Equation (5):
K ( x , x i ) = exp ( | x x i | 2 σ 2 )

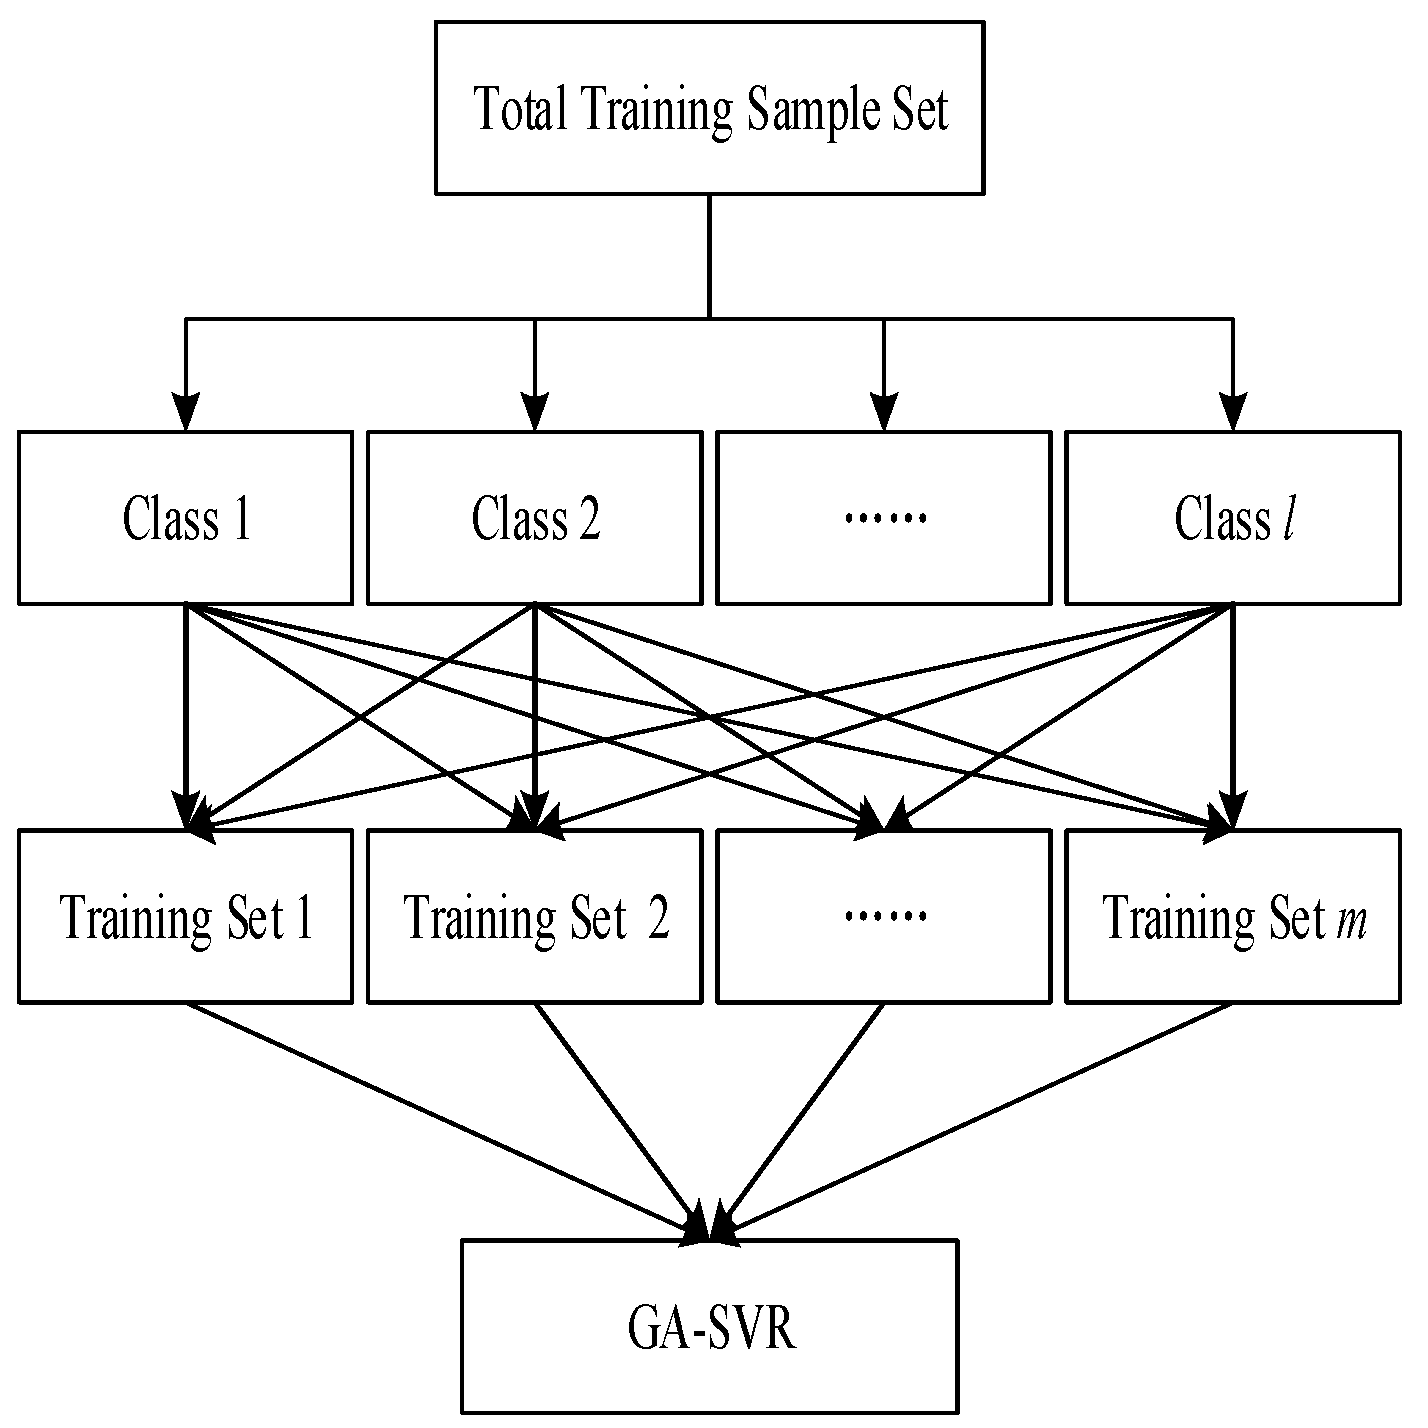
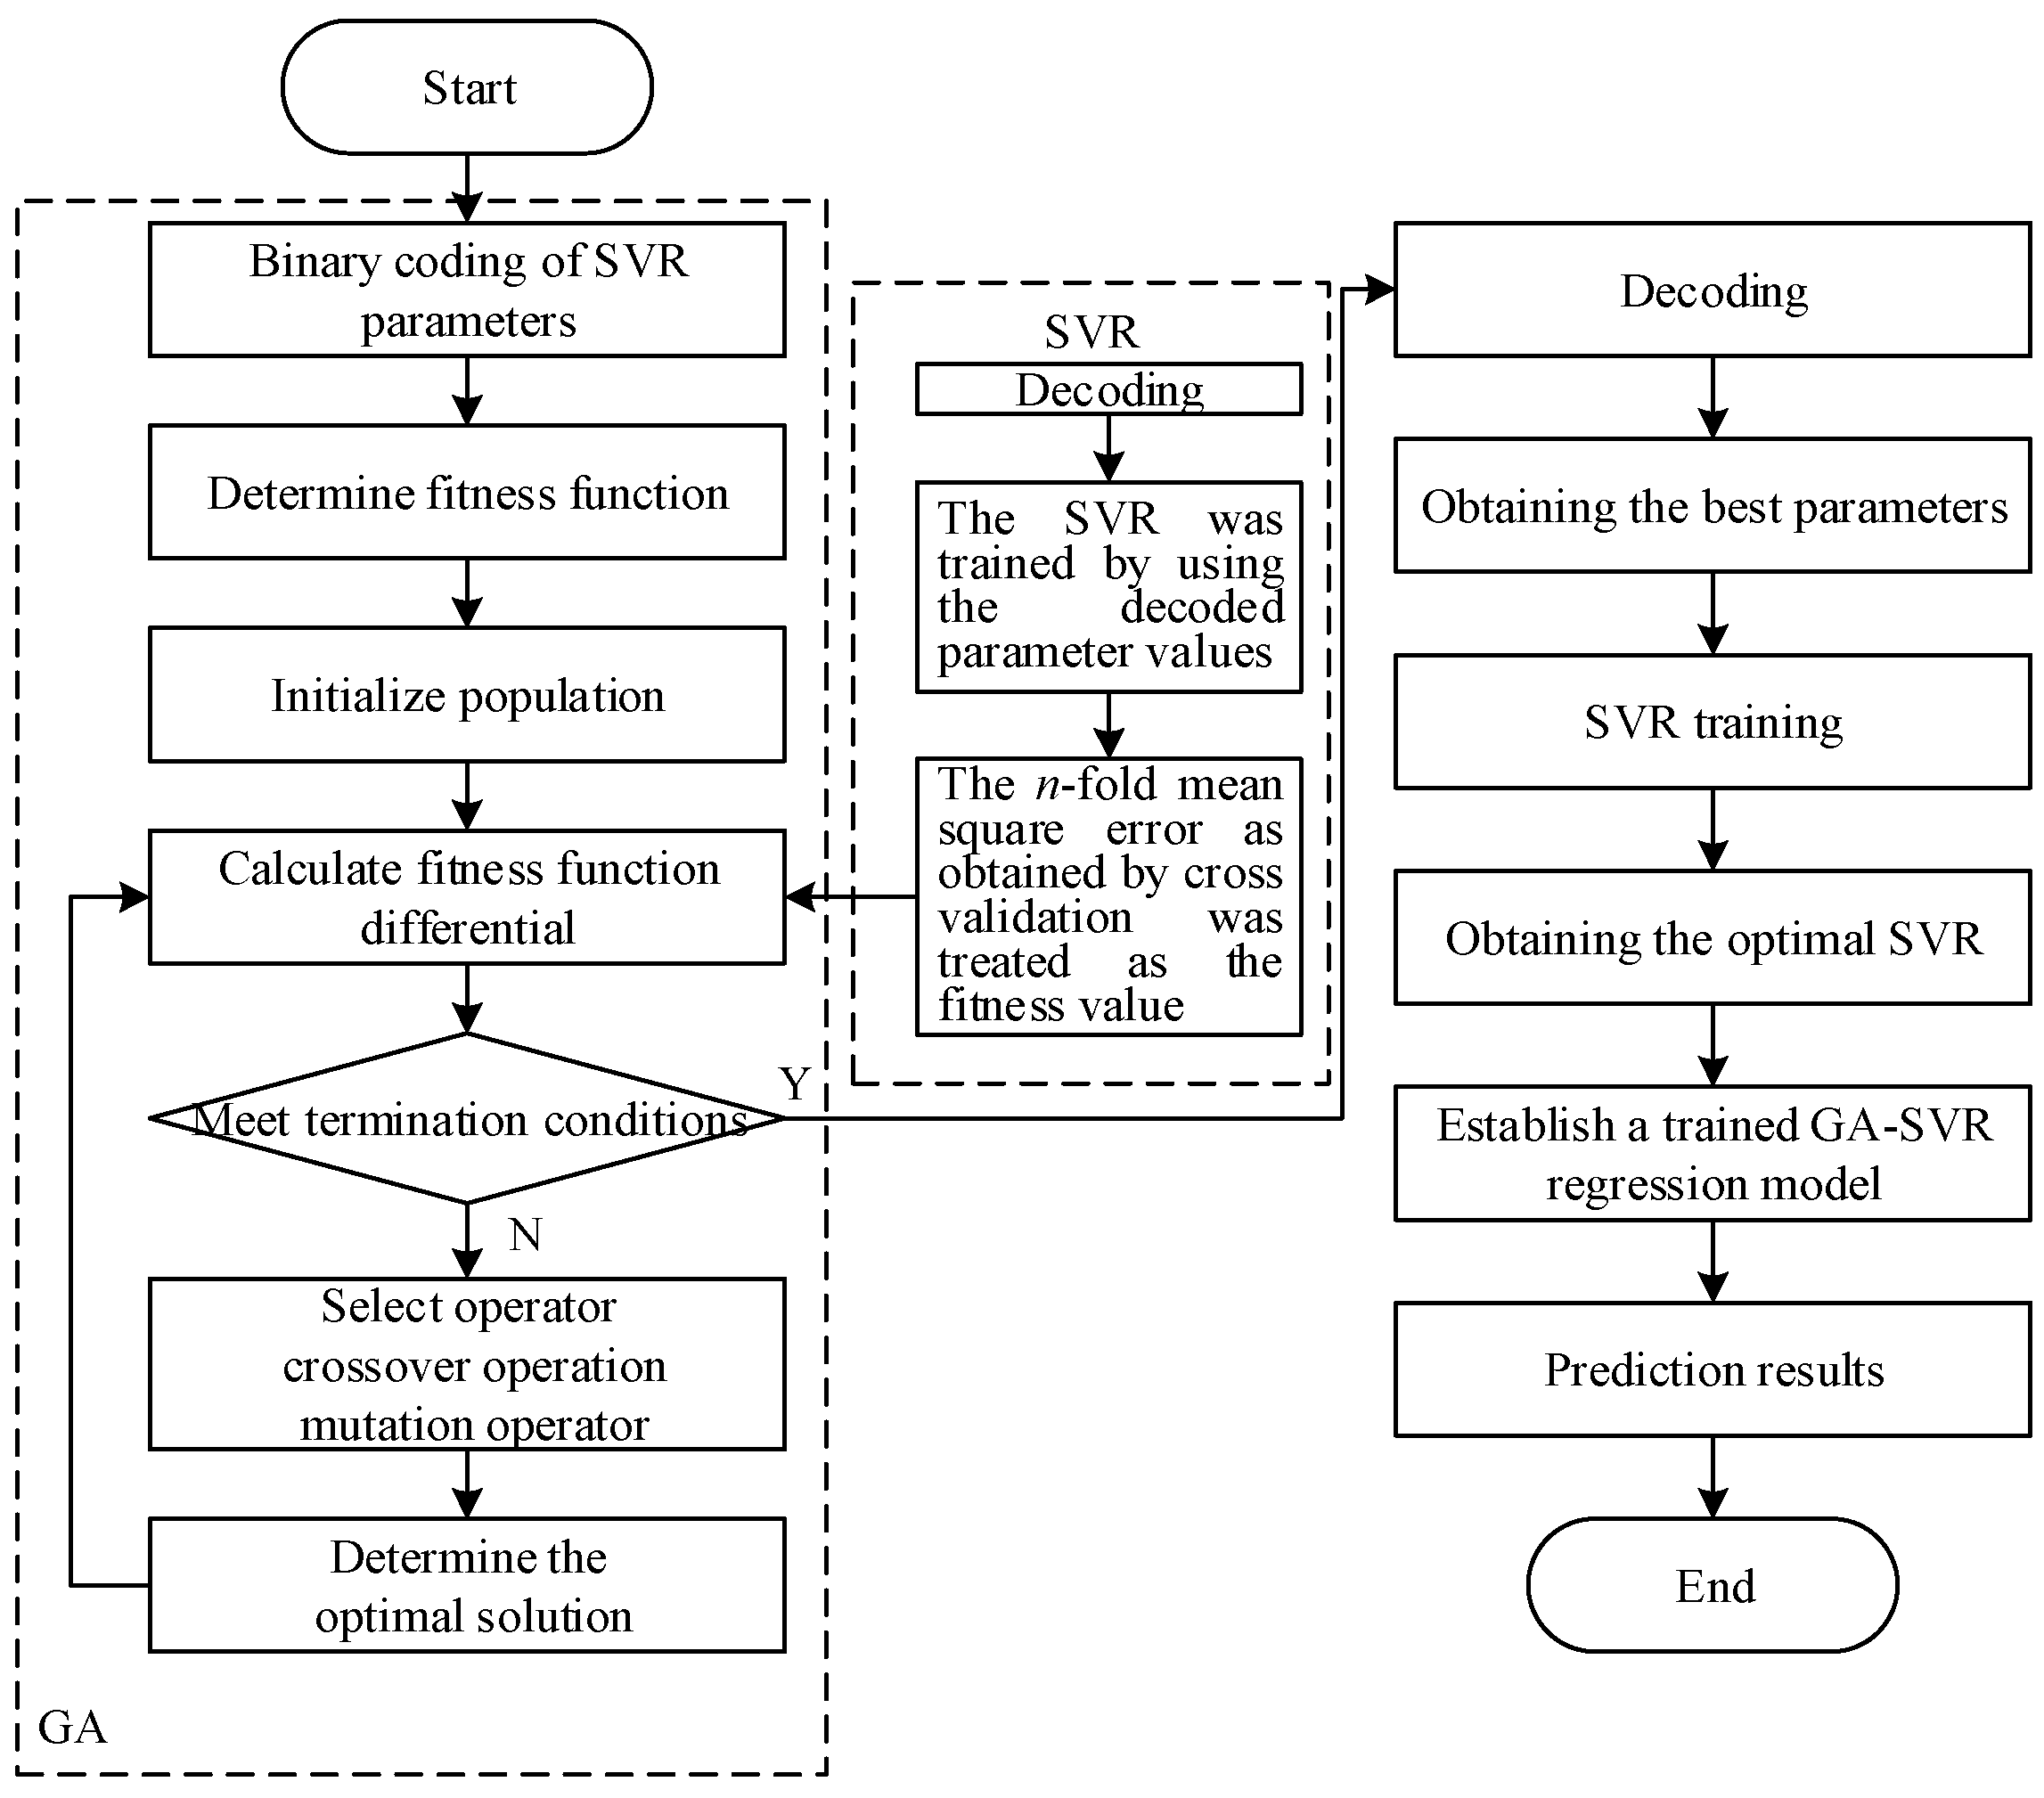
2.2. Parameter Optimization Method Based on Improved Genetic Algorithm

In the regression forecast assisted by the SVR model, the predicted results were closely associated with the penalty factor parameter C and the kernel function parameter σ. In the present study, the genetic algorithm was applied to optimize these two critical parameters in the regression machine. Cross-validation was conducted to deal with the selection of models and the evaluation of their quality in the context of SVR modeling. On the basis of ensuring accuracy, the mean square error of the model as established with different parameters was obtained in this study by performing 5-fold cross-validation and combining the program running time. Furthermore, it was treated as the criterion for evaluating the quality of the model constructed by using these selected parameters. The optimal parameter was obtained by finding the minimum mean square error through cross-validation. The process of implementing GA-SVR is detailed in Figure 1.
Under the different topographical and geomorphic conditions of a wind farm, the change in wind speed and direction shows a complex nonlinear relationship with various influencing factors, which is attributable to the effect of various meteorological factors such as temperature, air pressure, and humidity. Therefore, wind speed constitutes unstable data. For the purpose of the SVR model forecast, it is necessary to reduce the effect that the instability of the original data has on the results of the model forecast by homogenizing the original data.
As a form of an optimization algorithm, the genetic algorithm (GA) relies on the evolution mechanism that the fittest will survive in nature. Chromosomes represent an important carrier of biological genetics. According to the genetic algorithm, a series of sequences are used to simulate chromosomes for the optimal solution. In the present study, the genetic algorithm was adopted to optimize the two key parameters in the regression machine. When the SVR model was used for the regression forecast, the predicted results were closely related to a penalty factor parameter C and a kernel function parameter σ. Moreover, the genetic algorithm was used in this study to optimize these two key parameters in the regression machine.
The kernel function in the SVR prediction model uses the Gaussian radial basis kernel function. The calculation speed is very slow when solving the dual problem, so an improved method regarding the training time is proposed for the traditional GA optimization algorithm. Specifically, the whole training set of the prediction model is divided into l categories, and each class is divided equally into m parts, then m sub-training sets constitute the whole training set of the prediction model, as shown in Figure 2. The improved GA algorithm is optimized by the following steps:
(1)
In the first training model, training set 1 is used as the GA-SVR training sample set.
(2)
Training set 2 is used as a cross-validation set to calculate fitness.
(3)
In the second training model, training set 2 is taken as the new training sample set.
(4)
Training set 3 is used as a cross-validation set to calculate fitness.
(5)
In the mth training model, training set m is taken as the training sample set, and training set 1 is used as the cross-validation set to calculate the adaptive set.
Figure 2. Flowchart of improved GA-SVR.
Energies 16 02079 g002

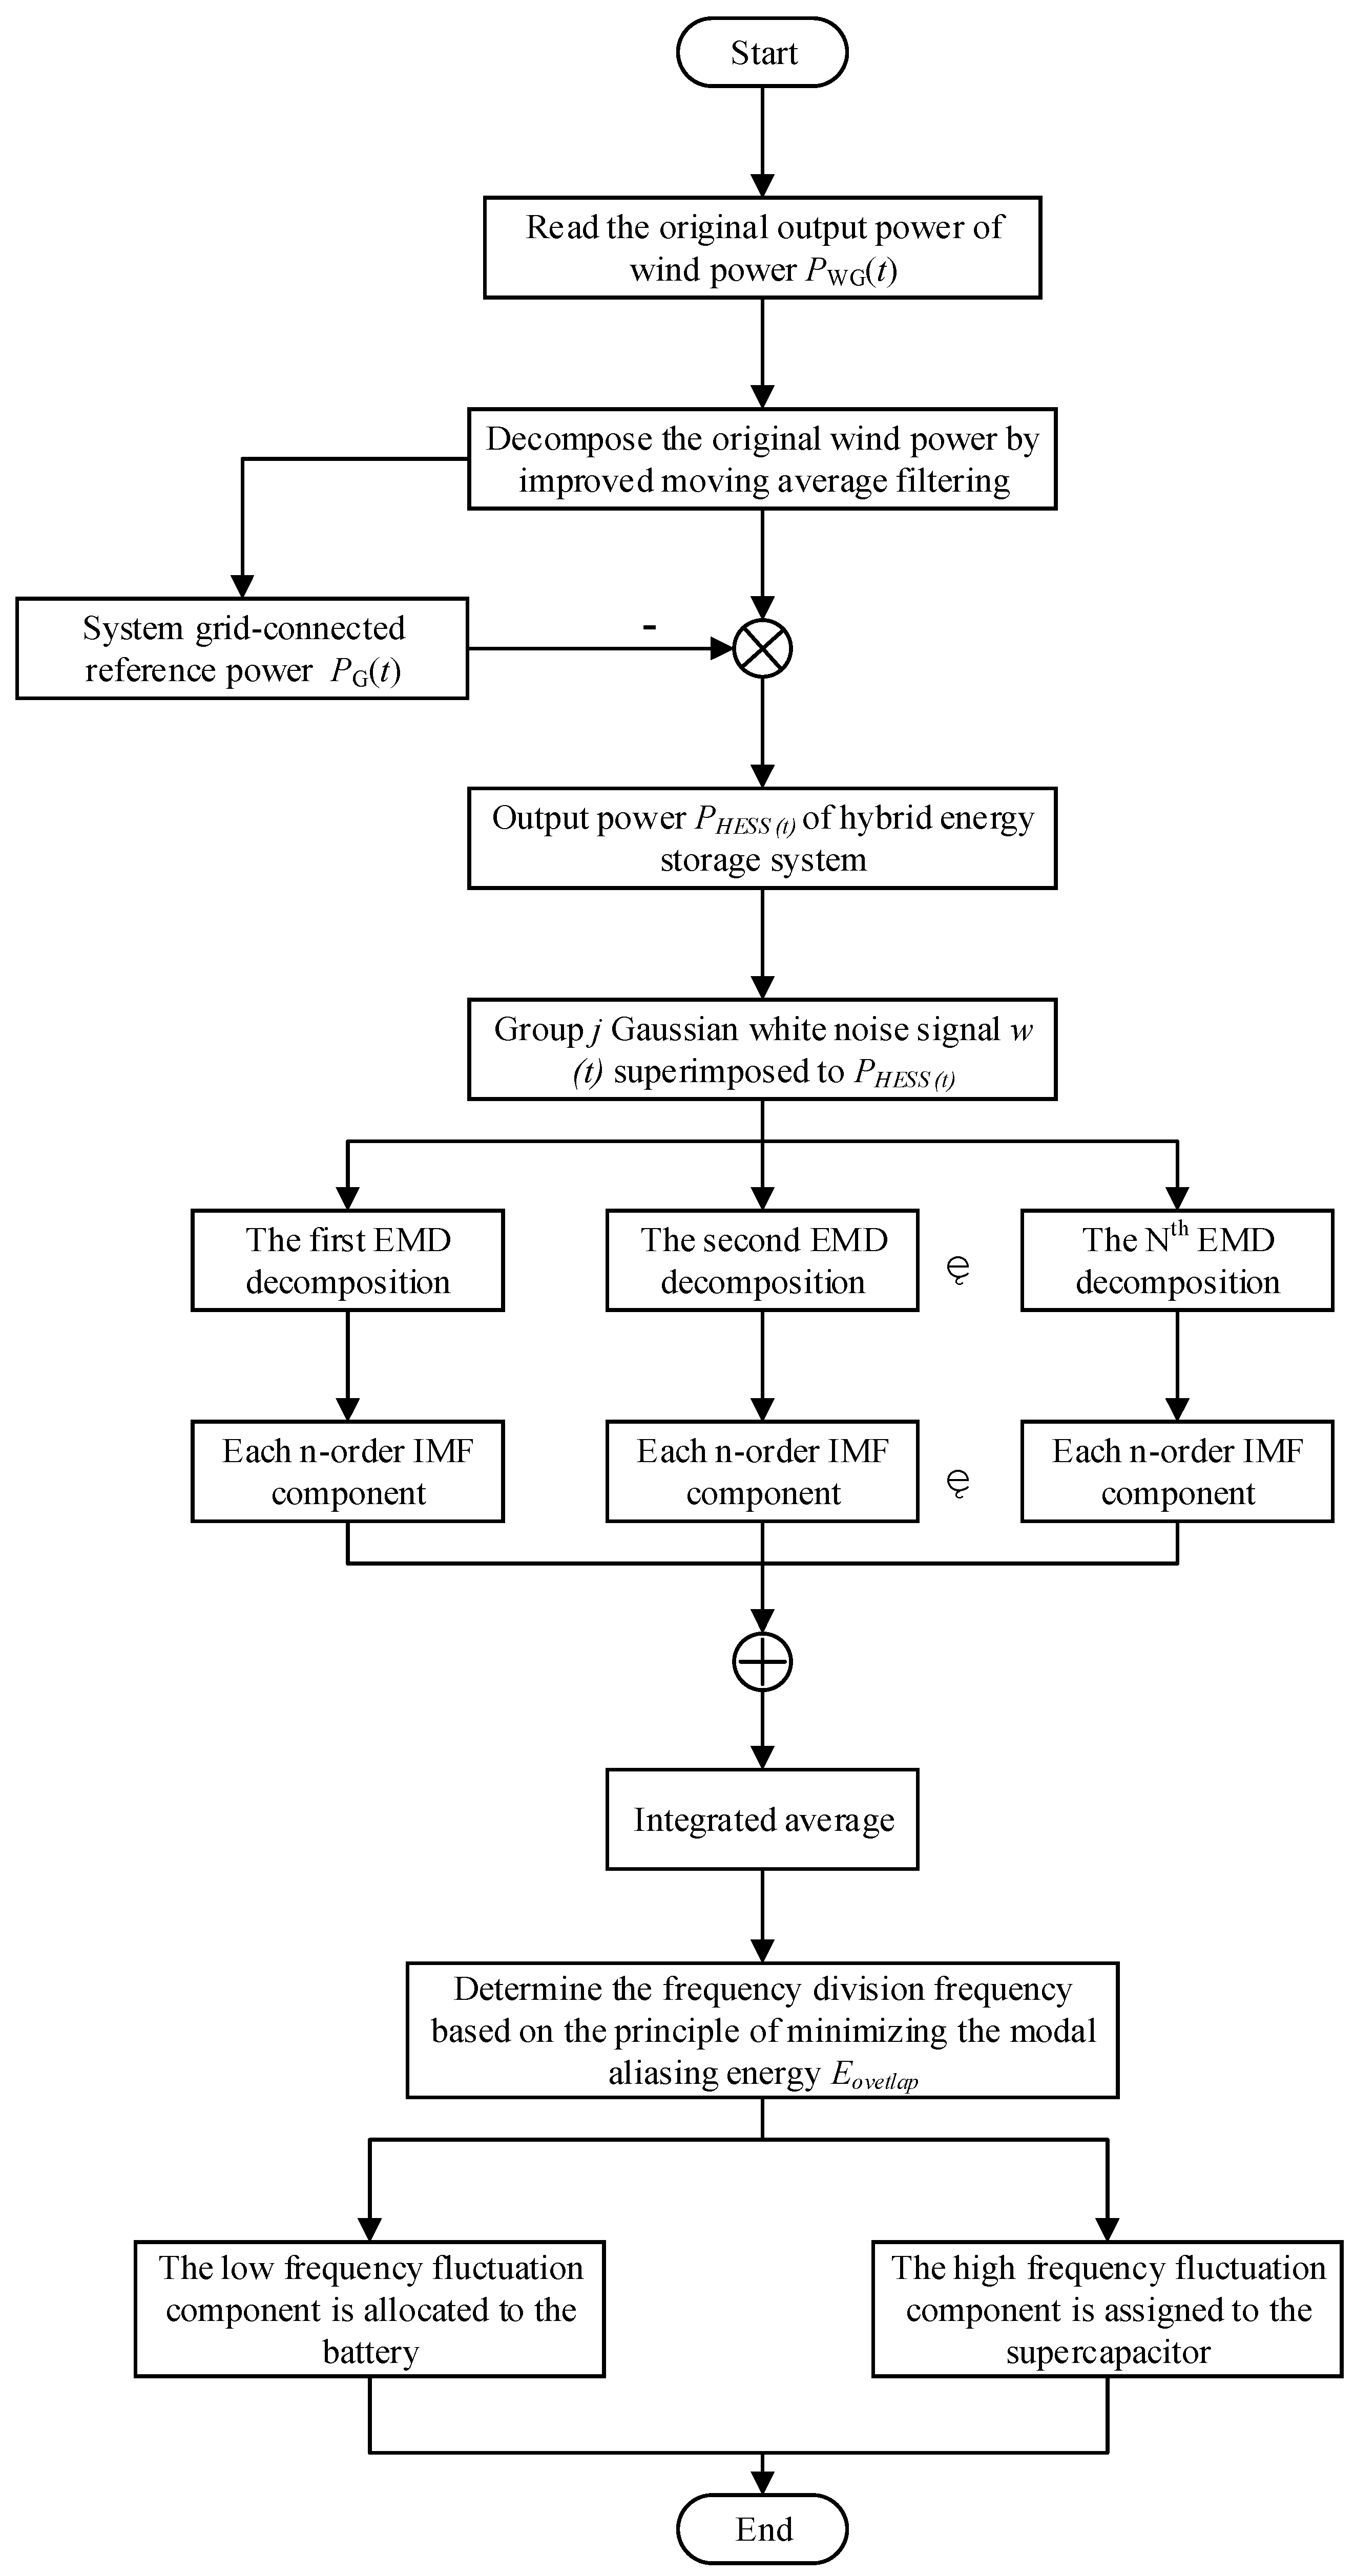
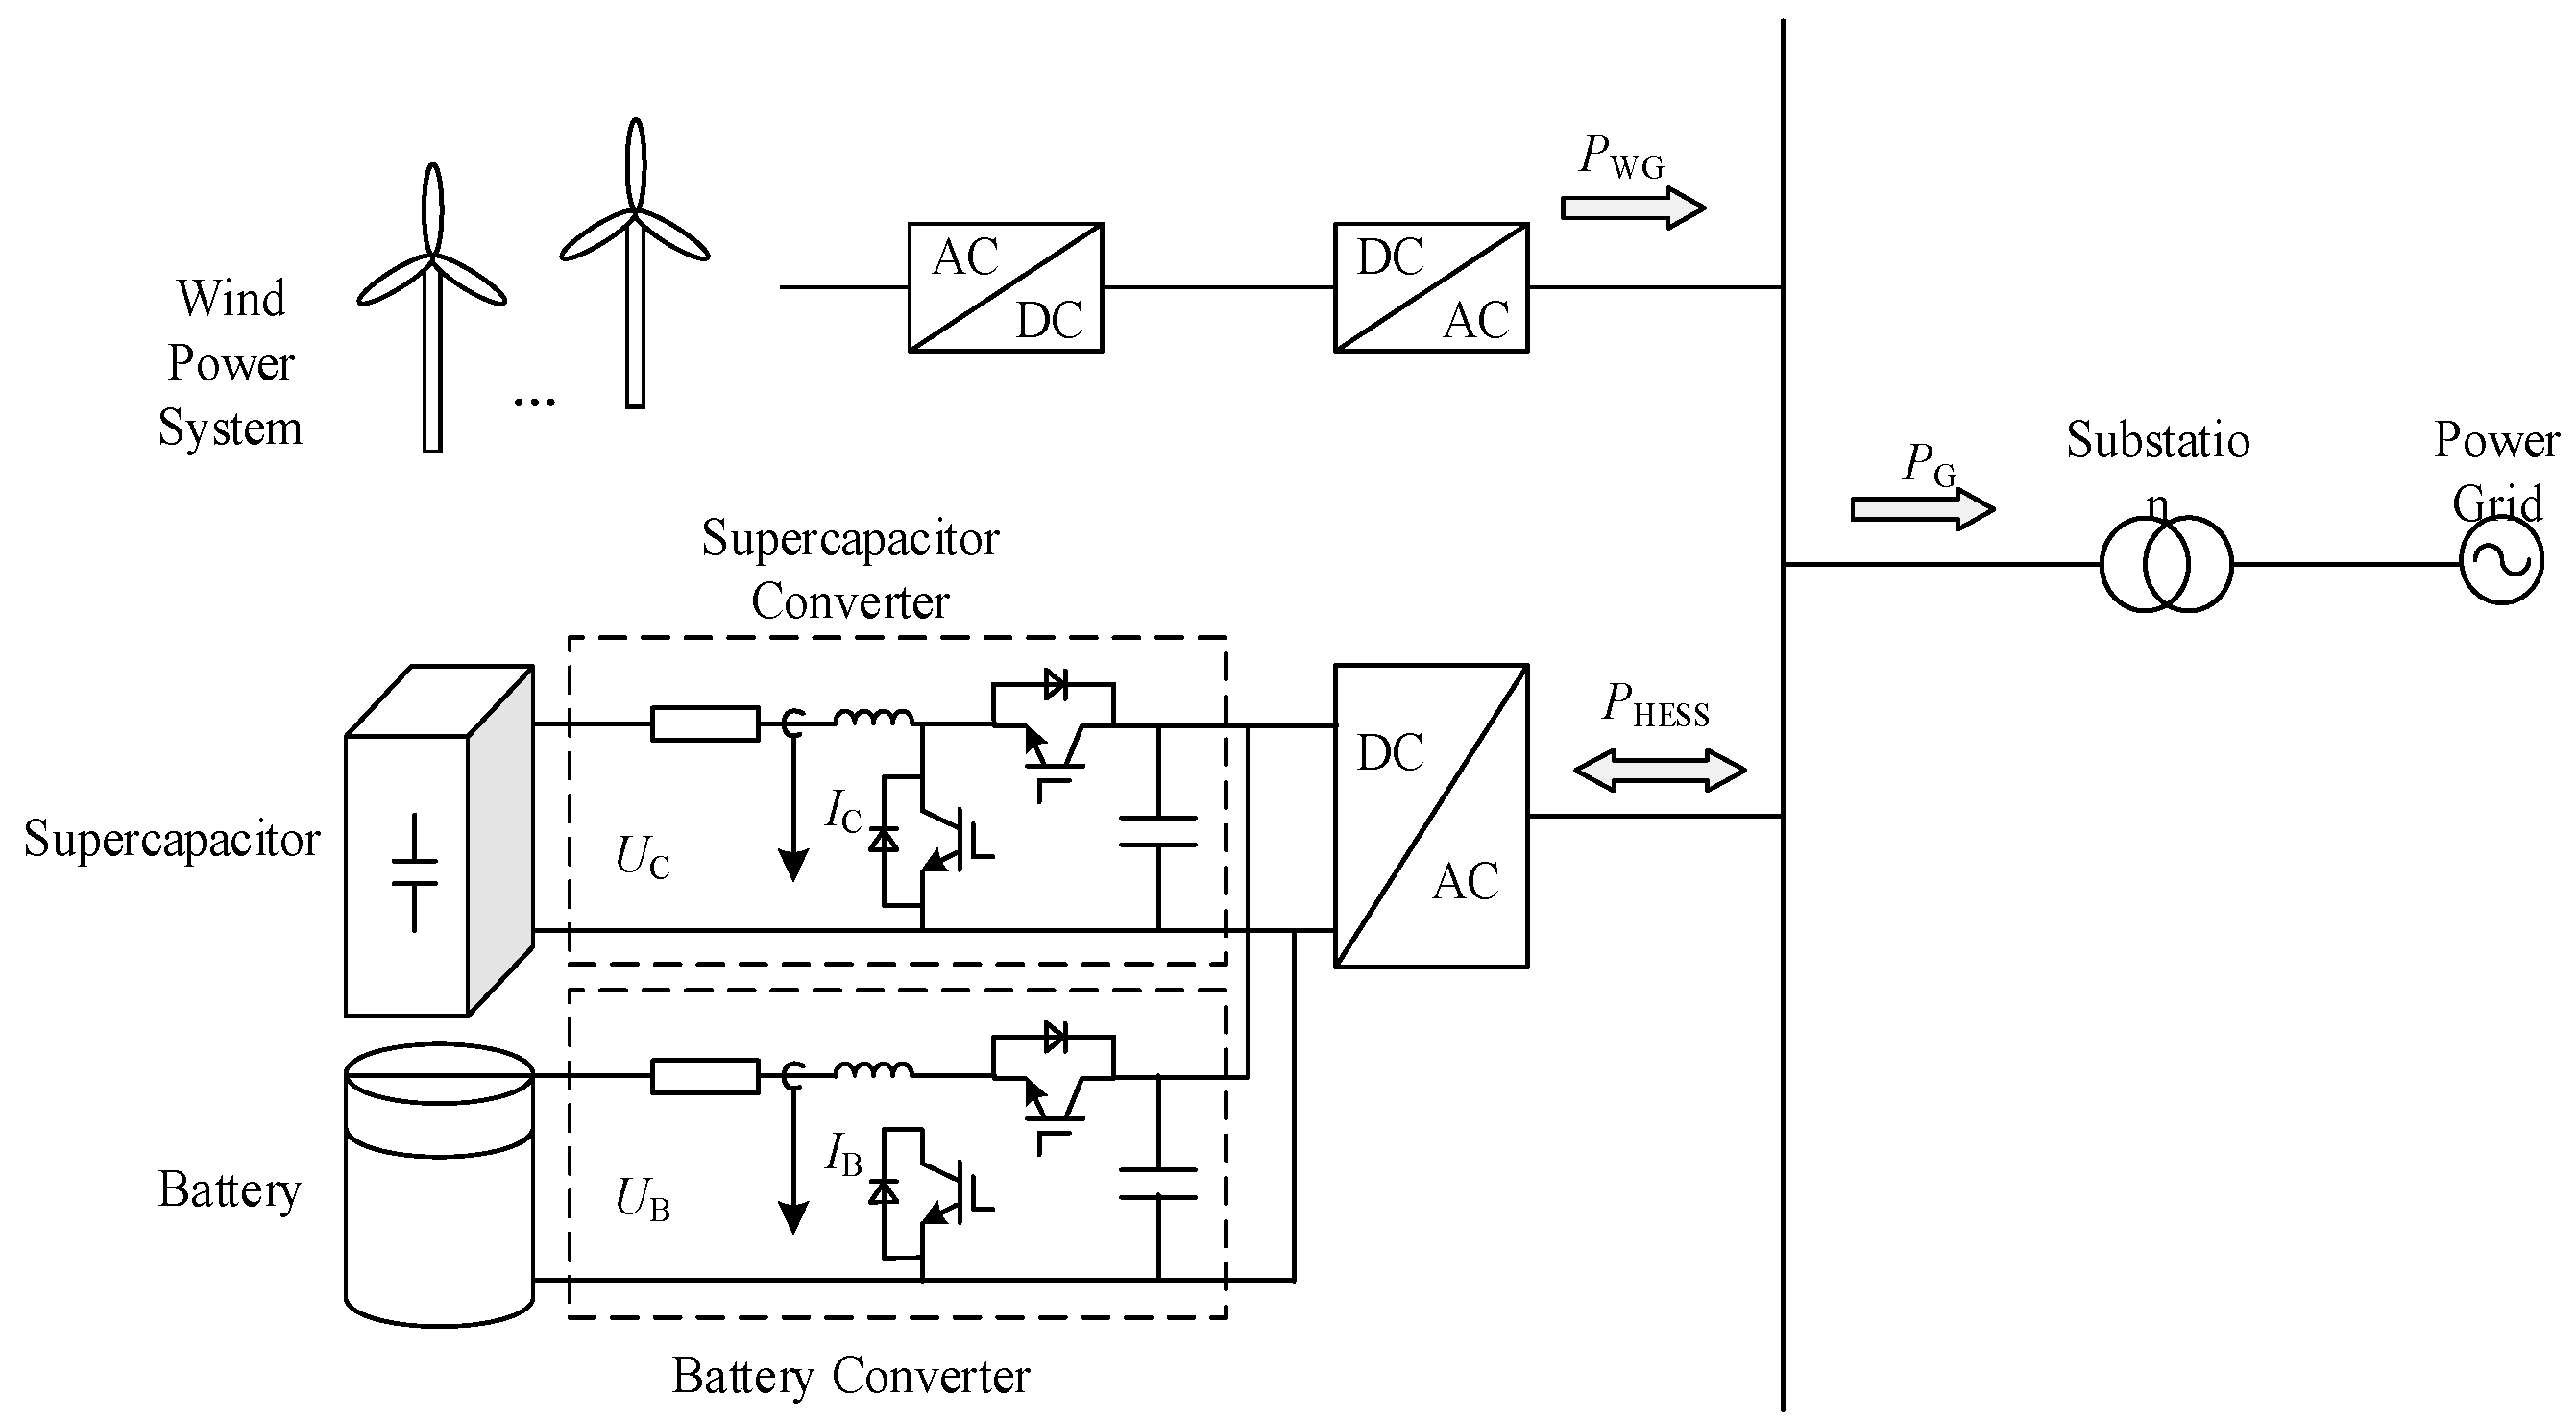
3. Hybrid Energy Storage Capacity Allocation Strategy

The improved hybrid energy storage power allocation strategy combining moving average filtering and EEMD decomposition is shown in Appendix A. The grid-connected reference power is obtained after the original wind power is filtered by the improved moving average, and the reference power of the hybrid energy storage system is obtained after the difference between the two. Then it is decomposed by EEMD, and the frequency division frequency is determined by the principle of minimum modal aliasing energy Eoverlap after the Hilbert transform, and the high- and low-frequency fluctuation components are allocated preliminarily, which lays a solid foundation for follow-up research.

4. Hierarchical Control Strategy for Hybrid Energy Storage System

The structure block diagram of the wind-storage combined power generation system is composed of a wind power generation system, a hybrid energy storage system, an Energy Management System (EMS), and a power grid, as shown in Figure 3. Among them, the battery and supercapacitor of the hybrid energy storage system realize the internal power conversion and energy interaction with the power grid through the converter in EMS, wherein PWG is the original output of the wind turbine, PHESS is the HESS charge and discharge power, and PG is the grid-connected reference power.

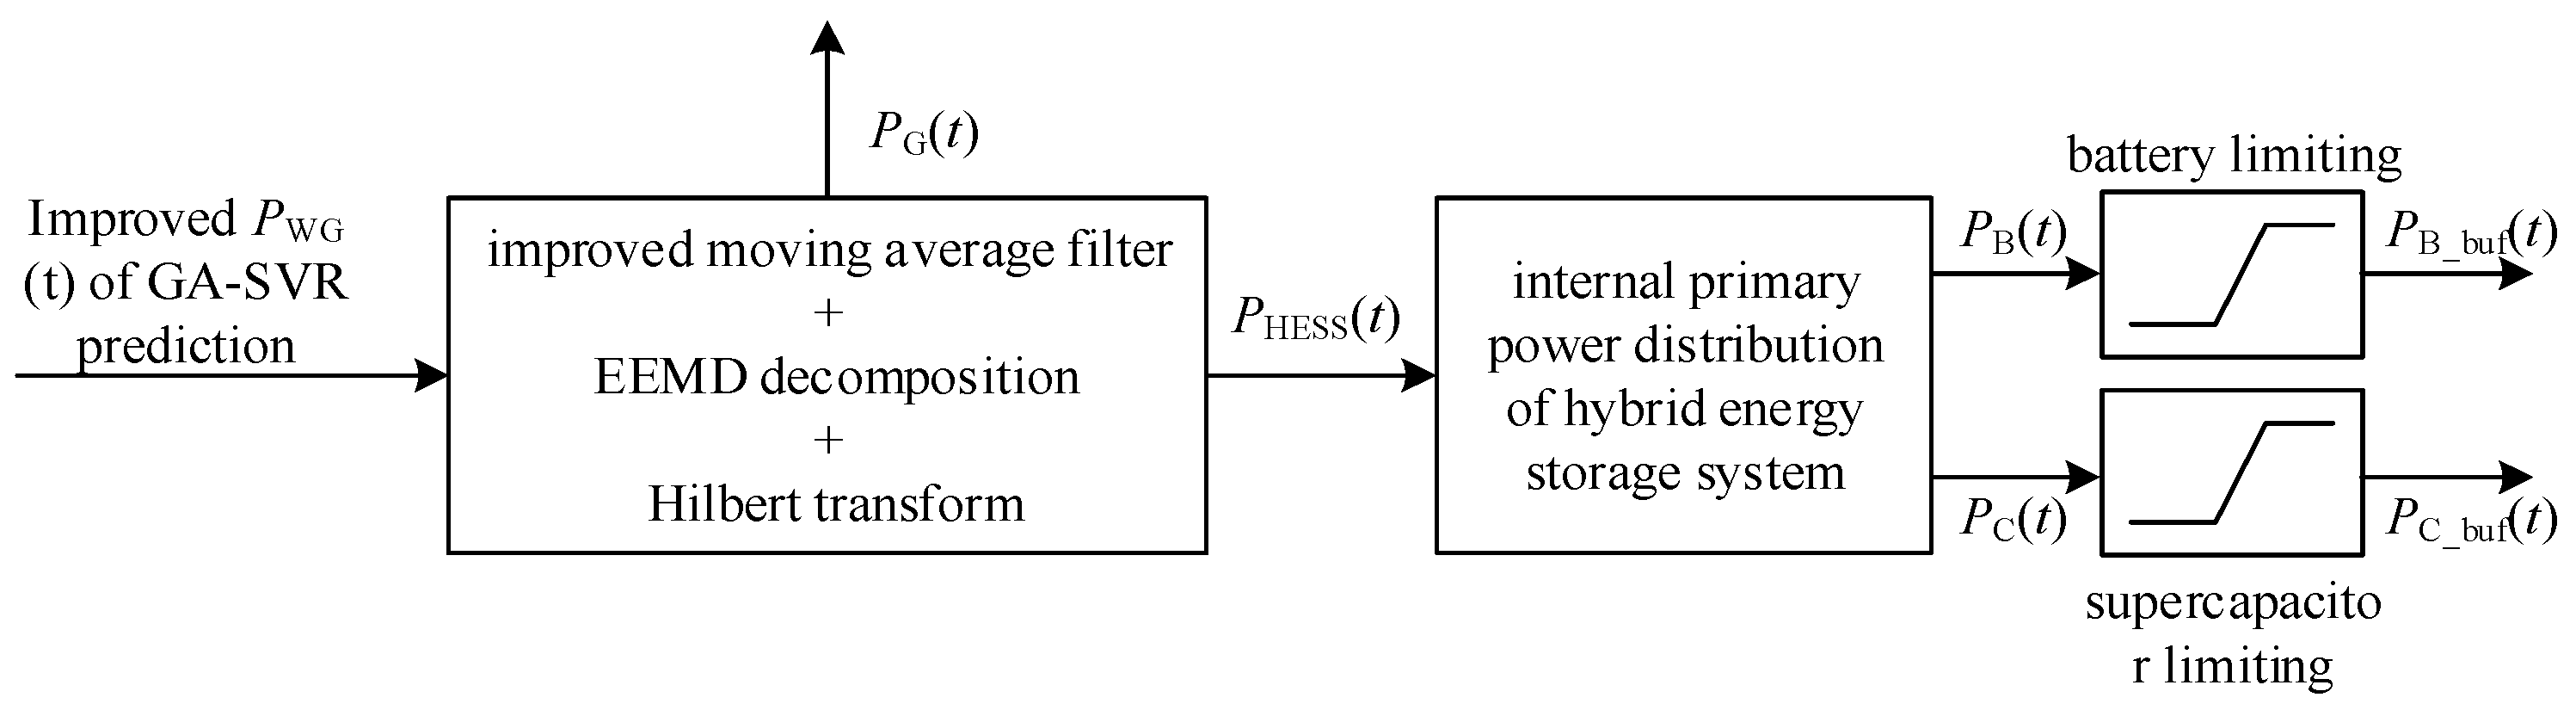
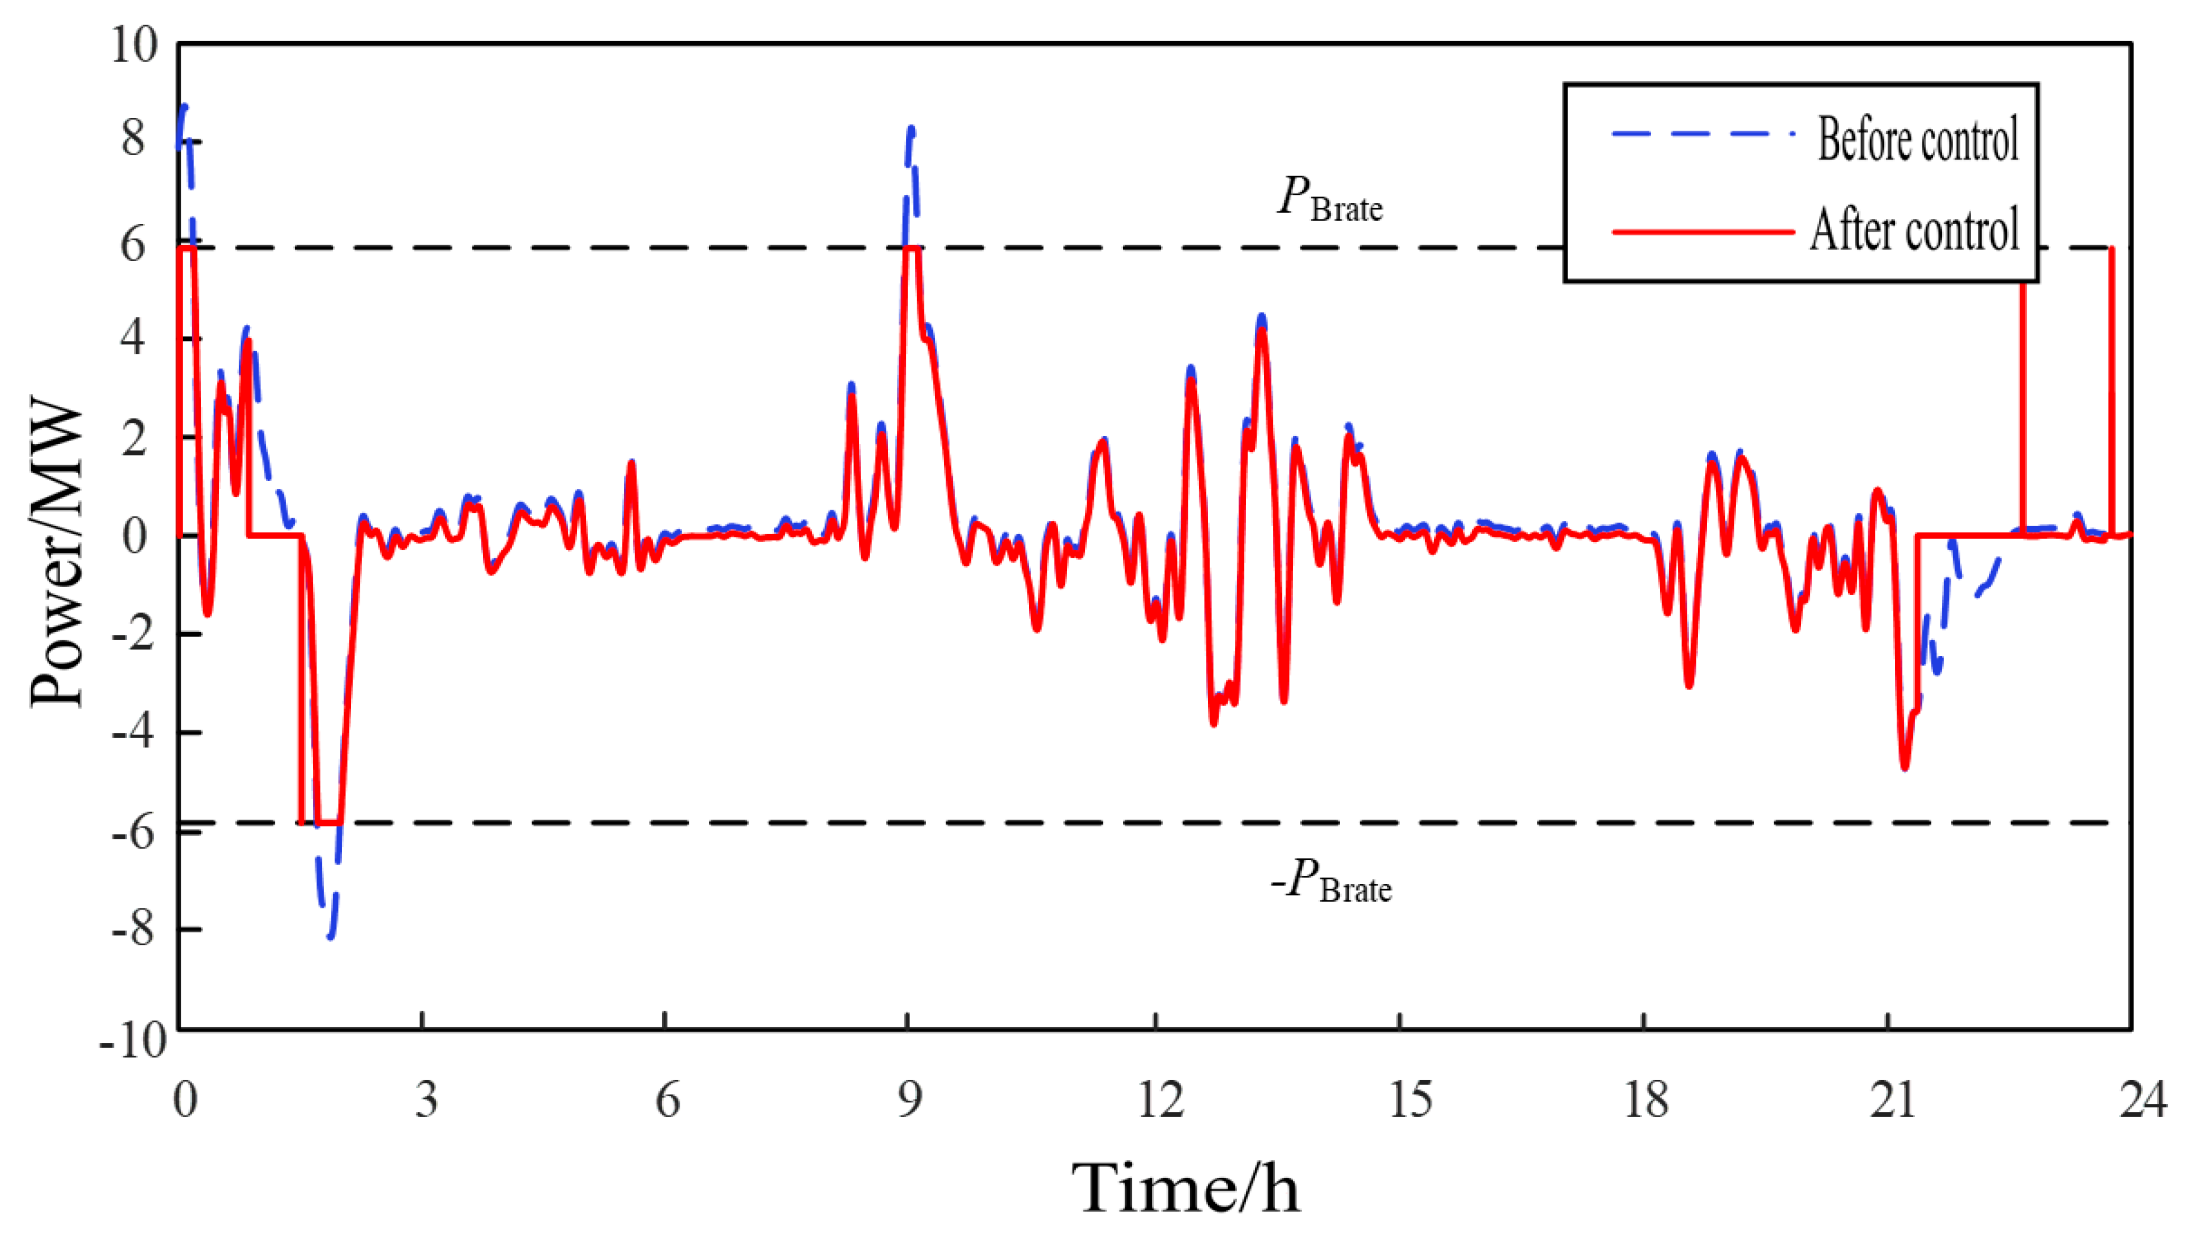
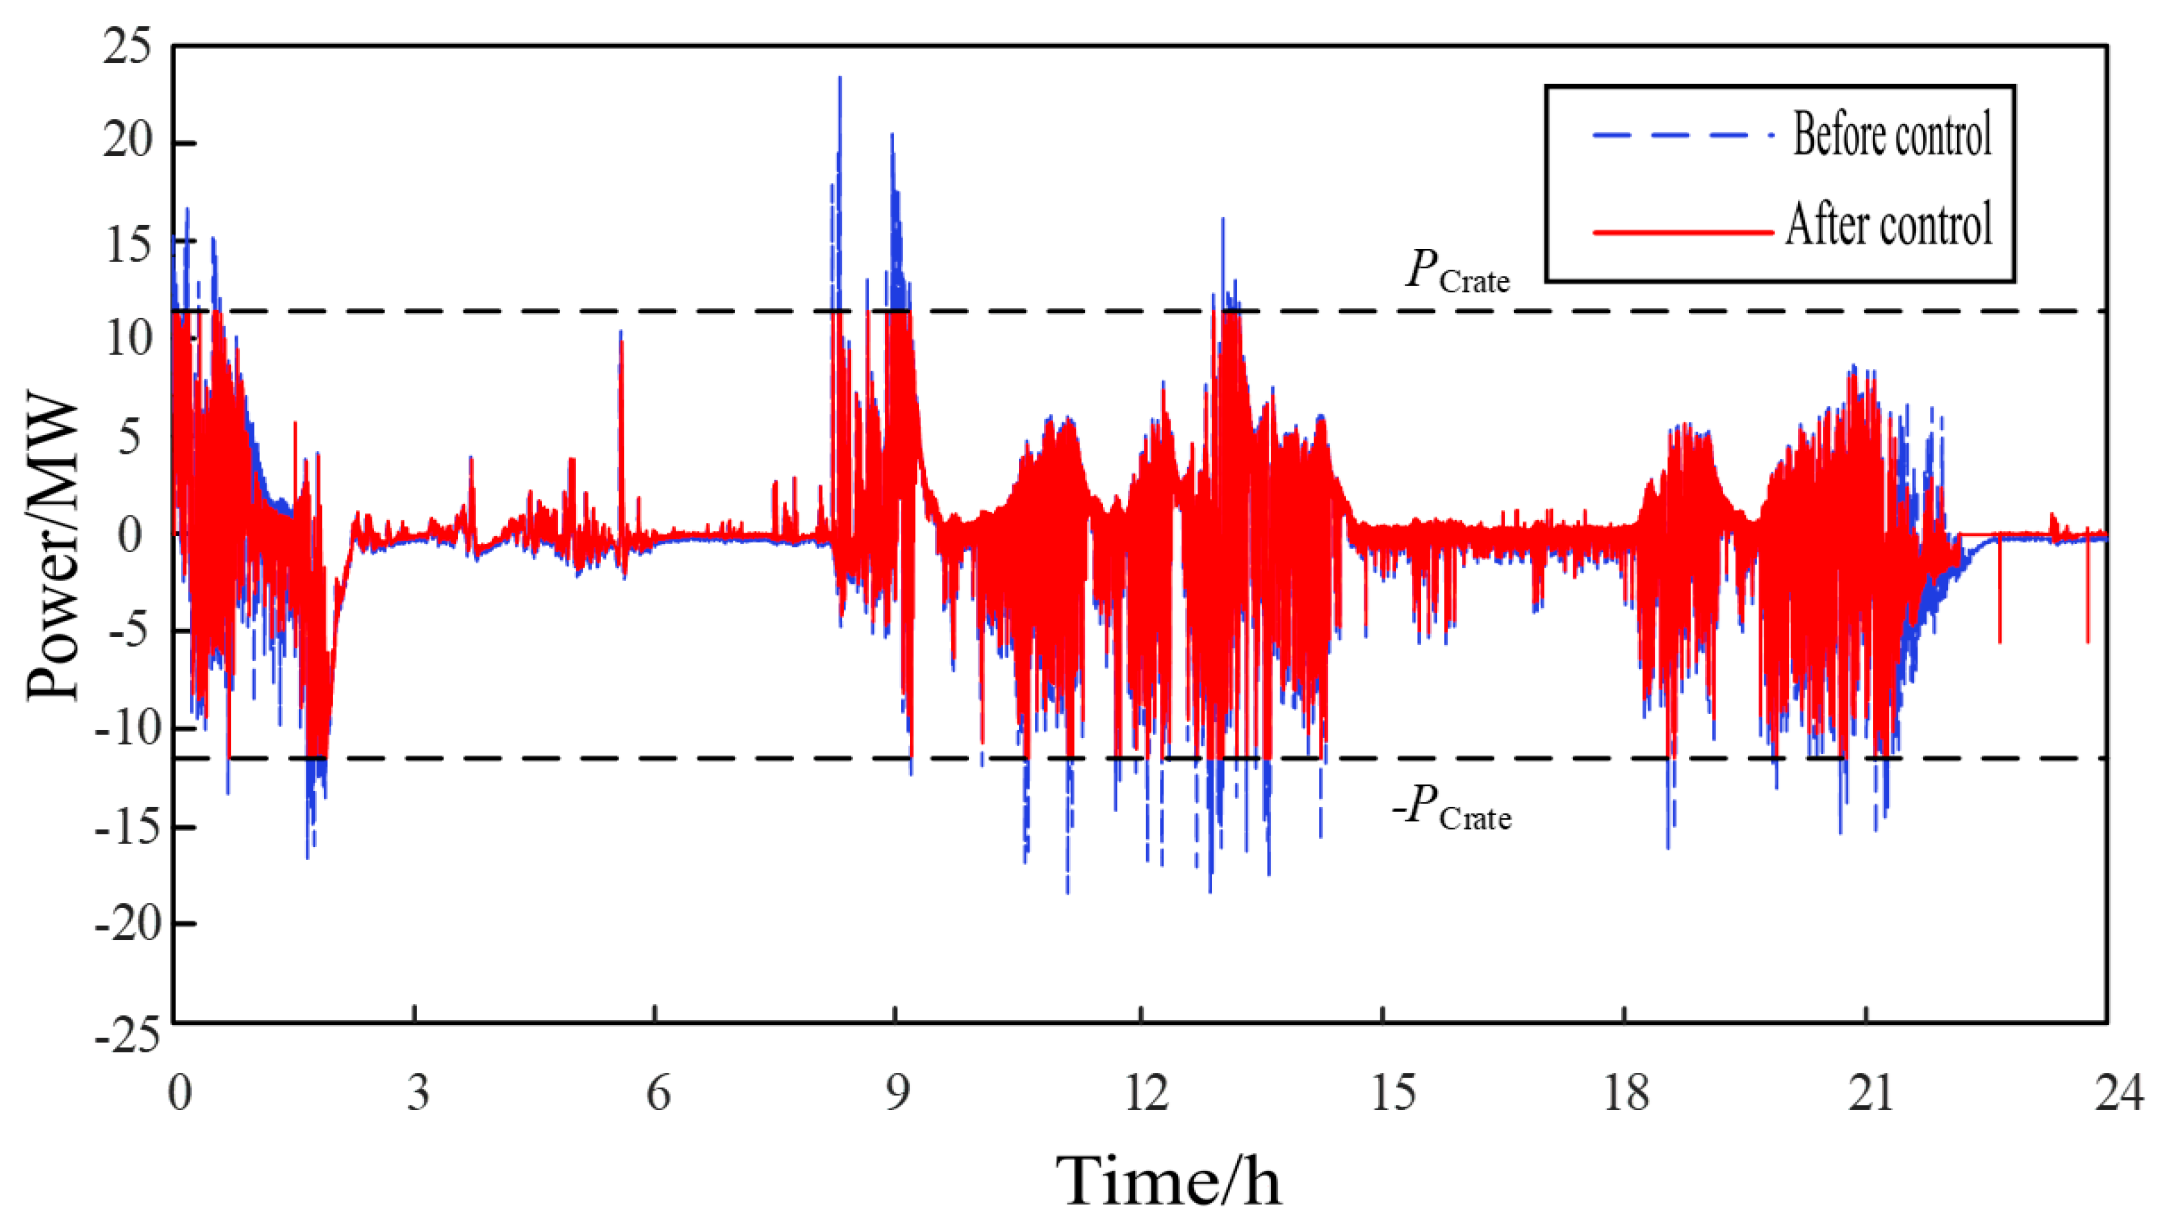
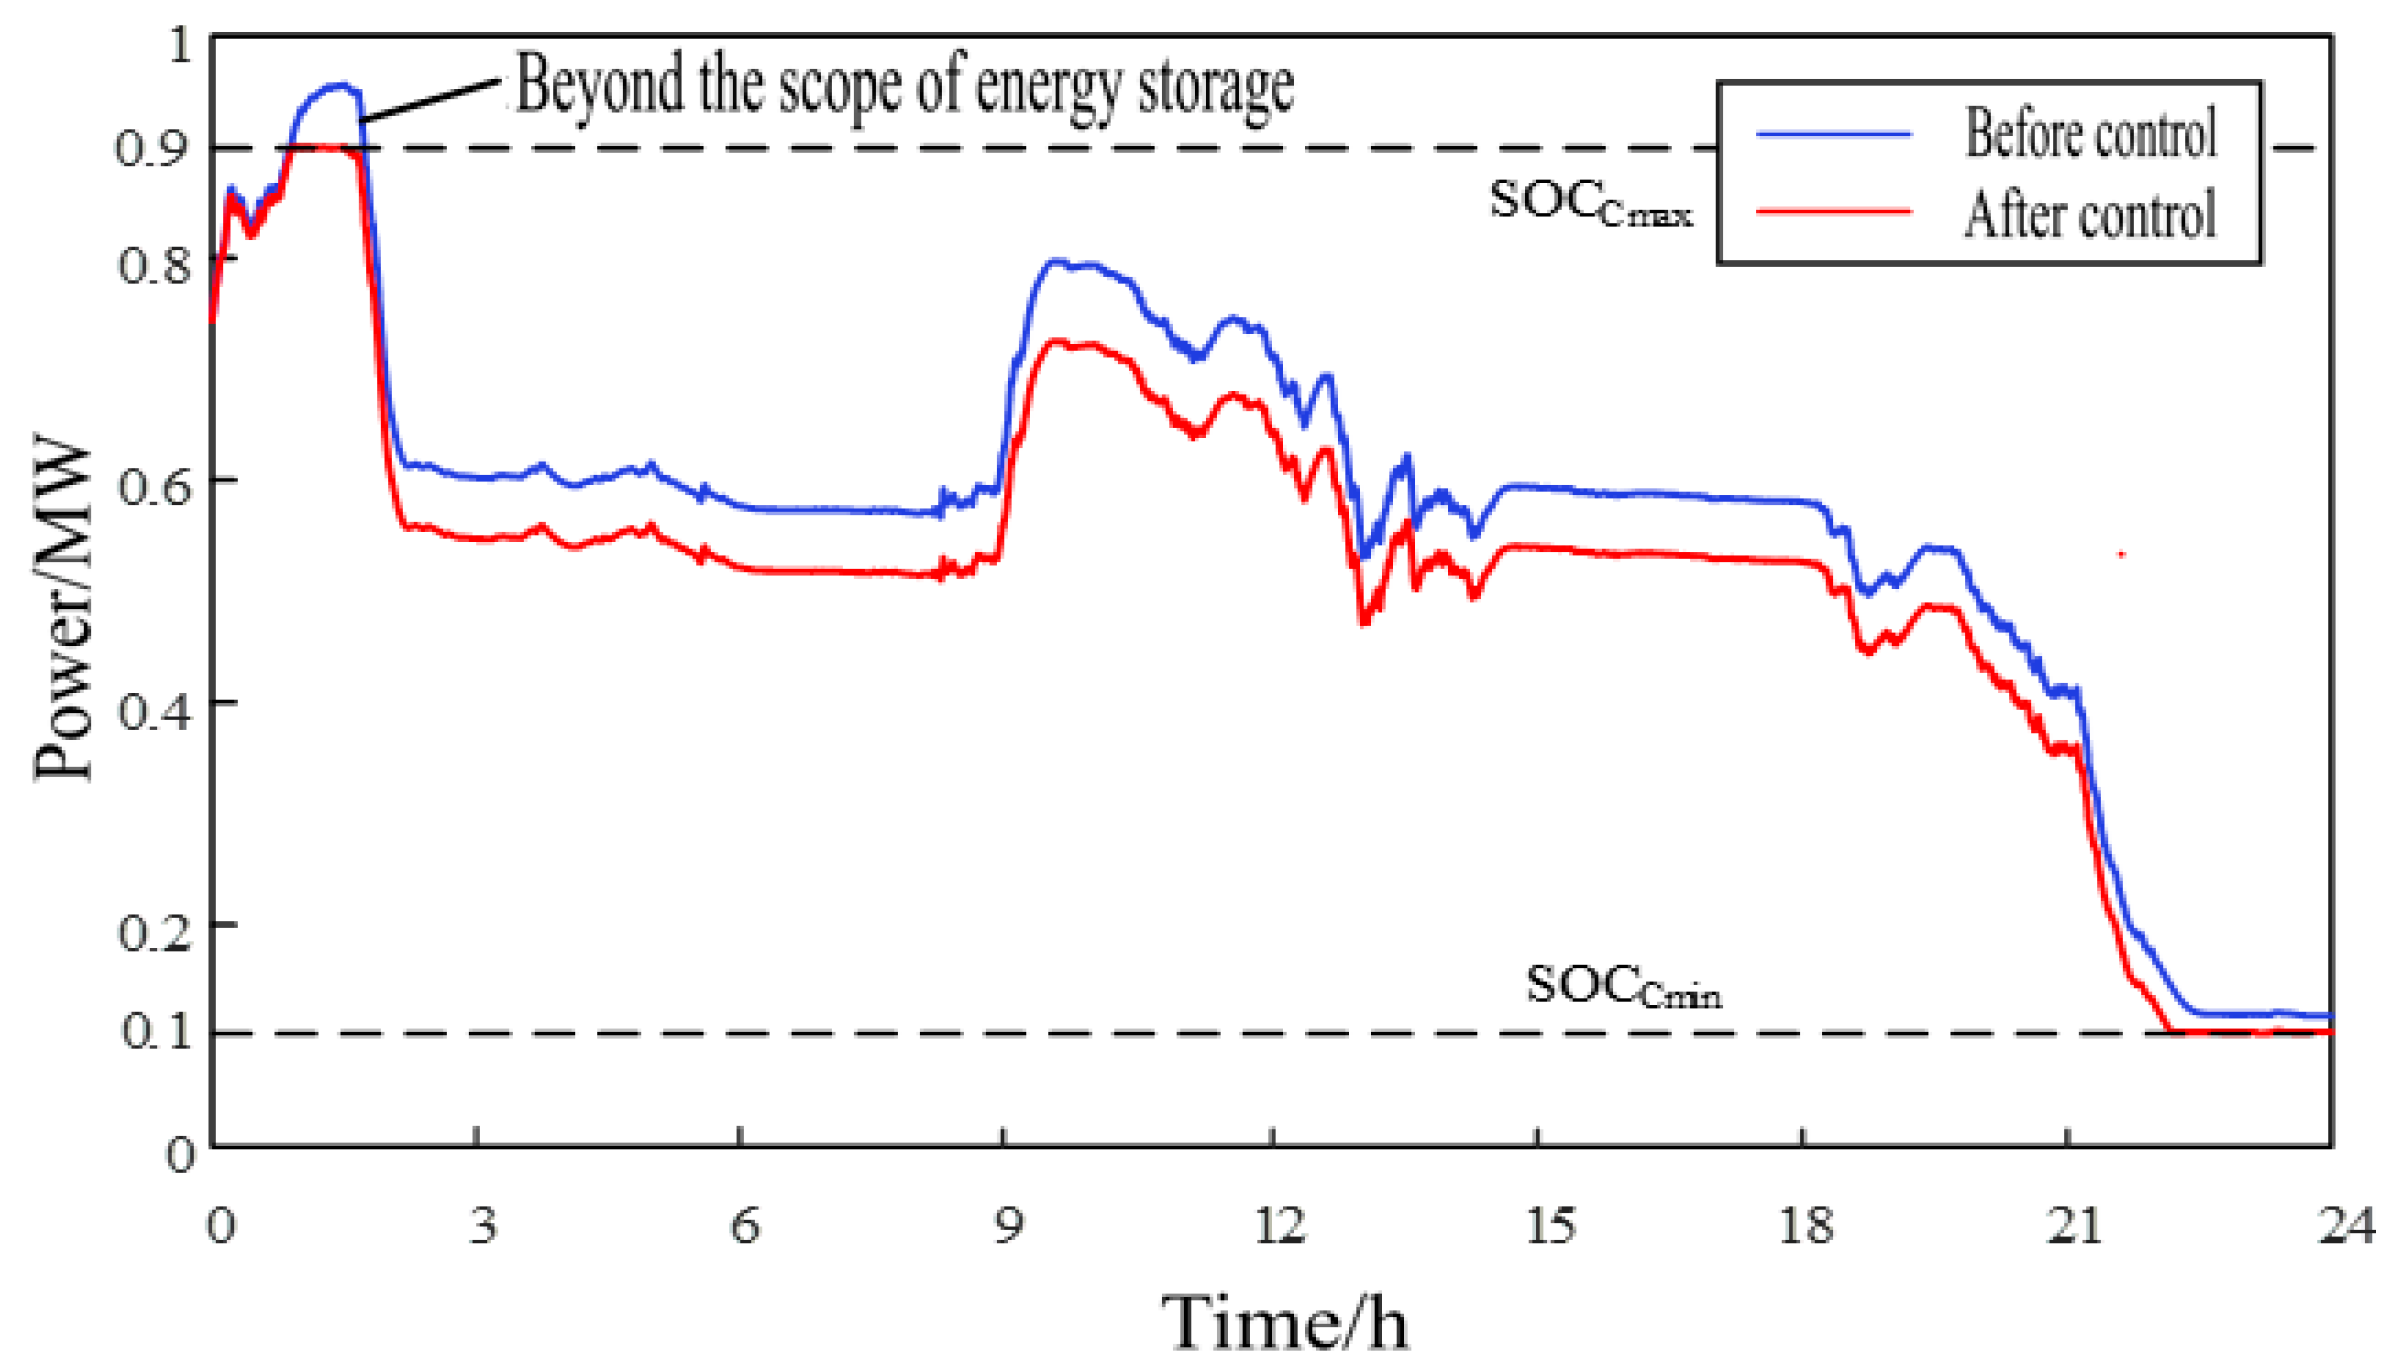
4.1. Upper Limiting Control of Hybrid Energy Storage System

The upper limiting control primarily includes the EEMD decomposition module, the primary power distribution module, and the limiting module. The result predicted by the improved GA-SVR model at t~t + T time is taken as the wind power output, and the PHESS(t) is obtained after the improved moving average filter. The appropriate frequency division frequency is determined by the time spectrum obtained by EEMD decomposition and Hilbert transform, and the high- and low-frequency components are reconstructed to determine the initial reference power of the battery and supercapacitor. The structure diagram of the upper limiting control is shown in Figure 4.
As both batteries and supercapacitors have maximum/minimum charge and discharge power values, limiting control is needed to prevent their output from exceeding the limit value. Batteries and supercapacitors need to meet Equations (6) and (7), respectively.
{ P B ( t ) P B _ max w h e n   P B ( t ) > 0 P B ( t ) P B _ min w h e n   P B ( t ) 0
{ P C ( t ) P C _ max w h e n   P C ( t ) > 0 P C ( t ) P C _ min w h e n   P C ( t ) 0
wherein PB_max and PB_min represent the upper and lower limits of battery charge and discharge power, respectively; PC_max and PC_min represent the upper and lower limits of supercapacitor charge and discharge power, respectively.

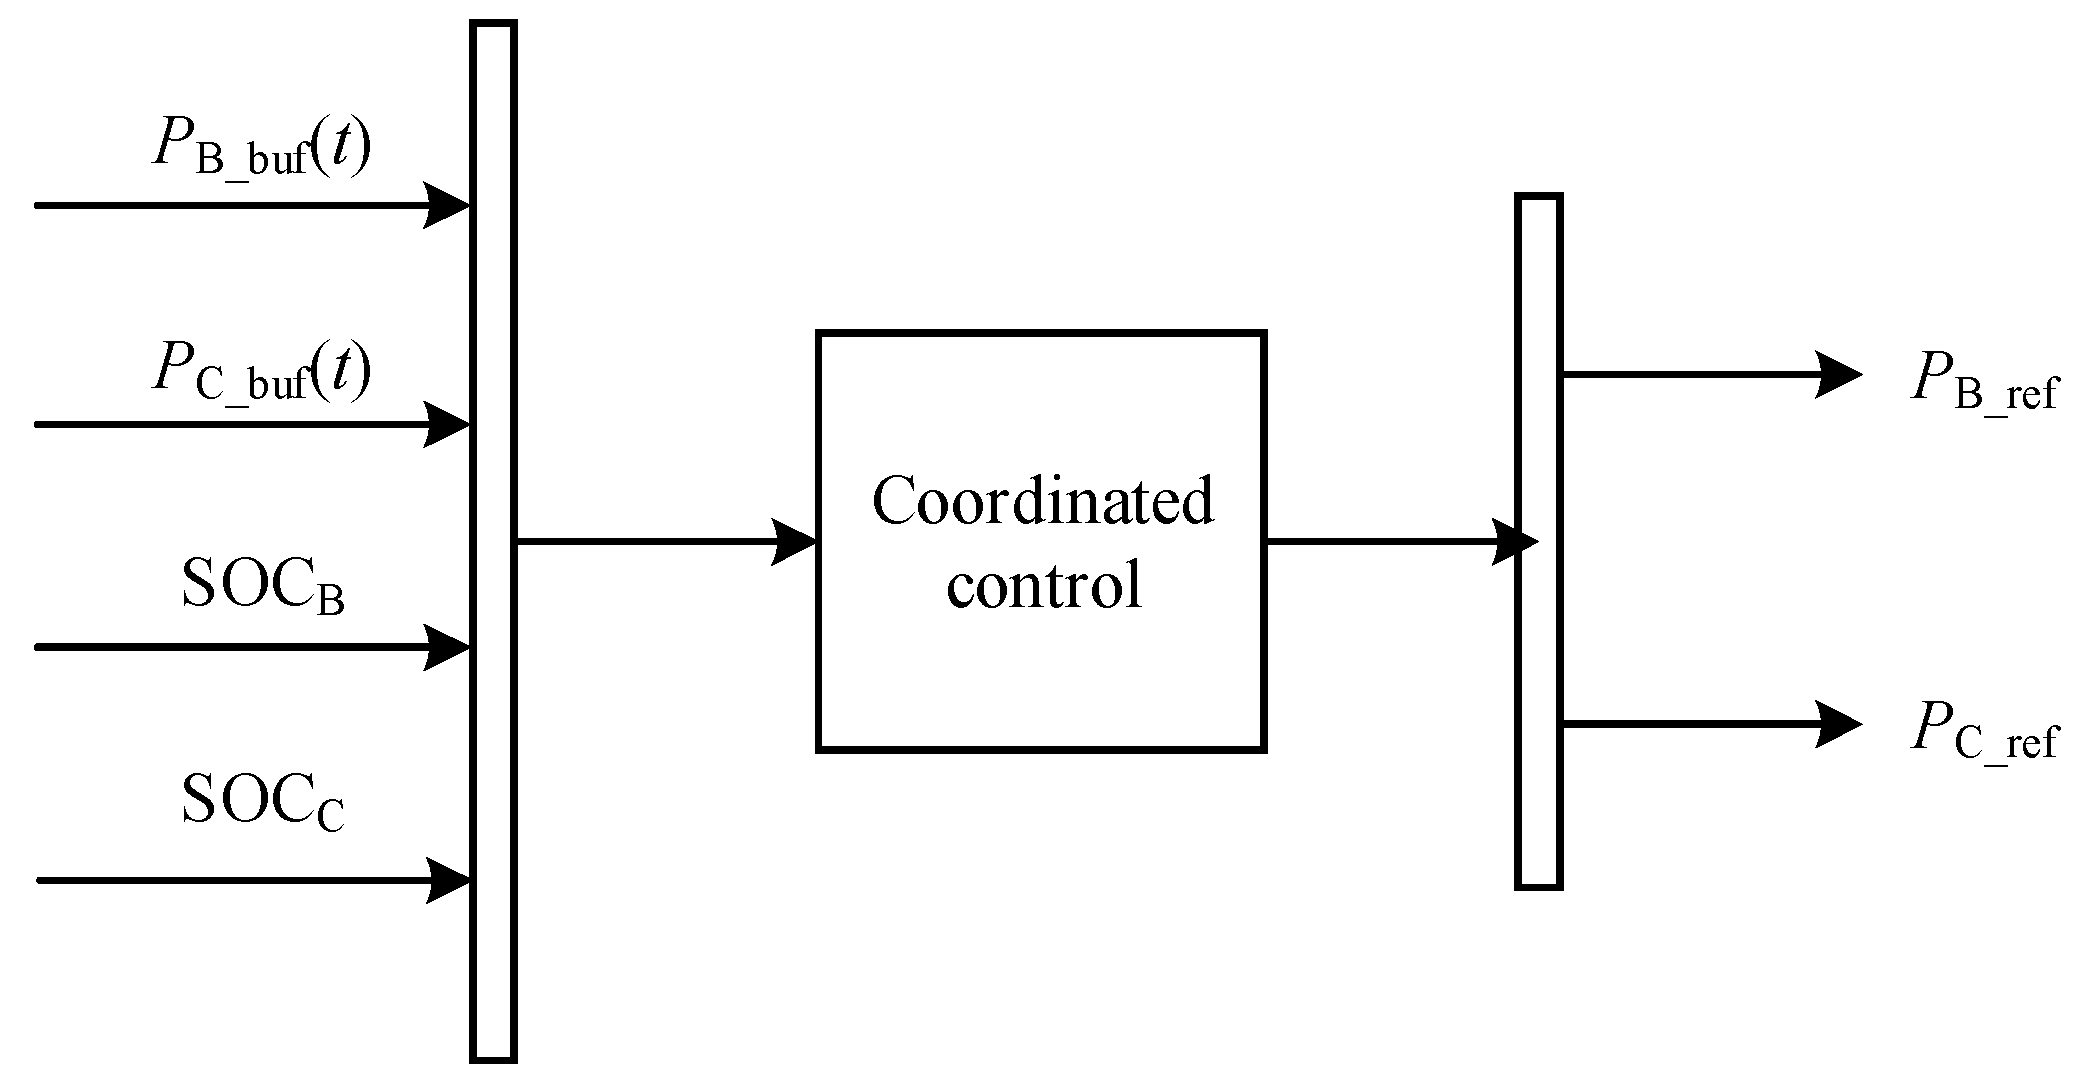
4.2. Lower Layer Coordinated Control of Hybrid Energy Storage System

The lower control is the coordinated control between the battery and the supercapacitor. The hybrid energy storage system is divided into 36 working states according to the respective charge states of the storage battery and the supercapacitor, as shown in Appendix B, where Energy Storage State “+” indicates that the energy storage is in the charging state and Energy Storage State “−” indicates that the energy storage is in the discharge state.
It is stipulated that when the hybrid energy storage system is in normal operation, the charge and discharge power instructions of the storage battery and supercapacitor are PB1 and PC1, respectively, as shown in Equation (8). When the hybrid energy storage system is in a coordinated operation, the charge and discharge power instructions of the battery and supercapacitor are P2 and P3, respectively, as shown in Equations (9) and (10). When the battery and supercapacitor are in a state of stopping operation, it is indicated by 0. The structure diagram of the lower coordinated control is shown in Figure 5. The results of the secondary adjustment of the output of each energy storage element after coordinated control are shown in Appendix C.
{ P B 1 = P B _ b u f ( t ) P C 1 = P C _ b u f ( t )
P 2 = min ( P B _ b u f ( t ) , P H E S S _ m a x )
P 3 = min ( P B _ b u f ( t ) + P C _ b u f ( t ) , P H E S S _ m a x )
The reference for the working process of coordination and control is as follows:
(1)
When HESS works on State 1:
{ S O C B < 0.15 S O C C < 0.10 P B _ b u f ( t ) > 0 P C _ b u f ( t ) > 0
The consumption power of the battery is:
P B _ r e f ( t ) = P 2
Charge the supercapacitor with a charging power of:
P C _ r e f ( t ) = P C 1
The SOCC continues to rise during the charging of the supercapacitor until the Working State of the Hybrid Energy Storage System switches to State 3 during SOCC0.10.
(2)
When HESS works on State 3:
{ S O C B < 0.15 0.10 S O C C 0.90 P B _ b u f ( t ) > 0 P C _ b u f ( t ) > 0
The consumption power of the battery is:
P B _ r e f ( t ) = P B _ m a x
At this time, the charge state of the battery is lower than the minimum, while the charge state of the supercapacitor is in the normal working range, and the battery operates at the maximum power. If the output of the hybrid energy storage system is less than the maximum operating power of the battery, the power shortage of the supercapacitor discharge compensation system will be made. If the output of the hybrid energy storage system is greater than the maximum operating power of the battery, the supercapacitor will charge and consume the remaining power of the system.
(3)
When HESS works at 14:00 in State:
{ 0.15 S O C B 0.85 S O C C < 0.10 P B _ b u f ( t ) > 0 P C _ b u f ( t ) < 0
The consumption power of the battery is:
P B _ r e f ( t ) = P 3
At this time, the charge state of the supercapacitor is lower than the minimum and is in the discharge state, which indicates that the supercapacitor must stop running because it cannot compensate for the system power gap or consume the power surplus. If the output of the hybrid energy storage system is less than the maximum operating power of the battery, the power of the battery discharge compensation system will be deficient; if the output of the hybrid energy storage system is greater than the maximum operating power of the battery, the battery will operate at its rated power.
(4)
When HESS works on State 29:
{ S O C B > 0.85 S O C C > 0.90 P B _ b u f ( t ) > 0 P C _ b u f ( t ) > 0
At this time, the charge state of the battery and supercapacitor is higher than the maximum, and the reference power is in the charging state, so each energy storage element must stop running because it cannot compensate for the system power shortage or consume the power surplus.

5. Example Simulation

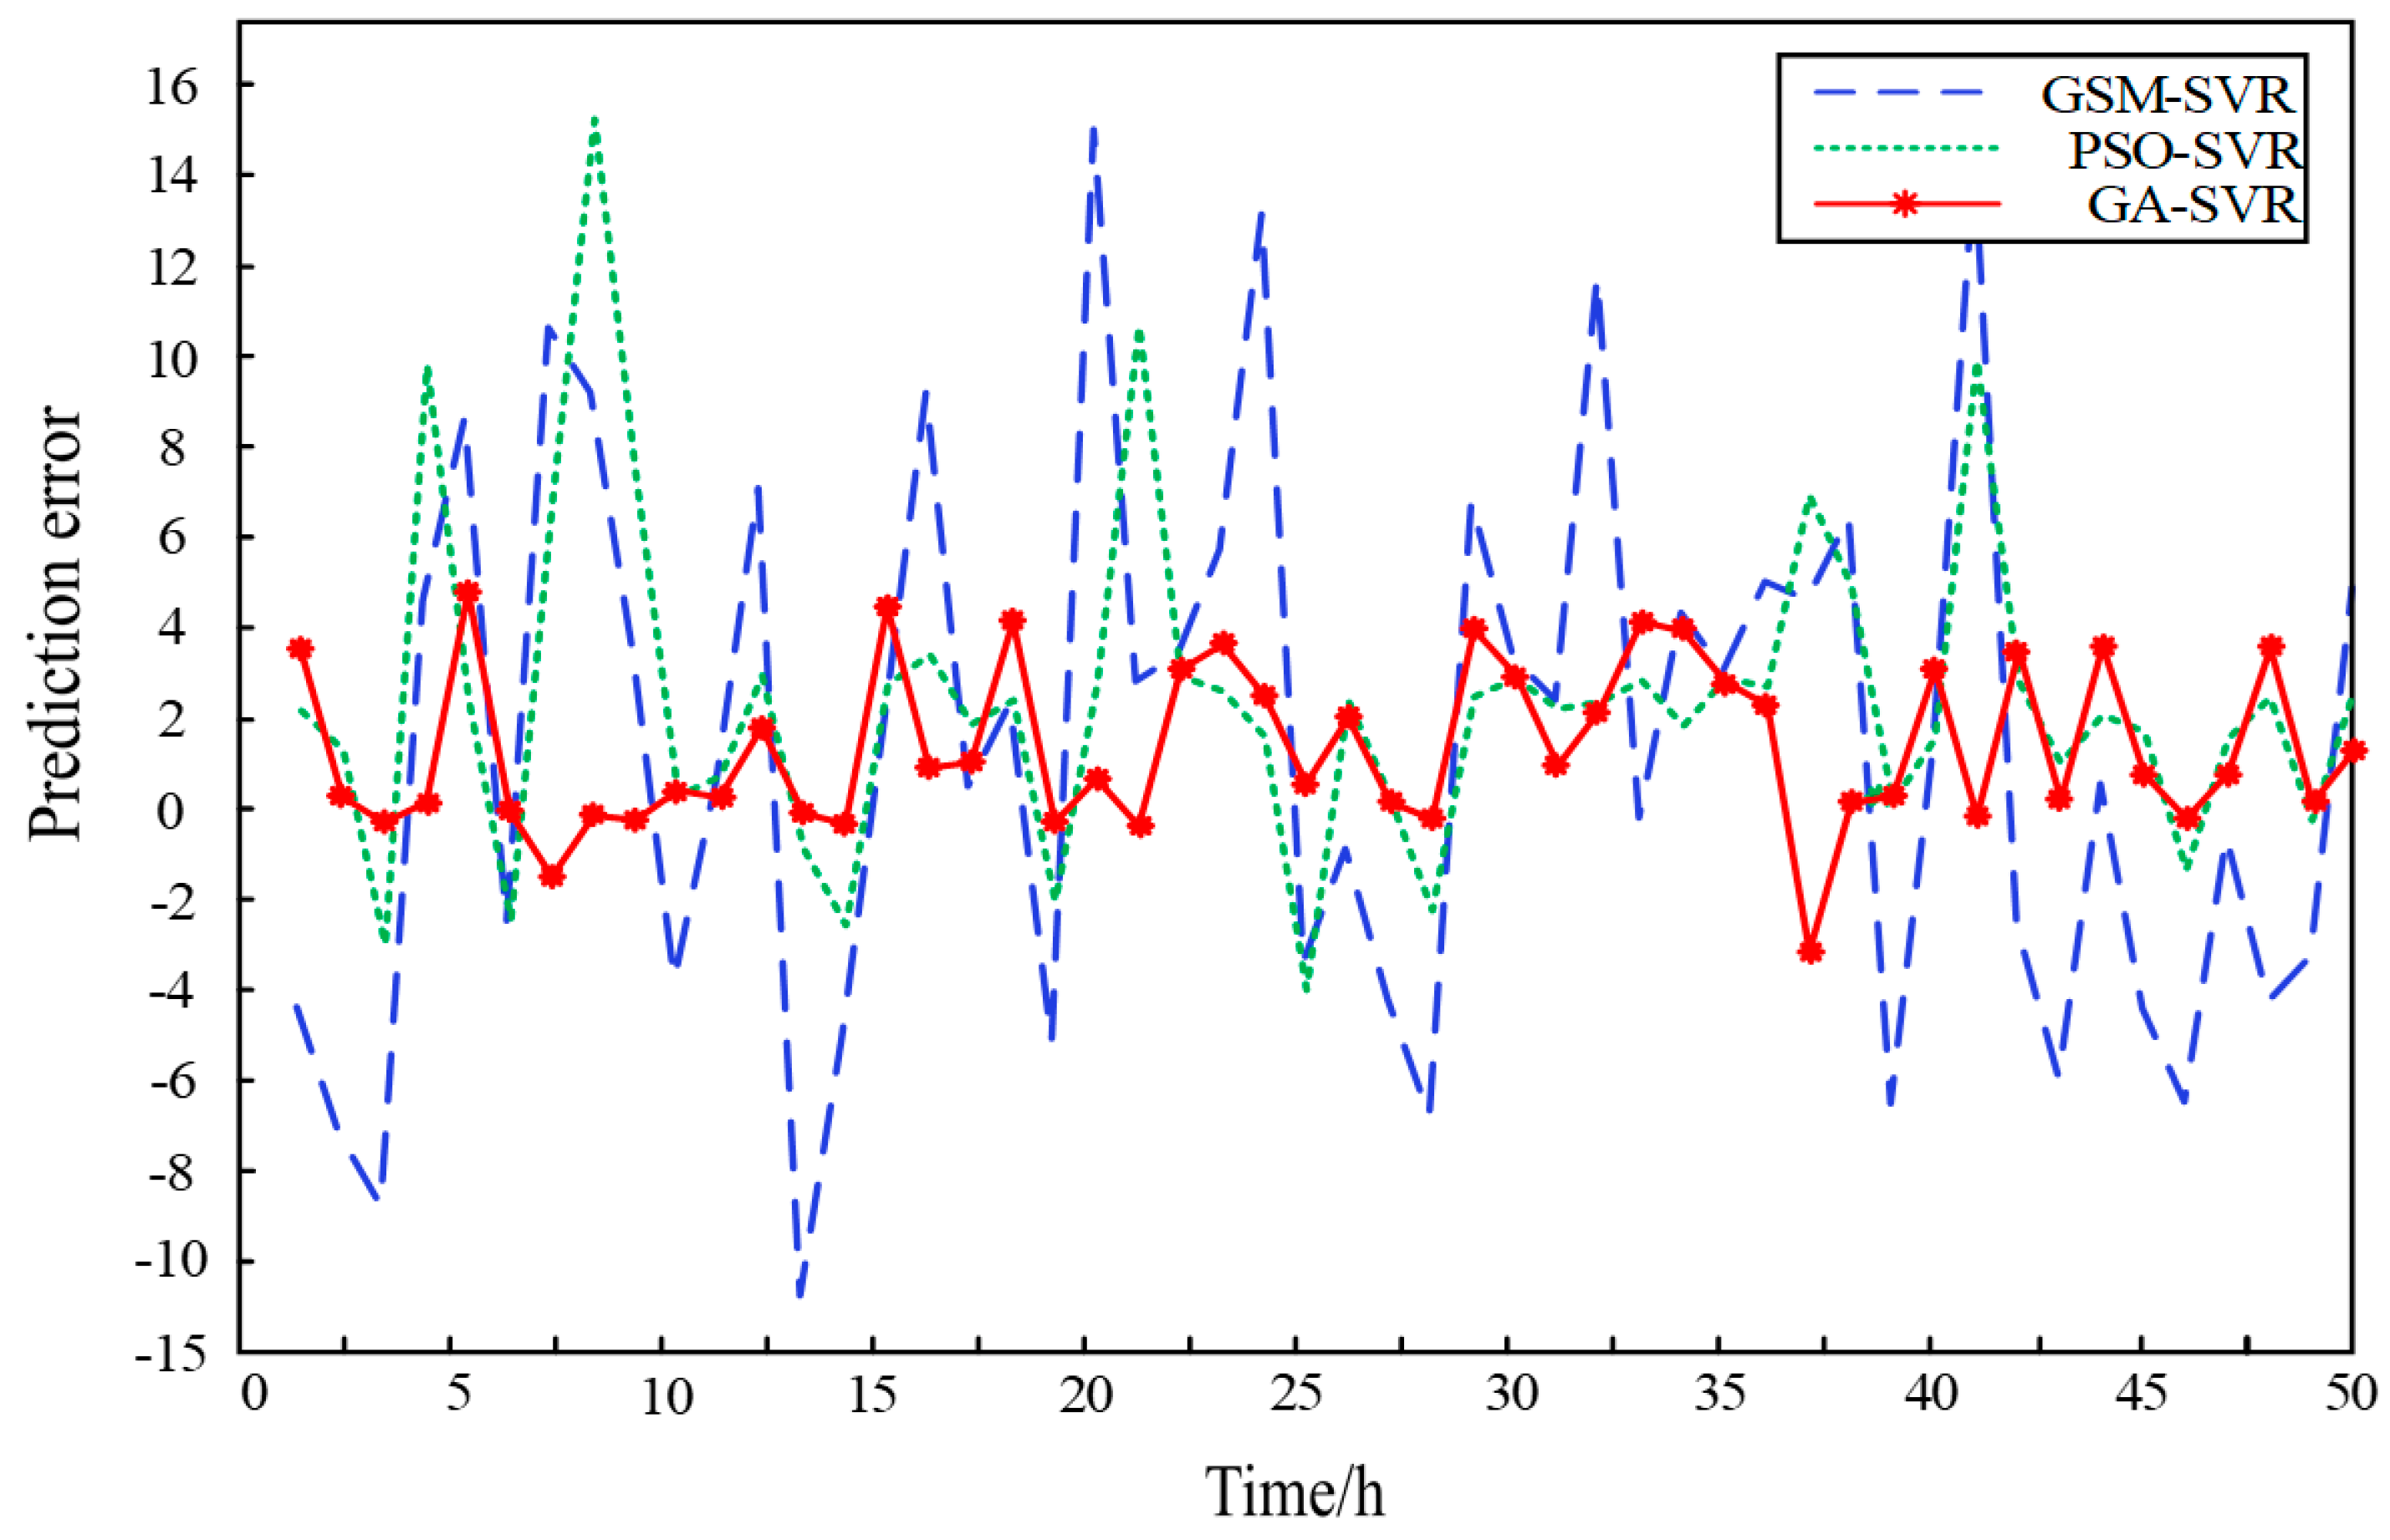
5.1. Simulation Analysis of Short-Term Prediction of Wind Power

According to the selected historical data of the wind farm’s daily output, 1050 output data points were obtained, of which the first 1000 points were used as the training set and the last 50 points were used as the test set. The optimal penalty factor parameter in the regressor machine obtained by improving the GA algorithm is C = 1.1421, and the optimal kernel function parameter is σ = 0.15634.
In order to verify the optimization effect of the proposed method, the optimization of SVR parameters by the grid search method (GSM-SVR) [21], the optimization of SVR parameters by Particle Swarm Optimization (PSO-SVR) [22], and the optimization of SVR parameters by the genetic algorithm (GA-SVR) [23] are compared and analyzed. The respective prediction errors are shown in Figure 6. It is obvious that GA-SVR has good prediction performance, higher accuracy, and minimum prediction error.
In order to accurately compare the prediction results of the three methods and evaluate the accuracy of regression prediction intuitively, Mean Absolute Error (MAE) and Root Mean Square Error (RMSE) are used to evaluate the three analysis methods, and the evaluation indicators are shown in Table 1.
According to Table 1, the error of the GA-SVR prediction algorithm is smaller than that of the other two prediction methods. In terms of time, the genetic algorithm is less than the grid search algorithm and the particle swarm optimization algorithm, which shows that the prediction effect of the proposed method is more accurate, and the convergence speed is faster. At the same time, compared with the traditional genetic algorithm, to optimize the SVR prediction model, the improved GA-SVR training time is reduced by 40%, although it does not improve the average absolute error and root mean square error, which proves that the proposed improved GA-SVR prediction algorithm reduces the time cost of training.

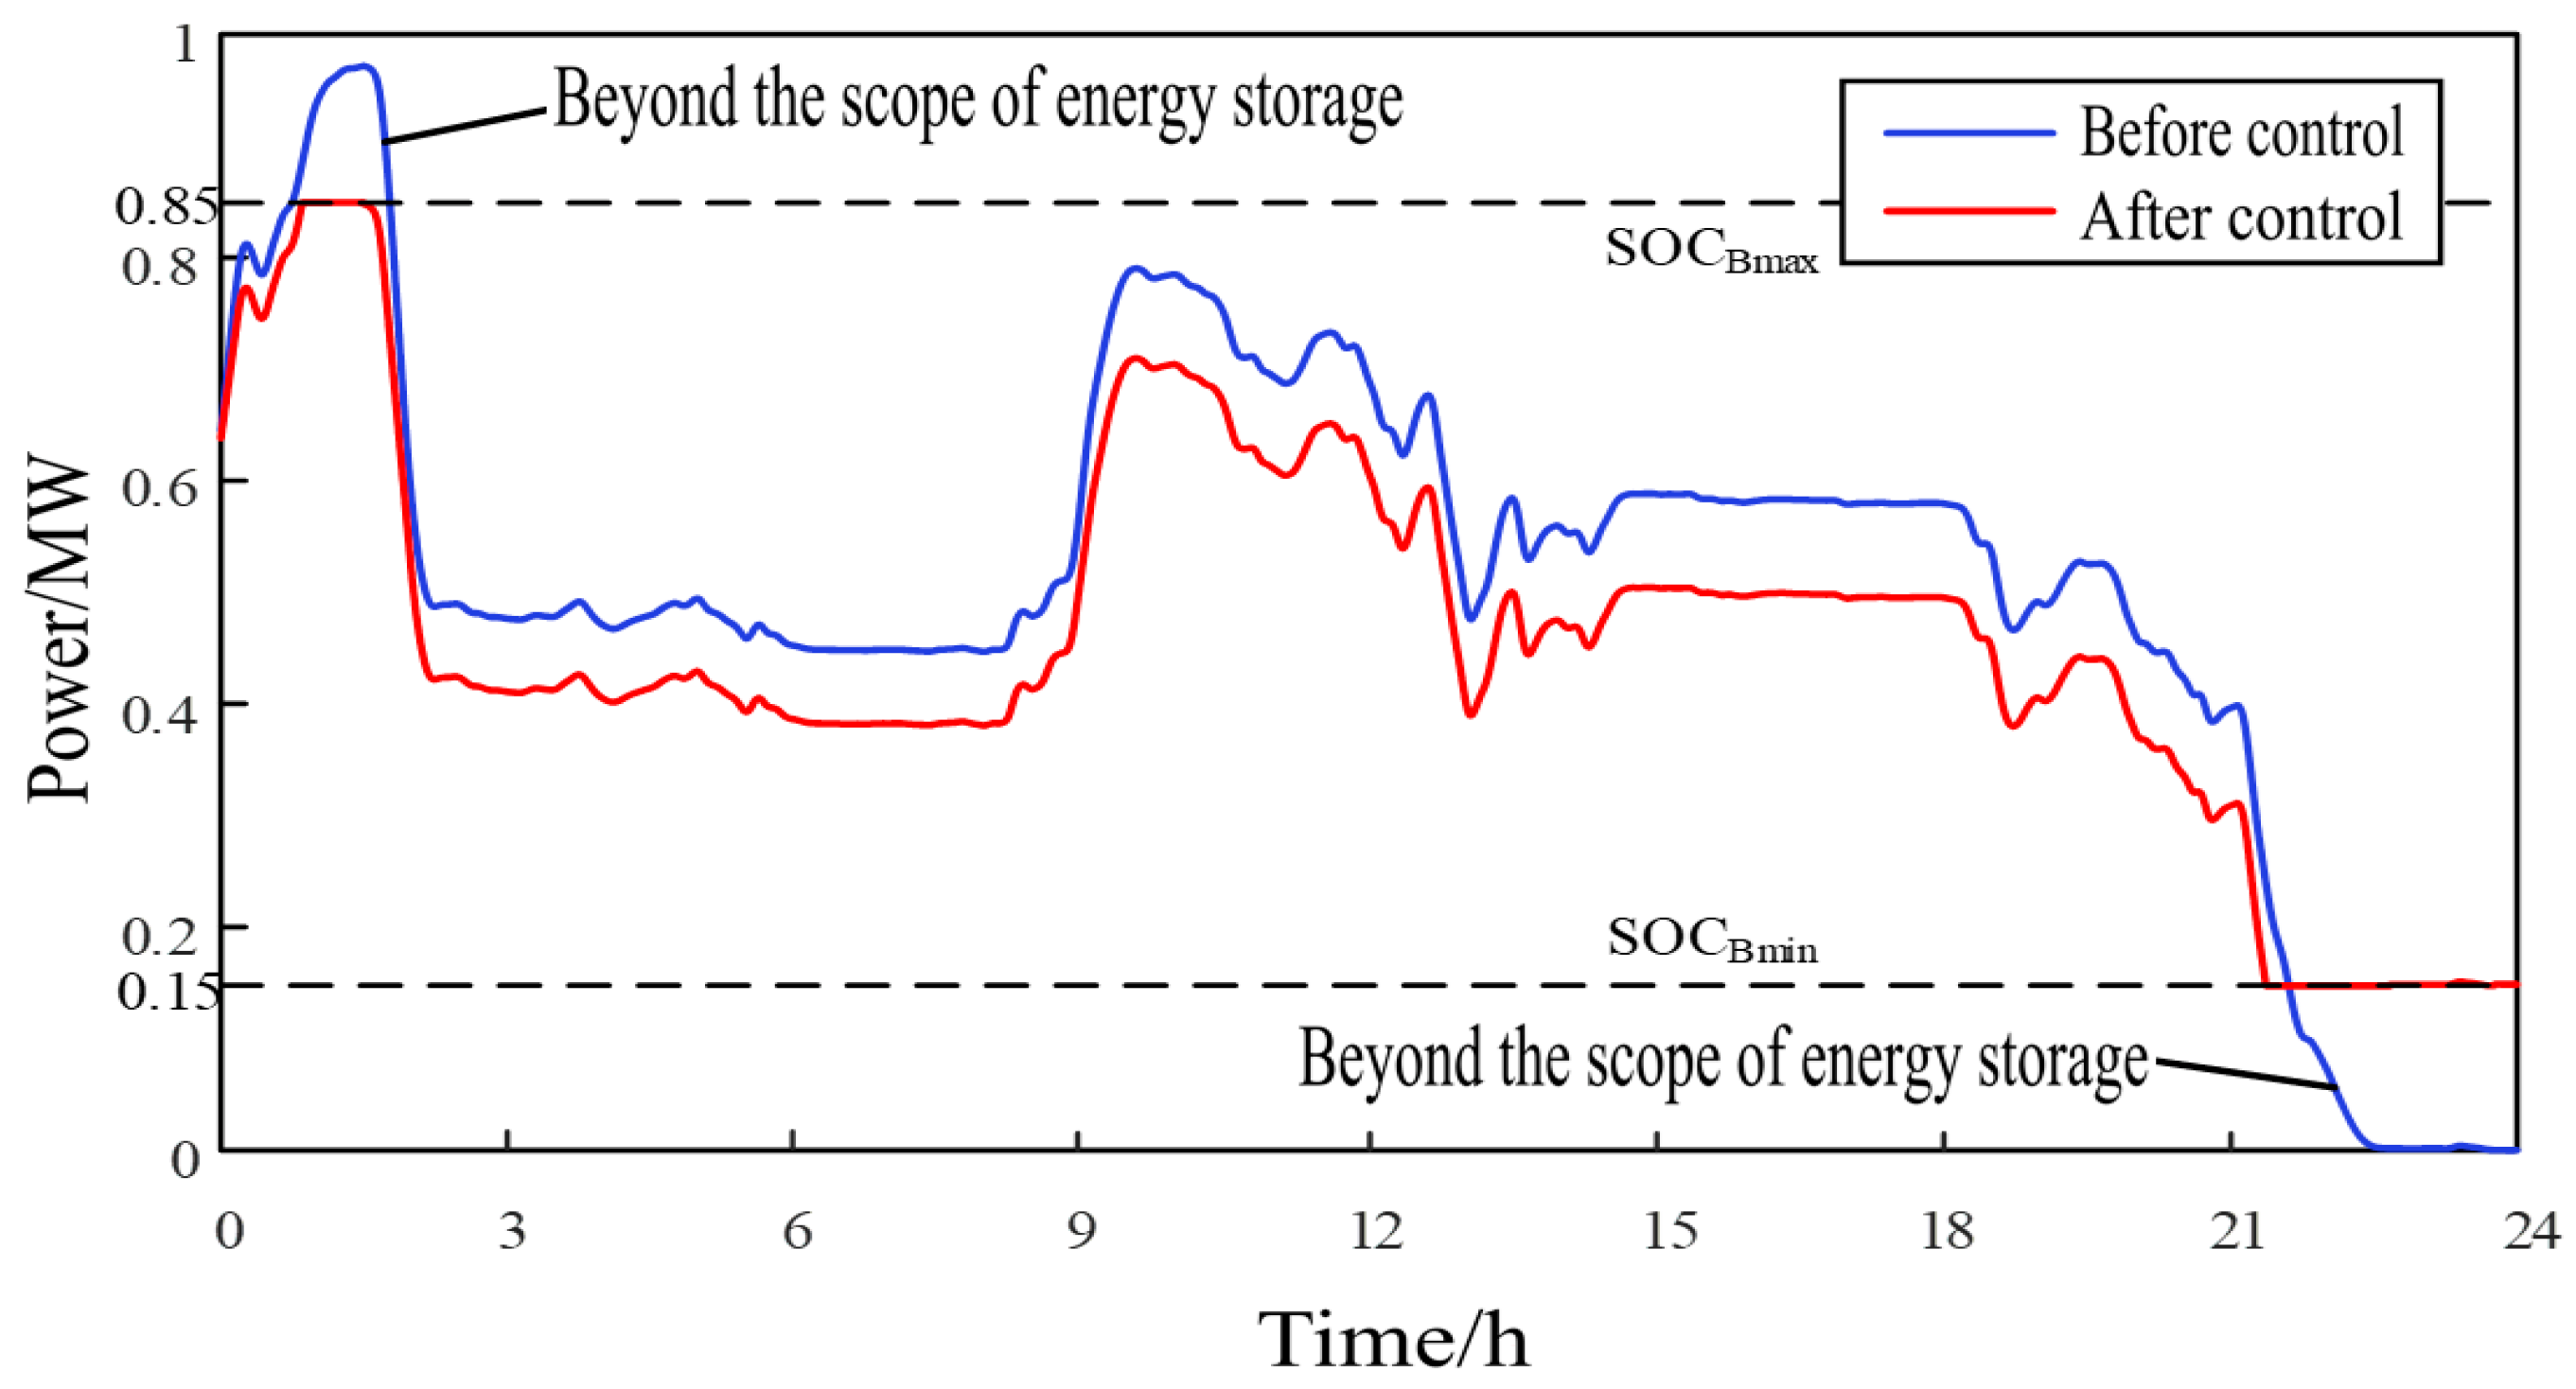
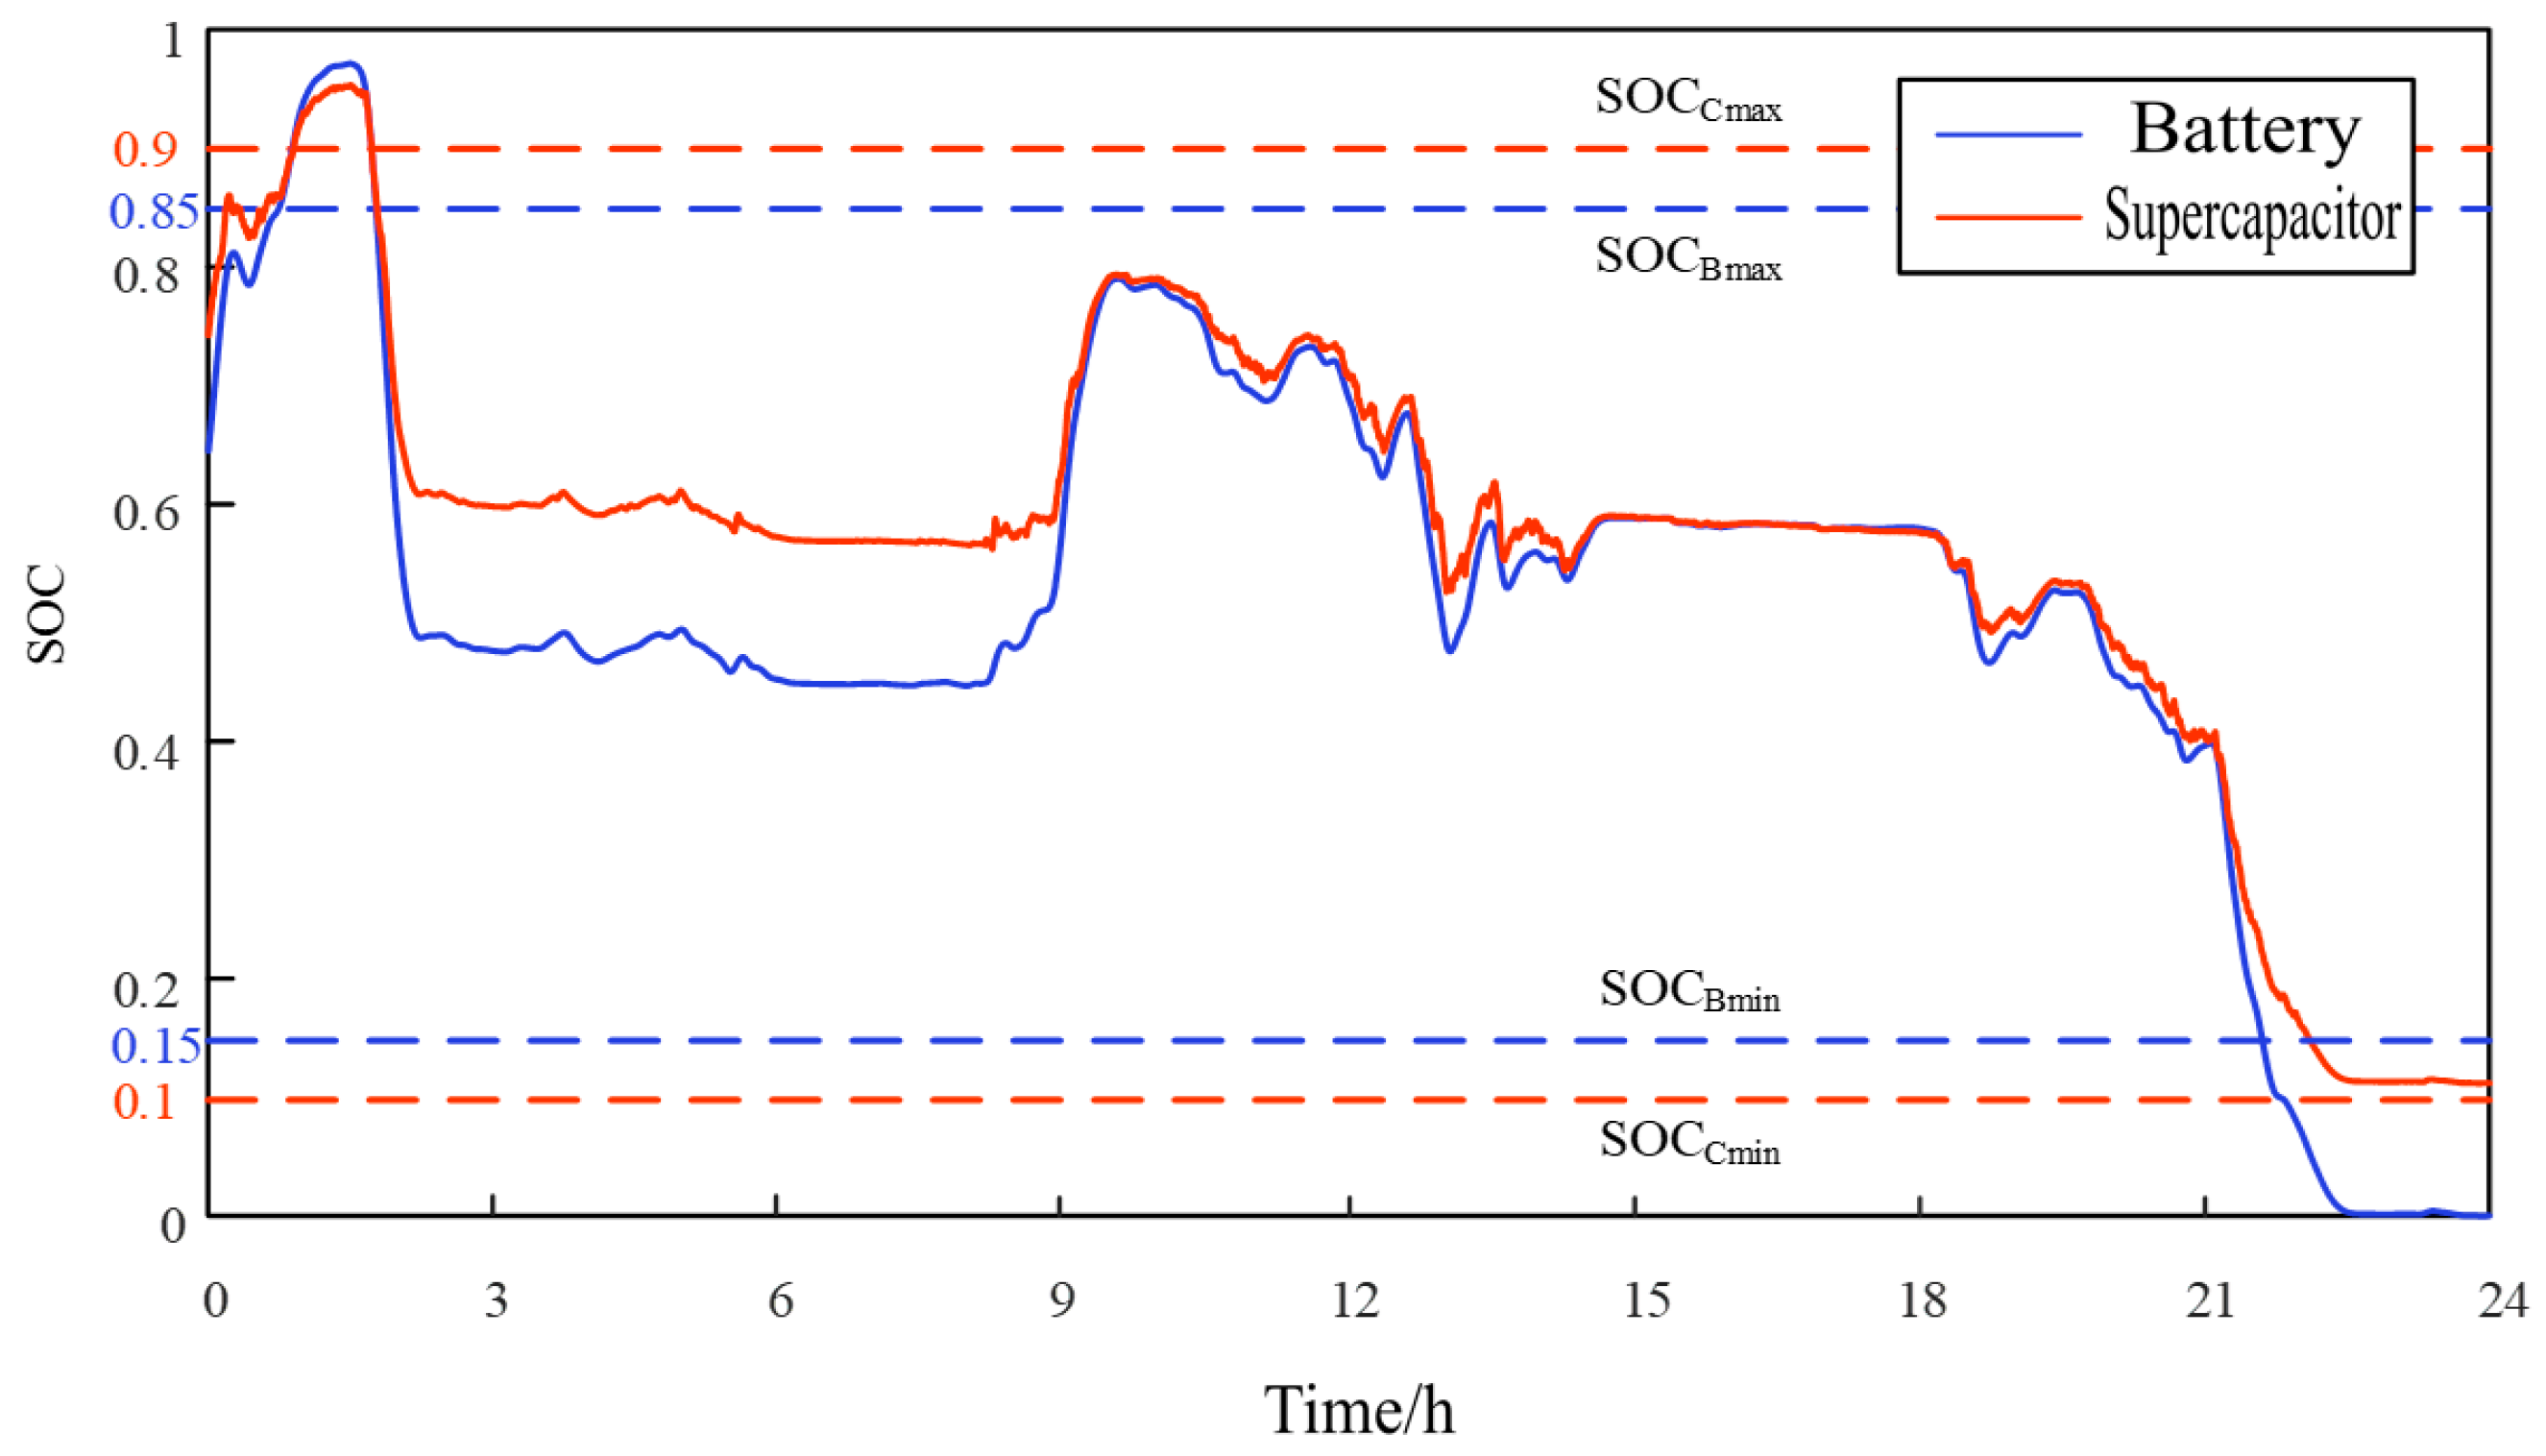
5.2. Simulation Analysis of Hierarchical Control of Hybrid Energy Storage System

In this example, the whole-day output active power of a wind farm with an installed capacity of 30 MW is used as the simulation data, and the sampling interval is 7 s, in which the rated capacity of the battery is 7.1150 MW·h, the rated operating power is 5.9364 MW, the SOC threshold is 0.15–0.85, the charge and discharge efficiency is η = 80%, the rated capacity of the supercapacitor is 9.9455 MW·h, the rated operating power is 12.3187 MW, the SOC threshold is 0.10–0.90, and the charge and discharge efficiency is η = 95%.
First of all, the SOC of each energy storage element before and after control is simulated. Figure 7 provides the charge state curve of the storage battery and the supercapacitor. Evidently, the SOC of the two energy storage media exceeds the upper and lower limits many times between 0~3 h and 21~24 h, which causes great damage to the elements and shortens their life. Evidently, when using the energy storage system to stabilize the fluctuation of the output power of the wind farm, the charge and discharge process of the energy storage equipment fluctuates. If the capacity of the energy storage element and the rated operating power are not taken into account, the problem of SOC exceeding the limit and overcharging and discharging may occur in actual operation.
In order to verify the effectiveness of the hierarchical control strategy in regulating the charge state of energy storage devices, the SOC change curves of two kinds of energy storage devices before and after control are given in Figure 8 and Figure 9, respectively. It is obvious that when there is no layered control, the SOC of the battery cannot be guaranteed to change between 0.15 and 0.85, which seriously affects the service life of the energy storage element. When the layered control is carried out, the SOC curve of the battery and supercapacitor is always within its upper and lower limits, and the phenomenon of exceeding the limit does not occur, which avoids the equipment working in the overcharge and overdischarge area and prolongs its operating life.
At the same time, the internal power optimization of the energy storage system can be realized by hierarchical control. The charge and discharge power curves of the two energy storage devices before and after hierarchical control optimization are compared, as shown in Figure 10 and Figure 11. Obviously, the charge and discharge power of the storage battery and supercapacitor is lower than that before control, and there is no over-limit trend, which ensures that the operating power of the storage battery and the supercapacitor does not exceed its rated operating power. In addition, the number of charges and discharges has also been reduced, which implies that the service life of the energy storage system can be extended.

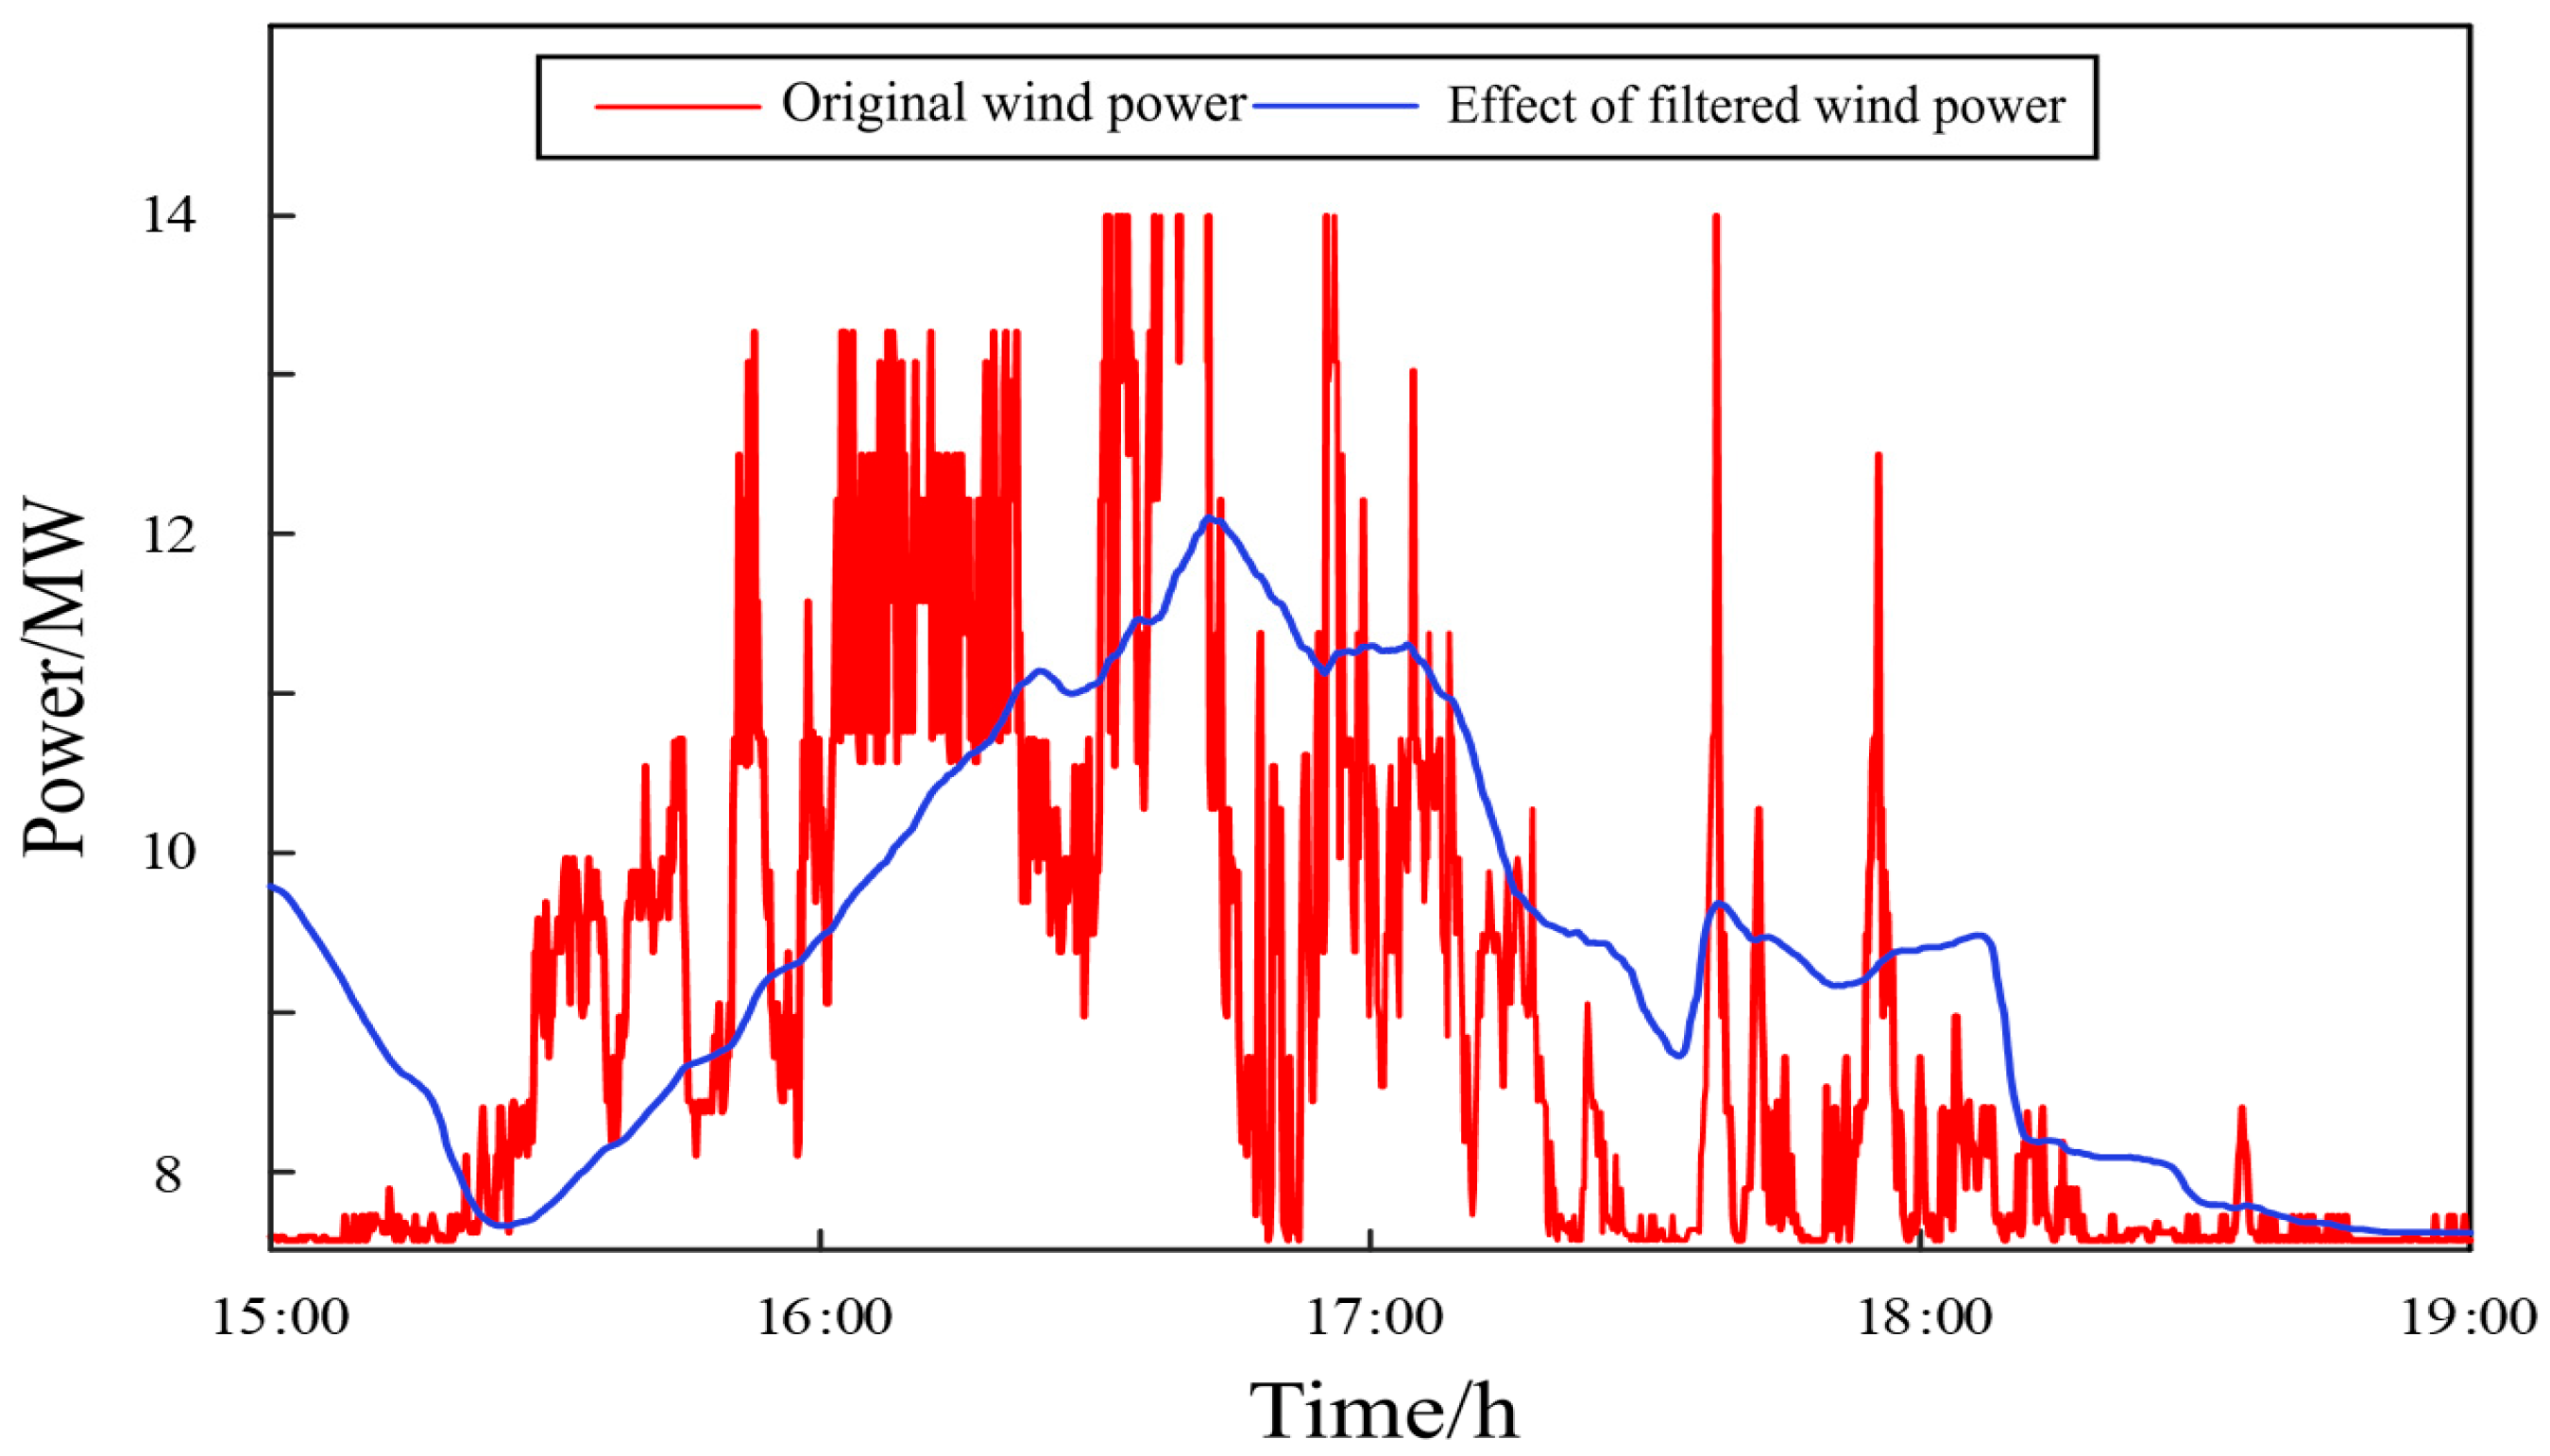
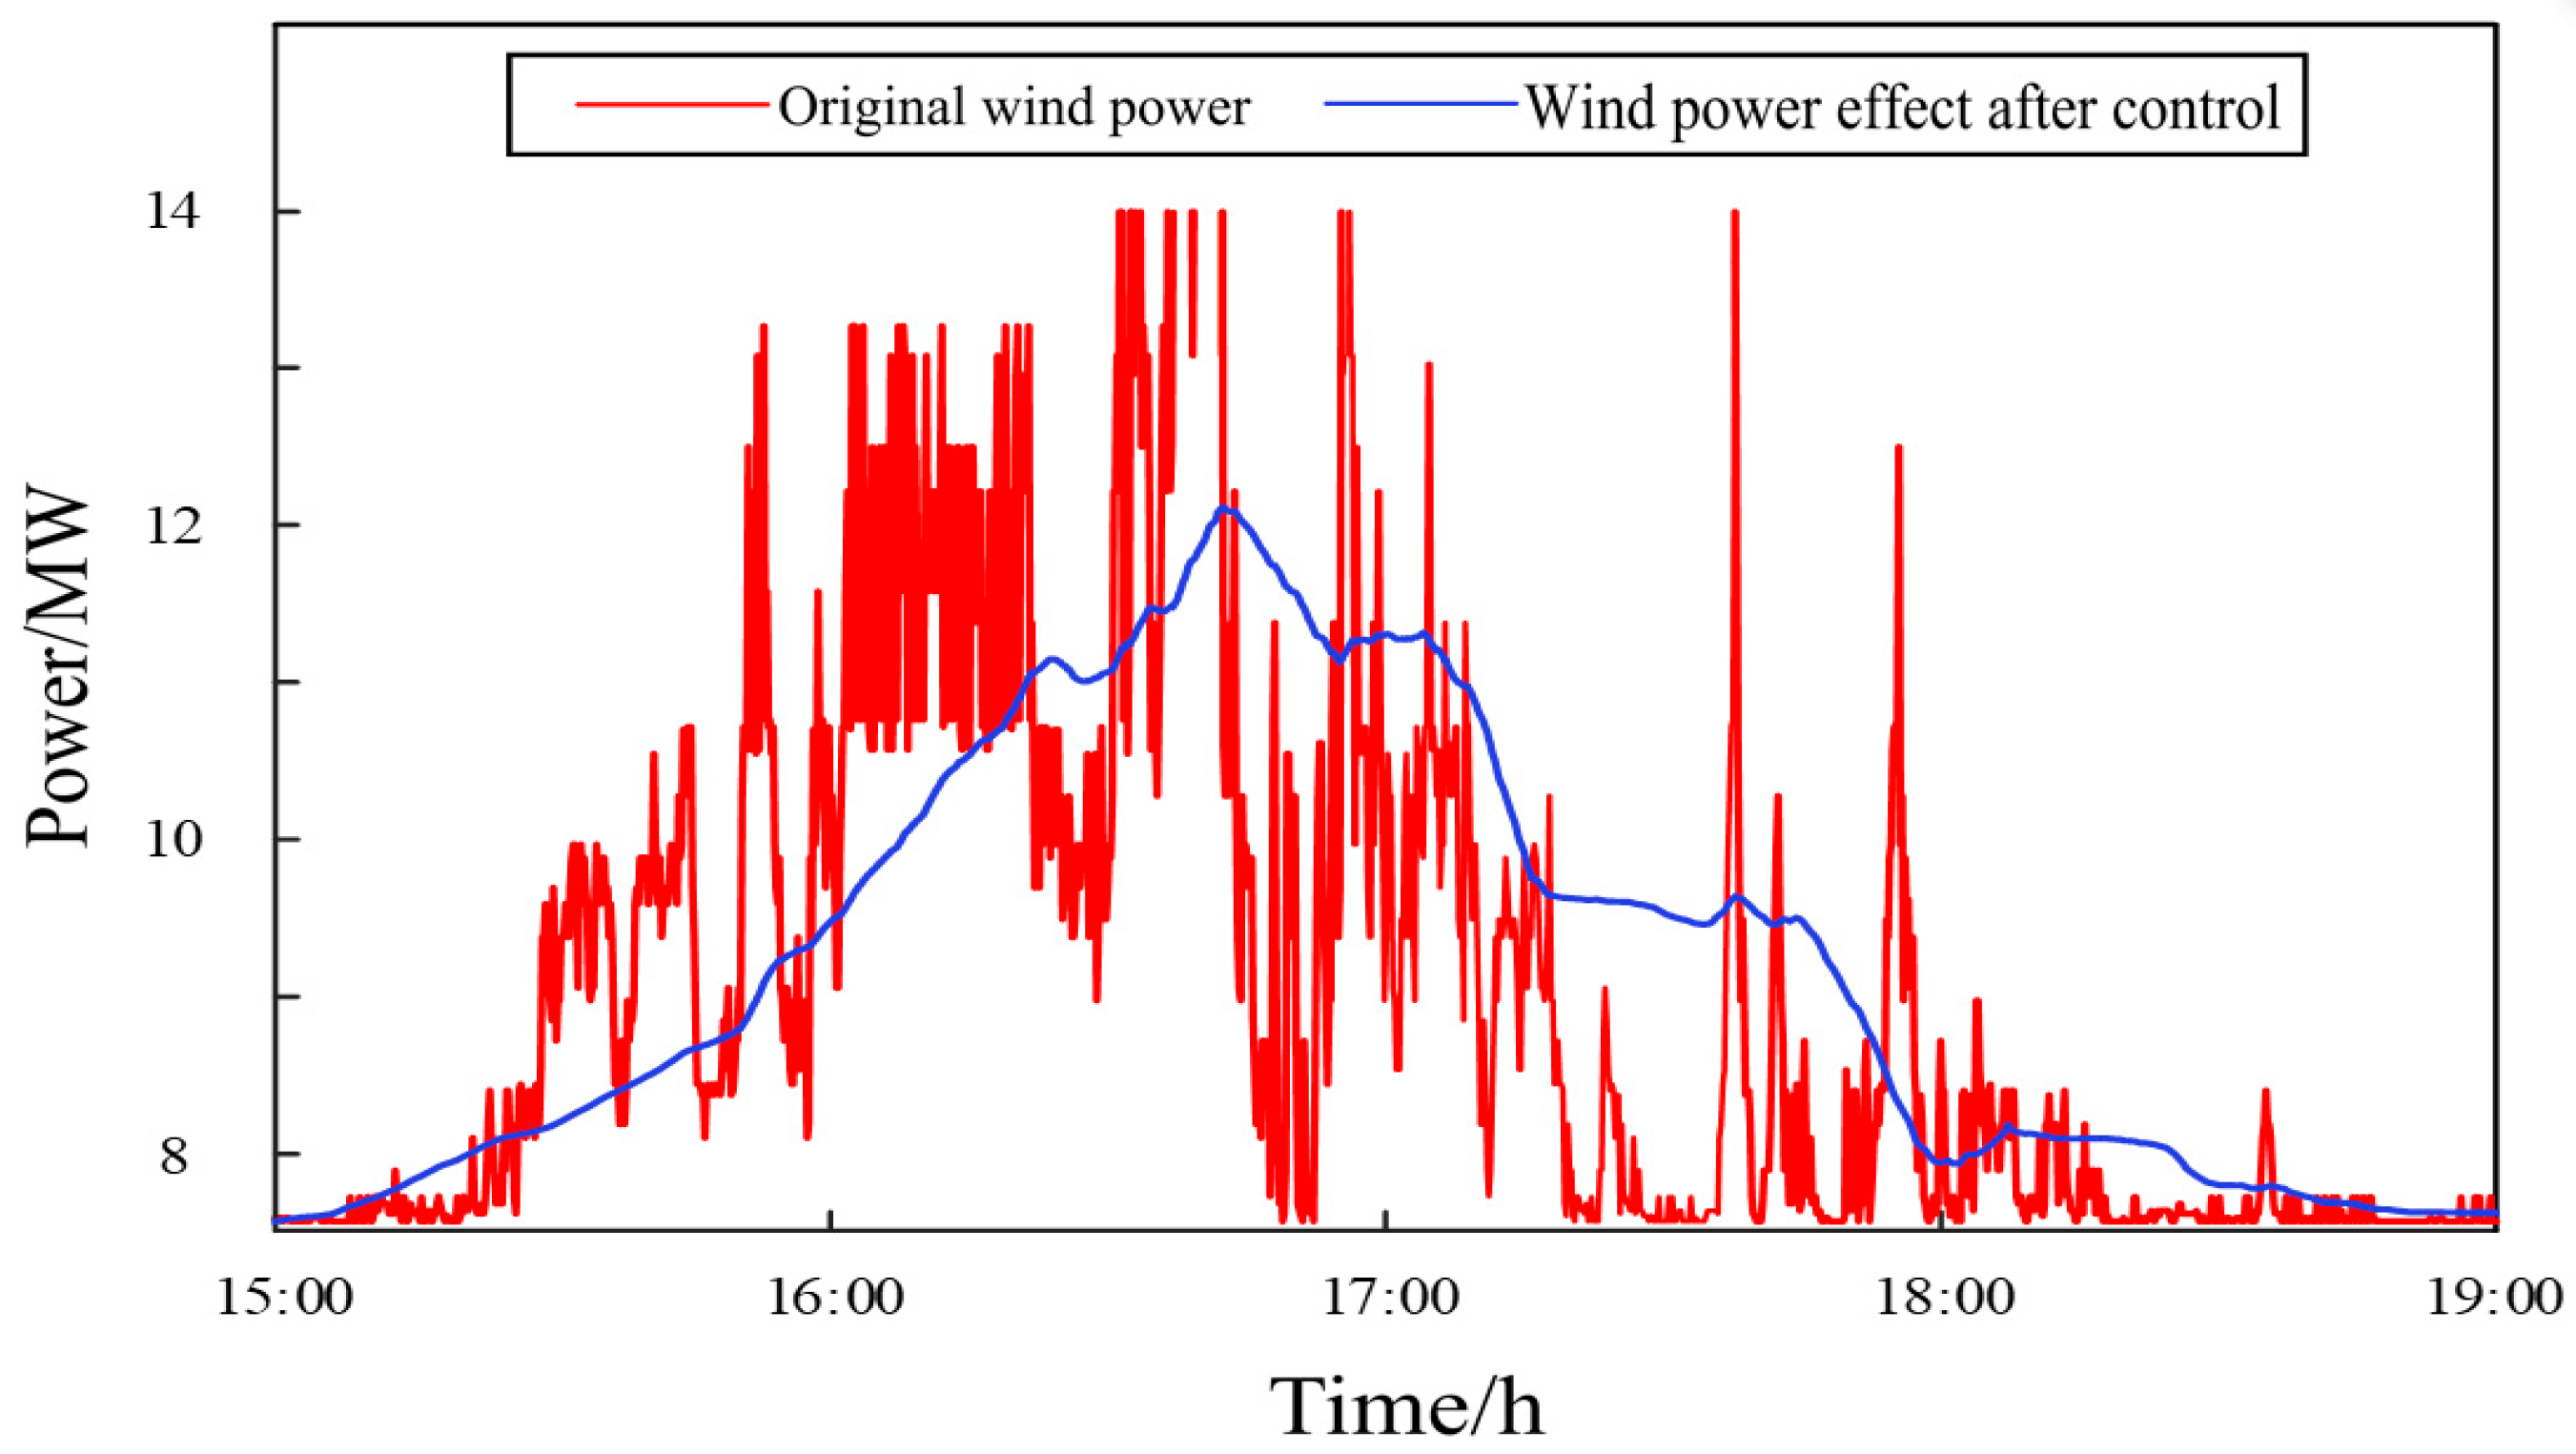
5.3. Simulation Analysis of Wind Power Fluctuation Stabilization in Hybrid Energy Storage System

In the process of smooth fluctuation of wind power output, the energy storage system may encounter the phenomenon that the charge and discharge power of energy storage components exceeds the limit, or the SOC is not within the safety threshold because of its inherent characteristics such as irregular fluctuation. Accordingly, the hierarchical control strategy is proposed to solve the above problems, and the SOC security index SH is specified to measure the stabilization effect of the hierarchical control strategy.
S H = i = 0 T / Δ t 1 f ( S O C ( t + i Δ t ) S O C min ) f ( S O C max S O C ( t + i Δ t ) ) T / Δ t
f ( x ) = { 1 , x > 0 0 , x 0
T d = ( 1 S H ) T
wherein Δt represents the sampling interval of wind power output, T represents the smoothing period, and Td represents the dead time in which the smoothing capacity of the energy storage element is limited. The higher the SH index, the lower the proportion of the limited smoothing capacity of the energy storage element, that is, the better the effect of the hierarchical control strategy.
Similarly, in this example, the whole-day output active power of a wind farm with an installed capacity of 30 MW is selected as the simulation data, and the wind power output stabilization effect with or without hierarchical control is compared during the time period of 15:00~19:00 in a day, as shown in Figure 12 and Figure 13 and Table 2.
According to the comparative analysis of Figure 12 and Figure 13, the wind power grid output fluctuation is relatively small after being controlled by the proposed hierarchical control strategy in the set smooth time period, and the curve is relatively smooth. According to Table 2, the SH indexes of batteries and supercapacitors have been improved, which significantly reduces the proportion of energy storage components entering the dead zone at work, thus effectively reducing the fluctuation of system charge and discharge output.

6. Conclusions

In view of the random and irregular output of wind power, the fixed and limited rated capacity and rated power of the battery and supercapacitor, the excessive charging and discharging of the system, and the damage to the operating life of the energy storage components, an improved genetic algorithm is proposed to optimize support vector regression prediction. Then, the wind power output data of a certain day were selected as the prediction training data before being obtained by the prediction model and taken as the wind power output. Then, this was applied to the hierarchical control strategy, and the secondary power distribution of each energy storage element was realized via limiting control and coordinated control. Finally, the results suggested that the hierarchical control strategy can effectively avoid the occurrence of excessive charging and discharging, reduce the number of charging and discharging cycles of hybrid energy storage devices, prolong the operation life of the system, and improve the overall performance of the system.

Author Contributions

Conceptualization, L.Y. and G.M.; methodology, G.P.; software, Y.W.; validation, L.Y., G.M. and Y.W.; formal analysis, Y.T.; investigation, L.Y.; resources, Y.W.; data curation, Y.W.; writing—original draft preparation, Y.T.; writing—review and editing, G.M.; visualization, G.P.; supervision, L.Y.; project administration, G.M.; funding acquisition, L.Y. All authors have read and agreed to the published version of the manuscript.

Funding

This research was funded by the Key research and development program of Jiangsu Province, grant number 20KJB480006.

Data Availability Statement

No data available.

Conflicts of Interest

The authors declare no conflict of interest.

Appendix A

Figure A1. Improved power allocation strategy based on moving average filtering and EEMD decomposition.
Energies 16 02079 g0a1

Appendix B

Table A1. Working State of Hybrid Energy Storage System.
Working State SOCBEnergy Storage State SOCCEnergy Storage State
<0.150.15~0.85>0.85+<0.10.1~0.9>0.9+
State 1
State 2
State 3
State 4
State 5
State 6
State 7
State 8
State 9
State 10
State 11
State 12
State 13
State 14
State 15
State 16
State 17
State 18
State 19
State 20
State 21
State 22
State 23
State 24
State 25
State 26
State 27
State 28
State 29
State 30
State 31
State 32
State 33
State 34
State 35
State 36

Appendix C

Table A2. Coordinated Control Results.
Working State of Hybrid Energy Storage SystemPB_ref(t)PC_ref(t)Working State of Hybrid Energy Storage SystemPB_ref(t)PC_ref(t)
State 1P2PC1State 19P2PC1
State 2P20State 20P30
State 3PB_maxPHESS-PB_maxState 21P2PC1
State 4PB_maxPHESS-PB_maxState 22P2PC1
State 5P30State 23P30
State 6P2PC1State 24P2PC1
State 70PC1State 250PHESS
State 800State 2600
State 90PHESSState 270PHESS
State 100PHESSState 280PHESS
State 1100State 2900
State 120PHESSState 300PC1
State 13P2PC1State 31P2PC1
State 14P30State 32P30
State 15P2PC1State 33−PB_maxPHESS + PB_max
State 16P2PC1State 34PB_maxPHESS + PB_max
State 17P30State 35P20
State 18P2PC1State 36P2PC1

References

  1. Nathwani, J.; Kammen, D.M. Affordable Energy for Humanity: A Global Movement to Support Universal Clean Energy Access. Proc. IEEE 2019, 107, 1780–1789. [Google Scholar] [CrossRef]
  2. Xue, Y.; Lei, X.; Xue, F.; Yu, C.; Dong, Z.Y.; Wen, F.S.; Ju, P. A Review on Impacts of Wind Power Uncertainties on Power Systems. Proc. CSEE 2014, 34, 5029–5040. [Google Scholar]
  3. Sun, R.; Zhang, T.; He, Q.; Xu, H. Review on Key Technologies and Applications in Wind Power Forecasting. High Volt. Eng. 2021, 47, 1129–1143. [Google Scholar]
  4. Wang, H.L.; Jiang, T.; Wu, Y.L.; Wang, N.S. Analysis on Distribution Network Power Quality Considering New Energy Grid-connected Power Generation. New Energy Power Control. Technol. 2021, 43, 20–23. [Google Scholar]
  5. Li, H.Z.; Zhang, Y.; Sun, W.Q. Wind power fluctuation smoothing strategy with generalized energy storage under wavelet packet decomposition. Power Syst. Technol. 2020, 44, 4495–4504. [Google Scholar]
  6. Cao, M.; Xu, Q.; Qin, X.; Cai, J. Battery energy storage sizing based on a model predictive control strategy with operational constraints to smooth the wind power. Int. J. Electr. Power Energy Syst. 2020, 115, 105471. [Google Scholar] [CrossRef]
  7. Li, P.Q.; Li, W.Y.; Tang, J.; Li, H.; Wang, J. Method of Hybrid Energy Storage to Smooth the Fluctuations for Wind Power Based on. Proc. CSU-EPSA 2017, 29, 20–27. [Google Scholar]
  8. Qian, F.; Zhang, X.D.; Liu, J.L.; Fu, C. Control method of wind power grid connection based on variational mode decomposition technology and hybrid energy storage strategy. Eng. J. Wuhan Univ. 2021, 54, 354–360+374. [Google Scholar]
  9. Ding, M.; Wu, J.; Zhu, C.; Zhao, B.; Chen, Z.; Luo, Y. A Real-time Smoothing Control Strategy With SOC Adjustment Function of Storage Systems. Proc. CSEE 2013, 33, 22–29. [Google Scholar]
  10. Jiang, Q.; Hong, H. Wavelet-Based Capacity Configuration and Coordinated Control of Hybrid Energy Storage System for Smoothing Out Wind Power Fluctuations. IEEE Trans. Power Syst. 2013, 28, 1363–1372. [Google Scholar] [CrossRef]
  11. Jiao, D.D.; Chen, H.; Fang, Y. Control strategy of hybrid energy storage for suppressing fluctuation of wind power output based on variational mode decomposition. Electr. Meas. Instrum. 2021, 58, 14–19+30. [Google Scholar]
  12. Li, Y.N.; Wang, Q.; Song, W. Variational mode decomposition and fuzzy control strategy of hybrid energy storage for smoothing wind power outputs. Power Syst. Prot. Control. 2019, 47, 58–65. [Google Scholar]
  13. Zhang, X.; Zhang, F.; Liang, J.; Zhang, L.; Han, X.S.; Yang, L.B. An Optimal Look-ahead Control Strategy for Hybrid Energy Storage System Based on Wind Power Prediction. Autom. Electr. Power Syst. 2015, 39, 58–65. [Google Scholar]
  14. Yan, H.; Li, X.J.; Ma, X.F.; Hui, D. Wind Power Output Schedule Tracking Control Method of Energy Storage System Based on Ultra-Short Term Wind Power Prediction. Power Syst. Technol. 2015, 39, 432–439. [Google Scholar]
  15. Yuan, Y.W. Research on Hybrid Energy Storage Control Strategy Based on Ultra-short-time Wind Power Prediction; North China Electric Power University: Beijing, China, 2017. [Google Scholar]
  16. Li, B.; Deng, Y.X.; Chen, B. Advanced Rolling Optimization Control Strategy for Wind Storage System With Enhanced Ultra-short-term Wind Power Prediction. Power Syst. Technol. 2021, 45, 2280–2287. [Google Scholar]
  17. Zhang, Y.; Han, P.; Wang, D.F.; Wang, S. Short-term prediction of wind speed for wind farm based on variational mode decomposition and LSSVM model. Acta Energ. Sol. Sin. 2018, 39, 194–202. [Google Scholar]
  18. Sun, Y.; Zhang, G.; Tang, X.; Jia, D.; Cao, Z. Research on MPC and daul energy storage control strategies with wind power fluctuation mitigation. Trans. China Electrotech. Soc. 2019, 34, 571–578. [Google Scholar]
  19. Wu, J.; Ding, M. Wind power fluctuation smoothing strategy of hybrid energy storage system using self-adaptive wavelet packet decomposition. Autom. Electr. Power Syst. 2017, 41, 7–12. [Google Scholar]
  20. Yan, Y.; Zhang, C.; Li, K.; Tian, C.; Wang, F. An active control strategy for composited energy storage with compressed air energy storage in micro-grid. Trans. China Electrotech. Soc. 2017, 32, 231–240. [Google Scholar]
  21. Han, T.W.; Chen, X.; Liu, Q.X. Short-Term Load Forecasting for Distribution Network in The Presence of TOU Price Based on Long-Short-Term Memory Network. J. Northeast. Electr. Power Univ. 2020, 40, 19–28. [Google Scholar]
  22. Zhao, Q.; Chen, F.F.; Gan, L. Wind power prediction based on support vector machine trained by improved particle swarm optimization. Electr. Eng. 2020, 21, 12–16. [Google Scholar]
  23. Cong, Y.; Li, X.F.; Yuan, S. A Multi-Periods Active Power Dispatch Method for Wind Farms Based on Improved GA Algorithm. Power Syst. Clean Energy 2021, 38, 107–114. [Google Scholar]
Figure 1. Flowchart of GA-SVR prediction model.
Energies 16 02079 g001
Figure 3. Block diagram of wind-storage cogeneration system.
Energies 16 02079 g003
Figure 4. Structure diagram of the limiting control layer.
Energies 16 02079 g004
Figure 5. Coordination control layer structure diagram.
Energies 16 02079 g005
Figure 6. Comparison of prediction errors of each method.
Energies 16 02079 g006
Figure 7. SOC curve of each energy storage element before control.
Energies 16 02079 g007
Figure 8. Comparison of battery SOC before and after control.
Energies 16 02079 g008
Figure 9. SOC comparison of supercapacitor before and after control.
Energies 16 02079 g009
Figure 10. Comparison of battery charge and discharge power curves before and after control.
Energies 16 02079 g010
Figure 11. Comparison of charge and discharge power curves of supercapacitors before and after control.
Energies 16 02079 g011
Figure 12. Wind power stabilization effect without stratified control.
Energies 16 02079 g012
Figure 13. Wind power stabilization effect after stratified control.
Energies 16 02079 g013
Table 1. Comparison of evaluation index and training time.
Prediction ModelMAE/MWRMSE/MWDuration/s
GSM-SVR31.590141.6488146
PSO-SVR12.849816.192390
GA-SVR9.631114.743545
Improved GA-SVR9.631114.743527
Table 2. Comparison of stabilization effect index.
IndexGrid-Connected OutputSHTd/min
Accumulator batteryGrid-connected output without hierarchical control0.8571218.5167
Grid-connected output after hierarchical control10
SupercapacitorGrid-connected output without hierarchical control0.965552.7333
Grid-connected output after hierarchical control10
Disclaimer/Publisher’s Note: The statements, opinions and data contained in all publications are solely those of the individual author(s) and contributor(s) and not of MDPI and/or the editor(s). MDPI and/or the editor(s) disclaim responsibility for any injury to people or property resulting from any ideas, methods, instructions or products referred to in the content.

