Article

Techno-Economic Assessment of PV Power Systems to Power a Drinking Water Treatment Plant for an On-Grid Small Rural Community

1
Centro de Energías Renovables y Alternativas (CERA), Escuela Superior Politécnica del Litoral (ESPOL), Km. 30.5 Vía Perimetral, Guayaquil EC90902, Ecuador
2
Computer Engineering Department, Villanova University, Villanova, PA 19085, USA
*
Author to whom correspondence should be addressed.
Energies 2023, 16(4), 2027; https://doi.org/10.3390/en16042027
Submission received: 20 January 2023 / Revised: 13 February 2023 / Accepted: 15 February 2023 / Published: 18 February 2023

Abstract

:
This paper shows the technical–economic assessment of two power systems based on renewable electricity to cover the energy consumption requirements of a drinking water treatment plant in the town of Pile, Ecuador, with a planning horizon of 15 years. A stand-alone and a grid-connected solar PV system were proposed to power this plant, which was designed considering the maximum daily potable water supply condition. This plant operated under two scenarios: (1) 12 h during daylight hours and (2) 24 h. Both schedules were proposed to assess the impact of PV power systems on plant operation. We modeled and optimized a total of four scenarios, where each scenario consisted of one of the proposed PV power systems and the plant with one of its operating schedules. Homer Pro software was used to size and find an optimal solution in each scenario, considering the net present cost (NPC) as the main criterion for optimization. The results showed that the change in the plant operation schedule significantly influenced the parameters of each scenario, such as component sizing, electricity production, initial capital, NPC, and electricity purchase/sale capacity from the plant as a grid power service user to the electric utility company.

1. Introduction

According to World Bank’s statistics, the world population is growing considerably every year [1], and projections indicate that there will be 9.7 billion people living in 2050, approximately two billion more than in 2020 [2]. Currently, 55% of this population lives in urban areas, expected to increase to 68% by 2050 [3]. Urban areas in each country have the most significant infrastructure coverage for social services such as health, education, housing, sewerage, sanitation, clean drinking water, and electricity. However, in many rural areas around the world, all these services are reduced or often non-existent [4], which are reasons for the rural population migrating to the cities in search of significant social and work opportunities. Clean drinking water and electricity supply services are two fundamental requirements for improving the quality of life of rural inhabitants. These areas are of vital interest to developing countries due to the high potential for economic growth linked to food production [5]. Given this, governments, non-governmental organizations, and the scientific community should increase financial and technical efforts to ensure that more rural communities have access to these essential services to achieve the United Nations Sustainable Development Goals, mainly Goal 3: Good Health and Well-Being [6], Goal 6: Clean Water and Sanitation [7], and Goal 7: Affordable and Clean Energy [8].
In the case of clean drinking water, the expansion or creation of water treatment projects in rural areas becomes difficult mainly due to economic and technological constraints in many developing countries [9]. This infrastructure deficiency often forces people to use this vital liquid without prior disinfection and treatment. According to the World Health Organization, about two billion people consume raw water mainly contaminated with stool, transmitting diarrhea, cholera, dysentery, typhoid, and polio [10]. These diseases are caused by intestinal parasites, which mainly affect people in rural areas of low-income countries [11], considering that these can also lead to chronic malnutrition in children [12]. In addition, this issue causes people to incur more medical expenses, reducing their economic capacity. Similarly, in many regions of Latin America, the availability of clean drinking water has decreased due to the considerable increase in the demand for this vital liquid [13]. According to UNICEF, Ecuador still has deficiencies in this type of infrastructure, affecting about 30% of the total population, who do not have access to safe water [14]. In 2015, clean drinking water coverage in this country reached 80.4% [15]. In the province of Manabi, where Pile is located, the clean drinking water coverage reached 64.7%. Given this, the lack of or reduced access to clean drinking water often forces people in rural areas to develop habits that can negatively affect their health, such as drinking untreated water directly from natural sources (wells, lakes, and rivers).
Limited or no access to electricity is another major problem facing rural inhabitants worldwide. According to the World Bank’s statistics, about 82% of the world’s rural population had access to electricity in 2019 [16]. Although electricity coverage reached 97% in Ecuador in 2018 [17], there are still rural communities that have limited access and even do not have this service. These communities present these issues due to their geographic locations in inaccessible sites, the dispersion of homes in these areas, and their considerable distances from the utility grid. Likewise, in the case of the existence of a grid, considerable distances can cause deficiencies or a decrease in the quality of the electricity supply service due to problems such as voltage and frequency instability [18]. Projects for improving or expanding the electrical grid to these areas require high levels of investment, which makes these projects economically unfeasible [18,19].
This paper shows the technical–economic assessment of two power systems based on renewable electricity to cover the energy consumption requirements of a drinking water treatment plant (DWTP) in the town of Pile, Ecuador. The power consumption profile to meet the community’s clean drinking water needs over a 15-year period, including other operating details, was obtained from a plant model developed in the literature [20]. Moreover, the plant’s electrical load was mainly composed of pumping systems and other auxiliary electrical systems. A stand-alone and a grid-connected solar PV system were proposed to power this plant. These systems were proposed due to the considerable solar resource of the area under study. A total of four scenarios were modeled and optimized using Homer Pro software. We have considered that the grid guarantees quality and an adequate electricity supply in the community, considering Pile is connected to the grid. Given this, we have assumed that the plant in the grid-connected scenario does not produce stability problems due to its operation. This DWTP was designed considering the maximum daily potable water supply condition, which occurs with the maximum population growth in the 15th year (445 m3/day). The DWTP operated under two operating scenarios: (1) 12 h during daylight hours and (2) 24 h. Both schedules were proposed to assess the impact of PV power systems on DWTP operation. The 12 h plant operation schedule was considered to take advantage of the solar resource at the site to supply power to the plant from the selected renewable system. This schedule does not indicate that the plant will work 12 h daily from the first year, but that it will work 12 h maximum to meet the community’s clean drinking water requirements in year 15. On the other hand, the 24 h plant operation schedule was considered due to the lower peak power consumption of the plant’s pumping system to meet the same clean drinking water requirement of the community as the 12 h plant operation.

2. State of the Art

Microgrids based on renewable energy can deliver power to plants operating with different drinking water treatment technologies to provide safe drinking water to their communities [21]. Usually, the electricity consumed by treatment plants is obtained from high- or low-voltage transmission grids from large-scale power plants [22], because these are energy-intensive technologies [23]. This section focuses on the electricity supply to a drinking water treatment plant (DWTP) because this technology is suitable for treating the raw water existing in the community studied in this work. This plant technology is based on physical and chemical treatment processes of raw water to eliminate microorganisms [24], considering this is intended to supply water to the local population through water supply systems [25]. The construction of water treatment infrastructure in rural areas is more challenging than in urban centers due to its high costs, including costs related to operation and maintenance, and its limited expansion opportunities [26]. In terms of the energy use of this infrastructure, microgrids can supply the high amounts of electricity that are required in processes related to drinking water treatment, such as water extraction, treatment, storage, and distribution.
The use of electricity from distributed generation (DG) with renewable energy sources can help to significantly reduce the electricity consumption of DWTPs connected to the utility grid. In distant or remote sites, this generation applied to a DWTP also benefits the environment and the improvement of the power quality of electricity service [27]. F. Wang et al. [22] found that a grid-connected storage/PV/wind system was optimal for several DWTPs in the Huili County area, China, indicating that this system reduces long-term electricity utilization costs and can even help energy consumers to cope with electricity price variation risks in the future. S. Bukhary et al. [28] also studied the advantage of using a solar PV system, with and without a battery energy storage system (BESS), in a large-scale DWTP, where they also quantified the net reduction in the carbon emissions of these configurations. The findings were obtained through a rigorous analysis of the energy consumption in each of the plant’s water treatment stages in Colorado River, USA. M. Soshinskaya et al. [21] studied a DWTP that was powered by a grid-connected system with 5.6 MWp PV panels, 8 MW wind turbines, and no BESS in Nieuwegein, Netherlands, where there are high renewable resources (solar–wind). The investment worthiness of this stand-alone renewable system showed a negative value with high excess electricity that should be harnessed, and the authors even mentioned that a 100% renewable system would require a large-capacity BESS, which makes this type of system highly expensive. Similarly, Bukhary et al. [29] modeled the use of a solar PV system with and without a BESS, finding reductions of 950 and 570 tCO2e year−1, respectively, and that this stand-alone solar PV system had a sizing of 15 MW PV panels and 30 MWh of battery capacity. Additionally, the grid-connected system without a BESS covered 60% of the plant’s total load located in the southwestern region of the USA.
One of the main advantages of using grid-connected renewable systems is the possibility of injecting surpluses into the utility grid [30]. The monetary value of these surpluses can reduce the DWTP’s electricity bill payments to electric utility companies [22,25] and improve the quality of electric power services in the area because the plant will use less energy from the local grid. In the case of 100% renewable (off-grid) systems, these require BESSs with considerable capacities, which raise the investment costs of microgrids and, in some cases, may make them unprofitable [21]. A 100% renewable microgrid design must also include additional costs related to infrastructure construction to take advantage of the surplus [31,32]. However, it would be desirable to use BESSs for any on-site water treatment process with renewable DG in areas with limited or no access to the public power grid.

3. Methodology

3.1. Location

The rural community of Pile is located in the coastal region of Ecuador in the province of Manabí, whose coordinates are 1°09′59″ S and 80°50′28″, with an elevation of 70 masl (Figure 1). In 2021, this community had an estimated population of around 1552 people concentrated in an area of 300 m2. It is supplied with water from a 40 m-deep groundwater well, which stores high-alkalinity water. There is no drinking water treatment plant, and according to studies, this raw water contains coliform bacteria, which frequently causes health problems for the inhabitants [33]. Although the community is served by electricity from the grid, this site has problems related to power quality due to the distance between this point of consumption and transmission (or sub-transmission) lines [34].

3.2. Weather Conditions

The rural community of Pile usually has a semi-arid and warm climate, with a moderate rainy season and intense but brief precipitation, and a predominantly dry climate. According to the Köppen–Geiger classification, the climate is hot and arid, belonging to the BWh group [35,36]. In addition, this area (like the rest of Ecuador) has two well-defined seasons: winter (December–May) and summer (June–November). The average monthly temperature varies between 23.3 °C and 25.9 °C. The average annual wind speed is 3.4 m/s. Monthly global horizontal radiation varies between 3.89 and 6.29 kWh/m2, with a minimum value in July and a maximum value in March. Table 1 shows average annual and monthly weather data for the area under study, obtained from the Meteonorm meteorological database [37].

3.3. Description of the DWTP Modeling

The design of a DWTP for the Pile community was presented in [20], where this plant considered an annual increase in clean drinking water demand of 4.9%. Moreover, the plant’s operation was based on the rapid filtration process [38]. In the first year of the DWTP’s operation, it could produce approximately 264 m3 of clean drinking water per day. Considering that the project had a planning horizon of 15 years, the community’s clean drinking water consumption could reach 445 m3/day by year 15. Figure 2 shows the process scheme of the DWTP, which consists of five stages: (1) coagulation: reduction in water turbidity by adding a coagulant; (2) flocculation: blending stage for sediment clustering; (3) sedimentation: sediment removal stage; (4) filtration: water clarification stage; and (5) chlorination: chlorine-dosing stage. In general, the plant operates from a submersible pump that transports the raw water from the groundwater well to the initial storage tank. Next, a dosing pump deposits chemical materials for the coagulation stage. Similarly, the drive pump transports the filtered water to the chlorination stage, while the distribution pump transports this clean drinking water to the storage tanks. In the filtration process, a wash-water pump is responsible for cleaning the filters one hour before beginning the overall drinking water treatment process. The present study analyzed this plant design, considering grid-connected and stand-alone solar PV systems.
Table 2 shows the plant considering two configurations based on the operation schedule (12 and 24 h) with the power consumption of its components. As shown in the table, 12H-DWTP indicates the plant with a maximum daily operation of 12 h from 06:00 a.m. to 06:00 p.m., while 24H-DWTP represents the plant with all-day operation (24 h). Solar radiation flux commonly occurs from 06:00 a.m. to 06:00 p.m. in the area under study. Additional power consumption, such as lighting circuits and control systems, were considered in “Others”. The components of each plant configuration were sized considering the highest hourly clean drinking water demand, which was obtained in the last year of the planning horizon, reaching a maximum capacity of 37.1 m3/h for the 12H-DWTP and 18.5 m3/h for the 24H-DWTP.
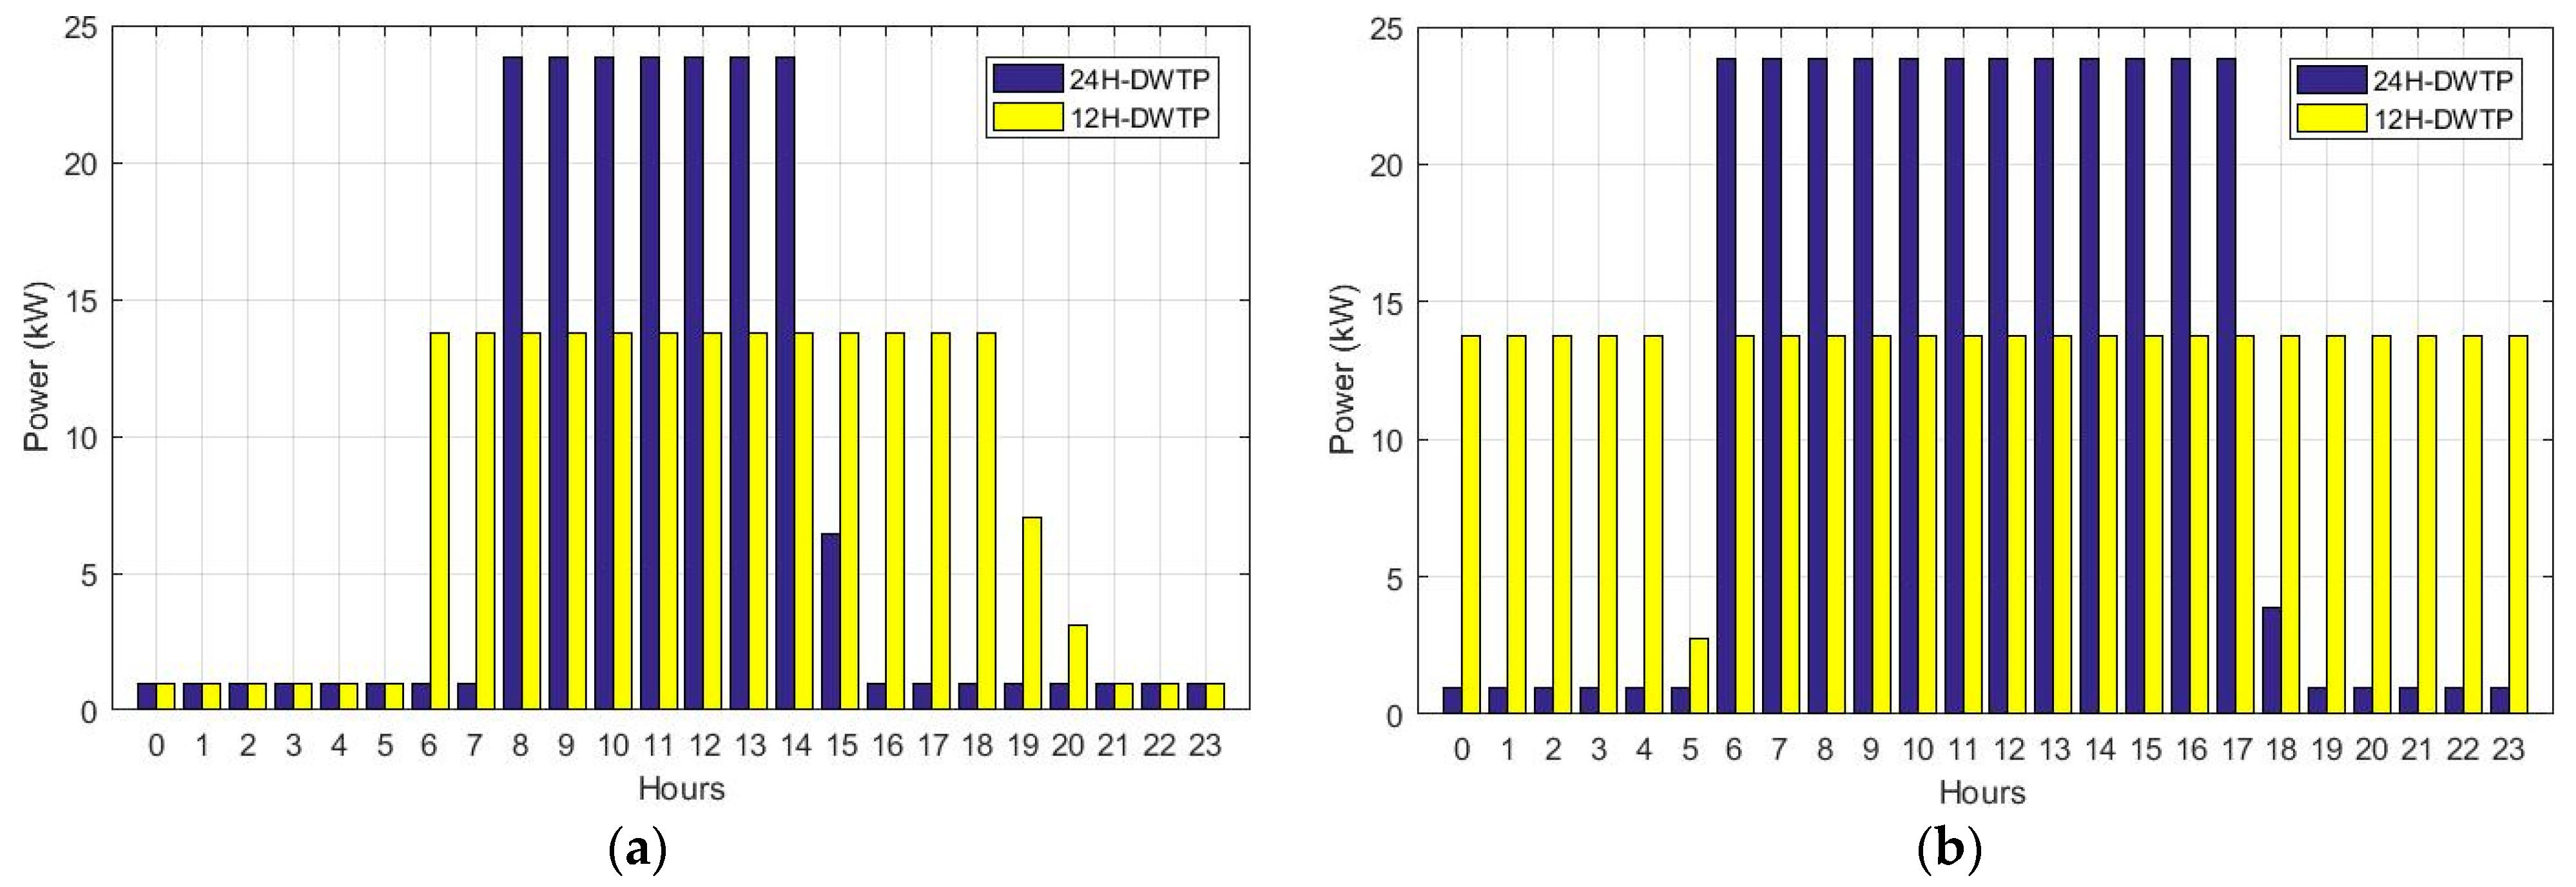
Figure 3 shows the plant’s power consumption on a typical day in years 1 and 15, considering the 12H-DWTP and 24H-DWTP configurations. As can be seen in Figure 3a, the 24H-DWTP operated fewer hours daily due to the lower demand for clean drinking water from the community during the first year of operation. This was similar for the 12H-DWTP. In the case of year 15 (Figure 3b), both configurations operated at maximum clean drinking water supply conditions.
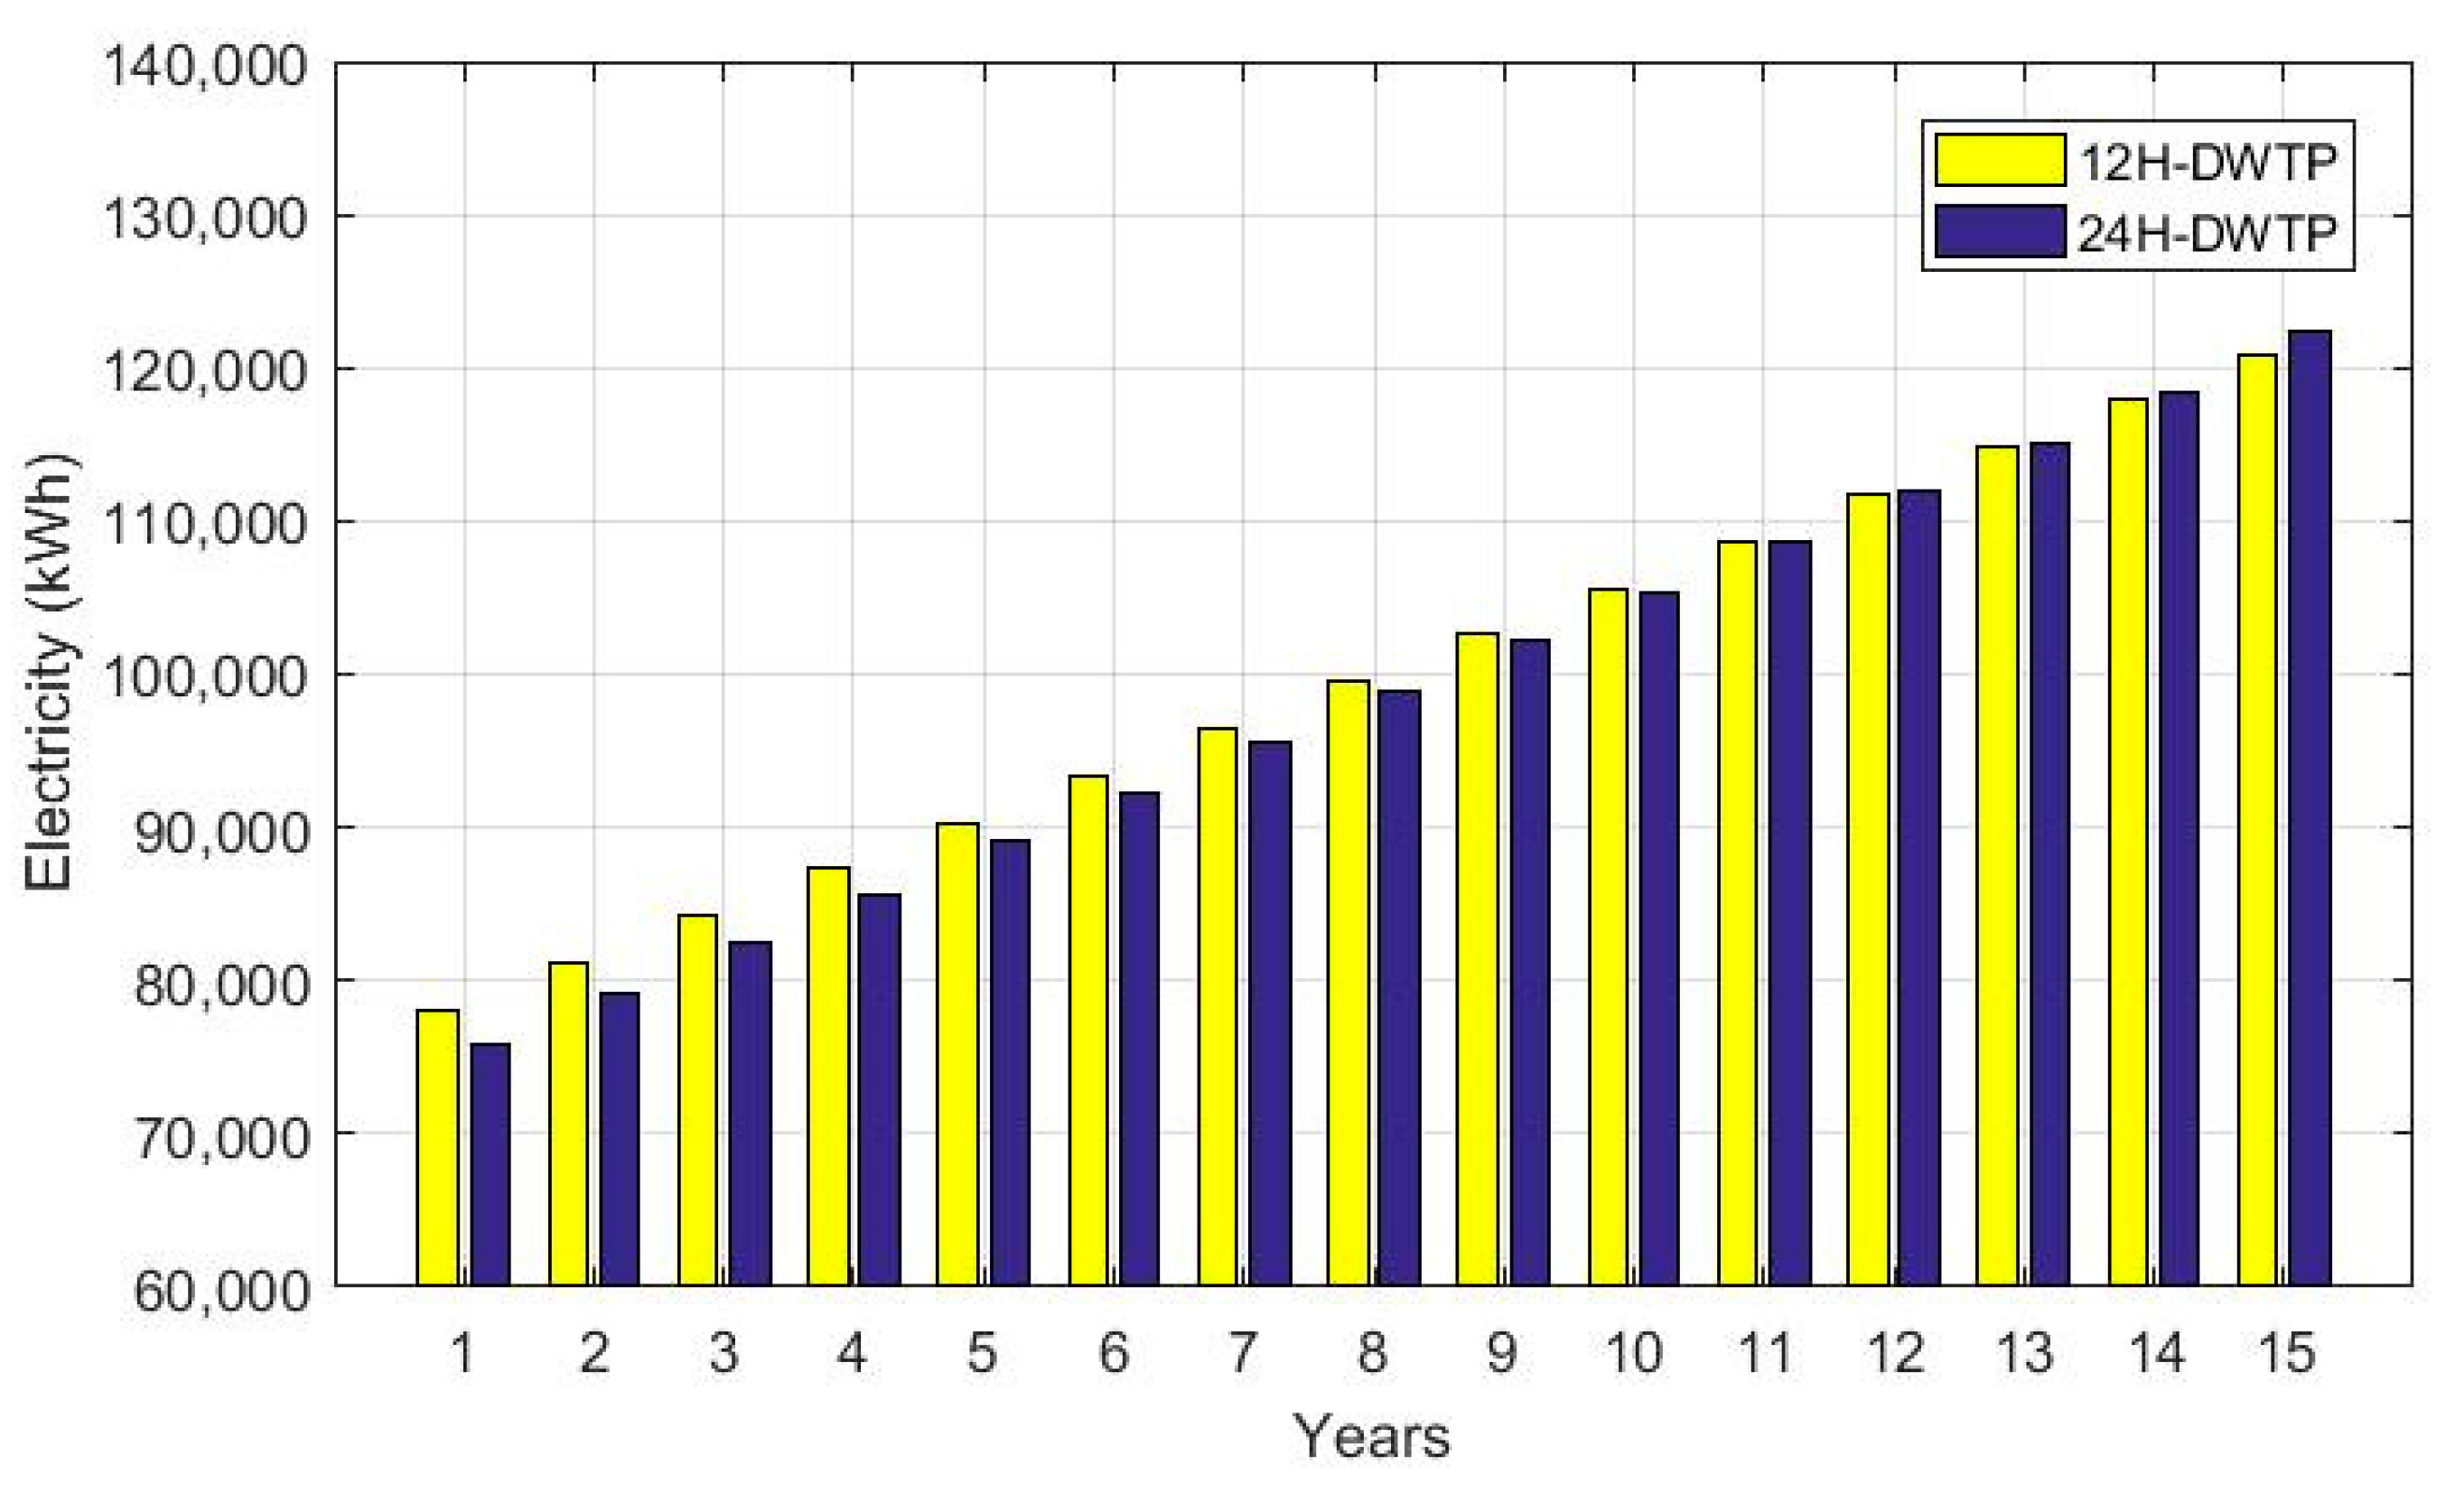
Figure 4 shows the electricity requirements of the configurations, 12H-DWTP and 24H-DWTP, during the project planning horizon. In the first year, the estimated electricity consumption of the 12H-DWTP was 78,134 kWh, while the 24H-DWTP was estimated at 75,897 kWh. In the case of year 15, the energy consumptions of both configurations were estimated at 120,919 kWh and 122,372 kWh, respectively.

3.4. Topology and Design Principle of the Proposed PV Power Systems (Grid-Connected and Stand-Alone Systems)

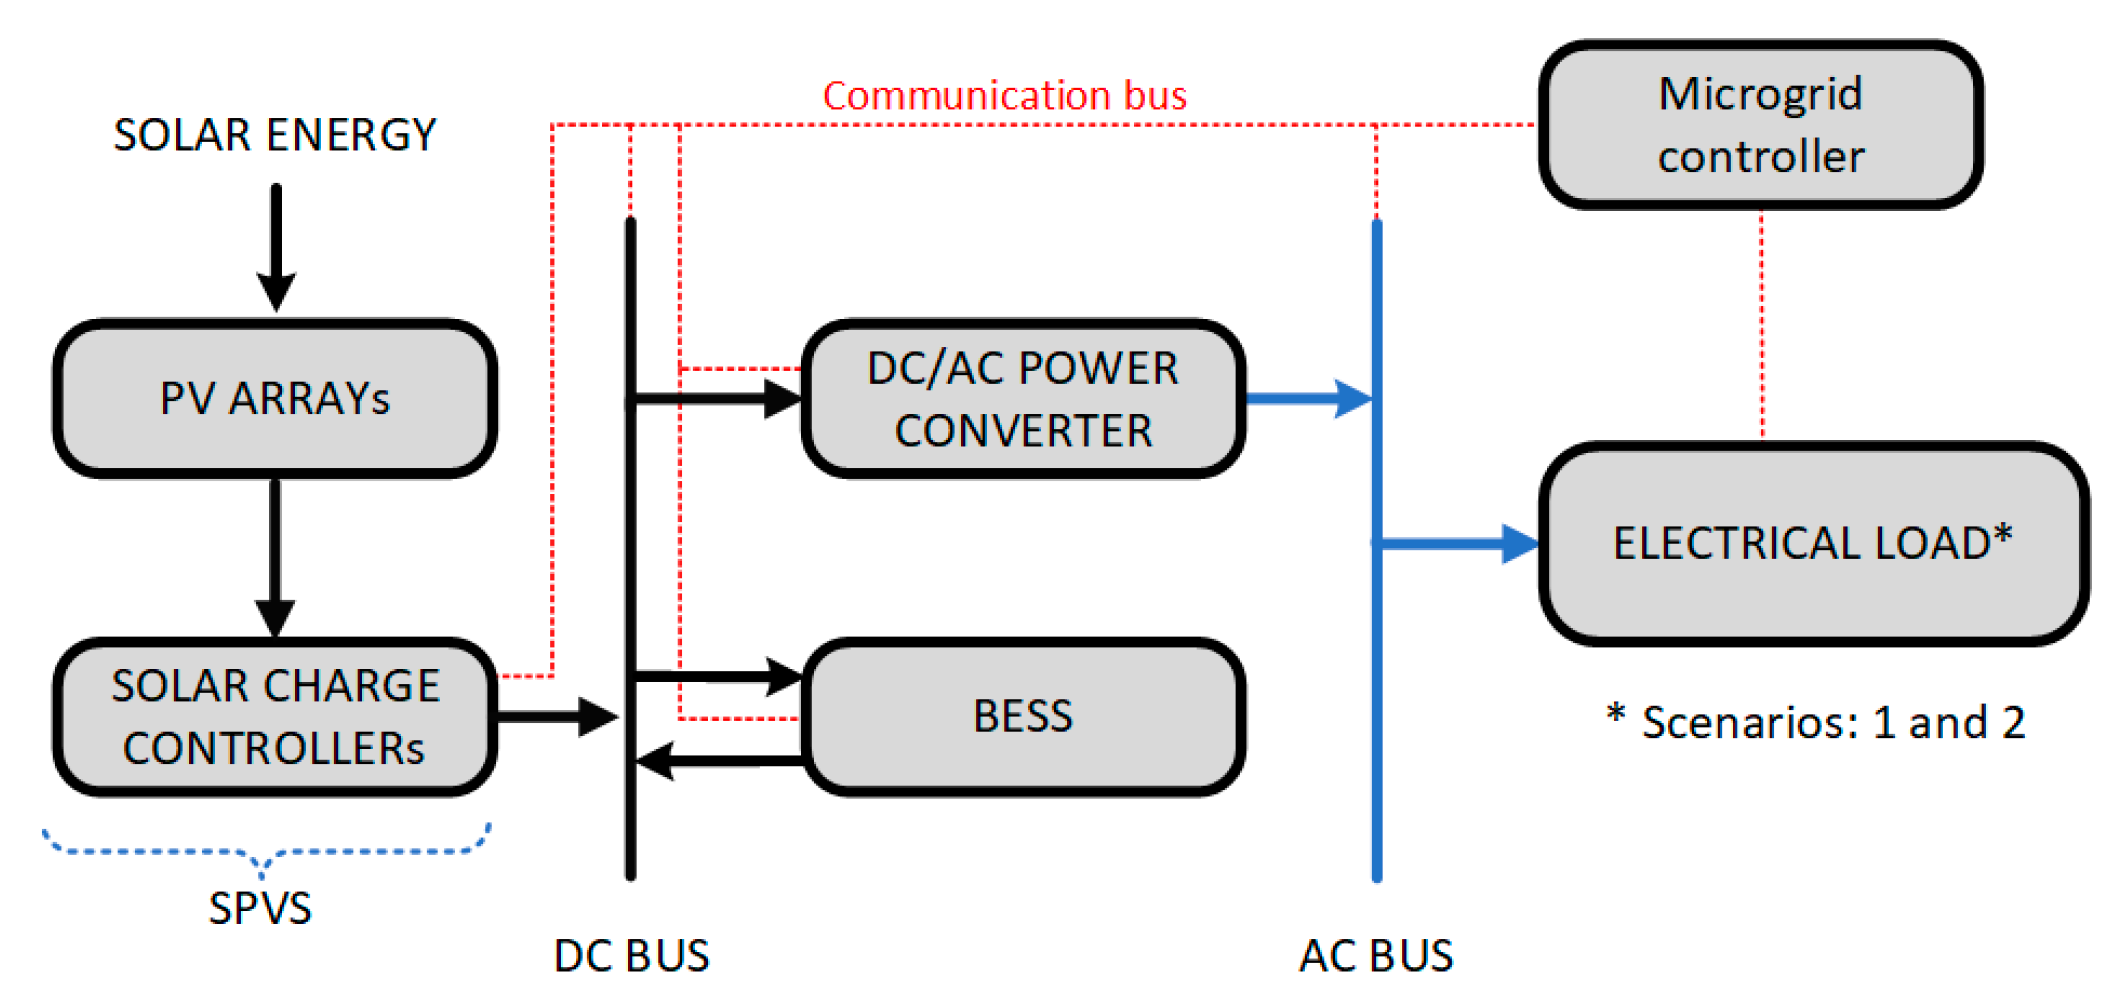
Figure 5 and Figure 6 show the stand-alone and grid-connected solar PV systems that powered the plant in the 12H-DWTP and 24H-DWTP configurations, respectively. We have established the following scenarios to facilitate the analysis of these power systems hereafter:
  • Stand-alone solar PV system supplies power to plant in 12H-DWTP (SPVS12);
  • Stand-alone solar PV system supplies power to plant in 24H-DWTP (SPVS24);
  • Grid-connected solar PV system supplies power to plant in 12H-DWTP (G-SPVS12);
  • Grid-connected solar PV system supplies power to plant in 24H-DWTP (G-SPVS24).
Homer Pro software was the tool used to simulate these scenarios. Figure 5 shows a stand-alone solar PV system consisting of a solar photovoltaic system (SPVS), a BESS, a DC/AC power converter, and solar charge controllers to protect the BESS. Arrays of PV modules comprise an SPVS, and each PV array can have one or several strings of these modules (connected in series/parallel). The input characteristics of the solar charge controller, such as open-circuit voltage and power, restrict these strings. Given this, each PV array must have its respective solar charge controller. Apart from converting DC to AC power and supplying a constant voltage and frequency, the power converter is also responsible for providing or absorbing reactive power in the case of reactive loads [39]. Figure 6 shows a grid-connected solar PV system composed of an SPVS, a DC/AC power converter, and the grid, without considering storage. Both G-SPVS12 and G-SPVS24 worked in a grid-tied mode in the present study [40].

3.5. Modeling Approach

The PV power systems shown in Figure 5 and Figure 6 were modeled and optimized using Homer Pro software [41]. This tool sizes renewable/non-renewable power systems, including the assessment of their net present cost (or life-cycle cost) [42,43]. Some of the equations used by Homer Pro are presented below.

3.5.1. Power Output from Solar PV System

The output power of the SPVS, considering the effect of temperature on the PV modules, is given by the following:
P out   PVarray = Yf   G T G T , STC ( 1 + α p ( T c - T c , STC ) )
where Y is the nominal capacity of the SPVS (power output under Standard Test Conditions—STC); f is the derating factor of the SPVS; G T is the incident radiation in the current time step (kW/m2); G T , STC is the irradiation under STC (1 kW/m2); α p is the temperature coefficient of power (%/°C); T c is the cell temperature of the PV modules (°C); and T c , STC is the temperature of the PV modules under STC (25°C).

3.5.2. Discharge/Charge Process of the BESS

The battery model used by Homer allows for defining parameters such as BESS costs, lifetime, and state of charge (SoC), among others. This model separates the energy available for electricity generation from the bounded energy that cannot be used. Given this, the model is a two-tank system. The BESS can discharge its maximum amount of power at each time step ( Δ t ) according to the following equation:
P BESS , dmax , kbm = η BESS , dmax -   kcQ max + kcQ 1 e - k Δ t + Qkc   1   -   e -   k Δ t 1   -   e -   k Δ t + c   k Δ t   -   1 + e -   k Δ t ,
where Q1 is the available energy in the BESS at the beginning of the Δ t (kWh); Q is the total amount of energy in the BESS at the beginning of the Δ t (kWh); Q max is the total capacity of the BESS (kWh); c is the BESS capacity ratio (unitless); k is the BESS rate constant (h−1); and η BESS , dmax is the BESS discharge efficiency.
The BESS’s maximum charge power ( P BESS , mcp ) results in the minimization of three expressions: the maximum amount of power that is absorbed ( P BESS , cmax , kbm ), the maximum charge rate ( P BESS , cmax , mcr ), and the maximum charge current ( P BESS , cmax , mcc ). These expressions are given as follows:
P BESS , cmax , kbm = kQ 1 e - k Δ t + Qkc   1   -   e -   k Δ t 1   -   e -   k Δ t + c   k Δ t   -   1 + e -   k Δ t ,
P BESS , cmax , mcr = 1   -   e -   α Δ t   ( Q max   -   Q ) Δ t ,
P BESS , cmax , mcc = N BESS I max V nom 1000 ,
P BESS , mcp = MIN   ( P BESS , cmax , kbm ,   P BESS , cmax , mcr ,   P BESS , cmax , mcc ) η B E S S , c ,
where α is the BESS’s maximum charge rate (A/Ah), NBESS is the number of batteries in the BESS, Imax is the BESS’s maximum charge current (A), Vnom is the BESS’s nominal voltage (V), and ηBESS,c is the storage charge efficiency.

3.5.3. Net Present Cost (NPC)

The NPC of a power system is the present value of all the system’s costs incurred over its planning horizon, minus the present value of all the revenue it earns over its horizon [41]. The optimal power system is chosen according to the lowest NPC of all optimized system scenarios [44]. It is given by the equation:
NPC = [ i   1 + i N   -   1 ]   C ann , tot 1   -   1 + i N ,
where i is the real discount rate, N is the number of years of the planning horizon, and C ann , tot is the total annualized cost of all the system components. The latter is given by:
C ann , tot = C ann , cap + C ann , rep + C ann , O & M   -   R ann , salv ,
where C ann , cap is the annualized capital cost, C ann , rep is the replacement cost, C ann , O & M is the cost of operation and maintenance, and R ann , salv represents the annualized total salvage value.

3.5.4. Levelized Cost of Energy (LCOE)

To calculate the LCOE, the software divides C ann , tot for the total electric load served ( E TELS ), using the following expression:
LCOE = C ann , tot E TELS ,

3.5.5. Renewable Fraction (RF)

The RF is the fraction of the energy delivered to the load that originated from renewable energy sources. It is calculated through the following equation:
RF = 1 - E nrs E TELS ,
where E nrs is the annual energy produced by non-renewable resources.

3.6. Components of PV Power Systems

Table 3 shows the costs and the technical details obtained from datasheets of the different components used in the PV power systems (Figure 5 and Figure 6). The costs of each component were estimated according to the Ecuadorian market. In the present simulations, the interest rate for the calculations was 6%, with a planning horizon of 15 years, considering the replacement cost of each component was the same value as its capital cost. Moreover, each PV power system considered fixed costs.
Table 4 shows the energy costs according to the daily schedule in the community obtained from the Ecuadorian Electricity Company [49]. Moreover, this region’s demand rate for national grid customers was USD 2.62/kW per month. In Ecuador, the electricity sale prices from renewable power systems to the grid are the same as the purchase prices, as shown in the table [50,51].

4. Results

This section shows the analysis, optimization, and simulation of the SPVS12, SPVS24, G-SPVS12, and G-SPVS24 scenarios, as shown in Section 3.4. Each scenario was sized according to the maximum volume of potable water supplied by the plant in the last year of the planning horizon. In addition, these scenarios considered component costs such as initial capital, operation and maintenance, and replacement.

4.1. Stand-Alone Solar PV Systems: SPVS12 and SPVS24 Scenarios

SPVS12 and SPVS24 are scenarios with a 100% renewable power system to power the plant considering its operation schedule, as shown in Figure 5. The range of SPVSs tested for each scenario was from 100 to 200 kW. This section presents the results of the optimal scenarios.
In terms of sizing and operation, the SPVS12 had an SPVS of 138 kWp with an average annual electricity production of 212,211 kWh and a maximum output power of 132 kW. The number of PV modules required for the SPVS was 307, requiring 11 MPPT solar charge controllers (each of 13 kW) and a BESS with 90 batteries connected in series, resulting in a DC-bus voltage of 180 V. The BESS’s nominal capacity was 550 kWh with an autonomy of about 35 h. The power converter with a nominal capacity of 30 kW provided a maximum output of 25.7 kW and an average output of 11.4 kW/day. In the case of the SPVS24, it had an SPVS of 144 kWp with an average annual electricity production of 221,669 kWh and a maximum power output of 138 kW. The number of PV modules required for the SPVS was 320, requiring nine MPPT solar charge controllers (each of 16.5 kW) and a BESS with 120 batteries connected in series, resulting in a DC-bus voltage of 240 V. The BESS’s nominal capacity was 696 kWh with an autonomy of about 45 h. The power converter with a nominal capacity of 20 kW provided a maximum output of 14.5 kW and an average output of 11.3 kW/day.
Figure 7 shows how the electricity produced annually by the SPVS in each scenario was distributed to the load (DWTP) and to the BESS, including its excess. Figure 7a shows this distribution for the SPVS12, where the load was completely covered with electricity from the SPVS and BESS, but the average annual excess was 105,688 kWh. Similarly, this average excess was 110,902 kWh for the SPVS24 (Figure 7b). This last figure shows how the BESS required more electricity for its charging process in the SPVS24 than in the SPVS12 because the plant obtained power from this storage system during nighttime hours. However, the plant did not use its pumping systems before 06:00 am and after 5:00 pm in the SPVS12. Given this, the plant made minimal use of its storage system in the SPVS12. Similarly, considering the SPVS24, its BESS required 52,441 kWh of average annual electricity for its charging process, while the SPVS12 required 19,039 kWh. For this reason, the SPVS12’s storage system doubled its lifetime concerning the BESS of SPVS24.
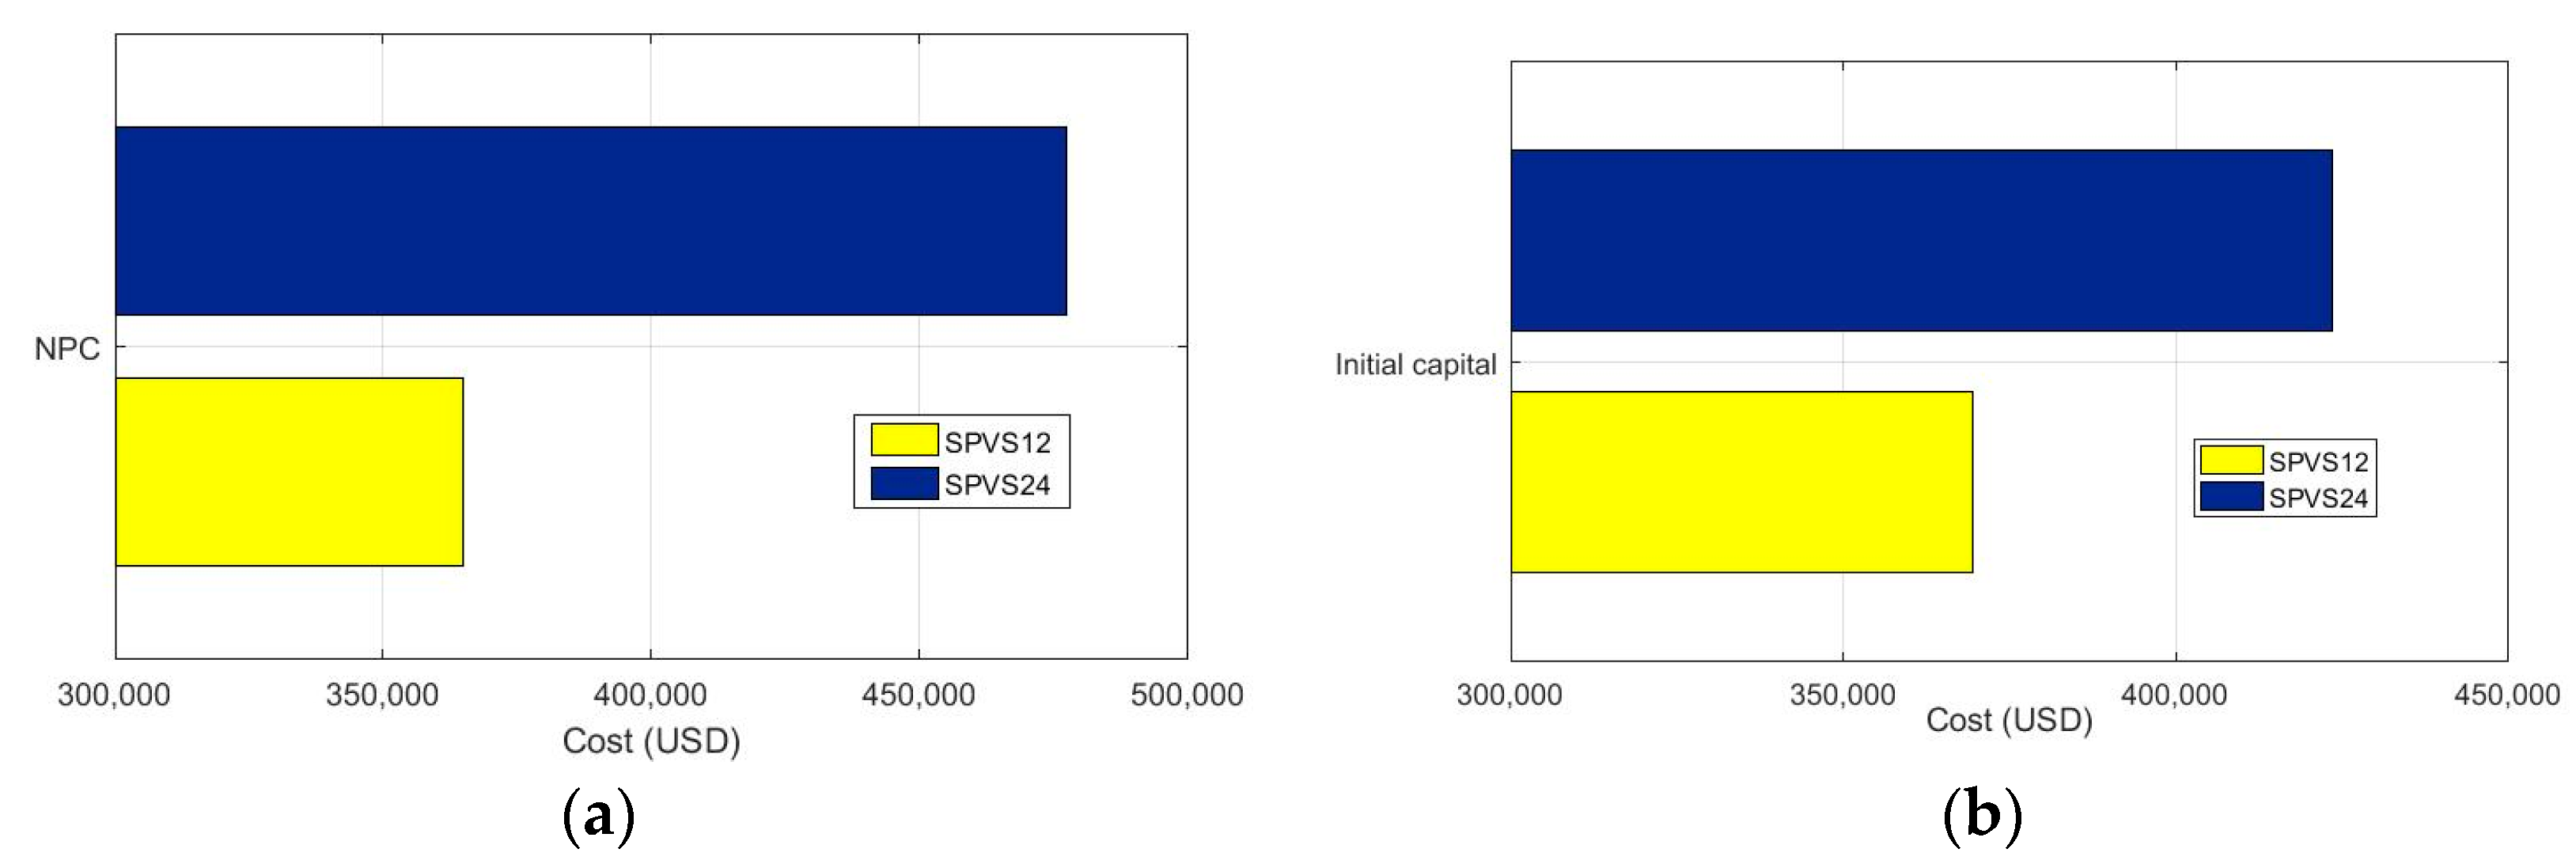
Figure 8 shows the costs to determine the return on investment for the scenarios (1 and 2) under analysis. Figure 8a shows how the SPVS12 decreased its NPC by 23.6% from the USD 477,378.09 accrued by the SPVS24. The smaller size of the BESS in the SPVS12 caused this cost reduction. Similarly, the SPVS12’s initial capital was 12.7% lower than the SPVS24’s value. The COE was USD 0.384/kWh for the SPVS12 and USD 0.508/kWh for the SPVS24. It should be noted that the NPC considers all costs (capital, replacement, operation and maintenance, and salvage) of each component of a scenario.
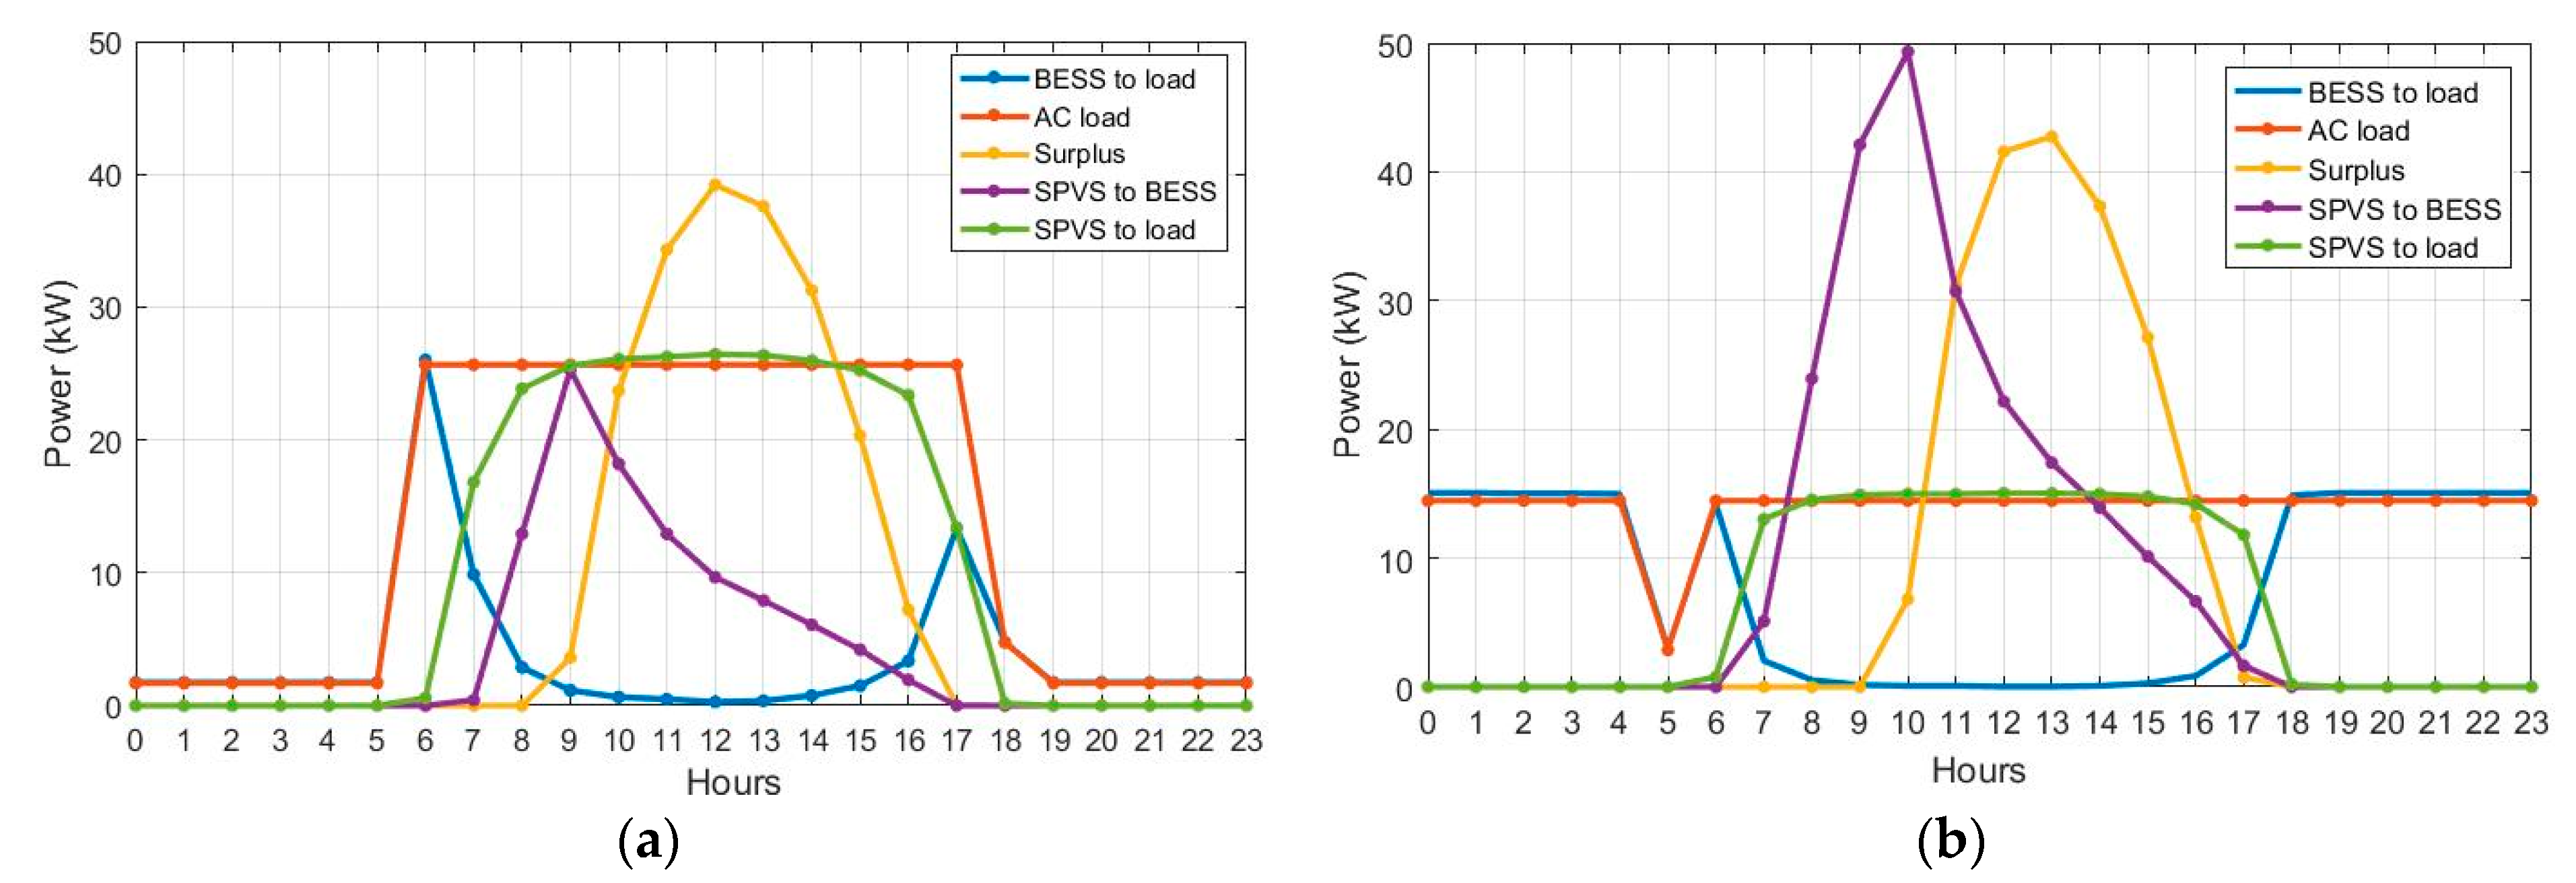
It is also interesting to know how the scenarios behaved in the last year of the planning horizon of the project. Figure 9 shows the average hourly power distribution in each scenario among SPVS, BESS, and load (DWTP). Figure 9a shows how the DWTP received power from the SPVS and the BESS in the SPVS12. The BESS frequently delivered power from 06:00 a.m. to 09:00 a.m. and again between 3:00 p.m. to 6:00 p.m. The smaller loads (“Others” in Table 2) required minimal power consumption from the BESS during the nighttime hours. Between 9:00 a.m. and 3:00 p.m., the SPVS completely covered the power requirement of the plant, but there were still considerable surpluses during these hours, reaching maximum values around 12:00 p.m. This scenario made it possible to take more advantage of the solar resource in the area, considerably reducing the power discharges from the BESS. Figure 9b shows the average hourly power distribution among SPVS, BESS, and load (DWTP) for the SPVS24. Due to the operating schedule of the plant, the BESS supplied power during nighttime hours; therefore, its discharge processes were deeper than the SPVS12, and consequently, its charge processes started from 06:00 a.m. to 06:00 p.m., reaching maximum values at around 10:00 a.m. The SPVS entirely covered the power demand of the plant from 08:00 to 16:00. The power surpluses started from 10:00 a.m. to 4:00 p.m., obtaining maximum values around 01:00 p.m. Due to the sizing of the SPVS in this scenario, the excesses were higher compared to the SPVS12.

4.2. Grid-Connected Solar PV System: G-SPVS12 and G-SPVS24 Scenarios

In the scenarios (3 and 4) analyzed in this section, the DWTP as a company has the role of a grid power service user. For this reason, the plant should monitor the levels of solar power penetration to the load and purchase/sell electricity to/from the electric utility company for both scenarios. According to the simulator control logic, the electricity from the SPVS has priority over the grid to feed the load. It should be noted that purchasing electricity from the grid occurs when the SPVS energy does not cover the entire load, so it needs to extract electricity from the grid to complete the remaining load. The sale of electricity happens when the SPVS electricity covers the load, and any surplus is injected into the grid.
The DWTP in the G-SPVS12 and G-SPVS24 scenarios operated on electricity from an SPVS and the grid, as shown in Figure 6. These scenarios were analyzed considering SPVS sizes between 20 to 60 kW, where the optimum result achieved was 50 kW by each scenario. This SPVS had an average annual electricity production of 76,900 kWh with a maximum output power of 47.9 kW and an average of 8.8 kW/day. The number of PV modules required for its SPVS was 307, where its power converter had a nominal capacity of 50 kW with an average output of 8.4 kW/day.
Figure 10 shows how the load was covered annually with electricity in each scenario from both the SPVS and the grid, including surplus energy for the sale from the SPVS to the grid. The plant in the G-SPVS12 received an annual average of 35,813 kWh from the grid and 66,848 kWh from its SPVS (Figure 10a). In addition, the average annual electricity for sale to the grid was 10,052 kWh. Similarly, the plant in the G-SPVS24 (Figure 10b) received an annual average of 51,881 kWh from the grid and 50,131 kWh from its SPVS, considering that the average annual electricity for sale to the grid was 26,764 kWh. Due to the PV module degradation, the sale of electricity from the SPVS has been reduced over the years. However, the purchase of electricity increased annually for the DWTP for both scenarios.
Figure 11 shows the NPC of scenarios 3 and 4 to determine their return on investment. The G-SPVS12 and G-SPVS24 scenarios had NPC values of USD 149,598.79 and USD 149,176.93, respectively. Both scenarios had a similar NPC value, i.e., this was indifferent to the operating time and size of the plant pumping system in each scenario. Similarly, the initial investment for both scenarios was USD 110,577.78 due to their equal size. In addition, the COE was USD 0.158/kWh for the G-SPVS12 and USD 0.159/kWh for the G-SPVS24.
Similar to the previous section, year 15 was analyzed to show how the G-SPVS12 and G-SPVS24 scenarios delivered their average hourly power magnitudes under maximum community clean drinking water requirements. Figure 12 shows the average hourly power distribution in each scenario among the SPVS, grid, and DWTP. In the G-SPVS12, the plant received 53.4% of its electricity from the SPVS and the remainder from the grid (Figure 12a). During daytime hours, the lowest power demand from the grid coincided with peak solar production. In addition, the total power output of the SPVS did not fully cover the plant’s power requirements. However, the grid received an injection of 8.3% of the total SPVS output. In Figure 12b, the load in the G-SPVS24 received 37.9% of its electricity from SPVS and the remainder from the grid. The nighttime operation of the plant resulted in the higher use of electricity from the grid. Its SPVS covered the load requirements from 10:00 am to 02:00 pm, including the injection of its surplus to the grid. In total, the surplus was 32.9% of the total SPVS production.
Table 5 shows the purchases/sales of electricity from the plant through the grid over 15 years. Annual electricity purchases included the monthly demand rates charged by the utility on the monthly peak demand. In the G-SPVS12, the total values of the purchase and sale of electricity were USD 43,448.67 and USD 8924.38, respectively. The difference between sales and purchases was USD 34,524.29, which represents the total grid cost. However, the total grid cost in the G-SPVS24 was reduced by almost USD 500 concerning G-SPVS12. The electricity sold to the grid reduced the plant’s annual electricity bill with the Ecuadorian electric utility company in both scenarios. In addition, the ability to sell electricity from each scenario decreased each year due to increased clean drinking water consumption and the degradation of the PV modules. The electricity sales never exceeded the purchases in both scenarios, i.e., the plant always had to pay (but at reduced costs) for its electricity supply service from the utility.

5. Discussion

The four scenarios modeled and optimized in this study were technically and economically viable options, given that they can meet the electrical energy needs to operate a DWTP during a planning horizon of 15 years for the Pile community. The results showed that the change in the DWTP operation schedule significantly influenced the parameters of each PV power system, such as component sizing, electricity production, initial capital, NPC, and electricity purchase/sale capacity. In addition, the 12 h plant operation schedule allowed both the SPVS12 and G-SPVS12 scenarios to take advantage of the solar resource in the area, even with an increased BESS lifetime in the SPVS12 and the system’s renewable fraction compared to the SPVS24 and G-SPVS24 scenarios, respectively. The cost of implementing the DWTP was not considered in the simulations and optimizations carried out in the four scenarios analyzed in the present work.

5.1. Comparative Analysis by PV Power System

The sizing of SPVS12 components was smaller than the other proposed stand-alone solar PV system. Given this, the size of the SPVS in the SPVS12 was 138 kWp with a BESS of 90 batteries connected in series, reaching a nominal capacity of 550 kWh. The installed capacity of PV modules in the SPVS24 was 4.3% higher than the SPVS12, also considering an increase of 33.3% in its number of batteries. Due to this, the NPC of the SPVS12 had a 23.6% reduction compared to the renewable system with all-day DWTP operation. This increase in NPC for SPVS24 was primarily due to costs related to the increased use of its BESS. However, both scenarios presented high electricity surpluses from their SPVSs during the planning horizon. The utilization of these surpluses is not within the scope of this work, but in the literature, they can be used for deferrable or dump loads such as auxiliary pumping systems for clean drinking water distribution [52], electrolyzers for green hydrogen production [53], or thermal loads. Adding these options to these proposed scenarios can raise their initial investment costs and NPCs. The technical and economic results of these two scenarios showed that the power system feeding the DWTP in its 12 h daily operation was the better option than the SPVS24. It is important to note that the use of renewable power systems (including BESS) is desirable for on-site drinking water treatment processes in areas with limited or no access to electricity from the grid, considering that this storage system has a considerable economic cost.
According to the modeling and optimization of the two scenarios with grid-connected solar PV power systems, the SPVS was 50 kWp; therefore, the capital cost was the same in both scenarios. Annually, the G-SPVS24 consumed an average of 45% more electricity from the grid and used 25% less electricity from the SPVS to power the DWTP than the G-SPVS12. However, one of the main advantages of using these systems is the possibility of injecting surpluses into the grid. In the G-SPVS12 and G-SPVS24 scenarios, the monetary value of these surpluses reduced their electricity bill for each year. The operating schedule of the DWTP had a significant impact on the ability of these scenarios to sell electricity. Given this, although the G-SPVS24 sold almost three times more electricity to the grid than the G-SPVS12, both scenarios had similar total grid costs over the 15 years of the project, as shown in Table 5. However, the G-SPVS24 had a slightly lower NPC than the G-SPVS12, so the first scenario would be the better choice for implementing a grid-connected PV power system for the DWTP at this location.

5.2. Comparative Analysis among All Scenarios

Figure 13 shows the results related to cost analysis (initial capital, replacement, total grid cost, and NPC) for each PV power system. As shown in this figure, the stand-alone scenarios had higher initial capital and replacement costs than the grid-connected scenarios. Among the four configurations, SPVS24 had the highest NPC (USD 477,378), including initial capital (USD 423,363) and replacement costs (USD 289,280), with a COE of USD 0.384/kWh. The high NPC of this scenario resulted from the implementation of the BESS. The BESS represented 54.7% of the NPC, while the SPVS was 22.8%. On the other hand, the NPC of SPVS12 was reduced by 23.6% compared to SPVS24 and obtained a COE of USD 0.384/kWh. In the case of grid-connected systems, the management of the intermittency of the solar resource is their main advantage because the grid acts similarly to the task of the BESS in stand-alone systems [21]. However, these systems must be disconnected from the grid when their power lines present faults (blackouts and emergencies) [40]. Given this, the G-SPVS12 and G-SPVS24 scenarios did not use battery storage systems, which notably reduced their NPC costs. The NPC had a similar value for both scenarios, and, therefore, this cost reached a reduction of about 74% in initial capital costs and 84% in replacement costs for these scenarios compared to the same costs in the SPVS24. In general terms, the G-SPVS24 had the lowest NPC value of all scenarios analyzed, reaching $149,177. The costs of its power converter and SPVS represented 34.2% and 25.3% of the NPC, respectively. The total grid cost reached a value of USD 34,524, representing 22.8% of the NPC and being lower than that of the G-SPVS12.
Figure 14 shows comparisons among the different scenarios considering the magnitudes of average electricity over the planning horizon, such as SPVS production, surpluses and sales to the grid, purchases from the grid, and electricity delivered by the BESS to the load. As shown in the figure, the stand-alone scenarios obtained higher electricity production from renewable resources than the grid-connected scenarios, i.e., the renewable fraction was 100% in each stand-alone system. The SPVS in SPVS24 produced 221,669 kWh/year, with the highest surplus (110,902 kWh/year). The PV electricity production in the grid-connected scenarios was similar, therefore, the G-SPVS24 (or G-SPVS12) produced around 65% less electricity than the SPVS24. The electricity surpluses from G-SPVS12 and G-SPVS24 were around 13% and 35% of their average annual SPVS production in each scenario, respectively. Consequently, these surpluses were injected into the grid, corresponding to sales to the grid. The average annual electricity surpluses of the 100% renewable power systems were considerably higher than the grid-connected power systems. In the case of the G-SPVS24, it had about 76% fewer surpluses than the SPVS24. In the stand-alone scenarios, the BESS of the SPVS24 showed a higher electricity discharge to cover the load requirements than the SPVS12.

6. Conclusions

This paper shows the technical–economic assessment of two power systems based on renewable electricity to cover the energy consumption requirements of a DWTP in the town of Pile, Ecuador, within a planning horizon of 15 years. A stand-alone and a grid-connected solar PV system were proposed to power this plant, which operated under two scenarios: (1) 12 h during daylight hours and (2) 24 h. Both schedules were proposed to assess the impact of PV power systems on plant operation. We modeled and optimized a total of four scenarios, where each scenario consisted of one of the proposed PV power systems and the plant with one of its operating schedules. Homer Pro software was used to size and find an optimal solution for each scenario, considering the net present cost as the main economic output.
The results of the two 100% renewable scenarios (SPVS12 and SPVS24) showed that the SPVS12 is the most suitable option for application to the DWTP in the Pile community, which was established according to its lower NPC value. The DWTP operating at SPVS24 required a higher storage capacity to cover the load requirements during nighttime. This increased charge/discharge cycling of the storage system also reduced its useful life, resulting in a higher replacement cost for this component. In addition, the SPVS12 and SPVS24 scenarios had high annual electricity surpluses suggesting that deferrable or dump loads should be used. It should be noted that a 100% renewable scenario must consider powering electrical loads at sites without access to or poorly served by grid electricity supply.
In the case of the two grid-connected scenarios, the G-SPVS12 had a higher renewable fraction than the G-SPVS24, i.e., the DWTP received more electricity from the SPVS than the grid, considering that both scenarios had the same SPVS size (50 kW). Unlike stand-alone scenarios, these scenarios can inject surplus electricity into the grid, which can economically help the user (DWTP) by reducing the electricity bill and increasing the power quality of the community’s electric distribution system, among other advantages. The G-SPVS24 sold more electricity to the grid than the G-SPVS12 because the power consumption of the DWTP was exceeded by the power produced by the SPVS, which was frequent during daytime hours. However, the nighttime operation of the DWTP resulted in a more significant purchase of electricity from the grid. Regarding NPC, the G-SPVS24 had a slightly lower value than the G-SPVS12, so the first scenario must be the most suitable solution for implementing a grid-connected renewable power system.
The comparison among all scenarios shows that the change in plant operation schedule substantially influenced economic aspects among the stand-alone systems (SPVS12 and SPVS24). However, this change was almost negligible among the grid-connected systems (G-SPVS12 and G-SPVS24). Given this, G-SPVS24 is the most cost-effective alternative among the four proposed scenarios, while SPVS24 is the most expensive solution. The cost of the BESS was the factor that most affected the NPC in the SPVS12 and SPVS24 scenarios, and in the case of SPVS24, this system had higher usage of the BESS and hence higher replacement costs. However, the plant load profiles have a certain level of uncertainty in each scenario because they were obtained from DWTP modeling, which is a limitation of this work. Therefore, each scenario with its respective sizing may vary in economic results and performance perspectives, considering actual electricity consumption data at the time this location will have a DWTP.
In this paper, we have considered that the grid guarantees quality and an adequate electricity supply in the community. Given this, we have assumed that the plant does not produce stability problems during its operation in grid-connected scenarios. Future work can evaluate the state of the grid and its possible interconnection with distributed systems with renewable generation to choose the most suitable solution for the DWTP. If this interconnection presents problems, the SPVS12 scenario should be the best option to cover the community’s power requirements. In addition, increasing the area of solar panels would not imply a higher penetration of renewable energy in the load in the proposed grid-connected systems. This increase may produce a higher amount of surplus electricity, so the DWTP will have more capacity to sell to the grid.

Author Contributions

Conceptualization, F.A., R.H.-L., K.M., J.U., P.S. and G.S.; methodology, F.A., R.H.-L. and K.M.; software, F.A., R.H.-L. and K.M.; validation, R.H.-L., J.U., P.S. and G.S.; formal analysis, F.A., R.H.-L., K.M. and J.U.; investigation, F.A., R.H.-L., K.M. and J.U.; resources, G.S.; data curation, F.A., R.H.-L., K.M. and J.U.; writing—original draft preparation, R.H.-L.; writing—review and editing, F.A., K.M., J.U., P.S. and G.S.; visualization, R.H.-L.; supervision, P.S. and G.S. All authors have read and agreed to the published version of the manuscript.

Funding

This research received no external funding.

Data Availability Statement

Data sharing is not applicable to this article.

Conflicts of Interest

The authors declare no conflict of interest.

Abbreviations

The following abbreviations are used in this manuscript:
ACAlternating current
BESSBattery energy storage system
DCDirect current
DGDistributed generation
G-SPVS12Grid-connected solar PV system supplies power to plant in 12H-DWTP
G-SPVS24Grid-connected solar PV system supplies power to plant in 24H-DWTP
LCOELevelized Cost of Energy
MPPTMaximum power point tracker
maslMeters above sea level
NPCNet present cost
PVPhotovoltaic
RFRenewable fraction
SPVSSolar photovoltaic system
SPVS12Stand-alone solar PV system supplies power to plant in 12H-DWTP
SPVS24Stand-alone solar PV system supplies power to plant in 24H-DWTP
UNICEFUnited Nations International Children’s Emergency Fund

References

  1. The World Bank. Population, Total. 2022. Available online: https://data.worldbank.org/indicator/SP.POP.TOTL (accessed on 14 March 2022).
  2. United Nations. GLOBAL ISSUES: Population. 2022. Available online: https://www.un.org/en/global-issues/population (accessed on 14 March 2022).
  3. United Nations. 68% of the World Population Projected to Live in Urban Areas by 2050, Says UN. 2018. Available online: https://www.un.org/development/desa/en/news/population/2018-revision-of-world-urbanization-prospects.html (accessed on 14 March 2022).
  4. Ebeke, C.H.; Etoundi, S. The effects of natural resources on urbanization, concentration, and living standards in Africa. World Dev. 2017, 96, 408–417. [Google Scholar] [CrossRef]
  5. United Nations. Las Zonas Rurales Son Clave Para El Crecimiento Económico de los Países en Desarrollo, Dice la FAO. 2017. Available online: https://www.un.org/sustainabledevelopment/es/2017/10/las-zonas-rurales-son-clave-para-el-crecimiento-economico-de-los-paises-en-desarrollo-dice-la-fao/ (accessed on 14 March 2022).
  6. United Nations. Goal 3: Ensure Healthy Lives and Promote Well-Being for All At All Ages. 2022. Available online: https://www.un.org/sustainabledevelopment/health/ (accessed on 8 October 2022).
  7. United Nations. Goal 6: Ensure Access to Water and Sanitation for All. 2022. Available online: https://www.un.org/sustainabledevelopment/water-and-sanitation/ (accessed on 8 October 2022).
  8. United Nations. Goal 7: Ensure Access to Affordable, Reliable, Sustainable and Modern Energy. 2022. Available online: https://www.un.org/sustainabledevelopment/energy/ (accessed on 8 October 2022).
  9. Yousefi, M.; Ghalehaskar, S.; Asghari, F.B.; Ghaderpoury, A.; Dehghani, M.H.; Ghaderpoori, M.; Mohammadi, A.A. Distribution of fluoride contamination in drinking water resources and health risk assessment using geographic information system, northwest Iran. Regul. Toxicol. Pharmacol. 2019, 107, 104408. [Google Scholar] [CrossRef]
  10. World Health Organization. Drinking-Water. Available online: https://www.who.int/news-room/fact-sheets/detail/drinking-water (accessed on 14 February 2023).
  11. Ribas, A.; Jollivet, C.; Morand, S.; Thongmalayvong, B.; Somphavong, S.; Siew, C.-C.; Ting, P.-J.; Suputtamongkol, S.; Saensombath, V.; Sanguankiat, S. Intestinal parasitic infections and environmental water contamination in a rural village of northern Lao PDR. Korean J. Parasitol. 2017, 55, 523. [Google Scholar] [CrossRef] [Green Version]
  12. Unicef Ecuador. Combatir la Desnutrición a Través del acceso a Agua Segura. 2020. Available online: https://www.unicef.org/ecuador/historias/combatir-la-desnutrición-través-del-acceso-agua-segura#:~:text=Además del agua potable y,para su edad y estar (accessed on 10 December 2022).
  13. Kumar, R.; Patel, M.; Singh, P.; Bundschuh, J.; Pittman Jr, C.U.; Trakal, L.; Mohan, D. Emerging technologies for arsenic removal from drinking water in rural and peri-urban areas: Methods, experience from, and options for Latin America. Sci. Total Environ. 2019, 694, 133427. [Google Scholar] [CrossRef]
  14. Unicef Ecuador. UNICEF Ecuador Desarrolla Intervenciones Para Que Cada Niño, Niña y Adolescente Acceda a Servicios de Agua, Saneamiento e Higiene de Calidad. 2017. Available online: https://www.unicef.org/ecuador/acceso-agua-saneamiento-e-higiene (accessed on 10 December 2022).
  15. Banco de Desarrollo del Ecuador. Cierre de Brechas en la Cobertura de Agua Potable y Alcantarillado Sanitario Período 2007–2015, Quito, Ecuador. 2017. Available online: https://sni.gob.ec/documents/10180/4534845/Brechas+Saneamiento+Ambiental.pdf/b2ed65ef-520b-4847-bb44-9e610da4c048 (accessed on 10 December 2022).
  16. The World Bank. Access to Electricity, Rural (% of Rural Population). 2019. Available online: https://data.worldbank.org/indicator/EG.ELC.ACCS.RU.ZS (accessed on 16 March 2022).
  17. Ministerio de Energía y Recursos Naturales No Renovables. Plan Maestro de Electricidad: Transformación y Situación Actual del Sector Eléctrico. 2020. Available online: https://www.cnelep.gob.ec/wp-content/uploads/2020/01/Plan-Maestro-de-Electricidad-2018-2027.pdf (accessed on 10 December 2022).
  18. Lin, W.; Xia, R.; He, D.; Harley, R.G.; Habetler, T.G. The impact of demand response on rural island power system operation. In Proceedings of the 2013 IEEE Power & Energy Society General Meeting, Vancouver, BC, Canada, 21–25 July 2013; IEEE: Piscataway, NJ, USA, 2013; pp. 1–5. [Google Scholar]
  19. Zhai, M.; Liu, Y.; Zhang, T.; Zhang, Y. Robust model predictive control for energy management of isolated microgrids. In Proceedings of the 2017 IEEE International Conference on Industrial Engineering and Engineering Management (IEEM), Singapore, 10–13 December 2017; IEEE: Piscataway, NJ, USA, 2017; pp. 2049–2053. [Google Scholar]
  20. Muñoz, K.; Amoroso, F. Diseño de una Planta Potabilizadora de Agua Abastecida Por Energía Solar. Bachelor’s Thesis, Undergraduate Dissertation, ESPOL, Guayaquil, Ecuador, 2021. [Google Scholar]
  21. Soshinskaya, M.; Crijns-Graus, W.H.J.; van der Meer, J.; Guerrero, J.M. Application of a microgrid with renewables for a water treatment plant. Appl. Energy 2014, 134, 20–34. [Google Scholar] [CrossRef] [Green Version]
  22. Wang, F.; Xu, J.; Liu, L.; Yin, G.; Wang, J.; Yan, J. Optimal design and operation of hybrid renewable energy system for drinking water treatment. Energy 2021, 219, 119673. [Google Scholar] [CrossRef]
  23. Ravindiran, G.; Saravanan, P.; Jeyaraju, R.M.; Josephraj, J. Water—Conventional and novel treatment methods. In Solar-Driven Water Treatment; Elsevier: Amsterdam, The Netherlands, 2022; pp. 37–66. [Google Scholar]
  24. Chen, L.; Deng, Y.; Dong, S.; Wang, H.; Li, P.; Zhang, H.; Chu, W. The occurrence and control of waterborne viruses in drinking water treatment: A review. Chemosphere 2021, 281, 130728. [Google Scholar] [CrossRef] [PubMed]
  25. Xu, L.; Ouyang, W.; Qian, Y.; Su, C.; Su, J.; Chen, H. High-throughput profiling of antibiotic resistance genes in drinking water treatment plants and distribution systems. Environ. Pollut. 2016, 213, 119–126. [Google Scholar] [CrossRef] [PubMed]
  26. Du, X.; Zhao, W.; Wang, Z.; Ma, R.; Luo, Y.; Wang, Z.; Sun, Q.; Liang, H. Rural drinking water treatment system combining solar-powered electrocoagulation and a gravity-driven ceramic membrane bioreactor. Sep. Purif. Technol. 2021, 276, 119383. [Google Scholar] [CrossRef]
  27. United States Environmental Protection Agency. Distributed Generation of Electricity and Its Environmental Impacts. 2022. Available online: https://www.epa.gov/energy/distributed-generation-electricity-and-its-environmental-impacts#:~:text=Distributed generation can benefit the,environmental impacts of centralized generation (accessed on 10 December 2022).
  28. Bukhary, S.; Batista, J.; Ahmad, S. Water-energy-carbon nexus approach for sustainable large-scale drinking water treatment operation. J. Hydrol. 2020, 587, 124953. [Google Scholar] [CrossRef]
  29. Bukhary, S.; Batista, J.; Ahmad, S. An analysis of energy consumption and the use of renewables for a small drinking water treatment plant. Water 2019, 12, 28. [Google Scholar] [CrossRef] [Green Version]
  30. Rodriguez, M.; Espin, V.; Arcos-Aviles, D.; Martinez, W. Energy management system for an isolated microgrid based on Fuzzy logic control and meta-heuristic algorithms. In Proceedings of the 2022 IEEE 31st International Symposium on Industrial Electronics (ISIE), Anchorage, AK, USA, 1–3 June 2022; IEEE: Piscataway, NJ, USA, 2022; pp. 462–467. [Google Scholar]
  31. Hidalgo-Leon, R.; Amoroso, F.; Urquizo, J.; Villavicencio, V.; Torres, M.; Singh, P.; Soriano, G. Feasibility Study for Off-Grid Hybrid Power Systems Considering an Energy Efficiency Initiative for an Island in Ecuador. Energies 2022, 15, 1776. [Google Scholar] [CrossRef]
  32. Hidalgo-Leon, R.; Amoroso, F.; Litardo, J.; Urquizo, J.; Torres, M.; Singh, P.; Soriano, G. Impact of the Reduction of Diesel Fuel Subsidy in the Design of an Off-Grid Hybrid Power System: A Case Study of the Bellavista Community in Ecuador. Energies 2021, 14, 1730. [Google Scholar] [CrossRef]
  33. Macias, L. Memoria técnica de los estudios y diseños para el mejoramiento del sistema de agua potable para la localidad de Pile, Cantón Montecriti; Pile, Manabi; 2010. [Google Scholar]
  34. Rodríguez-Gámez, M.; Vázquez-Pérez, A.; Vélez-Quiroz, A.M.; Saltos-Arauz, W.M. Mejora de la calidad de la energía con sistemas fotovoltaicos en las zonas rurales. Rev. Científica 2018, 265–274. [Google Scholar] [CrossRef]
  35. Peel, M.C.; Finlayson, B.L.; McMahon, T.A. Updated world map of the Köppen-Geiger climate classification. Hydrol. Earth Syst. Sci. 2007, 11, 1633–1644. [Google Scholar] [CrossRef] [Green Version]
  36. Beck, H.E.; Zimmermann, N.E.; McVicar, T.R.; Vergopolan, N.; Berg, A.; Wood, E.F. Present and future Köppen-Geiger climate classification maps at 1-km resolution. Sci. Data 2018, 5, 1–12. [Google Scholar] [CrossRef] [Green Version]
  37. CERA-ESPOL. Weather Parameters of Pile Community; Pile Community. 2022. Available online: https://meteonorm.com/en/ (accessed on 10 December 2022).
  38. CPE INEN 5, N.T.E. Normas Para Estudio Y Diseño De Sistemas De Agua Potable Y Disposición De Aguas Residuales Para 1992, 291. Available online: https://www.normalizacion.gob.ec/buzon/normas/cpe_inen_5%20Parte_9-1.pdf (accessed on 15 November 2022).
  39. Nwaigwe, K.N.; Mutabilwa, P.; Dintwa, E. An overview of solar power (PV systems) integration into electricity grids. Mater. Sci. Energy Technol. 2019, 2, 629–633. [Google Scholar] [CrossRef]
  40. Mohanty, P.; Sharma, K.R.; Gujar, M.; Kolhe, M.; Azmi, A.N. PV System Design for Off-Grid Applications; Springer: Cham, Switzerland, 2016; Volume 196, ISBN 9783319146638. [Google Scholar]
  41. Homer Energy. Net Present Cost. Available online: https://www.homerenergy.com/products/pro/docs/latest/net_present_cost.html (accessed on 9 October 2022).
  42. Petrillo, A.; De Felice, F.; Jannelli, E.; Autorino, C.; Minutillo, M.; Lavadera, A.L. Life cycle assessment (LCA) and life cycle cost (LCC) analysis model for a stand-alone hybrid renewable energy system. Renew. Energy 2016, 95, 337–355. [Google Scholar] [CrossRef]
  43. Oulis Rousis, A.; Tzelepis, D.; Konstantelos, I.; Booth, C.; Strbac, G. Design of a hybrid AC/DC microgrid using Homer Pro: Case study on an islanded residential application. Inventions 2018, 3, 55. [Google Scholar] [CrossRef] [Green Version]
  44. HOMER Energy. Net Present Cost—Main Economic Output. 2022. Available online: https://www.homerenergy.com/products/pro/docs/3.11/total_net_present_cost.html (accessed on 9 October 2022).
  45. jasolar. 470 MBB Half-Cell Module. 2022. Available online: https://www.jasolar.com/uploadfile/2021/0602/20210602105327260.pdf (accessed on 22 August 2022).
  46. Hoppecke. OPzV Solar Power: Valve Regulated Lead-Acid Batteries for Cyclic Applications. 2022. Available online: https://www.europe-solarstore.com/download/hoppecke/opzv/OPzV_solar.power_en.pdf (accessed on 22 August 2022).
  47. SMA. Sunny Island 6.0H/8.0H for Off-Grid And On-Grid Applications. Available online: http://www.go-pure.eu/download/SMA-6.0-8.0.pdf (accessed on 22 August 2022).
  48. Systellar. Systellar Innovations: Products and Services. 2022. Available online: https://systellar.co.in/mppt-high-voltage-solar-charge-controller/ (accessed on 22 August 2022).
  49. ARCONEL-035/19. Pliego Tarifario Para Las Empresas Eléctricas de Distribución—Servicio Público de Energía Eléctrica. Resolución Nro. ARCONEL–035/19 2020, 19, 35. Available online: https://www.regulacionelectrica.gob.ec/wp-content/uploads/downloads/2019/07/P-Tarifario-SPEE-2019_Codif.pdf (accessed on 15 November 2022).
  50. ARCONEL. Resolución No. ARCONEL -042/18 Regulacion No. ARCONEL-003/18 Codificación. Arconel 2018, 43. Available online: https://www.regulacionelectrica.gob.ec/wp-content/uploads/downloads/2019/03/042-18.pdf (accessed on 15 November 2022).
  51. Rodríguez, M.; Salazar, A.; Arcos-Aviles, D.; Llanos, J.; Martínez, W.; Motoasca, E. A brief approach of Microgrids implementation in Ecuador: A review. In Recent Advances in Electrical Engineering, Electronics and Energy: Proceedings of the CIT 2020 Volume 1, 149–163; Springer: Cham, Switzerland, 2021. [Google Scholar]
  52. Bhayo, B.A.; Al-Kayiem, H.H.; Gilani, S.I. Assessment of standalone solar PV-Battery system for electricity generation and utilization of excess power for water pumping. Sol. Energy 2019, 194, 766–776. [Google Scholar] [CrossRef]
  53. Dahbi, S.; Aziz, A.; Messaoudi, A.; Mazozi, I.; Kassmi, K.; Benazzi, N. Management of excess energy in a photovoltaic/grid system by production of clean hydrogen. Int. J. Hydrogen Energy 2018, 43, 5283–5299. [Google Scholar] [CrossRef]
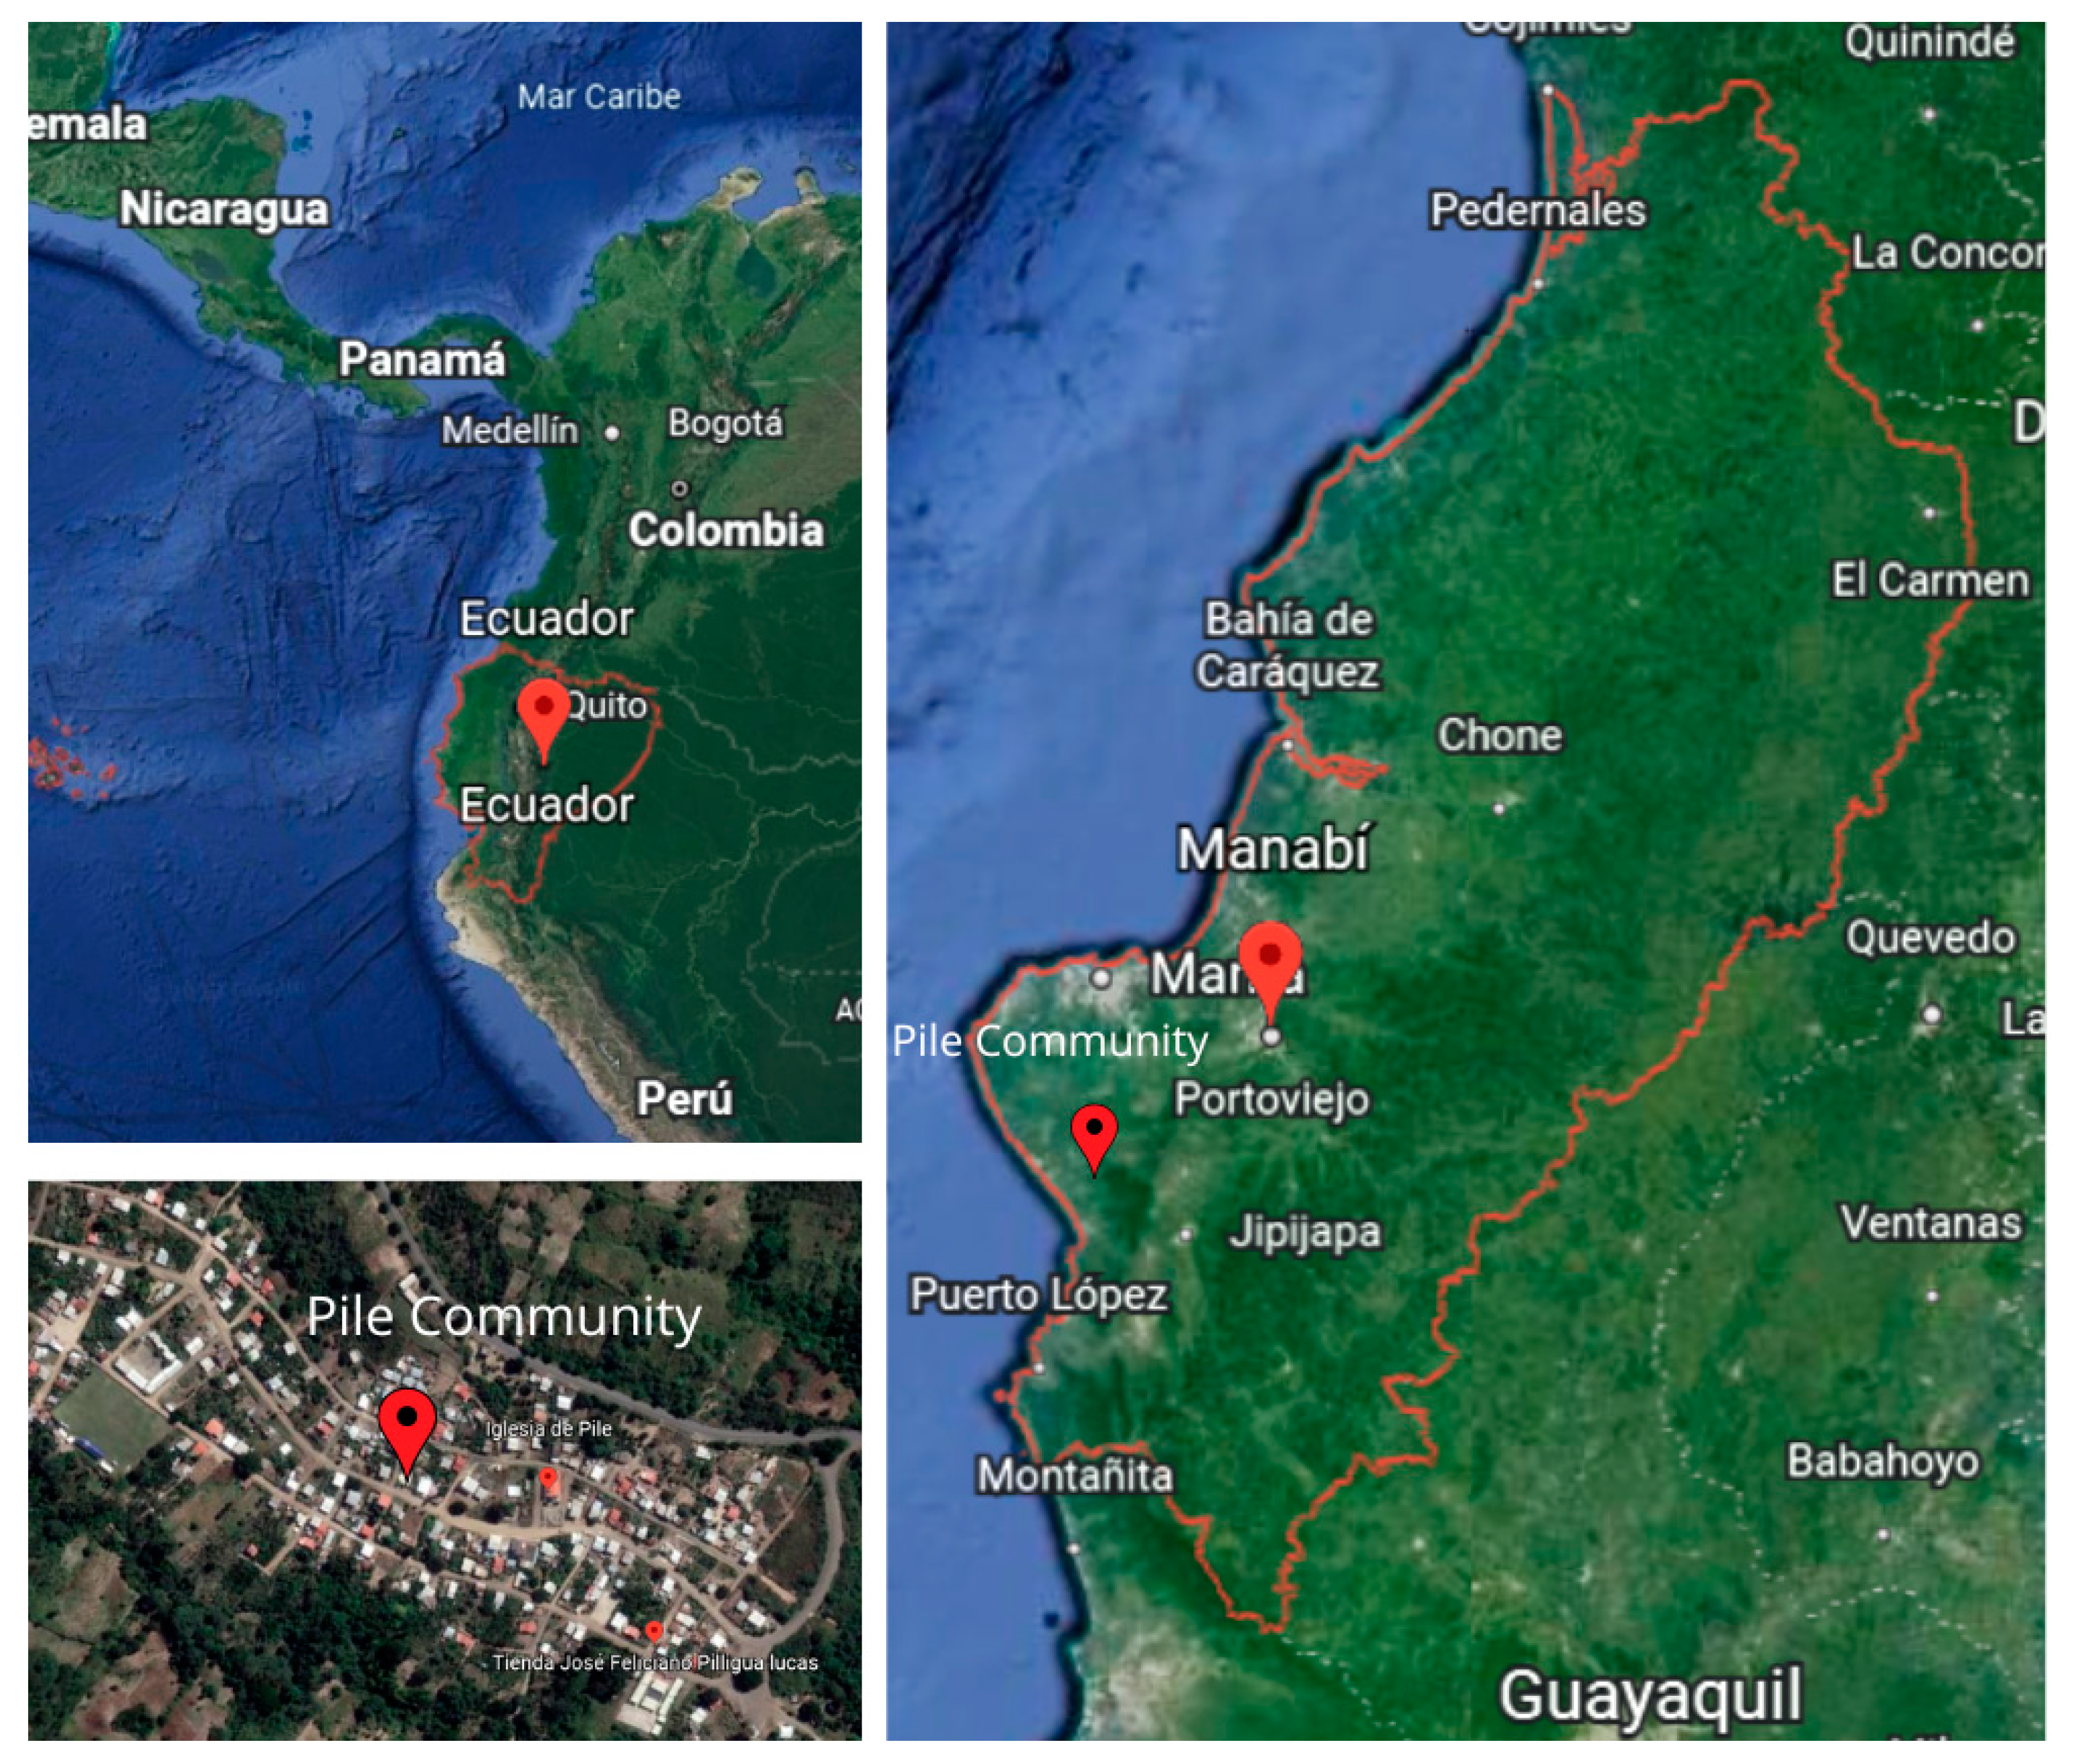
Figure 1. Google Earth view of Pile community, highlighting its location.
Energies 16 02027 g001
Figure 2. Process scheme of drinking water treatment plant for Pile’s community.
Energies 16 02027 g002
Figure 3. Plant’s power consumption on a typical day, considering 12H-DWTP and 24H-DWTP configurations, (a) year 1 and (b) year 15.
Energies 16 02027 g003
Figure 4. Annual electricity requirement of the DWTP during the project planning horizon considering the 12H-DWTP and 24H-DWTP configurations.
Energies 16 02027 g004
Figure 5. Proposed stand-alone solar PV system to cover the electricity demand from the DWTP, considering the 12H-DWTP and 24H-DWTP configurations as loads.
Energies 16 02027 g005
Figure 6. Proposed grid-connected solar PV system to cover the electricity demand from the DWTP, considering the 12H-DWTP and 24H-DWTP configurations as loads.
Energies 16 02027 g006
Figure 7. Average annual electricity production by the SPSV in each scenario, which was distributed to the load (DWTP) and to the BESS, including surplus, (a) SPVS12, and (b) SPVS24.
Energies 16 02027 g007
Figure 8. Costs to determine the return on investment of the SPVS12 and SPVS24 scenarios: (a) NPC and (b) initial capital.
Energies 16 02027 g008
Figure 9. Average hourly power distribution in each scenario among SPVS, BESS, and DWTP in the year 15: (a) SPVS12 and (b) SPVS24.
Energies 16 02027 g009
Figure 10. Annual electricity to cover the load in each scenario from the SPVS and the grid, including surplus energy for the sale from the SPVS to the grid, (a) G-SPVS12, and (b) G-SPVS24.
Energies 16 02027 g010
Figure 11. Net present cost to determine the return on investment of the G-SPVS12 and G-SPVS24 scenarios.
Energies 16 02027 g011
Figure 12. Average hourly power distribution in each scenario among SPVS, grid, and DWTP during year 15: (a) G-SPVS12 and (b) G-SPVS24.
Energies 16 02027 g012
Figure 13. Cost analysis for each PV power system, considering initial capital, replacement, total grid cost, and NPC. The NPC is the main economic output of the optimization problem.
Energies 16 02027 g013
Figure 14. Electricity distribution for each PV power system, considering SPVS production, surpluses and sales to the grid, purchases from the grid, and electricity delivered by the BESS to the load.
Energies 16 02027 g014
Table 1. Average annual and monthly weather data for the Pile community from Meteonorm software [37].
MonthAir Temperature
(°C)
Global Horizontal Radiation
(kWh/m2/Day)
Wind Speed
(m/s)
January25.65.103.0
February25.75.832.3
March25.96.292.3
April25.75.882.5
May25.15.173.1
June23.94.333.6
July23.73.893.8
August23.54.163.9
September23.34.744.0
October23.64.294.1
November24.04.224.0
December24.85.153.8
Year24.64.923.4
Table 2. Components of the DWTP considering power consumption and its operation schedule (12 and 24 h) under the maximum daily potable water supply condition.
ComponentsPower Consumption (kW)
12H-DWTP24H-DWTP
Submersible pump5.743.00
Drive pump1.000.70
Distribution pump16.009.00
Wash water pump2.211.21
Dosing pump0.090.09
Others0.980.98
Total26.0214.98
Table 3. Costs and technical details of the components used in the PV power systems obtained from their datasheets.
ComponentDescriptionSource
PV modulesCapacity, 0.45 kWp; efficiency, 20.3%; type, monocrystalline; annual degradation, 0.55%; temperature coefficient, −0.35%/°C; operating temperature, 45 °C; lifetime, 25 years; capital cost, USD 340.[45]
BESSNominal capacity, 2900 Ah; nominal voltage, 2 V; type, stationary lead acid served OPzS rechargeable batteries; minimum SoC, 20%. Capital cost, USD 1950.[46]
Power ConverterEfficiency, 96%; lifetime, 10 years; capital cost, USD 5670 each 6 kW.[47]
Solar charge controller1. Type, MPPT; efficiency, 98%; lifetime, 10 years; maximum voltage of PV array, 750 V; maximum capacity of PV array, 16.5 kW; capital cost, USD 1820.
2. Type, MPPT; efficiency, 98%; lifetime, 10 years; maximum voltage of PV array, 750 V; maximum capacity of PV array, 13 kW; capital cost, USD 1490.
[48]
Table 4. Energy purchase prices to the main grid in Manabí-Ecuador [49].
DaysDaily SchedulePrice (USD/kWh)
Monday to Sunday08:00–18:000.056
22:00–08:000.045
Monday to Friday18:00–22:000.095
Saturday and Sunday18:00–22:000.056
Table 5. Purchases/sales of electricity from the DWTP for each year of the planning horizon, considering the G-SPVS12 and G-SPVS24 scenarios.
G-SPVS12G-SPVS24
YearPurchase
(USD)
Sale
(USD)
Grid Cost
(USD)
Purchase
(USD)
Sale
(USD)
Grid Cost
(USD)
12043.721182.81860.912319.011755.27563.74
22074.701004.611070.092622.871734.28888.59
32156.02876.551279.472915.171713.151202.02
42247.73758.781488.953168.501691.961476.54
52321.29627.981693.313439.501670.651768.85
62494.87586.611908.263608.911649.291959.62
72675.31550.732124.583771.631627.852143.78
82748.82490.432258.393942.581606.372336.21
92932.79461.872470.924112.171584.802527.37
103108.75428.012680.744275.041563.182711.86
113338.51415.632922.884446.181541.552904.63
123537.47403.323134.154615.951519.903096.05
133819.82391.123428.704778.991498.203280.79
143875.37378.983496.394950.331476.543473.79
154073.50366.953706.555156.041454.913701.13
Total43,448.678924.3834,524.2958,122.8724,087.9034,034.97
Disclaimer/Publisher’s Note: The statements, opinions and data contained in all publications are solely those of the individual author(s) and contributor(s) and not of MDPI and/or the editor(s). MDPI and/or the editor(s) disclaim responsibility for any injury to people or property resulting from any ideas, methods, instructions or products referred to in the content.