Article

Photometric Method to Determine Membrane Degradation in Polymer Electrolyte Fuel Cells

1
Institute of Chemical Engineering and Environmental Technology, Graz University of Technology, Inffeldgasse 25/C, 8010 Graz, Austria
2
AiDEXA GmbH, Bergmanngasse 45 T10, 8010 Graz, Austria
*
Author to whom correspondence should be addressed.
Energies 2023, 16(4), 1957; https://doi.org/10.3390/en16041957
Submission received: 23 January 2023 / Revised: 9 February 2023 / Accepted: 11 February 2023 / Published: 16 February 2023
(This article belongs to the Special Issue Advances in Proton Exchange Membrane Fuel Cell)

Abstract

:
A new method for measuring membrane degradation in polymer electrolyte fuel cells (PEFCs) is proposed. The method is based on the detection of fluoride ions in effluent water from the cathode- and anode outlet of the PEFC using photometry (PM). The fluoride emission rate (FER) is an indicator of the membrane’s state of health (SoH) and can be used to measure the chemical membrane degradation. Commercial catalyst-coated membranes (CCMs) have been tested at 80 °C and 90 °C at 30% relative humidity (RH) to investigate the reliability of the developed method for fuel cell effluent samples. To verify the measurement, a mean-difference plot was created by measuring the same data with a fluorine selective electrode. The average difference was at ±0.13 nmol h−1 cm−2, which indicates good agreement between the two methods. These new findings imply that PM is a promising method for quick and simple assessment of membrane degradation in PEM technology.

1. Introduction

The energy produced from renewable sources, such as wind- and solar power, can be easily stored as green hydrogen and converted back into electricity in fuel cells [1]. This is important to establish a decarbonized energy supply chain that avoids the use of fossil fuels [2]. Compared to other fuel cell technologies, polymer electrolyte fuel cells (PEFC) can be employed in mobile applications, are flexible in use, and can be operated at low temperatures (60–80 °C) compared to other fuel cell technologies [3,4]. Despite many advantages of PEFCs, one main issue is their low lifetime due to degradation phenomena. One of the most important degradation mechanisms is the chemical and mechanical degradation of the perfluorinated sulfonic acid (PFSA) membrane, which is used for protonic transport [5]. Experimental findings show that the radical attack from hydrogen peroxide (H2O2) is one of the major decay mechanisms in PEFC membranes [6,7]. H2O2 can be generated on the Pt-catalyst surface and the formation of radicals is accelerated by metal ions from, e.g., impurities in the feed or corrosion of metal components in the cell [8]. Ferrous ions (Fe2+) are reported to have the highest impact on the membrane degradation rate [9,10]. In the so-called Fenton reaction, H2O2 is decomposed into intermediate radical species that are responsible for unzipping the carboxylic acid end groups (-COOH) of the PFSA membrane [10]. The simplified multistep mechanism is shown in reactions (1)−(3) below:
2H+ + O2 + 2e ↔ H2O2
H2O2 + Fe2+ → Fe3+ + OH + OH*
(CF2)jCOOH + 2OH* → (CF2)j−1COOH + CO2 + 2HF
Radical attacks at the backbone and side chains of the PFSA membrane lead to the release of HF and other fragments (HOC2F4SOR3 and F2COCF2) that further dissociate into fluoride ions (F) in the exhaust water of the PEFC. Therefore, the fluoride emission rate (FER) can be used as an indicator for the chemical durability of membranes in PEM technology that relies on PFSA-based membranes.
Several approaches exist to measure the FER in water sources [11]. Among those, fluoride selective electrodes (FSEs) and ion chromatography (IC) have been reported as diagnostic tools for monitoring the FER in the PEFC field [12,13]. The limit of detection (LOD) for both measurement techniques is approximately 0.02−0.04 mg L−1 [14,15,16] and both can potentially be automated for online data analysis [10]. FSEs are highly selective for detecting F ions in water sources, however, a total ionic strength adjustment buffer (TISAB) is necessary to eliminate interferences from OH ions, and a multi-step preparation is needed. IC offers the opportunity to simultaneously measure other degradation products but is more complex and requires longer measurement periods (up to 24 min per sample [10]). In this paper, we present a novel approach for measuring the F release from PEFC membranes, which is based on the visualization of the fluoride concentration in a photometric (PM) method. The new test method allows detection of the FER at a LOD of 0.008 mg L−1 and excels through a very short measurement period (60 s per measurement). Furthermore, no expensive measurement infrastructure is required, and standard lab equipment (UV–Vis spectrometer) can be used for the practical implementation of the measurement process. The visual detection of fluoride ions in the effluent water from the PEFC anode- and cathode outlet is based on the quenching of a non-toxic, cheap Zr(IV)-SPADNS2 complex and no further reagents are required [17].
In this work, a PEFC with an active area of 25 cm2 was subjected to the DOE MEA chemical stability protocol [18] as an accelerated stress test (AST) at two temperatures (80 °C and 90 °C) and samples of the effluent water were analyzed using an UV–Vis spectrometer developed by AiDEXA GmbH. Zr(IV)-SPADNS2 was added to the periodically taken samples from the stress test and absorption spectra were recorded to determine the fluorine concentration. At begin of testing (BoT) and after the experiment at end of testing (EoT), comprehensive electrochemical characterizations were performed to investigate the performance losses and the changes due to membrane degradation in the cells. Furthermore, the water samples were measured with a FSE and a mean-difference plot was created to verify the PM measurement data. Good agreement between the two diagnostic tools could be observed with a mean difference of ±0.13 nmol h−1 cm−2. The results from the stress test indicate that the operation at higher temperatures leads to a higher FER in the PEFC. The findings reported in this work present a promising and easy-to-apply technique for the measurement of the FER in PEFCs. In the next step, we aim to develop an automated flow-through system to quickly assess the membrane stability in PEFCs.

2. Materials and Methods
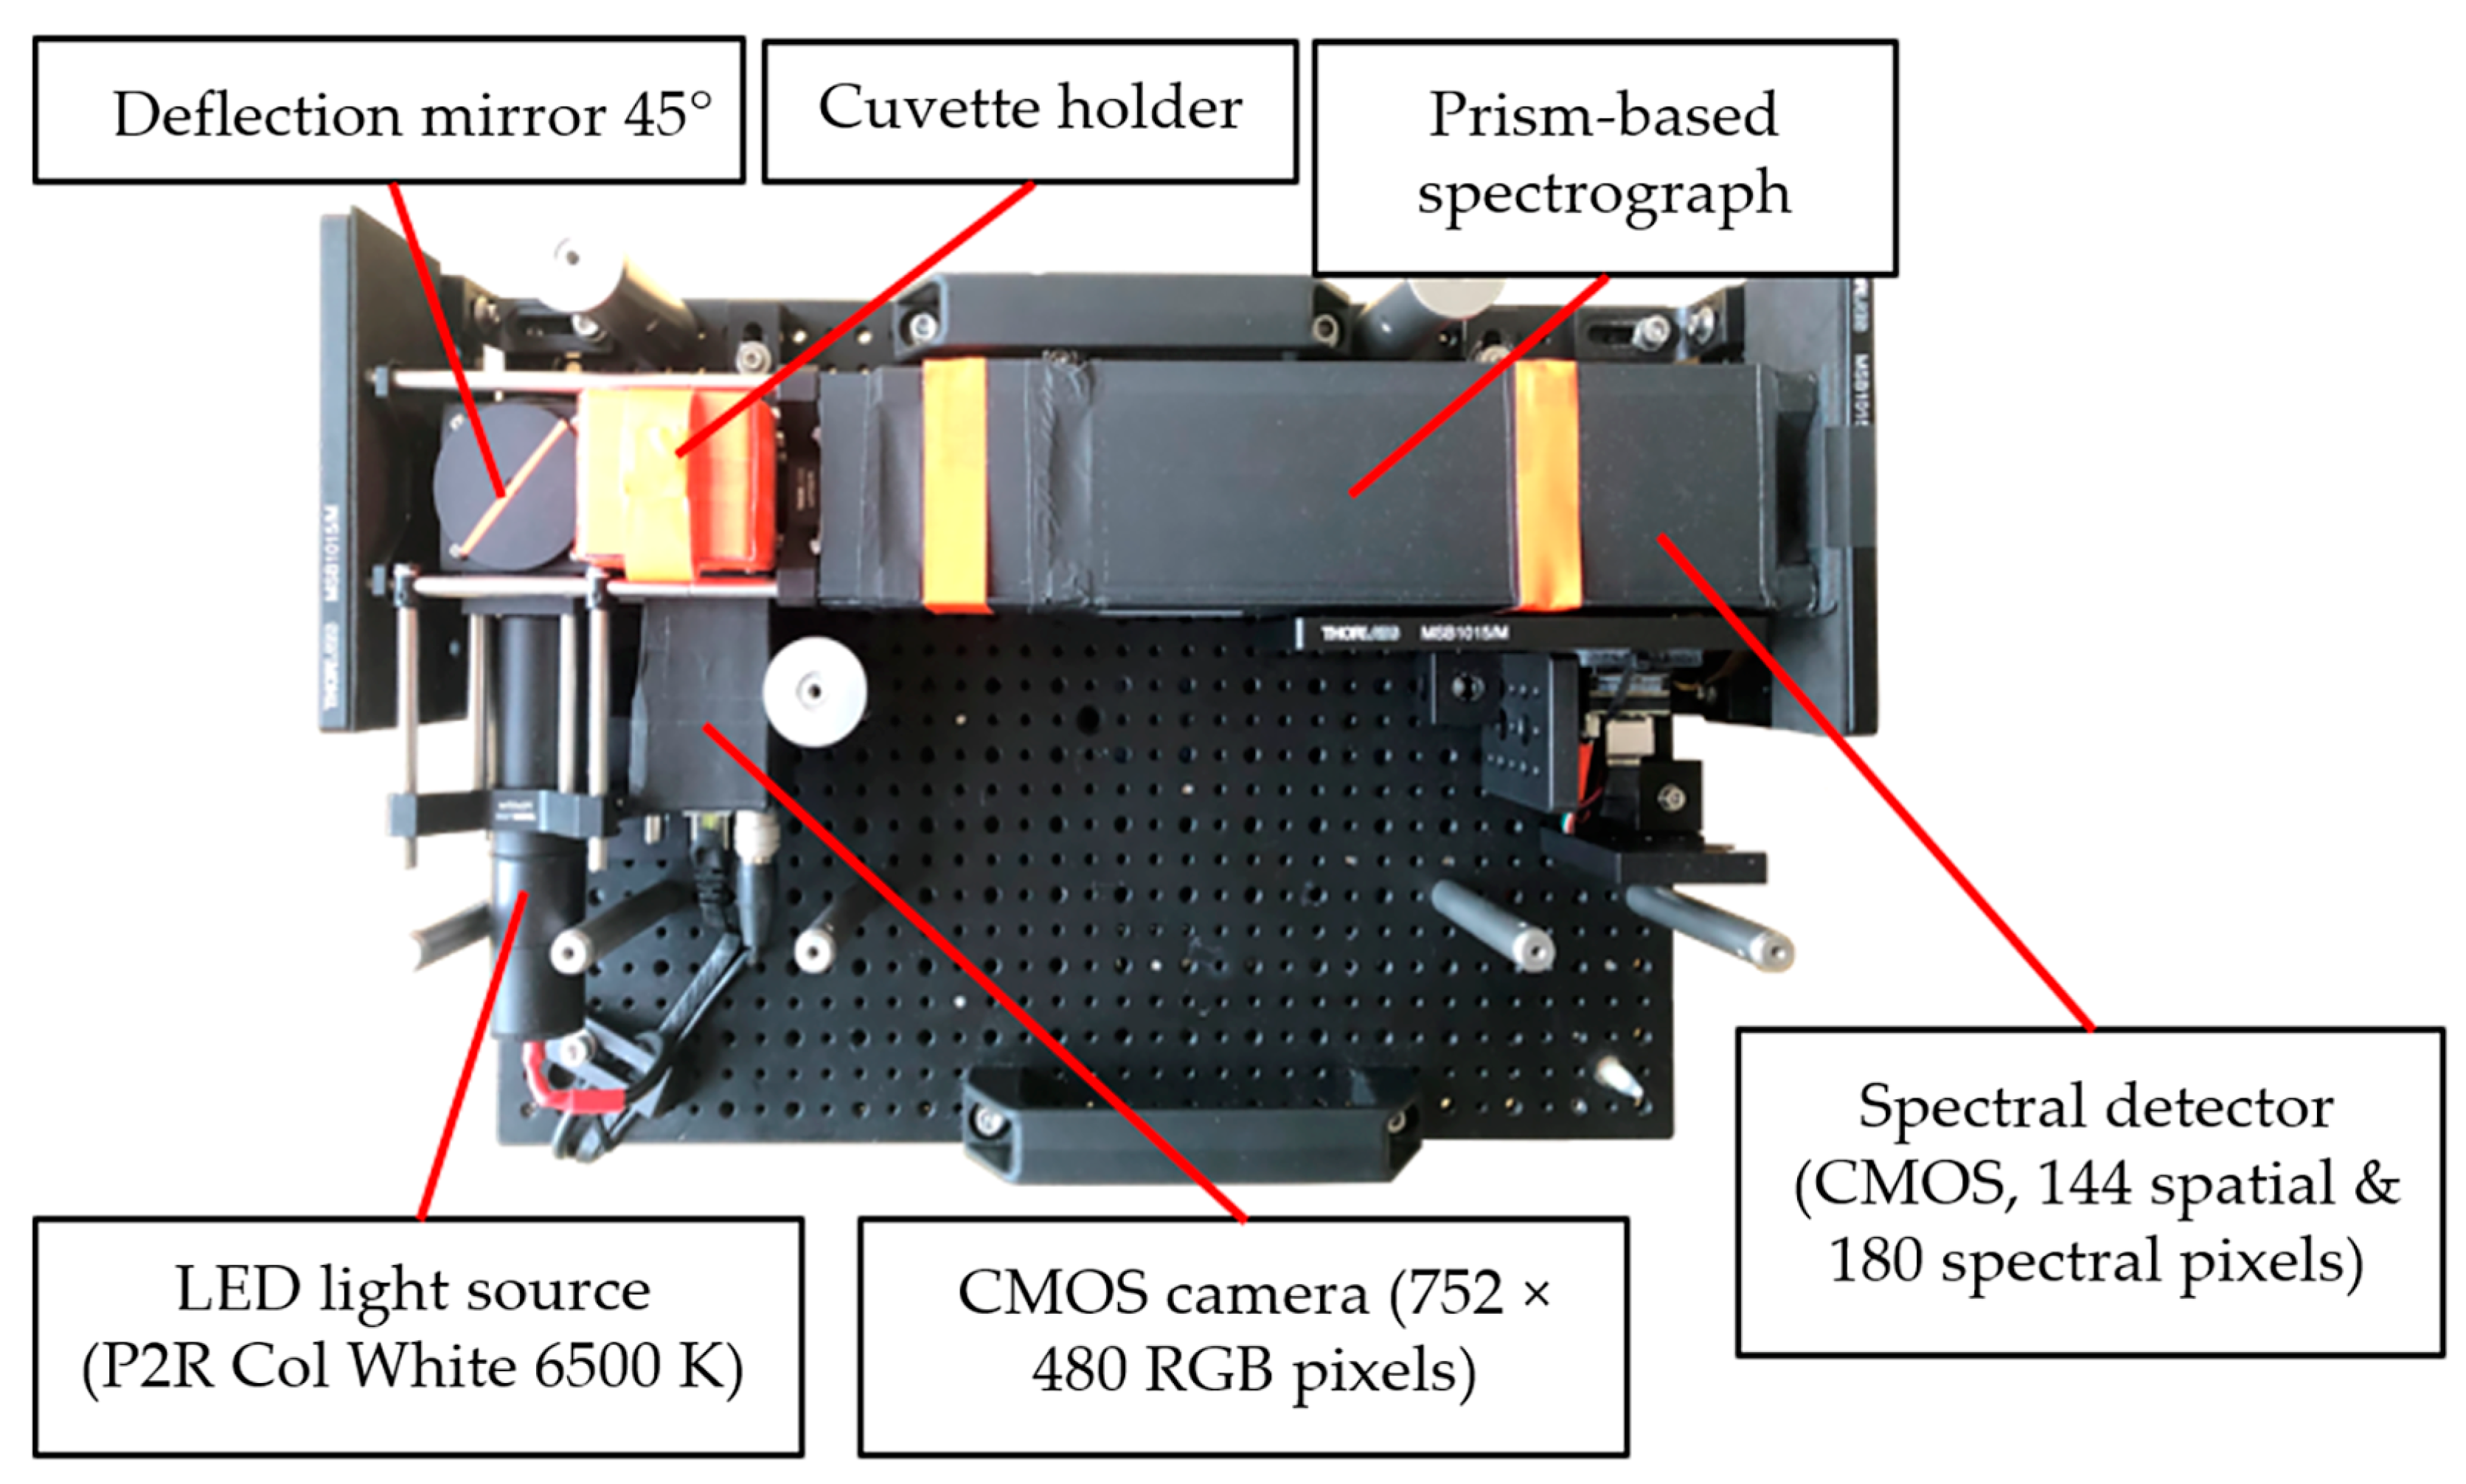
2.1. Test Setup FER

The measurement of the FER in the effluent water of the PEFC exhaust is based on the quenching of a zirconium complex (zirconyl-2-(4-sulphophenylazo)-1,8-dihydroxy-3,6-naphtalene-disulfonic acid), referred to as SPADNS in this paper [17]. The reaction is shown in Figure 1. In order to make the quenching visible an UV-Vis spectrometer developed by AiDEXA GmbH (Figure 2) was used.
SPADNS experiences a shift to lower wavelengths (yellow shift) in the presence of F ions. Before the initial measurement of the samples, a calibration of the system with standards is needed. The fluoride standards are prepared in concentrations of 0, 0.01, 0.02, 0.05, 0.1, 0.2, and 0.5 mg L−1.
All standards and samples were prepared in Semi-micro UV cuvettes from LABSOLUTE (Geyer GmbH & Co. KG, Renningen, Germany) with 1000–100 µL and 100–10 µL piston pipettes from Eppendorf (Eppendorf SE, Jülich, Germany). Ultrapure water (≥17.5 MΩ) was used for dilution and blank samples. For the detection, 900 µL of the sample was mixed with 100 µL of SPADNS. Each standard was measured for 60 s and the average values were used for the calibration. In order to ensure consistent quality of the results, the samples were measured right after the standards.
The calculation of the fluoride concentration in the sample was automatically done by the accompanying software, which calculated the area under the curve as well as the ratios at both sides of the peak. The results from the ratios described in the yellow shift were then weighted and processed into a reference feature value, which was used to convert PM data to fluoride concentrations.
Compared to commercial colorimeters, which use filters for the quantification of analytes and liquids, the eFLUORiX spectrometer is specially built around an optical transmission spectrograph to enable a more sensitive quantification. The eFLUORiX system comes with software that has been specially designed for the detailed analysis of fluoride ions in the lower detection range [19]. The product was developed in the B.GASUS project, with financial support from the Austrian Research Promotion Agency (FFG).

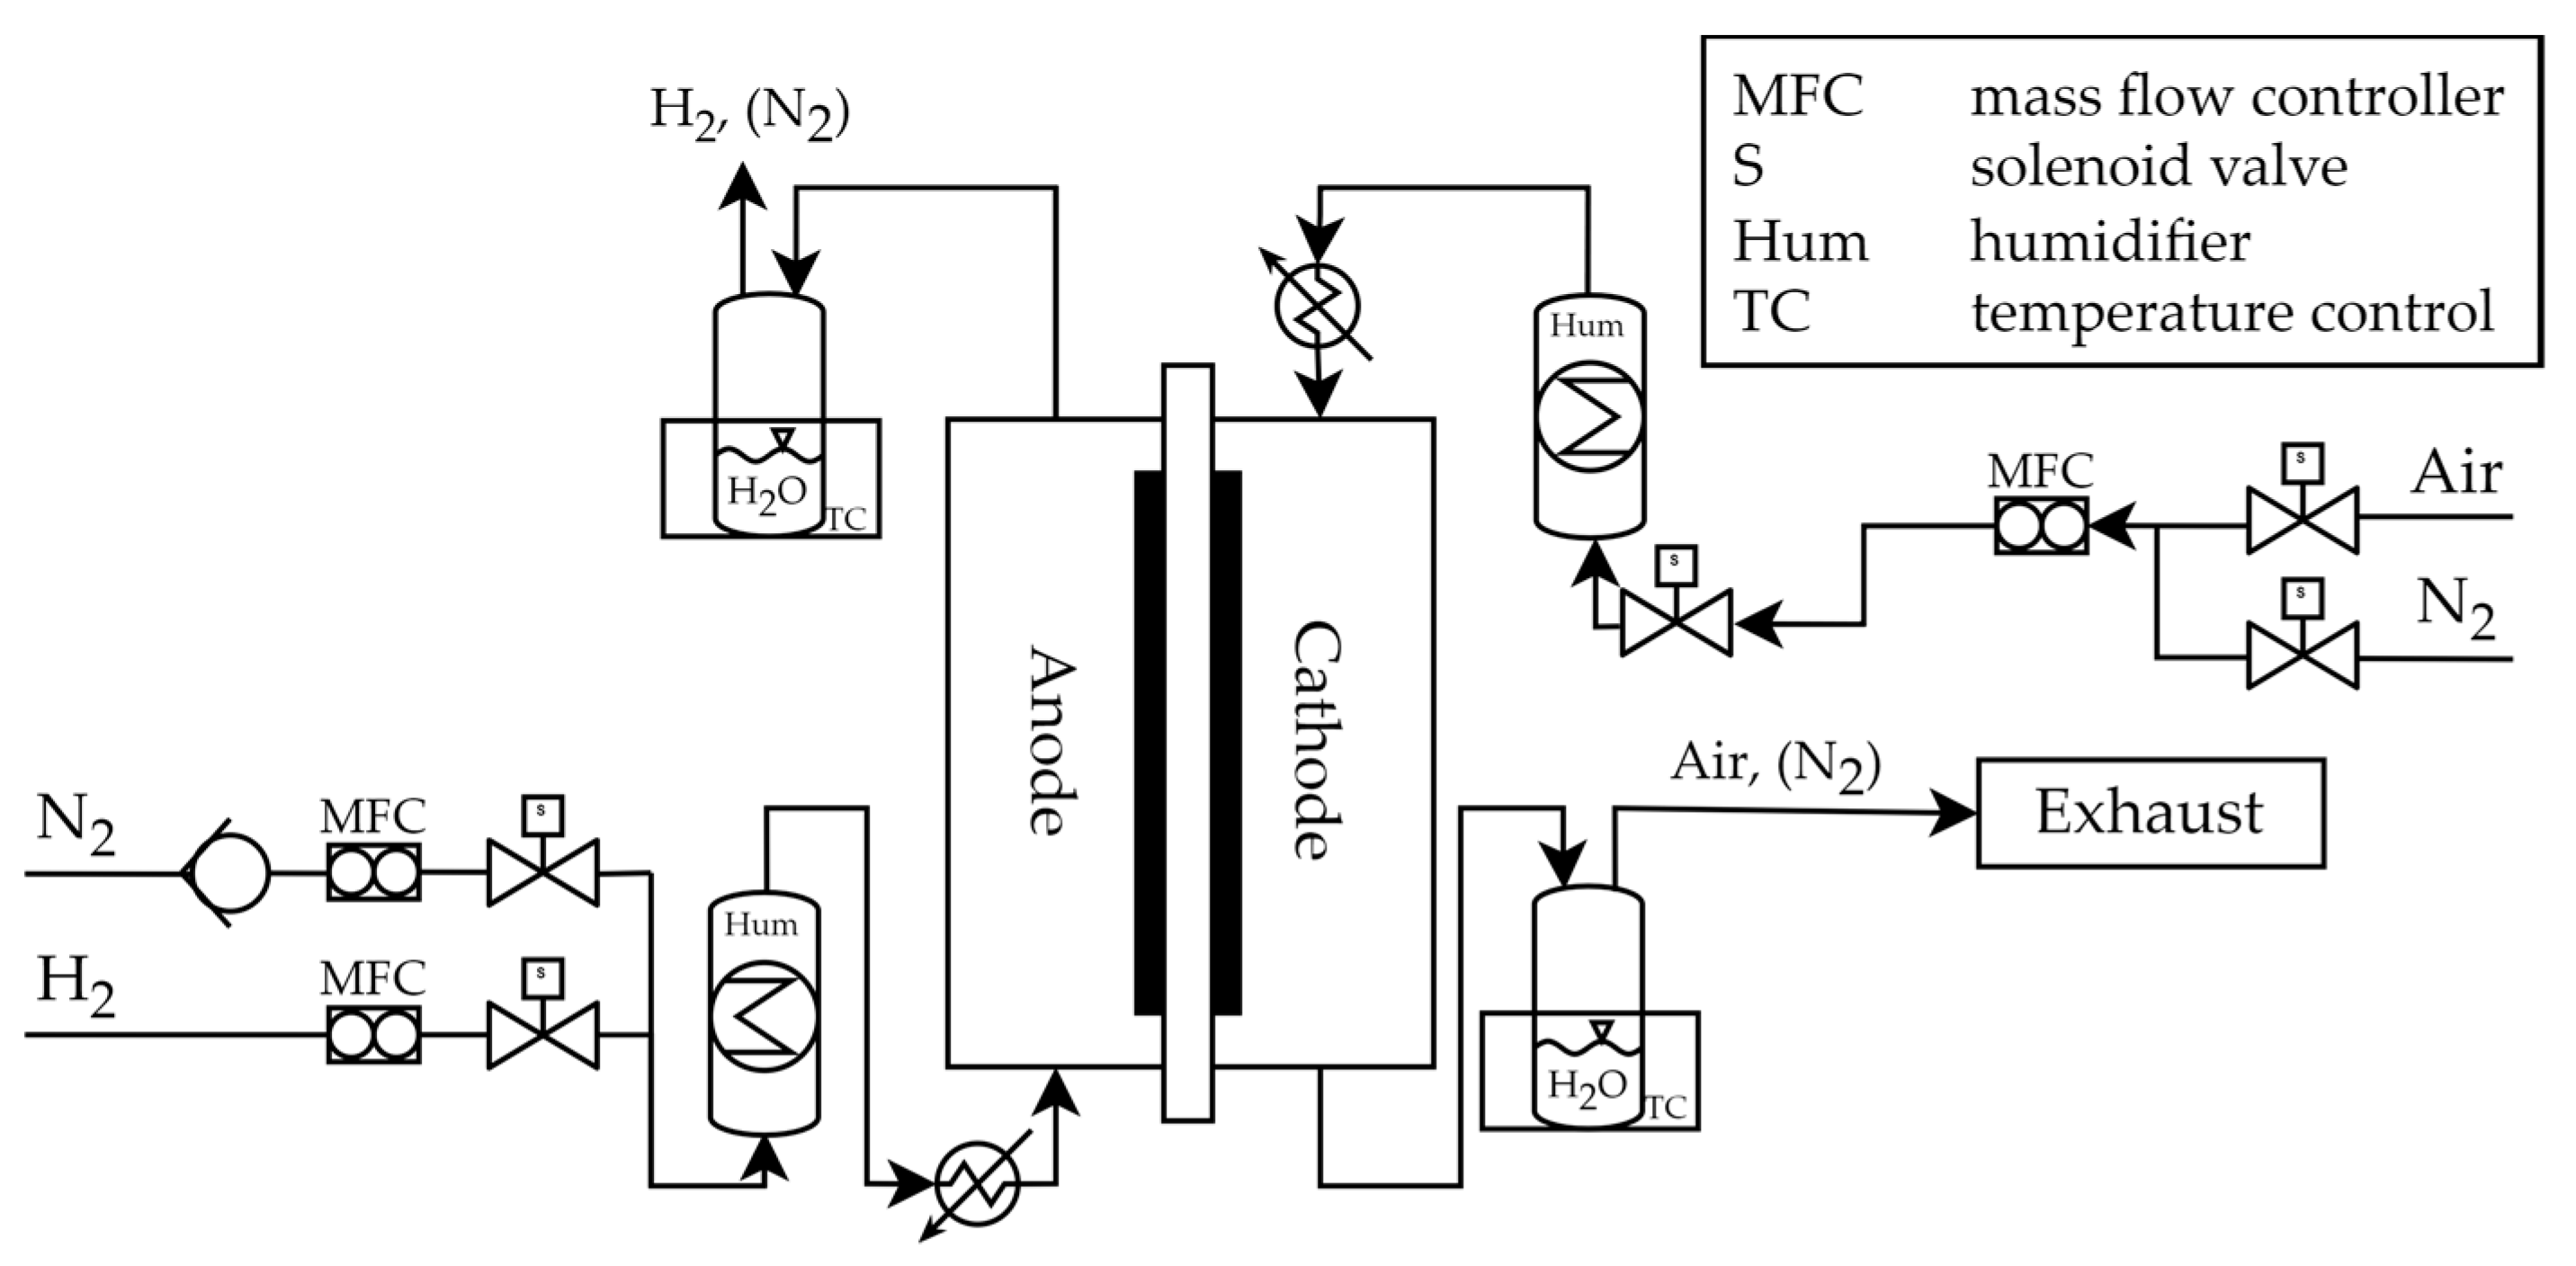
2.2. Test Setup PEFC

Catalyst-coated membranes (CCMs) were from QuinTech (QuinTech Brennstoffzellen Technologie, Göppingen, Germany), CCM-H25-N212, with an active area of 25 cm2, catalyst loading of 0.3 and 0.6 mg cm−2 Pt on the anode and cathode, respectively, and a Nafion™ 212 membrane. Sigracet 22 BB gas diffusion layers (GDLs) were used for the single-cell measurements. The cells were operated on a G60 test station from Greenlight (Greenlight Innovation, Burnaby, BC, Canada) in a pneumatic cell fixture (balticFuelCells GmbH, Schwerin, Germany) at 1.6 N mm−2. The cells were operated on in a cross-flow operation with a triple serpentine flow field with identical flow plates for the anode and cathode.
The cell temperature was maintained at 90 °C and 80 °C for the two stress tests, respectively. The relative humidity was set to 30 RH% for the anode and cathode. Pure hydrogen (5.0, Air Liquide, 0.348 NLPM) was supplied to the anode, and synthetic air (5.0 Air Liquide, 0.871 NLPM) to the cathode. The internal load of the G60 test station was disconnected for the duration of the AST to keep the cells in open circuit voltage (OCV).
Activation, break in, and characterization procedures were carried out according to the JRC protocol [20]. All procedures were conducted at ambient pressure. In Figure 3, a simplified scheme of the PEFC test setup is shown.

3. Results and Discussion

3.1. Electrochemical Characterization

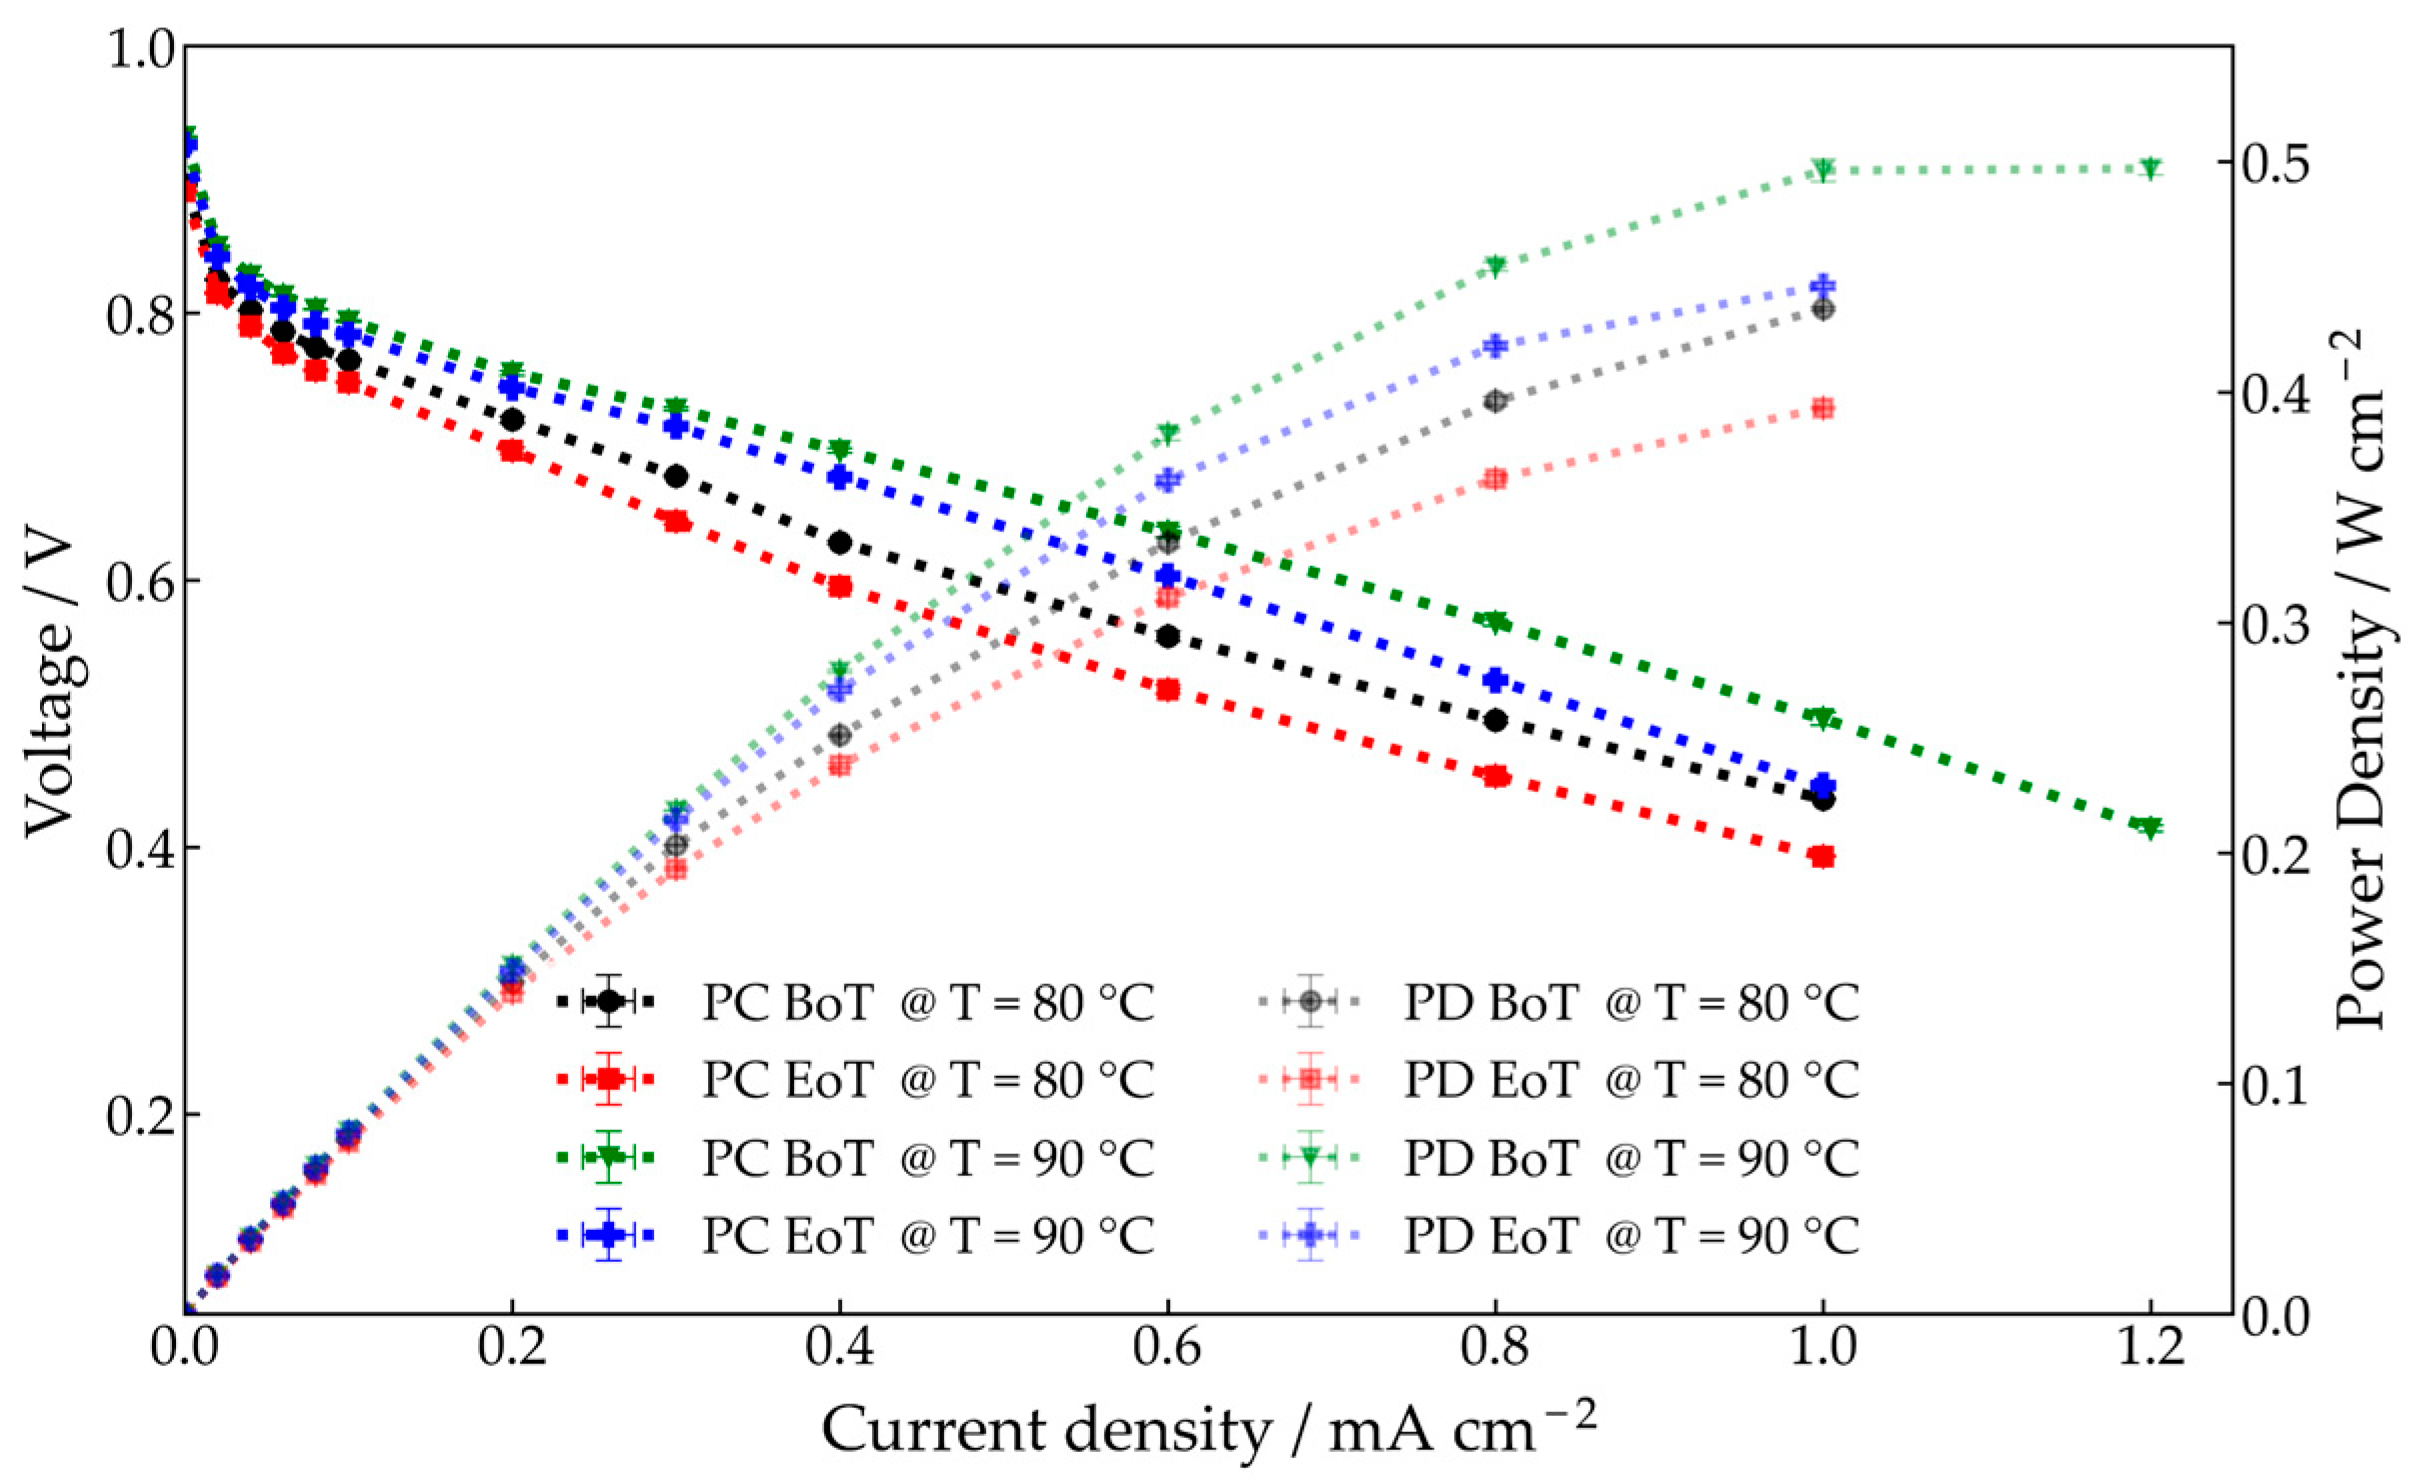
3.1.1. Performance Analysis

The performances of both CCMs were measured by recording polarization curves at a cell temperature of 80 °C with 85 RH% for the anode and cathode. Stoichiometry was set to 1.5 and 2, respectively, keeping the pressure set to ambient, with a minimum dwell time per step of 60 s. Electrochemical characterization steps were carried out after the break-in procedure (BoT) and after the ASTs (EoT).
Figure 4 displays the polarization curves and the power density for both ASTs at BoT and EoT. The activation region, which is mainly dominated by the sluggish kinetics of the oxygen-reduction reaction (ORR), ranges from 0.0 to 0.1 A cm−2. In the ohmic region between 0.1 and 1.0 A cm−2, the membrane resistance is the main contributing factor. The diffusion of oxygen molecules through the GDL and catalyst layer occurs in the mass transport region from 1.0 A cm−2 onwards. In this study, the polarization curves are mainly used to determine the performance degradation experienced by the cells over the course of the two ASTs. The maximum power density point (MPDP) for the cell tested at 80 °C is around 0.436 ± 0.001 W cm−2 at BoT and decreases by 9.9% to 0.393 ± 0.001 W cm−2 at EoT. For the cell tested at 90 °C, the MPDP lessened by 10.2% from 0.497 ± 0.003 W cm−2 to 0.446 ± 0.001 W cm−2 after the AST. In addition, the current density at MPDP decreased from 1.2 A cm−2 to 1.0 A cm−2 at 90 °C and remained at 1.0 A cm−2 for 80 °C.
Apart from the power density reduction, a decrease in open circuit voltage (OCV) was detected. OCV changed by 0.56% from 0.896 ± 0.001 V to 0.891 ± 0.001 V for the cell tested at 80 °C. At a higher temperature of 90 °C a voltage drop of 0.64% from 0.932 ± 0.001 V to 0.926 ± 0.01 V was observed in course of the AST. This alteration of the OCV may originate from chemical membrane degradation during the AST, which leads to a higher crossover current [21,22]. Both cells experience worse performance after the stress tests, especially in the ohmic region, after the AST has been completed. This indicates that the membrane is mainly contributing to the performance decay in both ASTs. At 80 °C the slope of the PC in the linear region indicates an increase from 0.41 ± 0.02 Ω cm2 at BoT to 0.43 ± 0.02 Ω cm2 at EoT (6.6% increase) and at 90 °C it increased from 0.32 ± 0.01 Ω cm2 at BoT to 0.37 ± 0.004 Ω cm2 at EoT (13.9% increase). Therefore, the loss in performance is worse for the AST at 90 °C.

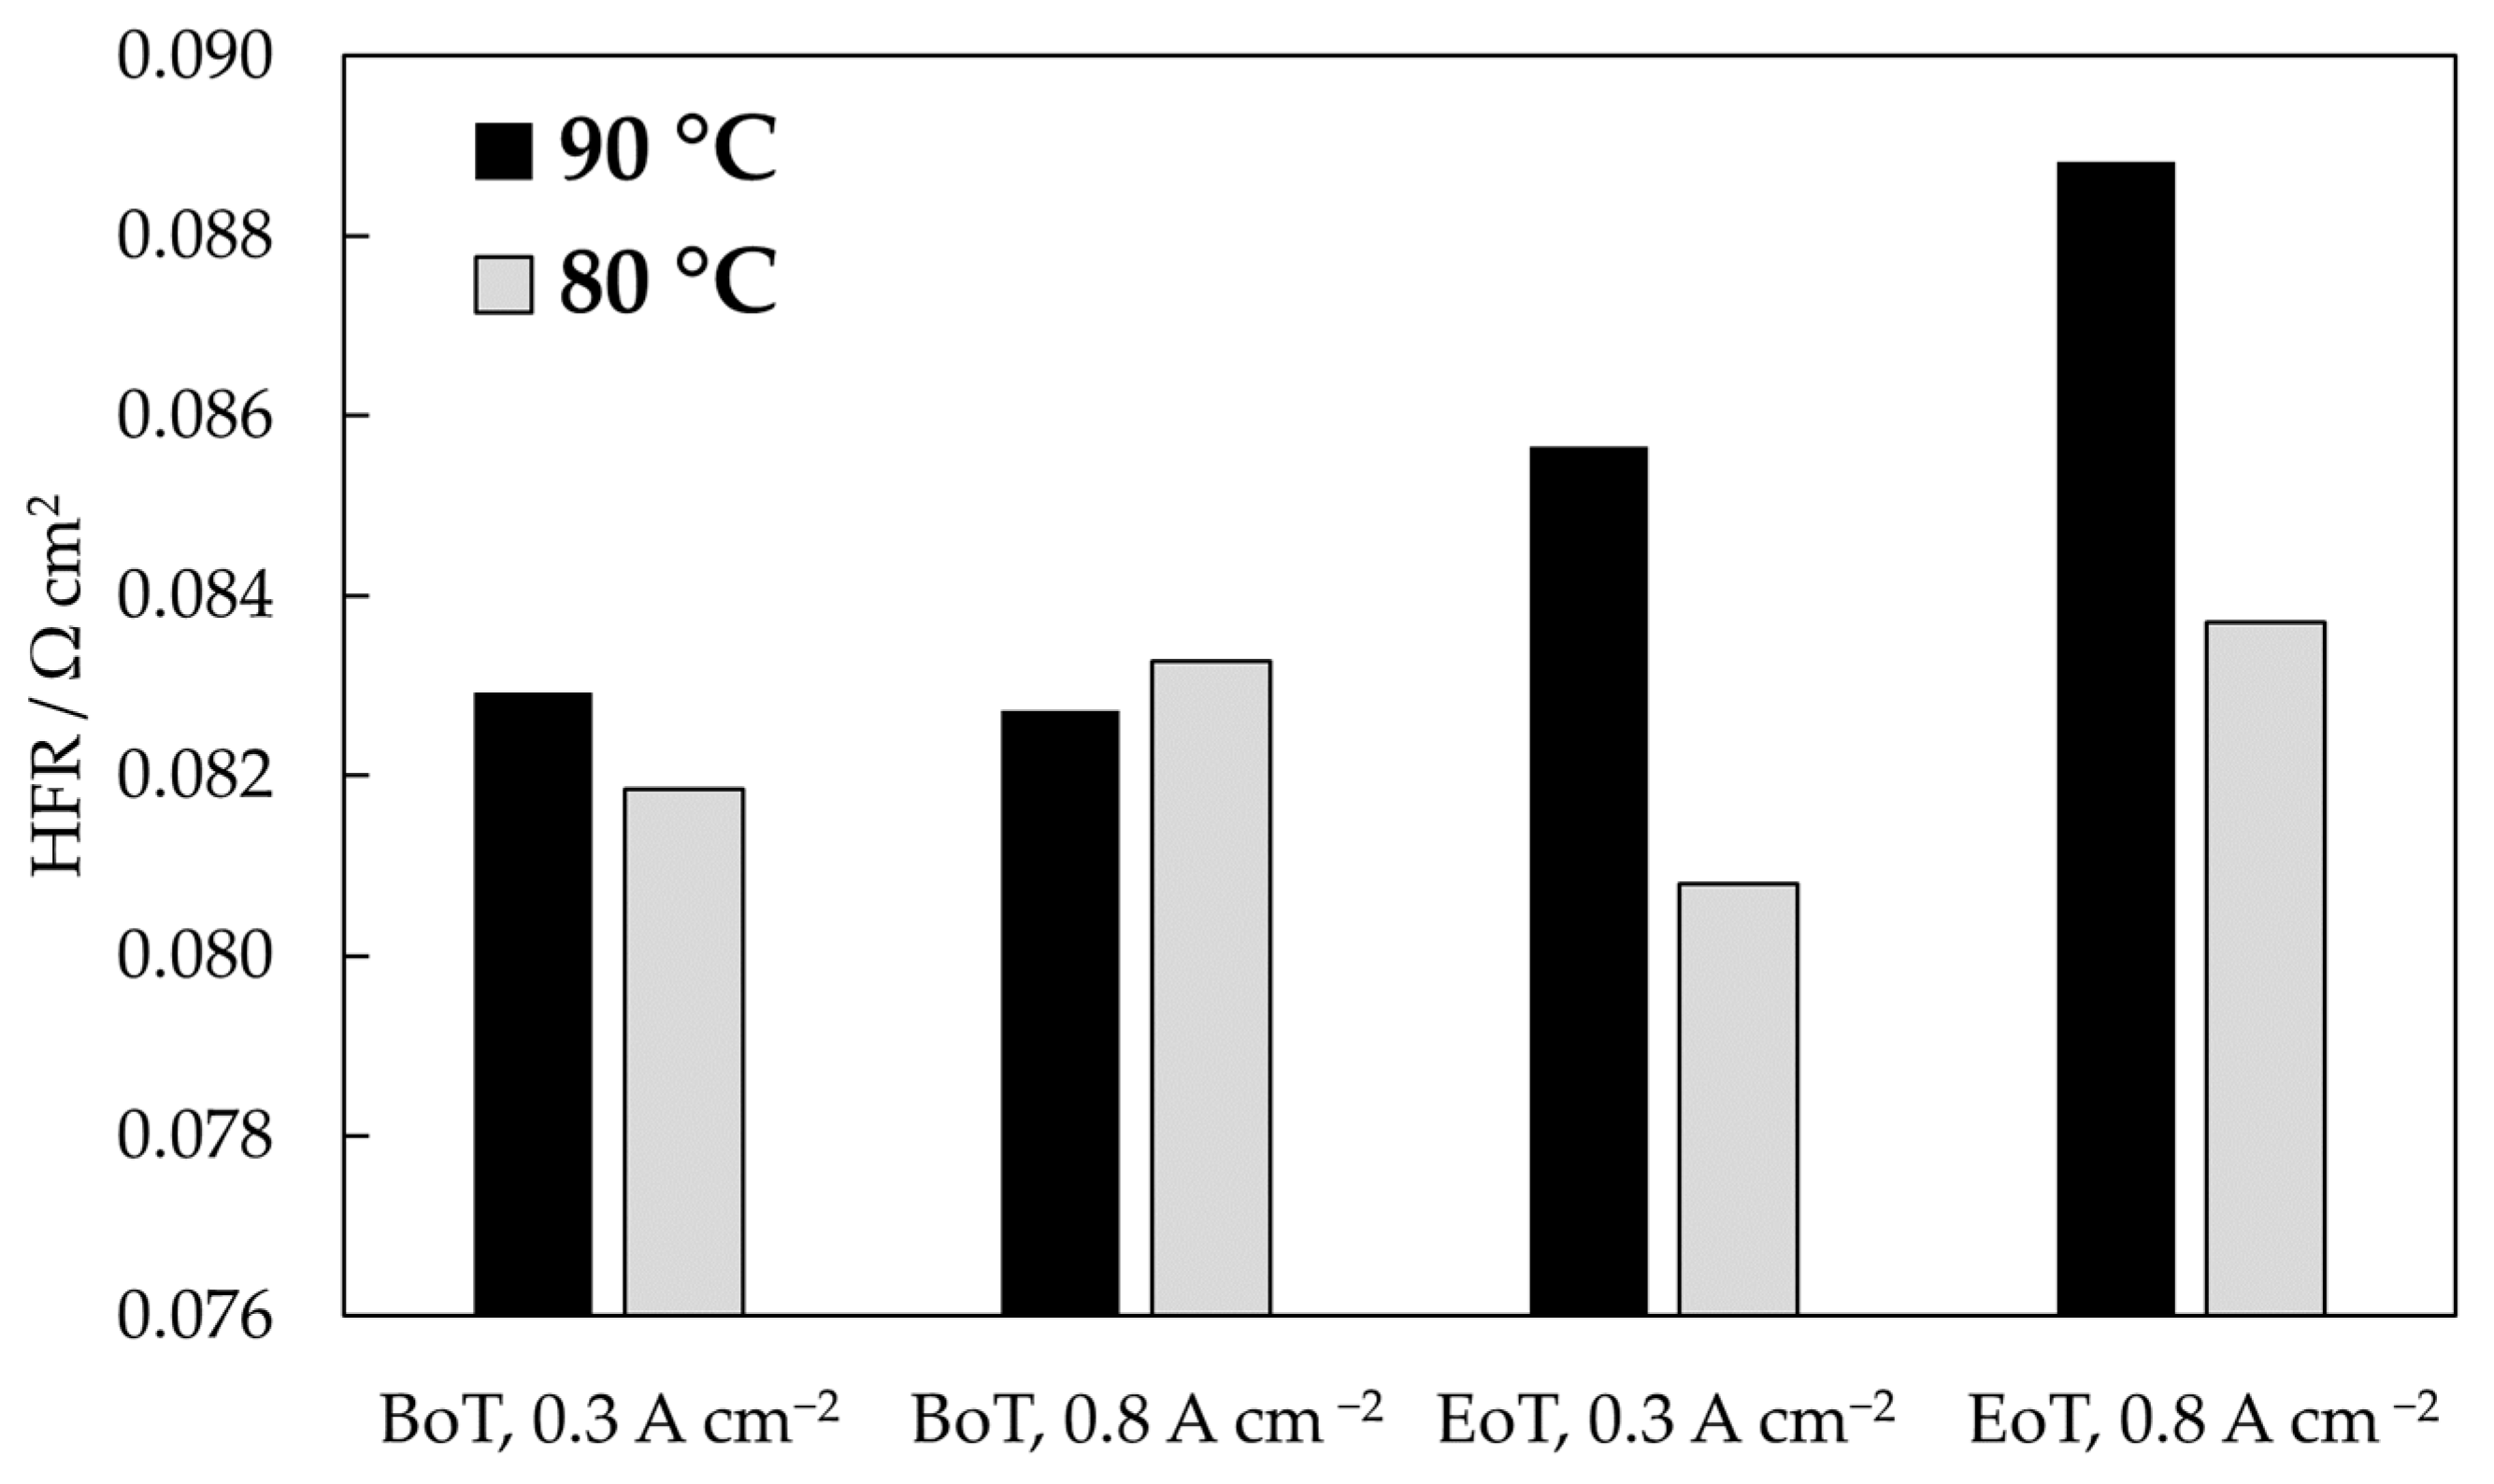
3.1.2. Electrochemical Impedance Spectroscopy

Membrane degradation was also analyzed using electrochemical impedance spectroscopy (EIS). With EIS it is possible to track the degradation progress of specific CCM parts and analyze them. EIS measurements were carried out galvanostatically at 0.3 A cm−2 and 0.8 A cm−2. The operating conditions were the same as for the polarization curves (80 °C cell temperature, 80 RH% for the anode and cathode, and stoichiometries of 1.5 and 2 at ambient pressure). The EIS spectra were recorded between 30 kHz and 0.3 Hz with a scan rate of 10 points per decade and an amplitude of 5% of the set current. For these measurements, the high-frequency resistance (HFR) of the CCMs is of particular interest, as it is directly related to the membrane state of health (SoH) and thickness. EIS measurements capture the membrane resistance as a purely ohmic resistance, which can be found at high frequencies when the phase angle of the resulting voltage reaches 0°. To track the membrane SoH, EIS measurements are performed at BoT and EoT. The resulting resistances of the HFR measurements are shown in Figure 5 for both temperatures.
The stress tests carried out in this work were designed to accelerate chemical degradation in the membrane, leading to fluoride emission and chemical membrane degradation. Furthermore, a higher H2 crossover is expected which further accelerates chemical degradation.
After the completed 50 h of AST, an increase from 0.083 to 0.089 Ω cm2 in HFR can be observed for the cell tested at 90 °C. This is in agreement with our fluoride measurements since chemical membrane degradation leads to an increase in the HFR and a higher FER. At 80 °C the HFR also rises at 0.8 A cm−2; however, a slight decrease during the course of the experiments can be observed at 0.3 A cm−2. This might be due to the better hydration of the membrane.

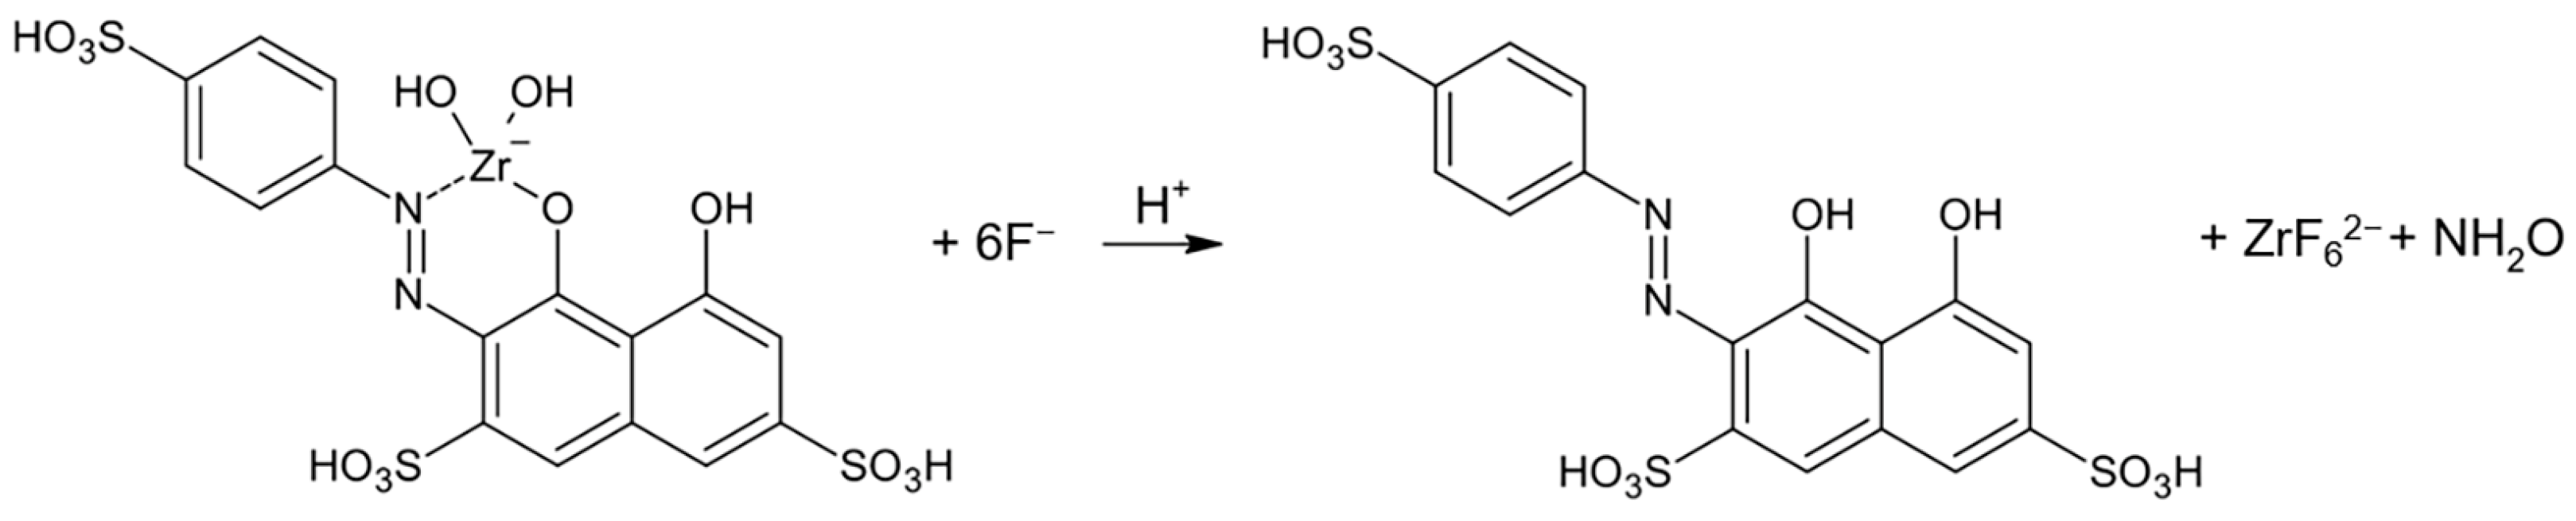
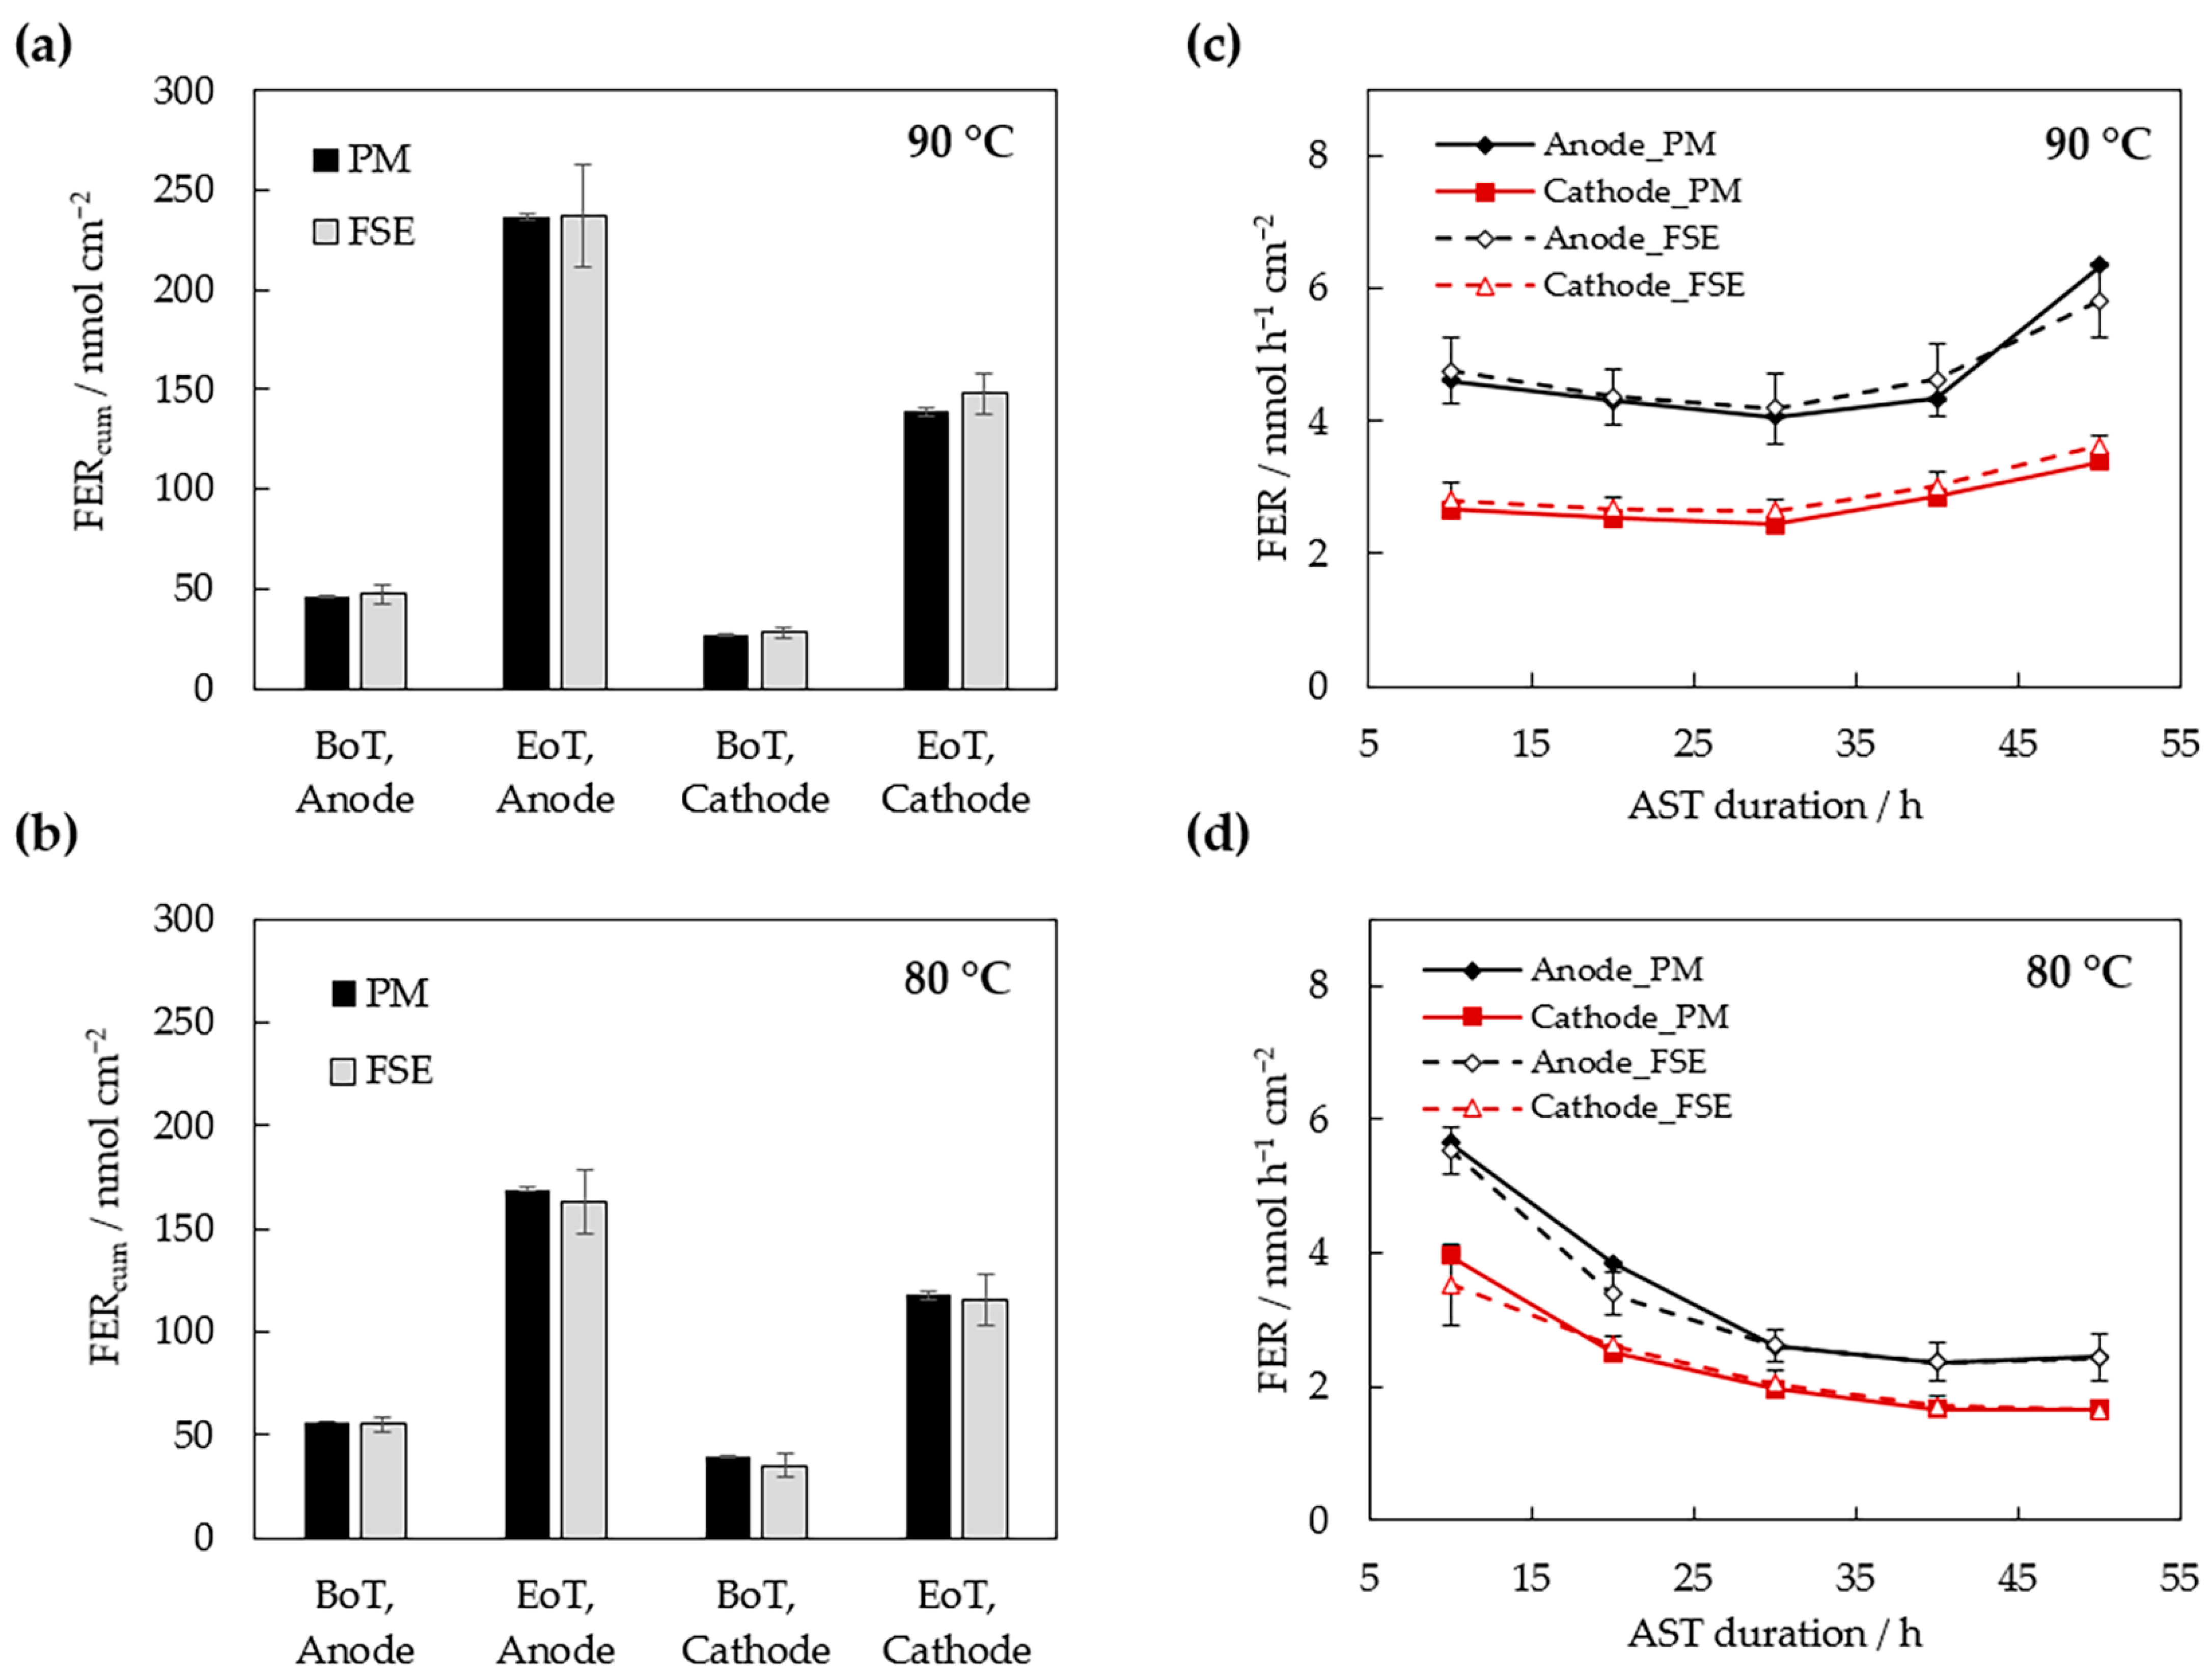
3.2. Measurement of the FER

The calibration results for the PM system are displayed in Figure 6 and show good agreement in the measurement range. The spectra corresponding to the plotted data points are shown in Figure 6a, with higher fluoride concentrations leading to higher intensity. The increasing yellow shift is also clearly visible for increasing fluoride concentrations. This is due to the quenching of SPADNS, resulting in a less intense colored sample. The signal intensity can be directly measured, as it is proportional to the transmission. Five samples of the calibration series used in this experiment are shown in Figure 7. The lighter colors of the samples on the right side indicate a higher concentration of fluoride ions in the solution.
The concentrations for all samples are calculated according to Equation (4). In this equation xi represents the measured concentration of one replicate and x ¯ represents the average value of all replicates, obtained through the calibration. The total number of replicates is represented as N, which was 60 for all samples, at a rate of one replicate per second. The resulting fluoride concentration in water is noted as cF in mg L−1.
c F = i = 1 N x i N     i = 1 N ( x i x ¯ ) 2 N 1
For the calculation of the area-specific FER in nmol h−1 cm−2, conversion is necessary. The amount of fluoride released for the active CCM area over time can be calculated according to the following equation:
F E R = c F / M F × V W a t e r / A c e l l / t s a m p l i n g
The FER in mol h−1 cm−2 can be calculated from the fluoride concentration in the water sample (cF) in mg L−1, the molar mass of fluoride (MF) in g mol−1, the amount of collected water at the cell exhaust (Vwater) in L, the active cell area (Acell) in cm2, and the sampling time, after which, the accumulated samples are taken (tsampling) in hours.
The cumulative FER at BoT and EoT at 90 °C and 80 °C are displayed in Figure 8a,b. The FER measurements consistently show a higher concentration for the anode effluent water than for the cathode outlet H2O. This is valid for experiments at both temperatures and the duration of the whole AST (see Figure 8a–d). The higher F− emission for the anode compartment has been reported in the literature before [23]. The cause for an increased FER and therefore chemical degradation is likely related to the different amounts of water for the anode and cathode (lower for the anode gas stream). Consequently, less H2O on the anode results in a lower dilution of H2O2 and resulting fluorides, which can be correlated to the higher FER on the anode in our experiment.
A side-by-side comparison of both methods (PM and FSE) shows a good agreement between the methods. Samples measured via PM show an overall lower standard deviation, which is even more prominent for the cumulative values (see Figure 8a,b). Therefore, it can be concluded that the PM method allows for a more precise determination of the FER. Figure 8c shows the FER for 90 °C and Figure 8d shows the FER for 80 °C cell temperature, which is, as expected, lower than that for the cell tested at 90 °C. In Figure 8c, a general upward trend can be seen which indicates that even higher degrees of degradation might be possible with further operation in AST mode. For a more a precise analysis of the membrane SoH, tests with longer AST periods would be needed. For the cell tested at 80 °C an opposing trend with a decreasing FER over time can be observed. Here, a maximum value of the FER can be observed at BoT and the values start to align in the last three measurement steps to approximately 3 nmol h−1 for the anode and 2 nmol h−1 for the cathode (PM) [12].
A higher operation temperature accelerates membrane degradation and, therefore, results in a high FER. Likewise, the gas crossover is a key factor for membrane degradation and has been reported to increase with temperature. For instance, Minoru et al. tested PEFC membranes between 60 °C and 80 °C and observed a higher gas crossover for higher temperatures (0.4 mA cm−2 for 60 °C and 0.85 mA cm−2 for 80 °C) [24]. The higher FER at 90 °C also aligns with an increased HFR compared to measurements carried out at 80 °C.
Figure 8c,d further highlight the cohesiveness of the PM and FSE measurements, which both deliver comparable results and are in the range of their respective standard deviation (with one exception at 90 °C, EoT). Figure 8c,d also shows the opposing trends for both experiments, with FERs increasing at 90 °C and FERs decreasing at 80 °C. The higher expected FER for 90 °C was observed. Additionally, the ratio between accumulated FER for the anode and cathode stays consistent in the course of the AST. This is valid for both experiments with a maximum fluctuation of 3% over the course of the AST. The individual results for the PM method and the FSE are displayed in Table 1. Here, the different precisions of PM and FSE measurements are shown, and the standard deviations for FSE measurements are consistently higher by a factor of ~10. This indicates that fluoride detection via PM presents a more reliable method compared to FSEs.

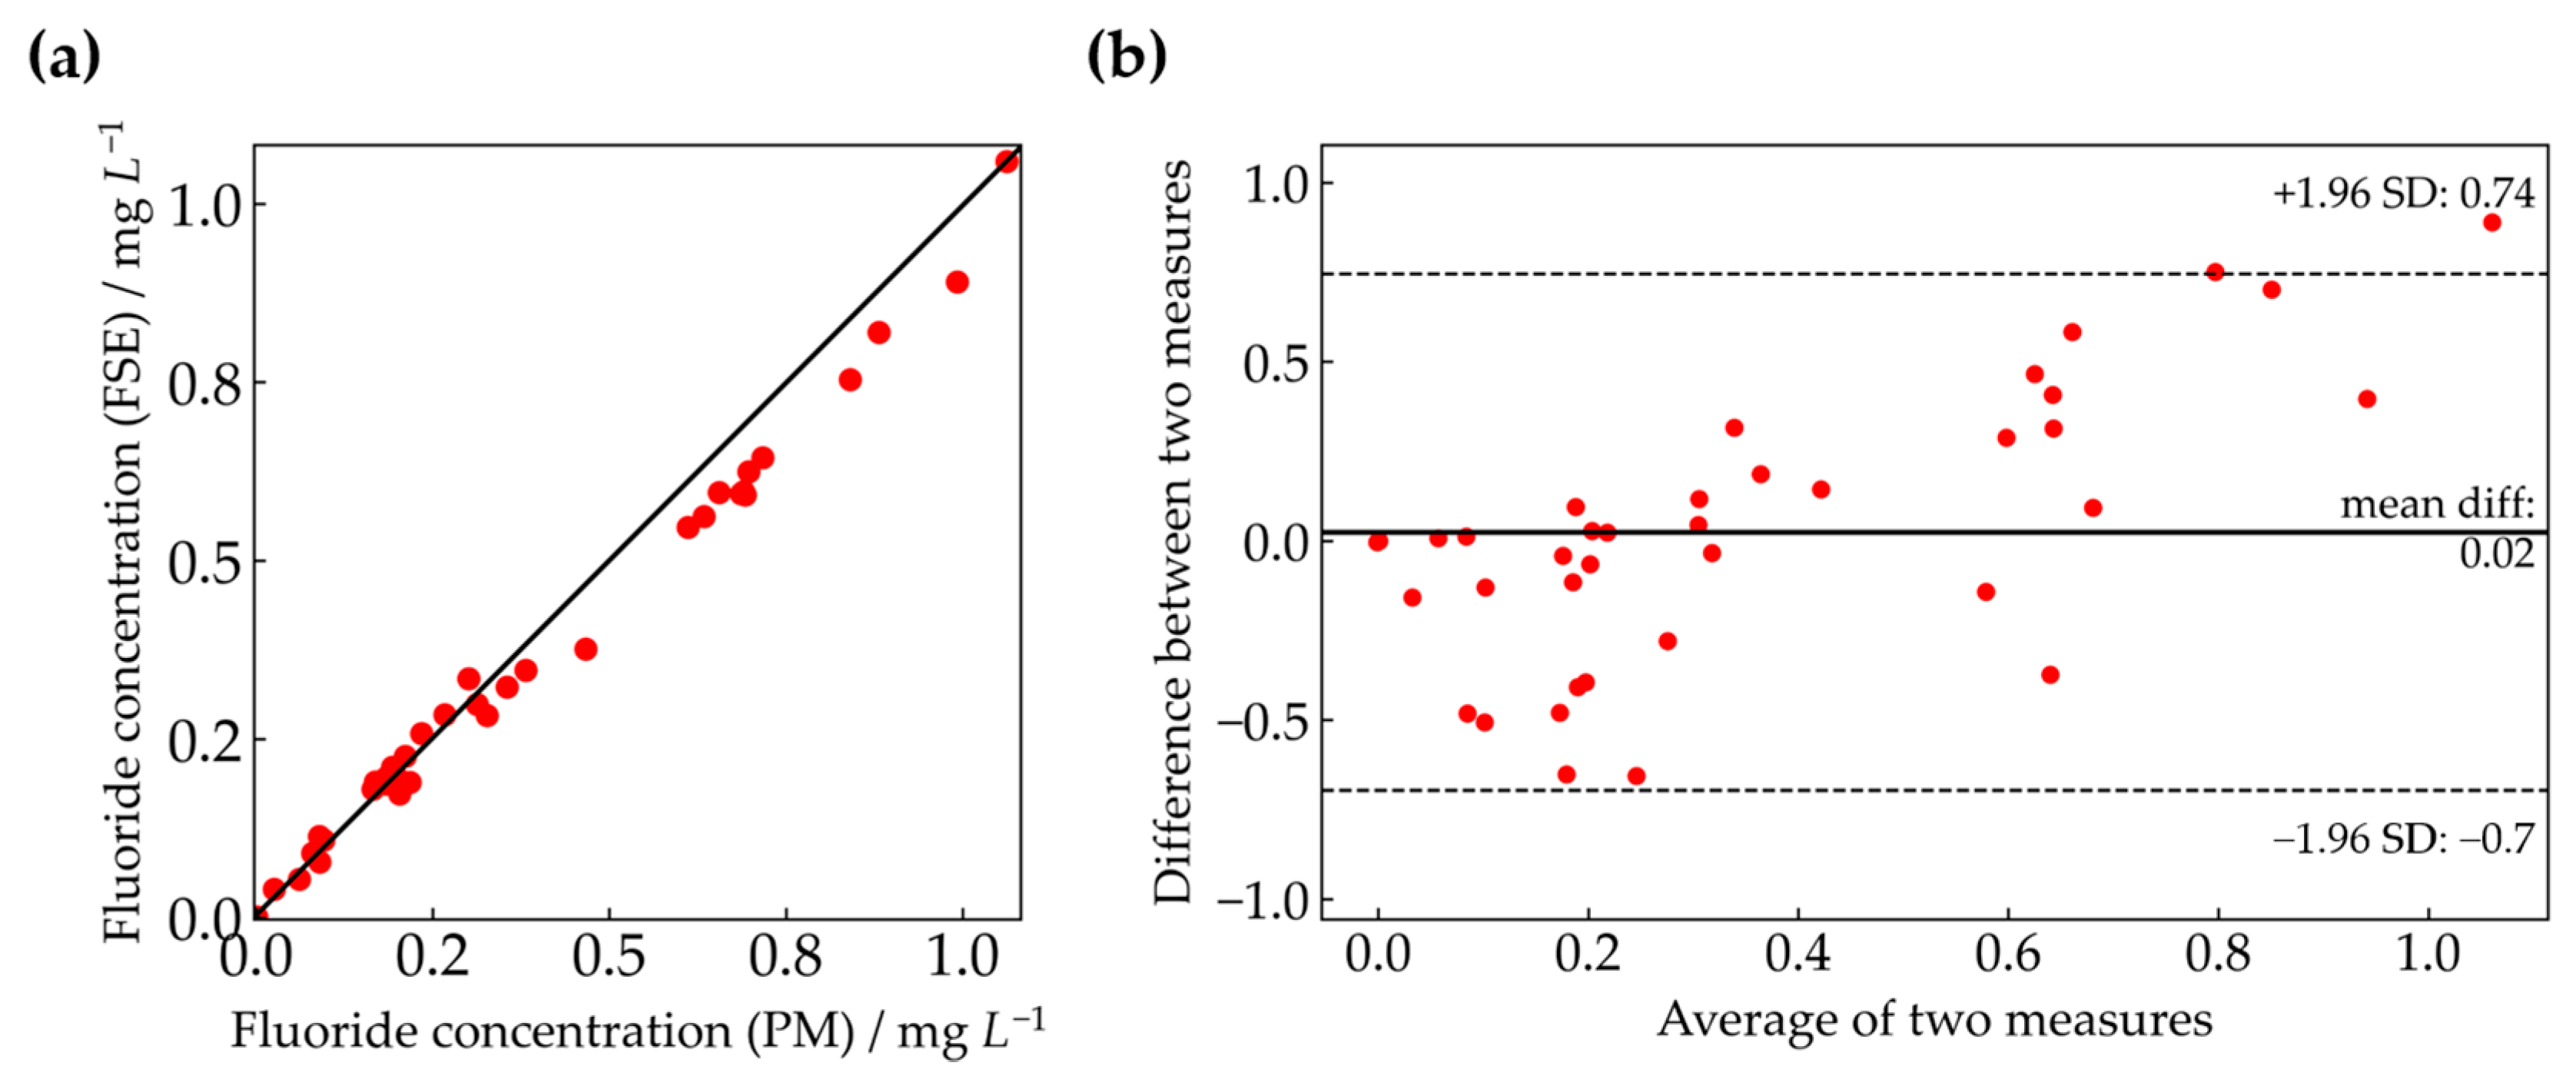
3.3. Correlation Analysis

To compare the different methods, the correlation of the sample measurement results is examined using a correlation analysis and a Bland–Altman plot. Bland and Altman have highlighted that two methods measuring the same parameter should correlate in the range of ±1.96 SD [25]. The correlation between PM and a FSE is shown in Figure 9a. A 45° line (black) indicates the perfect agreement between the two methods. The respective measurement results (red dots) show good agreement between the two methods as they are distributed along the 45° line. These results indicate that both methods are suitable for fluoride measurements in effluent water of PEFC. In Figure 9b the Bland–Altman analysis is shown. Here, the difference between the methods is regressed on the average of the two methods. Except for one outlier, the differences are within mean ± 1.96 SD (with a maximum method difference of 0.74 and a minimum method difference of −0.7), which indicates that the two methods may be used interchangeably [25]. The mean difference is at 0.02, which shows again that the results are in very good agreement.

4. Conclusions

A novel approach for measuring the fluoride emission rate (FER) of PEFC membranes was presented. The method is based on the photometric (PM) detection of fluoride ions in the anodic- and cathodic compartments of the PEFCs. Two OCV-based ASTs were performed at 90 °C and 80 °C, respectively, and the degradation was quantified by polarization curves (PCs), high-frequency resistance (HFR) measurements, and determination of the fluoride emission rate (FER) from the effluent water. A reliability comparison of the PM method with a fluoride selective electrode (FSE) was also performed.
The two methods show good agreement over the whole concentration range, which indicates good suitability for the utilization of PEFC technology. The electrochemical characterization shows a power drop and a pronounced voltage drop in the ohmic region for both measurements. The cell tested at 90 °C exhibits a higher degree of chemical degradation, which might be attributed to the thinning of the PFSA membrane. The measurement results correlate very well with the existing literature.
The investigations have shown that PM detection of fluoride ions in PEFC wastewater is a reliable and easy-to-apply method to detect membrane degradation in PEM technology. Precise measurements, even in the lower detection range are possible, and only a small amount of sample is needed. A simplified sample preparation procedure together with the possibility of further up-scaling makes this technique a promising alternative to existing methods.

Author Contributions

Conceptualization, M.B., E.K. and M.H.; methodology, D.S., M.H. and K.M.; software, D.S., M.H. and K.M.; validation, V.H.; formal analysis, E.K. and M.H.; investigation, M.H., E.K. and K.M.; resources, V.H.; data curation, M.H. and K.M.; writing—original draft preparation, E.K. and M.H.; writing—review and editing, V.H., M.B., E.K., M.H. and and K.M.; visualization, E.K. and M.H.; supervision, M.B. and V.H.; project administration, V.H.; funding acquisition, V.H. and M.B. All authors have read and agreed to the published version of the manuscript.

Funding

This research is performed under the projects HyLife (K-Project HyTechonomy, FFG grant number 882510) and B.GASUS (FFG grant number 884368), which are supported by the Austrian Research Promotion Agency (FFG).

Institutional Review Board Statement

Not applicable.

Data Availability Statement

The data that support the findings of this study are available within the article.

Acknowledgments

Special thanks are due to Walter Gössler for his help in performing the sample measurements using FSE at their laboratory.

Conflicts of Interest

The authors declare no conflict of interest. The funders had no role in the design of the study; in the collection, analyses, or interpretation of data; in the writing of the manuscript; or in the decision to publish the results.

References

  1. Kuhnert, E.; Hacker, V.; Bodner, M. A Review of Accelerated Stress Tests for Enhancing MEA Durability in PEM Water Electrolysis Cells. Int. J. Energy Res. 2023, 2023, 3183108. [Google Scholar] [CrossRef]
  2. Ota, K.; Nagai, T.; Matsuzawa, K.; Kuroda, Y.; Mitsushima, S.; Ishihara, A. Green Hydrogen and Polymer Electrolyte Fuel Cells for Our Future Sustainable Growth. Meet. Abstr. 2019, 235, 1505. [Google Scholar] [CrossRef]
  3. Rosli, R.E.; Sulong, A.B.; Daud, W.R.W.; Zulkifley, M.A.; Husaini, T.; Rosli, M.I.; Majlan, E.H.; Haque, M.A. A Review of High-Temperature Proton Exchange Membrane Fuel Cell (HT-PEMFC) System. Int. J. Hydrogen Energy 2017, 42, 9293–9314. [Google Scholar] [CrossRef]
  4. Hacker, V. Fuel Cells and Hydrogen; Elsevier: Amsterdam, The Netherlands, 2018; ISBN 978-0-12-811459-9. [Google Scholar]
  5. Mittal, V.O.; Kunz, H.R.; Fenton, J.M. Membrane Degradation Mechanisms in PEMFCs. J. Electrochem. Soc. 2007, 154, B652. [Google Scholar] [CrossRef]
  6. Mittal, V.O.; Russell Kunz, H.; Fenton, J.M. Is H2O2 Involved in the Membrane Degradation Mechanism in PEMFC? Electrochem. Solid-State Lett. 2006, 9, A299. [Google Scholar] [CrossRef]
  7. Qiao, J.; Saito, M.; Hayamizu, K.; Okada, T. Degradation of Perfluorinated Ionomer Membranes for PEM Fuel Cells during Processing with H2O2. J. Electrochem. Soc. 2006, 153, A967. [Google Scholar] [CrossRef]
  8. Chen, C.; Fuller, T.F. Modeling of H2O2 Formation in PEMFCs. Electrochim. Acta 2009, 54, 3984–3995. [Google Scholar] [CrossRef]
  9. Singh, R.; Sui, P.C.; Wong, K.H.; Kjeang, E.; Knights, S.; Djilali, N. Modeling the Effect of Chemical Membrane Degradation on PEMFC Performance. J. Electrochem. Soc. 2018, 165, F3328–F3336. [Google Scholar] [CrossRef] [Green Version]
  10. Marocco, P.; Sundseth, K.; Aarhaug, T.; Lanzini, A.; Santarelli, M.; Barnett, A.O.; Thomassen, M. Online Measurements of Fluoride Ions in Proton Exchange Membrane Water Electrolysis through Ion Chromatography. J. Power Sources 2021, 483, 229179. [Google Scholar] [CrossRef]
  11. Bodner, M.; Marius, B.; Schenk, A.; Hacker, V. Determining the Total Fluorine Emission Rate in Polymer Electrolyte Fuel Cell Effluent Water. ECS Trans. 2017, 80, 559–563. [Google Scholar] [CrossRef]
  12. Bodner, M.; Cermenek, B.; Rami, M.; Hacker, V. The Effect of Platinum Electrocatalyst on Membrane Degradation in Polymer Electrolyte Fuel Cells. Membranes 2015, 5, 888–902. [Google Scholar] [CrossRef] [PubMed] [Green Version]
  13. Xiao, S.; Zhang, H. The Investigation of Resin Degradation in Catalyst Layer of Proton Exchange Membrane Fuel Cell. J. Power Sources 2014, 246, 858–861. [Google Scholar] [CrossRef]
  14. Kjellevold Malde, M.; Bjorvatn, K.; Julshamn, K. Determination of Fluoride in Food by the Use of Alkali Fusion and Fluoride Ion-Selective Electrode. Food Chem. 2001, 73, 373–379. [Google Scholar] [CrossRef]
  15. Chan, L.; Mehra, A.; Saikat, S.; Lynch, P. Human Exposure Assessment of Fluoride from Tea (Camellia sinensis L.): A UK Based Issue? Food Res. Int. 2013, 51, 564–570. [Google Scholar] [CrossRef]
  16. Jamari, N.L.A.; Dohmann, J.F.; Raab, A.; Krupp, E.M.; Feldmann, J. Novel Non-Target Analysis of Fluorine Compounds Using ICPMS/MS and HPLC-ICPMS/MS. J. Anal. At. Spectrom. 2017, 32, 942–950. [Google Scholar] [CrossRef] [Green Version]
  17. Patel, R.M.; Patel, K.S.; Naik, M.L. Zr(Iv)-spadns Flow Analysis Procedure for Determination of Fluoride in Surface and Groundwater. Int. J. Environ. Stud. 1999, 56, 745–756. [Google Scholar] [CrossRef]
  18. Garland, N.; Benjamin, T.; Kopasz, J. DOE Fuel Cell Program: Durability Technical Targets and Testing Protocols. ECS Trans. 2007, 11, 923–931. [Google Scholar] [CrossRef]
  19. AiDEXA GmbH eFLUORiX Product Description 2022. Available online: http://www.aidexa.com/products.html (accessed on 10 February 2023).
  20. European Commision; Joint Research Centre; De Marco, G.; Malkow, T.; Pilenga, A.; Tsotridis, G. EU Harmonised Test Protocols for PEMFC MEA Testing in Single Cell Configuration for Automotive Applications; Publications Office of the European Union: Luxembourg, 2016. [Google Scholar] [CrossRef]
  21. Xing, Y.; Li, H.; Avgouropoulos, G. Research Progress of Proton Exchange Membrane Failure and Mitigation Strategies. Materials 2021, 14, 2591. [Google Scholar] [CrossRef]
  22. Chu, T.; Tang, Q.; Wang, Q.; Wang, Y.; Du, H.; Guo, Y.; Li, B.; Yang, D.; Ming, P.; Zhang, C. Experimental Study on the Effect of Flow Channel Parameters on the Durability of PEMFC Stack and Analysis of Hydrogen Crossover Mechanism. Energy 2023, 264, 126286. [Google Scholar] [CrossRef]
  23. Bodner, M.; Schenk, A.; Salaberger, D.; Rami, M.; Hochenauer, C.; Hacker, V. Air Starvation Induced Degradation in Polymer Electrolyte Fuel Cells. Fuel Cells 2017, 17, 18–26. [Google Scholar] [CrossRef] [Green Version]
  24. Inaba, M.; Kinumoto, T.; Kiriake, M.; Umebayashi, R.; Tasaka, A.; Ogumi, Z. Gas Crossover and Membrane Degradation in Polymer Electrolyte Fuel Cells. Electrochim. Acta 2006, 51, 5746–5753. [Google Scholar] [CrossRef]
  25. Bland, J.M.; Altman, D. Statistical Methods for Assessing Agreement between Two Methods of Clinical Measurement. Lancet 1986, 327, 307–310. [Google Scholar] [CrossRef]
Figure 1. Reaction of Zr(IV)-SPADNS2 with fluoride.
Energies 16 01957 g001
Figure 2. UV–Vis spectrometer eFLUORiX developed by AiDEXA GmbH.
Energies 16 01957 g002
Figure 3. P&ID of the PEFC test setup.
Energies 16 01957 g003
Figure 4. Polarization curves (PC) and power density (PD) recorded with 85 RH%, stoichiometry’s of 1.5 and 2 for the anode and cathode, at 80 °C and 90 °C respectively.
Energies 16 01957 g004
Figure 5. High-frequency resistance measured using EIS.
Energies 16 01957 g005
Figure 6. Calibration results of the photometric system from AiDEXA GmbH in the range of 0 to 0.5 mg L−1. In (a), the transmission spectra of the photometer are displayed as intensity vs. wavelength for all standards. In (b), the relation between the defined fluoride concentration of the standards and the normed reference value features is shown.
Energies 16 01957 g006
Figure 7. Calibration series with concentrations of 0 mg L−1, 0.02 mg L−1, 0.05 mg L−1, 0.2 mg L−1, and 0.5 mg L−1.
Energies 16 01957 g007
Figure 8. The cumulative fluoride emission rate (FERcum) of the two test methods at 90 °C (a) and 80 °C (b) at the anode- and cathode outlets and the FER of anode and cathode during the AST at temperatures of 90 °C (c) and 80 °C (d) measured with photometry (PM) and a fluoride selective electrode (FSE).
Energies 16 01957 g008
Figure 9. (a) Statistical correlation of the photometric (PM) method with a fluoride selective electrode (FSE) and Bland–Altman plot of the two methods (b).
Energies 16 01957 g009
Table 1. Fluoride emission rate (FER) measured via photometry (PM) and the fluoride selective electrode (FSE) at 90 °C and 80 °C over the duration of 50 h, respectively.
Cell
Temperature
Sampling
Location
AST Time
/h
Fluoride Emission Rate/nmol h−1 cm−2
PhotometryFSE
80 °CAnode105.65 ± 0.035.54 ± 0.35
203.85 ± 0.023.39 ± 0.32
302.60 ± 0.022.62 ± 0.25
402.37 ± 0.022.37 ± 0.29
502.46 ± 0.022.43 ± 0.34
Cathode103.96 ± 0.033.53 ± 0.60
202.52 ± 0.042.62 ± 0.15
301.96 ± 0.032.04 ± 0.20
401.66 ± 0.041.71 ± 0.16
501.67 ± 0.041.65 ± 0.15
90 °CAnode104.62 ± 0.034.76 ± 0.49
204.31 ±0.034.36 ± 0.43
304.07 ±0.034.19 ± 0.53
404.34 ± 0.034.63 ± 0.55
506.35 ± 0.035.81 ± 0.55
Cathode102.67 ± 0.062.81 ± 0.27
202.54 ± 0.052.68 ± 0.17
302.44 ± 0.042.65 ± 0.16
402.86 ± 0.053.02 ± 0.23
503.39 ± 0.043.63 ± 0.14
Disclaimer/Publisher’s Note: The statements, opinions and data contained in all publications are solely those of the individual author(s) and contributor(s) and not of MDPI and/or the editor(s). MDPI and/or the editor(s) disclaim responsibility for any injury to people or property resulting from any ideas, methods, instructions or products referred to in the content.

