Article

The Effects of Stack Configurations on the Thermal Management Capabilities of Solid Oxide Electrolysis Cells

Department of Mechanical Engineering, Inha University, 100 Inha-ro Michuhol-gu, Incheon 22212, Republic of Korea
*
Author to whom correspondence should be addressed.
Energies 2024, 17(1), 125; https://doi.org/10.3390/en17010125
Submission received: 31 October 2023 / Revised: 6 December 2023 / Accepted: 13 December 2023 / Published: 25 December 2023
(This article belongs to the Special Issue Advances in Proton Exchange Membrane Fuel Cell)

Abstract

:
In this study, we analyze the impacts of various stack configurations of a solid oxide electrolysis cell (SOEC) that includes U-type and Z-type stack structures as well as co-flow and counter-flow configurations. The primary focus of this study is to analyze the impact of these SOEC stack configurations on the temperature distribution within the stack and the temperature variations of key components. Furthermore, by predicting the thermal stress and thermal deformation of individual SOEC components, the study can provide design guidelines for enhancing the durability of the SOEC stack. Among various SOEC stack configurations, the counter-flow design outperformed others in temperature uniformity and component temperature variation. The Z-type stack structure slightly surpassed the U-type in flow uniformity, while both had a minimal influence on thermal management. Besides conventional flow-field configurations, such as the parallel flow field, we introduce a metal-foam-based flow-field design and analyze the effects of using metal foam to ensure flow uniformity within the stack and achieve temperature uniformity. The metal foam design has a lower average temperature (2–5 °C) and ∆T (4–7 °C) compared to the parallel flow field in each cell, but this improvement is accompanied by a substantial pressure-drop: 2359.3 Pa for vapor flow (11.7 times higher) and 4409.0 Pa for air flow (4.6 times higher). Additionally, structural analysis was performed using CFD temperature data. The co-flow configuration induced higher thermal stress at the front of the stack, whereas the counter-flow configuration mitigated thermal stress in the front cells. The metal foam structure consistently demonstrated a reduction in thermal stress across all cells by about 1 MPa, highlighting its potential to alleviate thermal stress in SOEC stacks. This study presents a novel CFD analysis approach for a 10-cell SOEC stack, enabling the development of an optimized stack design with improved heat and flow distribution. The integrated CFD–FEM analysis provides reliable thermal stress data that elucidates the correlation between temperature and stress distributions within the stack.

1. Introduction

Over 80% of the world’s energy production is derived from fossil fuels, which has resulted in significant environmental challenges, such as air pollution, climate change, and global warming. Remarkably, fossil fuel consumption accounts for 65% of the greenhouse gas emissions which directly exacerbate global warming [1,2]. While the adoption of renewable energy sources like hydropower, biomass, and wind power is seen as a potential solution for curtailing greenhouse gas emissions, they currently meet only 14% of global energy needs, due to technological and economic constraints [3].
Hydrogen is emerging as a promising avenue for sustainable energy production and storage. It can serve as an energy carrier, a storage solution, and fuel for fuel cells, offering a carbon-emission-free electricity generation method [4]. The broader adoption of hydrogen as a sustainable energy vector necessitates ongoing research to enhance the efficiency and cost-effectiveness of hydrogen electrolyzers and fuel cells. Such advancements in electrochemical technologies are anticipated to play a pivotal role in harnessing hydrogen as a clean energy supply [5].
Three primary technologies exist for hydrogen production via electrolysis: alkaline electrolysis, polymer electrolyte membrane (PEM) electrolysis, and solid oxide electrolysis cell (SOEC). While both alkaline and PEM electrolysis are well-developed and available commercially, their associated production costs are relatively high, which impacts their economic viability. In contrast, SOEC is a newer technology that operates at elevated temperatures ranging from 700–900 °C and is seen as a promising alternative. It presents enhanced performance, reduced energy requirements for hydrogen production, and a greater economic appeal [6,7]. The operation at such high temperatures provides thermodynamic benefits and accelerated electrochemical reactions in the electrodes, both of which result in decreased operating voltages compared to other electrolysis methods [6,7]. This leads to reduced electricity usage for hydrogen generation, positioning SOEC as a technology with superior efficiency and economic benefits [8]. However, to commercialize SOECs, certain challenges need to be addressed, including long-term durability concerns due to thermal stress and deformation, electrode degradation due to chemical interactions, and issues related to gas sealing. Many researchers are actively working to resolve these challenges in the domain of SOEC advancement [9].
Solid oxide cells have the capability to operate bidirectionally, functioning in both electrolysis and fuel cell modes. The performance of reversible solid oxide cells (R-SOCs) hinges on their ability to efficiently transition between these modes, with effective heat management being vital for longevity [10,11]. The ceramic components in both SOECs and solid oxide fuel cells (SOFCs) are inherently brittle and susceptible to damage from tensile stress, which can result in cracks and mechanical breakdowns due to thermal disparities. As such, a combination of adept thermal management and ongoing material development is pivotal to counteract these thermally induced damages [12]. Effective thermal management for sustained operations emphasizes the importance of maintaining uniform temperatures within the stack and minimizing temperature variations within individual cell components [13,14]. An extensive number of studies have utilized numerical analyses grounded in theoretical modeling to explore the internal heat distribution within the stack [13,14,15,16,17]. For instance, Kim et al. [13] delved into the thermal attributes and heat transfer patterns in a planar SOFC stack using 3D simulations, underscoring the significance of the gas inlet temperature and the thermal properties of interconnectors. In a subsequent study, Kim et al. [14] put forth innovative designs for manifolds and interconnects, aiming to bolster heat transfer efficiency. Bao et al. [15] crafted a 3D model to gauge the fluid dynamics in a unit cell of a planar SOEC stack, employing the temperature profiles from their simulations to evaluate the risk of mechanical cell failures. In a two-part series, Nakajo et al. [16,17] assessed mechanical stress in SOFC components, using 3D modeling to forecast thermal stresses and examining the factors influencing these stresses and the subsequent mechanical wear over extended operational cycles. Cui et al. [18] constructed a comprehensive 3D model for a planar SOEC stack and employed it to analyze thermal stress in stack components. Their research integrated the numerical strengths of both computational fluid dynamics (CFD) and the finite element method (FEM) to ascertain the impacts of various operational parameters on temperature and stress distribution. There have also been dedicated efforts by some scholars to understand how gas composition affects the performance and lifespan of SOEC cells [19,20].
Kim et al. [19] investigated how varying reactant gas compositions influence the performance and durability of high-temperature SOEC cells. Their observations revealed that the steam fraction had a negligible effect on ohmic resistance. However, there was a marked increase in charge transfer resistance when the steam volume fraction descended below 25%. In the pursuit of enhanced SOEC cell performance and durability, there have been strides in innovative stack design. Specifically, Choi et al. [20] introduced a novel hybrid flat-tubular stack encompassing a 100 cm2 active area. This was assembled using metallic elements in a cassette-like arrangement. These configurations not only safeguarded the cells against potential fractures from external forces but also ensured a completely sealed gas flow system, one comparable to planar stacks. This innovative approach paved the way for the successful creation of a kilowatt-class, reversible flat-tubular stack functioning at 700 °C. With 30 cells integrated, this stack demonstrated a power output of 1 kW at 43.7 A in fuel-cell mode and a hydrogen production rate of 500 L/h at 40 A during electrolysis. In the field of lithium-ion batteries, various studies have been conducted to improve cooling efficiency through the design of channel shapes for thermal management in situations where high heat generation occurs [21,22,23,24].
CFD analysis of 3D SOEC or SOFC has traditionally been limited to individual cells. However, we applied the actual 10-cell stack geometry and conducted a CFD analysis of the complete stack. This larger-scale analysis enabled the development of a model that closely simulates the actual heat and flow phenomena within the stack.
While numerous SOEC simulation studies have been undertaken, a noticeable gap exists in the literature addressing the essential design elements of stack configurations and particularly focusing on the SOEC stack’s structure (both U-type and Z-type configurations) and their flow dynamics (co-flow vs. counter-flow). Furthermore, a comprehensive analysis is lacking that would delve into the variations in internal temperature compared to the inlet temperature, as well as the temperature changes across different components. When a solid oxide electrolysis stack is operated through low-temperature inlet gas, the resistance of the cell increases due to the low temperature, and a large amount of irreversible heat occurs, an amount which exceeds the reversible heat of the endothermic reaction. This study conducted simulations of operating conditions which demonstrated high heat output because low-temperature inlet conditions were applied. Due to the ceramic composition of their cells, solid oxide electrolysis cells are susceptible to thermal expansions induced by temperature variations. Consequently, this study aimed to minimize the temperature differences within the cells during stack operation. Additionally, FEM structural analysis was conducted based on CFD results to validate the generated heat stress, corroborating the significance of the minimizing the internal temperature difference as a heat-management strategy.
Our study comprehensively assesses the interplay between flow variations among cells, heat removal efficacy, and the ensuing component thermal stress and deformation. Notably, the utility of metal foam as a gas distributor, which aims to supersede the traditional land/channel flow-field designs in fuel cells and electrolysis devices, has been rigorously explored, a testament to its exemplary thermal and electrical conductivity levels [25,26,27]. This paper delves into the intricacies of a metal-foam-based flow-field design, meticulously examining its advantages and potential drawbacks. By delving into its impact on flow distribution and thermal management, we contrast it with conventional channel-based flow-field designs, paving the way for a comprehensive comparison of stack configurations.

2. Numerical Model

In this study, a 3-D, coupled CFD-and-FEM-based SOEC thermal-fluid model was developed to analyze thermal-fluid and mechanical behaviors of SOECs within various channel designs and flow directions. The SOEC thermal-fluid model considers all sub-components of a SOEC, namely, current collectors (CCs), diffusion layers (DLs), functional layers (FLs), buffer layers (BL), electrolyte layer (EL), sealant, frame, and interconnector. Figure 1a presents a schematic diagram of the SOEC cell. The assumptions considered while developing the model are summarized in the following text.

2.1. Model Assumptions

  • The gas mixture is assumed to behave as an ideal gas due to the low-operating-pressure conditions.
  • Gas flow is considered to be laminar and incompressible.
  • The influence of gravity is considered to be negligible, a reasonable assumption given that the bond number—defined as the ratio of gravitational force to surface tension— is typically small for SOECs (<0.1)
  • Effective porosity and permeability are utilized to characterize the porous components, namely, DL, FLs, and CCs.
  • The electrochemical reactions occur uniformly in the FLs; consequently, the current density is uniformly distributed in the EL, BL.

2.2. Conservation Equations and Source Terms

The 3-D SOEC model was formulated according to the principles of conservation of mass, momentum, and energy, and taking into account the model assumptions mentioned in Section 2.1. The conservation equations are as follows:
Mass   conservation :   · ρ u = S m
Momentum   conservation :   1 ε 2 · ρ u u = P + · τ + S u
Energy   conservation :   · ρ u C p g T = · k e f f T + S T
The source terms of the conservation equations ( S m , S u , S T ) are identified in the various components of a SOEC and summarized in Table 1. In addition, transport properties are summarized in Table 2. The source term in the momentum equations, S u , represents Brinkman–Forchheimer–Darcy drag for flow through a porous media. Mass and energy equations are mainly caused by the electrochemical reaction.
Table 1. Source/sink terms for individual SOEC components.
Description Expression
MassIn FLs S m = s i I a i r   F L n F δ F L M i (4)
MomentumFor porous media S u = μ K u ε ρ C r u u (5)
EnergyIn FLs, BL, EL S T = I δ F L V c e l l U 0 T d U 0 d T (6)
Electrochemical   reactions
i s i M i z = n e , w h e r e M i z = c h e m i c a l   f o r m u l a   o f   s p e c i e s   i s i = s t o i c h i o m e t r i c   c o e f f i c i e n t n = n u m b e r   o f   t r a n s f e r r e d   e l e c t r o n s
(7)
Hydrogen   evolution   reaction   ( HER ) :   H 2 O + 2 e = H 2 + O 2 (8)
Oxygen   evolution   reaction   ( OER ) :   O 2 = 1 2 O 2 + 2 e (9)
Reversible Voltage [V] U = U 0 1 n F T 0 T S T d T R T n F I n P H 2 O P H 2 × P O 2 (10)
In Equations (1) and (2), ρ and u represent the gas mixture density and superficial velocity for porous SOEC components (CCs, DL, FLs), respectively. The gas mixture density can be expressed as
ρ = P R T 1 i m f i M W i  
The momentum source term, denoted as S u in Equation (8), represents the resistance encountered by a fluid as it flows through porous components. K represents the effective permeability of the porous media, following the Kozeny–Carman relationship, signifying the resistance due to viscous effects. C r denotes the constant for inertial effects. These parameters can be expressed as
K = 2 r p 2 × ε 3 72 τ × 1 ε 2
C r = ε K 0.5 × 1.8 180 ε 5 0.5
The parameters r p and τ represent the pore radius and tortuosity, respectively, of different porous SOEC components, as summarized in Table 2. The dynamic viscosity coefficient of the gas mixture, denoted as μ , varies with the gas composition and can be calculated as follows:
μ = i n x i μ i j = 1 n x i Φ i j
where
Φ i j = 1 8 1 + M W i M W j 0.5 1 + μ i μ j 0.5 M W i M W j 0.25 2
μ i = μ 0 , i T T 0 m
where μ 0 , i , T 0 , and m are as reported by Hilsenrath et al. [28] and listed in Table 2.
The energy conservation equation in Equation (3) can be derived by analysis of the heat balance, where C p g represents the specific heat of the gas mixture, and k e f f indicates the effective thermal conductivity, expressed as follows:
k e f f = ε k f + 1 ε k s
where k f and k s are the thermal conductivities of the fluid and solid in the porous region, respectively. Here, the thermal conductivity of the fluid, k f , is defined as follows:
k f = i k f , i × X i
The thermal conductivity of each chemical species, represented as k f , i , is denoted by i, where X i stands for the molar fraction of the species. In SOEC operations, the reversible heat term leads to heat absorption, while the irreversible heat terms cause heat release.

2.3. Solid Mechanics Model for SOEC

In this study, it was assumed that all the SOEC component materials have elastic mechanical properties. According to Hooke’s law, the strain that occurs in the components due to both mechanical loading and differing thermal expansions can be expressed as follows:
ε = ε t h + D 1 { σ }
{ σ } is the stress in the cell and D 1 is the inverse of the stiffness matrix, which we call the compliance matrix. The term { ε t h } is the rate of expansion due to the thermal gradient and is stated as
ε t h = Δ T α x   α y   α z   0   0   0 T
Δ T is the temperature difference, and α is the coefficient of thermal expansion for each degree of freedom. The term D 1 consists of a 6 × 6 matrix and is expressed as
D 1 = 1 / E x ν x y / E x ν x z / E x 0 0 0 ν y x / E x 1 / E x ν y z / E x 0 0 0 ν z x / E x ν z y / E x 1 / E x 0 0 0 0 0 0 1 / G x y 0 0 0 0 0 0 1 / G y z 0 0 0 0 0 0 1 / G x z
where E and ν denote the elastic modulus and Poisson’s ratio, respectively. G is the transitional number. The values for the SOEC cell vapor electrode are summarized in Table 2.

2.4. Boundary/Operating Conditions and Numerical Implementation

The 3D SOEC model for thermo-fluid analysis was applied to the SOEC stack geometry shown in Figure 1a. The dimensions of individual SOEC components and boundary conditions are summarized in Table 3. Non-slip and impermeable boundary conditions were enforced on all external surfaces of the computational domain except for the inlets and outlets of the gas channels. Even though air is not required for the operation of SOEC, an air-supply rate proportional to the operating current was considered for SOEC stack cooling. The side walls of the SOEC have been insulated to suit the stack environment, allowing the heat generated during the operation of the SOEC to be removed by the vapor airflow supplied to the vapor and air electrode sides.
As shown in Figure 1b, following the CFD analysis, a structural analysis was conducted by applying the temperature profiles obtained from CFD simulations as loading conditions in the FEM simulations. Since it is a vapor-electrode supported cell structure, we focused on the vapor electrode, which experiences the highest stress levels, and used it as the structural analysis domain to assess the stress caused by thermal expansion. To minimize the influence of boundary conditions, a weak spring boundary condition was applied. Thermal stresses in each layer of each cell were then determined. Given that the electrode material, nickel/yttria-stabilized zirconia with 8 mol% (Ni/YSZ), is brittle and susceptible to tensile stresses, we analyzed the structural results of the vapor electrode using the maximum principal stress.
The CFD model utilized a mesh consisting of a total of 24.3 million grid points, approximately distributed as 460 × 230 × 230 grid points in the x, y, and z directions, respectively. This CFD-based SOEC thermo-fluid model was implemented in a commercial CFD software, ANSYS Fluent (v21.1). A convergence criterion of 10−6 was set for the residuals of all governing equations. For the structural analysis model, a grid independence test was conducted, utilizing grid sizes of 12.1, 24.3, 36.7, and 48.6 million grid points to verify mesh suitability. The final mesh consisted of 24.3 million grid points. The FEM-based structural analysis, which incorporated fluid–structure interaction (FSI), was performed using the commercial FEM software ANSYS Mechanical (v21.1).

3. Results and Discussion

Figure 2 shows four stack-flow configurations with different inlet and outlet positions and flow directions. In the U-type, both the inlet and outlet are located at the first cell. Conversely, in the Z-type, the inlet and outlet are located at the first cell and tenth cell, respectively. Additionally, each flow direction can be categorized as co-flow, where steam as fuel and air enter in the same direction, or counter-flow, where they enter from opposite directions. Figure 3 shows the temperature distribution when vapor fuel and air flow in the co-flow direction within a U-type stack structure. From the inlet, due to the heat generation during SOEC stack operation, the temperature of the stack can be observed to increase gradually, the increase moving diagonally towards the exit direction. In Figure 3b, the contours representing temperature distribution in the EL cross-section from the first, fifth, and tenth cells are illustrated. Within the EL, there is a noticeable trend of the temperature increasing diagonally in the direction of the vapor and air flow’s exit. As the cell number increases, the peak temperature rises, but the temperature difference inside the EL, represented as ( Δ T E L ), decreases. This trend can be attributed to the vapor and air streams flowing from the inlet to the end. The heat generation gets transferred through the stack components to the manifold, leading to cells at the rear end being introduced to pre-heated fluid, thereby resulting in a higher minimum temperature for the cell.
Figure 4 compares the average temperature ( T a v g , E L ) and temperature deviation ( Δ T E L ) in the EL across four distinct SOEC stacks, each differentiated by their flow patterns, and plotted by cell number. As depicted in Figure 4a, in the co-flow configuration, both vapor and air enter in the same direction into the first cell. Consequently, the front of the stack exhibits a temperature that is relatively lower than what is observed in the counter-flow cases. However, as one moves towards the stack’s rear, the temperature rises, resulting in a significant temperature differential between the cells. In contrast, within the counter-flow configuration, the inflow directions of the vapor fuel and air are reversed, leading to a more uniform temperature difference across cells. In Figure 4b, in which Δ T E L is illustrated, stacks with a counter-flow configuration exhibit a lower Δ T E L compared to those with the co-flow SOEC stacks. In the same figure, stacks with a counter-flow configuration exhibit about 6 °C lower Δ T E L in the first cell compared to the co-flow SOEC stacks. Particularly, the counter-flow design exhibits about 6 °C lower Δ T E L in the first cell compared to that of the co-flow. As highlighted in Figure 2, given the opposing flow of air and vapor fuel in the counter-flow setup, the first cell has a low fuel temperature and a high air temperature, with the inverse being observed in the tenth cell. This complementary temperature interplay between the two gases results in a reduced Δ T E L when compared to the co-flow configurations. The U-type and Z-type stack configurations exhibit a comparatively minor impact on temperature rise and temperature deviation when contrasted with the effects of co-flow and counter-flow setups. For co-flow, both U-type and Z-type structures demonstrate similar trends in T a v g , E L and Δ T E L . However, the U-type records marginally elevated values for both temperatures. This difference stems from the co-flow design wherein both air and fuel gases flow in the same direction. Specifically, in the U-type with co-flow setup, the design ensures that gases are released after circulating from the warmest rear section, which results in a lengthier flow path relative to the Z-shaped configuration. Owing to these design intricacies, the U-type consistently presents higher T a v g , E L and Δ T E L values, compared to its Z-type counterpart. Conversely, within the counter-flow arrangement, the Z-type shows marginally increased T a v g , E L and Δ T E L values. In this flow, air and fuel gases move in opposing directions. This causes the cold gas at the inlet and the hot gas, which flows in the reverse direction, to constantly exchange heat through the stack components. The flow path in the U-type structure is longer than that in the Z-shaped one, promoting a more efficient heat exchange. Consequently, the U-type structure, combined with counter-flow, exhibits lower T a v g , E L and Δ T E L values than does the Z-type in a counter-flow configuration.
Figure 5 depicts the vapor and air flow rates entering each cell within the stack, as normalized by the average flow rates. Firstly, both U-type and Z-type stacks demonstrate excellent flow-distribution performance, with less than 1.5% flow deviation, wherein the Z-type stack, in particular, exhibited a relatively superior flow-uniformity. For the vapor fuel flow, the U-type stack shows a trend in which the mass-flow rate ratio is relatively large at the front, and as the cell number increases, the mass-flow rate ratio gradually decreases. On the other hand, the Z-type stack generally displays a uniform mass-flow rate ratio. This is because the U-type stack has both its inlet and outlet at the front, leading to a concentration of flow there, whereas the Z-type stack releases the vapor flow from the rear outlet, preventing flow concentration at the front. The co-flow and counter-flow configurations were found to have little impact on the distribution of vapor flow. As illustrated in Figure 5b, the air-mass flow rate ratio for both U-type and Z-type stacks is relatively high at the front and rear parts of the stack. The distribution of the air flow rate ratio is different from that of the vapor fuel, showing a distinct trend. This is because, on the vapor side, heavier vapor fuel is electrochemically consumed and lighter hydrogen is produced, whereas on the air side, oxygen continues to be produced. The air velocity distribution depicted in Figure 5c indicates that in certain areas, there is an outward speed distribution due to the production of oxygen.
Metal foam, known for its superior electrical and thermal conductivity, is seen as a potential replacement for the conventional channel-type BP flow field. This study examines the effectiveness of metal foam as a flow field in enhancing the thermal management of the SOEC stack. Figure 6 illustrates the design of a stack that incorporates metal foam in the air and vapor BP flow fields, juxtaposed with a stack that uses the traditional parallel flow-field design. The flow direction of the chosen vapor fuel and air was configured as co-flow within the U-type stack.
Figure 7 shows the flow distribution performance of vapor fuel and air in the metal-foam-based SOEC stack in comparison to the traditional parallel-flow-field-based stack. The metal foam structure exhibits a markedly superior flow distribution capability compared to the traditional parallel flow-field structure, ensuring a flow uniformity of less than 0.5%.
Figure 8a compares the temperature distribution on the EL for both metal foam and parallel-flow-field-based stack structures. Due to the superior thermal conductivity of the metal foam, the maximum temperature within the EL decreases and the minimum temperature increases, leading to a reduction in ∆T when compared to the parallel-flow-field-based stack. Additionally, Figure 8b compares the contour of the temperature gradient in the in-plane direction on the EL. In the parallel-flow-field structure, the influence of the thermal conductivity of the land is evident, revealing the channel and land shapes. In contrast, in the metal foam structure, a continuous temperature gradient distribution is observed without the influence of the channel/land. Moreover, in the metal foam structure, the area with a high gradient near the air inlet is reduced compared to the parallel flow-field structure. Figure 8c compares the average temperature and temperature difference ( Δ T E L ) between the metal foam structure and the parallel flow-field stack structure for each cell. Overall, the metal foam structure has a relatively lower average temperature compared to the parallel flow-field structure, and the ∆T also decreases by about 4–7 °C. This indicates that the metal foam structure has the advantage of facilitating thermal management during SOEC operation.
In Figure 9, the pressure-drop caused by the flow of air and vapor in metal foam and parallel-flow-field-based SOEC stacks is compared through contours. The metal foam structure has a greater flow resistance, as the flow passes through the porous area, rather than a channel structure. The pressure-drop when vapor flows through the metal foam is 2359.3 Pa, which is more than 11 times greater than the 201.2 Pa pressure-drop in the parallel-flow-channel structure. For air flow, the pressure-drop in the metal foam structure is 4409.0 Pa, which is more than four times greater than the 956.3 Pa in the parallel-channel structure. This indicates that, while the metal foam provides advantages in terms of thermal management for a SOEC stack, it has disadvantages in terms of the drop in pressure.
Figure 10 presents the structural analysis results based on temperature distributions derived from the CFD simulations of the SOEC stack. Most components of the SOEC stacks are made from ceramic materials, which are inherently brittle. As a result, they are more susceptible to tensile stress than to compressive stress. Therefore, we evaluated the results based on the maximum principal stress. The predicted thermal-stress distributions primarily appear near the edge, where gases enter the electrode. According to the results in Figure 10a, for the U-type stack with a co-flow configuration, the vapor FL of the first cell exhibits a thermal stress of 10.658 MPa. In contrast, the vapor FL of the tenth cell shows a stress of 7.791 MPa. This indicates that there is a decrease in the maximum principal stress that extends from the front to the rear of the SOEC stack, a trend which is consistent with the decrease in Δ T E L from the front to the rear section (as referenced in Figure 4b). Figure 10b presents the structural analysis outcomes for all SOEC stack configurations and flow directions. The stress in the SOEC cell is attributed to thermal expansion, with temperature variations being the primary cause. Consequently, configurations with notable temperature deviations, like the co-flow method, experience higher stresses. Conversely, designs employing metal foam and a counter-flow configuration, and which exhibit a comparatively lower Δ T E L , manifest reduced thermal stresses. Notably, the metal foam structure stack, which consistently demonstrates a decreasing Δ T E L towards its rear, exhibits the lowest principal stress. Also, the metal foam structure consistently demonstrated a reduction in thermal stress across all cells about 1 MPa, emphasizing its potential to mitigate thermal stress in SOEC stacks.

4. Conclusions

This study conducted 3D CFD analysis and FEM structural analysis of different flow configurations and flow-field design variables in a SOEC stack. The following key findings were observed:
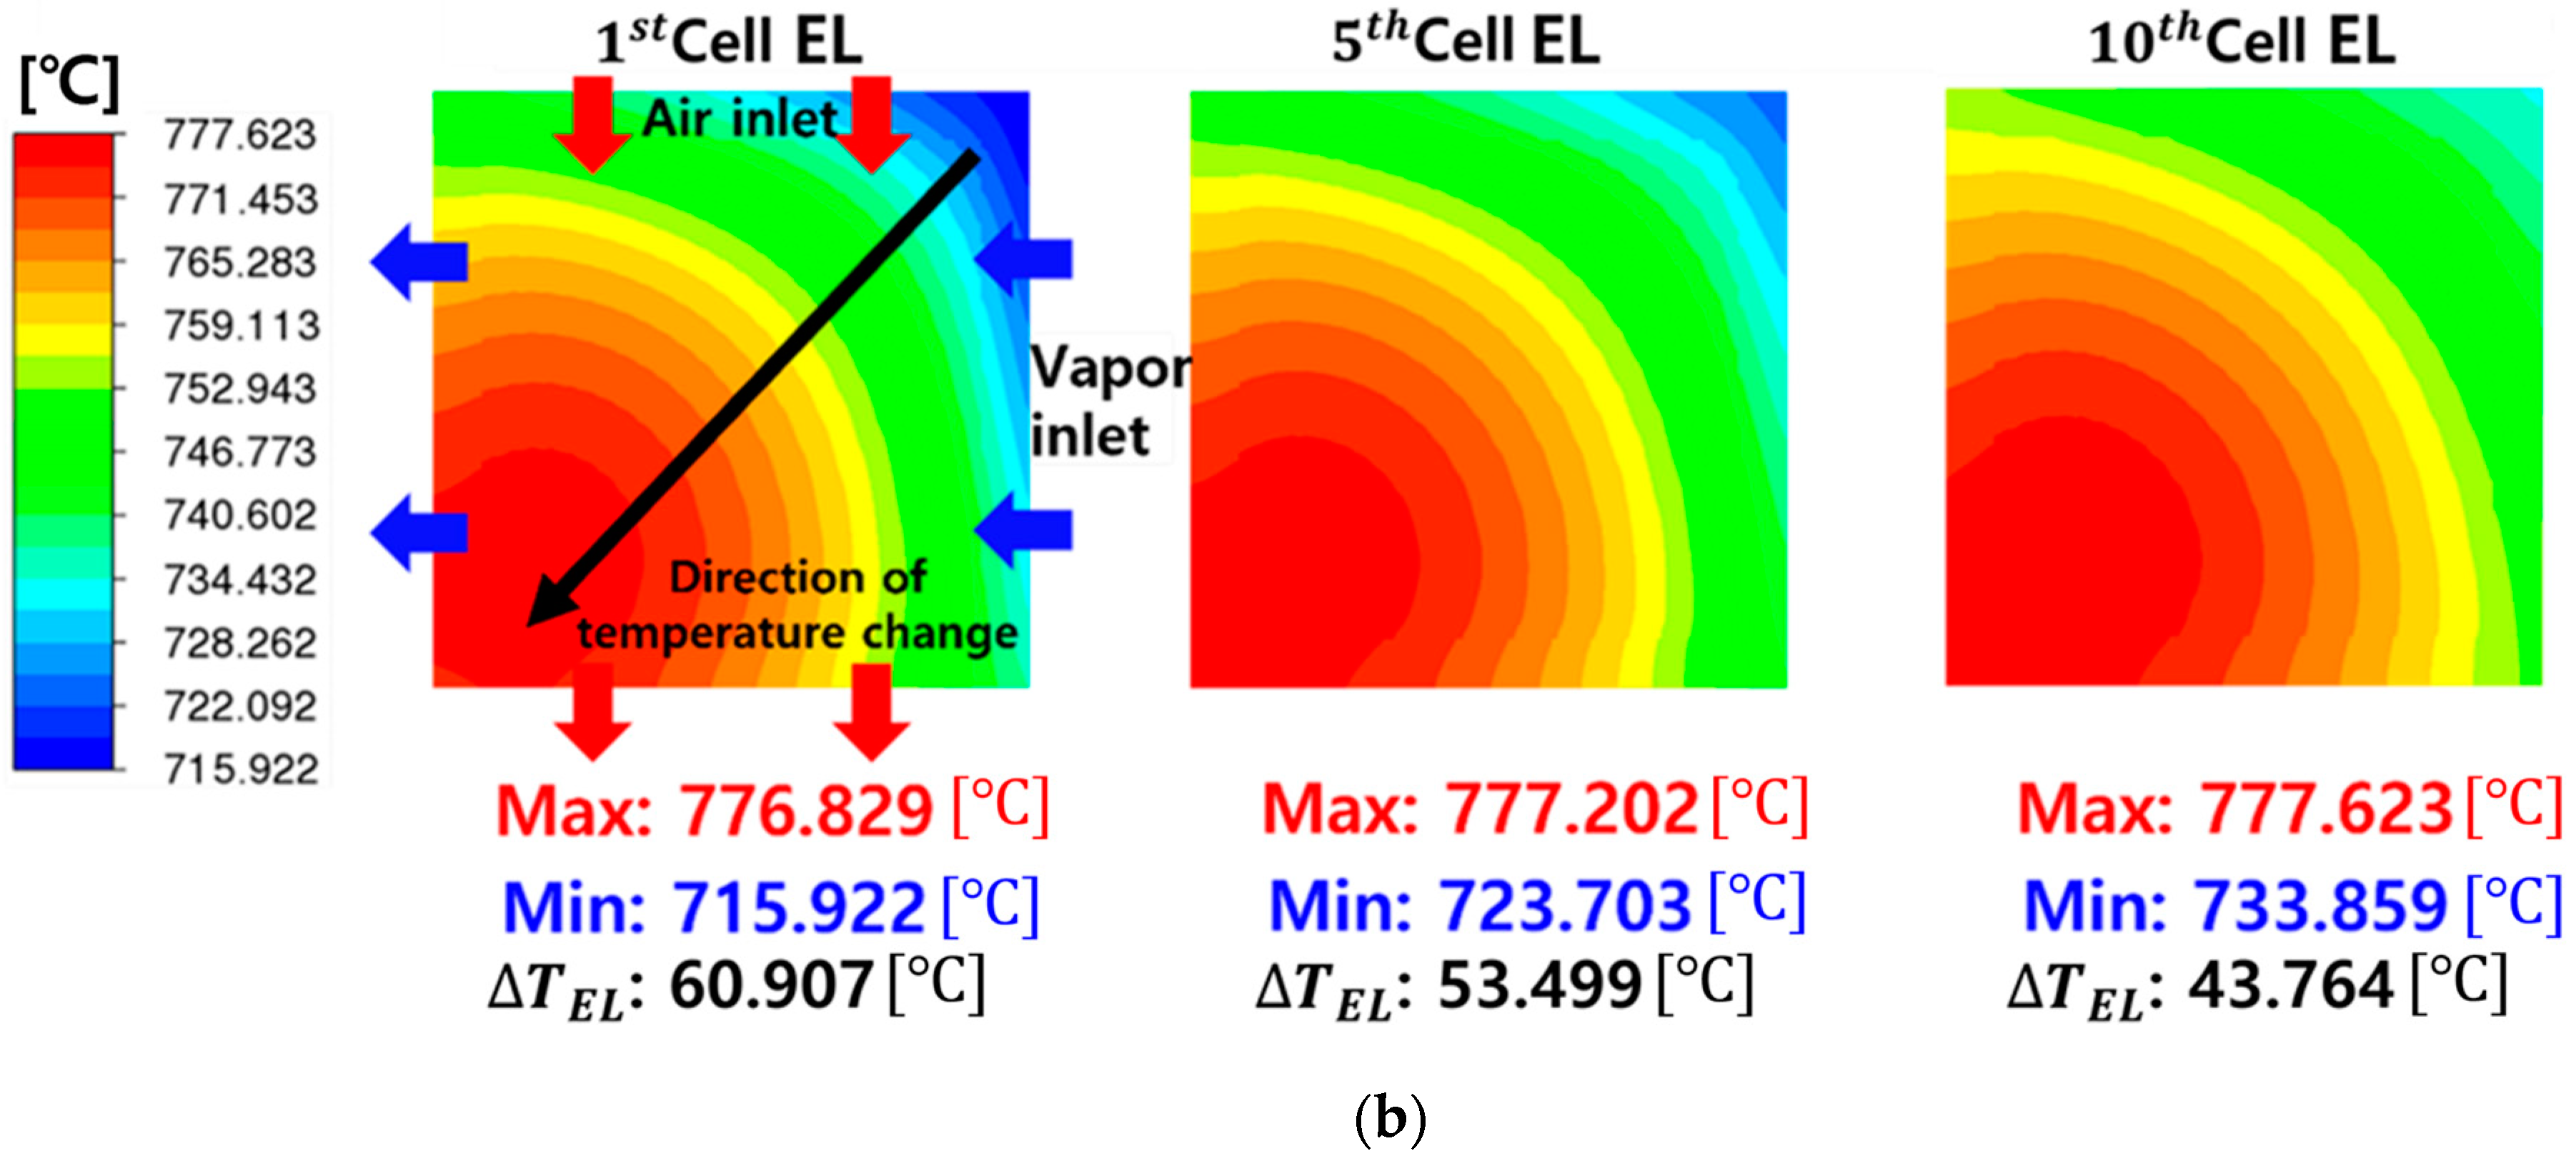
  • A U-type stack with a co-flow configuration exhibits a gradual temperature increase in the electrolyte, leading to a higher minimum temperature for cells at the rear end.
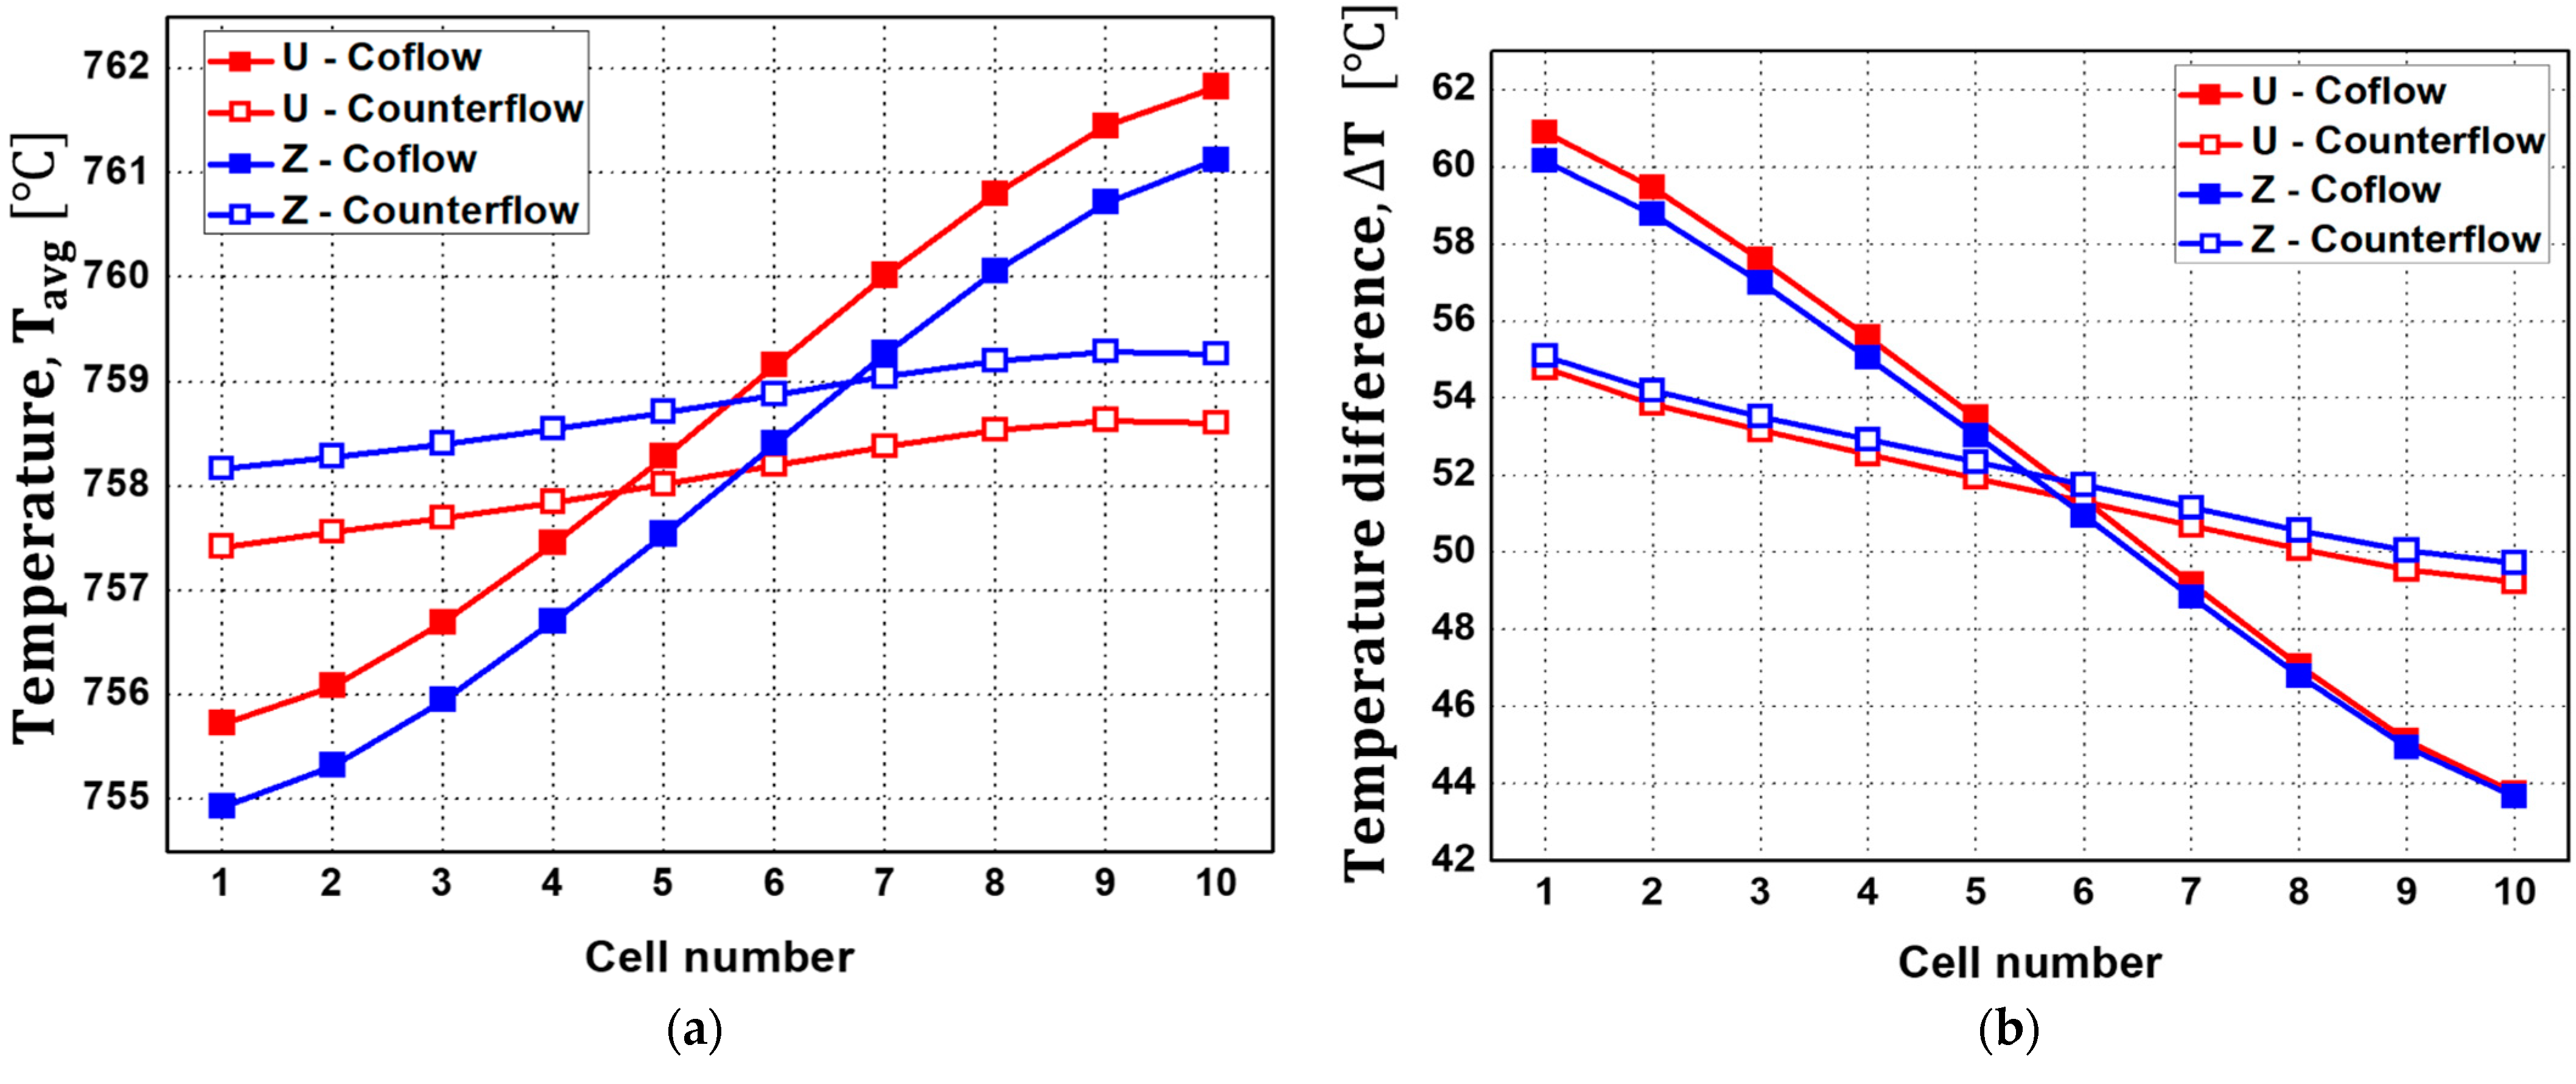
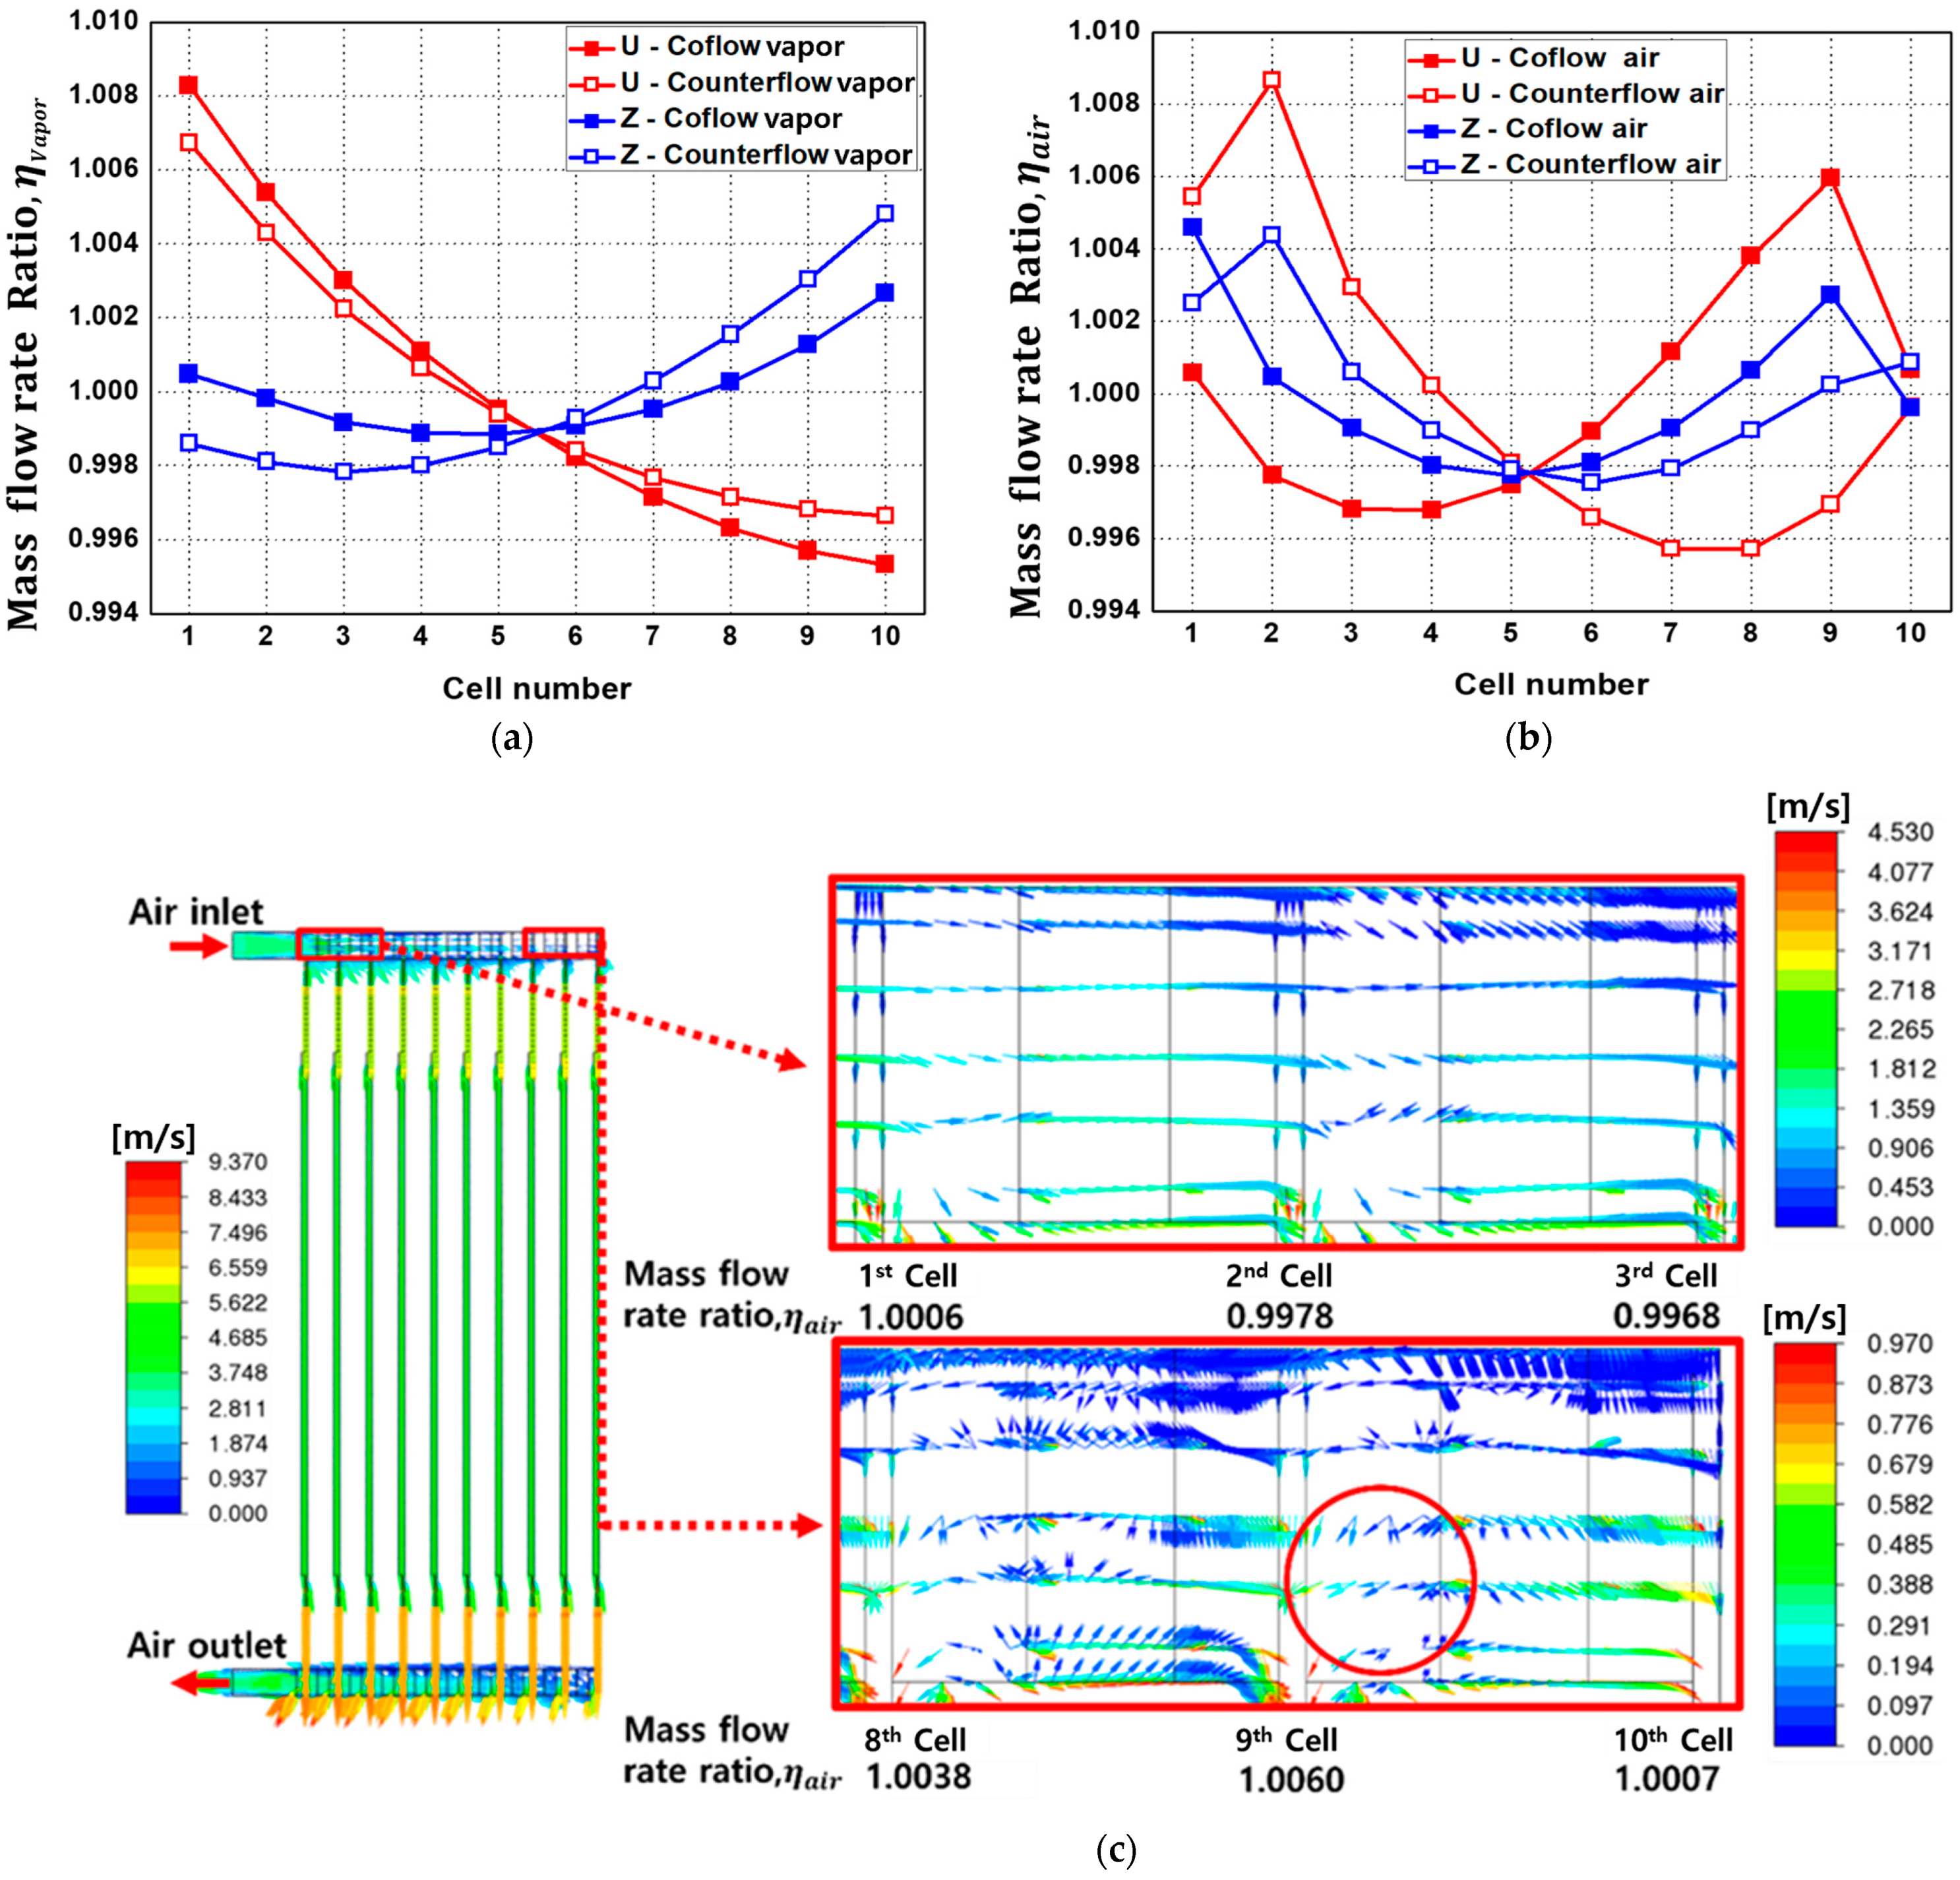
  • Analysis of four different flow configurations revealed no significant differences between U-type and Z-type configurations, but the counter-flow configuration demonstrated a more uniform temperature distribution compared to the co-flow configuration. Specifically, the counter-flow exhibited an approximately 6 °C lower Δ T E L in the first cell compared to that of the co-flow SOEC stack.
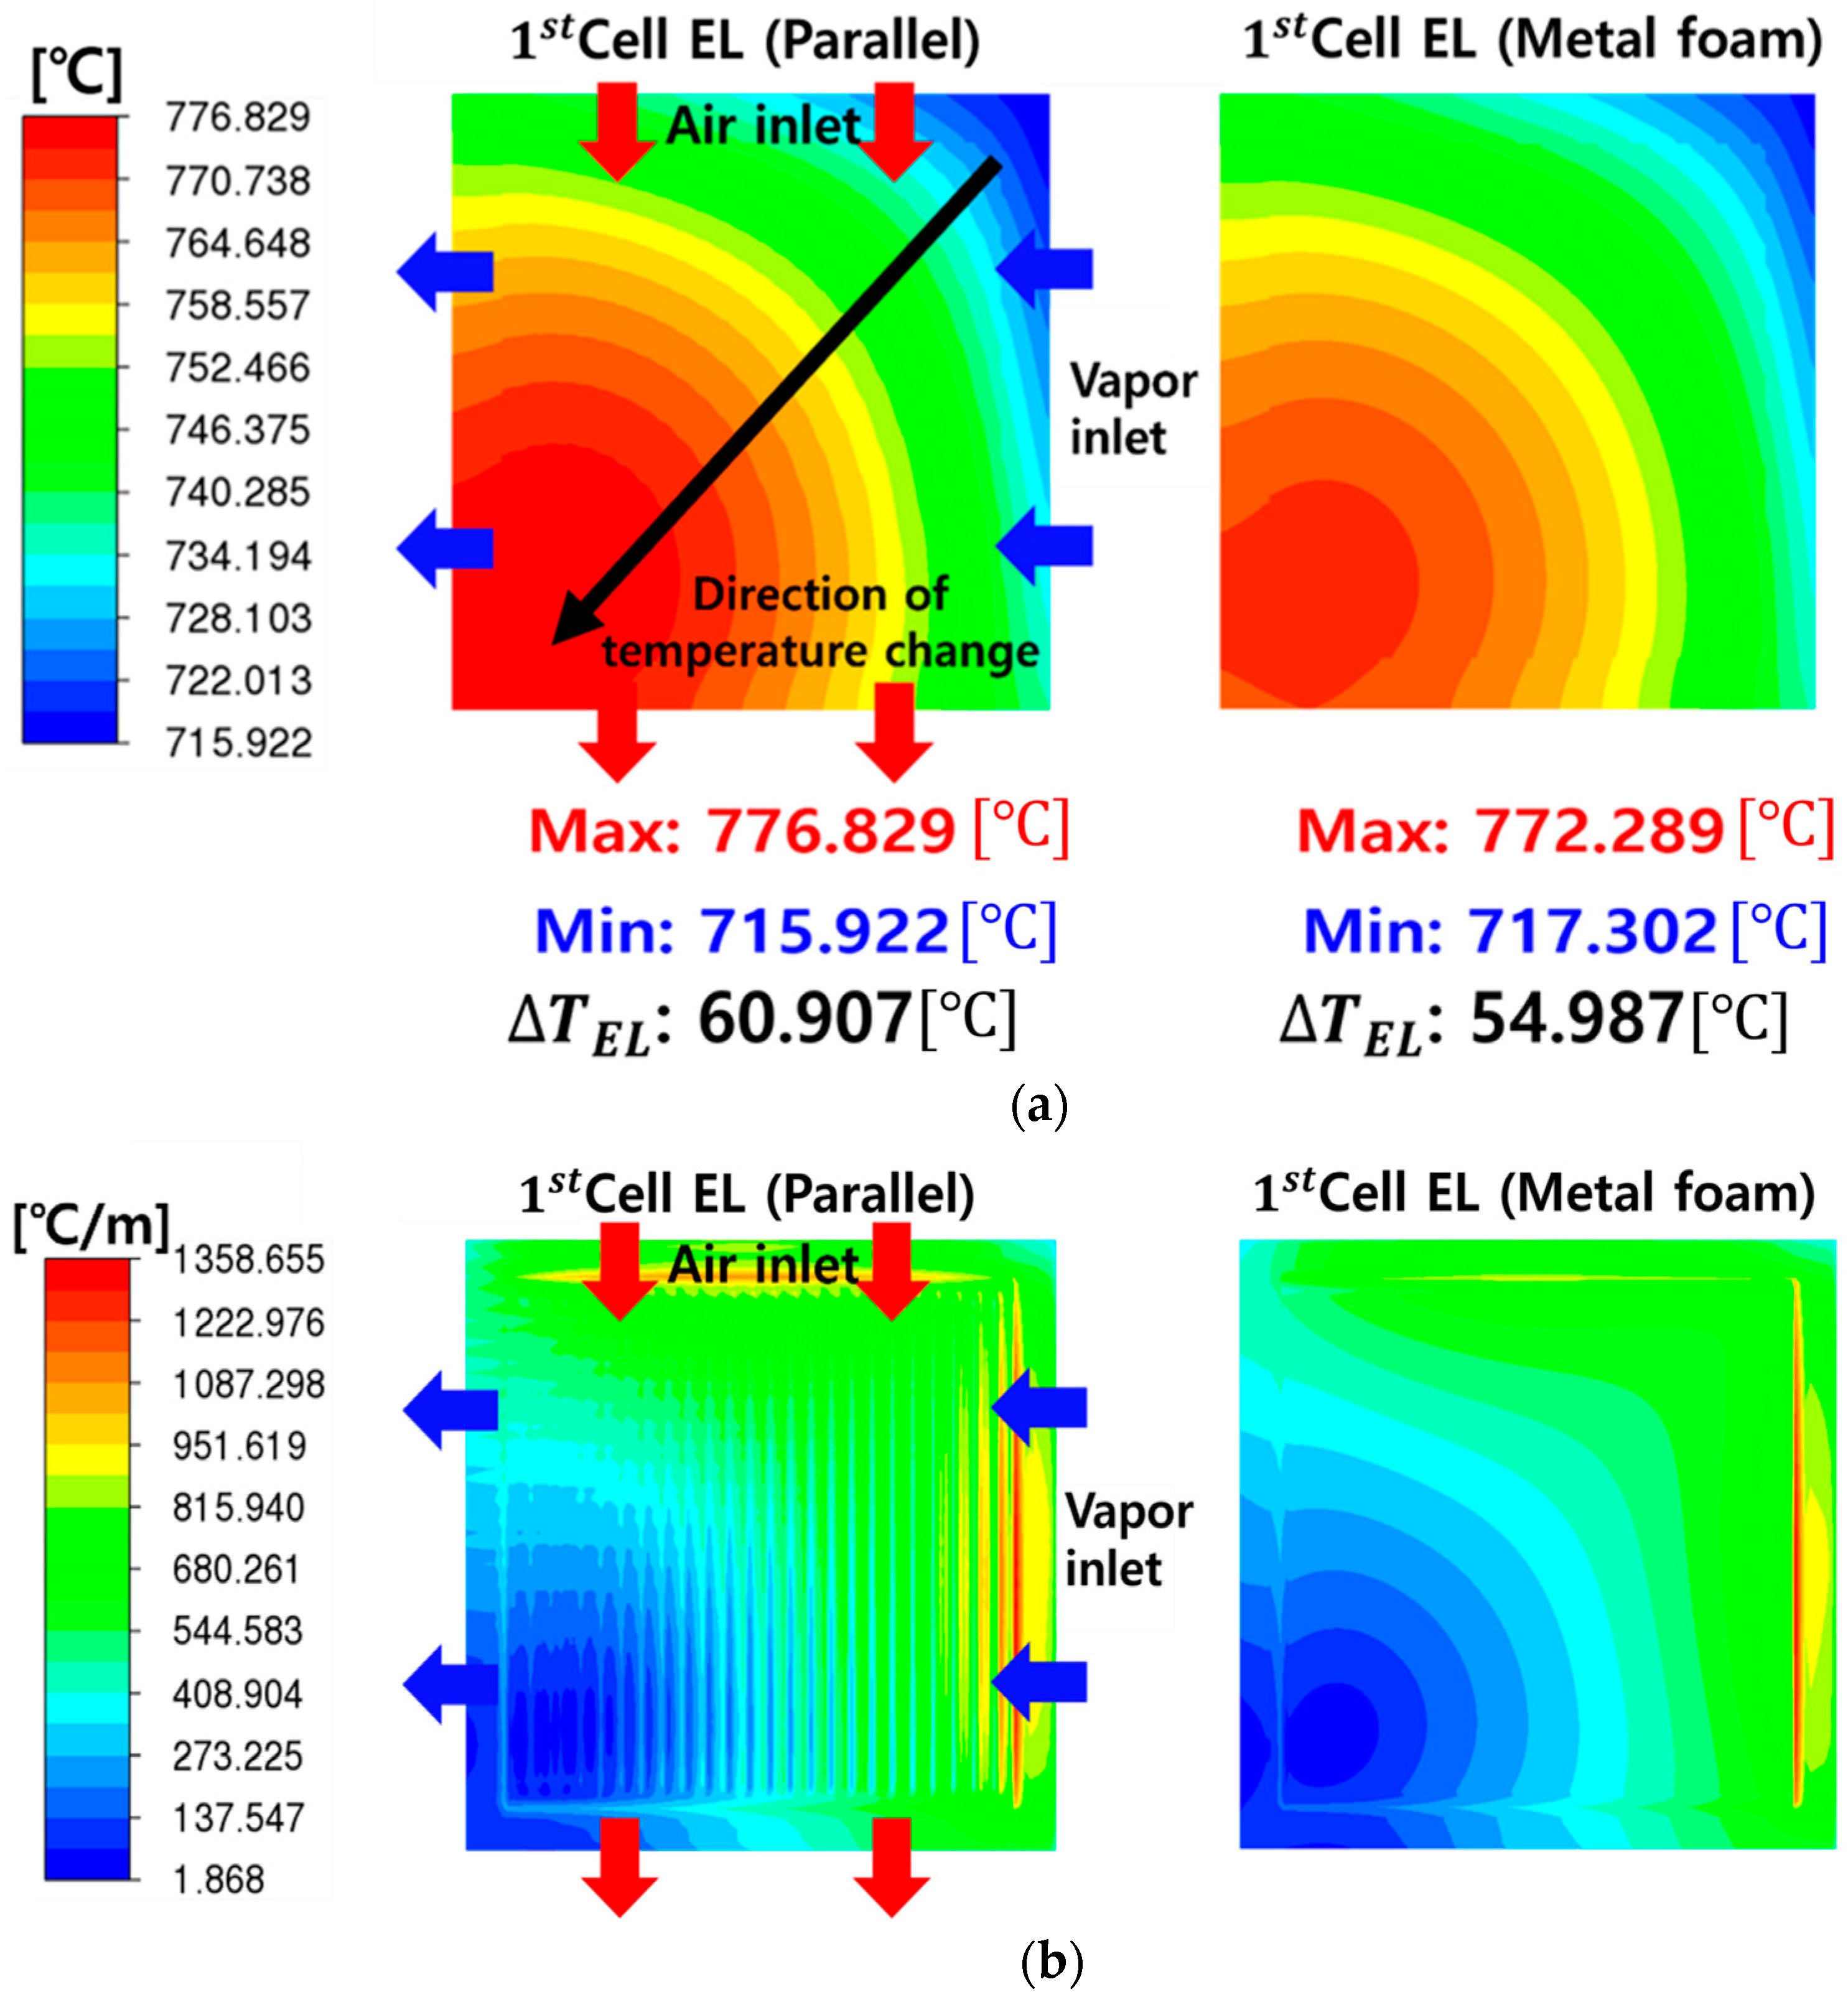
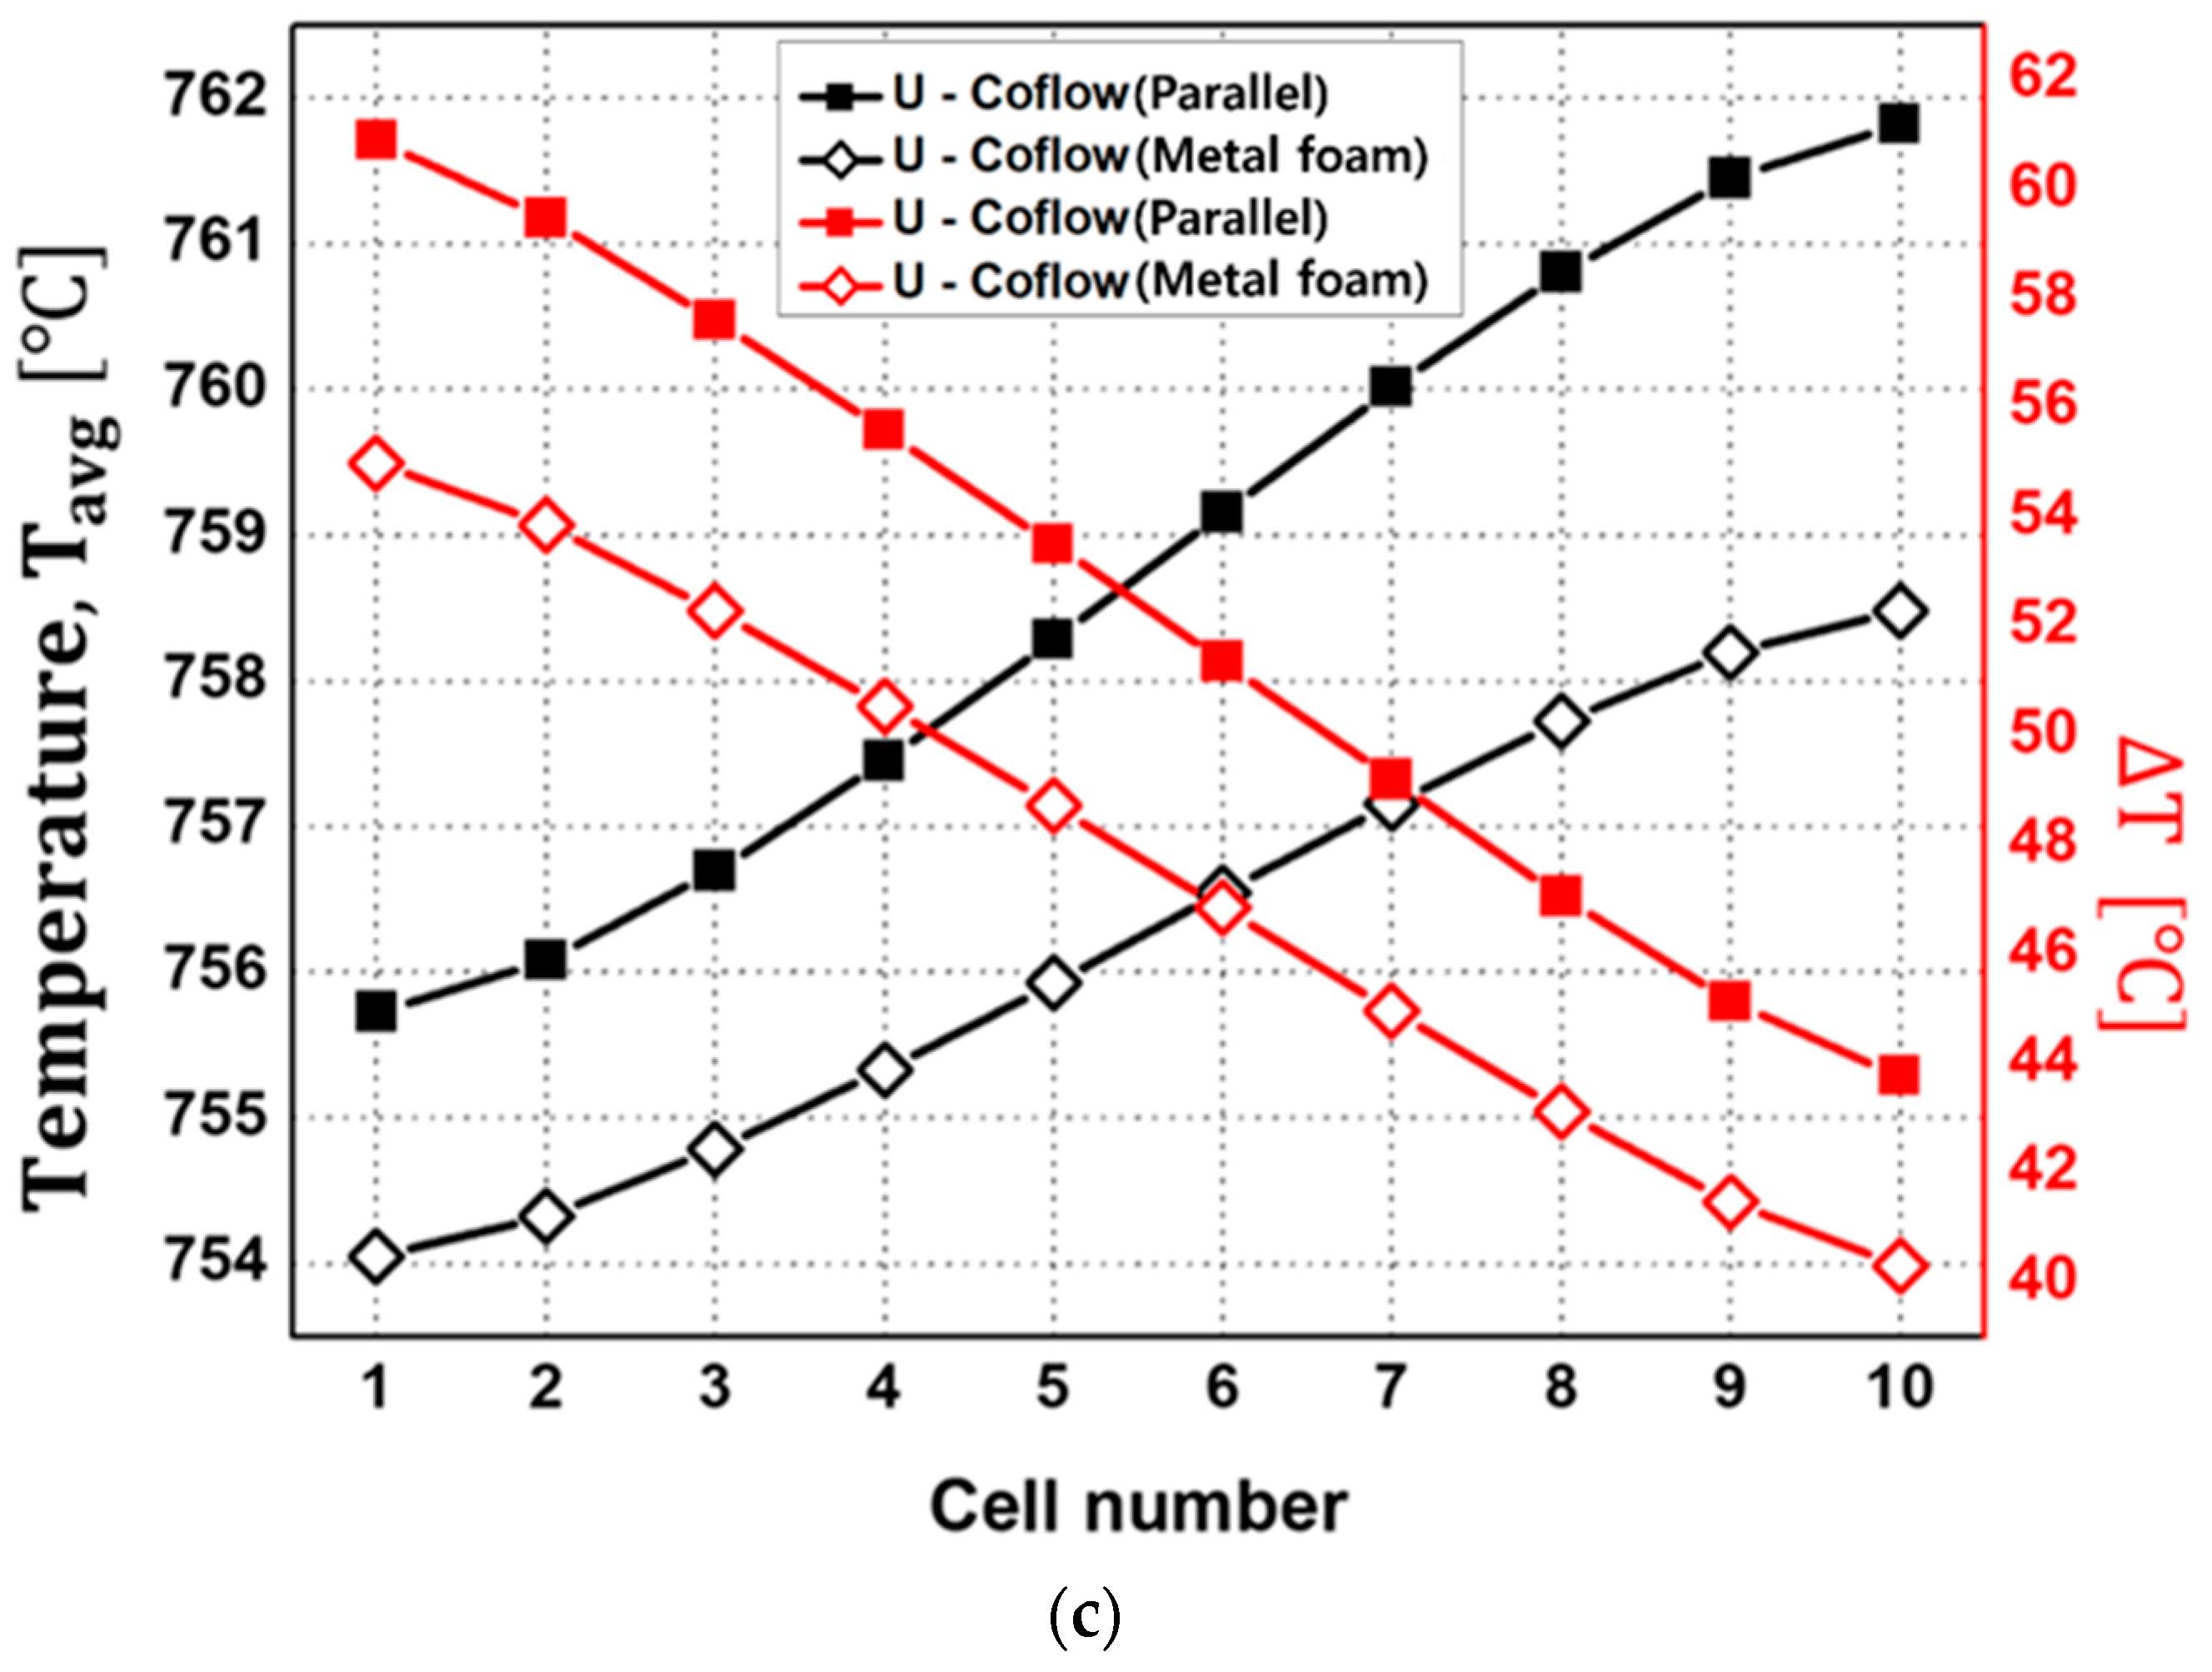
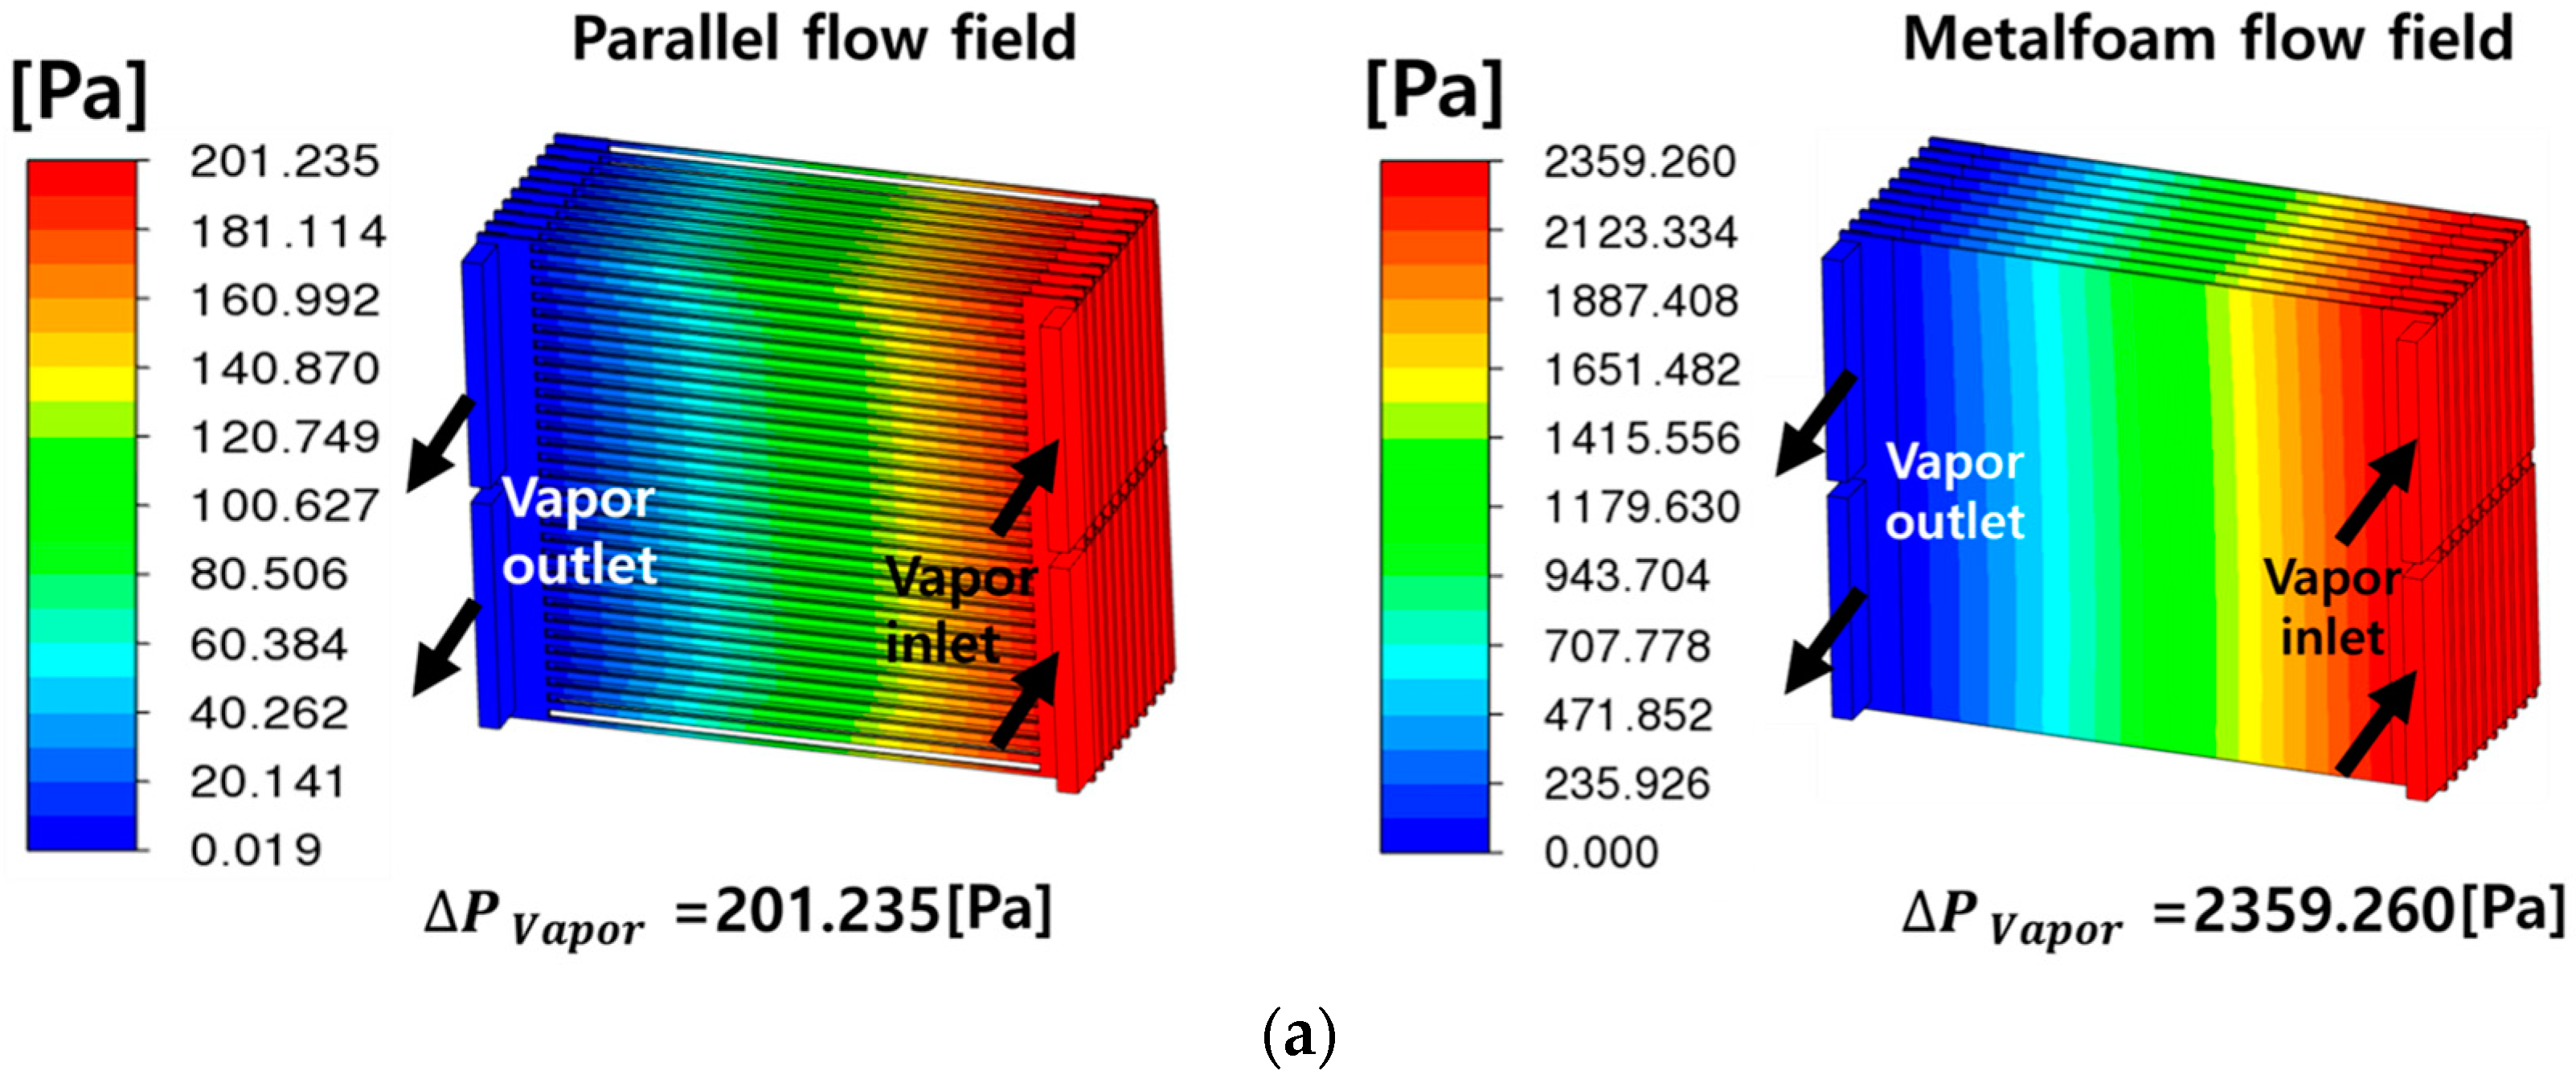
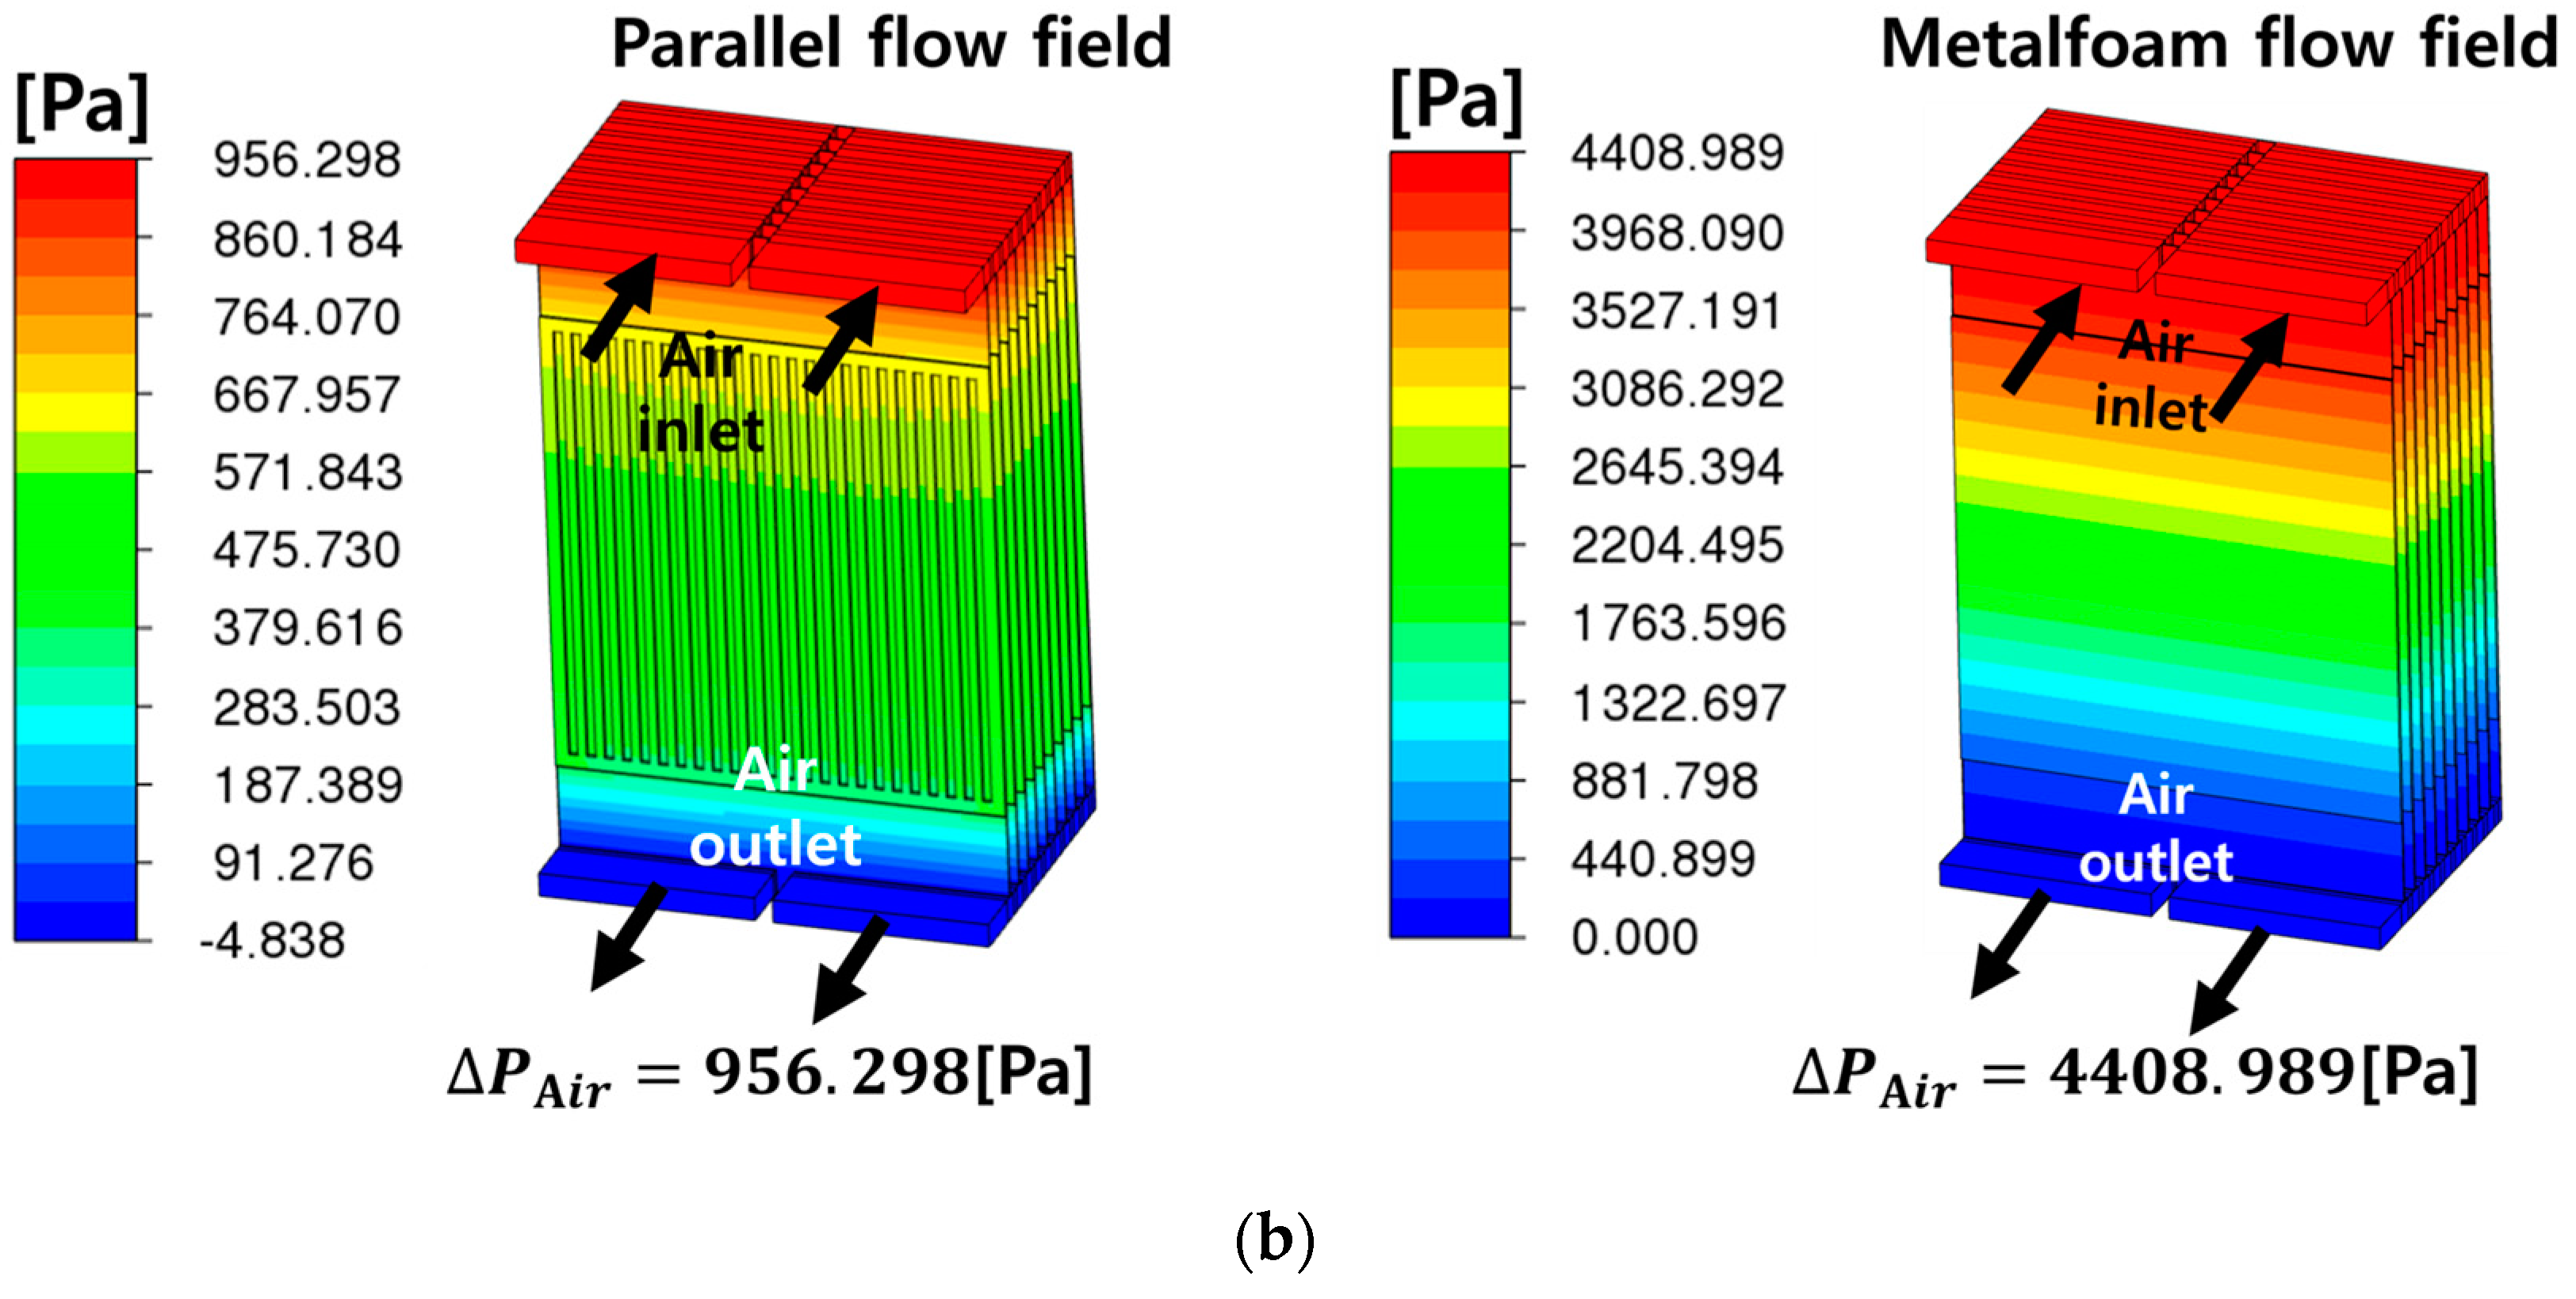
  • The metal-foam-based SOEC stack outperformed the traditional parallel-flow-field design in terms of flow distribution and thermal management, with lower average temperatures and reductions of about 4–7 °C in temperature differences across cells. However, it incurred higher pressure-drops due to the increased resistance of the metal foam structure. The pressure-drop for fuel flow in the metal foam structure is particularly noteworthy, at 11 times that of the parallel flow channel structure.
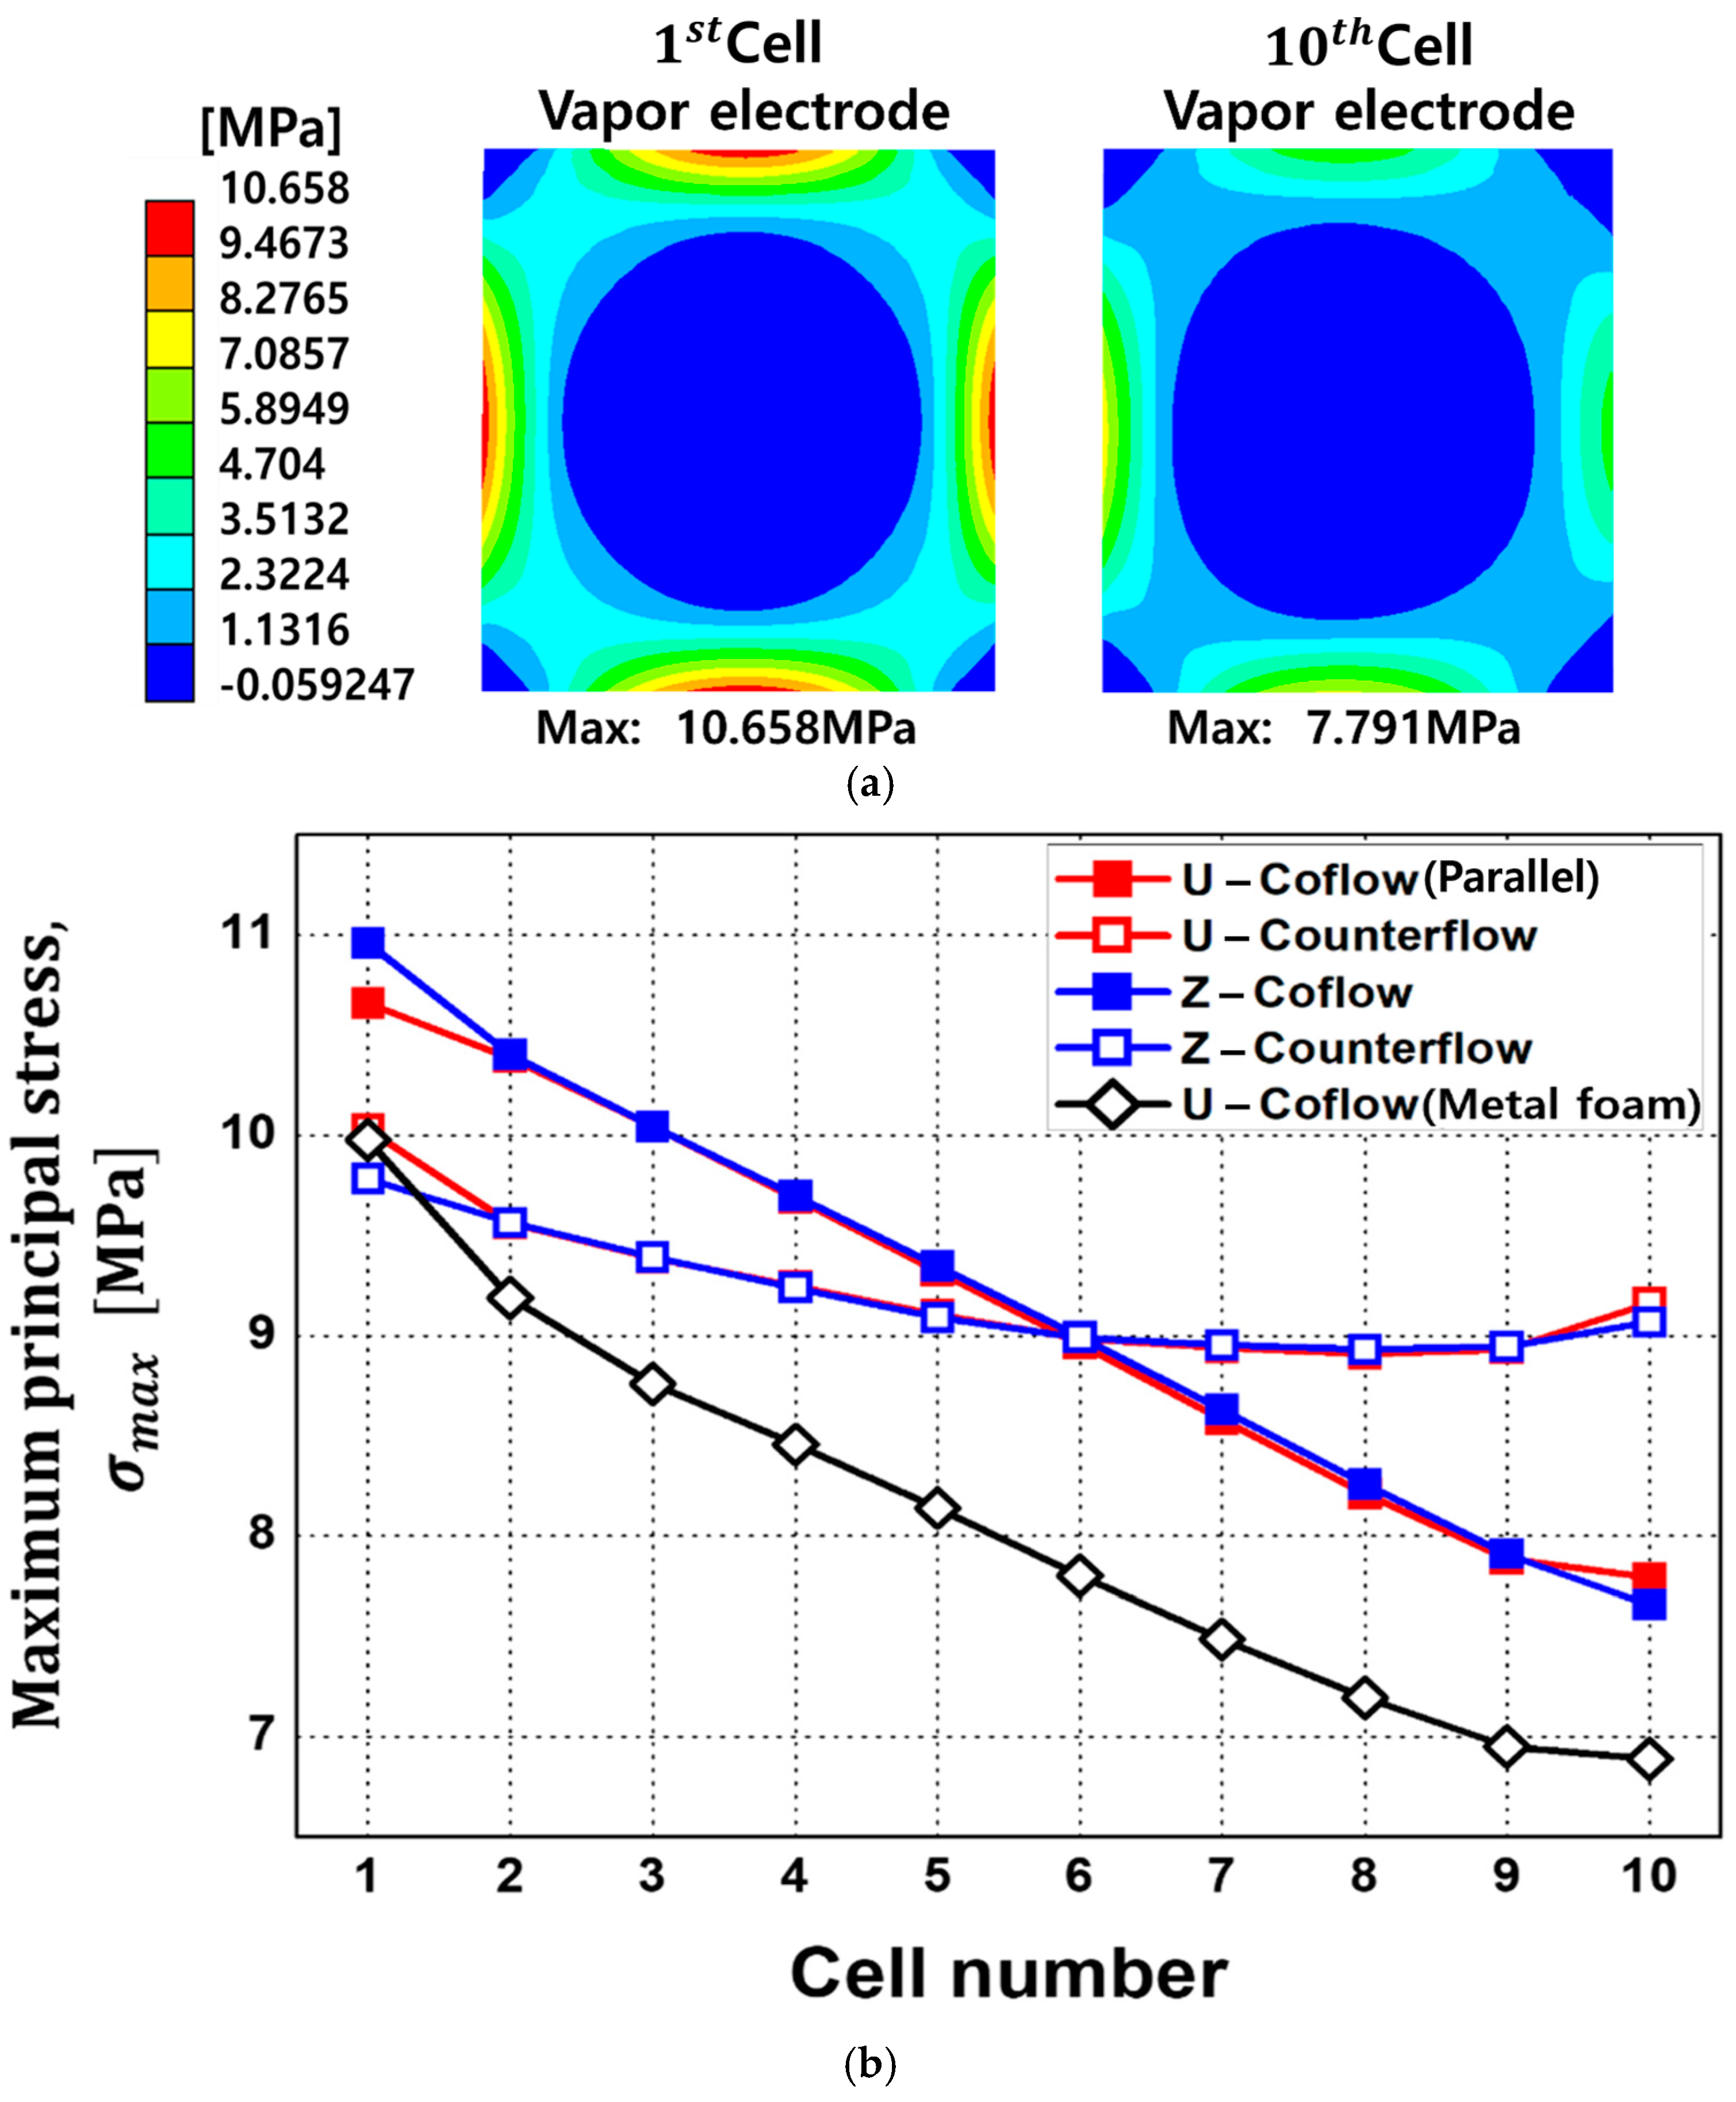
  • Structural analysis showed that the co-flow configuration led to elevated stress at the front of the stack, with the maximum value of 10.658 MPa being measured at the first cell. Unlike the co-flow configuration, the counterflow configuration showed a significant mitigation in stress imbalance in each cell, and this tendency is consistent with the results of CFD temperature analysis. The metal-foam structure consistently demonstrated a reduction in thermal stress across all cells of about 1 MPa, highlighting its potential to alleviate thermal stress in SOEC stacks.

Author Contributions

Conceptualization, H.J.; methodology, Y.K. and H.J.; software, Y.K. and K.L.; validation, K.L. and S.H.; formal analysis, Y.K. and H.J.; investigation, Y.K.; resources, H.J.; data curation, Y.K.; writing—original draft preparation, Y.K. and K.L.; writing—review and editing, H.J. and H.S.; visualization, Y.K., S.H. and K.L.; supervision, H.J.; project administration, H.J.; funding acquisition, H.J. All authors have read and agreed to the published version of the manuscript.

Funding

This study was supported by the Korea Institute of Energy Technology Evaluation and Planning (KETEP) and the Ministry of Trade, Industry & Energy (MOTIE) of the Republic of Korea (No. 20223030040040).

Data Availability Statement

Data available on request due to privacy restrictions.

Acknowledgments

This study was supported by the Korea Institute of Energy Technology Evaluation and Planning (KETEP) and the Ministry of Trade, Industry & Energy (MOTIE) of the Republic of Korea (No. 20223030040040).

Conflicts of Interest

The authors declare no conflict of interest.

Nomenclature

A Area ,   m 2
C p g Specific   heat   at   constant   pressure   of   the   gas ,   J   k g 1 K 1
CrInertial effect constant, m−1
d Depth ,   m
F Faraday s   constant ,   96 , 487   C   m o l 1
GShear modulus of elasticity, Pa
I Current   density ,   A   m 2
KHydraulic permeability, m2
kThermal conductivity, W m−1 K
mfMass fraction
MWMolecular weight, kg/mol
nNumber of electrons transferred in the electrode reaction
PPressure, Pa
R Universal   gas   constant ,   8.314   J   m o l 1   K 1
r Particle   radius ,   m
SSource term in the transport equation or Entropy, J mol−1 K
TTemperature, K
u Fluid   velocity   and   superficial   velocity   in   a   porous   media ,   m   s 1
UCell potential, V
VVoltage, V
W Width ,   m
XMole fraction
Greek
δ Thickness, m
ε Volume fraction or expansion rate
η Overpotential, V
μ Dynamic viscosity, k g   m 1 s 1
ν Atomic diffusion volumes or Poisson’s ratio
ρ Density, k g   m 3
τ Tortuosity or viscous shear stress, N   m 2
Superscripts
airAir electrode
e f f Effective
v a p o r Vapor electrode
TTransposed matrix
thThermal
Subscripts
0Initial conditions or standard conditions, 298.15 K and 101.3 kPa (1 atm)
activeActive
avgAverage
BLBuffer layer
BPBipolar plate
CCCurrent collector
cellCell
DLDiffusion layer
ELElectrolyte layer
FLFunctional layer
H 2 Hydrogen
H 2 O Water
iSpecies or components of SOEC
inInlet
jSpecies
kKnudsen
mMass or particle diffusion
maxMaximum
metalmetal foam
minMinimum
N 2 Nitrogen
O 2 Oxygen
outOutlet
pPore
refReference conditions
sSolid
uMomentum
vaporVapor
xx direction
yy direction
zz direction

References

  1. Holechek, J.L.; Geli, H.M.E.; Sawalhah, M.N.; Valdez, R. A Global assessment: Can renewable energy replace fossil fuels by 2050? Sustainability 2022, 14, 4792. [Google Scholar] [CrossRef]
  2. Gür, T.M. Carbon Dioxide Emissions, Capture, Storage and Utilization: Review of Materials, Processes and Technologies. Prog. Energy Combust. Sci. 2022, 89, 100965. [Google Scholar] [CrossRef]
  3. Pimentel, D.; Herz, M.; Glickstein, M.; Zimmerman, M.; Allen, R.; Becker, K.; Seidel, T. Renewable energy: Current and potential issues: Renewable energy technologies could, if developed and implemented, provide nearly 50% of US energy needs; this would require about 17% of US land resources. Bioscience 2002, 52, 1111–1120. [Google Scholar] [CrossRef]
  4. Weijia, L.; Fushuan, W.; Yusheng, X. Power-to-gas technology in energy systems: Current status and prospects of potential operation strategies. J. Mod. Power Syst. Clean Energy 2017, 5, 439–450. [Google Scholar]
  5. Rashidi, S.; Karimi, N.; Sunden, B.; Kim, K.C.; Olabi, A.G.; Mahian, O. Progress and challenges on the thermal management of electrochemical energy conversion and storage technologies: Fuel cells, electrolysers, and supercapacitors. Prog. Energy Combust. Sci. 2022, 88, 100966. [Google Scholar] [CrossRef]
  6. Hauch, A.; Küngas, R.; Blennow, P.; Hansen, A.B.; Hansen, J.B.; Mathiesen, B.V.; Mogensen, M.B. Recent advances in solid oxide cell technology for electrolysis. Science 2020, 370, eaba6118. [Google Scholar] [CrossRef] [PubMed]
  7. Ebbesen, S.D.; Jensen, S.H.; Hauch, A.; Mogensen, M.B. High Temperature electrolysis in alkaline cells, solid proton conducting cells, and solid oxide cells. Chem. Rev. 2014, 114, 10697–10734. [Google Scholar] [CrossRef]
  8. Min, G.; Choi, S.; Hong, J. A review of solid oxide steam-electrolysis cell systems: Thermodynamics and thermal integration. Appl. Energy 2022, 328, 120145. [Google Scholar] [CrossRef]
  9. Kang, C.; Huaiwu, P.; Junfeng, Z.; Xinxin, X.; Shengchen, Z.; Jingxin, R.; Biao, L.; Yueshe, W. Analysis of performance optimization of high-temperature solid oxide electrolytic cell based on the coupling of flow, heat, and mass transfer and electrochemistry. J. Energy Sci. Eng. 2022, 10, 3918–3927. [Google Scholar] [CrossRef]
  10. Lang, M.; Bohn, C.; Couturier, K.; Sun, X.; McPhail, S.J.; Malkow, T.; Pilenga, A.; Fu, Q.; Liu, Q. Electrochemical quality assurance of solid oxide electrolyser (SOEC) stacks. J. Electrochem. Soc. 2019, 166, F1180–F1189. [Google Scholar] [CrossRef]
  11. Santhanam, S.; Heddrich, M.; Riedel, M.; Friedrich, K. Theoretical and experimental study of Reversible Solid Oxide Cell (r-SOC) systems for energy storage. Energy 2017, 141, 202–214. [Google Scholar] [CrossRef]
  12. Bierschenk, D.M.; Wilson, J.R.; Barnett, S.A. High efficiency electrical energy storage using a methane–oxygen solid oxide cell. Energy Environ. Sci. 2011, 4, 944–951. [Google Scholar] [CrossRef]
  13. Kim, D.H.; Bae, Y.; Lee, S.; Son, J.-W.; Shim, J.H.; Hong, J. Thermal analysis of a 1-kW hydrogen-fueled solid oxide fuel cell stack by three-dimensional numerical simulation. Energy Convers. Manag. 2020, 222, 113213. [Google Scholar] [CrossRef]
  14. Kim, J.; Kim, D.H.; Lee, W.; Lee, S.; Hong, J. A novel interconnect design for thermal management of a commer-cial-scale planar solid oxide fuel cell stack. Energy Convers. Manag. 2021, 246, 114682. [Google Scholar] [CrossRef]
  15. Bao, J.; Karri, N.; Recknagle, K.; Wang, C.; Koeppel, B.; Marina, O.A. Modeling Framework to Analyze Performance and Structural Reliability of Solid Oxide Electrolysis Cells. J. Electrochem. Soc. 2022, 169, 054523. [Google Scholar] [CrossRef]
  16. Nakajo, A.; Mueller, F.; Brouwer, J.; Favrat, D. Mechanical reliability and durability of SOFC stacks. Part I: Modelling of the effect of operating conditions and design alternatives on the reliability. Int. J. Hydrogen Energy 2012, 37, 9249–9268. [Google Scholar] [CrossRef]
  17. Nakajo, A.; Mueller, F.; Brouwer, J.; Favrat, D. Mechanical reliability and durability of SOFC stacks. Part II: Modelling of mechanical failures during ageing and cycling. Int. J. Hydrogen Energy 2012, 37, 9269–9286. [Google Scholar] [CrossRef]
  18. Cui, T.; Xiao, G.; Yan, H.; Zhang, Y.; Wang, J.-Q. Numerical simulation and analysis of the thermal stresses of a planar solid oxide electrolysis cell. Int. J. Green Energy 2023, 20, 432–444. [Google Scholar] [CrossRef]
  19. Kim, S.-D.; Seo, D.-W.; Dorai, A.K.; Woo, S.-K. The effect of gas compositions on the performance and durability of solid oxide electrolysis cells. Int. J. Hydrogen Energy 2013, 38, 6569–6576. [Google Scholar] [CrossRef]
  20. Choi, Y.; Byun, S.; Seo, D.W.; Hwang, H.J.; Kim, T.W.; Kim, S.-D. New design and performance evaluation of 1 kW-class reversible solid oxide electrolysis-fuel cell stack using flat-tubular cells. J. Power Sources 2022, 542, 231744. [Google Scholar] [CrossRef]
  21. Sheng, L.; Zhang, H.; Su, L.; Zhang, Z.; Zhang, H.; Li, K.; Fang, Y.; Ye, W. Effect analysis on thermal profile management of a cylindrical lithium-ion battery utilizing a cellular liquid cooling jacket. Energy 2021, 220, 119725. [Google Scholar] [CrossRef]
  22. Sheng, L.; Su, L.; Zhang, H.; Li, K.; Fang, Y.; Ye, W.; Fang, Y. Numerical investigation on a lithium ion battery thermal management utilizing a serpentine-channel liquid cooling plate exchanger. Int. J. Heat Mass Transf. 2019, 141, 658–668. [Google Scholar] [CrossRef]
  23. Sheng, L.; Zhang, H.; Zhang, H.; Su, L.; Zhang, Z. Lightweight liquid cooling based thermal management to a prismatic hard-cased lithium-ion battery. Int. J. Heat Mass Transf. 2021, 170, 120998. [Google Scholar] [CrossRef]
  24. Sheng, L.; Su, L.; Zhang, H.; Fang, Y.; Xu, H.; Ye, W. An improved calorimetric method for characterizations of the specific heat and the heat generation rate in a prismatic lithium ion battery cell. Energy Convers. Manag. 2019, 180, 724–732. [Google Scholar] [CrossRef]
  25. Afshari, E.; Mosharaf-Dehkordi, M.; Rajabian, H. An investigation of the PEM fuel cells performance with partially restricted cathode flow channels and metal foam as a flow distributor. Energy 2017, 118, 705–715. [Google Scholar] [CrossRef]
  26. Jo, A.; Ju, H. Numerical study on applicability of metal foam as flow distributor in polymer electrolyte fuel cells (PEFCs). Int. J. Hydrogen Energy 2018, 43, 14012–14026. [Google Scholar] [CrossRef]
  27. Zhan, R.; Wang, Y.; Ni, M.; Zhang, G.; Du, Q.; Jiao, K. Three-dimensional simulation of solid oxide fuel cell with metal foam as cathode flow distributor. Int. J. Hydrogen Energy 2020, 45, 6897–6911. [Google Scholar] [CrossRef]
  28. Navasa, M.; Yuan, J.; Sundén, B. Computational fluid dynamics approach for performance evaluation of a solid oxide electrolysis cell for hydrogen production. Appl. Energy 2015, 137, 867–876. [Google Scholar] [CrossRef]
  29. Kakaç, S.; Pramuanjaroenkij, A.; Zhou, X.Y. A review of numerical modeling of solid oxide fuel cells. Int. J. Hydrogen Energy 2007, 32, 761–786. [Google Scholar] [CrossRef]
  30. Green, W.; Don, H.; Robert, P. Perry’s Chemical Engineers’ Handbook; McGraw-Hill Education: New York, NY, USA, 2008. [Google Scholar]
  31. Li, W.; Shi, Y.; Luo, Y.; Cai, N. Theoretical modeling of air electrode operating in SOFC mode and SOEC mode: The effects of microstructure and thickness. Int. J. Hydrogen Energy 2014, 39, 13738–13750. [Google Scholar] [CrossRef]
  32. Nakajo, A.; Kuebler, J.; Faes, A.; Vogt, U.F.; Schindler, H.J.; Chiang, L.-K.; Modena, S.; Van Herle, J.; Hocker, T. Compilation of mechanical properties for the structural analysis of solid oxide fuel cell stacks. Constitutive materials of anode-supported cells. Ceram. Int. 2012, 38, 3907–3927. [Google Scholar] [CrossRef]
Figure 1. (a) Schematic representation of a 10-cell planar SOEC stack and (b) initial temperature distribution inputs, along with boundary conditions, for mechanical SOEC analysis.
Energies 17 00125 g001
Figure 2. Schematic diagram of four SOEC stack configurations with different inlet and outlet locations and flow directions.
Energies 17 00125 g002
Figure 3. Temperature distribution contours for (a) the complete SOEC stack, and (b) the mid-plane of EL in the first, fifth, and tenth cells. The SOEC stack is configured as a U-type structure, with vapor and air supplied in a co-flow direction. The cell operates at a voltage of V c e l l = 1.4   V and a current density of I E L = 0.6944   A / c m 2 .
Energies 17 00125 g003aEnergies 17 00125 g003b
Figure 4. Comparison of (a) average temperature and (b) temperature deviation within the EL of individual SOEC stack cells under operating conditions V c e l l = 1.4   V   a n d   I E L = 0.6944   A / c m 2 .
Energies 17 00125 g004
Figure 5. Mass-flow rate ratio comparisons for individual cells of the SOEC stack with V c e l l = 1.4   V ,   I E L = 0.6944   A / c m 2 : (a) fuel vapor flow rate ratio, (b) air flow rate ratio, and (c) air velocity vector profile in the U-type stack.
Energies 17 00125 g005
Figure 6. Schematic representations of the U-type SOEC stack: (a) with parallel flow-field design and (b) with metal foam design.
Energies 17 00125 g006
Figure 7. Comparison of mass-flow rate ratios for individual cells of the SOEC stack, with V c e l l = 1.4   V ,   I E L = 0.6944   A / c m 2 : (a) fuel vapor flow rate ratio and (b) air flow rate ratio. The SOEC stacks utilize a U-type and co-flow configuration and are equipped with either metal foam or a parallel flow field.
Energies 17 00125 g007
Figure 8. Comparison of (a) temperature distribution, (b) local temperature gradient on the EL of the first cell, and (c) average temperature and temperature deviations within the EL of individual SOEC stack cells. The SOEC stacks are equipped with either metal foam or parallel flow fields which operate at V c e l l = 1.4   V ,   I E L = 0.6944   A / c m 2 .
Energies 17 00125 g008aEnergies 17 00125 g008b
Figure 9. Comparison of pressure-drop through the SOEC stacks equipped with the metal foam and parallel flow field: (a) pressure-drop in the vapor fuel side and (b) pressure-drop in the air side. The SOEC stacks operate at V c e l l = 1.4   V ,   I E L = 0.6944   A / c m 2 .
Energies 17 00125 g009aEnergies 17 00125 g009b
Figure 10. (a) Contours depicting maximum principal stress distributions in the vapor FL of the first and tenth cells of the U-type SOEC stack with a co-flow configuration, and (b) maximum principal stress in the vapor FLs in different SOEC stack designs.
Energies 17 00125 g010
Table 2. Transport and mechanical properties for individual SOEC components.
DescriptionValueRef.
Viscosity   coefficient   of   H 2 / H 2 O / N 2 / O 2   at   298.15   K ,   ( μ 0 , H 2 / μ 0 , H 2 O / μ 0 , N 2 / μ 0 , O 2 ) 8.91 · 10 6 / 1.04 · 10 5
/ 2.06 · 10 5 / 1.77   · 10 5
k g / ( m · s )
[28]
Exponent value in H2/H2O/N2/O2 relation of Equation (15), m 0.65 / 1.06 / 0.69 / 0.68 [28]
Effective thermal conductivity of CC/vapor DL/vapor FL/electrolyte/BL/air FL/BP,
( k C C e f f / k F u e l   D L e f f / k F u e l   F L e f f / k E L e f f / k B L e f f / k A i r   F L e f f / k B P e f f )
10.0 / 11.0 / 11.0 / 2.12
/ 2.12 / 6.0 / 25
W / ( m · K )
[29]
Thermal conductivities of H2/H2O/N2/O2,
( k H 2 / k H 2 O / k N 2 / k O 2 )
0.2040 / 0.0237 / 0.0293 / . 0.0296 W / ( m · K ) [30]
Porosity of CC/vapor DL/vapor FL/air FL/metal foam,
( ε C C / ε v a p o r   D L / ε v a p o r   F L / ε a i r   F L / ε m e t a l )
0.5 / 0.38 / 0.2 / 0.27 /0.8[14,25]
Tortuosity   of   CC / vapor   DL / vapor   FL / air   FL ,   ( τ C C / τ v a p o r   D L / τ v a p o r   F L / τ a i r   F L ) 1.5 / 3.0 / 5.0 / 5.0 Assumed
Pore   radius   of   CC ,   vapor   DL ,   vapor   FL ,   air   FL ,   ( r p , C C / r p , v a p o r   D L / r p , v a p o r   F L / r p , a i r   F L ) 2.4 / 0.35 / 0.15 / 0.2   ( μ m ) [31]
Permeability   of   metal   foam ,   ( K m e t a l ) 3 · 10 9 ( m 2 ) [25]
Thermal   expansion   coefficients   of   vapor   electrode ,   ( α ) 1.237 · 10 5   ( 1 / ° C ) [32]
Young’s modulus, (E) 119.9   ( G P a ) [32]
Poisson’s ratio0.32[32]
Table 3. Cell dimensions and boundary/operating conditions.
Description Value
GCWidth, W G C (vapor electrode/air electrode)2.0/2.0 mm
Depth, d G C (vapor electrode/air electrode)1.0/1.0 mm
ThicknessCC, δ c c (vapor electrode/air electrode)0.8/0.1 mm
Vapor DL, δ v a p o r   D L 0.2 mm
FL, δ F L (vapor electrode/air electrode)0.03/0.015 mm
EL, δ E L 0.005 mm
BL, δ B L 0.005 mm
Active area, A a c t i v e (air FL, EL)100/144 cm2
Inlet area, A i n (vapor electrode/air electrode)5.6/4.8 cm 2
Operating cell voltage1.4 V
Operating current density, I E L 0.6944   A / c m 2
Inlet temperature, T i n 650 °C
Inlet pressure, P i n (vapor electrode/air electrode)101.325/101.325 kPa
Mole fraction, X i
(vapor electrode (H2:H2O)/air electrode (O2:N2))
0.2:0.8/0.21:0.79
Gas flow rate (H2O/H2/Air) 27.86/6.96/16.58 slpm
Thermal boundary, except for the inlet and outlet regions T n = 0
Disclaimer/Publisher’s Note: The statements, opinions and data contained in all publications are solely those of the individual author(s) and contributor(s) and not of MDPI and/or the editor(s). MDPI and/or the editor(s) disclaim responsibility for any injury to people or property resulting from any ideas, methods, instructions or products referred to in the content.

