Abstract
Water can be an irritant to a power transformer, as it is recognized as a major hazard to the operation of transformers. The water content of a transformer insulation system comprises the water in the transformer insulation oil and in the cellulose paper. The increase in the water content in the insulation system leads to reduced breakdown voltage, accelerated aging of the oil–paper insulation system, and the possibility of producing bubbles at high temperatures. Therefore, various techniques have been applied to measure the water content in both oil and paper insulation. This article comprehensively reviews and analyzes the methods (technically or nontechnically) that have been used to monitor the water content in transformer insulation systems. Apart from discussing the advantages and major drawbacks of these methods, the accuracy, measurement time, and cost of each technique are also elucidated in this review. This review can be extremely useful to the utility in monitoring and maintaining the good condition of transformers. Based on the reviewed methods and their challenges, a few future research directions and prospects for determining the water content in transformer insulation systems are outlined, such as utilizing artificial intelligence and enhancing current techniques.
1. Introduction
Power transformers are one of the most expensive pieces of equipment in power systems that play an essential role in ensuring the flow of electricity in our everyday life [1]. The reliable operation of a power system is dependent on the transformer’s health. Any fault on the transformer reduces the reliable operation of the power system and results in high losses as well as damages to both operators and users. Therefore, special care is needed to ensure that transformers are well-protected from all types of faults. The health of a transformer depends on the insulation system, which is responsible for providing better performance when the transformer is operated. Therefore, properly utilizing the insulation materials present within the transformer will deliver a transformer’s excellent performance. A power transformer’s insulation materials primarily consist of cellulose (paper/pressboard) and oil.
Many factors can cause a transformer to fail unexpectedly: temperature, humidity, acidity, oil contamination, oil viscosity, oil break down voltage, and degree of polymerization in the cellulose paper [2]. Water content in the oil–paper insulation system would be the most significant among the factors. The presence of water in the transformer oil–paper insulation system can lead to dielectric failure, acceleration of cellulose’s aging process, and emission of gas bubbles at high temperatures [3]. Therefore, assessing the transformer condition with an accurate measurement of the water content in transformer insulation plays a significant role in securing the longevity of the transformer, maintaining its efficiency, and optimizing the asset life.
The research on determining the water content in the transformer insulation system is gaining importance since the water can cause detrimental effects to the power transformer. Many methods have been developed to measure the water content in the oil–paper insulation transformers. Extensive research articles discussed the water content measurements in the oil–paper insulation using different methods, such as Karl Fischer titration (KFT), water activity probe or moisture sensor, and frequency domain spectroscopy (FDS) [4,5,6,7,8,9]. A review paper [10] was published that discussed the water content measurement in the transformer insulation system. However, this review paper only focuses on the methods used by the utility. Meanwhile, other published review papers focused on fault detection and monitoring the condition of the transformer, which includes testing a few oils [11].
This review fills the gap by comprehensively discussing the methods used to measure the water content in oil and cellulose paper applied both in the laboratory and industry. The principles and procedures of the method will be included, and each method will be compared based on their accuracy, cost, measurement time, and other relevant parameters. Furthermore, the findings presented in this paper can serve as a resource for the researchers and industrial players who are currently developing an accurate and cost-saving method to determine water content in the transformer insulation system.
2. Transformer Insulation System
Insulation is one of the most important qualities that a transformer has and is responsible in providing the reliability, efficiency, and longevity of a transformer. Insulation systems in power transformers consist of a liquid together with solid materials. The most-common insulation used in a power transformer is mineral oil and cellulose paper. Oil is used as an insulating fluid that can disperse the heat from the transformer’s core and functions to protect the cellulose paper. Cellulose paper acts as a dielectric by storing electrical charge when the transformer is energized and also contributes to better thermal health of the transformer by creating cooling ducts for the oil. The inseparable oil–paper insulation performs its roles best when it is clean, dry, relatively void-free, and utilized within a certain temperature bandwidth. Therefore, it is very important and necessary to maintain good insulation during operation.
2.1. Transformer Insulation Oil
Insulation oil plays a significant role in the transformer insulation system, mainly when operating in a high-voltage environment or condition. The insulation oil acts as a coolant to dissipate heat losses and is usually placed in a tank where the transformer’s core is set. Petroleum oil, more specifically, naphthenic and paraffinic base oil derived from crude oil, have been the most commonly used as insulation oils [12]. However, due to the high pour point from the presence of wax of paraffin in the oil which cause the precipitation of the oxidation product at the bottom of the tank, naphthenic oil, which is generally wax-free, has become the predominant petroleum oil in use.
Naphthenic oil is a naphtha-based product that consists of hydrocarbon and usually comes from the residual oil fractions of the appropriate viscosity level. The advantages of naphthenic oil as an insulation are its high dielectric strength, excellent heat transfer characteristics, and low-cost materials [13]. However, the naphthenic oil will degrade after its usage, resulting in faults and costly repairs. Initially, the quality of the insulation oil will be affected by oxidization and contamination that occur in the oil. Oxidization is an acid that forms in the oil when it comes in contact with oxygen, whereas contamination includes water and particulate commonly found in insulation oil. The high acid content and contamination in the insulation oil will accelerate the deterioration of the insulating qualities of the oil and, if left untreated, will cause the transformer to fail. A proper preventive maintenance program should be carried out to avoid any costly interruption and expensive repairs. Testing the insulation oil is a part of the preventive maintenance program that will help to determine when corrective measures are required.
One of the assessment tests is to examine the oil color (ASTM D1500), a qualitative method that will indicate the aging and the presence of the contaminant in the oil. The darker the oil color, the higher the contamination [11]. The changes in the temperature during the operation of a power transformer will cause an increase in oil acidity. The acid number test (ASTM D974) can also be carried out as a part of a preventive maintenance program to measure the sludge-causing acid present in the oil. In addition, the test on dielectric breakdown (ASTM D877) can also be performed, as the contaminant will lower the dielectric breakdown. Last but not least, the water can be seen as the worst contamination because it will reduce the transformer insulation system by decreasing the dielectric strength. A transformer’s health is closely dependent on a knowledge of the water content in the insulation. Consequently, tests on the water content (ASTM D1533) should be performed regularly due to the negative effect on the insulation.
This review will focus on the detection methods of the water content in the transformer insulation system, both oil and paper. Usually, the terms moisture and water are used interchangeably, thinking they mean the same. However, there is a slight difference between them because moisture content determines the amount of water vapor and other volatile components present in a sample. In contrast, water content measures the total amount of water in a sample.
Water can exist in insulation oil at different states: dissolved water, emulsified water, and free water [14]. Table 1 shows the properties of each type of water in transformer oil. Dissolved water is also hydrogen-bonded to the hydrocarbon molecules of oil. The amount of water dissolved increases with increasing temperature, but there is no visible indicator present until the water molecules are saturated in oil and form the emulsion. A cloudy solution appearance indicates that the transformer needs to be cleaned or dried at this stage. Emulsified water is chemically bound water that forms at higher temperatures and is normally found in aged oil [15]. This state of water has a potential hazard for dielectric strength. It is difficult to remove using conventional methods such as circulating hot air and vapor phase drying in a vacuum chamber [16]. Since the oil cannot dissolve much water, water in oil (WCO) is measured in μg/g, where 1 μg of oil in 1 g of water is equal to 1 part per million (ppm).

Table 1.
Properties of water that exist in transformer oil.
2.2. Transformer Insulation Paper
Transformer insulation paper is primarily composed of cellulose. Cellulose is an organic compound of glucose molecules linked together to form a linear polymeric chain [7]. The polymeric chains are represented as an [C6H10O5]n, where n is the average number of glucose rings in the molecule and is measured in the degree of polymerization [17]. Only high-grade cellulose obtained from vegetable sources such as cotton, hemp, manila, straw, wood, and coniferous/deciduous trees were used to sustain the transformer insulation paper/pressboard’s electrical and mechanical strength [8,9]. Generally, solid insulation is made from two cellulose types: kraft paper (made from kraft pulp) and thermally upgraded paper (nitrogen-added compound). The combination of these two qualities of cellulose paper will reduce the rate of paper decomposition over the lifetime and increase transformer life [10]. Another benefit of cellulose material is that the material is cheap and largely available. Additionally, cellulose materials easily absorb impregnating materials and has the flexibility to be shaped [18].
The strength of the paper is dependent on its tensile strength. Consequently, the tensile strength of the paper is directly proportional to the length of the cellulose chain. The length of the cellulose chain will become shorter with the presence of water since the cellulose consists of polar glucose rings that can dissolve high quantities of water via hydrolysis reaction (Figure 1). Hydrolysis will occur when the interactions of a hydrogen atom from the cellulose chain form hydrogen bonds with OH-groups from the glucose rings. Water molecules may also form multiple layers attracted to glucose chains and weakly bonded via Van der Waals interactions [19]. Hydrolysis reaction will cause depolymerization of cellulose chains and decrease the tensile strength of the paper, reducing the mechanical stability of the transformer insulation, hence reducing the lifespan of the transformer. Moreover, hydrolysis of cellulose chains also risks bubble formation, especially when a sudden increase in the temperature where the water adsorbed to the cellulose is suddenly released into the oil [14]. Overload of bubble formation may weaken the dielectric strength and cause the transformer to fail catastrophically [7].
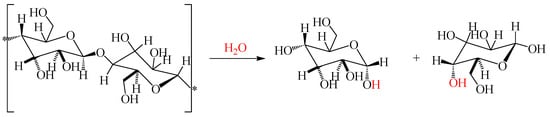
Figure 1.
Hydrolysis reaction of cellulose structure.
Water in the paper may be found in four states: it may be adsorbed to surfaces, as vapor, as free water in capillaries, and as free water. Water can be accumulated on paper more than in oil due to its hygroscopic properties. Several methods have been developed to remove water from paper insulation during operation, such as freeze-drying, heat and vacuum treatment, and the use of molecular sieves and cellulose cartridge filters. Water content in the paper (WCP) is typically expressed in percentage (%), which is the weight of the water content divided by the weight of the dry oil-free paper [20].
3. Sources of Water in Oil–Paper Insulation Transformers
As an essential equipment in an electrical power system, a power transformer undergoes a complicated manufacturing process to meet a high-standard design. Therefore, special attention must be given to the drying process during manufacturing, as it is one of the most critical processes to remove excessive water contaminants from the paper insulation [15]. The transformers are dried during manufacturing with a standard practice of achieving a WCP of at less than 1.0% [16]. However, the water content of the insulation system continually increases after initial drying. One of the factors is mainly due to the ingress from the atmosphere, especially during maintenance activities where the solid insulation is exposed to the air. Furthermore, water migration between oil and paper occurs during transformer operation as the temperature changes. The water from the oil migrates to the cellulose papers when the temperature decreases. In contrast, increasing temperature leads to the migration of water from cellulose papers to the oil. Additionally, the aging of cellulose and oil, predominantly from the oxidation process, also contributes to the water content [21,22]. Figure 2 shows the factors that generate water into the transformer insulation system.
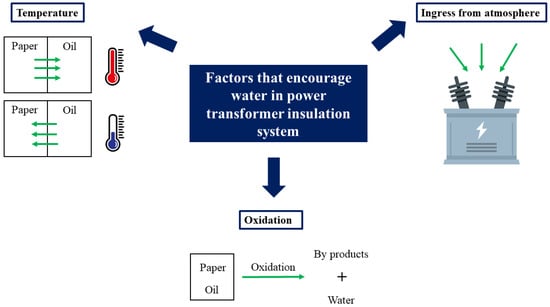
Figure 2.
Factors that encourage water into transformer insulation system.
Since water is a threat to the insulation system of a power transformer, determining the water content is of great significance for maintaining stable operation and avoiding any damage to the transformer. Generally, the WCP provides a more reliable value, as most of the water (>99%) is located in the cellulose insulation [23]. Unfortunately, it is a complicated task to sample cellulose for water content analysis, as the solid insulation is not easily accessible and even destructive [20]. Consequently, it is easier and cheaper to measure the water content in the insulation oil of the transformer. The information from oil analysis can be used to estimate the WCP. Many case studies have proposed various methods to determine the water content in oil–paper insulation transformers. However, most methods have measurements errors that are mainly dependent on impurities in the oil [8]. Section 4 and Section 5 will comprehensively discuss the methods to determine water contents in oil and paper insulation, respectively.
4. Detection Methods of Water Contents in Transformer Insulation Oil
Monitoring WCO is essential for early detection of the wetness of a transformer. Traditionally, an oil sample would be extracted from the transformer and sent to a laboratory for analysis. The data collected from the oil sample will be helpful in monitoring the WCP, which is a crucial part of the transformer. Typically, at the sampling stage, the oil sample could introduce moisture from the environment and contaminate the sample, resulting in measurement error. Section 4 will further discuss the methods used to detect WCO.
4.1. Karl Fischer Titration
Karl Fischer titration (KFT) is a laboratory-scale method widely used to detect water in oil. This method was first developed by a German chemist, Karl Fischer, in 1935 [24] and was standardized in ASTM Test Method D 1533 and International Electrotechnical Commission (IEC) Method 60814 as a direct method to determine water content in insulation oil (KFToil). KFToil methods consist of two primary methods, namely, volumetric and coulometric. The main difference between the two is that with the volumetric method, the iodine molecules (I2) are added directly to the sample by a burette, while the coulometric method regenerates the I2 from the iodide ion (I−) electrochemically in the titration cell [25]. Generally, WCO in the transformer is determined by the coulometric method since it can measure water levels at a much lower level (as low as 1 ppm) than the volumetric method (50–100 ppm) [26,27,28].
In the coulometric method, the titration cell consists of two parts, which are anodic and cathodic compartments. The oil sample is injected directly into the titration cell, where the electrode determines the water content of the oil. KFT is based on the stoichiometric reaction of iodine with water (1:1 mole ratio). From the two-step reaction mechanism in Figure 3, the reagent used for the titration needs to contain iodine, sulfur dioxide, alcohol as solvent (e.g., methanol, ethanol), and base (e.g., imidazole), which increases the speed and stability of the reaction.
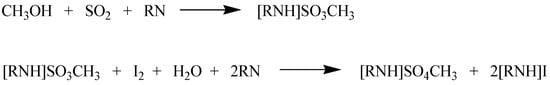
Figure 3.
Karl Fischer reaction mechanism.
Firstly, I2 is generated electrochemically within the titration cell from I−. The water molecules (H2O) in the sample are titrated when they come into contact with the I2, according to the reaction mechanism in Figure 3. The reaction is completed once all of the H2O molecules in the sample have reacted. Then, the current needed for the electrochemical generation of I2 is measured to calculate how much I2 was required for the titration, which is the same amount of water molecules present in the sample. A previous study by Koch et al. showed that direct injection via the KFT method gave more reliable results as compared to external oil heating coulometric titration [29]. The test procedure for the KFT method using direct injection is shown in Figure 4.
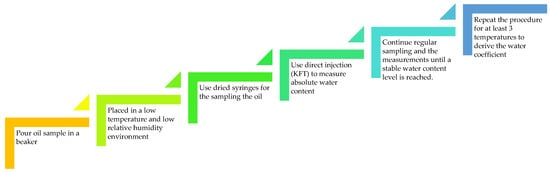
Figure 4.
Test procedure for KFT method [30].
Additionally, Koch et al. also highlighted the sampling procedure that plays a vital role in determining the results of a reliable KF titration. The requirements of the sampling procedure to determine the reliability of WCO results include:
- Oil should be sampled from different levels in the transformer; if possible, top, middle, and bottom.
- Samples should not be taken at high air humidity (rain, fog).
- When taking the samples, a few liters of oil should be drained out to prevent sludge and standing oil from being sampled.
- The bottle should be dry and technically clean so there is no moisture inside the bottle that could contaminate the oil.
- The bottle should be completely filled, leaving no space for air at the top, thus preventing contamination.
- The transportation time should be short, and the time between sampling and measurement should be below one week, depending on the tightness of the vessel.
To date, the KFT method has served as a benchmark for other methods in the measurements of trace water, such as dielectric response methods, because it can measure water content at a very high degree of accuracy (as low as 1–2 ppm) [16]. However, the KFT method can sometimes overestimate WCO due to the reaction of I2 with other chemical compounds in the degraded oil, resulting in a high error level [31]. Since it is not possible to remove contaminants from used transformer oils, Gizzatova et al. performed a study where they modified the KFT method by determining the water content in transformer oil before and after drying. The difference between these measurements is the water content in the oil without the influence of impurities. Hence, the absolute water content could be accurately determined [8]. Nevertheless, the KFT method still suffers from the usage of hazardous chemicals that potentially lead to a method that is not friendly to the environment. The method also consumes so much time that the oil sample needs to be returned to the laboratory for the test. The disadvantages of the KFT method have led to the development of online monitoring methods, such as saturation meter methods.
4.2. Saturation Meter Methods
To facilitate the discussion on the saturation meter methods, a few commonly used terminologies with the definitions are listed in Table 2. The terminologies are defined according to the descriptions given by the Technical Brochure of CIGRE WG A2.30 [32].
Table 2.
Common Terminologies for Saturated Meter Method.
As mentioned in Table 1 (Section 2.1), water content is present in a free, emulsified, or dissolved state in transformer oil, of which free and emulsified water cannot be measured using the KFT method. Furthermore, the WCO in ppm measured by the KFT method has limited value in diagnosing the condition of transformer insulation systems. The reason is due to the migration of water in a transformer insulation system which is highly dependent on the temperature. As the temperature in the transformer is evenly distributed, the water distribution in a different part of the transformer will be affected, causing an uncertainty in the measurement [33]. Thus, the concept of relative saturation (RS) of water in transformer oil has been introduced [34]. The water in oil can also be expressed as water activity (aw) in a unit form (0–1), while RS is expressed in percentage form (0–100%). Measuring the aw or RS of transformer insulation oil can almost entirely diagnose the actual condition of the transformer. Regardless of the saturation point of the oil, an aw or RS provides a true indication of the risk of free water formation. The aw or RS also accurately reflects the new margin to saturation, as the saturation point changes due to the oil temperature, age, or change in physical properties. Moreover, aw is independent of the type of oil, and it can be used universally for all substances regardless of chemical composition or physical characteristics, including aged transformer oil [35]. Wannapring et al., in their investigation of the WCO of the transformer through the KFT method, found that measuring the WCO in ppm does not always identify the actual water content condition, whether it is a dry or wet condition. Instead, analyzing the RS in the transformer oil has detected the accumulated water in insulation paper that is helpful in decision making for transformer maintenance [36]. Therefore, the saturation meter based on the sensor that measures RS or aw is being developed and will provide more straightforward and accurate measurements than determining WCO in ppm [32]. Studies suggest that the sensors based on the capacitive principle are more suitable for WCO measurement owing to their linear sensitivity over a wide range of humidity and thermal stability [37,38]. In the late 1990s, a sensor based on capacitive thin polymer was introduced to measure RS in oils. The measurements rely on the dielectric principle based on the fact that water content changes dielectric properties. A capacitive moisture sensor is a parallel plate capacitor with at least one electrode permeable to water vapor and allows water molecules to diffuse into the dielectric polymer layer. Absorbed water molecules increase the permittivity, which can be measured as increased capacitance of the sensor element that is proportional to the RS of the oil [30].
The moisture sensor devices could be helpful for laboratory measurements to obtain fast results of RS or aw since the calculation algorithm is already built into the sensor device with preset solubility coefficients [39]. The development of a saturation meter-based sensor has reduced the testing time when compared with the chemical diagnosis methods, such as KFT. Martin and his coworkers discussed the fundamental concepts of using aw from saturation meter-based sensors to assess the WCO of the transformer in the laboratory [40]. Magnetic stirrers and hotplates were used to mimic the actual oil flow and temperature of an operating transformer. It was observed that at the higher oil flow rate, the calculated WCO values are largely independent of whether the oil is heating or cooling, but at the lower flow rate, the WCO values during heating are higher than those at the same temperatures during cooling. The results from the study could help find the best position of the sensor probe for online monitoring of the power transformer.
Currently, many commercially available saturation meter-based sensors have been used for an online monitoring method for power transformers. Online measurement of the WCO of the transformer can significantly reduce errors due to transportation to the lab and titration and accurately trace water content variations [41]. Another effective use of online monitoring is depicted in Figure 5.
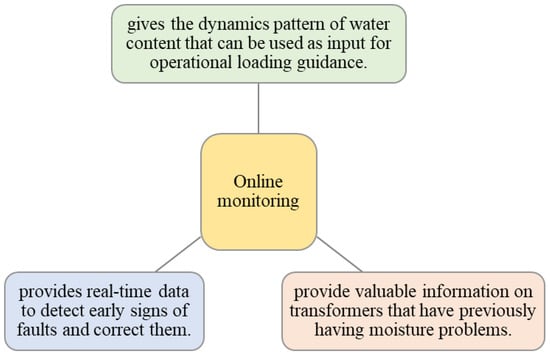
Figure 5.
The advantages of online monitoring based on the saturation meter method [42].
Online continuous monitoring of a power transformer has become possible with the introduction of thin film polymer capacitive sensors that were used as stand-alone devices with datalogger [5,38,43]. The benefits of using such devices are that no oil sampling is required, and the measurement is in direct contact with the oil. The in situ measurements reduce costs since they requires no special equipment, unlike those needed in the laboratory. This technique will increase the sampling numbers, thus reducing the uncertainty and increasing the accuracy. Furthermore, the capacitive sensor is very sensitive to water, with almost no observed response to other molecules in oil [44]. However, the problem arises when selecting the sensor location; it is important to avoid the stagnant oil location, as the sensor only measures the oil at the surface. Usually, the sensor probes are installed through the bottom of the tank wall, where the oil is the coolest [40]. The sensor is installed at a location with a good oil flow to prevent moisture fluctuations, increasing measurement accuracy [5,30,45]. However, during a rapid temperature decrease because of unexpected shutdown, the accuracy of the RS measurement will be affected because the dynamic response is slower at low temperatures, which can underestimate the saturation point [46]. Sometimes, using a long cable (>3 m) between the sensor and readout contributes to errors due to parasitic capacitance from the long cable.
4.2.1. Effect of Water Solubility on WCO Using KFT and Saturation Meter Method
The water solubility of oil is a material-specific property affected by the oil’s chemical composition, aging condition, and presence of hydrophilic impurities [47]. Water solubility in oil will increase dramatically with temperature, even though the oil is strongly hydrophobic [48]. Solubility is a function of temperature, which can be expressed in Equation (1).
where S stands for solubility, T is an absolute temperature, and A and B are the oil solubility coefficients. Calculating absolute WCO (ppm) in the transformer is possible if the oil-specific solubility coefficients (water solubility vs. temperature) are known. Additionally, the absolute WCO (ppm) is needed to calculate the RS of the oil. A study in [4] converted the aw to WCO (ppm) to calculate the solubility coefficients for their oil sample for the sensor probe calibration. Since the solubility is related to the chemical composition of oil, where aged and contaminated oil have a higher solubility than new oil, the authors suggested determining the solubility coefficients when using sensor probes with different transformers. The increase in solubility of aged or contaminated oil is due to the formation of organic acid or an increase in polar molecules during the chemical reaction of oil [48,49].
Gradnik et al. investigated the impact of chemicals and temperature on determination of WCO by using capacitive moisture sensors under controlled laboratory conditions [47]. Their study concluded that the results for new oils are in good agreement for temperature ranges below 30 °C when using the preset sensor solubility coefficients. However, at a temperature above 30 °C (i.e., 60 °C), the error is 20% of the measured value. Their investigation with aged oil using the preset sensor solubility shows 50% lower values of WCO than the actual values measured by the KFT method due to the increased water solubility. Therefore, theoretically, the solubility coefficient still affects the measurement accuracy using commercial probes. Studies have shown that various authors have determined the different values of A and B coefficients. A study by Leivo and Leppanen shows the solubility coefficients for the new oil from the IEC standard and Vaisala, a commercial brand for the saturation meter-based sensor, with the experimental determination of two different-aged oils [49]. The comparison of their A and B values is shown in Table 3.
Table 3.
Comparison of solubility coefficient for new and aged oil [49].
Since the water saturation for new and aged oil is different, it is important to know the oil solubility coefficients for each investigated transformer oil. Many efforts have been made to develop the formula to find the oil solubility coefficients. A study by [50] described a method to determine the coefficients A and B that consists of conditioning the electro-insulating liquid in a tightly closed vessel at three different temperature values. The oil parameters such as water content, RS, and temperature are measured for each temperature value after moisture equilibrium is achieved. The measurement procedure adopted from [50] is summarized in Table 4.
Table 4.
Measurement procedure to determine coefficients A and B of insulation oil.
Some of the studies use different formulas to calculate the coefficients A and B. For example, a study by [44] used the formula of Gibbs energy to relate with the Arrhenius formula and derive the calculation of A and B coefficient. Different formulas were presented to calculate coefficients A and B based on other studies, as shown in Table 5.
Table 5.
Equation to calculate A and B coefficients from the previous study.
4.3. Infrared Spectroscopy
Infrared spectroscopy (IR) is one of the methods that has attracted much attention to determine WCO in the transformer insulation system. Fourier Transform InfraRed (FTIR) is the preferred method of infrared spectroscopy. This method is straightforward, rapid, and involves no chemical additives described in ASTM E2412 [53]. FTIR is a common analytical tool available in most laboratories to identify the different functional groups present in degraded oil samples. The basic structure of the FTIR instrument is configured with a source, beam splitter, sample, and detector. The detector should sufficiently cover the midinfrared range of 4000 cm−1 to 550 cm−1. The signal measured by the detector will be digitized and sent to the computer, where the final infrared spectrum is presented to the user for interpretation. In the case of water detection, the FTIR spectrum shows absorbance peaks at wave numbers 3700–3000 cm−1, which is the detection of the O-H functional group. A study by [31] found the wave number of 3616 cm−1 to signify the absorption of the water in the insulation oil samples. Meanwhile, a study by [54] assessed the water samples’ infrared absorption at 3329 cm−1.
The FTIR method procedure includes trial and error to make a mixture of oil samples with acetonitrile (ACN) as a solvent. The author found that the ideal ratio for oil:ACN is 3:1 (vol/vol), with 9 mL of oil and 3 mL of ACN added to a 15 mL centrifuge tube. Then, the oil:ACN sample was vortexed for 2 min and then centrifuged for 2 min at 2000× g (gravity) to separate the ACN from the oil. The dry ACN sample was also prepared in another tube as a reference. The absorbance spectrum was recorded for the sample extract’s upper ACN layer (S) and the dry ACN (R). Finally, the water content in the sample was determined by calculating the differential spectrum [31].
The work carry out by Gupta shows that IR is a promising technique for directly measuring the WCP in an oil–paper-insulated transformer [55]. This study investigates three techniques, i.e., impedance measurement at high frequency, microwave absorption, and infrared absorption, for their suitability for directly measuring the WCP in oil–paper-insulated transformers. Gupta concluded that the IR technique can detect changes in the order of 0.1% in the WCP (e.g., 1.9% to 2.0%). The summarized IR technique using optical fiber bundles for directing infrared radiation used by Gupta is shown in Figure 6.
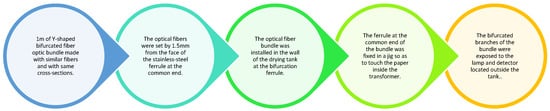
Figure 6.
Summarized IR method used to directly measure WCP of the transformer (based on a study by [55]).
Even though the IR technique developed by Gupta can measure WCP directly, the difficulty of finding a suitable location to install the optical fiber bundle has limited its application. Therefore, IR application is mostly used to detect the WCO in the transformer insulation system. Measurement of WCO, given its strong -OH absorption by means of the IR technique, is a simple and fast-analyzing method where the measurement result can be determined in less than 2 min. Even though IR techniques are more costly than a few other techniques, they only require a small sample during the analysis, where only one drop of oil is enough to run the test. Additionally, they are well-correlated to the KFT method, a benchmark method to determine water in insulation oil. However, it is probably difficult to interpret the IR spectrum because the -OH bond for water molecules may be confusing with the -OH bond for alcohol, which falls in the same place, at around 3200–3500 cm−1. The interferences in the oil sample, such as inhibitor content containing -OH bonds [53,54], can also be misinterpreted with the -OH bond for alcohol.
4.4. Chromatography Techniques
Chromatography techniques principally separate components in a mixture by the difference in partitioning behavior between mobile and stationary phases. The application of gas chromatography (GC) is widely used in the identification of gases (known as dissolved gas analysis, DGA) such as hydrogen (H2), nitrogen (N2), oxygen (O2), methane (CH4), ethane (C2H4), and other gases. The gases are generated because of the breaking of the hydrocarbon molecules in oil due to electrical or thermal stress during transformer operation [11]. However, a minimal study measured water content using GC analysis [56]. The findings demonstrated that two ways could be used to measure water using GC: directly inject the insulation oil through an injection port; and based on the preliminary extraction in a gas phase. The advantages of directly injecting the insulation oil are that the water content data appear simultaneously with the diagnostic gases. However, the water peak is asymmetrical because its polar compound makes it challenging to interpret. Hence, the water content was measured based on the preliminary extraction in a gas phase to obtain the symmetry peak. This method determines the water as an independent task, and the amount of extracted water will depend on the extraction condition. The study found that the retention time of water’s symmetric peak is 3 to 3.5 min, with the detection limit at 0.2 mg/kg. The GC operating condition for the symmetry peak of water is as in Table 6.
Table 6.
The operating conditions used for GC analysis.
Using the GC technique, determining water is considered a fast analysis with a low detection limit. However, this technique is not practically used to determine the insulation oil’s water content, probably due to the difficulty of interpreting the chromatogram, as the water’s peak is asymmetrical. Moreover, the independent task of determining the water is also not suitable since it requires a time-consuming extraction method. The measurement accuracy can also be argued, as the water content depends on the extraction condition.
Overall, there are four methods that can be used to detect the water content in transformer oil. These include KFT, saturation meter method, IR, and GC. KFT is the most common method for determining water content in transformer oil, as it provides a highly accurate measurement compared to other methods. However, it is time consuming, laboratory based, and uses hazardous chemicals. In contrast, the saturation meter method provides a quick and accurate measurement of the amount of water in transformer oil, but it can be expensive and require regular maintenance. The IR method also provides a quick measurement of the amount of water in transformer oil; nevertheless, this method is not commonly used, as it requires specialized equipment with a trained operator. The spectrum interpretation might also differ from one person to another. A similar limitation is also exhibited by the GC method. In addition, the GC method also requires a time-consuming extraction procedure prior to detection. In general, the best method for water detection is dependent on the specific needs of the transformer and the resources available for testing. It is often recommended to use multiple methods to provide comprehensive data of water content in transformer oil.
5. Detection Methods of Water Contents in Transformer Insulation Paper
Paper degradation can cause worse effects than insulation oil since it can never be returned to its original condition once degraded. Eventually, the paper will become brittle and lose its thermal and mechanical strength. Consequently, a higher cost is needed to replace insulation paper than to replace oil. Increases in water content in paper insulation are one factor that contributes to paper degradation. With the awareness of water’s hazardous effects, many kinds of research have been performed to develop a suitable method that can accurately determine the WCP. Determination of WCP can be directly measured by collecting paper samples from the transformer, which will make the test destructive. Indirectly, WCP is estimated from the known value of WCO with the help of some well-known standard equilibrium curves, such as Oommen [57], Griffin [58], and Fabre–Pichon curves [59]. In addition to these equilibrium curves, WCP can also be calculated using some mathematical formulae, such as Fessler’s equation, ABB’s equation, and Serena’s equation [4,60,61]. Electrical methods such as dielectric response are also among the methods used to assess WCP in a transformer. Conclusively, this section will review the methods that have been used to measure the water content in the paper insulation using direct and indirect methods.
5.1. Direct Method on Paper Samples
The WCP can be directly determined from the paper sample by collecting it from the insulation system. The direct measurement will provide an accurate result since the water content was measured directly form the paper. The distillation method known as the Dean–Stark method [62] directly measures water content in the insulation paper according to the ASTM D95 standard [63]. The distillation method involves heating up a paper sample with known weight, taken directly from the transformer insulation system in the presence of an organic solvent such as xylene or toluene. The organic solvent must be immiscible with water, have a higher boiling point than water, be less dense than water, and be safe to be used. The water in the sample evaporates and is collected in a graduated glass tube where its mass is determined. When no more water is collected in the graduated tube, the distillation process is stopped, and the volume of water is read from the tube. The study carried out by [62] performed the Dean–Stark method to measure the WCP. It was concluded that Dean–Stark, as a direct method, is more accurate than indirect methods such as Frequency-Domain Spectroscopy (FDS) and KFToil.
The other way to determine the WCP is using a chemical reaction approach by performing the KFT method directly on a paper sample (KFTpaper) [64]. The KFTpaper method analyzes the solid paper sample with the help of oven systems, as solid samples do not dissolve in the reagent. This technique requires that the samples be heated for the water to be released before the samples are quantitatively carried into the measurement cell with a stream of carrier gas. Since the KFTpaper is a destructive method, the used of this method is generally performed for comparison with another method to test the accuracy, as conducted in [61,65]. The Dean–Stark distillation method in general gives higher accuracy compared to the KFTpaper method since the oil remains dissolved in the organic solvent and therefore does not interfere with the measurement of the water [66]. However, a practical disadvantage of the Dean–Stark method is the difficulty of ensuring that all the water is collected in the graduated portion of the trap during the distillation process. Apparently, the KFTpaper method is preferable as the direct method to measure WCP of a transformer, as the titration only uses a simple apparatus and is easily carried out [67]. Still, these two methods are not practically used to determine the WCP in the transformer since they are destructive and require a complicated sampling process, as the paper samples need to be sampled from the transformer tank. In fact, these methods are possible only when the transformer is not operating or is under repair. That might be why research on it is minimal.
5.2. Indirect Method: Moisture Equilibrium Curves or Water Sorption Isotherm
Moisture equilibrium curves are a group of characteristics that describe the dependence of WCP as a function of WCO (ppm). Water sorption isotherm refers to a group of characteristics that present the dependence of WCP as a function of the relative humidity (RH) of the surroundings for different temperatures. Since the WCP cannot be measured directly by the KFTpaper or Dean–Stark methods due to the destructive process and the difficulty in obtaining the paper, the WCP is usually estimated through a moisture equilibrium curve or water sorption isotherm. Fabre and Pichon first reported the application of equilibrium curves in 1960 to derive the WCP in oils [68]. Other standard equilibrium curves that have been widely used to determine the WCP are based on Oommen and Griffin’s curves [57,58]. Based on the standard procedure for operators of power transformers, the WCP was derived from the WCO (ppm). Firstly, the oil is sampled under service conditions, followed by the measurement of WCO by KFToil. Then, the WCPpaper is derived by using standard equilibrium curves.
A new approach to equilibrium diagrams uses the RS or aw in the oil instead of the absolute WCO (ppm) [69]. An equilibrium diagram based on RS is generally derived with limits of IEC60422 [70,71,72] to diagnose the condition of the insulation paper. The advantage of using the RS measurement is that the aging of oil becomes negligible, and the measurement can be performed online, leading to much more accurate results [73]. Instead of estimating WCP based on standard curves as mentioned before, the new equilibrium curve could also be developed for each type of oil sample to achieve more accurate WCP estimation [59,74]. This is due to a different kind of oil having different oil solubility that may cause the deviation in the standard equilibrium curves. Some formulae for calculating the solubility coefficients based on previous studies are shown in Table 5 (Section 4.2.1). In an attempt to know the WCP in a transformer, estimating the WCP from equilibrium curves or mathematical formulae will not be fully justified since the techniques are recommended to be used under stable equilibrium conditions inside a transformer. Practically, it is very difficult to achieve absolute equilibrium (depicted in Figure 7), which includes thermodynamic equilibrium, mechanical equilibrium, phase equilibrium, and chemical equilibrium in a power transformer. The unstable conditions of a transformer generally cause diffusion of water between oil and paper that eventually gives uncertain results of WCP [65].
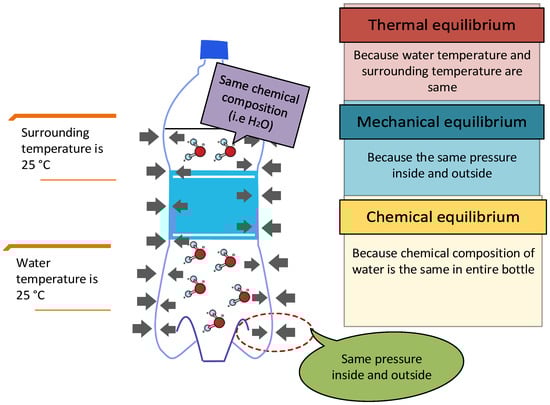
Figure 7.
Absolute water equilibrium systems.
We summarized the determination of WCP in a flowchart in Figure 8. The WCP obtained by mathematical formula can be used to construct a new equilibrium curve based on an RS or aw measurement. Based on the flowchart, we can conclude that the accuracy of using RS or aw measurements compared to KFToil is due to the Pv value that can be determined directly by using the readily measured RS or aw from the probe’s reading.
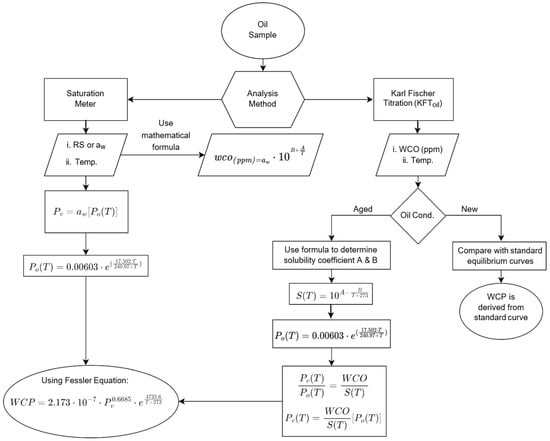
Figure 8.
Flowchart diagram to determine WCP in a transformer based on KFToil and saturation meter method. Note: Due to the nature of the capacitance sensor used in the saturation meter, the solubility coefficients A and B measured will not affect the obtained measurement of RS or aw.
5.3. Indirect Method: Dielectric Response Methods
The dielectric response method is another indirect technique to determine insulation paper water content. This technique overcomes the limitations of the moisture equilibrium curve for estimating water content in insulation paper, such as the need to use the correct moisture equilibrium curve for aged oils. It is also important to determine the water content at different operating temperatures under stable conditions, which is impossible to achieve. Therefore, measurement based on dielectric response is currently used domestically and internationally since the measurement is temperature dependent [75]. This technique is performed by measuring the effects of water on electrical properties based on the fact that paper and oil change their dielectric properties when water levels increase [76,77]. The dielectric response techniques measure the dielectric properties as a function of frequency or time. These techniques measure the impedance of a system over a range of frequencies and reveal the dissipation properties. There are two types of dielectric response techniques: time-domain and frequency-domain [78].
5.3.1. Time-Domain Measurement
The time-domain dielectric diagnosis mainly includes polarization and depolarization current methods that record the insulation’s charging and discharging currents [79]. Two time-domain measurement techniques are recovery voltage measurement (RVM) and polarization and depolarization current (PDC).
The polarization (charging) current through the object can be expressed as in Equation (2):
Once a short circuit replaces the step voltage, a depolarization current will build up. The magnitude of the depolarization current is expressed as in Equation (3):
The effect of can be neglected if the charging period to complete all polarization was long enough [80]. As a result, the depolarization current becomes directly proportional to the dielectric response function and can be calculated as in Equation (4):
Furthermore, the conductivity of the insulation can be calculated as in Equation (5):
where:
From Equation (5), the conductivity, ; the relative permittivity, ε; and the dielectric response function, , characterize the behavior of the dielectric material in the time-domain. The current measurements in the time domain also can directly lead to the estimation or quantification of and to identify the insulation condition of a power transformer. The basic circuits diagrams to measure RVM and PDC are shown in Table 7. Based on the previous study, the characteristics of RVM are interpreted as maximum return voltage, initial slope, and central time constant [81]. The magnitude of return voltage depends on charging time and discharging time. The initial slope of return voltage is proportional to the active depolarization current at discharging time and thus, proportional to the intensity of the polarization process [78].
Table 7.
The basic circuits to measure RVM and PDC.
These two time-domain dielectric response methods, RVM and PDC, can be measured by the interfacial polarization spectra (IPS), developed at the University of Queensland [82]. Computer-aided techniques are integrated with the IPS system to control the hardware. Generally, MATLAB software is used to evaluate the measurement data to define the condition of the insulation system. The commercial system named PDC Analyzer 1 MOD was later developed by Alff Engineering and has been fully automated with internal data evaluation [83]. Water content for paper can be obtained independently using RVM and PDC measurements. However, the water content for oil-based insulators can be evaluated from PDC tests.
5.3.2. Frequency-Domain Measurement
In the frequency domain, capacitance and dissipation factor (tan δ) are measured as a function of frequency. The measurement principle of the frequency-domain is based on the impedance of a test object, where it is determined by applying a sinusoidal voltage across the object and accurately measuring the voltage across and current through the object. Typically, the frequencies are applied from 0.001 Hz to 1000 Hz [84]. The dissipation of electromagnetic energy through dielectric materials is called dielectric loss, generally expressed as a loss tangent, tan δ, which corresponds to the loss angle of a phase difference between voltage and current in a complex plane [85]. Given this relation, the tan δ can be quantified as the ratio of resistive current, , by the capacitive current, , measured at respective frequency, ω, and voltage, V, as in Equation (6):
The terms dissipation factor, DF, and tan δ are commonly used interchangeably to express losses in the system due to dielectric loss, C”, assuming the sample to be of complex capacitance.
The test sample is subjected to the sinusoidal voltage producing the complex impedance, Z*, which consists of real resistance, Z’, and imaginary capacitive reactance, Z”, in a complex plane. The impedance is then determined by measuring the resulting voltage across and current through the object [86]. Given the measured phase difference of the voltage U(ω) and the current I(ω) at a specific frequency, the test sample impedance can be expressed as in Equation (7):
Assume that the test sample is always a complex capacitance, such that Equation (8):
where Equation (9):
Rearranging Equations (6)–(9), the DF or tan δ can be expressed as Equation (10):
The frequency-domain measurement techniques are known as FDS or dielectric frequency response (DFR). It is a modern technology that has the advantages of providing insulation information and has a strong anti-interference ability [87] as compared with the PDC and RVM methods. Thus, it has excellent potential in evaluating oil–paper insulation and can reliably calculate water content in paper insulation. From Equation (10), with the tan δ, as well as complex capacitance, water content in the paper insulation can be computed by using the FDS method. The parameters that were measured by FDS were the voltage across U(ω) and current I(ω) through the test sample at its respective frequency. The measurement of the capacitance and tan δ can be performed using dielectric analyzers such as Megger IDAX300 [88], Omicron [10,89], ALPHA-A Dielectric Analyzer from Novocontrol Technologies [90], and ELTEL ADTR-2K [91].
The basic procedure of running the FDS method is adapted from [23,86]. In common practice, the sinusoidal voltage is applied between high-voltage (HV) and low-voltage (LV) windings to measure the main insulation (CHL) dielectric response, as it contains the most cellulose. The three HV terminals or bushings (for three-phase transformers) are joined together by an output (voltage) cable, and the three LV terminals or bushings are joined together by an input (sensor) cable, which is connected to the measuring equipment. The equipment interprets the electrical response generated through the cables to measure the corresponding voltage and current at a specific frequency. These measured values are then used to autocompute the insulation tan δ. A guard cable is used to bypass unwanted electrical influences. The computed tan δ values are plotted against their respective frequency to produce tan δ, which will be interpreted to estimate water content in the transformer insulation system [23,86]. The measured tan δ curves are compared to the simulated curve modeled according to the standard X-Y model (barriers and spacings) described in CIGRÉ TB 254. The modeled curve is fed with a pressboard dielectric properties database at various known temperatures, water contents, and oil conductivity [92]. The modeled curve parameters (water content and oil conductivity) are autotuned until the modeled curve best fits the real measured curve. Therefore, the measured curve’s unknown parameters (water content and oil conductivity) are estimated to be almost identical to the matched modeled curve parameters, as shown in Figure 9.
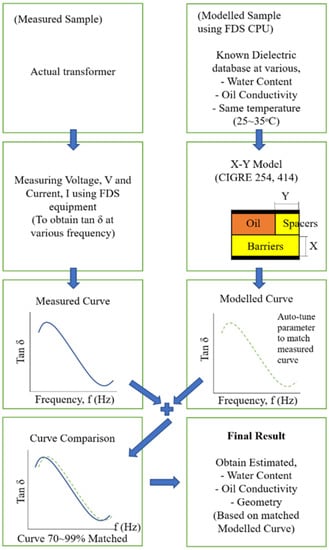
Figure 9.
FDS measurement procedure.
Theoretically, tan δ is inversely proportional to frequencies. This phenomenon is significantly more apparent in higher and lower frequencies due to the fact that higher frequencies cause the polarization changes process to happen very fast in the capacitors; thus, it acts like a short circuit (lower tan δ), whereas in lower frequencies, the polarization changes process took so long to complete that it causes the capacitor to act like an open circuit (higher tan δ). However, distinct curve patterns in lower and higher frequencies can be observed in Figure 10. This can be related to Equation (10), where an increase in dielectric losses, C’, due to moisture in higher- and lower-frequency areas, corresponds to a decrease in charges’ polarization in cellulose insulation, which consequently influences the tan δ curve in both lower and higher frequencies [23].
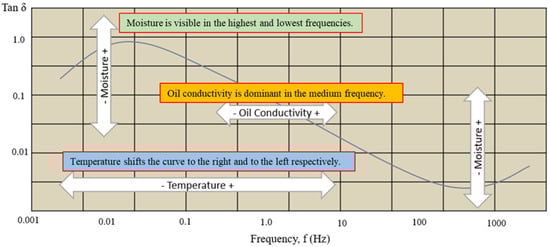
Figure 10.
Influence of moisture and oil conductivity on tan δ curve [93].
The dielectric response method is currently the most widely adopted method for determining the water content in transformer insulating paper. Three dielectric response methods discussed here have an advantage: nondestructive diagnosis methods for the transformer insulation system [94]. The advantage of the RVM lies in its simplicity, nondestructive character, and the ability for fast use directly on-site. However, the RVM method is outdated since its interpretation scheme appeared to be complicated and unreliable in calculating water content in solid insulation. In contrast, FDS and PDC can reliably estimate water in the solid insulation, and both FDS and PDC results are comparable.
Since the moisture equilibrium in the oil and paper insulation system is highly temperature-dependent, the FDS and PDC measurement require the shutdown of the transformer. The measurements are generally performed under nonequilibrium conditions in the presence of temperature variations and thermal instabilities.
5.4. Comparison of the WCP Determination Method Based on the Previous Studies
Based on our literature review, there are two different methods to determine the WCP in a power transformer: direct and indirect. A direct method that requires collecting cellulose samples from the transformer insulation is generally not a standard method to measure WCP. Meanwhile, an indirect method such as dielectric response measurement, an equilibrium diagram based on WCO (ppm), and an equilibrium diagram based on RS or aw in oil is commonly used to estimate the WCP in a power transformer. The unit for WCP is typically expressed in %, which is the weight of the water content divided by the weight of the dry oil-free paper [74]. More precisely, if the vapor pressure (Pv) of water directly above the paper is known, then the WCP can be calculated (as a ratio of the mass of water to the mass of dry paper) if the temperature is also known [10]. Section 5.4 discusses on the accuracy or reliability of the results obtained from the methods described before in determining the WCP.
Previous studies have shown the reliability of the dielectric response method, which include FDS and PDC in water content analysis [62,75,95]. Bagheri et al. [62] investigated the WCP measurement of three brand new distribution transformers using two laboratory methods, the Dean–Starkpaper (direct) and KFToil (indirect) methods. Additionally, an on-site FDS method was also carried out to determine the WCP of the transformer. Table 8 shows the result of the investigation with the % error calculated, using Dean–Starkpaper as a reference measurement. Based on the results in Table 8, KFToil indicates high % error when compared to the Dean–Starkpaper method. Meanwhile, the FDS method has shown a relatively close WCP value with the Dean–Starkpaper method. Therefore, based on the results, the FDS method has a higher probability of becoming the most reliable method for determining the WCP.
Table 8.
Comparison of % error based on different WCP using Dean–Starkpaper, KFToil, and FDS measurement methods.
In another study, Koch et al. investigated the WCP in a heavily aged transformer with 30 MVA, built in 1950 [72]. Table 9 shows the WCP results determined by Koch et al. using different techniques that were carried out in the laboratory, such as KFTpaper and KFToil. On-site measurements were also performed to determine the WCP using FDS, PDC, and RS measurements. The WCP measurement, based on the KFTpaper, is used as a reference to compare the accuracy of the other methods. Based on the results in Table 9, determination of WCP estimated from equilibrium curves based on RS measurement (WCP = 2.5%) is in good agreement with the KFTpaper method (WCP = 2.6%). In contrast, the WCP estimated from equilibrium curves based on the KFToil method indicated high content of water (WCP = 6.0%). On-site measurement using a combination of FDS and PDC methods shows well-correlated results with the KFTpaper, which indicates 2.9% of WCP. Meanwhile, the use of FDS and PDC alone exhibit the WCP values of 3.8% and 4.0%, respectively.
Table 9.
Percentage error comparison of different water content detection methods. (Direct KFTpaper detection as reference.)
Based on the method comparison in determining the WCP by Koch et al., on-site RS measurement is recommended to be employed for a heavily aged transformer. Nevertheless, more investigation is still needed to improve the measurement to reduce the cost and achieve a simple procedure. Table 10 shows a summary of the methods used to determine the WCO and WCP of the transformer that were discussed in Section 4 and Section 5. The direct method to detect water content in transformer insulation paper includes the Dean–Stark method and KFTpaper. Both methods are destructive, as the insulation paper needs to be taken out from the transformer prior to measurement. The most common method to detect water in transformer insulation paper is through indirect quantification from oil measurement. The indirect methods, which include KFToil, saturation meter, FTIR, and GC are possible indirect methods to quantify water content in transformer insulation paper. Another indirect method based on electrical measurement is using dielectric responses, which is also widely used through techniques such as FDS, PDC, and RVM. Finally, to conclude our findings of the detection method for water content in the transformer insulation system, WCO, and WCP in the laboratory or industrial practices, we summarized our results in Table 10.
Table 10.
Summary of methods to determine WCO and WCP in the transformer.
Research on the assessment of water content in the transformer insulation oil and paper has been challenging and provides many opportunities for researchers for future research. Many different techniques have been applied, including chemical, electrical, and mathematical algorithms. This review made an effort to describe and compare the possible techniques used to measure the water content in the transformer insulation oil and paper. Although the most adopted methods to determine the water content in the transformer insulation system are currently dominated by the dielectric response method, the primary tool for determining the water content in transformers is still the oil analysis. The data from the oil analysis are significant as an early indication of the current condition of the transformer insulation system.
Based on the studies, the most common laboratory method in determining the WCO in a transformer is based on the KFToil method as compared with the FTIR or GC method. Instead of measuring WCO in ppm, the measurements based on aw or RS are more recommended, as they can provide a true indication of WCP in the transformer. Measuring aw or RS can be performed by calculating from the WCO in ppm (obtained from KFToil) using mathematical equations or from directly on-site measurement using saturation meter probes. Nevertheless, obtaining accurate WCP utilizing this method still relies on changes in oil solubility coefficients, which need to be calculated for each oil sample of the different transformers. A thorough investigation is required in order to find the universal oil solubility coefficients that can be used for any type of oil. Currently, analysis by KFToil in the laboratory is still practical to measure the WCO in the transformer oil, probably due to the high price of saturation meter probes and their calibration requirement. However, the estimation of the WCP method should be improved to make it more feasible.
Even though online monitoring of the transformer is considered an advanced method, as described in a study by [43], where it can measure the water content and its distribution in real-time, which can alert the operator if the water content level is increasing. However, its application is still not suitable for old transformers, and the difficulty in locating the sensor limits the use of this advanced method. The electrical method of the dielectric response is also widely used currently because of its advantages of removing the hassles of laboratory analysis and providing a simple measurement. However, the dielectric response method’s offline measurement field still needs attention, as disconnecting a power transformer involves a high cost that cannot be overlooked [76].
Based on the review, we can conclude that the main problem lies in the difficulties in interpreting the data to estimate the accuracy of WCP in the transformer. Since the water accumulates more in the paper insulation and could not be determined directly without shutting down the power transformer, accurate measurement of the data from the oil analysis and its related parameters are essential. Employing artificial intelligence (AI)-based technologies such as machine learning could interpret the data with high accuracy and simultaneously handle data uncertainty because it removes human errors. A few AI models have been proposed to investigate the performance of predicting power transformers, such as Random Forest, Artificial Neural Network (ANN), Support Vector Machine (SVM), and Decision Tree [96]. Recent studies [97,98,99] showed that the incorporation of artificial intelligence would reduce the error due to data uncertainty and provide a fast and simple analysis in monitoring the condition of the transformer insulation system. Implementation of a high computational tool such as AI to determine the WCP should be carried out in the future in the transformer insulation system to overcome the limitations of the current methods and achieve high accuracy in the estimation.
6. Conclusions
Measurement of the WCP, a critical part in determining the health of a transformer, has been a challenging task since the direct detection method is unsuitable for practical use. This paper reviews the water detection method in oil and paper insulation that has been used in the laboratory and on-site. The principle of the method was described with its pros and cons. With various methods available, the accuracy and simplicity of the techniques should be the main criteria in choosing a suitable method to be adopted. It can be concluded that estimation of the WCP from RS or aw measurement of oil samples using a saturation meter-based sensor could be the most recommended method since it increases accuracy as well as has simple procedures. Even though the saturation meter-based sensor is currently advanced in online monitoring methods, its application is still limited due to the high installation cost and the suitability of the transformer type. Furthermore, the dielectric response method also can provide good correlation results of WCP with the direct method of WCP measurement. Additionally, the electrical method does not require sampling, which usually contributes to more errors. A combination of the time and frequency domain of the dielectric response method shall be explored more in depth as other alternatives in determining the accurate WCP. However, more research is needed to overcome the limitation of this electrical method, which can greatly reduce the cost required of the shutdown of a transformer during measurement. The research on the online dielectric measurement on oil–paper-insulated transformers was performed in the laboratory and looks promising for reducing the cost of the current offline method. However, it is still not extended to the practical application of field measurement [76]. Recently, AI techniques constituted the most cutting-edge method to diagnose the fault in a power transformer; thus, implementing AI technologies in solving complex problems of power transformer systems can be considered. With the growth of the power transformer system, complexity in the network has increased tremendously. As a consequence, the analysis of the acquired data by conventional techniques became more complicated and time-consuming. Therefore, applying AI technologies with the help of sophisticated computer tools could resolve the problems of determining the WCP in the transformer. Subsequently, the difficulties in monitoring and maintaining power transformers could be reduced and handled efficiently.
Author Contributions
Conceptualization, P.J.K. and S.R.A.; writing—original draft preparation, S.R.A. and P.J.K.; writing—review and editing, S.R.A., P.J.K., M.Z.J., Y.Z.Y.G., H.J.L. and V.A.T.; visualization, S.R.A. and P.Y.C.; supervision, P.J.K.; project administration, M.Z.J.; funding acquisition, P.J.K. All authors have read and agreed to the published version of the manuscript.
Funding
This research was funded by Tenaga Nasional Berhad Seeding fund, grant number U-TD-RD-21-08 that is managed by UNITEN R&D Sdn. Bhd.
Data Availability Statement
Not applicable.
Acknowledgments
The authors would like to express our gratitude to the engineers and technical staffs of Tenaga Nasional Berhad for their technical support and knowledge sharing.
Conflicts of Interest
The authors declare no conflict of interest.
References
- Aslam, M.; Arbab, M.N.; Basit, A.; Ahmad, T.; Aamir, M. A review on fault detection and condition monitoring of power transformer. Int. J. Adv. Appl. Sci. 2019, 6, 100–110. [Google Scholar]
- Bagheri, M.; Phung, B.T.; Blackburn, T. Influence of moisture content variation on Frequency Response Analysis of transformer winding. In Proceedings of the EIC 2014 32nd Electrical Insulation Conference, Philadelphia, PA, USA, 8–11 June 2014; Volume 21, pp. 333–337. [Google Scholar]
- Ansari, M.A.; Martin, D.; Saha, T.K. Investigation of Distributed Moisture and Temperature Measurements in Transformers Using Fiber Optics Sensors. IEEE Trans. Power Deliv. 2019, 34, 1776–1784. [Google Scholar] [CrossRef]
- Martin, D.; Perkasa, C.; Lelekakis, N. Measuring paper water content of transformers: A new approach using cellulose isotherms in nonequilibrium conditions. IEEE Trans. Power Deliv. 2013, 28, 1433–1439. [Google Scholar] [CrossRef]
- Martin, D.; Saha, T.; Gray, T.; Wyper, K. Determining Water in Transformer Paper Insulation: Effect of Measuring Oil Water Activity at Two Different Locations. IEEE Electr. Insul. Mag. 2015, 31, 18–25. [Google Scholar] [CrossRef]
- García, B.; Valecillos, B.; Burgos, J.C. Determination of Water Content in Transformer Solid Insulation by Frequency Domain. Spectroscopy 2005, 2005, 18–23. [Google Scholar]
- Martin, D.; Saha, T.; Krause, O.; Clarkson, V. Improving the online water content measurement of transformer insulation paper using low pass filters. In Proceedings of the IEEE PES Innovative Smart Grid Technologies Conference Europe, Ljubljana, Slovenia, 9–12 October 2016; pp. 1043–1048. [Google Scholar]
- Gizzatova, I.D.; Kozlov, V.K.; Valiullina, D.M. Determination of the true water content, the nature of the impurities and their concentration in transformer oil. E3S Web Conf. 2019, 124, 10–13. [Google Scholar] [CrossRef]
- Gradnik, T.; Končan-Gradnik, M.; Petric, N.; Muc, N. Experimental evaluation of water content determination in transformer oil by moisture sensor. In Proceedings of the IEEE International Conference on Dielectric Liquids, Trondheim, Norway, 26–30 June 2011. [Google Scholar]
- Martin, D.; Saha, T. A Review of the Techniques Used by Utilities to Measure the Water Content of Transformer Insulation Paper. IEEE Electr. Insul. Mag. 2017, 33, 8–16. [Google Scholar] [CrossRef]
- Sylvestre N’cho, J.; Fofana, I.; Hadjadj, Y.; Beroual, A. Review of physicochemical-based diagnostic techniques for assessing insulation condition in aged transformers. Energies 2016, 9, 367. [Google Scholar] [CrossRef]
- Aluyor, E.O.; Ori-Jesu, M. Biodegradation of mineral oils-A review. Afr. J. Biotechnol. 2009, 8, 915–920. Available online: http://www.academicjournals.org/AJB (accessed on 2 February 2023).
- Rouse, T.O. Key Words: Liquid dielectrics, electrical insulating liquids, electrical apparatus, TRANSFORMER. IEEE Electr. Insul. Mag. 1998, 14, 6–16. [Google Scholar] [CrossRef]
- Perkasa, C.Y.; Lelekakis, N.; Wijaya, J.; Martin, D. Investigating bubble formation in vegetable and mineral oil impregnated transformer paper insulation systems. In Proceedings of the 2012 22nd Australasian Universities Power Engineering Conference (AUPEC), Bali, Indonesia, 26–29 September 2012; pp. 1–5. [Google Scholar]
- Siswanto, S.; Indarto, A.; Rahmatullah, R.; Hudaya, C. The effects of drying time during manufacturing process on partial discharge of 83.3 mva 275/160 kv power transformer. MATEC Web Conf. 2018, 218, 04008. [Google Scholar] [CrossRef]
- Convenor, U.A.; Aubin, J.; Davydov, V.; Griffin, P.; Koch, M.; Lundgaard, L.; Scala, M.; Tenbohlen, S. Moisture Equlilibrium and Moisture Migration. Electra 2008, 238, 25–32. [Google Scholar]
- Arshad, M.; Islam, S. Significance of cellulose power transformer condition assessment. IEEE Trans. Dielectr. Electr. Insul. 2011, 18, 1591–1598. [Google Scholar] [CrossRef]
- CIGRE Working Group A2.34. A Guide to Transformer Maintenance. 2011. Available online: https://www.slideshare.net/AHMEDMOHAMEDHEGAB/guide-for-transformer-maintenance-cigre445 (accessed on 22 March 2022).
- Koch, M.; Tenbohlen, S.; Stirl, T. Advanced Online Moisture Measurements in Power Transformers. In Proceedings of the CMD 2006 International Conference on Condition Monitoring and Diagnosis, Changwon, Republic of Korea, 2–5 April 2006. [Google Scholar]
- Ruan, J.; Jin, S.; Du, Z.; Xie, Y.; Zhu, L.; Tian, Y.; Gong, R.; Li, G.; Xiong, M. Condition assessment of paper insulation in oil-immersed power transformers based on the iterative inversion of resistivity. Energies 2017, 10, 509. [Google Scholar] [CrossRef]
- Thiviyanathan, V.A.; Ker, P.J.; Leong, Y.S.; Abdullah, F.; Ismail, A.; Zaini Jamaludin, M. Power transformer insulation system: A review on the reactions, fault detection, challenges and future prospects. Alex. Eng. J. 2022, 61, 7697–7713. [Google Scholar] [CrossRef]
- CIGRE Brochure 323. Ageing of Cellulose in Mineral-Oil Insulated Transformers; CIGRÉ, 2007. Available online: https://www.semanticscholar.org/paper/AGEING-OF-CELLULOSE-IN-MINERAL-OIL-INSULATED/0deca2f06bd377c3c1f856827c1d6eec11e0c625 (accessed on 2 April 2022).
- Anglhuber, M. Why is water killing power transformer insulation ? Water is a slow but deadly poison for power transformers. Omicron 2017, 4, 106–112. [Google Scholar]
- Aro, R.; Jalukse, L. Karl Fischer Titration Usage and Uncertainty Evaluation. 2017. Available online: https://www.researchgate.net/publication/317238903 (accessed on 2 April 2022).
- Margolis, S.A.; Hagwood, C. The determination of water in crude oil and transformer oil reference materials. Anal. Bioanal. Chem. 2003, 376, 260–269. [Google Scholar] [CrossRef] [PubMed]
- Cedergren, A.; Jonsson, S. Diaphragm-free cell for trace determination of water based on the Karl Fischer reaction using continuous coulometric titration. Anal. Chem. 1997, 69, 3100–3108. [Google Scholar] [CrossRef]
- Noria Corporation. Karl Fischer Coulometric Titration Explained and Illustrated. Machinery Lubrication. 2022. Available online: https://www.machinerylubrication.com/Read/594/karl-fischer-coulometric-titration (accessed on 15 October 2022). Machinery Lubrication.
- Margreth, M.; Schlink, R.; Steinbach, A. Water Determination By Karl Fischer Titration. In Pharmaceutical Sciences Encyclopedia: Drug Discovery, Development, and Manufacturing; Shayne, C., Ed.; John Wiley & Sons, Inc.: Hoboken, NJ, USA, 2010; pp. 1–35. [Google Scholar]
- Koch, M.; Tenbohlen, S.; Blennow, J.; Hoehlein, I. Reliability and Improvements of Water Titration by the Karl Fischer Technique. In Proceedings of the 15th International Symposium on High Voltage Engineering, Ljubljana, Slovenia, 7 May 2007. [Google Scholar]
- D1.52 CWG. Moisture Measurement And Assessment In Transformer Insulation—Evaluation of Chemical Methods And Moisture Capacitive Sensors. 2018. Available online: http://ppapco.ir/wp-content/uploads/2019/07/CIGRE-Workgorup-D1.52-741.pdf (accessed on 22 March 2022).
- Hadjadj, Y.; Fofana, I.; van de Voort, F.R.; Bussieres, D. Potential of determining moisture content in mineral insulating oil by fourier transform infrared spectroscopy. IEEE Electr. Insul. Mag. 2016, 32, 34–39. [Google Scholar] [CrossRef]
- CIGRE Working Group. A2.30. Moisture Equilibrium and Moisture Migration within Transformer Insulation Systems; CIGRÉ: Paris, France, 2008. [Google Scholar]
- Sarfi, V.; Mohajeryami, S.; Majzoobi, A. Estimation of water content in a power transformer using moisture dynamic measurement of its oil. High Volt. 2017, 2, 11–16. [Google Scholar] [CrossRef]
- Ding, H.; Heywood, R.; Griffin, P.; Lewand, L. An overview of water and relative saturation in power transformers. In Proceedings of the 2017 IEEE 19th International Conference on Dielectric Liquids, ICDL, Manchester, UK, 25–29 June 2017. [Google Scholar]
- Vaisala. Oil Moisture Expressed as Water Activity (aw). 2009. Available online: https://www.vaisala.com/sites/default/files/documents/OilMoistureExpressedasWaterActivity_B210806EN-A.pdf (accessed on 19 October 2022).
- Wannapring, E.; Sirisithichote, T.; Pattanadech, N.; Leelajindakrairerk, M. Determination of water in transformer by water solubility and percent moisture by dry weight in comparison with ppm water value for justification transformer maintenance. In Proceedings of the 8th International Conference on Condition Monitoring and Diagnosis, CMD, Phuket, Thailand, 25–28 October 2020; pp. 82–85. [Google Scholar]
- Samimi, M.H.; Ilkhechi, H.D. Survey of different sensors employed for the power transformer monitoring. IET Sci. Meas. Technol. 2020, 14, 1–8. [Google Scholar] [CrossRef]
- Islam, T.; Tehseen, Z.; Kumar, L. Highly sensitive thin-film capacitive sensor for online moisture measurement in transformer oil. IET Sci. Meas. Technol. 2020, 14, 416–422. [Google Scholar] [CrossRef]
- Aubin, J.; Noirhomme, B. Limitations to the determination of water content in transformers solid insulation from measurement of water in oil. In Proceedings of the 2016 IEEE Electrical Insulation Conference (EIC), Montreal, QC, Canada, 19–22 June 2016; pp. 366–370. [Google Scholar]
- Martin, D.; Saha, T.; Perkasa, C.; Lelekakis, N.; Gradnik, T. Fundamental concepts of using water activity probes to assess transformer insulation water content. IEEE Electr. Insul. Mag. 2016, 32, 9–16. [Google Scholar] [CrossRef]
- Kondalkar V v Ryu, G.; Lee, Y.; Lee, K. Development of highly sensitive and stable humidity sensor for real-time monitoring of dissolved moisture in transformer-insulating oil. Sens. Actuators B Chem. 2019, 286, 377–385. [Google Scholar] [CrossRef]
- Parret, R. Water Saturation as a Screening Method for On-site Oil Analysis. Machinery Lubrication. Available online: https://www.machinerylubrication.com/Read/200/water-saturation-screening-oil (accessed on 21 September 2022). Machinery Lubrication.
- Ansari, M.A.; Martin, D.; Saha, T.K. Advanced Online Moisture Measurements in Transformer Insulation Using Optical Sensors. IEEE Trans. Dielectr. Electr. Insul. 2020, 27, 1803–1810. [Google Scholar] [CrossRef]
- Roizman, O.; And Dukarm, J.J. Advanced Moisture Assessment for Transformers. Available online: https://netaworldjournal.org/advanced-moisture-assessment-for-transformers (accessed on 8 November 2022).
- Bishop, O. Moisture Sensors. Electronics: A First Course; Routledge: Amsterdam, The Netherlands, 2011; p. 127. [Google Scholar]
- Committee, T.; Engineers, E.; Avenue, T.P.; Licensing, S. IEEE PC57.143 TM/D21 Guide for Application for Monitoring Equipment to Liquid-Immersed Transformers and Components. 2010. Available online: https://www.scribd.com/document/353518116/IEEE-Guide-for-Application-for-Monitoring-Equipment-to-Liquid-Immersed-Transformers-and-Components (accessed on 21 October 2022).
- Gradnik, T.; Cucek, B.; Koncan-Gradnik, M. Temperature and chemical impact on determination of water content in dielectric liquids by capacitive moisture sensors. In Proceedings of the 2014 IEEE 18th International Conference on Dielectric Liquids (ICDL), Bled, Slovenia, 29 June–3 July 2014; pp. 1–5. [Google Scholar]
- Gan, D.; Liu, F.; Du, L.; Liu, Y. Analysis of water solubility in transformer oil using least square fitting method. In Proceedings of the 2010 International Conference on High Voltage Engineering and Application, ICHVE, New Orleans, LA, USA, 11–14 October 2010; pp. 93–95. [Google Scholar]
- Leivo, S.; Leppanen, J. Transformer’s moisture assessment with online monitoring. In Proceedings of the 23rd International Conference on Electricity Distribution, Lyon, France, 15–18 June 2015; Volume 0374, pp. 1–5. [Google Scholar]
- Przyby, P.; Siod, K. Application of capacitive sensor for measuring water content in electro-insulating liquids. Maint. Reliab. 2016, 18, 181–185. [Google Scholar]
- Atanasova-Höhlein, I.; Končan-Gradnik, M.; Gradnik, T.; Čuček, B.; Przybylek, P.; Siodla, K.; Brede Liland, K.; Liu, Q. Experience with capacitive on-line sensors for moisture evaluation in transformer insulation. IEEE Electr. Insul. Mag. 2019, 35, 18–26. [Google Scholar] [CrossRef]
- Shukla, P.; Sood, Y.R.; Jarial, R.K. Experimental Evaluation of Water Content In Transformer Oil. Int. J. Innov. Res. Sci. Eng. Technol. 2013, 2, 284–291. [Google Scholar]
- Annex A1, ASTM E2412-10; Standard Practice for Condition Monitoring of Used Lubricants by Trend Analysis Using Fourier Transform Infrared (FT-IR) Spectrometry. ASTM International: West Conshohocken, PA, USA, 2010.
- Munajad, A.; Subroto, C.; Suwarno. Fourier transform infrared (FTIR) spectroscopy analysis of transformer paper in mineral oil-paper composite insulation under accelerated thermal aging. Energies 2018, 11, 364. [Google Scholar] [CrossRef]
- Gupta, B.K. Direct determination of moisture in solid oil-paper insulation. In Proceedings of the Conference Record of IEEE International Symposium on Electrical Insulation, Arlington, VA, USA, 7–10 June 1998; Volume 2, pp. 583–586. [Google Scholar]
- Armstrong, D.W. Measuring Water: The Expanding Role of Gas Chromatography. LCGC N. Am. 2017, 35, 503–506. [Google Scholar]
- Oommen, T.V. Moisture Equilibrium Charts for Transformer Insulation Drying Practice. IEEE Trans. Power Appar. Syst. 1984, 103, 3063–3067. [Google Scholar]
- Griffin, P.J.; Bruce, C.M.; Christie, J.D. Composition of Water Equilibrium in silicone and Mineral Oil transformer. In Proceedings of the Minutes of the 55th Annual International conference of Doble Clients, Boston, MA, USA, 26–31 March 1998; pp. 10–91. [Google Scholar]
- Tenbohlen, S.; Jovalekic, M.; Bates, L.; Szewczyk, R. Materials Water Saturation Limits and Moisture Equilibrium Curves of Alternative Insulation Systems. In Proceedings of the CIGRE SC A2 & D1 Joint Colloquium, Kyoto, Japan, 10–15 September 2011. [Google Scholar]
- Mukherjee, M.; Martin, D.; Kulkami Svaha, T. A mathematical model to measure instantaneous moisture content in transformer insulation cellulose. IEEE Trans. Dielectr. Electr. Insul. 2017, 24, 3207–3216. [Google Scholar] [CrossRef]
- Martins, M.; Pahlavanpour; Eklund. Study of moisture equilibrium in oil-paper system with temperature variation. In Proceedings of the 7th International Conference on Properties and Applications of Dielectric Materials (Cat No03CH37417), Nagoya, Japan, 1–5 June 2003; pp. 1124–1129. [Google Scholar]
- Bagheri, M.; Naderi, M.S.; Blackburn, T.; Phung, B.T. Dean-Stark vs FDS and KFT methods in moisture content recognition of transformers. In Proceedings of the PECon 2012—2012 IEEE International Conference on Power and Energy, Kota Kinabalu, Malaysia, 2–5 December 2012; pp. 712–717. [Google Scholar]
- ASTM D95, IP 74 I 9029. Dean and Stark Apparatus. 2007. Available online: https://www.lin-tech.ch/pdf/ds109000eng.pdf (accessed on 8 April 2022).
- Straub-Jubb, B.; Matus, I. Tips & Tricks: Karl Fischer Titration—Measuring Water Content of Samples that Do Not Easily Release Water. Available online: https://www.sigmaaldrich.com/MY/en/collections/analytix-reporter (accessed on 2 February 2023).
- Ojha, S.K.; Purkait, P.; Chakravorti, S. Thermodynamic equilibrium of transformer oil-paper insulation—An experimental study. In Proceedings of the 2016 IEEE Uttar Pradesh Section International Conference on Electrical, Computer and Electronics Engineering, UPCON, Varanasi, India, 9–11 December 2016; Volume 2017, pp. 132–137. [Google Scholar]
- McClements, D.J. Determination of Moisture and Total Solids. Available online: https://people.umass.edu/~mcclemen/581Moisture.html (accessed on 24 October 2022).
- Harris, G. Brewing Industry Research Foundation and Brewing. J. Inst. Brew. 1958, 64, 290–303. [Google Scholar] [CrossRef]
- Fabre, J.; Pichon, A. Deteriorating Processes and Products of Paper in Oil Application to Transformers. In Proceedings of the International Conference on Large High Voltage Electric Systems, Sofia, Bulgaria, 17 June 1969; p. 137. [Google Scholar]
- Przybylek, P. Water saturation limit of insulating liquids and hygroscopicity of cellulose in aspect of moisture determination in oil-paper insulation. IEEE Trans. Dielectr. Electr. Insul. 2016, 23, 1886–1893. [Google Scholar] [CrossRef]
- Koch, M.; Krüger, M.; Tenbohlen, S. Comparing Various Moisture Determination Methods for Power Transformers. Power 2009, 509, 1–6. [Google Scholar]
- ASTM. Standard Test Method for Furanic Compounds in Electrical Insulating Liquids by High-Performance Liquid Chromatography, ASTMD Method. Available online: https://www.astm.org/d5837-15.html (accessed on 11 March 2022).
- Koch, M.; Krüger, M.; Gupta, M. A fast and reliable dielectric diagnostic method to determine moisture in power transformers. In Proceedings of the 2008 International Conference on Condition Monitoring and Diagnosis, CMD, Beijing, China, 21–24 April 2008; pp. 467–470. [Google Scholar]
- Koch, M. Reliable Moisture Determination in Power Transformers. centaur-wp.s3.amazonaws.com. 2008. Available online: http://centaur-wp.s3.amazonaws.com/theengineer/prod/content/uploads/2013/04/24123400/2011-09-PotM-Moisture-Determination-PTs-ENU.pdf (accessed on 12 April 2022).
- Du, Y.; Zahn, M.; Lesieutre, B.C.; Mamishev, A.V.; Lindgren, S.R. Moisture Equilibrium in Transformer Paper-Oil System. Ieee Electr. Insul. Mag. 1999, 15, 11–20. [Google Scholar] [CrossRef]
- Setayeshmehr, A.; Fofana, I.; Akbari, A.; Borsi, H.; Gockenbach, E. Effect of Temperature on Dielectric Response of Transformer Insulation. In Proceedings of the 15th International Symposium on High Voltage Engineering (ISH), Ljubljana, Slovenia, 26 – 31 August 2007; p. T8-537. [Google Scholar]
- Gubanski, S.M.; Boss, P.; Csepes, G.; Der Houhanessian, V.; Filippini, J.; Guuinic, P.; Gafvert, U.; Zaeng, W. Dielectric Response Methods for Diagnostics of Power Equipment. In Report of the TF D10109; IEEE Electrical Insulation Magazine: Piscataway, NJ, USA, 2003; Volume 33. [Google Scholar]
- Davydov, G.; Roizman, O. Moisture Assessment in Power Transformers: Lessons Learned. VAISALA News. Vaisala 2002, 160, 18–21. [Google Scholar]
- Zaengl, W.S. Applications of dielectric spectroscopy in time and frequency domain for HV power equipment. IEEE Electr. Insul. Mag. 2003, 19, 9–22. [Google Scholar] [CrossRef]
- Ekanayake, C.; Saha, T.K.; Ma, H.; Allan, D. Application of polarization based measurement techniques for diagnosis of field transformers. In Proceedings of the IEEE PES General Meeting, PES, Gothenburg, Sweden, 11–13 October 2010; pp. 1–8. [Google Scholar]
- Jamail, N.A.M.; Piah, M.A.M.; Muhamad, N.A.; Kamarudin, Q.E. Comparative study on conductivity and moisture content using polarization and depolarization current (PDC) test for HV insulation. Trans. Electr. Electron. Mater. 2014, 15, 7–11. [Google Scholar] [CrossRef]
- Saha, T.K.; Yao, Z.T. Experience with return voltage measurements for assessing insulation conditions in service-aged transformers. IEEE Trans. Power Deliv. 2003, 18, 128–135. [Google Scholar] [CrossRef]
- Saha, T.K.; Purkait, P. Investigation of Polarization and Depolarization Current Measurements for the Assessment of Oil-paper Insulation of Aged Transformers. IEEE Trans. Dielectr. Electr. Insul. 2004, 11, 144–154. [Google Scholar] [CrossRef]
- Saha, T.K.; Purkait, P. Investigation of an expert system for the condition assessment of transformer insulation based on dielectric response measurements. IEEE Trans. Power Deliv. 2004, 19, 1127–1134. [Google Scholar] [CrossRef]
- Fofana, I.; Hadjadj, Y. Electrical-Based Diagnostic Techniques for Assessing Insulation Condition in Aged Transformers. Energies 2016, 9, 679. [Google Scholar] [CrossRef]
- Hernandez-mejia, J.C. CHAPTER 6 Dissipation Factor (Tan δ); Cdfi Handbook; NEETRAC: Forest Park, GA, USA, 2016; pp. 1–102. [Google Scholar]
- Chakravorti, S.; Dey, D.; Chatterjee, B. Recent Trends in the Condition Monitoring of Transformers: Theory, Implementation and Analysis; Power Systems; Springer: London, UK, 2013. [Google Scholar]
- Ohlen, M.; Werelius, P.; Cheng, J.; Skoldin, J. Best practices for Dielectric Frequency Response measurements and analysis in real-world substation environment. In Proceedings of the 2012 IEEE International Conference on Condition Monitoring and Diagnosis, CMD, Bali, Indonesia, 23–27 September 2012; pp. 244–249. [Google Scholar]
- Xia, G.; Wu, G.; Gao, B.; Yin, H.; Yang, F. A new method for evaluating moisture content and aging degree of transformer oil-paper insulation based on frequency domain spectroscopy. Energies 2017, 10, 1195. [Google Scholar] [CrossRef]
- Zhang, D.; Zhao, H.; Yun, H.; Liu, X.; Han, Y.; Mu, H.; Zhang, G.J. Study on FDS characteristics of oil-immersed paper insulation bushing under non-uniform moisture content. IET Sci. Meas. Technol. 2018, 12, 691–697. [Google Scholar] [CrossRef]
- Jaya, M.; Leibfried, T. Dielectric modelling and diagnosis of the oil-paper- insulation system in power transformers. In Proceedings of the 16th International Symposium on High Voltage Engineering (ISH), Cape Town, South Africa, 24–28 August 2009; pp. 2–6. [Google Scholar]
- Ten, C.F.; Fernando, M.A.R.M.; Wang, Z.D. Dielectric properties measurements of transformer oil, paper and pressboard with the effect of moisture and ageing. In Proceedings of the Annual Report—Conference on Electrical Insulation and Dielectric Phenomena, CEIDP, Vancouver, BC, USA, 14–17 October 2007; Volume 1, pp. 727–730. [Google Scholar]
- Analyzers, I.D. Insulation Diagnostic Analyzers. 1996. Available online: https://us.megger.com/insulation-diagnostic-analyzer-idax-series (accessed on 22 March 2022).
- Cheng, J.; Werelius, P.; Ohlen, M. Dielectric frequency modeling-transformer insulation model improvements including contamination effects. In Proceedings of the International Colloquium Transformer Research and Asset Management, Opatija, Croatia, 12–14 November 2012. [Google Scholar]
- Liu, J.; Qi, P.; Zhang, M.; Liao, L.; Zhang, W. A quantitative calculation method of frequency domain dielectric spectroscopy of moisture-containing oil-paper insulation. In Proceedings of the IEEE International Conference on Properties and Applications of Dielectric Materials, Xi’an, China, 20–24 May 2018; pp. 594–597. [Google Scholar]
- Kumar, A.; Verma, H.C.; Baral, A.; Pradhan, A.K.; Chakravorti, S. Estimation of paper-moisture in transformer insulation employing dielectric spectroscopy data. IET Sci. Meas. Technol. 2018, 12, 536–541. [Google Scholar] [CrossRef]
- Rediansyah, D.; Prasojo, R.A.; Suwarno Abu-Siada, A. Artificial intelligence-based power transformer health index for handling data uncertainty. IEEE Access 2021, 9, 150637–150648. [Google Scholar] [CrossRef]
- Rediansyah, D.; Prasojo, R.A.; Suwarno. Study on Artificial Intelligence Approaches for Power Transformer Health Index Assessment. In Proceedings of the 2021 International Conference on Electrical Engineering and Informatics (ICEEI), Kuala Terengganu, Malaysia, 12–13 October 2021; pp. 1–4. [Google Scholar]
- Raisan, A.; Yaacob, M.M.; Alsaedi, M.A. Faults diagnosis and assessment of transformer insulation oil quality: Intelligent methods based on dissolved gas analysis a-review. Int. J. Eng. Technol. 2015, 4, 54. [Google Scholar] [CrossRef]
- Kumari, P.; Kaur, K.; Singh, J. Condition monitoring of power transformer using ANN for IEC based on DGA. Int. J. Control. Theory Appl. 2016, 9, 29–36. [Google Scholar]


Disclaimer/Publisher’s Note: The statements, opinions and data contained in all publications are solely those of the individual author(s) and contributor(s) and not of MDPI and/or the editor(s). MDPI and/or the editor(s) disclaim responsibility for any injury to people or property resulting from any ideas, methods, instructions or products referred to in the content. |
© 2023 by the authors. Licensee MDPI, Basel, Switzerland. This article is an open access article distributed under the terms and conditions of the Creative Commons Attribution (CC BY) license (https://creativecommons.org/licenses/by/4.0/).