Abstract
This paper describes an energy management strategy for a DC microgrid that utilizes a hybrid renewable energy system (HRES) composed of a photovoltaic (PV) module, a wind turbine based on a permanent magnetic synchronous generator (PMSG), and a battery energy storage system (BESS). The strategy is designed to provide a flexible and reliable system architecture that ensures continuous power supply to loads under all conditions. The control scheme is based on the generation of reference source currents and the management of power flux. To optimize the supply–demand balance and ensure optimal power sharing, the strategy employs artificial intelligence algorithms that use previous data, constantly updated forecasts (such as weather forecasts and local production data), and other factors to control all system components in an optimal manner. A double-input single-output DC–DC converter is used to extract the maximum power point tracking (MPPT) from each source. This allows the converter to still transfer power from one source to another even if one of the sources is unable to generate power. In this HRES configuration, all the sources are connected in parallel through the common DC–DC converter. The strategy also includes a long short-term memory (LSTM) network-based forecasting approach to predict the available energy production and the battery state of charge (SOC). The system is tested using Matlab/Simulink and validated experimentally in a laboratory setting.
1. Introduction
The recent challenges in energy management strategies in smart grids focus on the processes useful to supervise, control, and optimize the exploitation of power. Several approaches have been developed in recent years to monitor renewable energies (PV panel, wind turbine, geothermal, etc.) and to deal with data acquisition with power management systems due to the ever-growing demand in industrial, commercial, and domestic sectors [1]. Renewable energy-based hybrid renewable energy systems (HRESs) offer better options than single source-based systems. The goal of renewable energy integration is to enhance the design and operation of the electrical grid in order to minimize carbon emissions by expanding the usage of renewable energy, storage systems, and other green distributed power [2]. Indeed, HRES is proficient at enhancing some features of the global system in terms of decreasing power storage capacity, power quality, cost, reliability, and efficiency [3].
Coupled with the fast development in advanced power electronic interfaces, renewable power technologies, and safe electric infrastructure, some smart solutions could be evolved to meet the requirement imposed by the hybrid power management systems and to make the optimized use of various power sources and energy storage devices [4]. HRESs generally consist of distributed energy sources, such as a photovoltaic (PV) and a wind turbine (WT), a control system, an energy storage system (ESS), and an energy management strategy (EMS). WT-PV is a promising combination because of their complementary nature. Thus, there are various HRESs but the WT-PV system represents the most common hybrid system. Thus, hybrid systems with wind and solar power have experienced a notably accelerated growth in such sectors [5].
However, solar and wind energy are unpredictable in nature, as they are strongly correlated to the weather condition. To improve the dependability of a hybrid system based on WT-PV energy sources, other sources such as battery storage and fuel cells can also be incorporated as a backup system [6]. Therefore, ESS is used to overcome the intermittency of WT and PV outputs in the hybrid system and it is considered as the heart of HRES due to its importance. Thus, integrating ESS inside interconnected electrical networks is associated with improvements in controlling power features in terms of node voltage magnitude and phase angle. A correctly sized and located ESS can assist in meeting peak energy requirements, improving the benefits of integrating renewable power sources, and improving power quality control such explained in [7].
The intensive emergence of HRES opens the door to research on finding the best hybrid systems to obtain the most amount of power and on developing smart energy management strategies by designing mathematical models, intelligent techniques, and algorithms in order to share power in an efficient way that helps to balance the power supply and demands [8].
Thus, our project focuses on the design of a smart microgrid and on the development of an intelligent EMS which guarantees the balance between power demand and production while ensuring the security of the whole system system. The main contributions of our work are the implementation of an experimental test bench for solar energy conversion system, wind energy conversion system (WECS), and ESS, and application of MPPT algorithms to extract the maximum power from each source. In addition, the concept of a DISO DC–DC boost circuit is performed in real time and is used to integrate the two input sources (PV, WECS).
Finally, an EMS is developed and analyzed to operate the ESS and the power converters through adequate control in order to effectively share the power generated by the hybrid system, as well as to impose battery protection and power saving capabilities based on the forecasting algorithm which will consider several parameters such as the meteorological conditions, the forecasting production, and the battery SOC.
The rest of the paper is structured as follows. Section 2 illustrates some previous works; it shows how the key literature and EMSs were selected and reviewed. Section 3 describes, in detail, the modeling of the wind/PV/ESS for the synthesis of the control laws. Section 4 illustrates the control schemes that help to achieve an effective EMS. Section 5 explains the proposed EMS algorithm. Constructed DC microgrid and experimental verifications are presented in Section 6. Power production forecasting and the battery SOC prediction results are discussed in Section 7. Section 8 comprises a discussion of the key findings of our work and a synthesis of future paths to bridge research gaps. Lastly, a conclusion is given in Section 9.
2. Literature Review
Researchers are currently investigating several methods to design effective EMSs which may be good solutions to achieve an optimal operation and resilience of the systems, to smooth the integration of renewable energy, to save energy, and to solve the problems that result from traditional electrical systems [9,10].
Different EMSs have been proposed in the literature [11,12] and these EMSs are dependent on various factors such as the power generation from hybrid sources, the control approaches, the considered scenarios, the load requirement, the cost,... etc. [13].
Some hybrid systems are conceived due to the enhanced efficiency achieved by these sources. A hybrid system based on PV and micro-hydro generator is studied in [14]. This system depends on the energy generation of each source, where the production of the micro-hydro generator strictly depends on the water flow availability. In the rainy season, the water flow is sufficiently present to gather the required energy from the micro-hydro generator, but during the dry season, it is hard to obtain enough energy, which is an evident problem.
In [15], the authors conducted a study of a hybrid solar PV and biomass generator-based supply system with energy storage units for sustainable powering of the base stations with high quality of services. In addition, researchers studied the deployment of many hybrid systems such as wind and fuel cells [16], solar and biomass [17], wind and biomass [18], solar–wind-biomass [19], and solar–wind–hydraulic accumulator [20].
Recently, the crucial concern of researchers is to optimize hybrid power systems to give the largest amount of power to enhance the efficiency. Many conducted studies are currently concentrating on the energy of the sun and the wind. Therefore, most of the researchers propose the integration of a hybrid power system based on PV and wind energy using a suitable energy storage tool to ensure an uninterrupted power supply [21]. Both solar and wind power are not persistently available and are highly dependent on seasonal or daily climatic conditions. In addition, the two sources are characterized by a high degree of complementarity. Thus, the best solution to optimize the generated power of the whole system is to merge the two resources.
However, control coordination and energy management of a hybrid power system based on a PMSG, a PV system, and ESS have attracted little research attention. On the other, with the fast development of artificial intelligence (AI) technologies, climatic prediction (temperature, solar radiation, wind speed) helps in finding the best way to extract energy from the wind and the sun. In addition, the process of forecasting the behavior of the energy system (production and consumption) leads to avoid any problems because of the irregularity of the load, to mitigate energy potential uncertainties, and consequently protecting the electrical grid [22].
Different EMSs of the hybrid solar and wind microgrids were proposed in [23,24,25]. In these works, various control approaches were designed to control the different converters integrated into each system and then validated experimentally. In [26], a simple power management for a PV-fed DC-microgrid was proposed. The overall microgrid consisted of a cluster of four nanogrids connected through a common DC bus with a single ESS. The proposed power management integrates the power sharing capability among the nanogrids. However, using the power switching circuit in each nanogrid can increase the power loss. Authors in [27] also tackled a novel genetic optimized multicontrol adaptive fractional order PID (AFOPID) for a photovoltaic (PV) and wind connected grid system. This work treated the control of the proposed system without introducing an energy management strategy to supervise the entire system. Nonetheless, the numerous types of power converters increase the complexity of the system and make it compact. In addition, the weather and the consumption forecasting were ignored.
Therefore, our work focuses on the use of the dual-input single-output converter as a kind of multi-input converter which decreases the complexity of the entire system and then facilitates the control process. In addition, power production and the battery state of charge (SOC) predictions are introduced to achieve the reliability of the system.
3. HRES Configuration
The investigated HRES used in this work consists of solar PV, wind-turbine-based PMSG generator, dual-input DC–DC converter, battery energy storage system, a DC load, and some additional components. The power sources (PV, wind, battery) are connected to the common DC bus to supply the DC load. The PV–wind power generators are coupled to the DC bus via the dual-input single-output DC–DC converter and the battery is connected through the bidirectional buck–boost converter. The overall scheme of the proposed HRES is described in Figure 1. The energy conversion PV and wind resources are reciprocal to each other with respect to meteorological conditions. Therefore, the combination of PV and wind hybrid renewable systems is more effective with regard to energy generation as compared to a single source. However, the PV–wind power system requires energy storage system backup under unfavorable conditions for a standalone microgrid to achieve better performances, which influences hybrid system reliability, efficiency, cost, and environmental emission [28]. In addition, the PV–wind hybrid system operation depends on the each element behavior. Therefore, rectifying each renewable power source performance is essential to attain optimal microgrid operation. Each component of the entire system is modeled and discussed in this section.
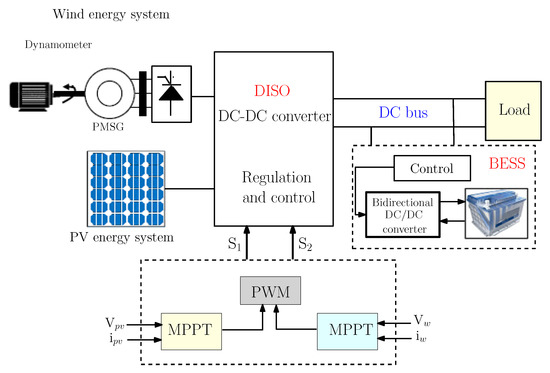
Figure 1.
PV/wind HRES representation.
3.1. Power Sources Modeling
3.1.1. PV Modeling
Solar or photovoltaic (PV) energy has witnessed increased attention as a prominent renewable power source nowadays. Thus, it is considered as one of the prime renewable power resources because it is pollution-free, abundant and recyclable. Indeed, a photovoltaic cell is often presented as an electric current generator whose behavior is equivalent to a current source shunted by a diode. The diode is formed by a p–n junction. The physical phenomena at the level of the cell have been studied by incorporating two series and parallel intrinsic resistors and into the model level, as shown in Figure 2.
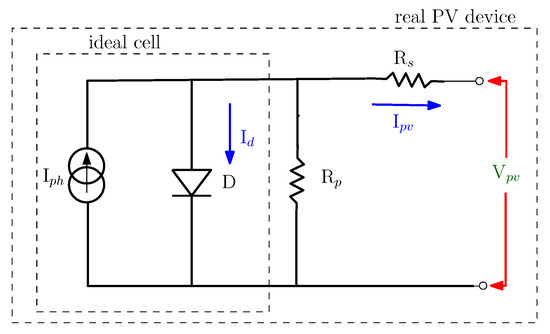
Figure 2.
The equivalent circuit of a photovoltaic cell.
Therefore, the process of modeling the solar cell can be represented through Equations (1)–(3) in terms of the photocurrent , the current via the diode, and the leakage current [29]. Furthermore, electrical proprieties of the cell differs somewhat from those of a diode. Therefore, is represented using the Shockley equation, as shown below:
The leakage current caused by the shunt resistance is as follows:
The net current supplied by the cell can be stated in the following way:
Thus, replacing and by their expressions in the above governing equation allows it to be written as follows:
with
- : the net produced current;
- : the diode current;
- : the photocurrent in shunt;
- : the saturation current of the diode;
- q: the electron charge (C);
- : the cell intrinsic series resistance;
- : the cell intrinsic shunt or parallel resistance;
- n: the diode ideality factor which is between 1 and 2;
- K: the Boltzmann constant ( J/K);
- T: the temperature of the junction during its operation (K).
A photovoltaic generator consists of a set of elementary photovoltaic cells connected in series and/or in parallel. Therefore, the following equation describes the current delivered by the PV panel as a function of the number of cells in series and parallel [30]:
3.1.2. WECS Modeling
A. Wind Turbine Modeling
WECSs have achieved continued growth in power generation over the recent decades. These systems capture the kinetic energy of the wind through the aerodynamic blades of the wind turbine and use it to rotate the generator (PMSG), which in turn generates electrical power. The fundamental equation describing the mechanical power of the wind turbine is given by:
where R is the blade turbine radius and is the aerodynamic power coefficient, which is a function of the tip speed ratio (TSR) and the pitch angle . The relation between these parameters can be illustrated as [31]:
The coefficient is a specific parameter that characterizes the aerodynamics of wind turbines. It is defined as the ratio of the tangential velocity of the blade tip to the free stream velocity. The TSR is given as:
where is the angular speed (rad/s).
B. PMSG Modeling
The electrical model of the PMSG can be expressed in the park reference as [32]:
- are the synchronous rotating reference frame.
- is the stator resistance.
- presents the electric pulsation.
- , are the stator currents expressed in the reference.
- , are the stator voltages expressed in the reference.
- and define the totalized fluxes in each phase and are given as:
- : the aerodynamic torque.
- f: the friction coefficient.
- : the dry friction torque.
- J: the moment of total inertia.
The active and the reactive powers are represented as:
3.1.3. DISO Converter Modeling
This section provides an overview of the converter under consideration. In reality, the design of its control system necessitates a thorough understanding of the converter topology, working principle, and average state model. Figure 3 depicts the boost–boost converter. This converter is investigated, analyzed, and evaluated in [33] to provide a more in-depth understanding of the operating principles and recommended control approaches.
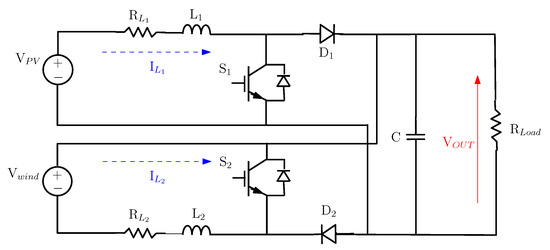
Figure 3.
Boost–boost converter circuit diagram.
The proposed DISO DC–DC converter’s circuit topology includes two input voltages and , two resistors (, ), two inductors (, ), two controllable switches (, ), and two diodes (, ). The diodes and are linked to prevent current passage from to and vice versa. The source is a photovoltaic (PV) source, while the source is a wind turbine generator. The two voltage sources and are connected to the DC link capacitor (C) to supply the load.
The illustrated topology may deliver power to the load from the two integrated renewable power sources either concurrently or separately by applying suitable gate signals to the switches. This converter includes four operational modes.
- mode 1: Both switches are turned on;
- mode 2: is off and is on;
- mode 3: is on and is off;
- mode 4: Both switches are turned off.
3.1.4. Battery Modeling
The BESS is an important implement for reducing the differences between energy production and consumption that can be notably hard to control when generation is supplied by variable renewable power sources such as wind and solar energy. Variable production sources must generally be converted and conditioned, adopting power electronics to serve the load either in a microgrid or on the utility grid. Batteries are one of the most current electronic devices utilized for adding resilience to smart electric micogrids and saving electrical energy, since it helps to deal with the unpredictability of renewable sources. In the field of battery modeling, there are various electrochemical models that have been proposed in the literature such as internal resistance battery model, one RC network battery model, and Randles circuit [34]. One of the most precise models, the Shepherd model, is shown in Figure 4, and the corresponding electrical behaviors are expressed as follows:
where E is the no-load voltage (V), denotes the battery constant voltage (V), is the internal resistance (), K presents the polarization constant (Ah−1) and Q is the battery capacity (Ah), A denotes the exponential voltage (V), and B is the exponential capacity (Ah−1).
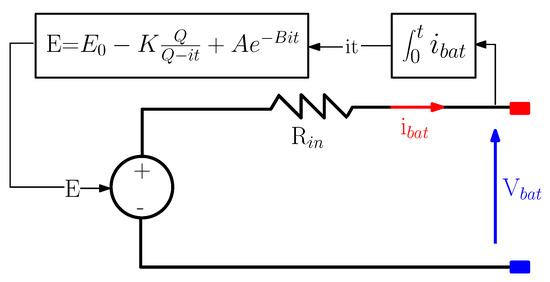
Figure 4.
The generic battery model.
4. Control Strategies
The major goal of the suggested control approach is to achieve an uninterrupted power feed. The wind and the PV rated powers are chosen to fulfill the peak load power demand. This implies that the load can be totally powered from at least one power source. In order to assure a continuous electrical energy, control mechanisms are being developed for both renewable power sources and the BESS. Vector control strategy is applied to reach the maximum power tracking for the PMSG. For the control of the PV emulator, the perturb and observe (P&O) algorithm is implemented as an MPPT method in order to extract the maximum generated power. The MPPT principle is to control the duty cycle for the pulse width modulation block that controls the power converter to supply maximum electrical energy to the load. In our work, the DISO boost converter is controlled via the two IGBT switches and to power the load, as shown in Figure 3.
4.1. MPPT Control for the Wind PMSG Turbine
A vector control approach is applied for controlling the PMSG, as clearly depicted in Figure 5. The complete PMSG drive system includes a three-phase power converter, machine side speed, generator, and current controllers. The vector controller generates PWM signals through a current regulator. This optimal control has two current regulators which are exploited to regulate the component currents and corresponding to the desired torque . As a result, the rated value of flux is preserved. The reference torque is also obtained via an outer-controller-based speed control. The equations used to design the control process are given as:
and designate the reference values of the direct and quadrature components of stator current in rotor reference frame, respectively.
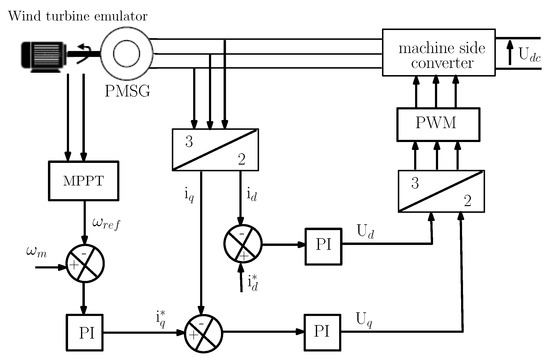
Figure 5.
Control scheme of the WECS.
4.2. MPPT Control for the PV System
To optimize the effectiveness of the PV generator, it is important to generate the maximum output energy of the PV system by applying so-called MPPT control approaches. The MPPT control allows the PV generator to operate at optimum current and voltage. Thus, the extraction of maximum electrical energy is ensured. Indeed, various techniques for maximizing the power generated by renewable energy source have been discussed in the literature. The MPPT algorithms involve perturb and observe (P&O), incremental conductance (IC), hill climbing (HC), maximum power voltage (MPV) technique, fuzzy logic (FL) algorithm, and neuro-fuzzy approach [35]. Because of its simplicity of implementation, the P&O MPPT algorithm is applied under uniform weather conditions to track the maximum power point of the disposable power. The flowchart of the adopted P&O algorithm for the PV system is given in Figure 6.
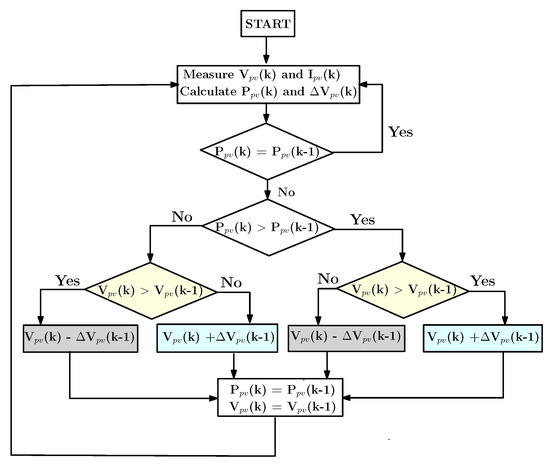
Figure 6.
P&O MPPT algorithm.
4.3. BESS Control
The proposed BESS consists of a battery and a bidirectional DC–DC buck–boost converter linked to the DC bus of the hybrid system. The role of this power converter is to control the charging/discharging process according to power generation and load demand. Indeed, the adopted converter is able to transfer power between its two ports, supporting both negative and positive currents. The DC bus voltage is controlled in the BESS through a PI control cascade strategy. When the DCs less than the reference voltage it will discharge to the load. Again, when the DC voltage is greater than the reference voltage, it will charge the battery. Depending on the voltage , the controller drives the two IGBTs of the converter. The final output of the BESS controller is two switching signals (, ) which are complementary to avoid battery short-circuit. Figure 7 shows the BESS controller.
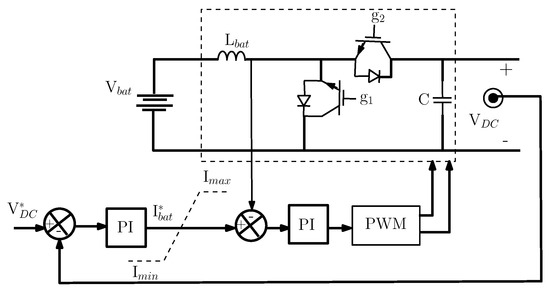
Figure 7.
BESS and control structure.
5. EMS Algorithm
Chiefly, the EMS of a system aims at optimizing the exploitation of the different energy sources integrated in the hybrid network. This strategy consists of making the right decisions regarding the different scenarios that the multisource system will face during its operation. To achieve its objectives, the management process of the HRES must generally follow the strategic approach described in Figure 8.
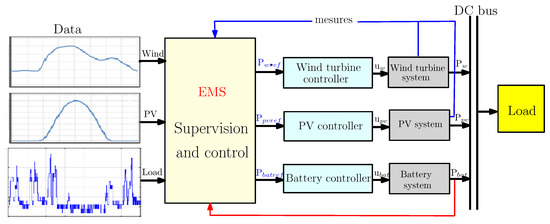
Figure 8.
Global EMS control scheme.
The aim of the EMS is to maintain the power balance of the HRES and power the load continuously under different generation and load demand condition. The power balance equation of the proposed microgrid is provided as follows:
The proposed EMS algorithm used in this work is illustrated in the flowchart of Figure 9.
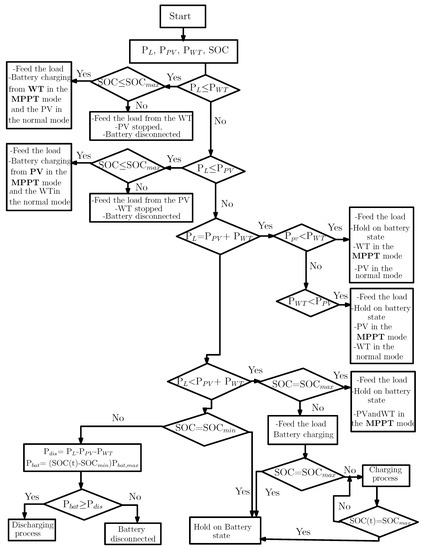
Figure 9.
Flowchart of the EMS.
This power management strategy is a power system comprising a supervisory control module that monitors the required real-time parameters from the wind–PV–battery system, multiple current and voltage sensors, and different controllers for each of the power electronic converters. According to the variation of the controlled parameters, the EMS decides the scenarios and selects appropriate control approaches to be applied to the used converters to insure a reliable power environment. The suggested EMS has several modes of operation.
Each mode of operation depends on two factors: power generation and the battery’s SOC. Thus, the main operation modes can be listed below as:
- Mode 1: , in this mode, we considered two cases:
- –
- 1a: If and , then the WT is in the MPPT mode and the battery is in the charging mode.
- –
- 1b: If and , then the PV is in the MPPT mode and the battery is in the charging mode.
- Mode 2: ; in this case, the PV or the WT are in the MPPT mode.
- Mode 3: and .
In this case, the PV and the WT are in the MPPT mode and the battery is in the discharging mode. Otherwise, if , in this case, the battery is disconnected and the load is in the shedding mode.
These modes are explained with various proposed scenarios in detail in the flowchart of Figure 9, and a summary of this algorithm is as follows:
The desired mode is obtained when the power provided by the PV generator and WECS exceeds the load demand. During this operation, the battery is charged until ; if the battery SOC reaches , then the MPPT controller is switched to off-mode which limits solar power output since total power generation exceeds demand and the excess generated power can no longer be used to charge the battery. When the power delivered by the solar and wind energy sources does not satisfy the load requirement, the power shortfall is supplied by the battery until the SOC reaches , at which point load shedding is required to maintain power balance since the power supply is less than demand. If the generated energy is higher than the load demand, the DC bus voltage rises. Thus, the BESS is charged with excess power and load power stays constant. If the generated power is less than the load need, the DC bus voltage decreases, so the BESS discharges required power to the load.
6. EMS Implementation
The experimental setup to emulate the hybrid wind–PV energy conversion system with BESS and experimental results are presented and discussed in this section. In this paper, a PV/wind/battery DC microgrid is set up, and the system parameters are listed in Table 1 and Table 2. The hardware setup of the proposed system is illustrated in Figure 10. The system includes circuits to measure the PV module, the WT generator, the battery, the load output variables, and the developed DC–DC (DISO boost–boost, buck–boost) converters that are presented in Figure 3 and Figure 7.

Table 1.
WT and PMSG specifications.
Table 2.
PV emulator specifications.
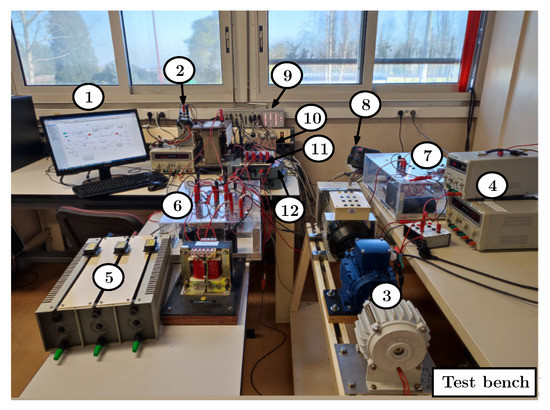
Figure 10.
Experimental test bench: 1. PC interface; 2. PV simulator; 3. WT simulator; 4. ESS; 5. Load; 6. DISO converter; 7. Bidirectional converter; 8. Frequency variator; 9. dSPACE 1104 board; 10. Controller board; 11. Current sensor; 12. Voltage sensor.
The current and voltage sensors were used for current and voltage measurement, respectively. The control system was implemented on a controller board designed by our team laboratory. The converter switching frequency = 20 MHz was chosen to the limitation of the microcontrollers and the dSPACE 1104 board. Our control strategy was successfully tested on dSPACE1104 which contains two DSP (Texas Instruments TMS320F240 and Motorola PowerPC604). This card is manufactured in Germany. The DS1104 board upgrades a PC to a development system for rapid control prototyping. The experimental data were saved in “mat” format by the dSPACE 1104 card, and then the curves were plotted using MALTAB.
To validate the EMS, the system was tested under various operating conditions (solar irradiation, wind speed, and load). Thus, to realize a precise analysis of the performance of the different control and management techniques, they were experimentally tested, taking into account the different wind speed and irradiation diagrams. A random change in the wind turbine generator was used in this case, as shown in Figure 11. The variation of the solar irradiance is illustrated in Figure 12. Figure 13 and Figure 14 describe the variation of the rectified output voltage of the PMSG generator and the output voltage of the PV emulator, respectively, depending on the weather conditions. As shown, the wind turbine voltage and the PV voltage are proportional to the wind speeds and the solar irradiance, respectively. Figure 15 and Figure 16 give the current variations on the two power sources (the PMSG generator and the PV emulator). As clearly observed, the two output currents well follow their references which are determined by the MPPT algorithms, and the angular speed of the wind turbine generator also well follows the reference value as shown in Figure 17. These results demonstrate the effectiveness of the control system. Figure 18 and Figure 19 show the generated power of the PMSG generator and the PV emulator as the principle power sources. These powers are highly dependent on the weather conditions and the control strategies which are designed to extract maximum power under any circumstance. Figure 20 gives the power load demand and Figure 21 shows battery power variation which is dynamically dependent on the produced and required power. In our experimental test, the generated power is greater than the load power, and consequentially the battery is used as a storage system. Its charging current is negative; therefore, the charging power is also negative.
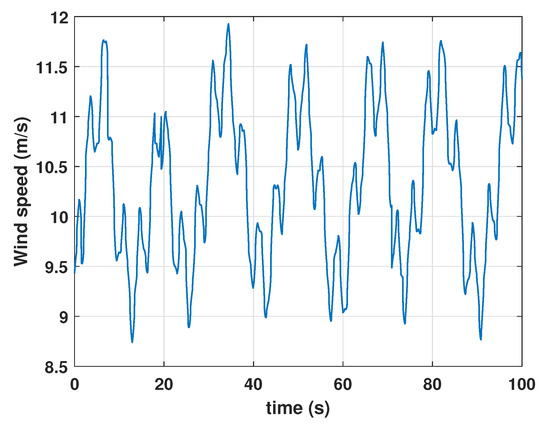
Figure 11.
Wind speed variation.
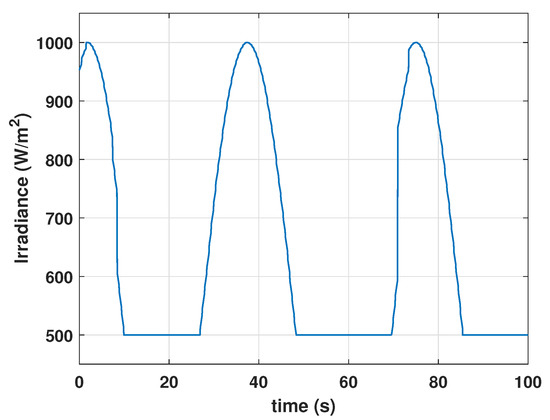
Figure 12.
Solar irradiation variation.
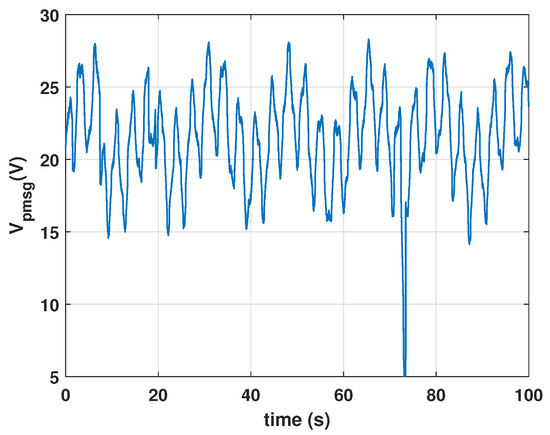
Figure 13.
Output voltage of the PMSG.
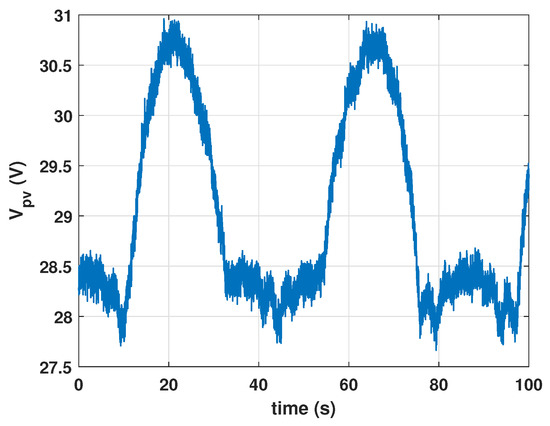
Figure 14.
Output voltage of the PV emulator.
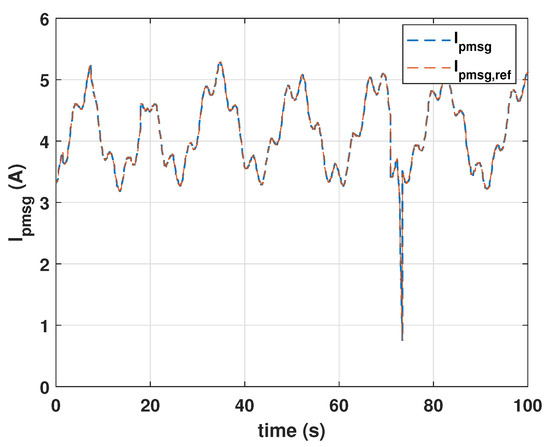
Figure 15.
Output current of the PMSG.
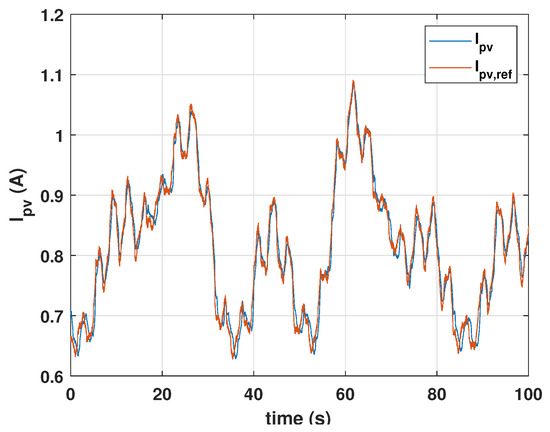
Figure 16.
Output current of the PV emulator.
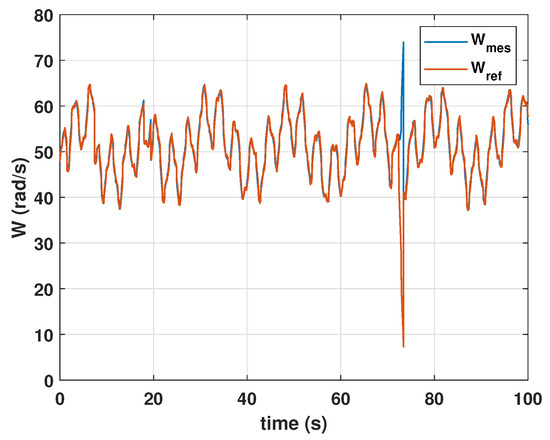
Figure 17.
Angular speed variation.
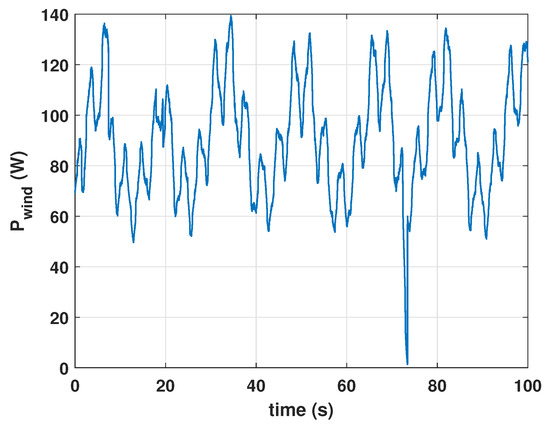
Figure 18.
Output power of the PMSG.
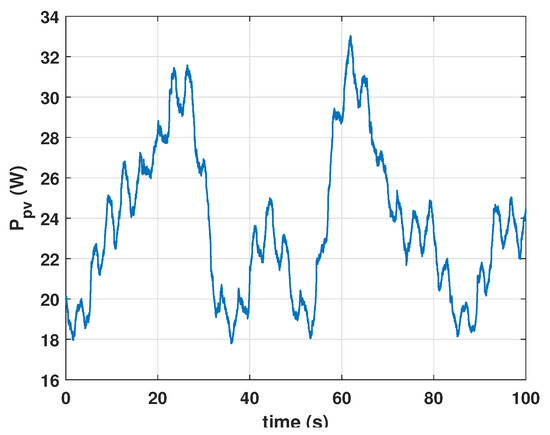
Figure 19.
Output power of the PV emulator.
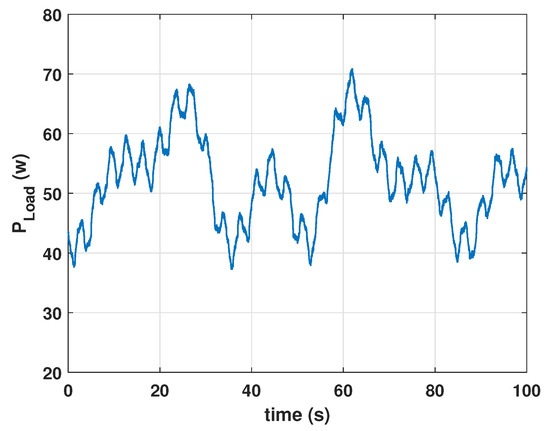
Figure 20.
Output power of the DC load.
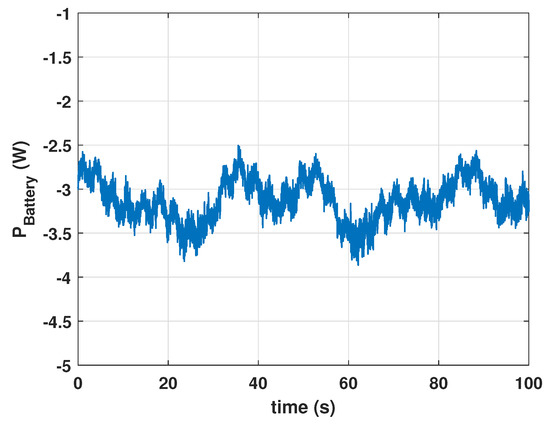
Figure 21.
Power of the battery emulator.
7. LSTM and Forecasting Technique
7.1. Power Potential Forecasting
Detailed information on energy production and consumption predictions is a crucial element for the management strategies and the good operation of microgrids. Reliable forecasts for the generation of intermittent renewable power sources permit less use of storage systems and better integration of higher quantities of RES. Depending on this prediction, decisions and control strategies can be applied. The forecasting approaches are often designed in a collaboration between the producer, the network operators, and the forecasters to define the context and the aims of their application. Forecasting is an estimate of the short, medium, or long-term variation of a variable or phenomenon. It is employed in intermittent energies to expect future production. As part of intermittent renewable energy contribution in the energy mix, the electrical grid operator requires production predictions to achieve high performances, efficiency, and a secure electricity supply system. In summary, power production approaches can be classified into various categories based on mathematical, statistical, physical, artificial intelligence (AI), and hybrid. Advanced approaches, such as artificial neural networks (ANNs), are used in AI methodologies to anticipate energy output and demand variations for providing flexibility to the electrical systems [36]. This method is used to identify data models from learning datasets. However, the necessity for a large amount of historical data to develop the ANN and anticipate electricity generation is a significant drawback [37].
In this work, we propose to integrate neural network techniques to forecast PV power production as a kind of renewable source and the battery’s SOC. They allow us to achieve a better decision-making and management strategy. This contributes greatly to the improvement of the performance of a hybrid power system. In the following, we will use the LSTM as a neural network forecasting algorithm.
7.2. LSTM Neural Network Architecture
The LSTM networks are a form of recurrent neural network that can handle nonlinear approximation tasks of time series. The LSTM network is based on the inclusion of a cell memory in the RNN which offers a promising solution for preventing the gradient disappearance. Their contribution is especially noticeable in extended sequences of events. It has also demonstrated a considerable improvement in terms of forecasting stability. The LSTM method can provide more reliable predicting power in time-series forecasting, compared to traditional neural networks [38]. Figure 22 depicts the internal structure of an LSTM network which is made up of numerous perceptrons that are linked in a well-organized manner. Every perceptron may be modeled as a gate, and these gates can feed forward the information stored inside in them; the units are the input gate, output gate, the cell gate, which includes the update of information, and, finally, the forget gate, which can erase information from the next time step output [39].
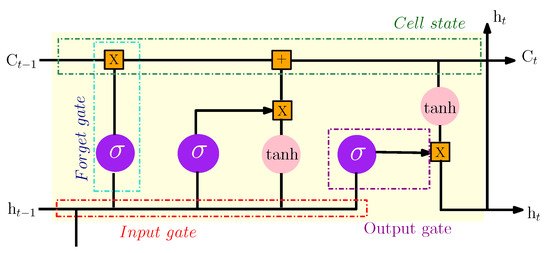
Figure 22.
The internal structure of the LSTM model.
The gates are triggered via and activation functions. The equations that characterize the relationships between the LSTM output, the cell state, and the various gates are as follows [40]:
where is the LSTM inputs, , are the input gates, , , and represent, respectively, the forget gates, the output gates, and the cell state. The LSTM output is . is the sigmoidal activation function and it can be defined as:
present the network feed-forward weights, are the network recurrent weights, and, finally, designate the network bias weights.
7.2.1. Data Preprocessing
The dataset used in our work was collected from two sources. For the PV generator, the data were obtained from the Photovoltaic Geographical Information System (PVGIS) website, and the battery’s SOC was obtained from the registered data on the evolution of the SOC of a battery in our laboratory throughout a year.
After the collection of data, we were interested in the preprocessing step. Indeed, because the gathered data tend to be partial and incoherent, preprocessing seeks to eliminate noise, fill in missing values, and rectify inconsistencies in the data. Therefore, we utilized the simple moving average () technique to fill in the missing information. Then, we used the to normalize the data, which seeks to place values within specific ranges and accelerate the model’s execution. The and the are calculated as [41]:
where
- a is the average in period n;
- n designates the number of time periods.
7.2.2. Train and Test of the LSTM Model
The dataset was split into two parts: training and testing. In this work, as an example, to forecast 24 h of PV power and battery ‘SOC’, the training group consisted of of the whole dataset. This percentage was chosen to produce accurate predicted values. Indeed, the prediction model was built on the training group. The remaining of the dataset was designated as the test group for model evaluation. For the prediction of PV production and SOC, we trained the LSTM model using a single hidden layer that includes 80 and 100 hidden units, respectively. We employed the ADAM optimizer, which is one of the optimization strategies used in deep learning. The learning rate was 0.01 and decayed every 50 epochs.
7.3. Predictive Simulation Results
The main goal of the forecasting process is to investigate the behavior of the power system under several stresses. Figure 23 shows the monthly PV power production, while Figure 24 shows the monthly battery’s SOC.
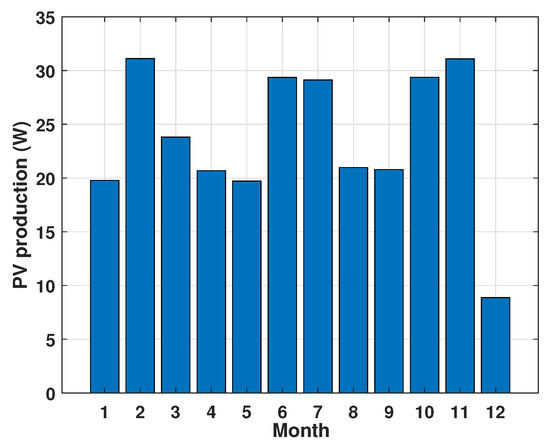
Figure 23.
PV monthly power production.
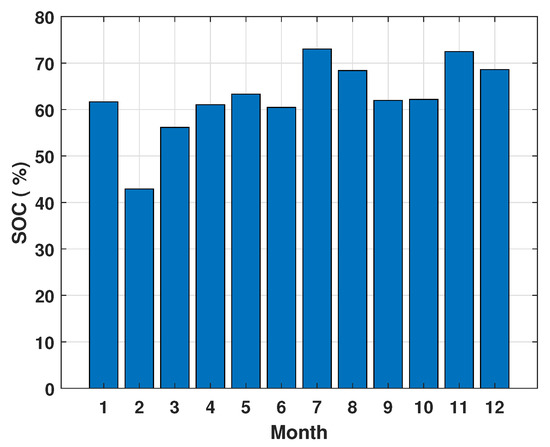
Figure 24.
Monthly SOC battery.
Figure 25 depicts the predicted PV power, and Figure 26 presents the predicted battery SOC. We employed the well-known LSTM neural network forecasting; with our approach, we can forecast 24 h from four previous consecutive days of data.
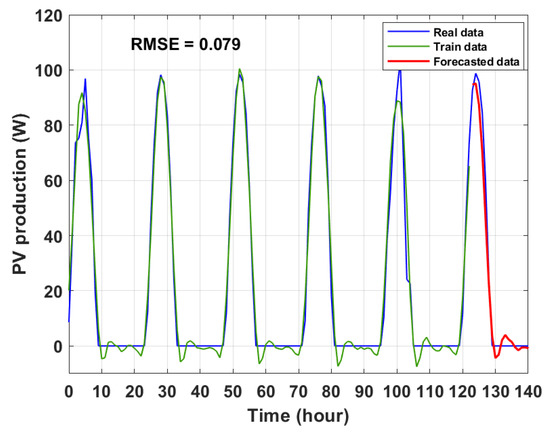
Figure 25.
Hourly PV panel power forecasting.
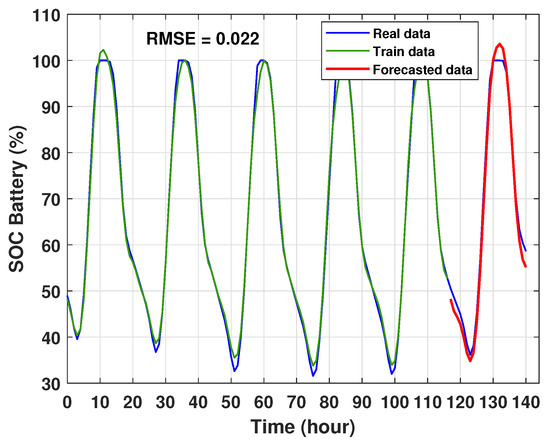
Figure 26.
Hourly SOC battery forecasting.
As clearly observed, the predicted values of PV production or the battery SOC are very similar to the corresponding actual values, which prove the effectiveness of the proposed algorithm. A more overall view of the PV production over 25 days in the future is represented in Figure 27 and the zoomed version of this prediction is illustrated in Figure 28. Figure 29 show also the SOC forecasted values for the next 25 days and the zoomed version of this forecast is shown in Figure 30.
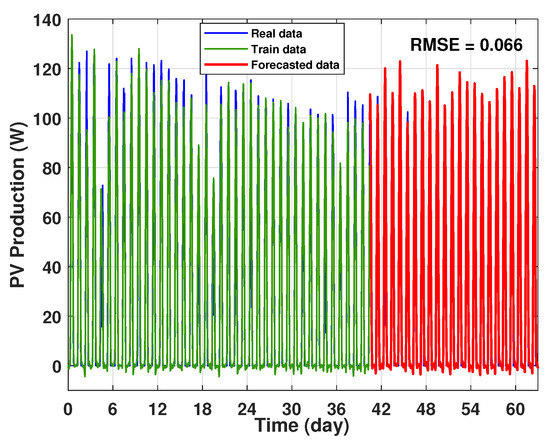
Figure 27.
PV panel power forecasting over 25 days.
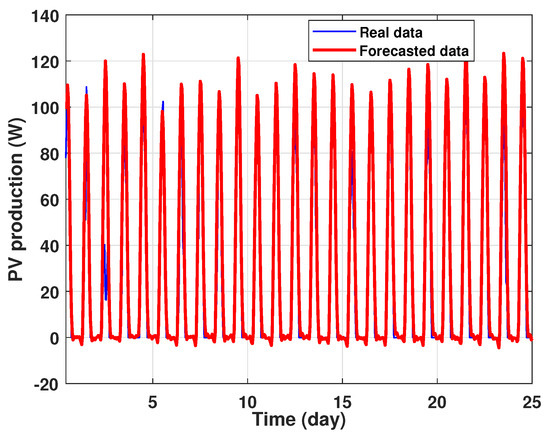
Figure 28.
Zoom version of the PV panel power forecasting over 25 days.
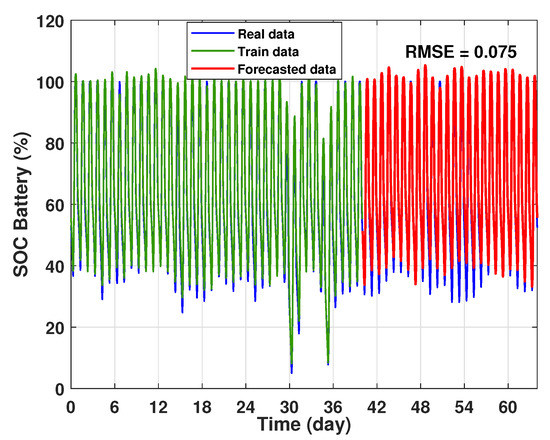
Figure 29.
Battery SOC forecasting results over 25 days.
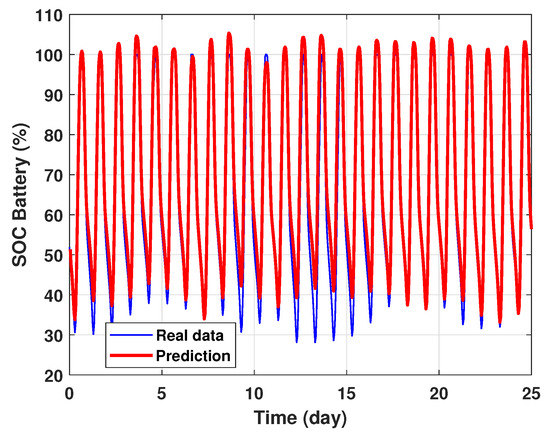
Figure 30.
Zoom version of the battery SOC forecasting results over 25 days.
The efficacy of the proposed predictive algorithm will be evaluated in terms of the root mean square error (RMSE) and the mean absolute error (MAE) [36]. Table 3 gives the performance criteria RMSE and MAE of the PV power production and the SOC battery forecasting.
Table 3.
Performance criteria of the prediction.
8. Discussion
In this project, we worked on two main axes: development with validation of an EMS in real time and forecasting of power production using the ANN algorithm. As a conclusion from experimental results shown in Figure 11, Figure 12, Figure 13, Figure 14, Figure 15, Figure 16, Figure 17, Figure 18, Figure 19 and Figure 20, all system components were successfully controlled, which proves the effectiveness of the proposed energy management and supervision system. On the other hand, for the forecasting algorithm, we can deduce that the LSTM architecture gives very satisfactory results and the prediction outcomes are precise and reliable. Indeed, the evaluation metrics RMSE and MAE for the proposed LSTM model were substantially smaller. Table 3 summarizes the achieved numerical performance and precision of our algorithm.
Thus, based on the reviews and obtained results in this study, the following recommendations are summarized:
- In the future, optimal sizing and energy management strategies should be thoroughly researched based on artificial intelligence and validated experimentally in order to obtain optimal results and be able to meet the load requirement while guaranteeing the stability of the whole power system.
- With the continuous development of renewable energies, power forecasting will continue to play a significant part in energy management systems. To better predict produced power from large-scale PV and wind farms, more advanced and cost-effective prediction systems must be developed. New hybrid approaches, such as integrating numerical simulations and neural networks, as well as more sophisticated combinations, such as ensemble learning techniques, are explicitly encouraged.
- The advancement of current computers and storage systems allows for the management of bigger databases. Meanwhile, the growing database size has created new obstacles in data pretreatment and error post-processing. Future research should concentrate on creating less computationally intensive approaches and reducing noise from raw data.
9. Conclusions
This paper presents the implementation of a lab-scale (standalone) hybrid power system featuring a wind turbine based on a PMSG generator coupled with a PV emulator through a DISO DC–DC boost converter, satisfying a DC load demand. The experimental test bench comprises the two emulated renewable power sources which are considered as primary sources, BESS, which is used to store the excess of power or supply the deficit power when primary sources cannot meet the load demand. When the storage device is fully charged, the surplus power can be dumped. This case was not investigated in this work because of limited resources of the experimental test bench (no availability of a dump load), but it can be added to the hybrid power system in future works. Many real tests will be carried out for validation besides the simulation results. Our goal is to implement the proposed system on a connected microgrid. The main objective of this work was to also control and manage the power flux according to the forecasted power availability of the system production and the predicted battery SOC. All experimental predictions have an RMSE ranging between and and an MAE ranging between and , which demonstrates the efficiency of the proposed technique. It presents a key challenge for energy management in smart grids. In fact, it will allow improving the electrical system based on previous data and the constantly updated forecasts (weather, habits of inhabitants, SOC, etc.). This sophisticated technology can assist in making automatic decisions such as load shedding, connecting, or disconnecting batteries.
Author Contributions
Conceptualization, L.C.-A. and S.M.; methodology, S.M., S.D. and L.C.-A.; software, S.M.; validation, S.M. and S.D.; formal analysis, N.D. and L.C.-A.; investigation, S.M. and S.D.; resources, L.C.-A.; data curation, N.D.; writing—original draft preparation, S.M.; writing—review and editing, L.C.-A. and N.D.; visualization, S.M.; supervision, L.C.-A. and N.D.; project administration, L.C.-A., N.D. and S.D.; funding acquisition, L.C.-A. All authors have read and agreed to the published version of the manuscript.
Funding
This research received no external funding.
Institutional Review Board Statement
Not applicable.
Informed Consent Statement
Not applicable.
Conflicts of Interest
The authors declare no conflict of interest.
Abbreviations
The following abbreviations are used in this manuscript:
| HRES | Hybrid Renewable Energy System |
| PV | Photovoltaic |
| WT | Wind Turbine |
| PMSG | Permanent Magnetic Synchronous Generator |
| BESS | Battery Energy Storage System |
| DC | Direct current |
| DISO | Double-Input Single-Output |
| MPPT | Maximum Power Point Tracking |
| SOC | State Of Charge |
| LSTM | Long Short-Term Memory |
| ESS | Energy Storage System |
| EMS | Energy Management Strategy |
| AI | Artificial Intelligence |
| WECS | Wind Energy Conversion System |
| TSR | Tip Speed Ratio |
| IGBT | Insulated-Gate Bipolar Transistor |
| PWM | Pulse Width Modulation |
| P&O | Perturb and Observe |
| IC | Incremental Conductance |
| HC | Hill Climbing |
| MPV | Maximum Power Voltage |
| FL | Fuzzy Logic |
| PI | Proportional–Integral |
| ANN | Artificial Neural Network |
| SMA | Simple Moving Average |
| RMSE | Root Mean Square Error |
| MAE | Mean Absolute Error |
References
- Pau, G.; Collotta, M.; Ruano, A.; Qin, J. Smart home energy management. Energies 2017, 10, 382. [Google Scholar] [CrossRef]
- Fotis, G.; Dikeakos, C.; Zafeiropoulos, E.; Pappas, S.; Vita, V. Scalability and replicability for smart grid innovation projects and the improvement of renewable energy sources exploitation: The FLEXITRANSTORE case. Energies 2022, 15, 4519. [Google Scholar] [CrossRef]
- Malik, P.; Awasthi, M.; Sinha, S. Biomass-based gaseous fuel for hybrid renewable energy systems: An overview and future research opportunities. IJER 2021, 45, 3464–3494. [Google Scholar] [CrossRef]
- Ma, Y.; Li, B. Hybridized intelligent home renewable energy management system for smart grids. Sustainability 2020, 12, 2117. [Google Scholar] [CrossRef]
- Al-Falahi, M.D.; Jayasinghe, S.D.G.; Enshaei, H.J.E.C. A review on recent size optimization methodologies for standalone solar and wind hybrid renewable energy system. Energy Convers. Manag. 2017, 143, 252–274. [Google Scholar] [CrossRef]
- Dawoud, S.M.; Lin, X.; Okba, M.I. Hybrid renewable microgrid optimization techniques: A review. Renew. Sustain. Energy Rev. 2018, 82, 2039–2052. [Google Scholar] [CrossRef]
- Adewumi, O.B.; Fotis, G.; Vita, V.; Nankoo, D.; Ekonomou, L. The impact of distributed energy storage on distribution and transmission networks’ power quality. Appl. Sci. 2022, 12, 6466. [Google Scholar] [CrossRef]
- Shahrabi, E.; Hakimi, S.M.; Hasankhani, A.; Derakhshan, G.; Abdi, B. Developing optimal energy management of energy hub in the presence of stochastic renewable energy resources. Sustain. Energy Grids Netw. 2021, 26, 100428. [Google Scholar] [CrossRef]
- Ali, S.; Zheng, Z.; Aillerie, M.; Sawicki, J.P.; Péra, M.C.; Hissel, D. A review of DC microgrid energy management systems dedicated to residential applications. Energies 2021, 14, 4308. [Google Scholar] [CrossRef]
- Querini, P.L.; Chiotti, O.; Fernádez, E. Cooperative energy management system for networked microgrids. Sustain. Energy Grids Netw. 2020, 23, 100371. [Google Scholar] [CrossRef]
- Alam, M.S.; Arefifar, S.A. Energy management in power distribution systems: Review, classification, limitations and challenges. IEEE Access 2019, 7, 92979–93001. [Google Scholar] [CrossRef]
- Iris, Ç.; Lam, J.S.L. A review of energy efficiency in ports: Operational strategies, technologies and energy management systems. Renew. Sustain. Energy Rev. 2019, 112, 170–182. [Google Scholar] [CrossRef]
- Leonori, S.; Martino, A.; Mascioli, F.M.F.; Rizzi, A. Microgrid energy management systems design by computational intelligence techniques. Appl. Energy 2020, 277, 115524. [Google Scholar] [CrossRef]
- Shabani, M.; Mahmoudimehr, J. Techno-economic role of PV tracking technology in a hybrid PV-hydroelectric standalone power system. Appl. Energy 2018, 212, 84–108. [Google Scholar] [CrossRef]
- Hossain, M.S.; Rahman, M.F. Hybrid solar PV/Biomass powered energy efficient remote cellular base stations. IJRER 2020, 10, 329–342. [Google Scholar]
- Ranjbar, M.R.; Mohammadian, M. Economic analysis of hybrid system consists of fuel cell and wind based CHP system for supplying grid-parallel residential load. Energy Build. 2014, 68, 476–487. [Google Scholar] [CrossRef]
- Islam, M.S.; Akhter, R.; Rahman, M.A. A thorough investigation on hybrid application of biomass gasifier and PV resources to meet energy needs for a northern rural off-grid region of Bangladesh: A potential solution to replicate in rural off-grid areas or not? Energy 2018, 145, 338–355. [Google Scholar] [CrossRef]
- Tajeddin, A.; Roohi, E. Designing a reliable wind farm through hybridization with biomass energy. Appl. Therm. Eng. 2019, 154, 171–179. [Google Scholar] [CrossRef]
- Li, J.; Liu, P.; Li, Z. Optimal design and techno-economic analysis of a solar-wind-biomass off-grid hybrid power system for remote rural electrification: A case study of west China. Energy 2020, 208, 118387. [Google Scholar] [CrossRef]
- Sultan, H.M.; Diab, A.A.Z.; Oleg, N.K.; Irina, S.Z. Design and evaluation of PV-wind hybrid system with hydroelectric pumped storage on the National Power System of Egypt. Glob. Energy Interconnect. 2018, 1, 301–311. [Google Scholar]
- Sabishchenko, O.; Rębilas, R.; Sczygiol, N.; Urbański, M. Ukraine energy sector management using hybrid renewable energy systems. Energie 2020, 13, 1776. [Google Scholar] [CrossRef]
- Mocanu, E.; Nguyen, P.H.; Gibescu, M.; Kling, W.L. Deep learning for estimating building energy consumption. Sustain. Energy Grids Netw. 2016, 6, 91–99. [Google Scholar] [CrossRef]
- Fathabadi, H. Novel high-efficient large-scale stand-alone solar/wind hybrid power source equipped with battery bank used as storage device. J. Energy Storage 2018, 17, 485–495. [Google Scholar] [CrossRef]
- Kumar, P.S.; Chandrasena, R.P.S.; Ramu, V.; Srinivas, G.N.; Babu, K.V.S.M. Energy management system for small scale hybrid wind solar battery based microgrid. IEEE Access 2020, 8, 8336–8345. [Google Scholar] [CrossRef]
- Shan, Y.; Hu, J.; Chan, K.W.; Fu, Q.; Guerrero, J.M. Model predictive control of bidirectional DC-DC converters and AC/DC interlinking converters-A new control method for PV-wind-battery microgrids. IEEE Trans. Sustain. Energy 2018, 10, 1823–1833. [Google Scholar] [CrossRef]
- Zakir, M.; Arshad, A.; Sher, H.A.; Lehtonen, M. An Optimal Power Management System Based on Load Demand and Resources Availability for PV Fed DC-Microgrid with Power-Sharing among Multiple Nanogrids. In Proceedings of the IEEE PES Innovative Smart Grid Technologies Europe (ISGT Europe), Espoo, Finland, 18–21 October 2021; pp. 1–5. [Google Scholar]
- Sibtain, D.; Murtaza, A.F.; Ahmed, N.; Sher, H.A.; Gulzar, M.M. Multi control adaptive fractional order PID control approach for PV/wind connected grid system. Int. Trans. Electr. Energy Syst. 2021, 31, e12809. [Google Scholar] [CrossRef]
- Kumar, N.M.; Chopra, S.S.; Chand, A.A.; Elavarasan, R.M.; Shafiullah, G.M. Hybrid renewable energy microgrid for a residential community: A techno-economic and environmental perspective in the context of the SDG7. Sustainability 2020, 12, 3944. [Google Scholar] [CrossRef]
- Koohi, S.; Rahim, N.A.; Mokhlis, H.; Tyagi, V.V. Photovoltaic electricity generator dynamic modeling methods for smart grid applications: A review. Renew. Sustain. Energy Rev. 2016, 57, 131–172. [Google Scholar] [CrossRef]
- Bjaoui, M.; Khiari, B.; Benadli, R.; Memni, M.; Sellami, A. Practical implementation of the backstepping sliding mode controller MPPT for a PV-storage application. Energies 2019, 12, 3539. [Google Scholar] [CrossRef]
- Lee, S.W.; Chun, K.H. Adaptive sliding mode control for PMSG wind turbine systems. Energies 2019, 12, 595. [Google Scholar] [CrossRef]
- Anbarasan, P.; Venmathi, M.; Krishnakumar, V. Modeling and Simulation of Standalone PMSG based Wind Energy Conversion System with Common Mode Voltage Suppression. In Proceedings of the 7th International Conference on Electrical Energy Systems (ICEES), Chennai, India, 11–13 February 2012; pp. 85–88. [Google Scholar]
- Mahjoub, S.; Chrifi-Alaoui, L.; Delahoche, L.; Marhic, B.; Derbel, N. Global Fuzzy Supervisor Control For a Dual Input-Single Output Boost Converter. In Proceedings of the 9th International Renewable and Sustainable Energy Conference (IRSEC), Morocco, 23–27 November 2021; pp. 1–6. [Google Scholar]
- Yang, B.; Wang, J.; Cao, P.; Zhu, T.; Shu, H.; Chen, J.; Zhang, J.; Zhu, J. Classification, summarization and perspectives on state-of-charge estimation of lithium-ion batteries used in electric vehicles: A critical comprehensive survey. J. Energy Storage 2021, 39, 102572. [Google Scholar] [CrossRef]
- Villegas, C.G.; Rodriguez-Resendiz, J.; Álvarez-Alvarado, J.M.; Rodriguez-Resendiz, H.; Herrera-Navarro, A.M.; Rodríguez-Abreo, O. Artificial neural networks in MPPT algorithms for optimization of photovoltaic power systems: A review. Micromachines 2021, 12, 1260. [Google Scholar] [CrossRef] [PubMed]
- Mahjoub, S.; Chrifi-Alaoui, L.; Marhic, B.; Delahoche, L. Predicting Energy Consumption Using LSTM, Multi-Layer GRU and Drop-GRU Neural Networks. Sensors 2022, 22, 4062. [Google Scholar] [CrossRef]
- Kamp, M.; Koprinska, I.; Bibal, A.; Bouadi, T.; Frénay, B.; Galárraga, L.; Oramas, J.; Adilova, L.; Krishnamurthy, Y.; Kang, B.; et al. (Eds.) Machine Learning and Principles and Practice of Knowledge Discovery in Databases: International Workshops of ECML PKDD, Virtual Event, 13–17 September 2021; Part II; Springer: Cham, Switzerland, 2021. [Google Scholar]
- Kim, K.; Kim, D.K.; Noh, J.; Kim, M. Stable forecasting of environmental time series via long short term memory recurrent neural network. IEEE Access 2018, 6, 75216–75228. [Google Scholar] [CrossRef]
- Alnejaili, T.; Labdai, S.; Chrifi-Alaoui, L. Predictive management algorithm for controlling pv-battery off-grid energy system. Sensors 2021, 21, 6427. [Google Scholar] [CrossRef] [PubMed]
- Bento, P.; Pombo, J.; Mariano, S.; do Rosário Calado, M. Short-term load forecasting using optimized LSTM networks via improved bat algorithm. In Proceedings of the International Conference on Intelligent Systems (IS), Funchal, Portugal, 25–27 September 2018; pp. 351–357. [Google Scholar]
- Mahjoub, S.; Chrifi-Alaoui, L.; Marhic, B.; Delahoche, L.; Masson, J.B.; Derbel, N. Prediction of energy consumption based on LSTM Artificial Neural Network. In Proceedings of the 19th International Multi-Conference on Systems, Signals & Devices (SSD), Setif, Algeria, 6–10 May 2022; pp. 521–526. [Google Scholar]
Disclaimer/Publisher’s Note: The statements, opinions and data contained in all publications are solely those of the individual author(s) and contributor(s) and not of MDPI and/or the editor(s). MDPI and/or the editor(s) disclaim responsibility for any injury to people or property resulting from any ideas, methods, instructions or products referred to in the content. |
© 2023 by the authors. Licensee MDPI, Basel, Switzerland. This article is an open access article distributed under the terms and conditions of the Creative Commons Attribution (CC BY) license (https://creativecommons.org/licenses/by/4.0/).