Article

Development of Cellulose-Reinforced Polyurethane Coatings: A Novel Eco-Friendly Approach for Wind Turbine Blade Protection

by
Shrirang M. Pathak
1,
V. Praveen Kumar
1,
Venkataramana Bonu
1,
Leon Mishnaevsky, Jr.
2,
R. V. Lakshmi
1,*,
Parthasarathi Bera
1,* and
Harish C. Barshilia
1
1
Surface Engineering Division, CSIR–National Aerospace Laboratories, Bengaluru 560017, India
2
Department of Wind Energy, Technical University of Denmark, 4000 Roskilde, Denmark
*
Authors to whom correspondence should be addressed.
Energies 2023, 16(4), 1730; https://doi.org/10.3390/en16041730
Submission received: 29 December 2022 / Revised: 21 January 2023 / Accepted: 3 February 2023 / Published: 9 February 2023

Abstract

:
Wind energy is considered a clean energy source and is predicted to be one of the primary sources of electricity. However, leading-edge erosion of wind turbine blades due to impacts from rain drops, solid particles, hailstones, bird fouling, ice, etc., is a major concern for the wind energy sector that reduces annual energy production. Therefore, leading-edge protection of turbine blades has been an important topic of research and development in the last 20 years. Further, there are critical issues related to the amount of waste produced, including glass fiber, carbon fiber, and various harmful volatile organic compounds in turbine fabrication and their end-of-life phases. Hence, it is vital to use eco-friendly, solvent-free materials and to extend blade life to make wind energy a perfect clean energy source. In this study, cellulose microparticles (CMP) and cellulose microfibers (CMF) have been used as fillers to reinforce water-based polyurethane (PU) coatings developed on glass fiber reinforced polymer (GFRP) substrates by a simple spray method for the first time. Field emission scanning electron microscopy images show the agglomerated particles of CMP and fiber-like morphology of CMF. Fourier transform infrared spectra of CMP, CMF, and related coatings exhibit associated C–H, C=O, and N–H absorption bands of cellulose and polyurethane. Thermal gravimetric analysis shows that CMP is stable up to 285 °C, whereas CMF degradation is observed at 243 °C. X-ray photoelectron spectroscopy of C 1s and O 1s core levels of CMP, CMF and related coatings show C–C/C–H, C–O, C–OH, and O–C=O bonds associated with cellulose structure. The solid particle erosion resistance properties of the coatings have been evaluated with different concentrations of CMP and CMF at impact angles of 30° and 90°, and all of the coatings are observed to outperform the PU and bare GFRP substrates. Three-dimensional (3D) profiles of erosion scans confirm the shape of erosion scars, and 2D profiles have been used to calculate volume loss due to erosion. CMP-reinforced PU coating with 5 wt.% filler concentration and CMF-reinforced PU coating with 2 wt.% concentration are found to be the best-performing coatings against solid particle erosion. Nanoindentation studies have been performed to establish a relation between H3/E2 and the average erosion rate of the coatings.

1. Introduction

Wind energy is one of the most promising clean energy sources for mitigating future global warming caused by the combustion of fossil fuels. Today, wind energy represents 5% of electricity generated globally, with an installed capacity of more than 800 GW in 2021, making it the second largest renewable energy source [1,2]. The leading and third-ranked renewable energy sources are hydro energy (1332 GW) and solar energy (714 GW) [2]. It is expected that by 2050, the share of wind energy in global electricity generation will increase to 30%, which will help to achieve the carbon neutrality target set in the Paris Agreement [1]. However, in recent years, environmental concerns have been expressed regarding the massive amounts of waste that will be generated when these wind turbine blades are decommissioned over the next few decades. Despite being mostly pollution-clean when in use, wind turbines produce pollutants and use a large amount of energy during their production and end-of-life phases [3,4,5,6,7]. It is expected that 225,000 tons of waste blade material will be generated per year by 2050 [8]. In this regard, it is to be noted that there are several ways to make wind energy an exceptionally green and renewable energy source. At present, the wind turbine blades are composed of thermosetting resin matrix composite reinforced with glass fiber (GF), carbon fiber (CF), or glass-carbon fiber hybrid. One route is to recycle and reuse composite waste materials from wind turbine blades [9,10]. However, both GF- and CF-reinforced thermoset composites are difficult to recycle and have a high cost of recycling. Therefore, it is imperative to employ alternative recyclable and environment-friendly materials for wind turbine blades. In the contemporary scenario, the available recyclable materials include thermoplastic composites, modified thermoset composites, and natural fiber composites such as sisal, flax, hemp, jute, and so on. [10,11]. In addition to solid waste, the emission of volatile organic compounds (VOCs) from paints and resins used in wind turbine blade production and associated erosion resistant coatings play a significant role. Their manufacturing involves the use of synthetic raw materials derived from other manufacturing processes that rely on the combustion of fossil fuels [12]. VOCs are produced during the curing or drying phases of coatings owing to solvent evaporation. Solvents are frequently considered environmentally harmful compounds that have varying effects on humans, animals, and plants. VOCs are key precursors of tropospheric ozone and secondary aerosol formation, both of which endanger human health and have an impact on the environment and climate change [13]. When VOCs enter the atmosphere, they react with other chemicals in the environment, such as nitrogen oxides in the air, which engage in atmospheric photochemical reactions [14]. Further, the use of biodegradable and eco-friendly materials as fillers for the development of wind turbine blade protective coatings is also important as far as the environment is concerned. As a result, to make wind energy a perfect clean energy source, it is critical to use eco-friendly, solvent-free materials, and prolong blade life.
Most wind turbine blades are meant to last 20 years, but they undergo surface erosion during their service lives due to a variety of harsh environmental variables, such as ultraviolet (UV) exposure and impacts caused by raindrops, solid particles (sand, dust, fly ash, and volcanic ash), hailstones, lightning strike, insect fouling, and so on. Surface erosion evolves through the following steps: superficial roughness, pit formation, increase in pit density, cracks, and finally delamination. Wind turbine blade erosion is a critical challenge in tropical countries such as India because of the wide range of geographical and climatic conditions. Monsoon and dusty weather increase the severity of rain and solid particle erosion of wind turbine blades. Consequently, the maintenance and monitoring of the structural health of blades is critical in the wind energy industry. Surface erosion mainly appears at the leading edge due to the higher blade speed at the outer part of the blades. Due to the high tip speed of huge wind turbine blade, which can reach 100 m s−1, impacts of even small objects can cause significant erosive damage. Leading-edge erosion (LEE) of a wind turbine blade by repetitive impacts of rain droplets, which is rain erosion, and solid particles in the form of sand, dust, and hailstones, which is solid particle erosion, is a severe problem. Rain erosion is also influenced by solid particle erosion, which worsens its severity. According to Boopathi and co-workers, surface erosion is the second most common cause of LEE in India [15]. LEE contributes the most to surface erosion and the maintenance cost. LEE is the most prevalent and expensive type of wind turbine blade erosion. It is responsible for 2–25% of annual energy production (AEP) loss for wind turbines depending on severity of the erosion [16]. As a result, it is critical that the protective coating withstands severe solid particle impacts, particularly in tropical nations such as India.
The wind turbine industry has devised a multi-layered coating strategy to address the LEE issue. A putty layer is placed on the laminate to fill the holes and smooth the surface. Following this layer, a topcoat, which was the primary protective layer, is applied. Polyurethane (PU)-based coatings are commonly employed as topcoats because of their mechanical strength, long-term damping, elasticity, UV stability, chemical resistance, and low toxicity [17]. Fillers are employed as reinforcements in coatings to impart strength and wear resistance. Inorganic, organic, or metallic particles can be used as fillers. Micro-and nanosized particles are employed as fillers in the composite for reinforcement. Fiber insertion increases the mechanical properties, whereas filler particles increase the modulus [18]. A review of the literature finds few wind turbine blade coatings have been evaluated for solid particle erosion performance. Recently, Pathak and co-authors have studied the solid particle erosion performance of ceramic oxide-reinforced water-based PU coatings for wind turbine blades [19]. Al2O3, ZrO2, and CeO2 nanoparticles have been used as fillers. Studies have revealed that ceramic oxide-based coatings show 20 to 40% lower erosion rates compared to unmodified PU coating and 40 to 55% lower rates than glass fiber reinforced polymer (GFRP) substrates. Godfrey and colleagues have investigated the temperature influence on the solid particle erosion of commercial PU coatings used to protect wind turbine leading edges [20]. According to this study, the solid particle erosion rate is higher under cold circumstances (−30 °C) than under ambient conditions (25 °C). Cold erosion is observed to cause more abrasion of the PU layer than ambient erosion. The behaviour of single and multi-layer graphene-based coatings on GFRP substrates regarding solid particle erosion has been investigated by Alajmi and Ramulu [21]. A single layer of graphene coating (H-146) provides the best erosion resistance, improving material removal and maximum depth by up to 19% and 8%, respectively. At normal impact, a combination of a polyurethane layer on top of a graphene coating (IA-700) demonstrates the highest erosion-resistant behaviour, with enhancements up to 15%, while two layers of polyurethane offer material removal reductions up to 38%. Additionally, researchers have studied the solid particle erosion behaviour of composites reinforced with different natural fibers, such as jute, coir, bamboo, and sugarcane [22,23,24,25]. However, these composite materials are not used for wind turbine blade protection. In this regard, it is to be noted that cellulose-based materials have widespread applications in metal adsorption, antioxidants, biosensors, the separation of proteins, antibacterial activity, packaging, superhydrophobicity, the biomedical field, etc. [26,27]. Within this context, it would be worthwhile to investigate cellulose-based composite coatings to protect wind turbine blades against solid particle erosion, considering the environmental impact and mechanical properties of cellulose.
In the present study, cellulose microparticle (CMP) and cellulose microfiber (CMF)-reinforced water-based PU coatings have been developed for wind turbine blade protection. One of the key performance characteristics of water-based PU is its lower VOC content vs. its solvent-borne equivalent. Water-based PU resins have recently been developed to provide a diverse variety of aesthetic finishes with the ability to preserve appearance, colour, and gloss stability during weathering and mechanical wear over the long term [28]. Moreover, water-based PU coatings can be used on solvent-sensitive substrates. Aside from being environmentally friendly, it also provides additional benefits, such as reduced odour and the simple cleaning of applicator instruments. Water-based PU coatings with varying concentrations of CMP and CMF have been tested for solid particle erosion (SPE) resistance at impingement angles of 30° and 90°. The volume losses of the coatings have been compared to assess their performances.

2. Experimental Details

2.1. Materials

Cellulose microparticles was obtained from Nano Research Elements, Kurukshetra, India. Cellulose microfibers were procured from Jai Shakti Enterprises, Bhiwani, India. Water-based PU was used as a matrix for coating preparation and was procured from Asian Paints, Mumbai, India. GFRP sheets with a thickness of 2.5 mm were supplied by Advanced Composite Division of CSIR–NAL. They were used as substrates after being cut into coupons with dimensions of 2.4 cm × 2.4 cm. The filler layer was made of a polyester-based body filler putty purchased from Esdee Paints, Mumbai, India.

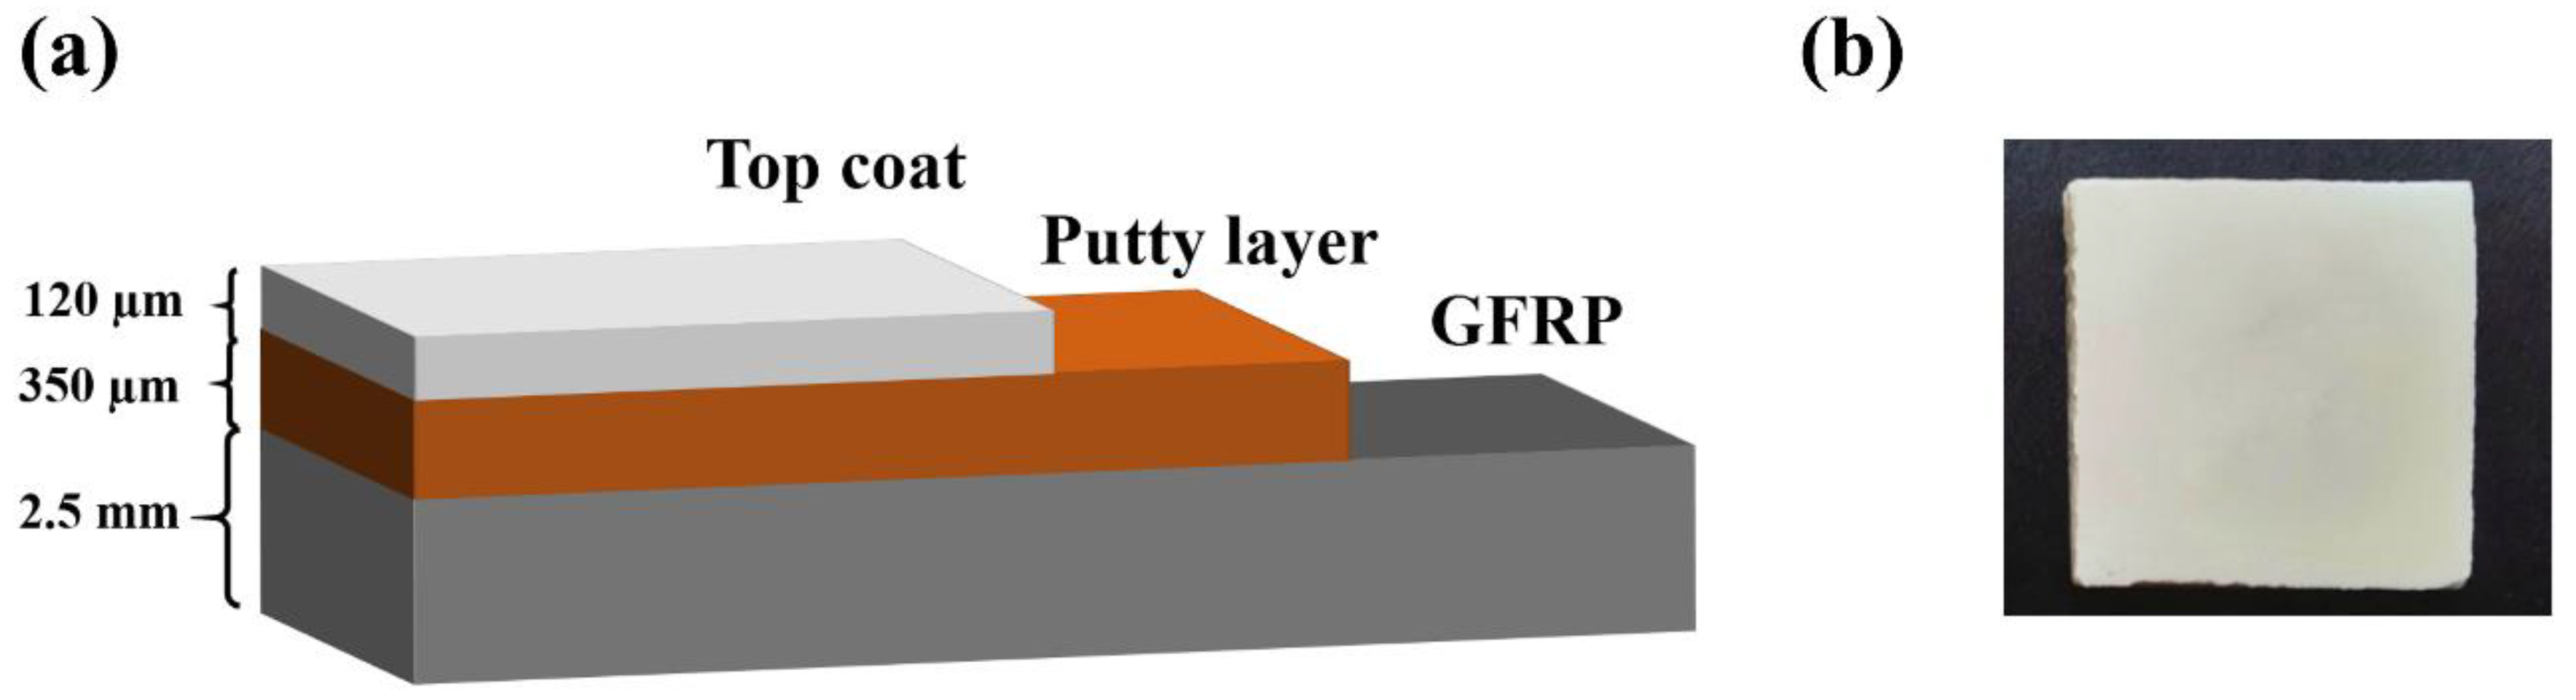
2.2. Development of Coatings

The GFRP substrates were cleaned using acetone and their thicknesses were measured with a digital micrometer screw gauge. The bilayer coating technique was adopted to develop PU-based composite coatings. The base layer was the body filler layer. Polyester-based body filler putty was used to reduce the pinholes and other surface irregularities present on the substrate. The body filler putty was applied using a putty blade in accordance with the instructions from the manufacturer. The surfaces were polished with 200 and 800 µm emery paper after 30 min of curing for better finishing. The average thickness of the body filler layer after emery was 350 µm. The top layer was a protective composite PU layer with CMP and CMF as reinforcing fillers. Figure 1a depicts a schematic representation of coating layers. CMP and CMF were mixed with water and stirred at 400 rpm for 2 h followed by addition to the water-based PU resin in three different weight ratios of resin to filler: 10:1, 10:0.5, and 10:0.2. A topcoat layer of cellulose-reinforced PU was sprayed with a Pilot Type-64 gun. The coated samples were cured for 24 h under ambient conditions. A digital micrometer screw gauge was used to measure the thicknesses of the coatings. The average thickness of the topcoat was 120 µm. Figure 1b represents a typical image of the as-prepared coating. The composite coatings developed with CMP and CMF are termed PUCMP and PUCMF, respectively.

2.3. Physico-Chemical Characterization

The morphologies of the CMP and CMF were characterized using a Carl Zeiss Supra VP 40 field emission scanning electron microscopy (FESEM) having a resolution of 1.2 nm. The drop-casting method was used to prepare FESEM samples. CMP and CMF were dispersed in ethanol and drop-cast onto a polished metallic substrate using a micropipette. The Fourier transform infrared (FTIR) spectra of CMP, CMF and related coatings were recorded using a PerkinElmer, Model Frontier IR spectrometer with a resolution of 4 cm−1 in the range of 4000–500 cm−1 using the attenuated total reflection (ATR) accessory. Thermal gravimetric analysis (TGA) profiles of CMP and CMF powders were recorded using a PerkinElmer Pyris 1 TGA to examine the thermal stability of the powders and coatings throughout a temperature range from room temperature to 600 °C at a heating rate of 10 °C min−1 in a N2 environment. For this examination, a small pellet of each sample was used. The measurement error was less than 0.02%. X-ray photoelectron spectroscopy (XPS) of cellulose microstructures and cellulose-reinforced PU coatings were recorded with a SPECS spectrometer (SPECS Surface Nano Analysis GmbH, Berlin, Germany) employing non-monochromatic AlKα radiation (1486.6 eV) as an X-ray source operated at 150 W (12 kV, 12.5 mA). The binding energies reported here were referenced with the C 1s peak at 284.6 eV. A pass energy of 70 eV with a step increment of 0.5 eV was used to record all the survey spectra and individual spectra were obtained with a pass energy of 40 eV and step increment of 0.05 eV.

2.4. Adhesion Test of Coatings

The Elcometer 107 crosshatch cut adhesion tester was used to assess the adhesion of coatings in accordance with ASTM D3359 standard. In order to create a grid of tiny squares for this test, cuts were made into the coated surface in two opposing directions perpendicular to one another. On the grid, a pressure-sensitive adhesive tape was used. The tape was swiftly peeled away from the specimen within two minutes of application by grasping the free end and pulling at an angle close to 180°. The grid was then inspected under a microscope to determine the amount of coating materials that had been removed. The percentage of coating lost from the grid of squares was used to determine the adhesion.

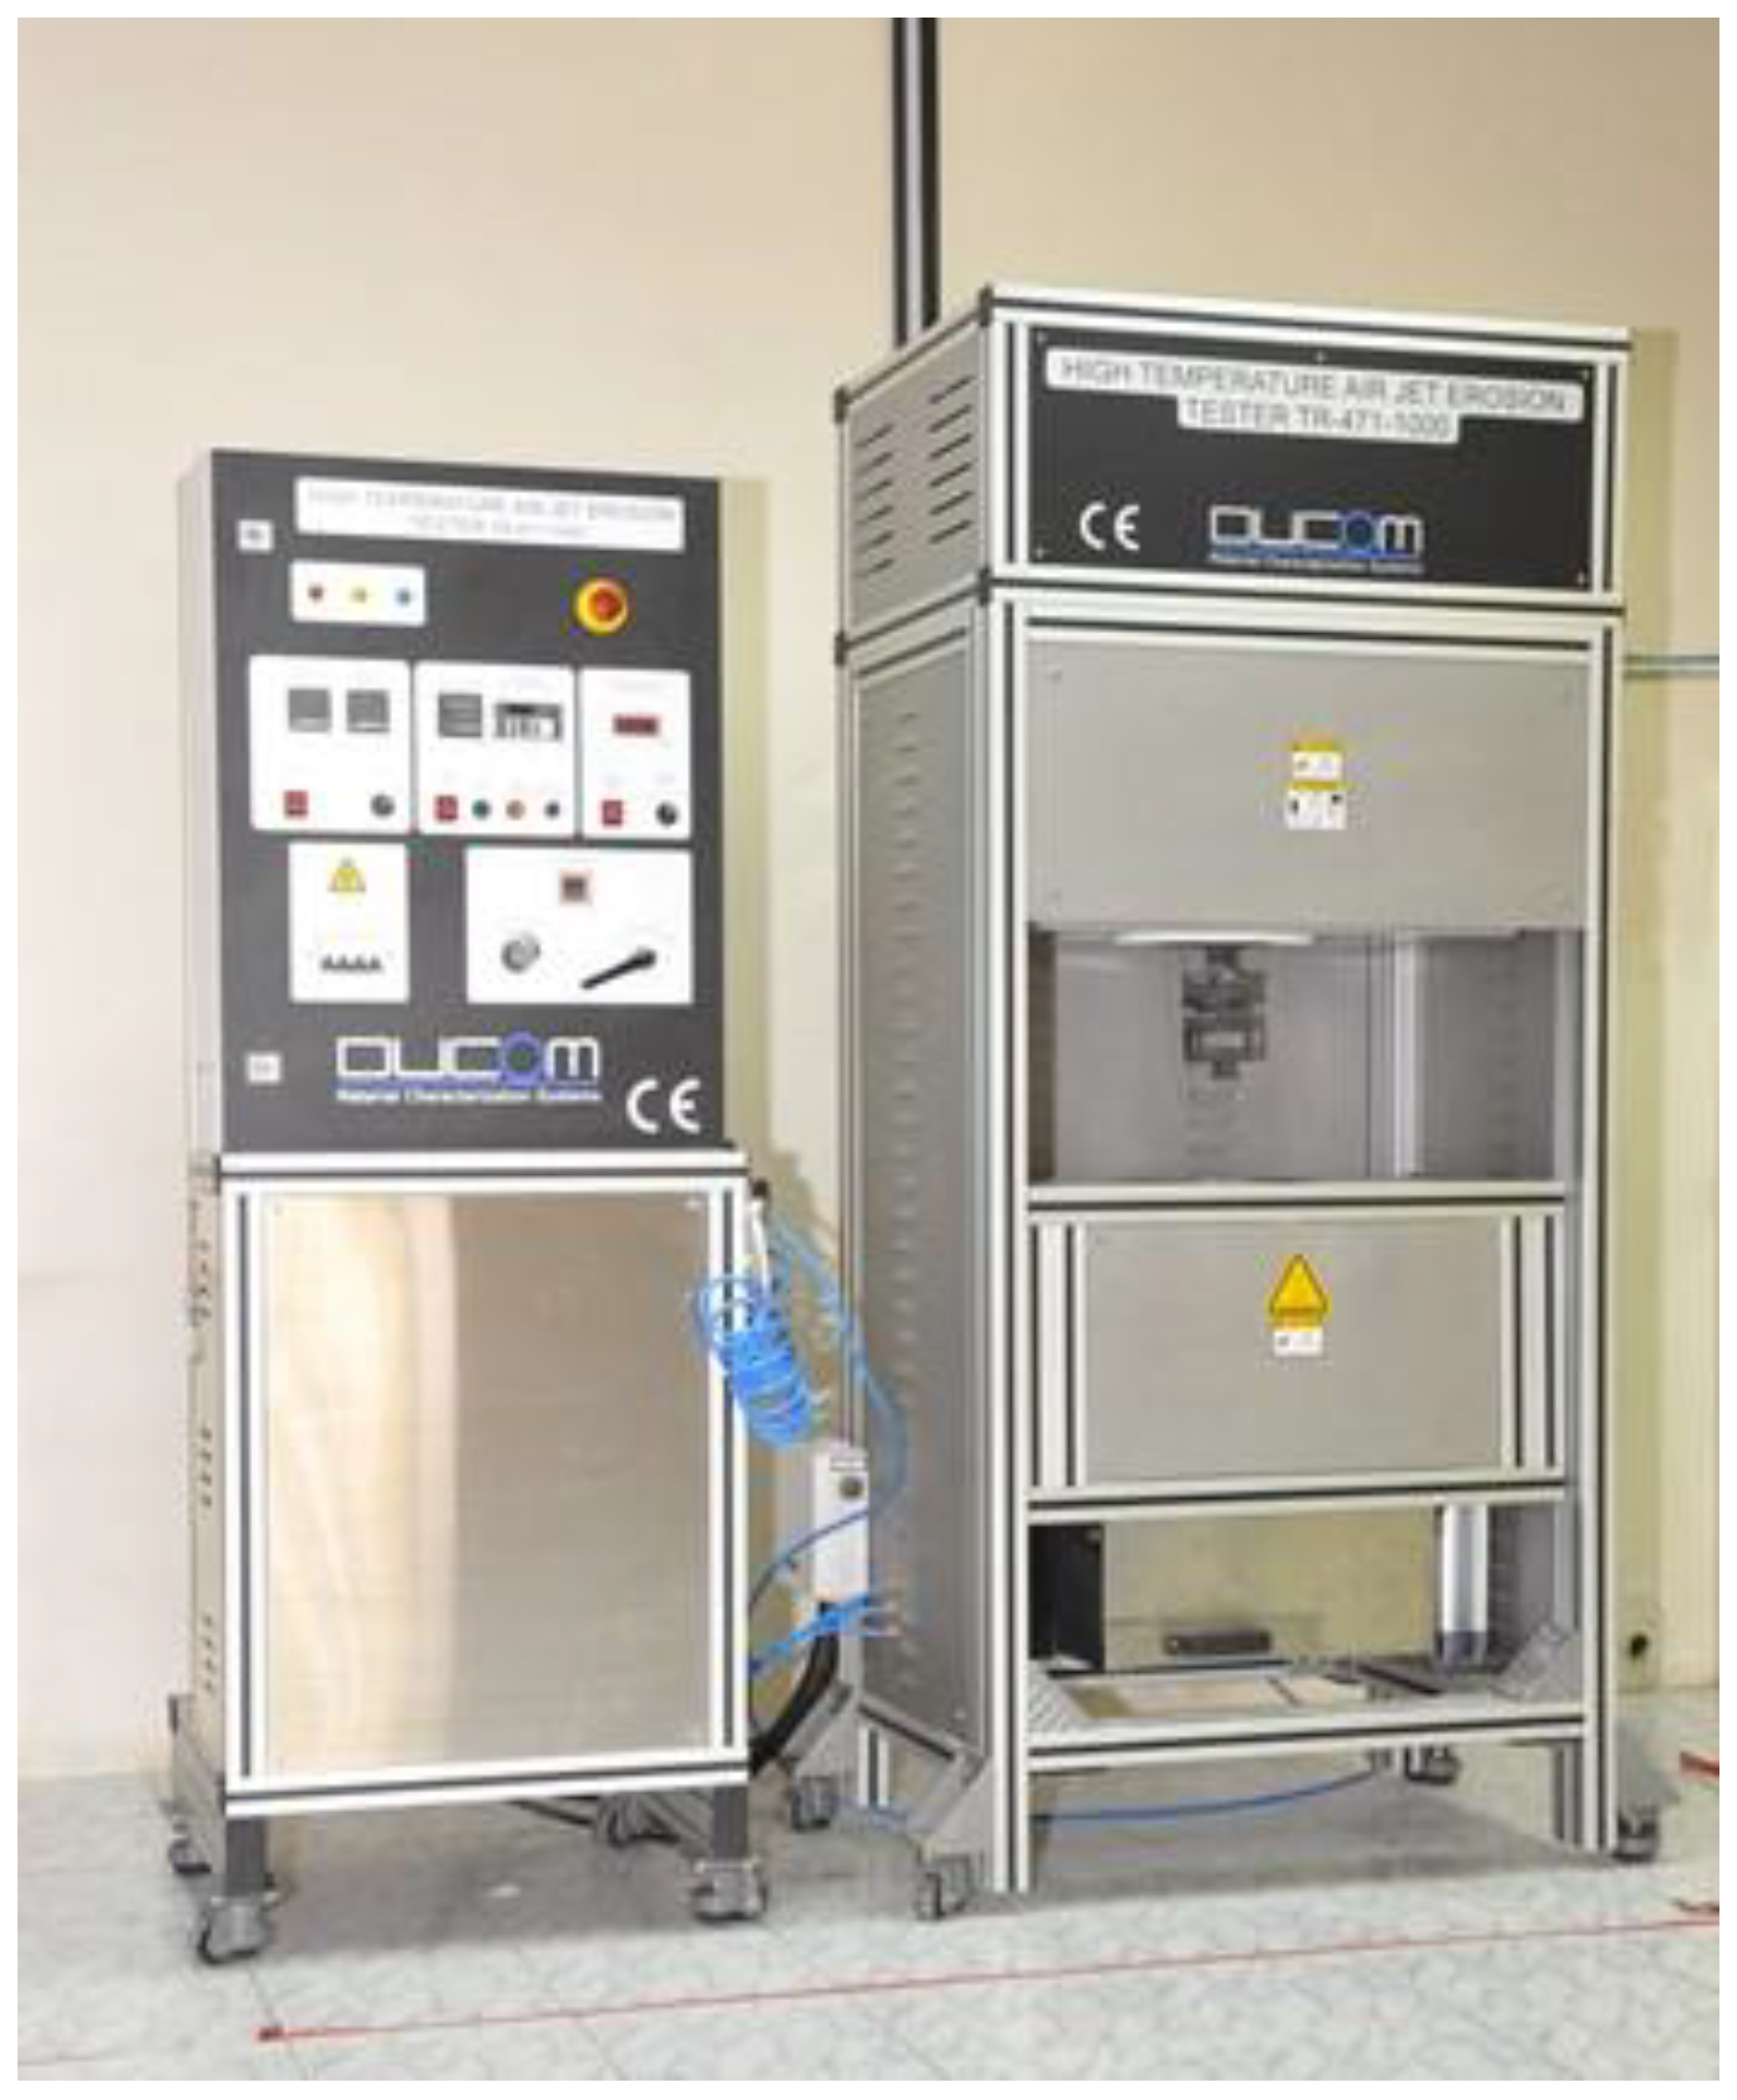
2.5. SPE Test of Coatings

A DUCOM air-jet erosion tester was used to assess the solid particle erosion performances of the coatings at ambient conditions. In this technique, erodent particles combined with compressed air were bombarded on a sample positioned at a certain angle. Widely used Al2O3 particles with a size of ~50 µm were used as the erodent. Coatings were tested for 3 min at impact angles of 30° and 90° with an erodent speed of 30 m s−1 and erodent rate of 2 g min−1. In the erosion tester system, the nozzle diameter, nozzle length, and nozzle to sample distance were 1.5, 50, and 10 mm, respectively. A photograph of the erosion tester used in the present study is shown in Figure 2.

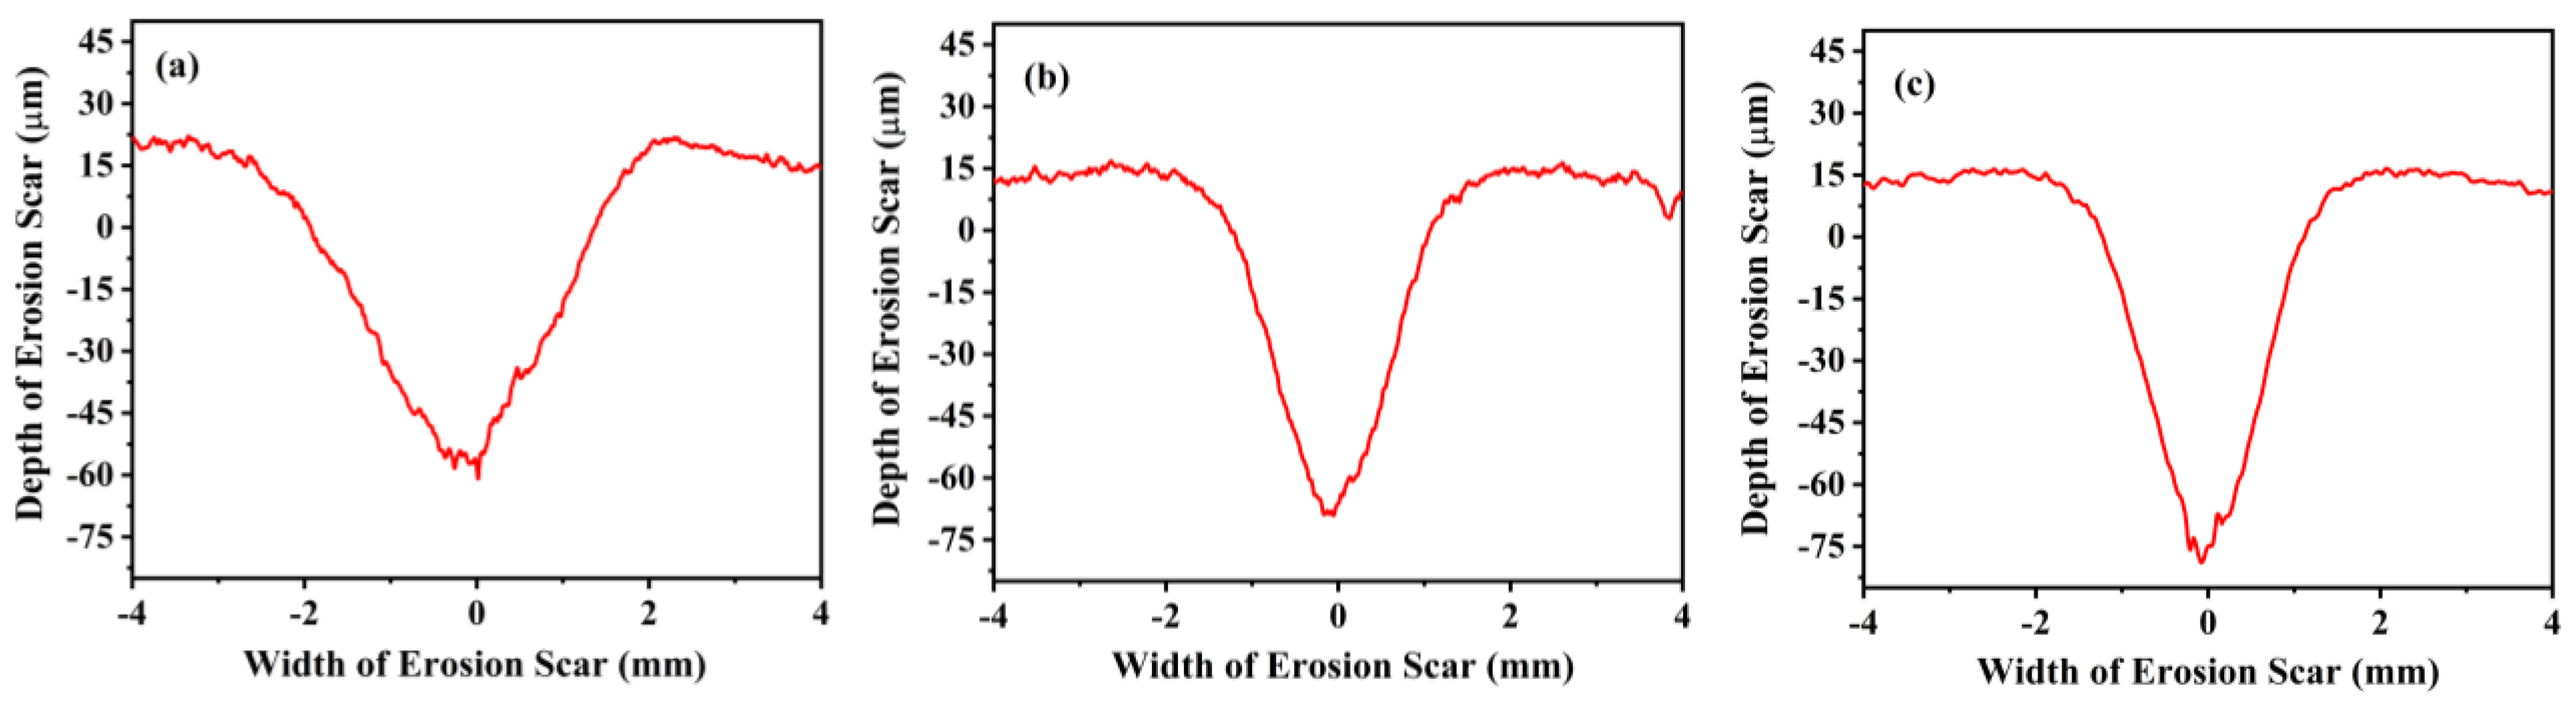
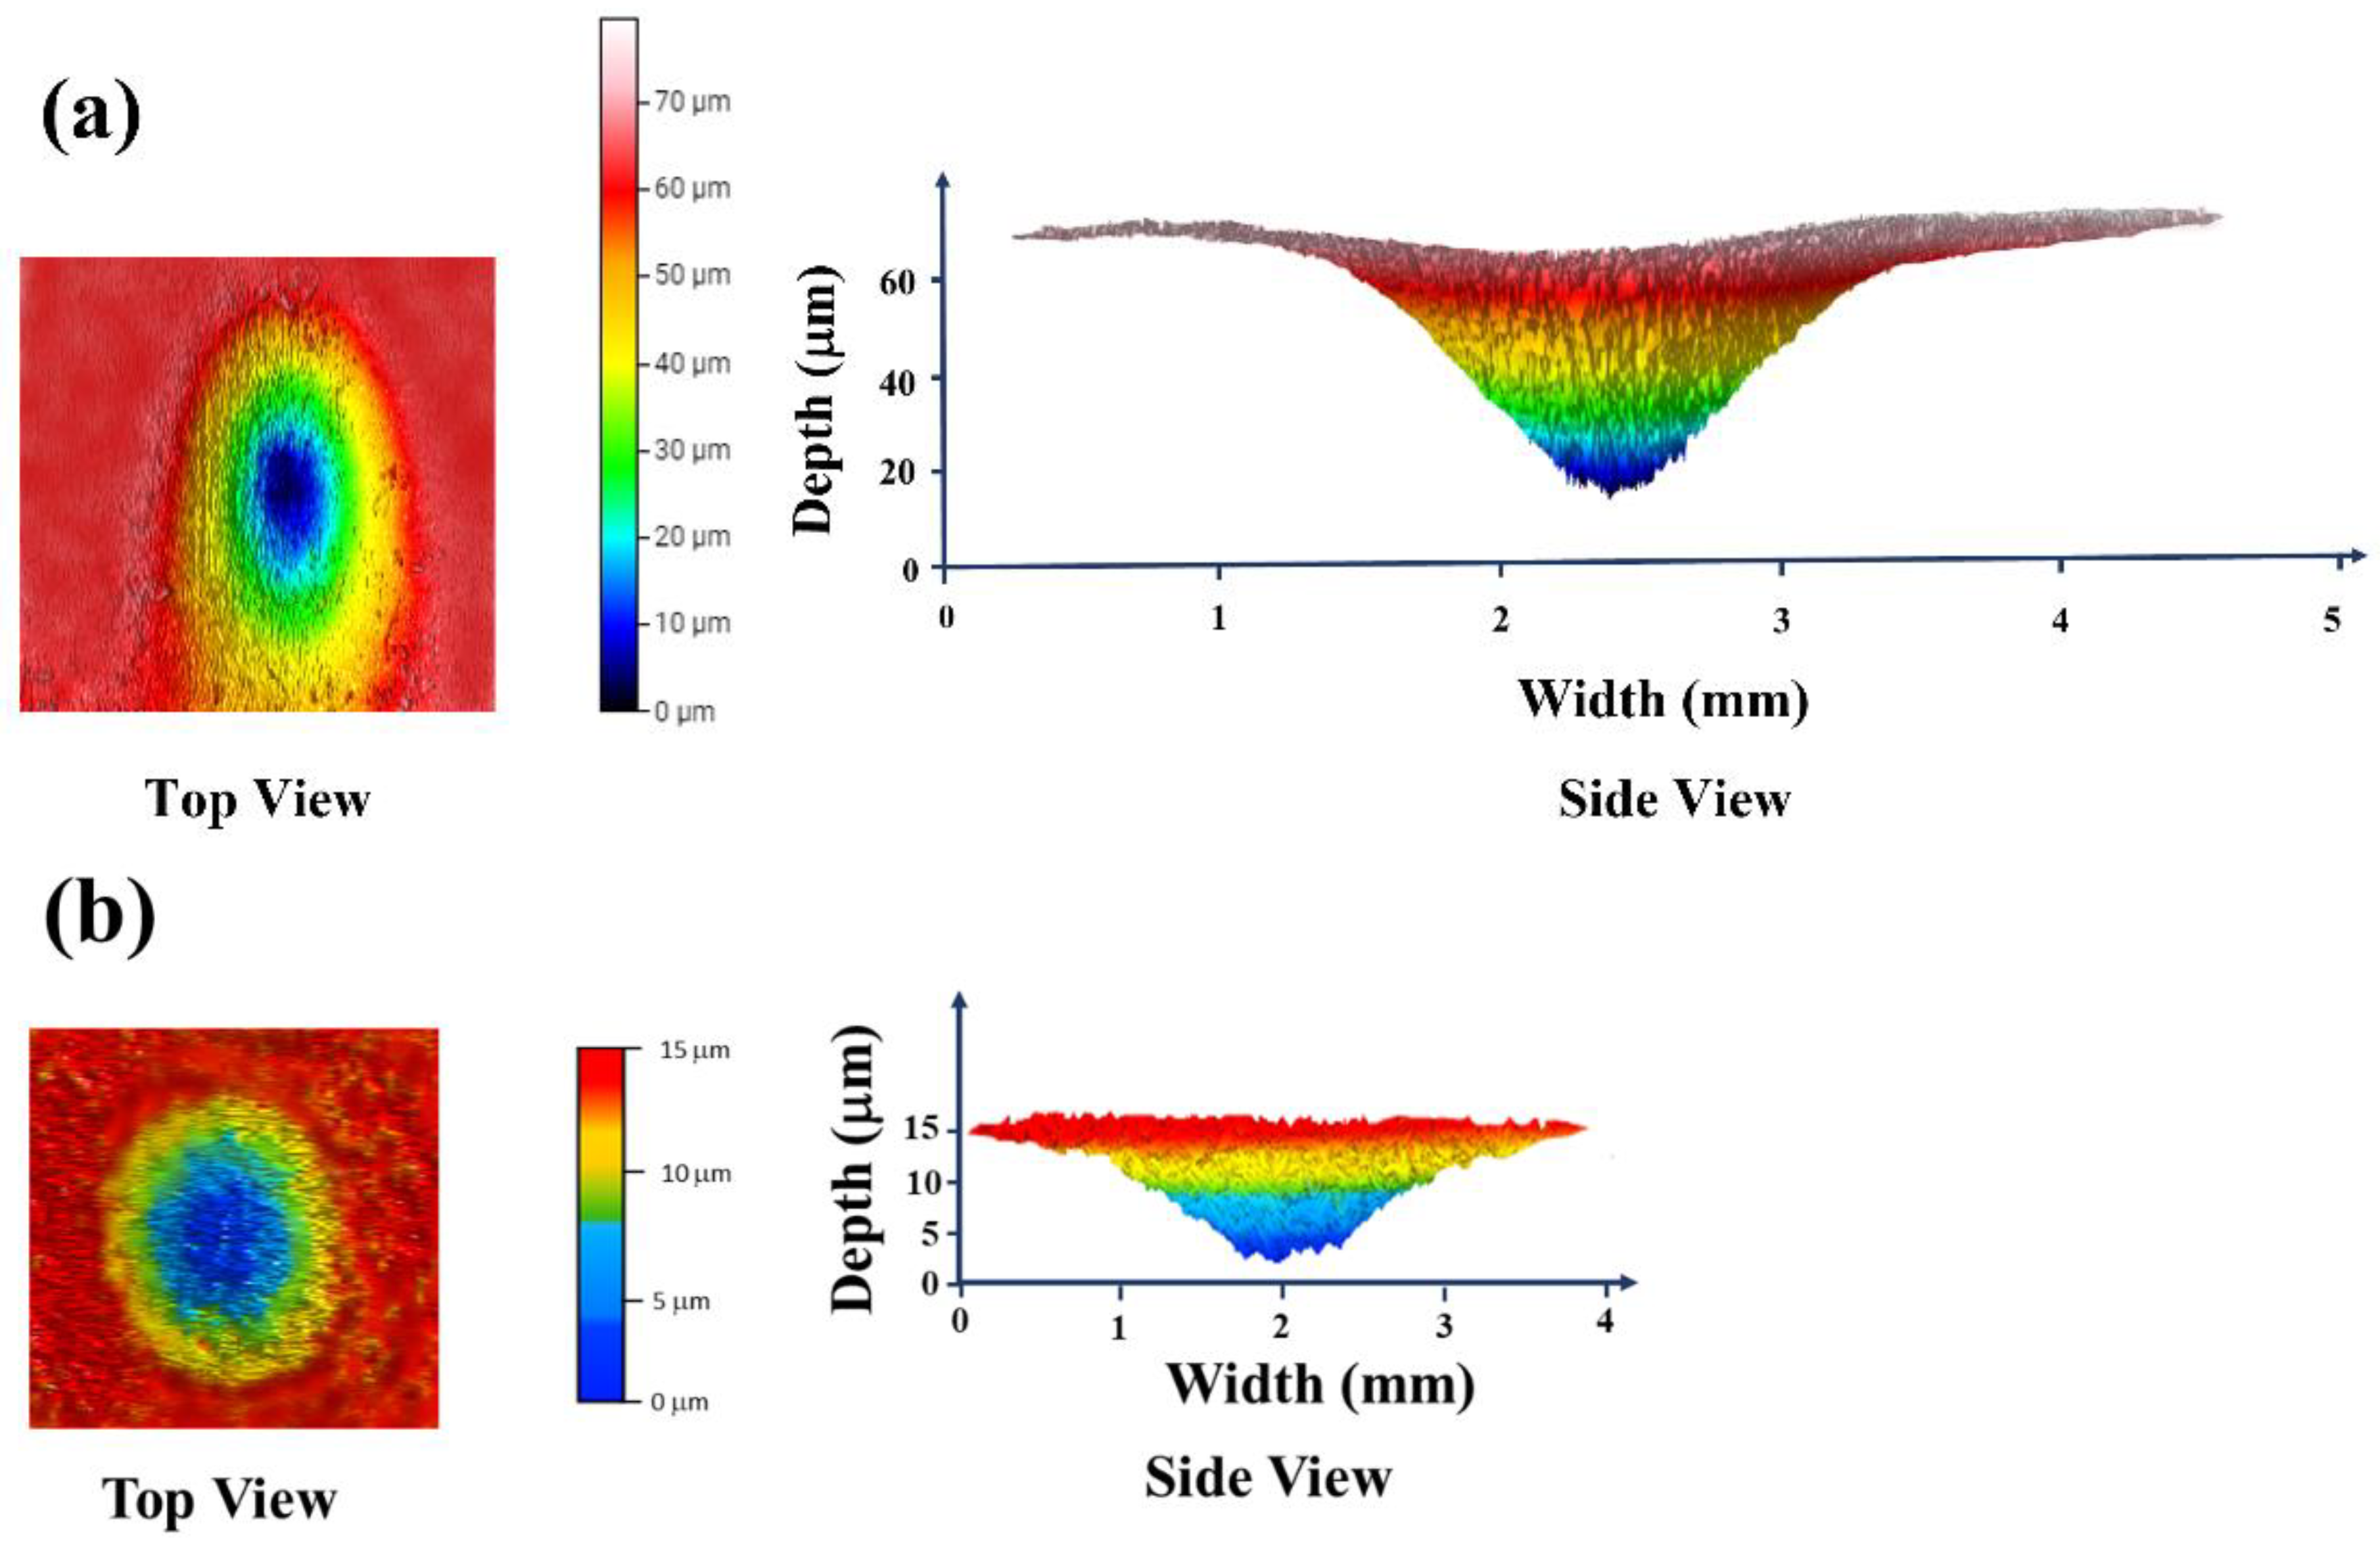
2.6. The 2D and 3D Scans of Erosion Scars of Coatings

Volume losses were calculated using 2D and 3D scans of erosion scars. For this, a Nano Map 500LS 3D surface profilometer from AEP Technology was employed in contact mode in accordance with ISO 4287 and ISO 25178 standards, respectively. The probe with tip size of 200 nm was used with contact force and Z-axis range of 20 mg and 500 µm, respectively.

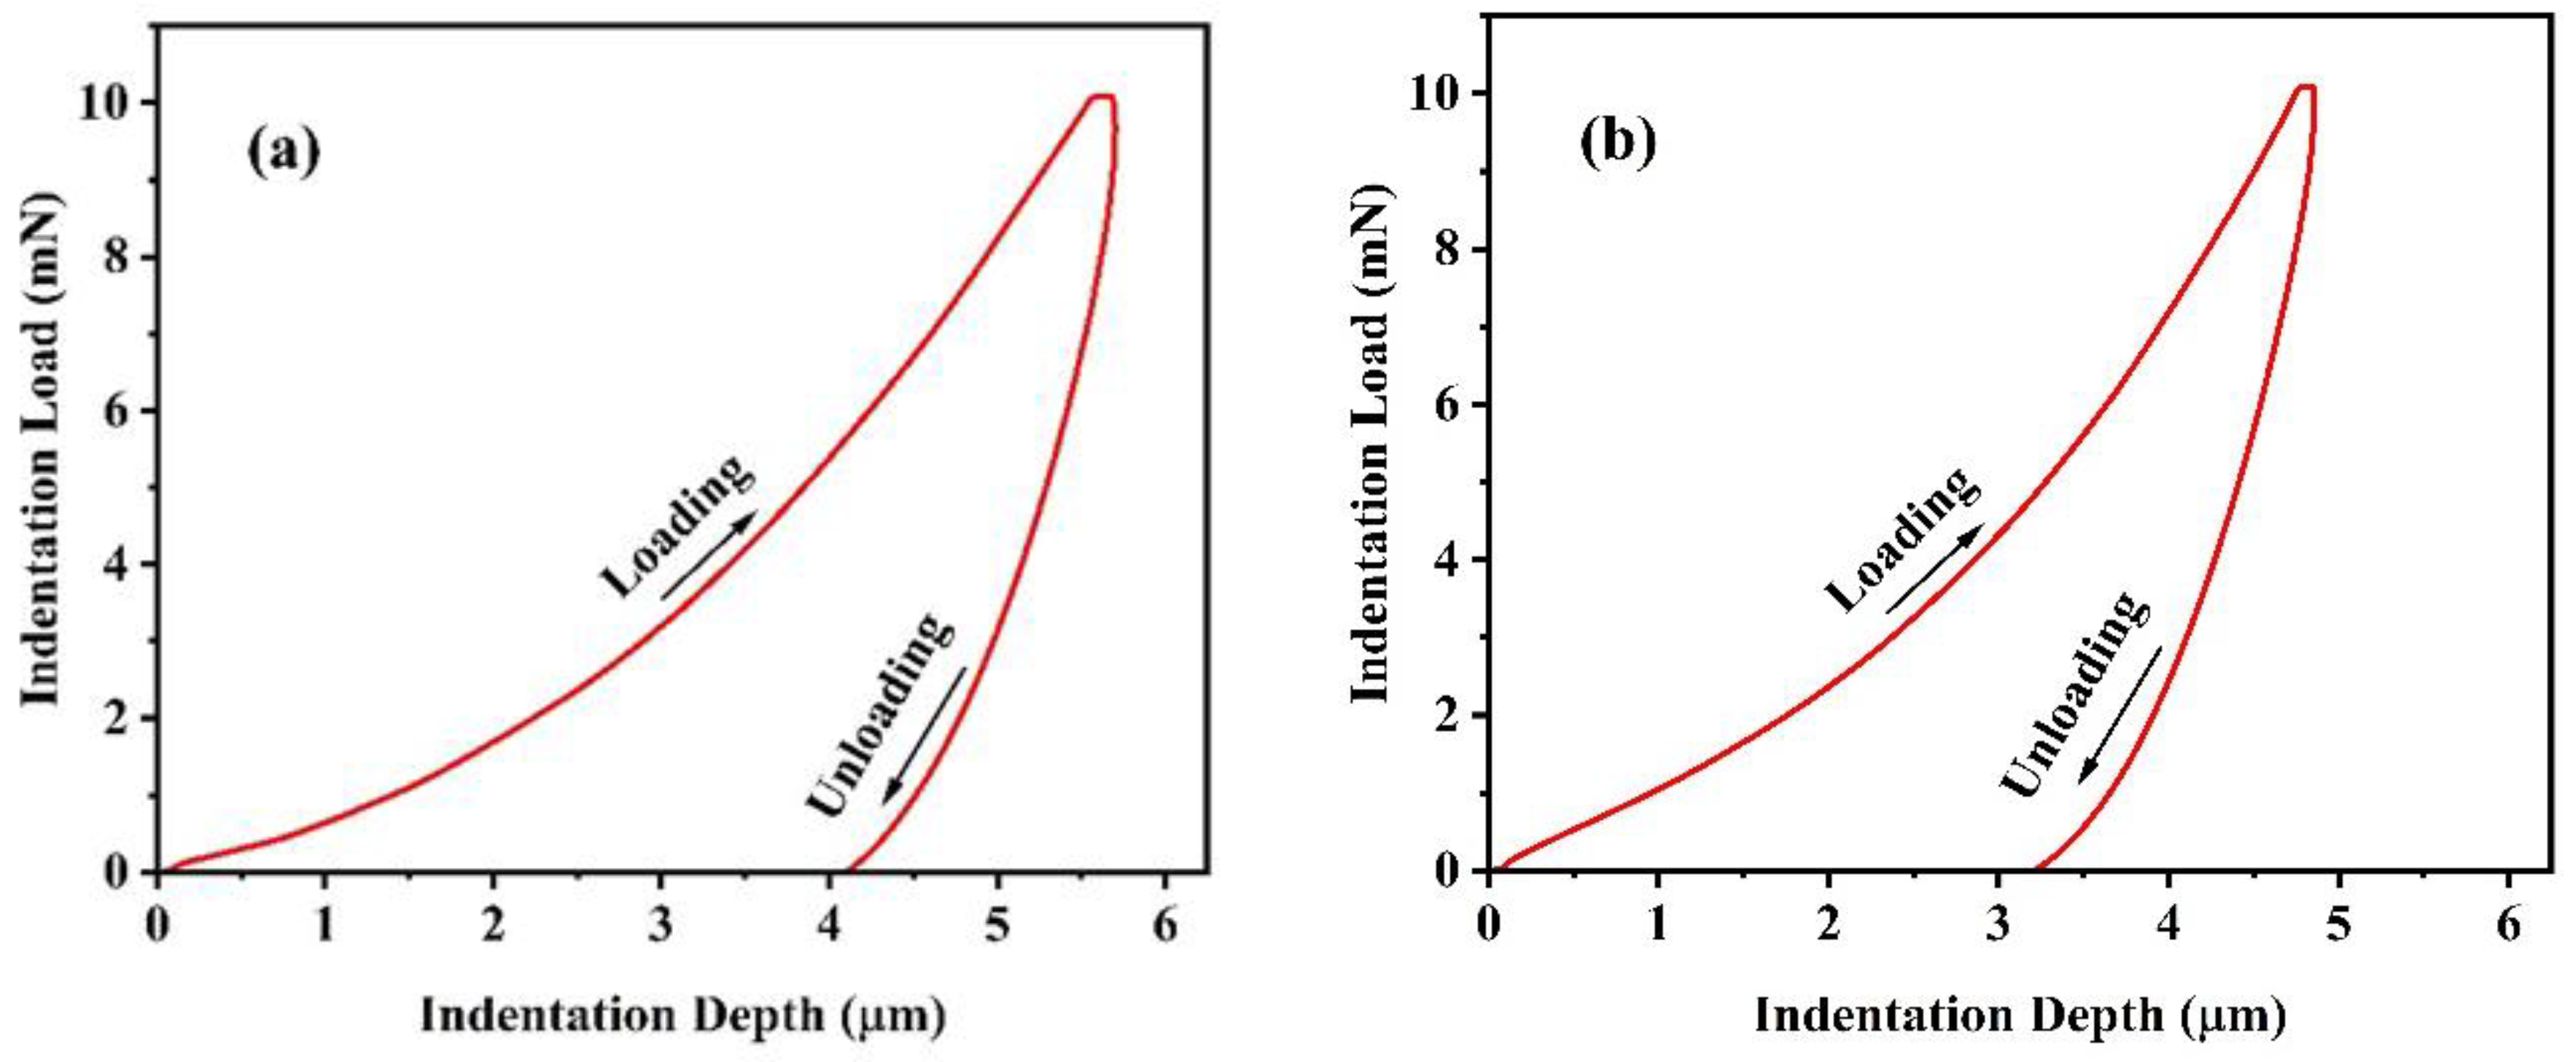
2.7. Nanoindentation of Coatings

Hardness (H) and elastic modulus (E) values of the coatings were obtained through nanoindentation tests. A nanoindentation hardness tester (CSEM Instruments) with Berkovich diamond indenter was employed for the tests by applying a maximum load of 10 mN. Hardness can be expressed as Pmax/A, where Pmax and A are peak load and projected contact area, respectively.

3. Results and Discussion

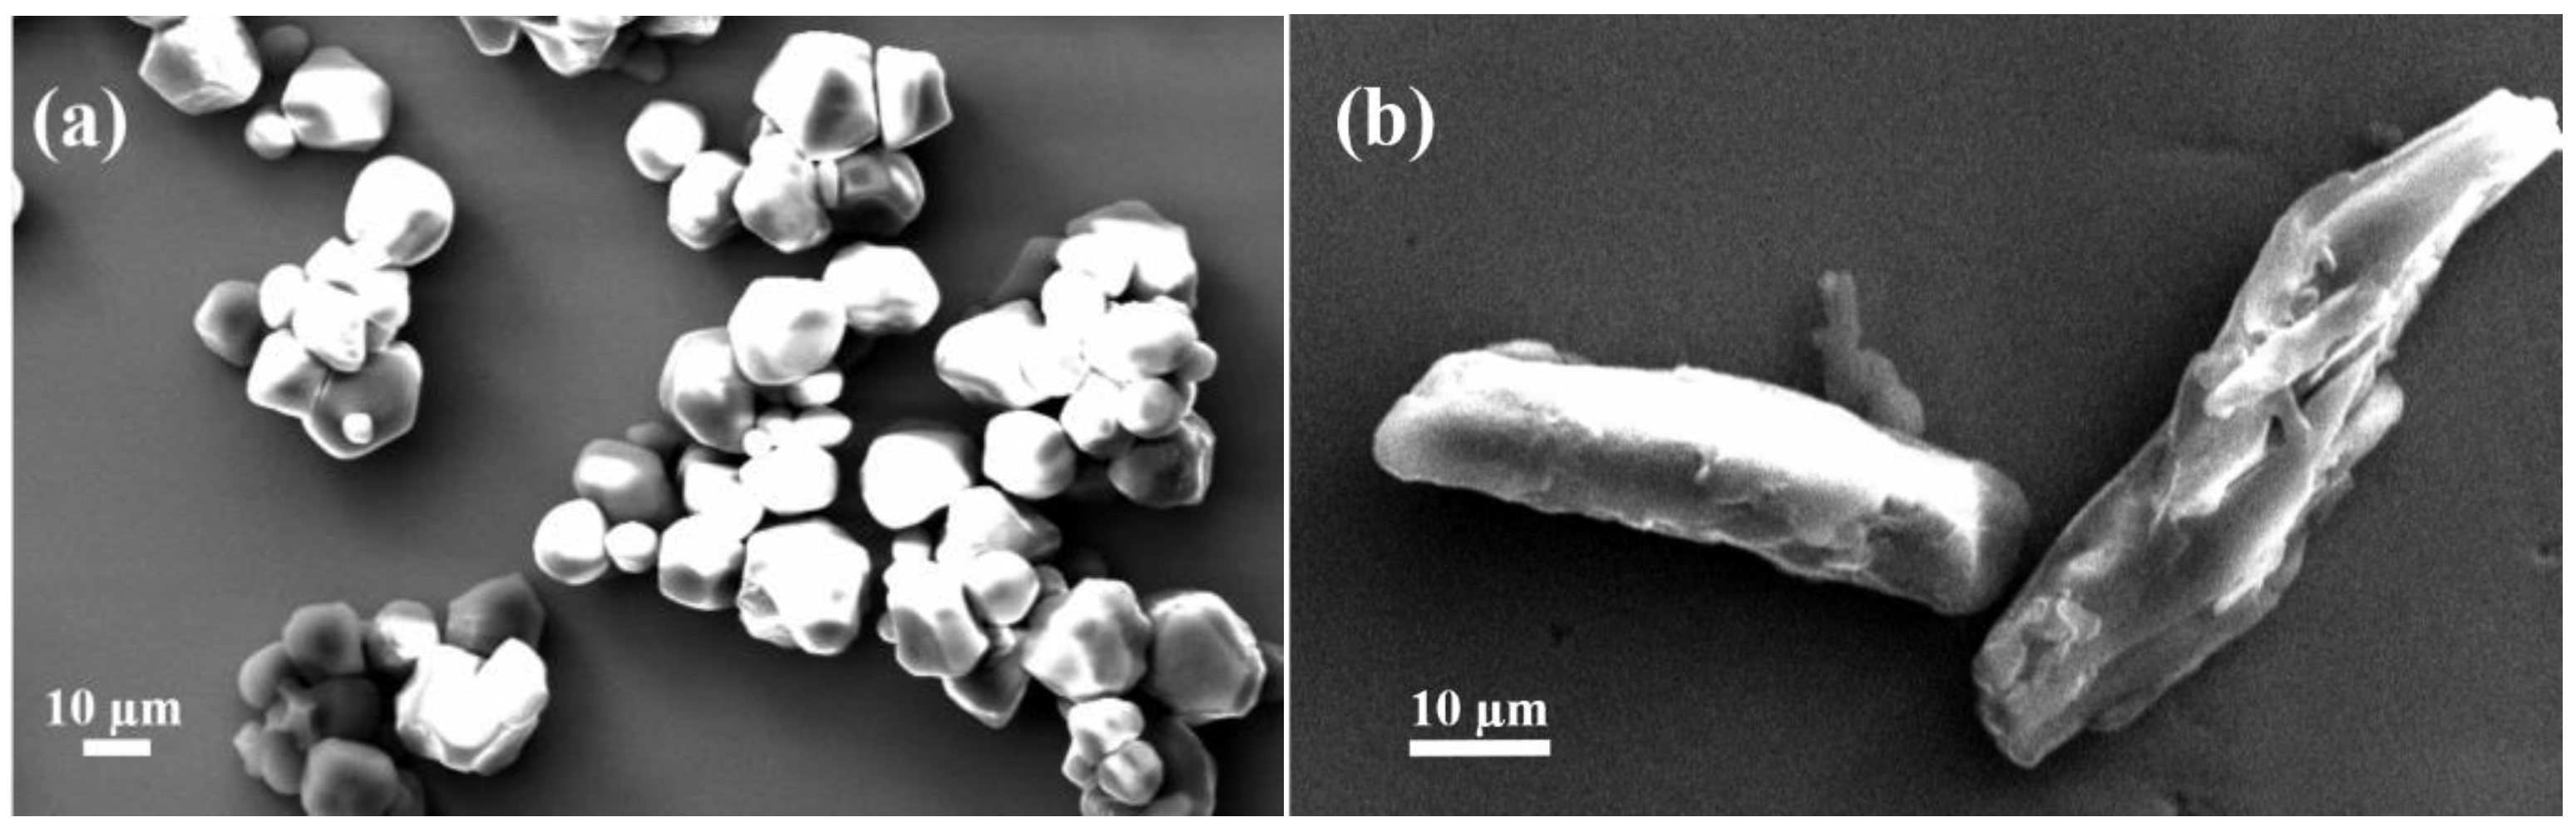
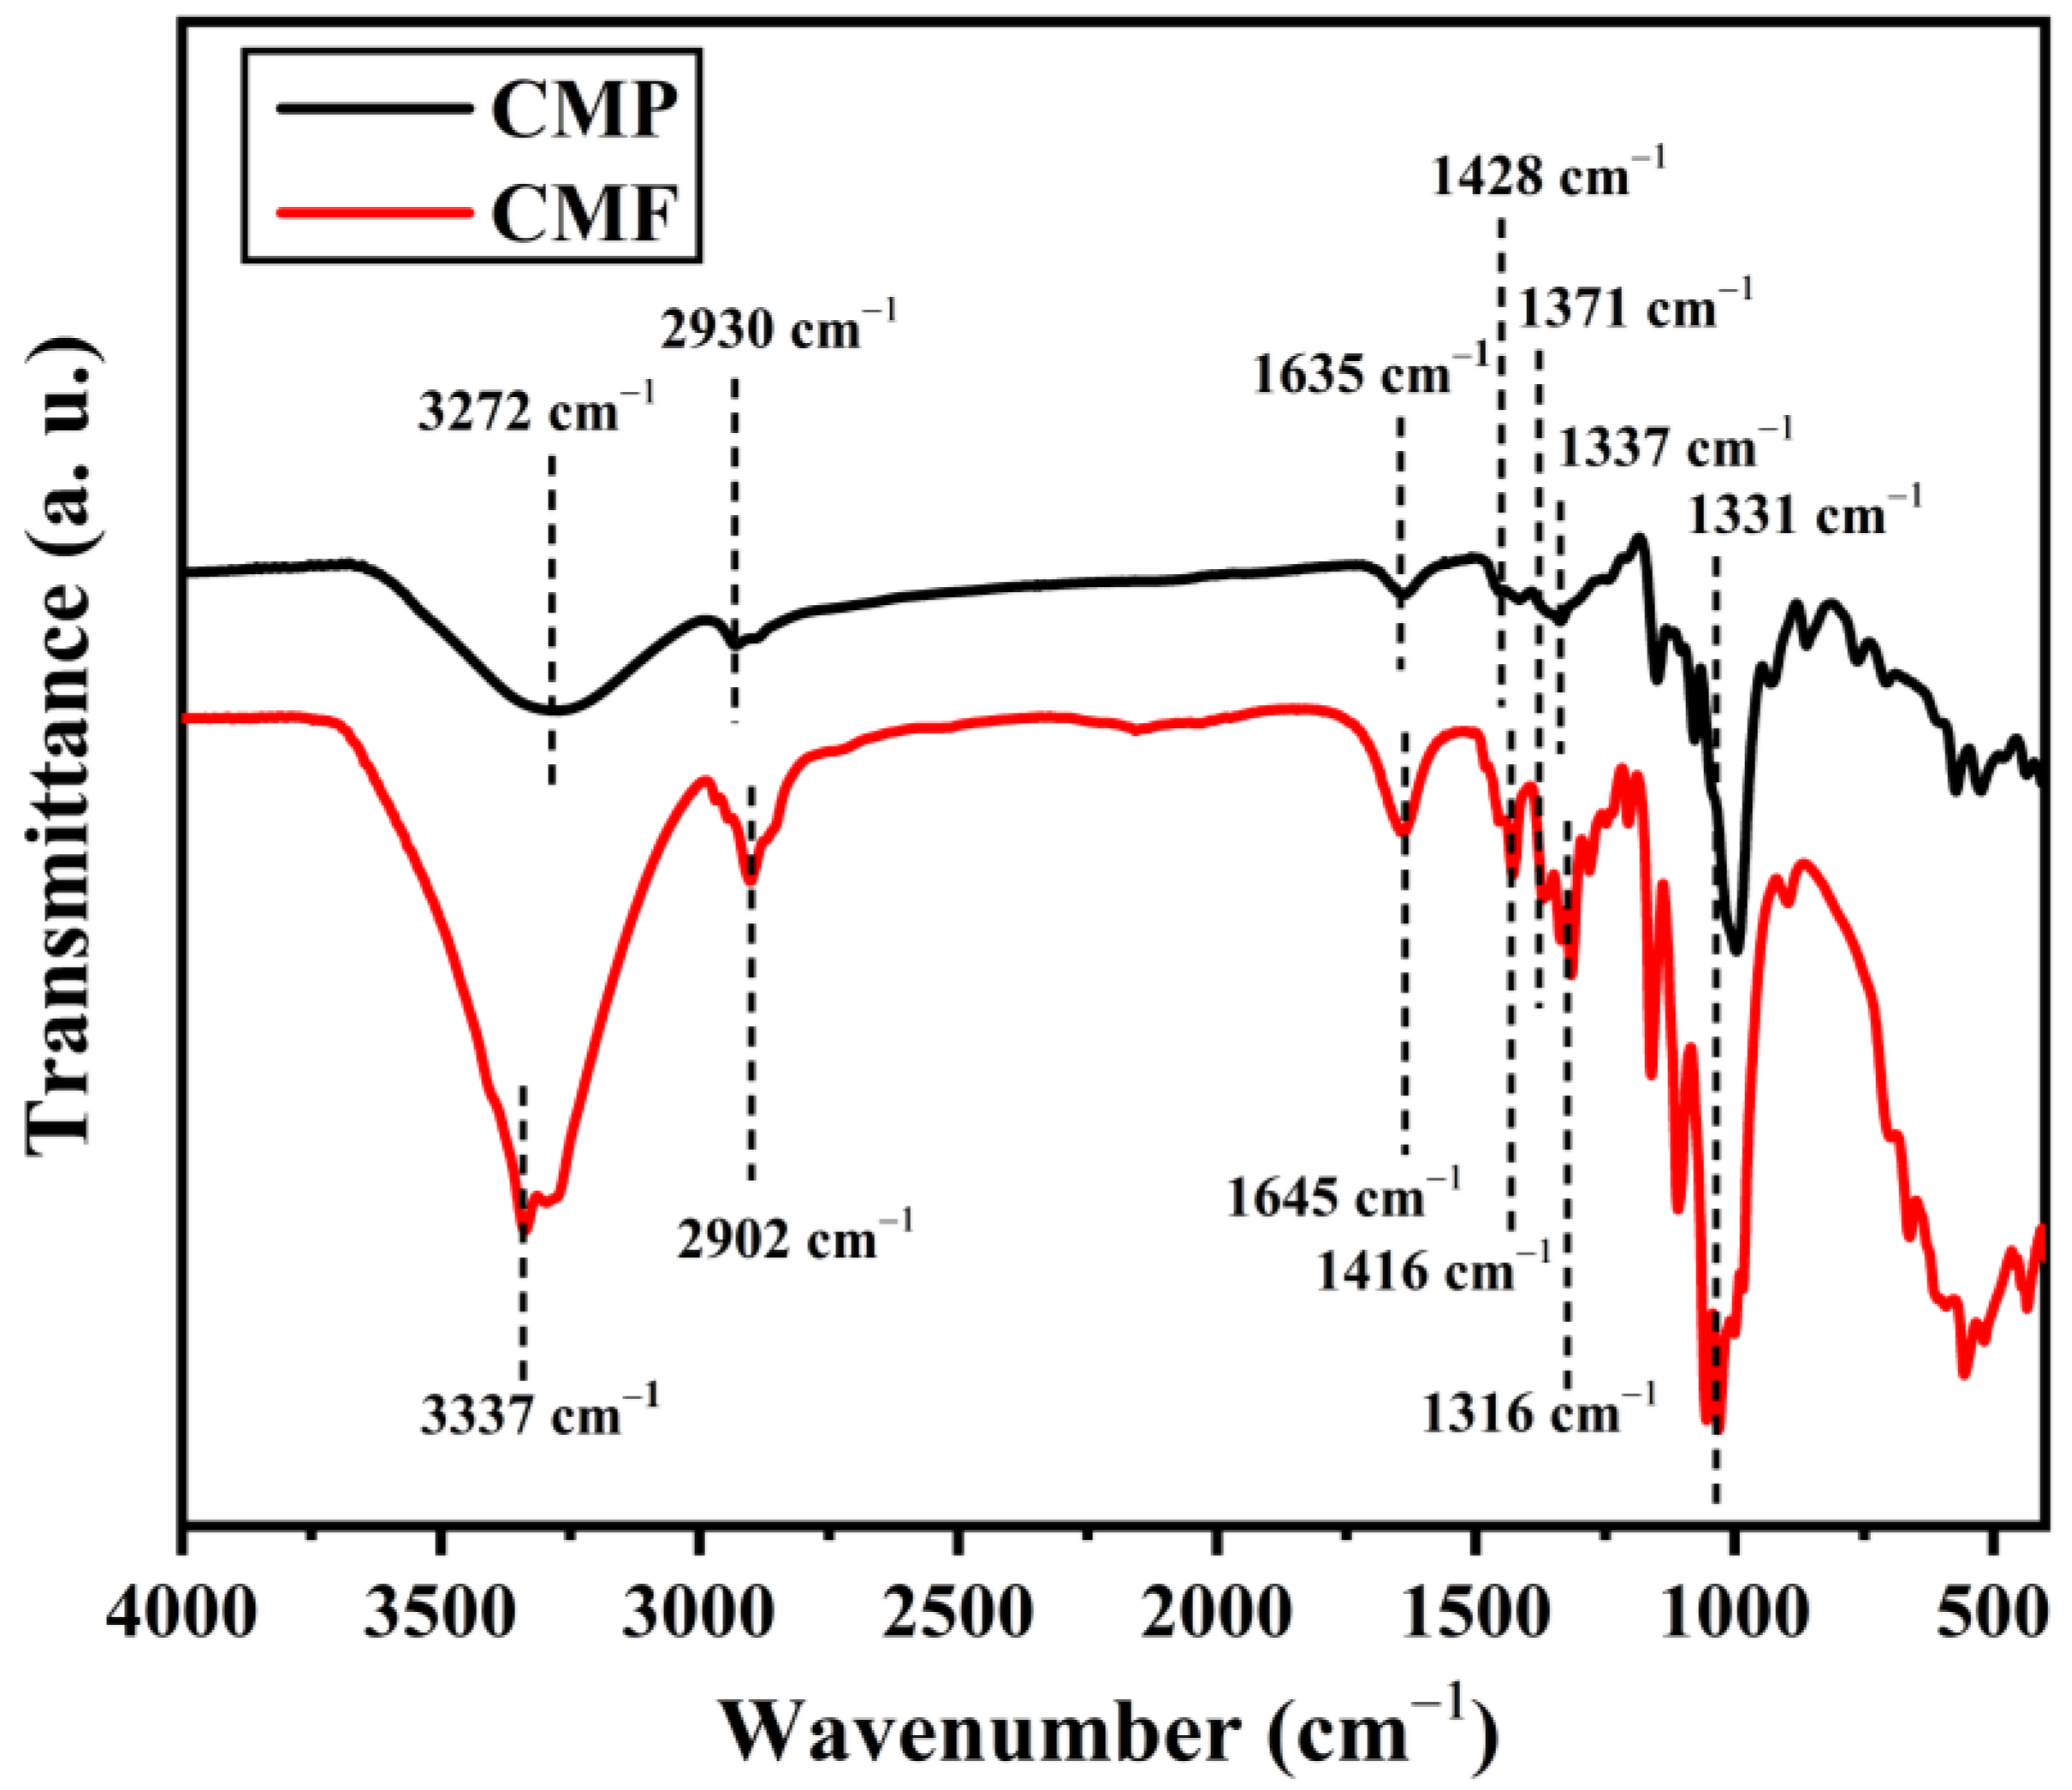
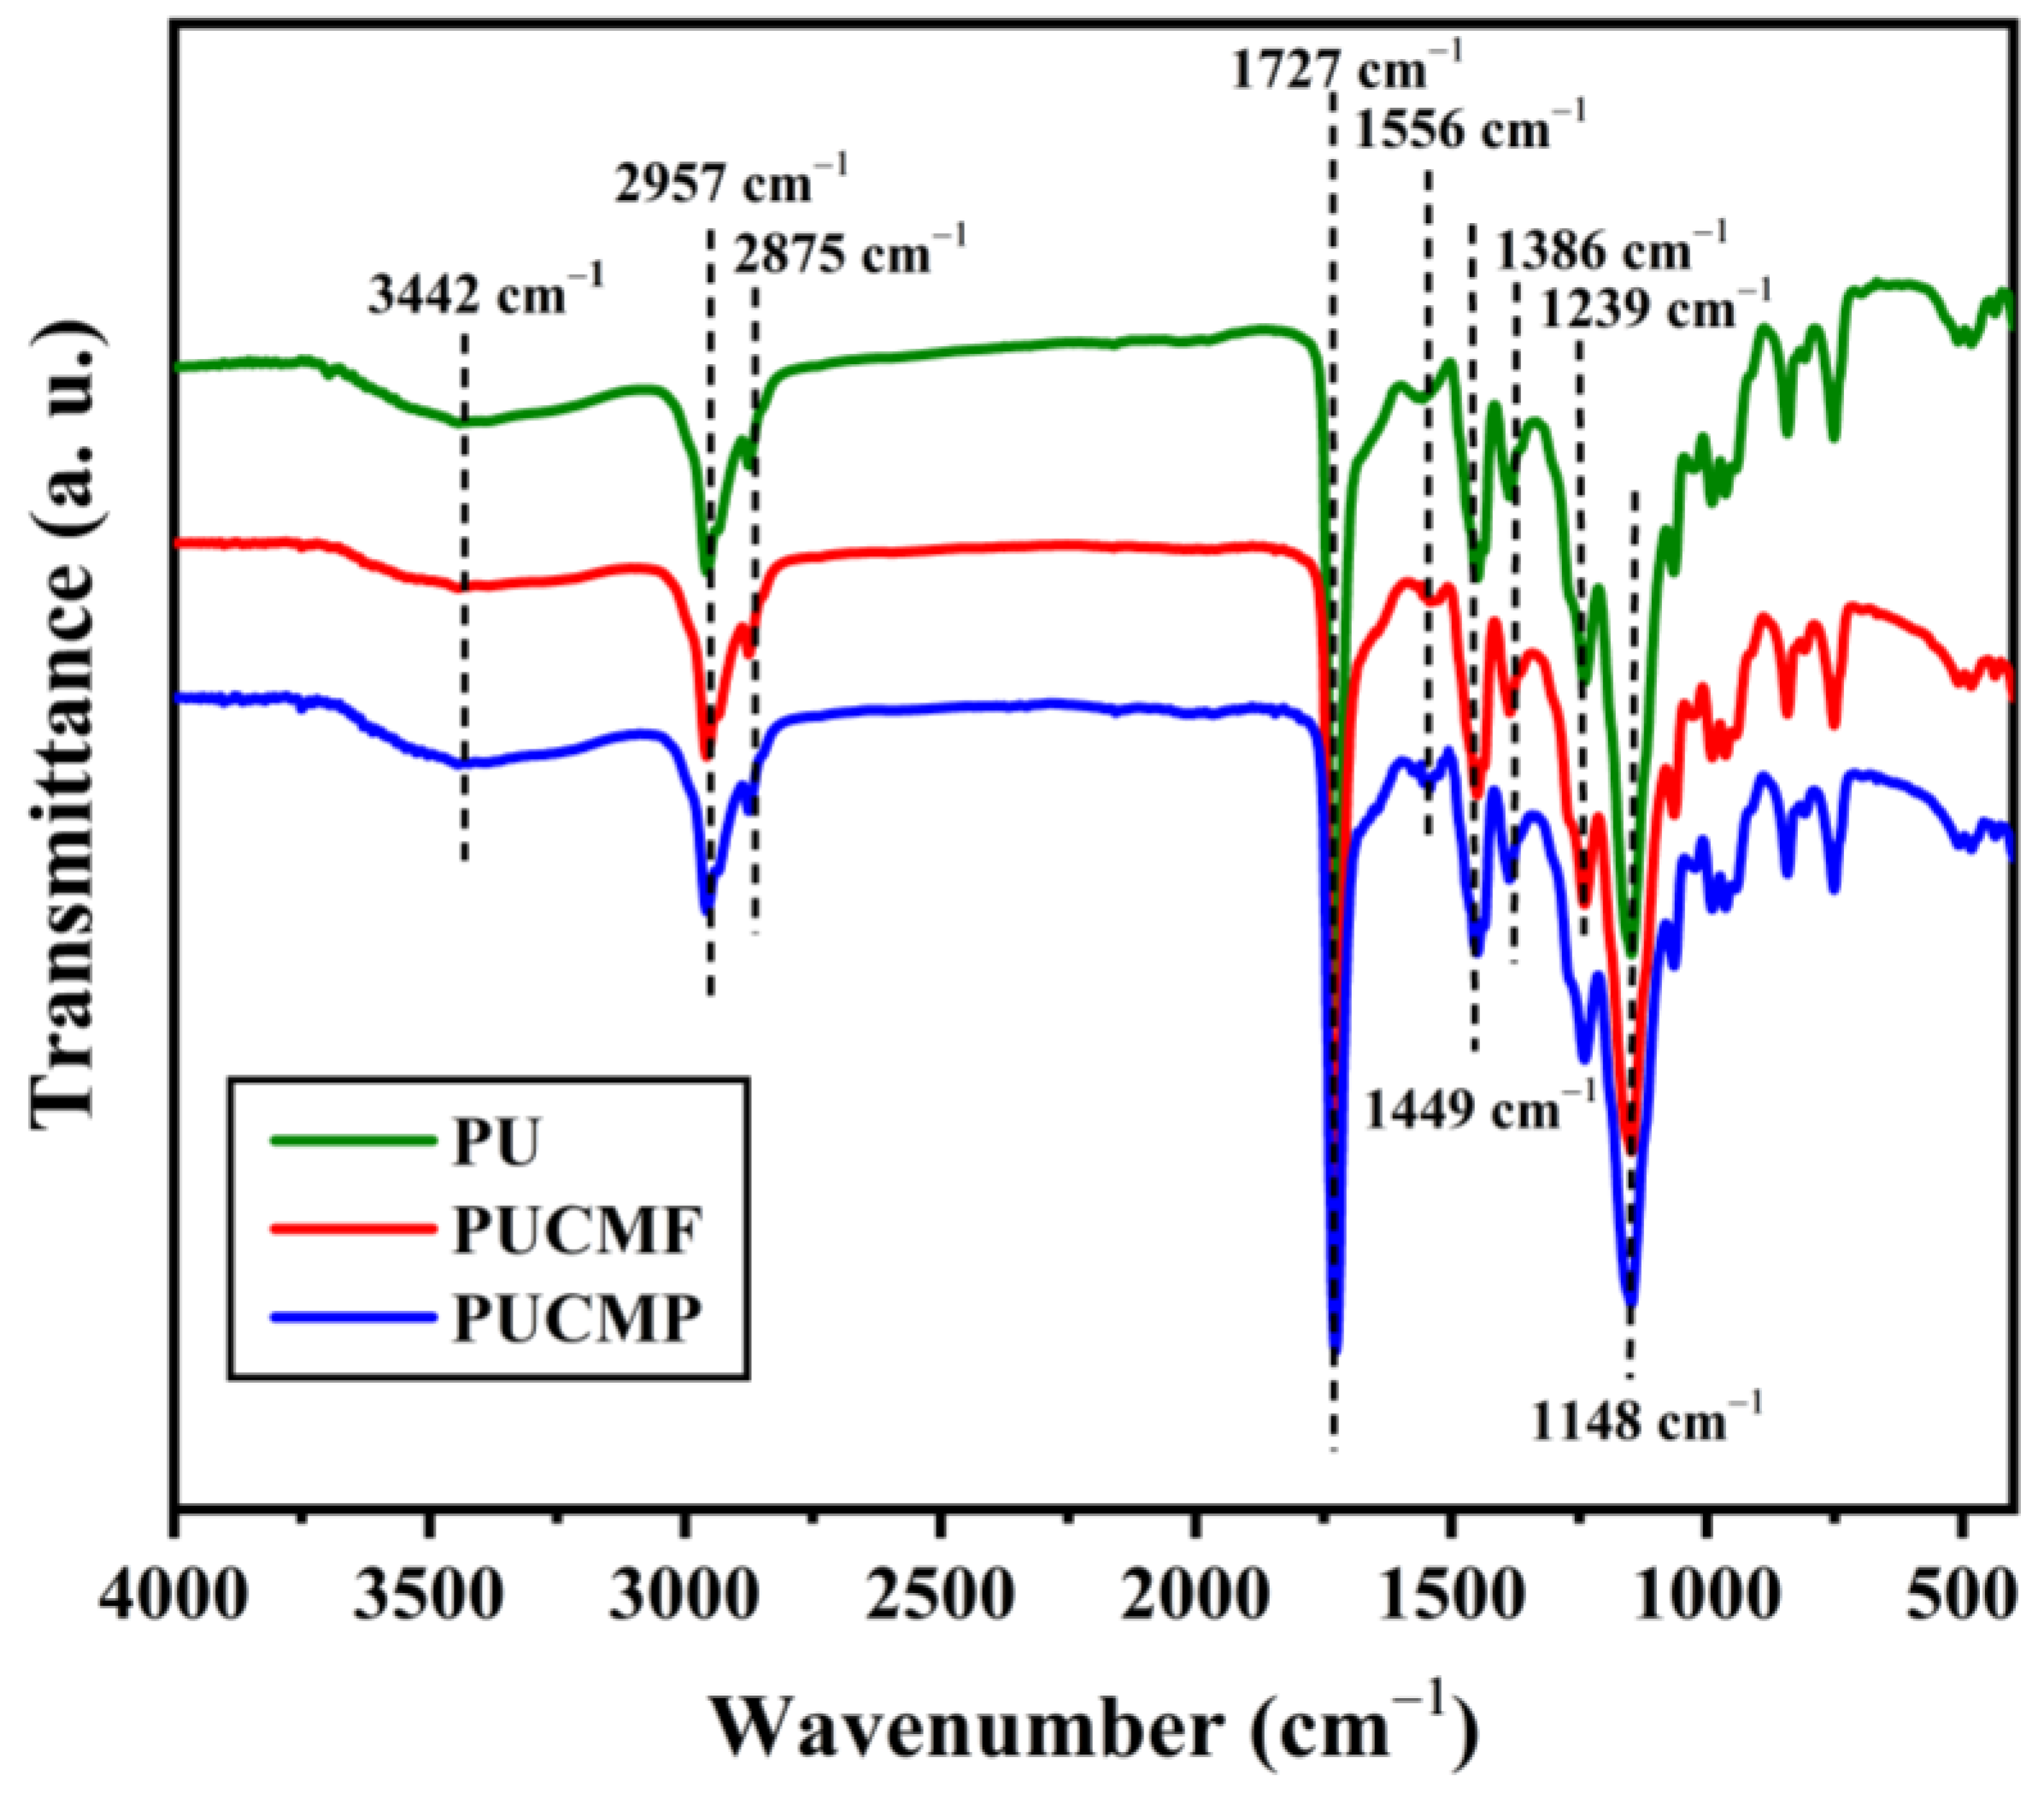
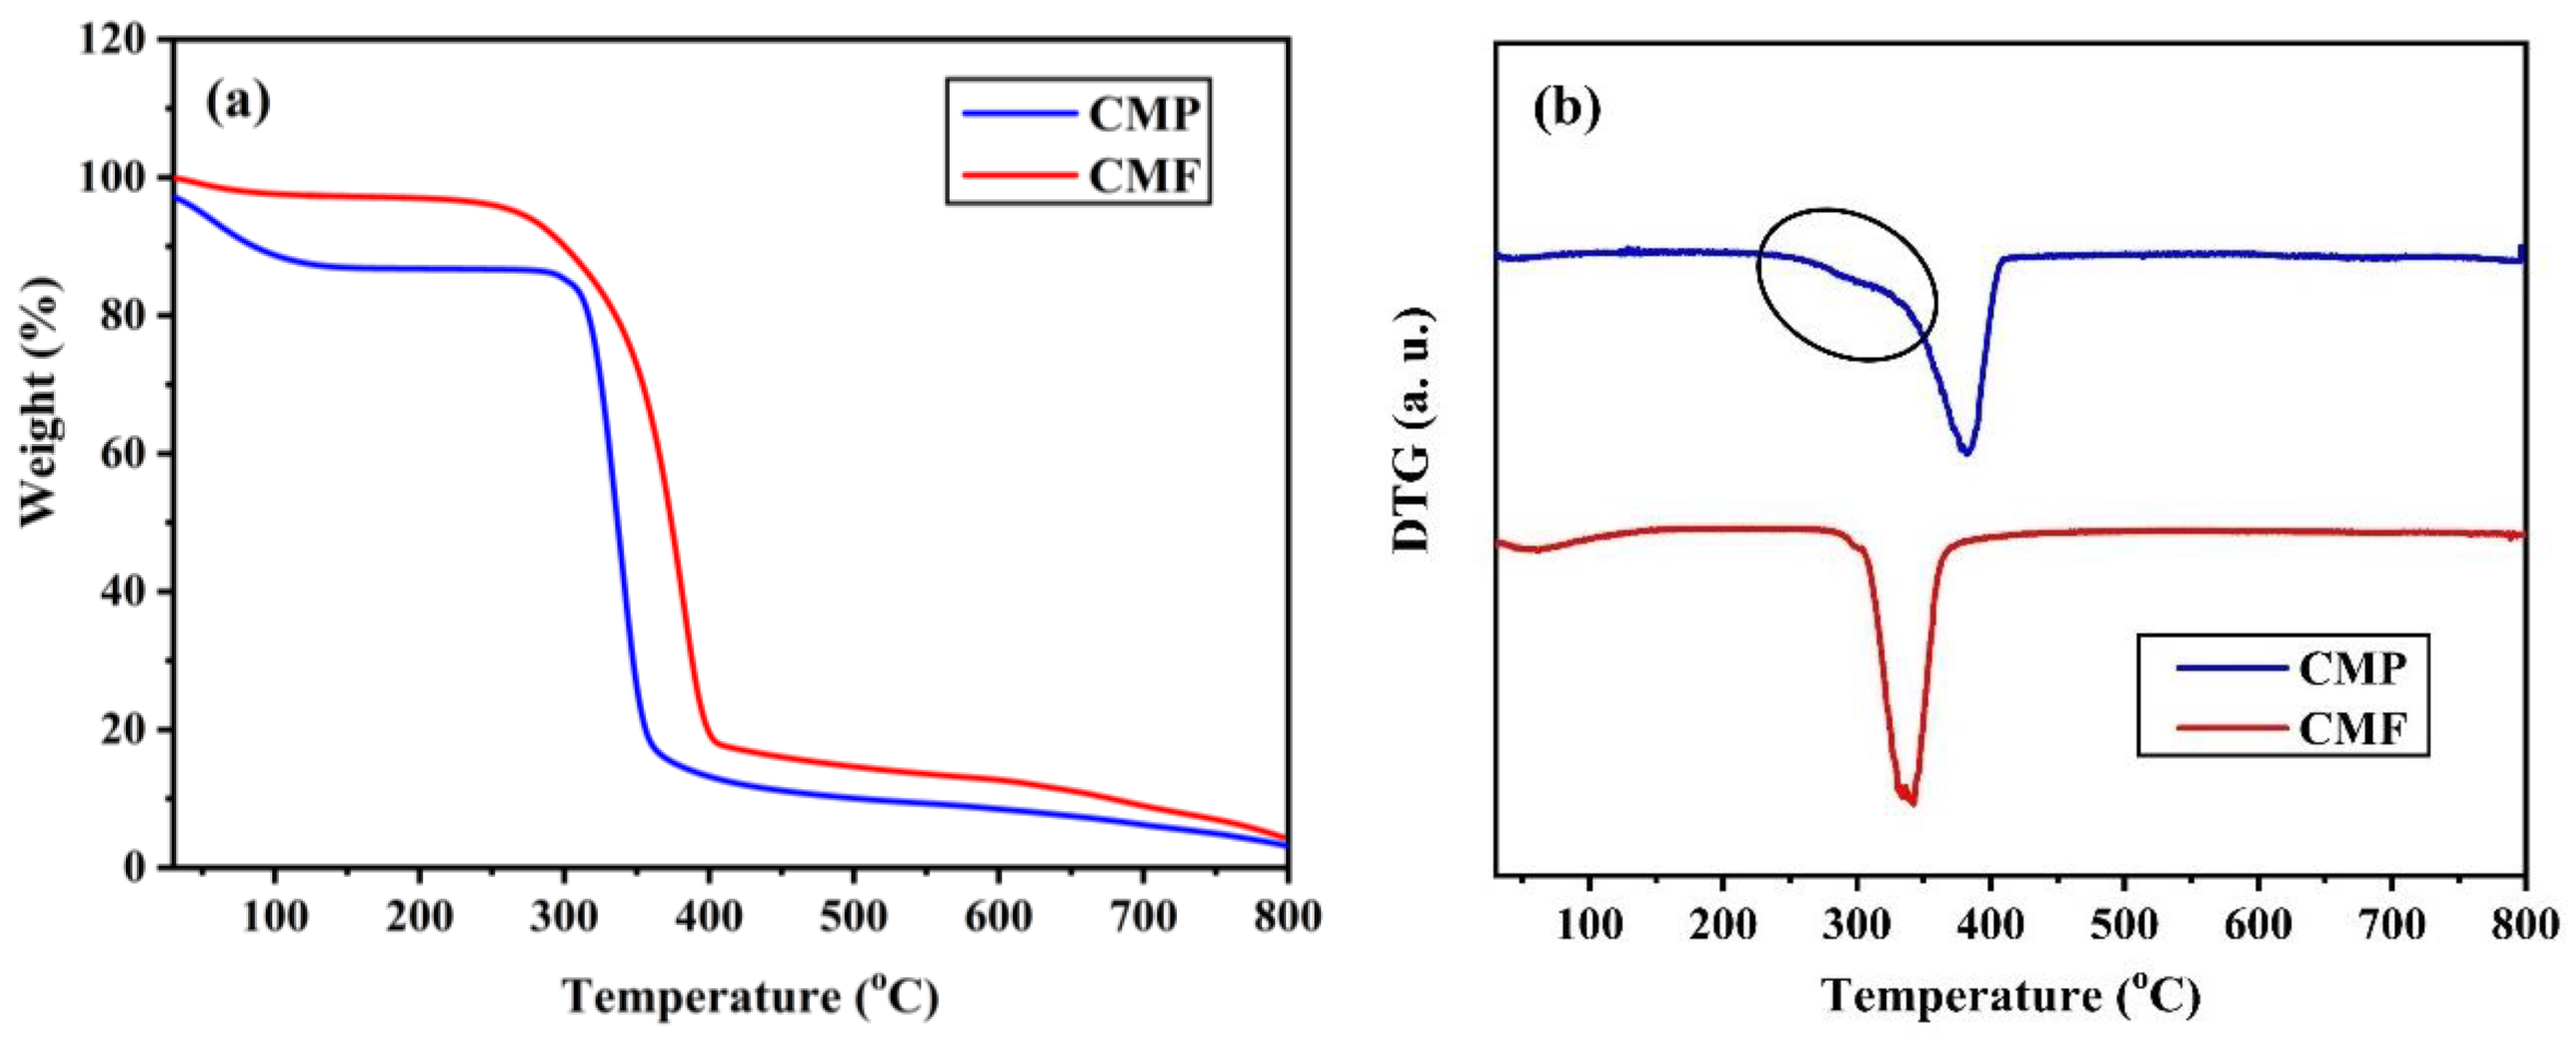
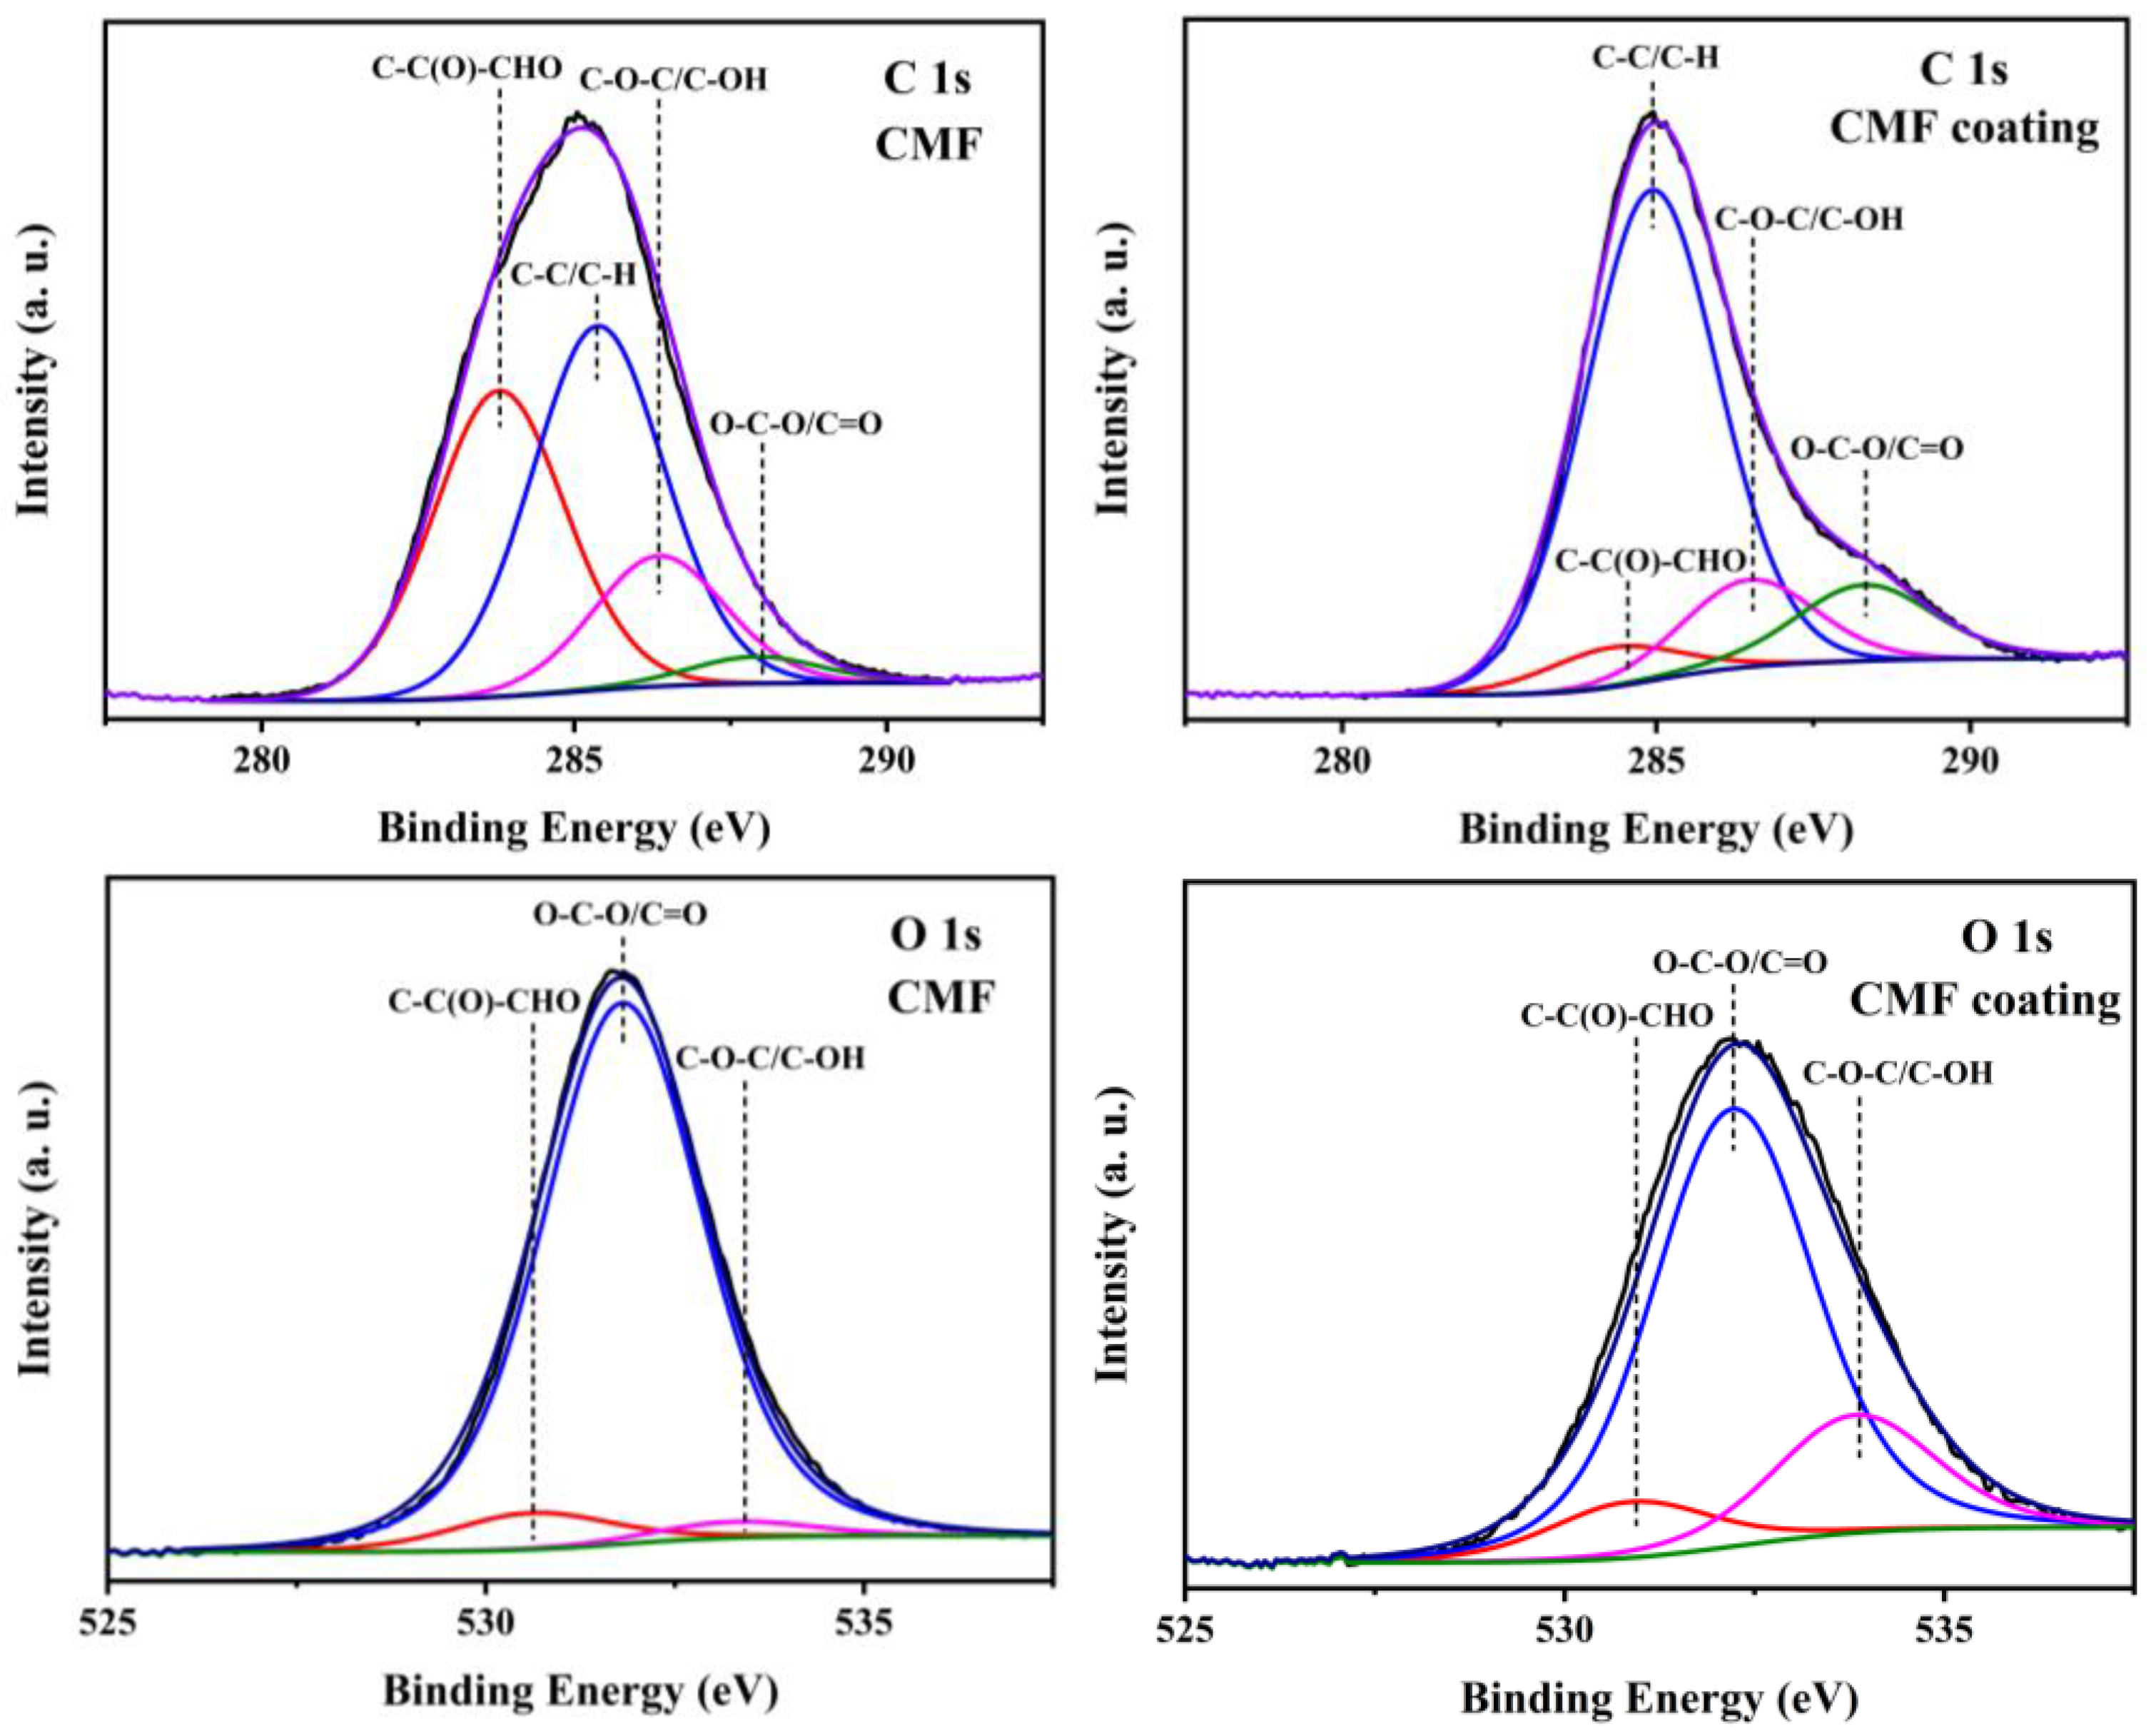
3.1. Physio-Chemical Characterization

Figure 3 represents FESEM images of CMP and CMF microstructures. Figure 3a displays a spherical morphology of cellulose microparticles of ~10 µm in size. The cellulose microparticles appear to be highly agglomerated. Figure 3b confirms the fiber-like morphology of CMF, having a width of 10 µm and average length of 40 µm.
The FTIR spectra of CMP and CMF are shown in Figure 4. Intense broad peaks observed at 3272 and 3337 cm−1 in CMP and CMF spectra, respectively, are due to the hydrogen bonded –OH vibration of the cellulose [29]. This includes inter- as well as intra-molecular hydrogen bond vibration in cellulose [30]. Other characteristic peaks at 2930 and 2902 cm−1 belong to the C–H stretching vibration from the CH2 group of cellulose [29]. Peaks located at 1635 and 1645 cm−1 correspond to the vibration of water molecules in moisture absorbed by CMP and CMF [29]. Peaks found at 1428 and 1416 cm−1 are associated with CH2 scissoring, while peaks at 1337 and 1316 cm−1 represent the OH bending vibration of cellulose [31]. The peak located at 1371 cm−1 is attributed to the C–H asymmetric deformation of cellulose [32]. The IR bands in the region of 1000–1200 cm−1 are related to C–O–C stretching and CO vibrations. The peak at 1031 cm−1 in the FTIR spectrum corresponds to the C–O–C pyranose ring skeletal vibration of cellulose in CMP and CMF, respectively [33].
Figure 5 represents the typical FTIR spectra of unmodified PU, PUCMP (10 wt.%), and PUCMF (10 wt.%) coatings. All three spectra are found to be identical. This may be because of the lower concentration of fillers in the coatings. The broad absorption peak at 3442 cm−1 is assigned to the N–H stretching vibration of the urethane group [34]. Peaks positioned at 2957, 2937, and 2875 cm−1 represent the C–H stretching of alkanes [34]. The C=O stretching of the urethane group leads to the sharp peak at 1727 cm−1, whereas the N–H bending peak is observed at 1556 cm−1 [34]. Peaks positioned at 1449 and 1386 cm−1 are due to CH2 and CH3 bending vibration. A peak related to the symmetrical C–O stretching vibration of polyol is found at 1239 cm−1 and the peaks located at 1148 and 1062 cm−1 are due to the C–O stretching vibration of the urethane group [34].
The TGA and DTG thermograms of CMP and CMF are shown in Figure 6. The TGA results of CMP and CMF are illustrated in Figure 6a. It shows that the thermal degradation of CMP and CMF occurs in two steps. Both samples demonstrate initial weight loss started around 100 °C, which is due to the evaporation of moisture in the cellulose samples. In the case of CMP, weight loss due to the evaporation of moisture is greater than that for CMF. Fast pyrolysis occurs at temperatures ranging from 250 °C to 350 °C. The subsequent weight loss is rapid, owing to cellulose dehydration and breakdown. The temperature at which the oxidation process begins is known as the onset decomposition temperature. The onset temperature of CMP is higher than that of CMF, being 289 °C versus 243 °C, respectively. As a result of oxidative thermal degradation and the breakdown of the crystallite structure, cellulose and regenerated cellulose are completely burned during this stage. Figure 6b shows the DTG curves of CMP and CMF samples. It is observed that the DTG curve of CMP is shifted to a higher temperature than CMF. DTG peaks occur at 382 °C for CMP and 340 °C for CMF. This higher decomposition temperature can be attributed to more order and packing of the cellulose region as well as higher hydrogen bond intensity [35]. Furthermore, the DTG curve of CMP displays a shoulder between 260 and 320 °C encircled in the figure. This can be related to degradation of hemicellulose in CMP. In a work of Yang and co-authors, it has been revealed that hemicellulose exhibits more prominent decomposition between 220 and 315 °C [36].
XPS of CMP, CMF, and related coatings has been carried out to understand their surface nature. C 1s core level spectra in all samples are observed to be broad, indicating the presence of several carbon species, which are resolved by curve fitting. C 1s peaks located at 285.1, 286.7, and 288.1 eV in all samples are assigned to the C–C/C–H, C–O–C/C–OH, and O–C–O/C=O species of cellulose, respectively [37,38,39]. The peak around 284 eV is attributed to –C–C(O)–CHO species present in the cellulose structure [37]. The spectral nature of O 1s core levels suggests that oxygen is present in different component species. The O 1s core level peak at 530.6 eV observed in all samples corresponds to the –C–C(O)–CHO species of cellulose structure. Higher binding energy peaks situated at 531.7 and 533.5 eV stand for O–C–O/C=O and C–O–C/C–OH species, respectively [37,38,39]. Typical C 1s and O 1s core level spectra of CMF powder and its coating (PUCMF 10 wt.%) are shown in Figure 7.

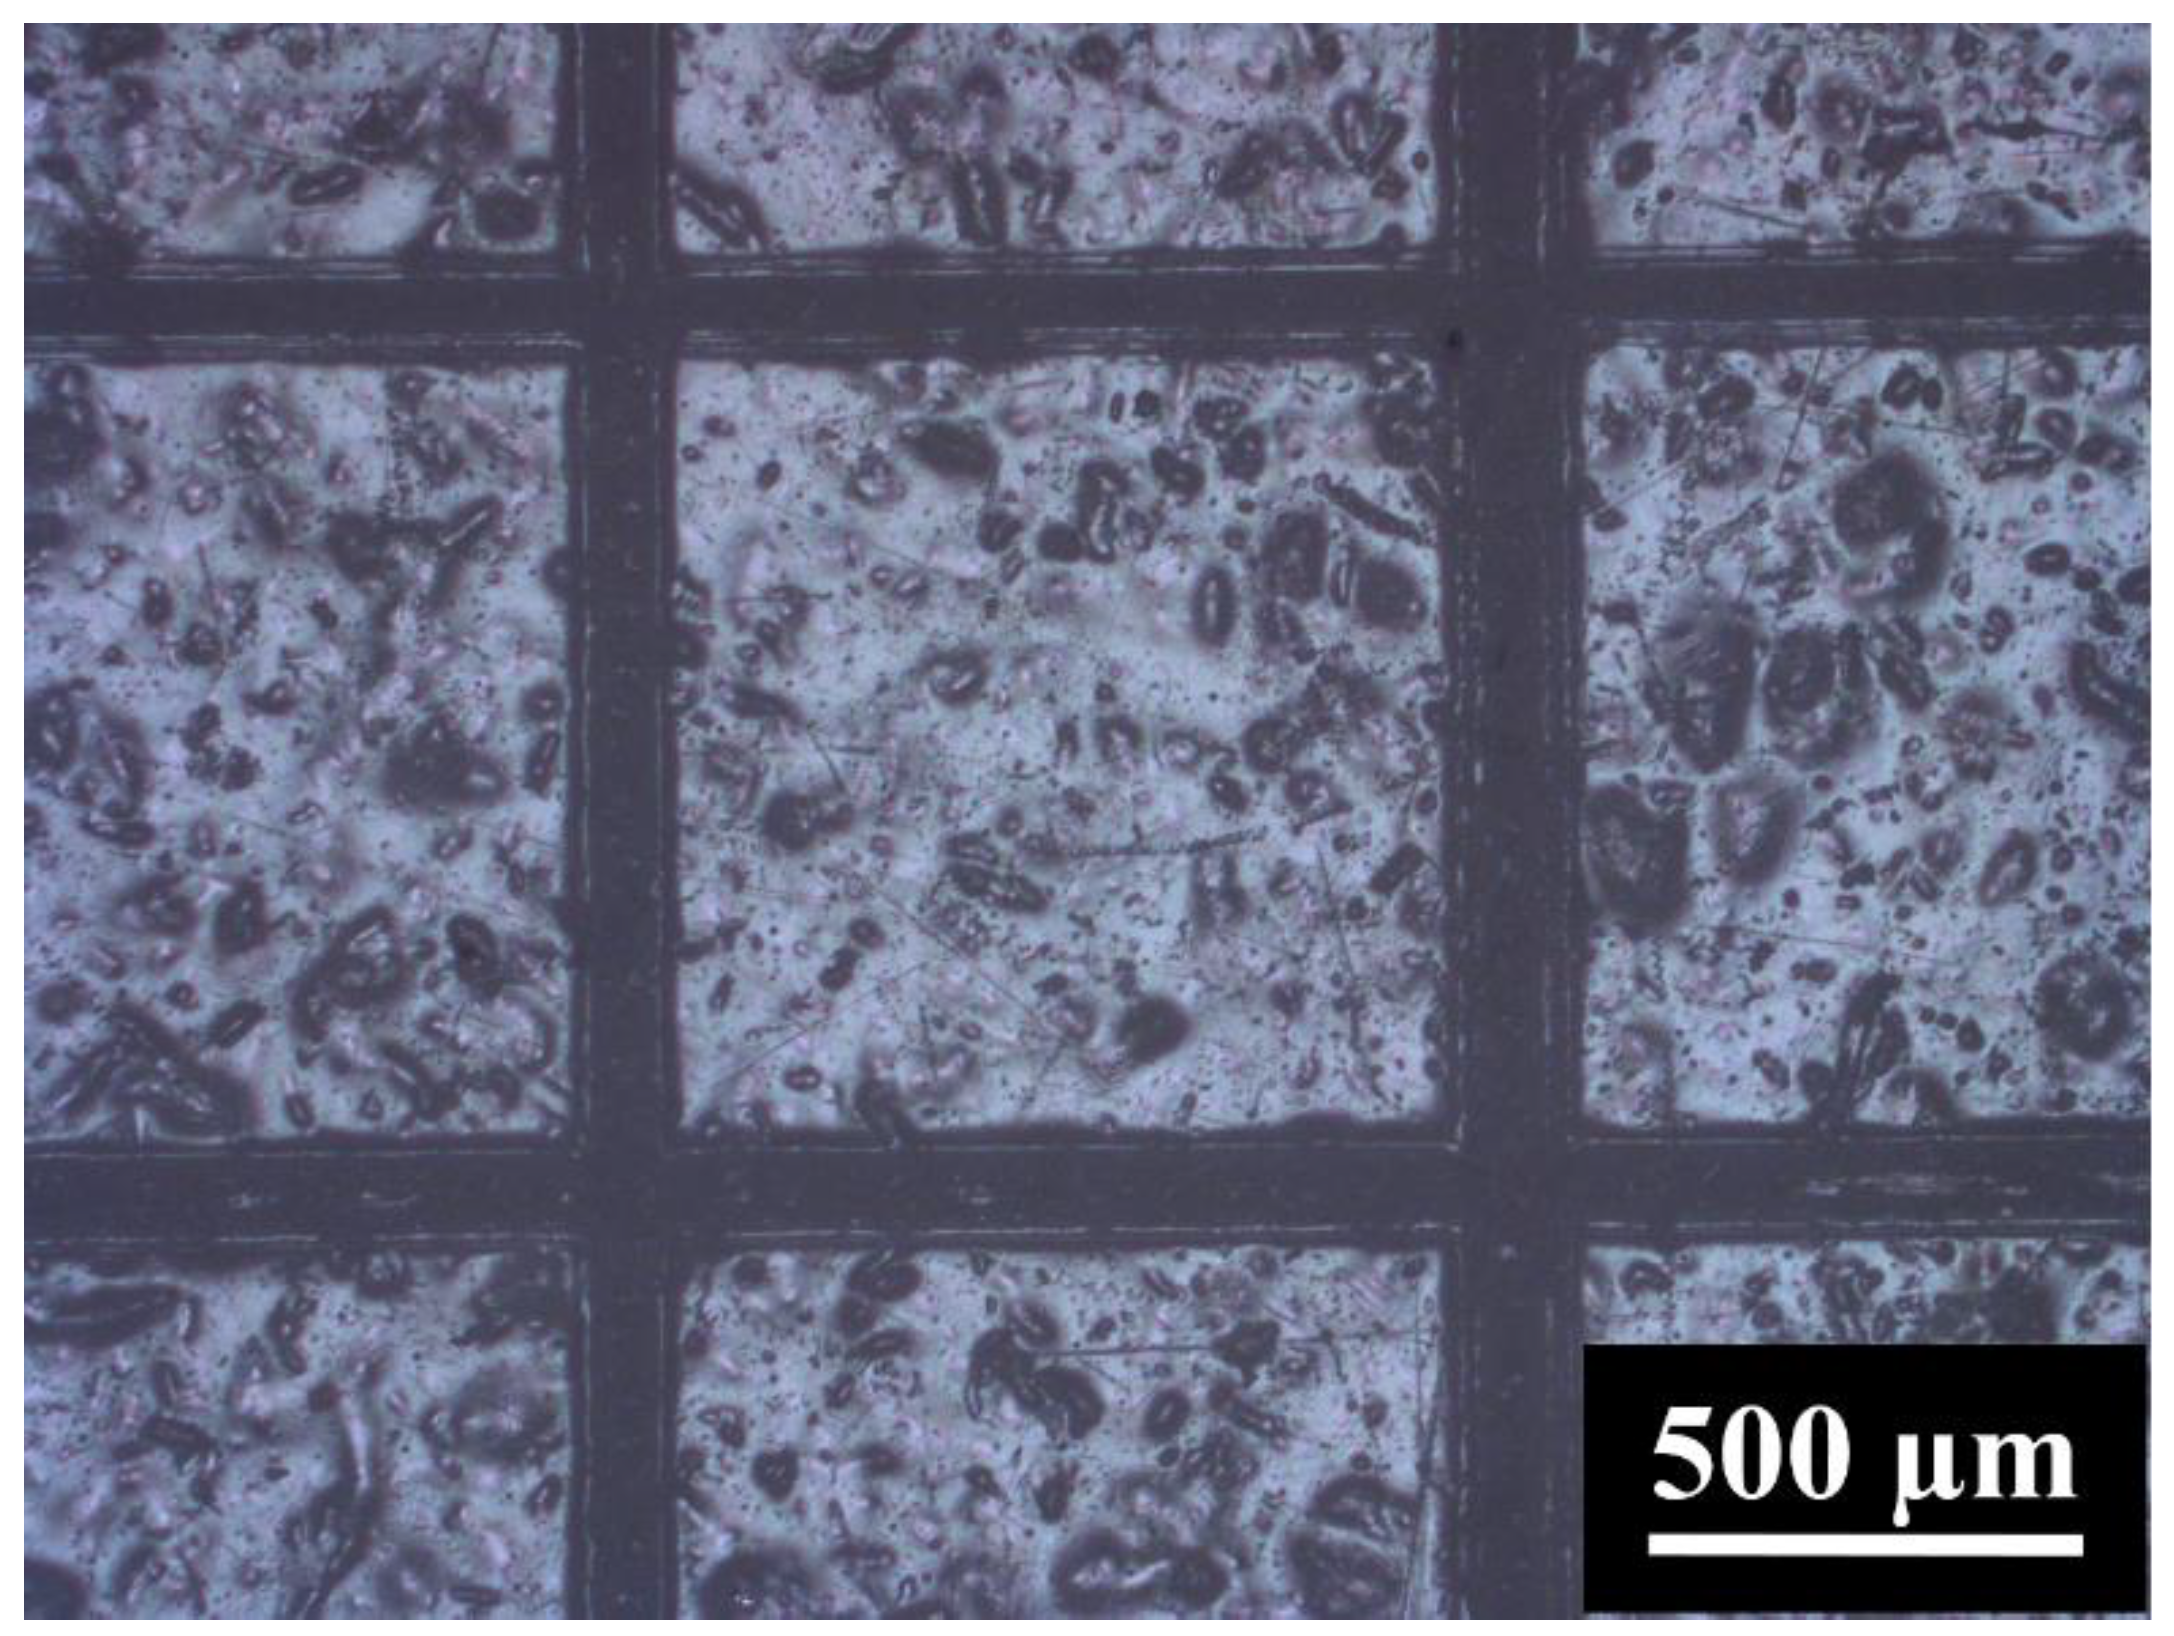
3.2. Crosshatch Cut Test

The cellulose-reinforced PU coatings are designed to be extremely adherent to the substrate. Coatings have been sprayed on a conventional polyester body filler layer that covers up all defects of the substrates and provides appropriate surface roughness for the mechanical grafting of a subsequent PU coating layer. Furthermore, water-based PUs comprise poly(-caprolactone) and polylactic acid as hydroxyl-terminated oligomers that function as soft segments [40,41]. They are employed directly as polyols for the production of waterborne PUs because of several useful properties such as good mechanical strength, high melting point, and easy processability [42,43]. Both polycaprolactone and polylactic acid are a linear aliphatic thermoplastic polyester. The body filler layers utilized in this study are polyester based. Hence, it is envisaged that they are extremely compatible with each other and the strong covalent bonds exists between them, which results in very good coating adherence to the substrate. This was evident when coatings were subjected to the crosshatch cut adhesion test in accordance with the ASTM D3359 standard. The coatings were found to be entirely intact at all corners and edges of the cut, and received the maximum rating of 5B. Figure 8 depicts a typical image of a PUCMF 5 wt.% coating after a crosshatch cut adhesion test.

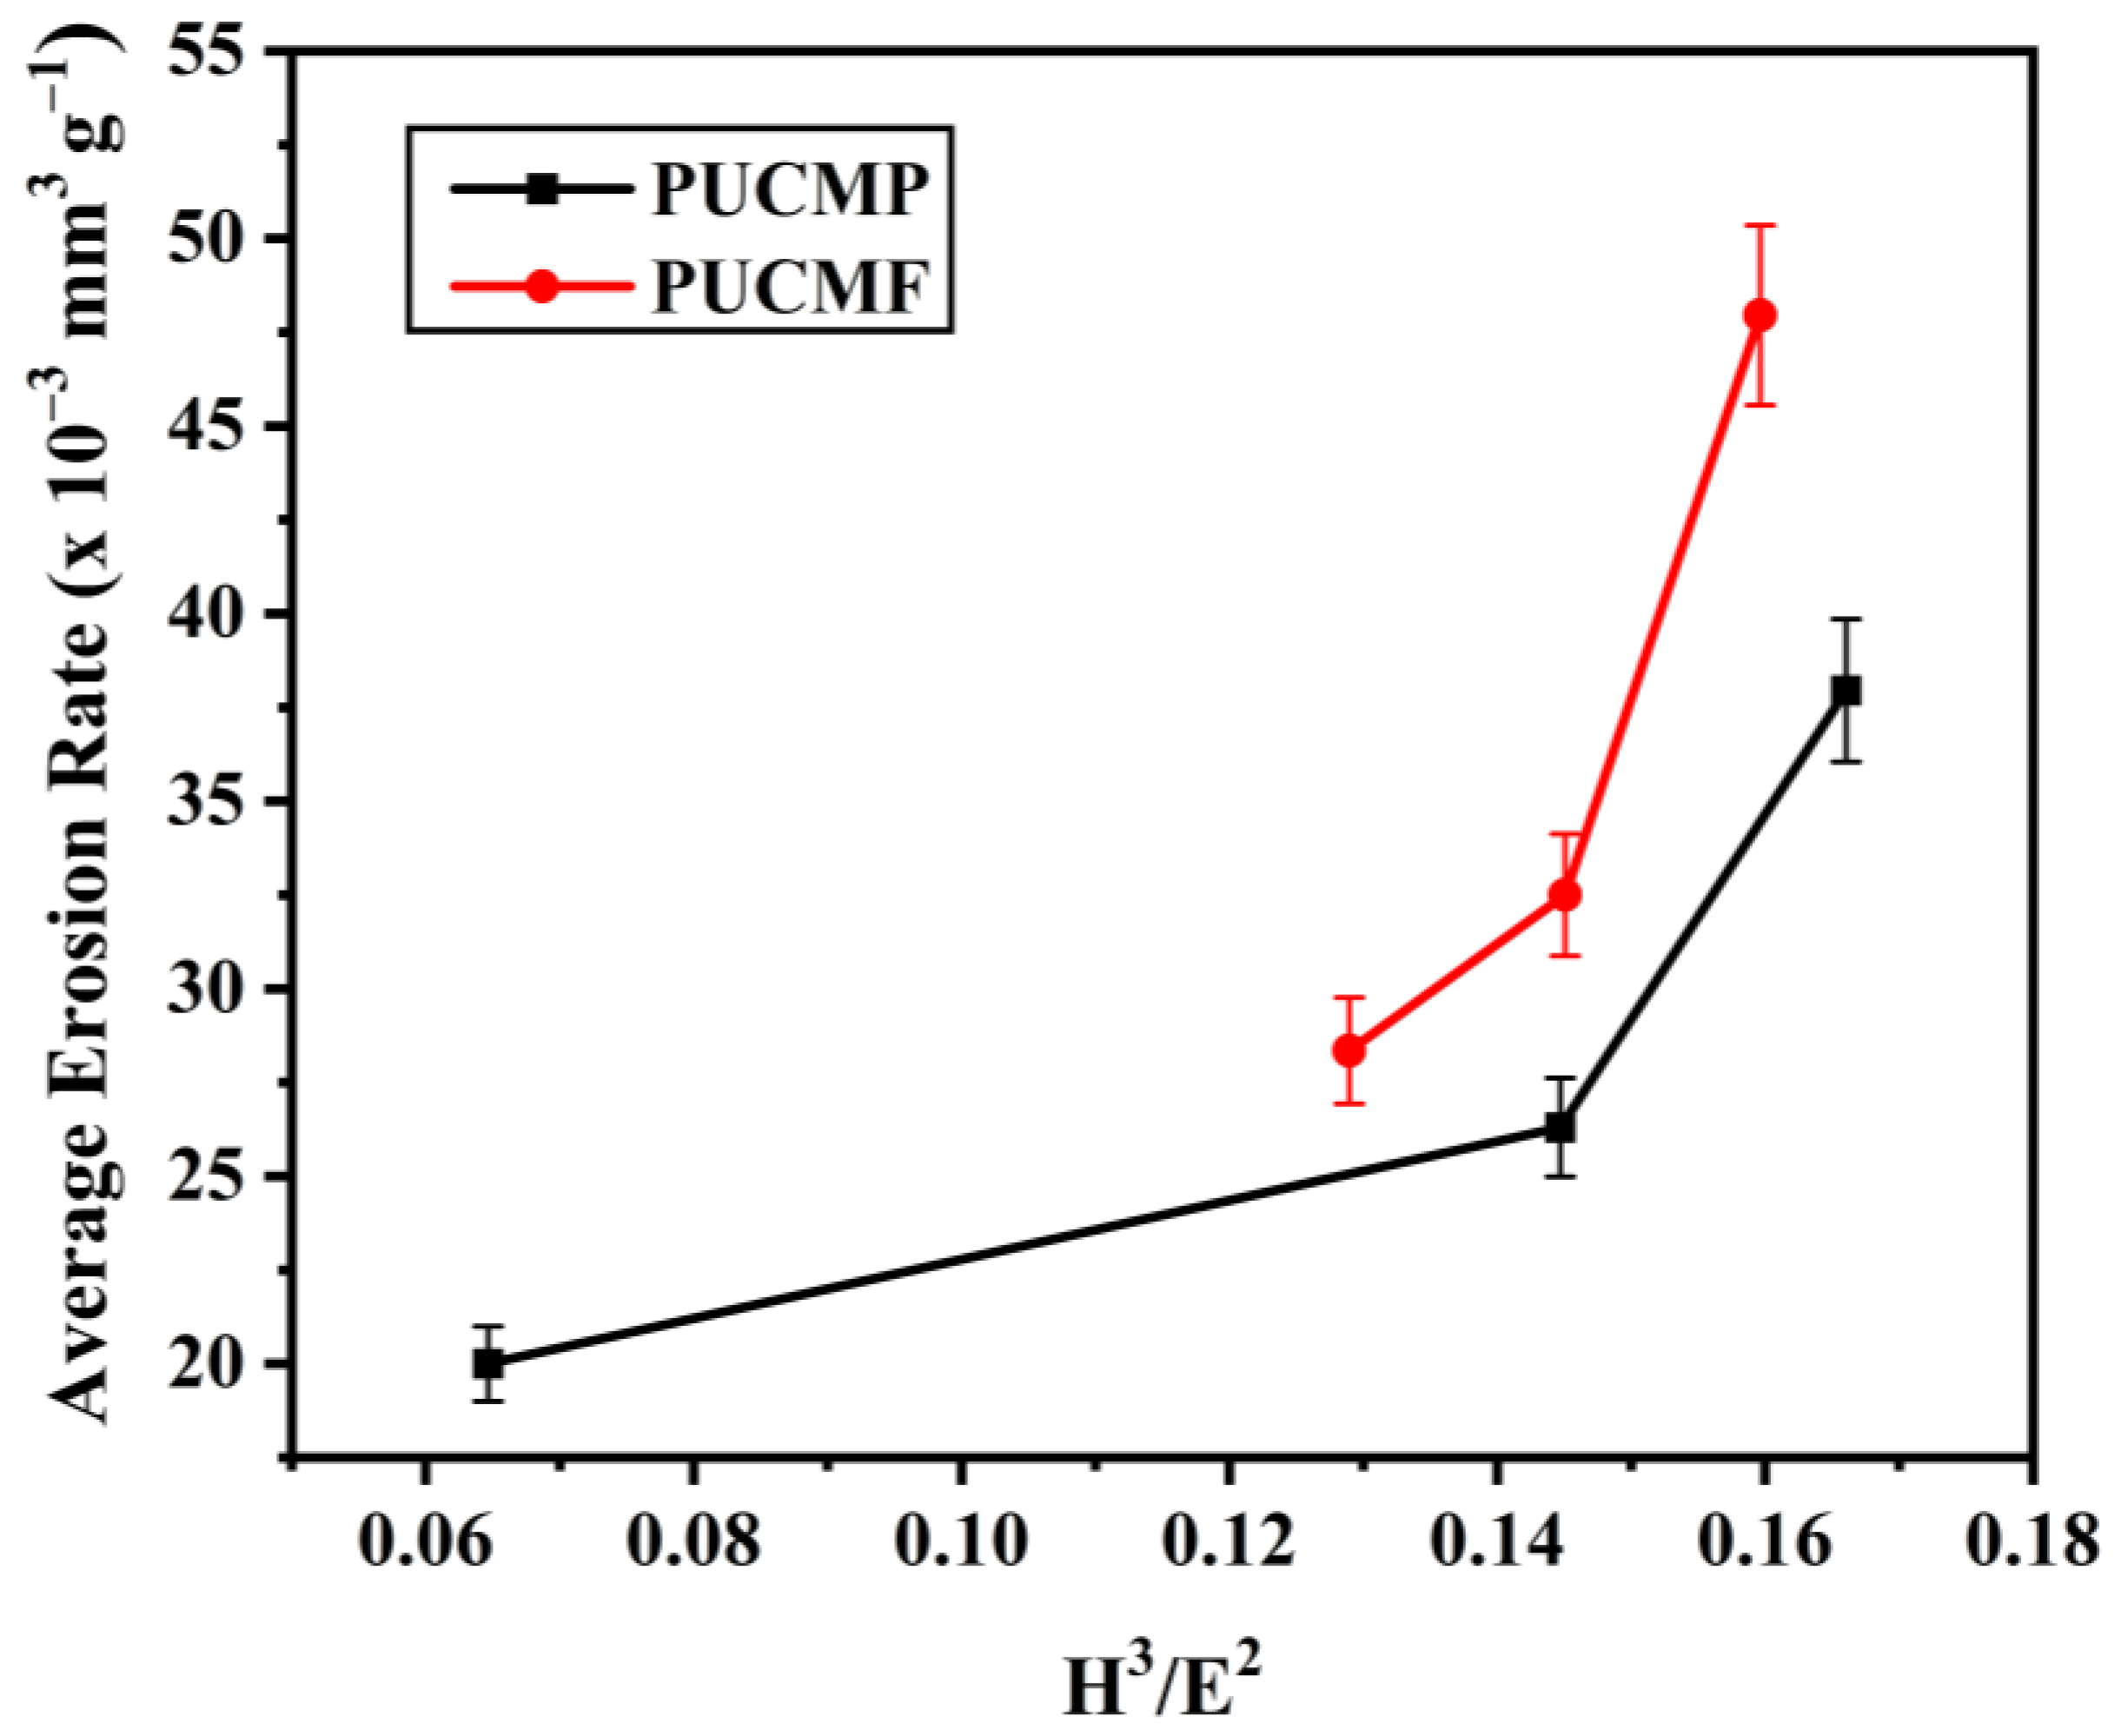
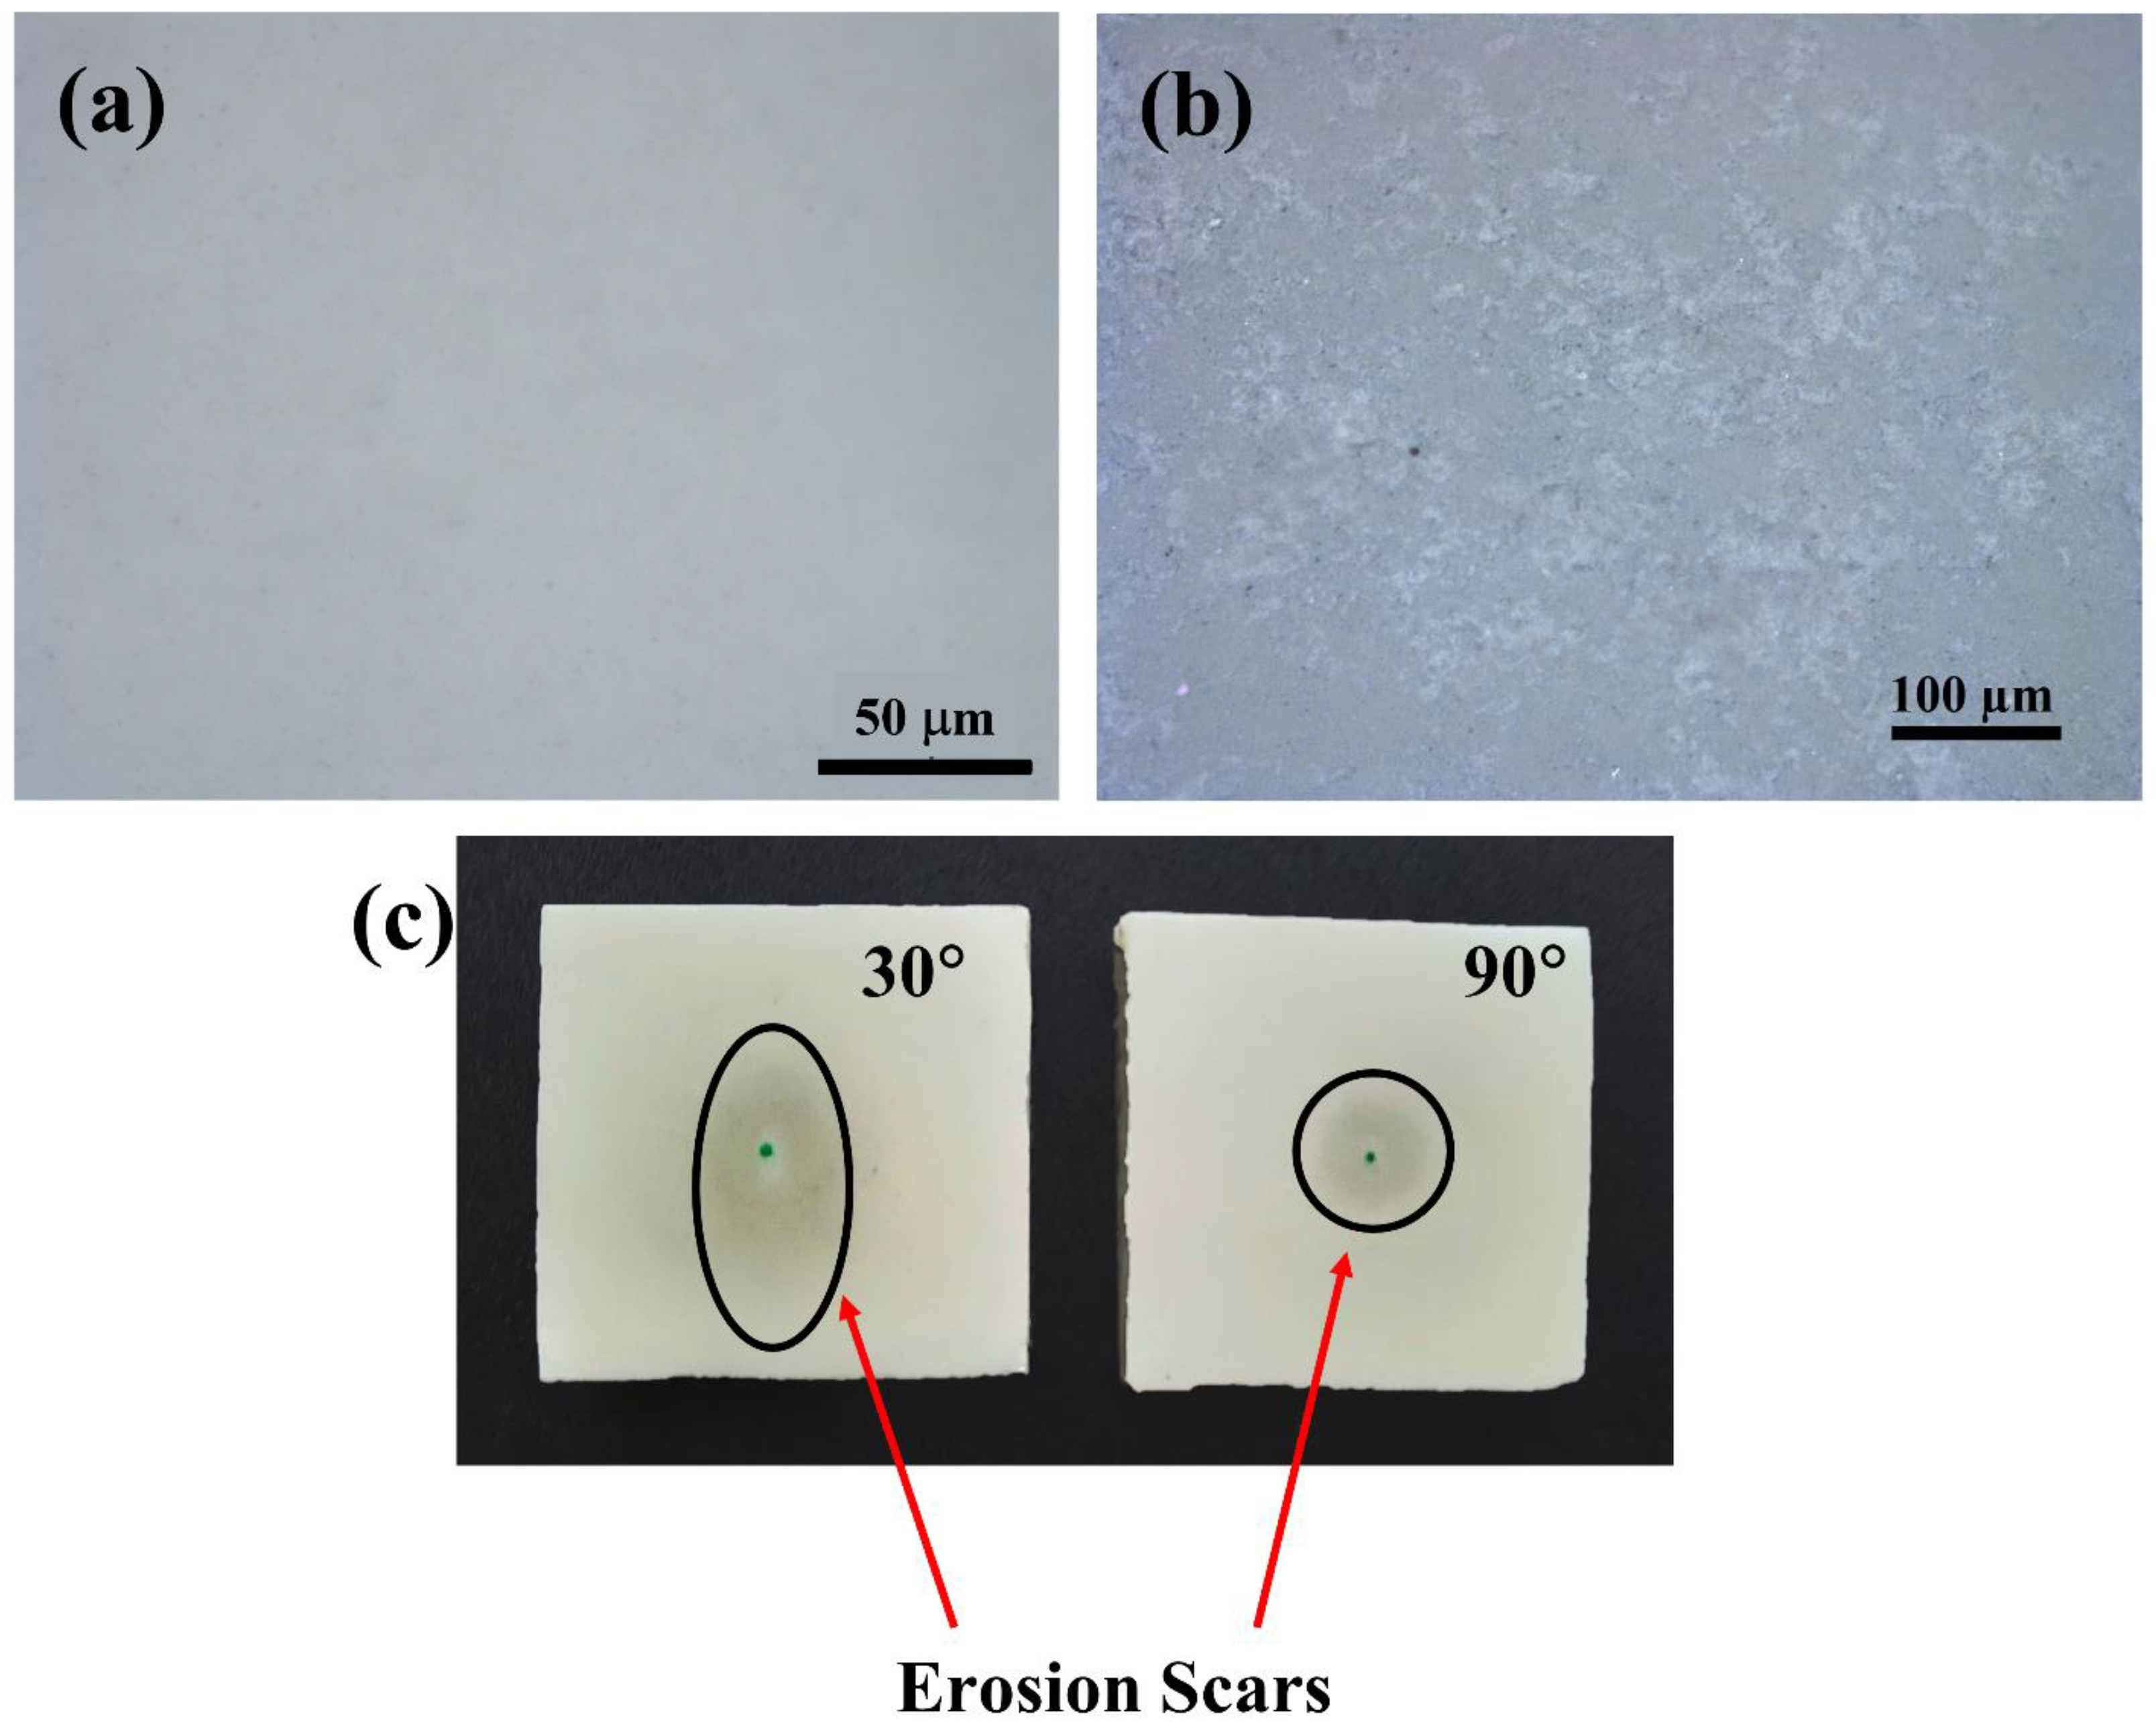
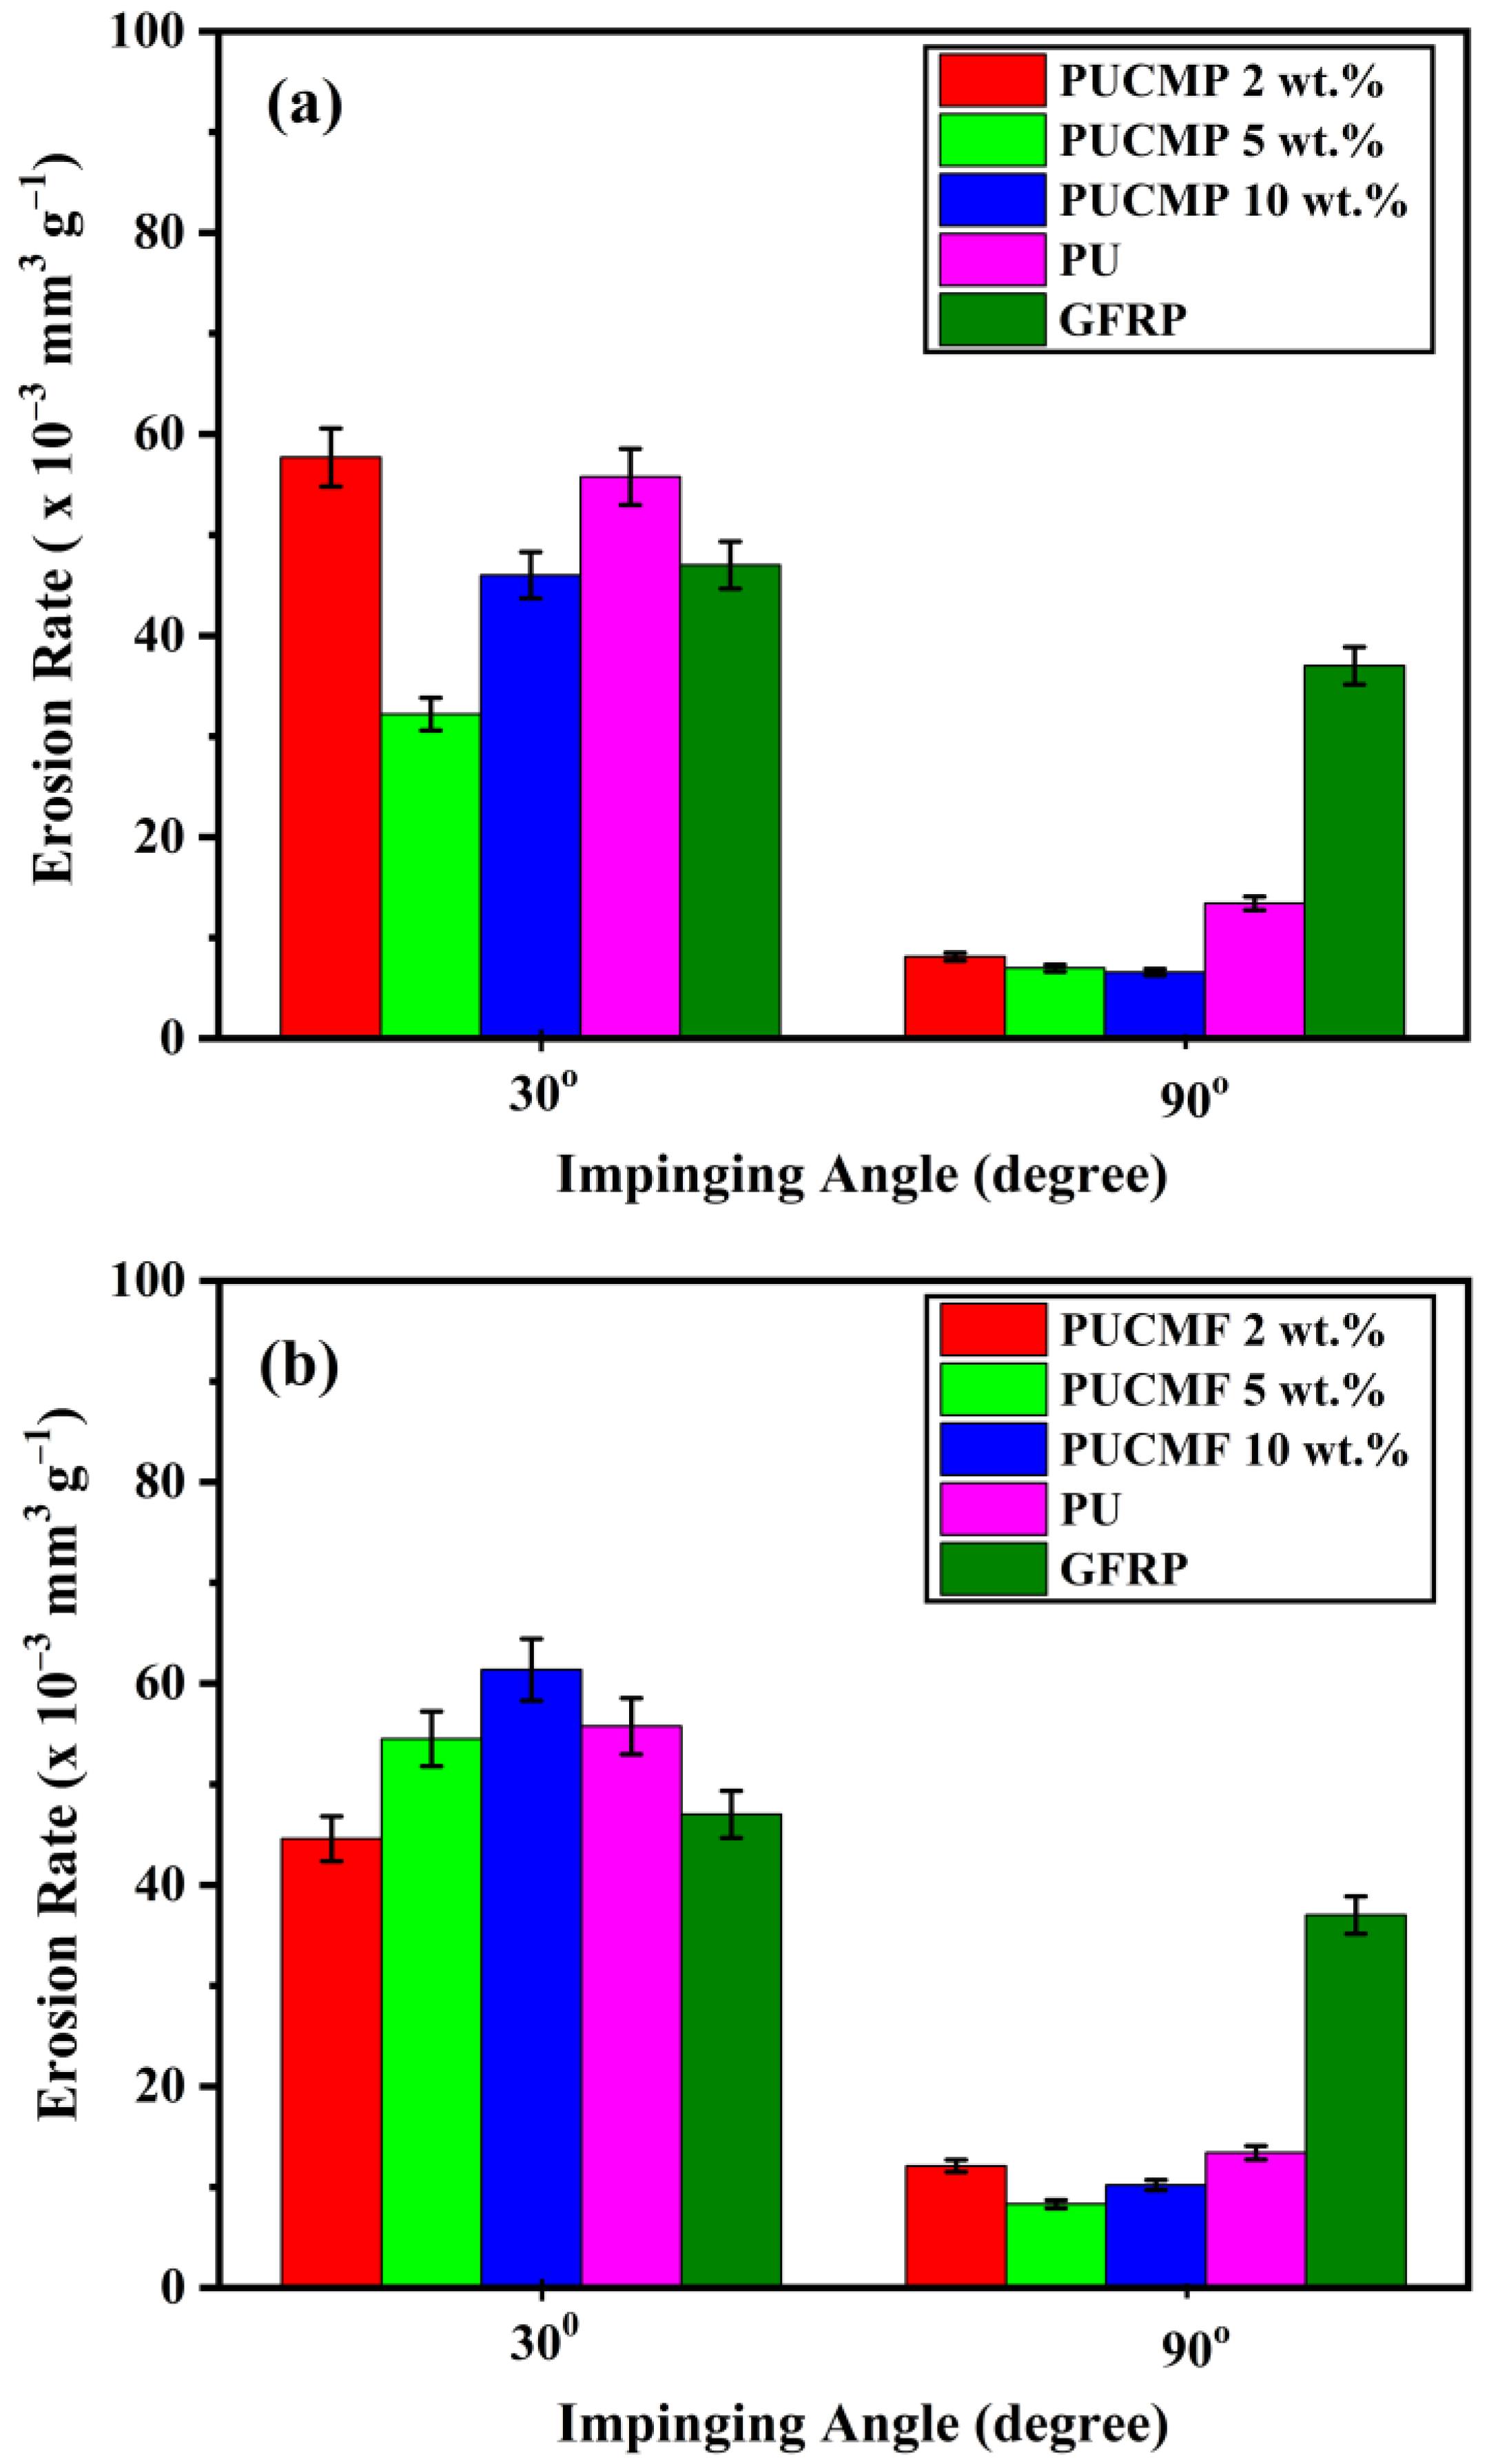
3.3. SPE Performances of Coatings

SPE tests have been carried out on composite PU coatings as well as unmodified PU coatings and bare GFRP substrates, in accordance with the ASTM G-76 standard, in ambient conditions. The average wind speed in India is 6 m s−1 at 100 m above the ground level, which is the average height of commercial wind turbines [44]. However, to make the erosion condition severe, erosion experiments have been carried out with an erodent speed of 30 m s−1. A literature survey reveals that for ductile materials maximum erosion occurs at 30°, whereas minimum erosion is at 90° [20,21,22,45]. Hence, all coatings have been evaluated for impact angles of 30° and 90°. Four identical sets of all coatings were examined to ensure data reproducibility. Figure 9a,b show optical microscopic images of as-prepared and SPE-tested coatings, respectively. Figure 9c depicts typical images of erosion scars of PUCMF 5 wt.% at impinging angles of 30° and 90°. As revealed by the optical images as shown in Figure 9, the as-prepared coating is smooth and has no defects, whereas small crater-like features are observed on the SPE-tested coating. This shows the plastic cutting of the coating due to the impacts of the erodent. The nonappearance of cracks confirms the ductile cutting mechanism. Depending on the impact angle, an alumina erodent impact disinters the coating, affecting the material loss and the appearance of the scar. An elliptical scar is observed for a 30° impact angle, whereas for a 90° impact angle scar shape is circular. Figure 10a,b show the typical 3D profiles of erosion scars of PUCMF 5 wt.% coatings for 30° and 90° impact angles. Profiles reveal that the shape of the erosion scar for a 30° impact angle is an elliptical cone, whereas for a 90° impact angle it is a circular cone. In a soft polymeric coating, erodent particles can get embedded into the coating during the SPE test and can show weight gain after testing. Hence, in this study material loss has been assessed by volume loss instead of weight loss. Volume losses have been calculated from 2D profiles of erosion scars. Figure 11 represents typical 2D profiles of the erosion scars of PUCMP 2 wt.% for 30° and 90° impact angles. As shown in Figure 11a,b, two 2D scans have been obtained along the short and long axis of elliptical erosion scars for a 30° impinging angle. To calculate the volume of elliptical erosion scar,  1 3 π r 1 r 2 h  is used, where r1 is the minor radius, r2 is the major radius, and h is height. Similarly, for a circular cone scar (90° impinging angle), a 2D scan recorded along the diameter of the scar is displayed in Figure 11c and the formula,  1 3 π r 2 h  is used to calculate the volume of the erosion scar, where r is the radius of the cone and h is the height of the cone. Erosion rates (ER) are calculated from volume loss per gram of erodent. A comparison of the erosion rates of PUCMP and PUCMF coatings at varied cellulose concentrations to the erosion rates of unmodified PU and bare GFRP is presented in Figure 12a,b, respectively. In comparison to the 90° impinging angle, the erosion rates of the coatings are higher at 30°. This is understandable, considering the ductile nature of the coatings. For ductile materials, material loss is higher at lower impinging angles compared to the normal angle [46,47]. In the case of PUCMP coatings, for a 30° impinging angle erosion rates of coatings with 2 wt.% loading and unmodified PU are comparable and coatings with 5 wt.% loading are observed to perform better than all other coatings. In contrast, for a 90° impinging angle, all PUCMP coatings outperform unmodified PU and bare GFRP. For PUCMF coatings it is observed that at a 30° impinging angle the erosion rate decreases with lower filler concentration. The PUCMF coating with 2 wt.% filler concentration is found to be the best performing PUCMF coating. On the other hand, at a 90° impact angle, the performances of all PUCMF coatings are comparable to unmodified PU coatings. To optimize the CMF filler concentration, PUCMF coatings with 1 wt.% loading have also been tested for SPE. It is found that erosion rates for both 30° and 90° impinging angles are comparable to the unmodified PU coatings.
PUCMF coatings exhibit similar behaviour to PUCMP coatings but for lower filler concentration. This can be attributed to the difference in the morphology of cellulose. In CMF, a higher surface-to-volume ratio influences the critical filler concentration. In a recent study, Pathak et al. have observed similar behaviour in ceramic oxide-reinforced water-based PU coatings [19]. Higher filler concentration may affect the integrity of coatings and leads to higher volume loss.
Wind turbine blades are susceptible to erodent impacts from all directions. As a result, it is critical that coatings protect wind turbine blades from all impact angles. The ductile coatings exhibit the maximum erosion rate at 30° and a minimum at 90°. Therefore, to obtain a better understanding of the erosion performance of coatings, the average erosion rates have been calculated. Table 1 presents the obtained results. From the table, it can be concluded that PUCMP coatings with 5 wt.% and 10 wt.%, and the PUCMF coating with 2 wt.% are the best performing coatings. These coatings have demonstrated 20–40% lower erosion rates in comparison with unmodified PU and 30–50% lower rates than bare GFRP. Overall PUCMP coatings have shown better SPE performances compared to PUCMF, which can be attributed to the higher hydrogen bond density observed in DTG studies.
Nanoindentation studies have been carried out to understand the mechanical properties of coatings. Figure 13 depicts the typical loading–unloading curves of coatings. The maximum load applied was 10 mN and indentation depth was kept between 1 to 6 μm to avoid errors associated to lower indentation depth. The Oliver–Pharr method has been used to calculate the hardness (H) and elastic modulus (E) of the coatings [48]. All the coatings show hardness values in the range of 19 to 43 MPa and an elastic modulus ranging between 340 to 750 MPa. The ratio of H3/E2 has been demonstrated to be a useful value that characterizes the mechanical behaviour of coatings. Researchers have proposed the ratio H3/E2 as a proxy for the SPE test of materials [49]. H3/E2 represents the resistance to plastic deformation. In the case of soft polymeric coating systems, plastic deformation plays a role in SPE. In coatings with lower plastic deformation resistance, erodent impact energy gets easily dissipated. Hence, it is expected that the erosion rate would be lower for lower values of H3/E2 [20,50]. Figure 14 displays plots of H3/E2 vs. the average erosion rates of coatings. It can be observed that the average erosion rate increases with increasing H3/E2 values for both PUCMP and PUCMF coatings. It is expected as both types of coatings are polymeric and show a plastic cutting mechanism as mentioned earlier. PUCMF coatings have higher erosion rates compared to PUCMP coatings, even though they have similar H3/E2 values. This may be due to the difference in the morphology of fillers, which leads to different packing densities. Godfrey and co-authors also observed an increase in erosion rates with an increase in plasticity index for commercial PU-based coatings [20]. Hence, the H3/E2 index can be used to predict the SPE behaviour of coatings.
The usage of eco-friendly materials for turbine blades and coatings and recycling/reusing turbine waste materials are crucial for wind energy to become a perfect clean energy source. Accordingly, in the present study, cellulose microparticles and microfibers have been used as filler materials for water-based PU resin to develop protective coatings against SPE for a wind turbine blade for the first time. Chemical characterization shows the chemical similarity of CMP and CMF samples, which confirms that PU-cellulose bonding does not play any role in determining critical filler concentration in the PU matrix. However, the difference in packing density due to changes in morphology is the main reason for CMP and CMF having different critical filler concentrations. Superior SPE performances of coatings for 5 and 10 wt.% CMP, and 2 wt.% CMF, indicate that these coatings give excellent protection against SPE for wind turbine blades. A nanoindentation study and correlation of H3/E2 with the average erosion rate will be helpful for a simulation to develop a more realistic coating for wind turbine blade protection. It has been observed that low resistance to plastic deformation (lower H3/E2) increases the capacity of coatings to absorb and dissipate external impacts. This property also renders these coatings potential candidates for rain erosion resistance. Further, the water-based PU coatings obviously have low VOC content and are eco-friendly in nature, which make these protective coatings crucial for the wind turbine industry. This strategy helps in reducing the emission of toxic chemicals into the environment as well as increasing the blade life, which is critical to control solid waste generation from decommissioned blades. This will give a boost to wind energy allowing it to be a perfectly clean source of energy.

4. Conclusions

Water-based PU-composite coatings have been prepared using commercially procured CMP and CMF by a simple spray method. The physio-chemical characterization of CMP, CMF, and their coatings have been carried out by FESEM, FTIR, TGA, and XPS. FESEM studies show the fiber-like morphology of CMF has a width of 10 µm and an average length of 40 µm, whereas CMP has a spherical morphology with diameter of 10 µm. In the FTIR spectra of CMP and CMF, characteristic peaks of cellulose in the 3230–3280 and 1310–1330 cm−1 frequency ranges are observed. Peaks between 1000–1200 cm−1 are related to C–O–C stretching and C–O vibrations. In the FTIR spectra of coatings, peaks related to the N–H vibration of the urethane group are found at 1556 and 3442 cm−1. The C=O stretching of the urethane group leads to a sharp peak at 1727 cm−1, whereas peaks located between 2870–2960 cm−1 are attributed to the C–H stretching of alkanes. The TGA of CMP and CMF reveals that the onset temperature of CMP is higher compared to CMF, being 289 °C and 243 °C, respectively. The DTG curves show higher decomposition temperatures for CMP and CMF, 382 °C and 340 °C, respectively. This explains the higher cellulose order and packing, as well as higher hydrogen bond intensity. All chemical characterizations confirm that CMP and CMF are chemically identical and PU-cellulose bonding does not play any major role in the critical filler concentration of CMP and CMF. Cellulose-reinforced coatings show excellent adhesion in the crosshatch cut test with 5B ratings (the highest). Cellulose reinforcement improves the SPE resistance of coatings. PUCMP of 5 wt.% and 10 wt.%, and PUCMF of 2 wt.% are found to be best performing coatings against SPE. The relatively poor performance of PUCMF 10 wt.% coating can be associated with the fiber-like morphology of CMF, which leads to different dispersion behaviour, thus impacting the critical filler concentration in the PU. The average erosion rates of all the cellulose-based coatings are comparable, except PUCMF 10 wt.%. PUCMP 5 wt.% coatings demonstrate the lowest average erosion rate of 20 × 10−3 mm3 g−1. In contrast, unmodified PU and bare GFRP substrate exhibit average erosion rates of 34.4 and 42 × 10−3 mm3 g−1, respectively. The difference in the critical filler concentration can be attributed to the difference in morphologies of CMP and CMF. Nanoindentation studies have revealed that the hardness and elastic modulus values of the coatings are in the ranges of 19–43 and 340–750 MPa, respectively. The correlation between H3/E2 and average erosion rates leads to the conclusion that the coatings with lower H3/E2 values exhibit a lower average erosion rate. Therefore, these cellulose-based composite coatings are potential candidates for the protection of wind turbine blades against solid particle impact as well as rain erosion. This pioneering research and development work advocates an eco-friendly approach towards coating development for wind turbine blade protection.

Author Contributions

Conceptualization, R.V.L. and P.B.; methodology, S.M.P., R.V.L. and P.B.; formal analysis, S.M.P., V.B., R.V.L. and P.B.; investigation, S.M.P., V.P.K., V.B., R.V.L. and P.B.; resources, L.M.J. and H.C.B.; data curation, S.M.P., R.V.L. and P.B.; writing—original draft preparation, S.M.P.; writing—review and editing, V.B., R.V.L., P.B. and H.C.B.; project administration, H.C.B.; funding acquisition, L.M.J. and H.C.B. All authors have read and agreed to the published version of the manuscript.

Funding

The authors gratefully acknowledge the financial support of the Ministry of Foreign Affairs of Denmark in the framework of Danida grant, 19-M02-DTU (Maintenance and Repair Strategy for Wind Energy Development). L.M.J. is grateful to the Innovation Foundation of Denmark for the support in the framework of the Grand Solutions project DURALEDGE, Durable leading edges for high tip speed wind turbine blades, File nr.: 8055-00012A.

Institutional Review Board Statement

Not applicable.

Informed Consent Statement

Not applicable.

Data Availability Statement

The data presented in this study are available on request from the corresponding authors.

Acknowledgments

The authors wish to thank the Director of CSIR–NAL for his support and encouragement. The authors are grateful to G. Kamalakannan, Manabendra De, and A. P. Chandran for fruitful discussion and for supplying GFRP substrates. The authors wish to thank M. Muniprakash, S. Jaikesh, G. Srinivas, Siju John, and N. T. Manikandanath for optical images, substrate preparation, FTIR, FESEM, and TGA, respectively.

Conflicts of Interest

The authors declare no conflict of interest.

References

  1. IRENA. Renewable Capacity Statistics 2021; International Renewable Energy Agency (IRENA): Abu Dhabi, United Arab Emirates, 2021. [Google Scholar]
  2. Gielen, D.; Boshell, F.; Saygin, D.; Bazilian, M.D.; Wagner, N.; Gorini, R. The role of renewable energy in the global energy transformation. Energy Strategy Rev. 2019, 24, 38–50. [Google Scholar]
  3. Liu, P.; Barlow, C.Y. Wind turbine blade waste in 2050. Waste Manag. 2017, 62, 229–240. [Google Scholar] [CrossRef]
  4. Song, Y.S.; Youn, J.R.; Gutowski, T.G. Life cycle energy analysis of fiber reinforced composites. Compos. Part A Appl. Sci. Manuf. 2009, 40, 1257–1265. [Google Scholar]
  5. Ortegon, K.; Nies, L.F.; Sutherland, J.W. Preparing for end of service life of wind turbines. J. Clean Prod. 2012, 39, 191–199. [Google Scholar]
  6. Pickering, S.J. Recycling technologies for thermoset composite materials—Current status. Compos. Part A Appl. Sci. Manuf. 2006, 37, 1206–1215. [Google Scholar]
  7. Job, S. Recycling glass fibre reinforced composites—History and progress. Reinforc. Plast. 2013, 57, 19–23. [Google Scholar]
  8. Lichtenegger, G.; Rentizelas, A.A.; Trivyza, N.; Siegl, S. Offshore and onshore wind turbine blade waste material forecast at a regional level in Europe until 2050. Waste Manag. 2020, 106, 120–131. [Google Scholar]
  9. Chen, J.; Wang, J.; Ni, A. Recycling and reuse of composite materials for wind turbine blades: An overview. J. Reinf. Plast. Compos. 2019, 38, 567–577. [Google Scholar] [CrossRef]
  10. Rani, M.; Choudhary, P.; Krishnan, V.; Zafar, S. A review on recycling and reuse methods for carbon fiber/glass fiber composites waste from wind turbine blades. Compos. Part B Eng. 2021, 215, 108768. [Google Scholar] [CrossRef]
  11. Mishnaevsky, L., Jr.; Branner, K.; Petersen, H.N.; Beauson, J.; McGugan, M.; Sørensen, B.F. Materials for wind turbine blades: An overview. Materials 2017, 10, 1285. [Google Scholar]
  12. Petrauskaite, E.; Vaiskunaite, R.; Blumberga, D.; Ivanovs, K. Experimental study of droplet biofilter packed with green sphagnum to clean air from volatile organic compounds. Energy Procedia 2017, 128, 373–378. [Google Scholar] [CrossRef]
  13. Liu, J.; Zheng, G. Emission of volatile organic compounds from a small-scale municipal solid waste transfer station: Ozone-formation potential and health risk assessment. Waste Manag. 2020, 106, 193–202. [Google Scholar] [PubMed]
  14. Jiménez-López, A.M.; Hincapié-Llanos, G.A. Identification of factors affecting the reduction of VOC emissions in the paint industry: Systematic literature review—SLR. Prog. Org. Coat. 2022, 170, 106945. [Google Scholar] [CrossRef]
  15. Boopathi, K.; Mishnaevsky, L., Jr.; Sumantraa, B.; Premkumar, S.A.; Thamodharan, K.; Balaraman, K. Failure mechanisms of wind turbine blades in India: Climatic, regional, and seasonal variability. Wind Energy 2022, 25, 968–979. [Google Scholar] [CrossRef]
  16. Mishnaevsky, L., Jr.; Hasager, C.B.; Bak, C.; Tilg, A.-M.; Bech, J.I.; Rad, S.D.; Fæster, S. Leading edge erosion of wind turbine blades: Understanding, prevention and protection. Renew. Energy 2021, 169, 953–969. [Google Scholar] [CrossRef]
  17. Ashrafizadeh, H.; Mertiny, P.; McDonald, A. Evaluation of the effect of temperature on mechanical properties and wear resistance of polyurethane elastomers. Wear 2016, 368–369, 26–38. [Google Scholar] [CrossRef]
  18. Gupta, R.; Kumar, A.; Kumer, A. Fundamentals of Polymers, International Editions; McGraw Hill: Singapore, 1988. [Google Scholar]
  19. Pathak, S.M.; Kumar, V.P.; Bonu, V.; Latha, S.; Mishnaevsky, L., Jr.; Lakshmi, R.V.; Bera, P.; Barshilia, H.C. Solid particle erosion studies of ceramic oxides reinforced water-based PU nanocomposite coatings for wind turbine blade protection. Ceram. Int. 2022, 48, 35788–35798. [Google Scholar] [CrossRef]
  20. Godfrey, M.; Siederer, O.; Zekonyte, J.; Barbaros, I.; Wood, R. The effect of temperature on the erosion of polyurethane coatings for wind turbine leading edge protection. Wear 2021, 476, 203720. [Google Scholar] [CrossRef]
  21. Alajmi, A.F.; Ramulu, M. Solid particle erosion of graphene-based coatings. Wear 2021, 476, 203686. [Google Scholar] [CrossRef]
  22. Mishra, P.; Acharya, S.K. Solid particle erosion of Bagasse fiber reinforced epoxy composite. Int. J. Phys. Sci. 2010, 5, 109–115. [Google Scholar]
  23. Gupta, A.; Kumar, A.; Patnaik, A.; Biswas, S. Effect of filler content and alkalization on mechanical and erosion wear behavior of CBPD filled bamboo fiber composites. J. Surf. Eng. Mater. Adv. Technol. 2012, 2, 149–157. [Google Scholar] [CrossRef]
  24. Ramadan, N.; Taha, I.; Hammouda, R.; Abdellatif, M.H. Behaviour of hybrid SiC/jute epoxy composites manufactured by vacuum assisted resin infusion. Polym. Polym. Compos. 2017, 25, 333–344. [Google Scholar]
  25. Das, G.; Biswas, S. Erosion wear behavior of coir fiber-reinforced epoxy composites filled with Al2O3 filler. J. Ind. Text. 2017, 47, 472–488. [Google Scholar] [CrossRef]
  26. Aziz, T.; Farid, A.; Haq, F. A review on the modification of cellulose and its applications. Polymers 2022, 14, 3206. [Google Scholar] [PubMed]
  27. Cherian, R.M.; Tharayil, A.; Varghese, R.T. A review on the emerging applications of nano-cellulose as advanced coatings. Carbohydr. Polym. 2022, 282, 119123. [Google Scholar]
  28. Scrinzi, E.; Rossi, S.; Deflorian, F.; Zanella, C. Evaluation of aesthetic durability of waterborne polyurethane coatings applied on wood for interior applications. Prog. Org. Coat. 2011, 72, 81–87. [Google Scholar]
  29. He, Y.; Pang, Y.; Liu, Y.; Li, X.; Wang, K. Physicochemical characterization of rice straw pretreated with sodium hydroxide in the solid state for enhancing biogas production. Energy Fuels 2008, 22, 2775–2781. [Google Scholar]
  30. Popescu, M.C.; Popescu, C.M.; Lisa, G.; Sakata, Z. Evaluation of morphological and chemical aspects of different wood species by spectroscopy and thermal methods. J. Mol. Struct. 2011, 988, 65–72. [Google Scholar] [CrossRef]
  31. Maheswari, C.U.; Reddy, K.O.; Muzenda, E.; Guduri, B.R.; Rajulu, A.V. Extraction and characterization of cellulose microfibrils from agricultural residue–Cocos nucifera L. Biomass Bioenergy 2012, 46, 555–563. [Google Scholar] [CrossRef]
  32. Reddy, J.P.; Rhim, J.-W. Extraction and characterization of cellulose microfibers from agricultural waste of onion and garlic. J. Nat. Fibers 2018, 15, 465–473. [Google Scholar]
  33. Pappas, C.; Trarantilis, P.A.; Daliani, I.; Mavromoustakos, T.; Polissiou, M. Comparison of classical and ultrasound-assisted isolation procedures of cellulose from kenaf (Hibiscus cannabinus L.) and eucalyptus (Eucalyptus rodustrus Sm.). Ultrason. Sonochem. 2002, 9, 19–23. [Google Scholar] [PubMed]
  34. Bahadur, A.; Shoaib, M.; Saeed, A.; Iqbal, S. FT-IR spectroscopic and thermal study of waterborne polyurethane-acrylate leather coatings using tartaric acid as an ionomer. E-Polymers 2016, 16, 463–474. [Google Scholar]
  35. Poletto, M.; Pistor, V.; Marlene, R.; Santana, R.M.C.; Zattera, A.J. Materials produced from plant biomass. Part II: Evaluation of crystallinity and degradation kinetics of cellulose. Mater. Res. 2012, 15, 421–427. [Google Scholar]
  36. Yang, H.; Yan, R.; Chen, H.; Zheng, C.; Lee, D.H.; Liang, D.T. In-depth investigation of biomass pyrolysis based on three major components: Hemicellulose, cellulose and lignin. Energy Fuels 2006, 20, 388–393. [Google Scholar]
  37. Azadfar, M.; Wolcott, M.P. Surface characterization of powdered cellulose activated by potassium hydroxide in dry condition through ball milling. Polysaccharides 2020, 1, 80–89. [Google Scholar]
  38. Haensel, T.; Comouth, A.; Lorenz, P.; Ahmed, S.I.-U.; Krischok, S.; Zydziak, N.; Kauffmann, A.; Schaefer, J.A. Pyrolysis of cellulose and lignin. Appl. Surf. Sci. 2009, 255, 8183–8189. [Google Scholar] [CrossRef]
  39. Cagniant, D.; Magri, P.; Gruber, R.; Berlozecki, S.; Salbut, P.D.; Bimer, J.; Nansé, G. Ammoxidation of cellulose—A structural study. J. Anal. Appl. Pyrol. 2002, 65, 1–23. [Google Scholar]
  40. Ajili, S.H.; Ebrahimi, N.G.; Soleimani, M. Polyurethane/polycaprolactane blend with shape memory effect as a proposed material for cardiovascular implants. Acta Biomater. 2009, 5, 1519–1530. [Google Scholar] [CrossRef]
  41. Imre, B.; Bedó, D.; Domján, A.; Schön, P.; Vancso, G.J.; Pukánszky, B. Structure, properties and interfacial interactions in poly(lactic acid)/polyurethane blends prepared by reactive processing. Eur. Polym. J. 2013, 49, 3104–3113. [Google Scholar]
  42. Haq, R.H.A.; Wahab, M.S.; Wahit, M.U. Improvement of mechanical properties of polycaprolactone (PCL) by addition of nano-montmorillonite (MMT) and hydroxyapatite (HA). Appl. Mech. Mater. 2013, 315, 815–819. [Google Scholar]
  43. Yao, S.-S.; Pang, Q.-Q.; Song, R.; Jin, F.-L.; Park, S.-J. Fracture toughness improvement of poly(lactic acid) with silicon carbide whiskers. Macromol. Res. 2016, 24, 961–964. [Google Scholar] [CrossRef]
  44. Global Wind Atlas. Wind Atlas of India. Available online: https://globalwindatlas.info/area/India (accessed on 17 January 2023).
  45. Finnie, I. Some reflections on the past and future of erosion. Wear 1995, 186–187, 1–10. [Google Scholar]
  46. Ivosevic, M.; Knight, R.; Kalidindi, S.R.; Palmese, G.R.; Sutter, J.K. Solid particle erosion resistance of thermally sprayed functionally graded coatings for polymer matrix composites. Surf. Coat. Technol. 2006, 200, 5145–5151. [Google Scholar] [CrossRef]
  47. Borawski, B.; Todd, J.A.; Singh, J.; Wolfe, D.E. The influence of ductile interlayer material on the particle erosion resistance of multilayered TiN based coatings. Wear 2011, 271, 2890–2898. [Google Scholar] [CrossRef]
  48. Oliver, W.C.; Pharr, G.M. An improved technique for determining hardness and elastic modulus using load and displacement sensing indentation experiments. J. Mater. Res. 1992, 7, 1564–1583. [Google Scholar] [CrossRef]
  49. Bousser, E.; Martinu, L.; Klemberg-Sapieha, J.E. Solid particle erosion mechanisms of protective coatings for aerospace applications. Surf. Coat. Technol. 2014, 257, 165–181. [Google Scholar]
  50. Chen, X.; Du, Y.; Chung, Y.-W. Commentary on using H/E and H3/E2 as proxies for fracture toughness of hard coatings. Thin Solid Films 2019, 688, 137265. [Google Scholar]
Figure 1. Development of coating: (a) schematic diagram of coating layers and (b) a typical image of a developed coating.
Energies 16 01730 g001
Figure 2. Photograph of air-jet erosion tester facility.
Energies 16 01730 g002
Figure 3. FESEM images of (a) CMP and (b) CMF.
Energies 16 01730 g003
Figure 4. FTIR spectra of CMP and CMF powders.
Energies 16 01730 g004
Figure 5. FTIR spectra of PU, PUCMP (10 wt.%), and PUCMF (10 wt.%) coatings.
Energies 16 01730 g005
Figure 6. (a) TGA and (b) DTG profiles of CMP and CMF powders.
Energies 16 01730 g006
Figure 7. C 1s and O 1s core level spectra of CMF and CMF coating (PUCMF 10 wt.%).
Energies 16 01730 g007
Figure 8. A typical optical image of PUCMF 5 wt.% coating after crosshatch adhesion test.
Energies 16 01730 g008
Figure 9. Optical microscopic images of PUCMF 5 wt.% coating: (a) as-prepared (b) after SPE test, and (c) images of erosion scars at 30° and 90° erodent angles.
Energies 16 01730 g009
Figure 10. Three-dimensional top views and side views of erosion scars of PUCMF 5 wt.% coating for (a) 30° impact angle and (b) 90° impact angle.
Energies 16 01730 g010
Figure 11. 2D profile scans of erosion scars of PUCMP 2 wt.% for (a) 30° along long axis, (b) 30° along short axis, and (c) 90° along diameter.
Energies 16 01730 g011
Figure 12. SPE performances of (a) PUCMP and (b) PUCMF coatings for different filler concentrations at 30° and 90° impinging angles.
Energies 16 01730 g012
Figure 13. Nanoindentation loading–unloading curves of (a) PUCMP 5 wt.% and (b) PUCMF 2 wt.% coatings.
Energies 16 01730 g013
Figure 14. Plots of average erosion rate vs. H3/E2 of PUCMP and PUCMF coatings.
Energies 16 01730 g014
Table 1. Average erosion rates of PUCMP, PUCMF, and PU coatings with varied cellulose concentrations along with GFRP substrate.
CoatingsAverage Erosion Rate (×10−3 mm3 g−1)
(Average of Erosion Rates at 30° and 90°)
2 wt.%5 wt.%10 wt.%
PUCMP37.92026.5
PUCMF28.332.535.8
PU34.4
GFRP42
Disclaimer/Publisher’s Note: The statements, opinions and data contained in all publications are solely those of the individual author(s) and contributor(s) and not of MDPI and/or the editor(s). MDPI and/or the editor(s) disclaim responsibility for any injury to people or property resulting from any ideas, methods, instructions or products referred to in the content.

