1. Introduction
Reducing carbon emissions and our overall carbon footprint is one of the biggest challenges facing humanity in the current millennium [
1]. In the last couple of decades, to take full advantage of Renewable Energy Sources (RES), in particular, when considering solar and wind generation due to their uncertain nature, many researchers are focusing their attention on developing mechanisms to balance the demand and supply of energy, such that in periods where production from RES is lower, it is possible to reduce the consumption, and vice versa [
2]. As a response to this challenge, the concept of Renewable Energy Community (REC) emerged. RECs are groups of individuals who aim to produce or invest in the production of clean energy to meet their consumption needs, striving to minimize the use of energy from non-renewable sources as much as possible. They have as the main objective the production and sharing of renewable energy, resulting in environmental, economic, and social benefits, especially less CO
emission into the atmosphere.
However, moving from the concept to reality is not as simple as it seems. While RECs have the potential to be valuable sources of clean energy, they also face several challenges that need to be addressed. Some of the most pressing issues include: (1) the need to reduce peak demand, hence avoiding the acquisition of energy from sources outside the community, which may or not be from RES, and (2) ensuring a fair allocation of the community resources, to avoid having community members that have higher benefits than others [
3].
Based on this, in the last few years, with the expansion of this field, many researchers are focusing on developing strategies and mechanisms to solve such problems [
4,
5]. For instance, in Chavali et al. [
6], the authors developed a distributed algorithm for scheduling appliances in a Home Energy Management System (HEMS) to monitor and control energy consumption using a Demand Response (DR) approach to encourage the consumers to modify their consumption patterns in response to time-varying electricity prices.
To test and evaluate such strategies at scale, large amounts of data are necessary, hence ensuring that the proposed solutions are evaluated considering a wide range of different scenarios.
1.1. Current Status of Energy Communities Datasets and Simulators
In the current literature, as highlighted in a recent survey paper [
7], there is clear evidence of a lack of datasets (real or synthetic) on ECs. In fact, only two public datasets were found in the literature: a real-world dataset from Norway [
8] and a synthetic one from Portugal [
9], both of which were released in 2022. These datasets cannot be customized and are not enough to create different case studies with different characteristics and evaluate the developed approaches in energy communities.
For instance, in [
10], the authors established a mixed-integer linear-programming-based optimal planning approach for renewable energy communities and evaluated it using a small-scale REC testbed with nine community participants (six consumers and three prosumers) in a village in Carinthia, Austria. The electric load profile data of the nine individual participants were provided by the Distributed System Operator (DSO) and were generated in a synthetic way based on real smart-meter measurements in time intervals of fifteen minutes. This proposed optimization model was tested on a small-scale REC with nine houses, but it was not tested in medium or big ECs due to the lack of of medium and big EC datasets. In this sense, it is not possible to understand its scalability or its limitations.
Another study proposing an optimization model for the energy management in energy communities was presented in Giordano et al. [
11]. This model encourages energy sharing within the community and limits the exchanges of energy with the external grid. The main goal is to foster energy exchanges among the prosumers of the community. The effectiveness of the model was evaluated in a specific scenario: the University of Calabria Campus, in Italy, for a specific day (15 October 2019). Once again, although the authors reported a 28% increase in Self-Consumption (SC) and a 71% reduction in energy costs, the truth is that it was evaluated in a single and specific scenario, and it is not possible to understand its behavior when applied to different scenarios.
These works are two of the many examples that clarify the importance of these EC datasets.
Interestingly, several research projects aim at developing load demand profiles, some of which allow the simulation of individual appliance consumption profiles (e.g., [
12,
13,
14]). However, these tools are targeted at specific research problems; for example, AMBAL was originally developed to generate synthetic datasets to train and evaluate Non-Intrusive Load Monitoring (NILM) algorithms [
12]. Therefore, properly integrating such different platforms to generate the power demand of ECs will require great software engineering knowledge and programming skills.
1.2. Main Contributions
Against this background, this paper proposes the PROCSIM open-source simulation platform. PROCSIM was developed to create realistic energy community datasets that contain individual appliances’ information.
A key difference to the existing literature is the development of a platform capable of generating multiple scenarios in energy communities considering PV and wind production and consumption profiles at the appliance level. To the best of our knowledge, there are no works that focus on the dataset generation and simulation of renewable energy communities, and only few datasets are available for use, which cannot be customized by the user (i.e., it is not possible to configure the community size, the renewable resources, the householders, or the appliances). Hence, this gap can be filled by developing an energy communities simulator that allows researchers to configure, customize, and generate different EC scenarios that can be used in multiple case studies to understand and study the impact of different strategies in these communities. Differently from other tools proposed in the literature, where each one has a specific purpose (e.g., generate demand profiles, generate PV profiles, and generate wind profiles), a unique tool is composed with all these features.
In summary, this paper makes the following original research contributions:
The PROCSIM simulation platform, which allows the generation of realistic EC datasets at the appliance level completely customized by the user for multiple purposes considering different periods. It allows the creation of ECs with different sizes by choosing the number of houses, members, and appliances of each house; the peak power contract; and the schedule of every activity done by the house members. Additionally, it supports integration with multiple sources for weather forecasts (for instance, using Solcast Application Programming Interface (API) to provide solar irradiance data with a minimum granularity of 30 min, using PVLib to provide solar data from the weather models, or using Tomorrow.io to provide wind data). Finally, based on the weather forecast, it supports PV and wind generation using PVLib and
windpowerlib libraries. This open-source platform is fully available at
https://pypi.org/project/procsimulator/ (accessed on 4 February 2023), and its documentation is also available at
https://procsim.readthedocs.io/en/latest/procsimulator.html (accessed on 4 February 2023).
The remainder of this paper is organized as follows. In
Section 2, an overview of the related work is provided. In
Section 3, the PROCSIM simulator is presented, and its modules and functionalities are described. In
Section 4, two different experiments are presented, showing how useful the simulator is. More concretely, how the simulator can be used to generate a custom EC dataset and how the generated dataset can be used to evaluate an optimization model. Finally, the
Section 5 ends the paper and suggests directions for future research.
2. Background and Related Works
This section presents and briefly discusses some ongoing initiatives to create EC datasets and existing tools that can be used to assist in the creation of such datasets—namely, publicly available household consumption data, household consumption simulators, and tools for PV and wind generation.
2.1. Energy Communities’ Datasets
As aforementioned, a quick survey of the published literature revealed a lack of datasets specific to ECs. More precisely, only two datasets were found, a real-world dataset from Norway [
8] and a synthetic dataset from Portugal [
9].
The dataset of a Norwegian energy community [
8] includes household consumption data collected from smart meters measurements filtered by season, weekday/weekend, and time segment. It is divided into five groups: household consumption, appliance consumption, electric vehicle charging, photovoltaic power generation, and wholesale electricity price. It aims to allow researchers to implement situations and experiments on realistic ECs.
The synthetic one is presented in [
9], where a dataset featuring a residential community with 49 households and a public building (a municipal library) is created by assigning consumption and PV production profiles, and disaggregating the total consumption of these households into appliances’ consumption.
2.2. Tools for Energy Communities’ Research
Considering the lack of real-world EC datasets, an alternative is to rely on the development of synthetic data. In such cases, the data are not obtained from direct measurements. Instead, the data are obtained from tools that can provide, among others, profiles for household electricity consumption (e.g., aggregated and per individual appliance) and renewable energy generation (e.g., from PV) [
7]. In this section, we aim to describe possible alternatives to gather the required data. This includes publicly available electricity consumption datasets (real-world and synthetic), household consumption simulators, and tools for simulating energy generation from RES.
2.2.1. Electricity Consumption Datasets
Electricity consumption datasets are collections of electricity measurements from aggregate (i.e., measured at the main breaker box) and/or individual appliance consumption. They can be mainly of two different types depending on how they are created: real-world or synthetic.
According to [
15], “A real-world electricity consumption dataset refers to a collection of electrical energy measurements taken from real-world scenarios, without disrupting the everyday routines in the monitored space”. In the context of EC, these datasets can be further divided into residential and commercial datasets. The former category refers to datasets collected in residential settings (e.g., UK-DALE [
16], REFIT [
17], and SustDataED [
18,
19]). The latter category refers to datasets from commercial spaces (e.g., BLOND [
20], COMBED [
21], and FIKElectricity [
22]).
Since collecting real-world datasets requires real measurements, which are time-consuming and expensive to acquire, generating synthetic data is gaining popularity as a viable alternative that reduces measurement costs and saves valuable work hours [
23]. SynD [
23] is a synthetic energy-consumption dataset originally developed for NILM research in residential buildings. Another example of a synthetic dataset is the SHED dataset [
24], which consists of synthetic high-frequency electricity consumption measurements from commercial buildings.
2.2.2. Household Consumption Simulators
A major limitation related to the use of datasets in the context of ECs is the fact that they are static, hence not allowing the evaluation of different scenarios. In contrast, simulators can be customized (e.g., specify the number of consumers and type of appliances) to generate unique datasets at each run, hence enabling the possibility of exploring many different scenarios.
In Buneeva et al. [
12], the authors proposed AMBAL, a system that generates models from real devices’ power consumption data collected by smart plugs. To test the quality of the traces synthesized from AMBAL’s models, they developed ANTgen [
25], a synthetic appliance trace generator that combines device models into aggregate traces and uses them to evaluate disaggregation algorithms. SMACH [
13,
26] is a meta-model and multi-agent simulator of human activity that allows the modeling and simulation of household activities and their relations with electricity consumption. Finally, the LoadProfileGenerator [
14] is another household consumption simulator. This simulator enables the generation of load profiles for electricity, gas, hot water, and cold water and returns individual load profiles.
2.2.3. Energy Generation from PV and Wind
In addition to electricity consumption, energy generation from renewable sources, such as PV and wind, is also important to consider in RECs. In this sense, energy engineers and researchers are increasingly producing open-source software tools for energy modeling. A summary of PV modeling tools is present in [
27]. PVLib is a library for PV modeling for multiple purposes written in Python [
28] and SolPy (
https://solpy.readthedocs.io/en/latest/, accessed on 8 December 2022). The
feedinlib library (
https://pypi.org/project/feedinlib/0.0.8/, accessed on 8 December 2022) is a tool for PV time series modeling that contains implementations of PV models to calculate the generation of electricity based on solar radiation measurements. Finally, PECOS is a performance monitoring tool that was originally designed for PV systems, but it can monitor other systems as well. It includes a feature for tracking the performance of time series data [
29].
Concerning the tools for wind generation, there are also some open-source libraries. The Wind Power Library (WPL) (
https://www.claytex.com/products/dymola/model-libraries/wind-power-library/, accessed on 14 December 2022) is a Modelica-based simulation library that is used for modeling wind power plant components, such as generators, power electronics, and auxiliary components. Its purpose is to examine the dynamic behavior of modern wind turbines that have both generator and grid components. The
windpowerlib is a library designed for modeling the output of wind turbines and farms. It includes a set of functions and classes for determing the power output of wind turbines. Finally, wind [
30] is a library providing a collection of stochastic approaches to generate wind speed data on daily and hourly time steps.
2.3. Summary
In summary, as it was possible to observe, there are already many tools that can assist in creating EC datasets. Nevertheless, there is an evident difficulty in combining all these tools, highlighting the relevance of the platform being proposed in this work, by combining several of these tools in a unique package. Additionally, datasets are crucial for advancing the development of multiple computational fields, including the energy community’s one. Taking into account the lack of ECs datasets, it is fundamental to foster the development of tools such as PROCSIM.
3. PROCSIM: Energy Community Simulation Platform
The core purpose of PROCSIM is to allow the creation of EC datasets that are fully customizable to meet different objectives over several time horizons (e.g., one week, two months, one year). The PROCSIM simulator was developed in Python due to the availability of a vast set of libraries for simulating both household consumption and PV and wind generation. Furthermore, Python is becoming very popular among researchers and is increasingly used for data science due to its simplicity and flexibility.
PROCSIM has been:
Released as open-source software (with documentation) to encourage researchers to contribute with new EC datasets, with the aim of fostering increased collaboration within the community. These datasets offer benefits for data scientists, researchers, and decision makers in the energy field, making them a valuable source for model and algorithm applications. In addition, they can be convenient for real-life simulating and planning of an EC. They can also be used to evaluate different communities with diverse sizes and characteristics. Ultimately, it provides a stronger contribution due to the individual appliance consumption profiles, which are hard to find in the existing literature.
Designed with a modular structure, enabling researchers to reuse, replace, or append individual components as needed (for instance, a researcher can append an electric vehicles module to understand how it affects the community in terms of the management of the renewable resources).
Designed to allow the use of just one module or a set of modules instead of the whole simulator (for instance, generate only one house with a PV panel) for teaching purposes.
Written in Python, ensuring simplicity (allowing even beginners to use it) and compatibility with many existent platforms.
3.1. PROCSIM Implementation
As aforementioned, PROCSIM was developed following a modular approach (i.e., it was divided into multiple modules) to allow for easily replacing or appending of new modules. For instance, the Consumption Generator module can be replaced by another tool that provides consumption data at the appliance level.
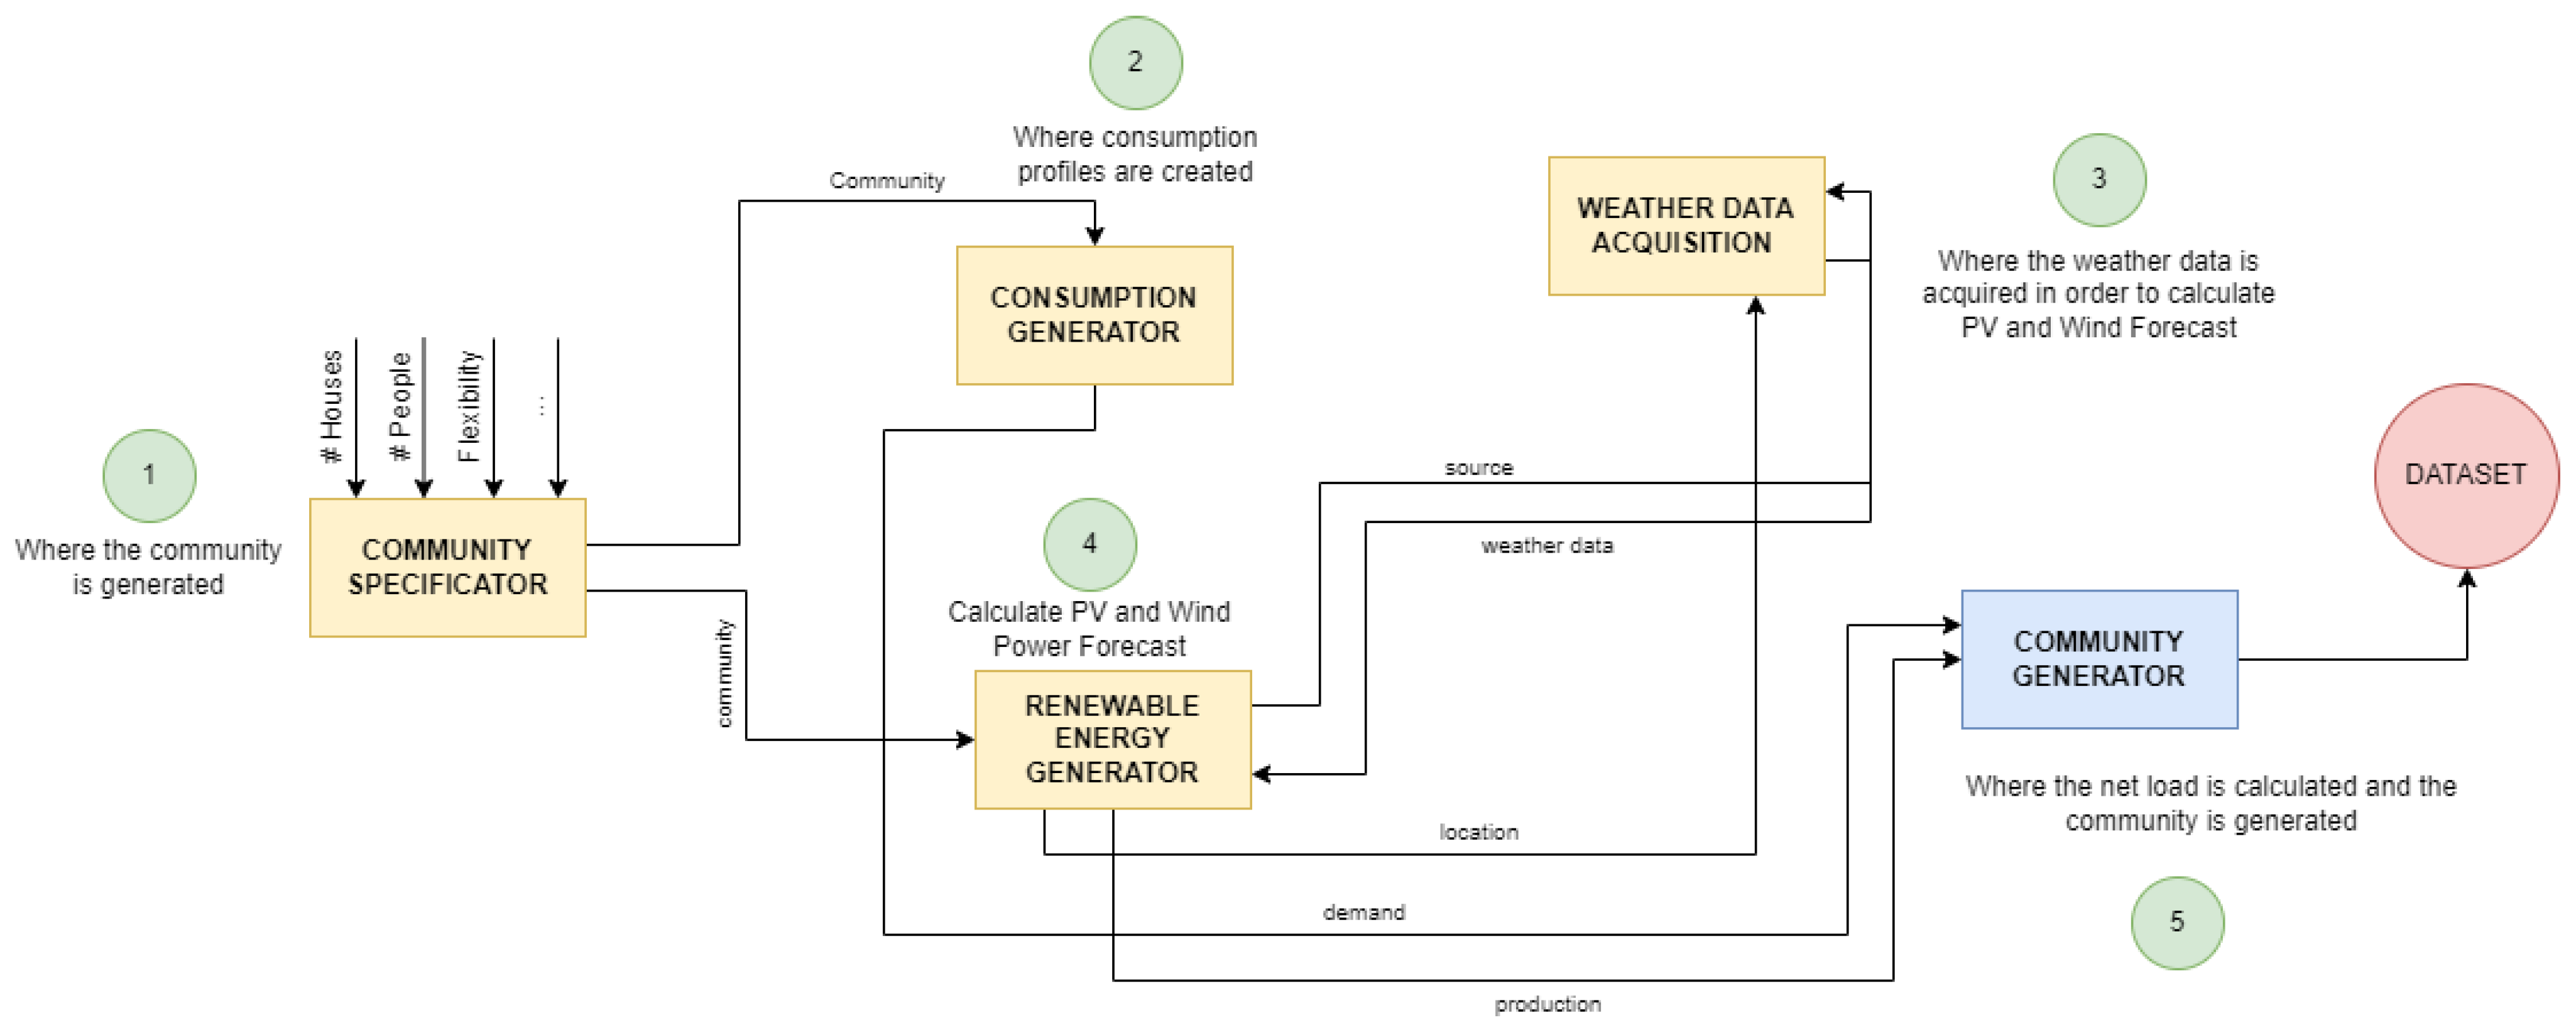
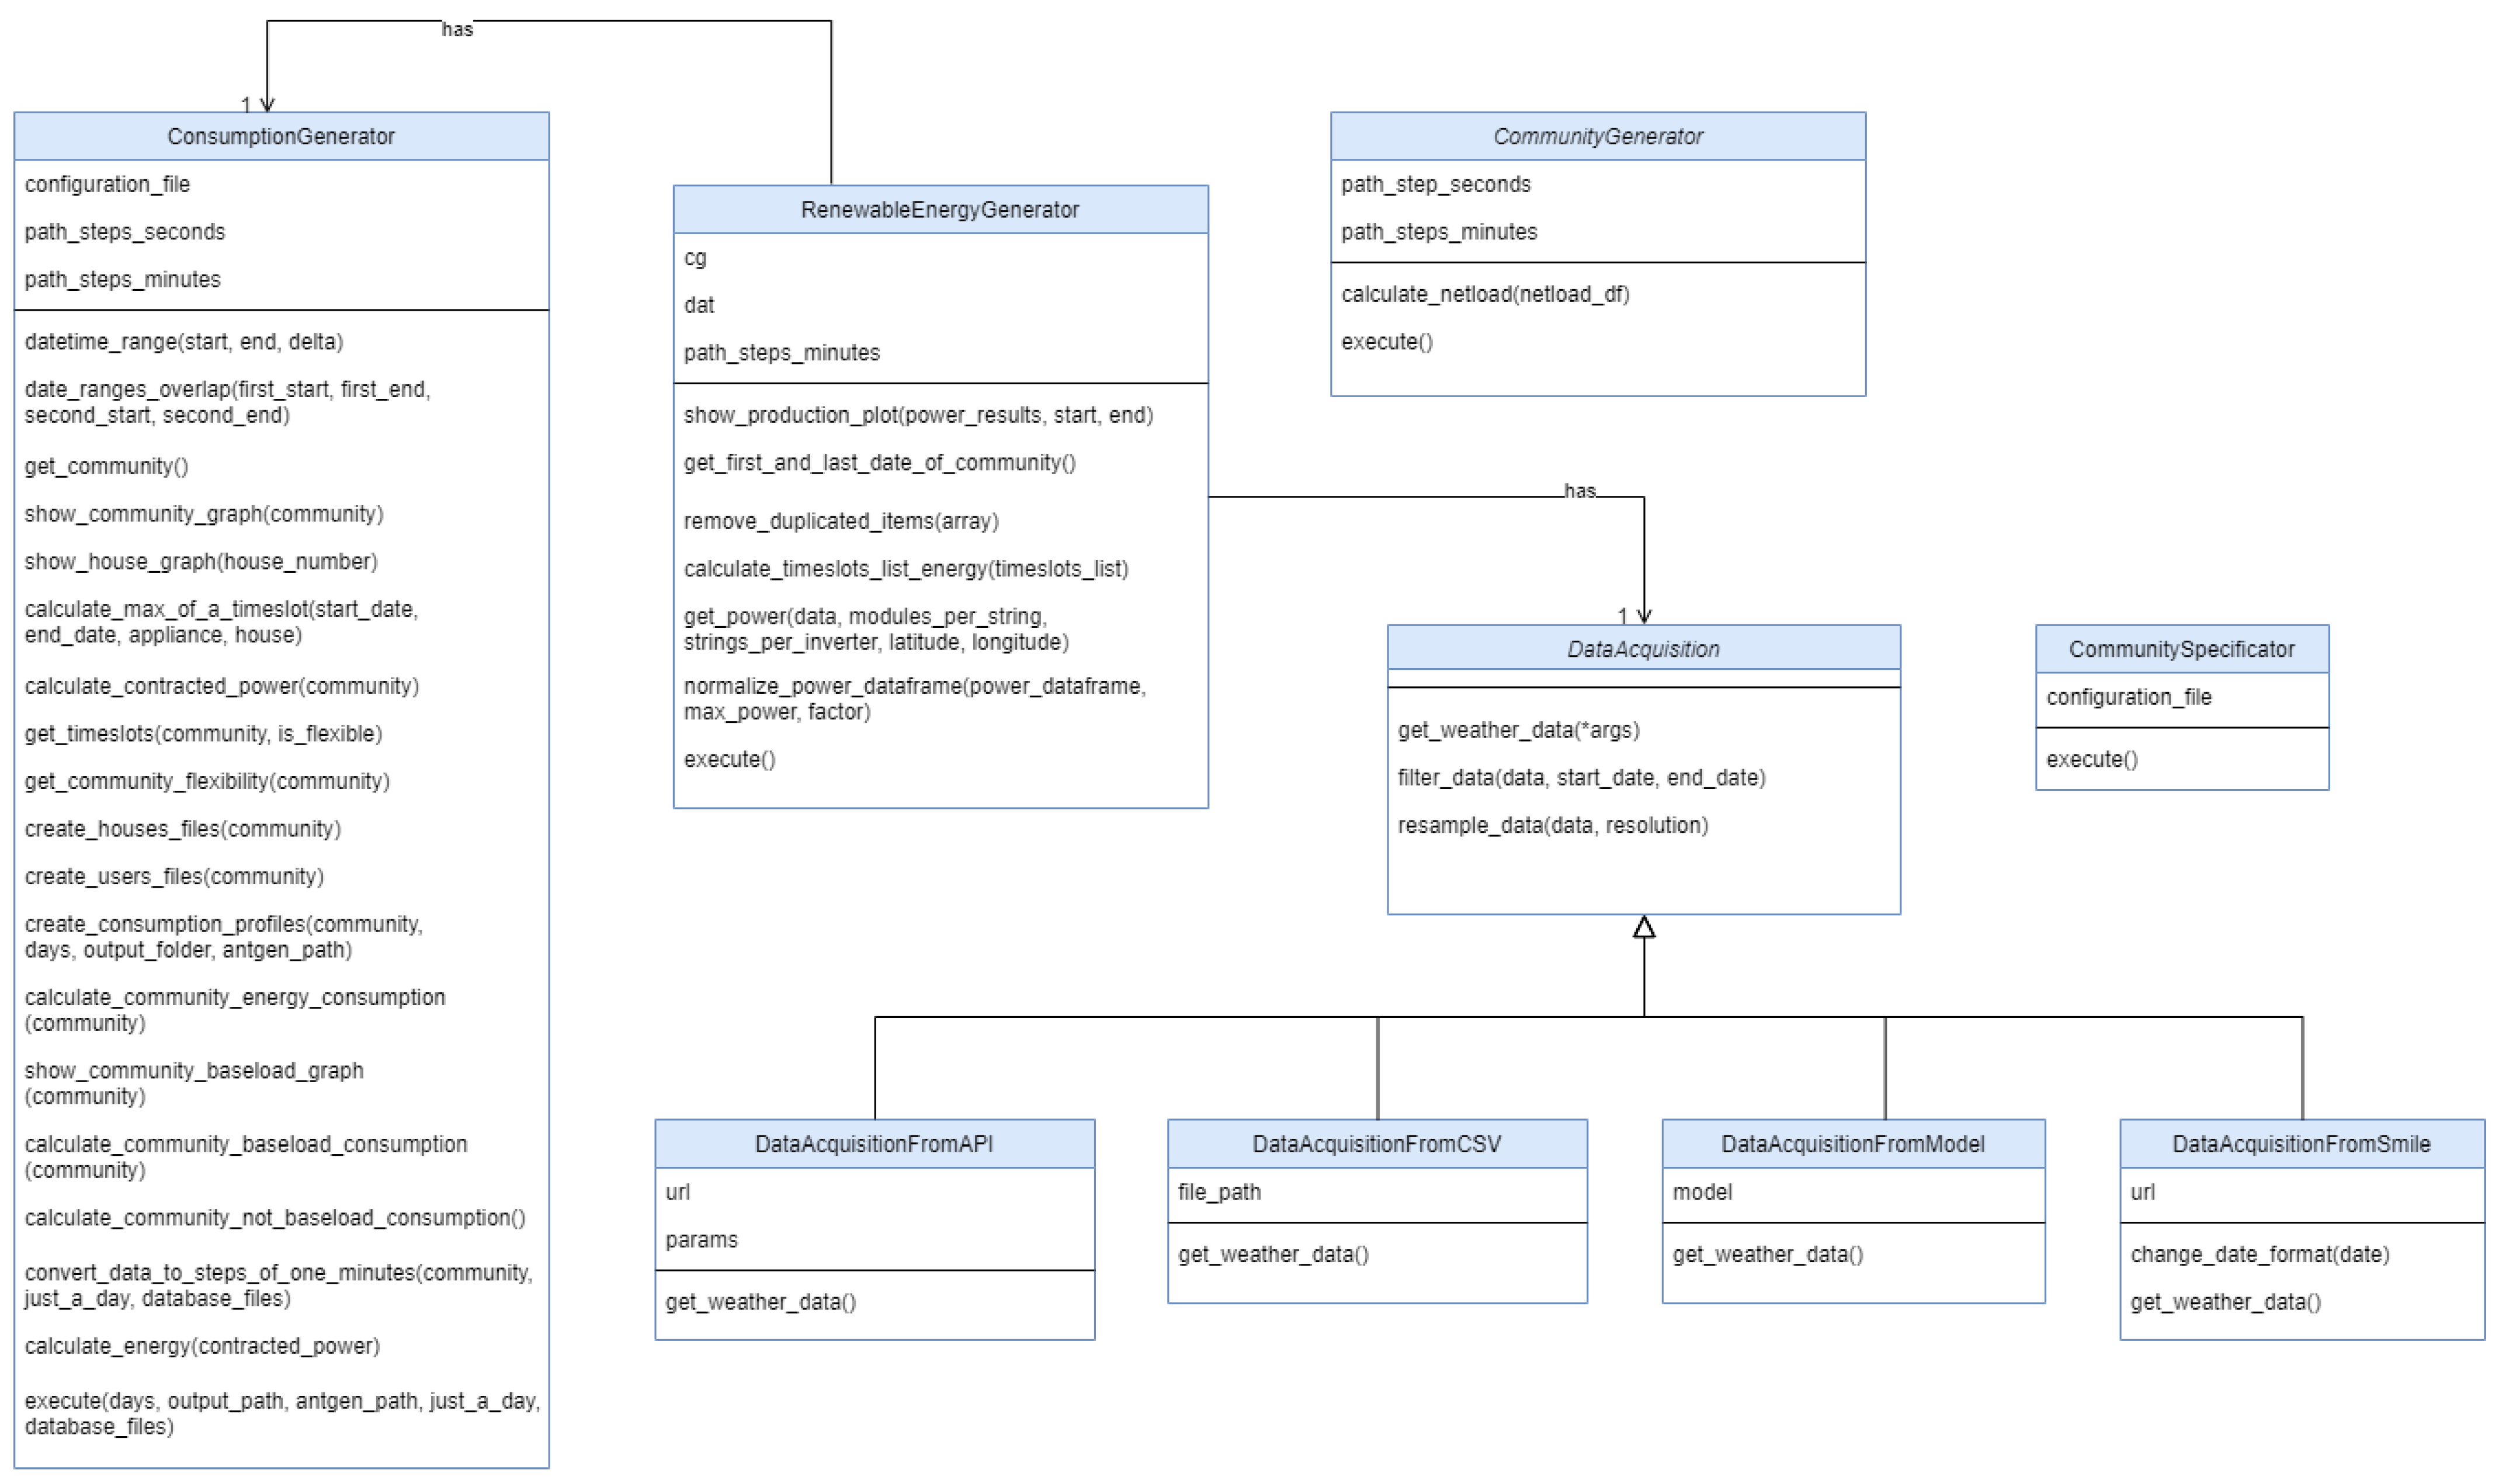
The way that the simulator was implemented is presented in
Figure 1, where it is possible to see the five different modules of the simulator. Additionally, the Unified Modeling Language (UML) diagram, showing the different classes implemented in the simulator and the different components that are being simulated, is presented in
Figure 2. PROCSIM currently focuses on the simulation of residential consumption and RES from PV and wind. However, in the future, the goal is also to simulate the grid (import and export from the grid), batteries, and electric vehicles. Each module is briefly described next.
3.1.1. Community Specificator
The Community Specificator module offers the tools and mechanisms to define an EC. To this end, several parameters must be specified by the end user. For instance, the community size (number of households), the appliances present in each house, the number of householders, and the main activities of each one. In this module, the users also can set their Peak Power Contract (PPC) (which is the maximum electricity that can be consumed by a house at every instant). In the current version, the community configuration is done using a JavaScript Object Notation (JSON) file with all the aforementioned variables.
3.1.2. Consumption Generator
The Consumption Generator module generates the consumption profiles of the community using the information from the previous module. Specifically, it creates the baseline load and the consumption of individual appliances for each household, which are then aggregated to form the households and community consumption profiles
To accomplish this, the PROCSIM current version relies on the AMBAL appliance trace generator (ANTgen) [
12] to produce appliance consumption traces at a frequency of 1 Hz.
Considering that the ANTGen library has its configuration structure, a converter was created to translate the community specifications given in the previous module into a data structure supported by ANTGen. In the future, it can be adapted to support other formats. In this sense, this module creates a configuration file for each house of the community, which is also composed of a set of configuration files—one for each user of the house. Then, each user configuration file contains the user presence schedule and a set of daily activities for each resident.
After the creation of these configuration files, the ANTgen uses them to generate the consumption profiles based on the activities and appliance models that are already available in the tool (TV, refrigerator, washing machine, etc.).
The final output is a set of Comma Separated Values (CSV) files containing power consumption values and their timestamps with a frequency of 1Hz (1 value per second) for every house, activity, appliance, and user.
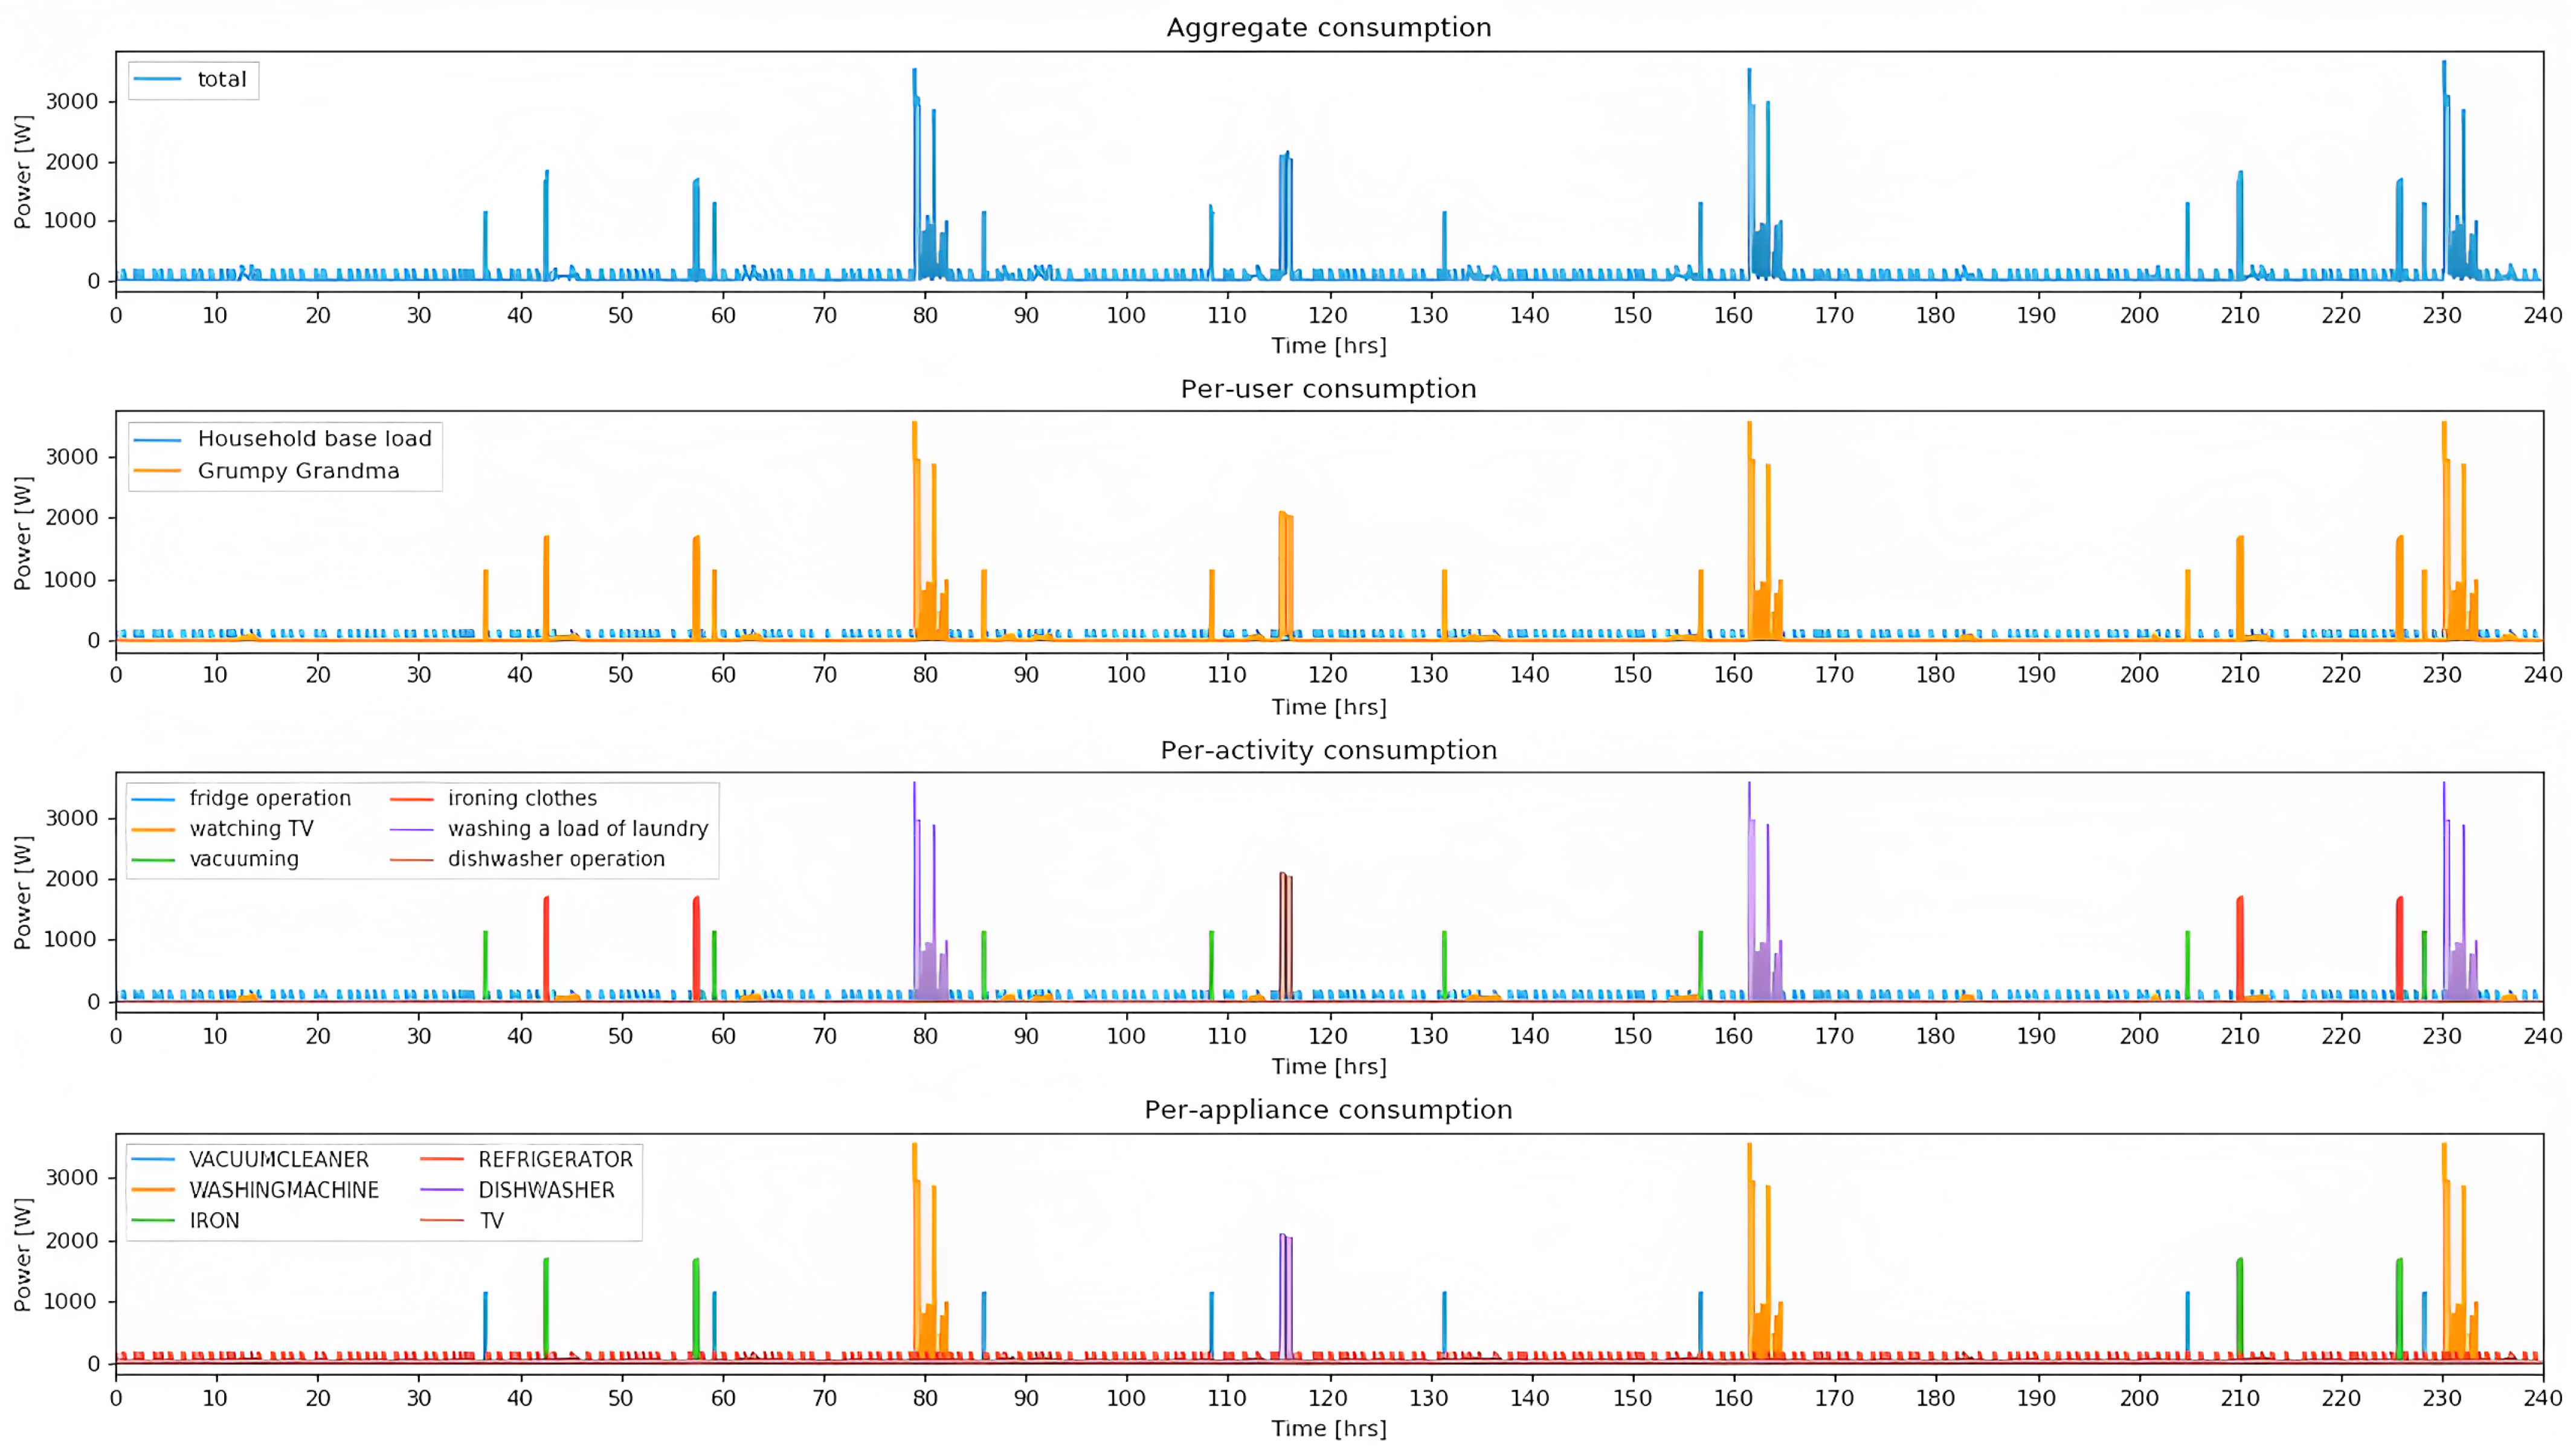
For illustration proposes,
Figure 3 shows a house consumption profile generated by the AMBAL trace generator. In the figure, it is possible to visualize the four ways ANTGen generates profiles: per appliance, per activity, per user, and aggregated.
3.1.3. Weather Data Acquisition
Weather Data Acquisiton is the module responsible for retrieving the weather data from a specific location (lat and long coordinates), namely, the solar irradiance data and the wind data.
These weather data are important, since they are used to produce the PV and wind power forecast. This module was developed to support data from multiple sources. In the current version, weather data from external APIs (e.g., Solcast or Tomorrow.io), weather models (from PVLib library), and external files (CSV files) are supported. However, other sources could be integrated in the future. The external API allows access to weather data from different APIs, hence providing historical data and forecast data (which allows the development of real-time simulations).
Regarding the weather models, there are five in the current version: Global Forecast System (GFS) (see
https://pvlib-python.readthedocs.io/en/v0.4.0/forecasts.html#gfs, accessed on 18 December 2022, High Resolution Rapid Refresh (HRRR) (see
https://pvlib-python.readthedocs.io/en/v0.4.0/forecasts.html#hrrr, accessed on 18 December 2022), Rapid Refresh (RAP) (see
https://pvlib-python.readthedocs.io/en/v0.4.0/forecasts.html#rap, accessed on 18 December 2022), North AmericanMesoscale (NAM) (see
https://pvlib-python.readthedocs.io/en/v0.4.0/forecasts.html#nam, accessed on 19 December 2022), and National Digital Forecast Database (NFDF) (see
https://pvlib-python.readthedocs.io/en/v0.4.0/forecasts.html#ndfd, accessed on 19 December 2022); and all of them are supported by PVLib (see
https://pvlib-python.readthedocs.io/en/v0.4.0/forecasts.html#weather-models, accessed on 19 December 2022). The main challenge in using these weather models to retrieve solar irradiance data are that they are not frequently updated. For example, the GFS model is only updated every six hours.
Finally, external files with weather data can be used in the simulator, supporting different time resolutions. To be supported by the platform, in the case of PV, the files have to contain at least three specific weather columns: Global Horizontal Irradiance (GHI), Direct Normal Irradiance (DNI), and Direct Horizontal Irradiance (DHI). For the wind case, the mandatory columns are the wind speed, temperature, and pressure.
3.1.4. Renewable Energy Generation
This enables the generation of production profiles with the same sampling rate as the sources (e.g., Solcast supports historical and real-time data down to 5 min resolution and up to 60 min). These tools provide functions to simulate the production from photovoltaic energy systems and wind turbines.
3.1.5. Community Generation
The last module of the Community Simulation is the
Community Generator. It receives as input all the generated consumption profiles (from the Consumption Generator module) and the production profiles (from the Renewable Energy Generator). It then returns an EC with the consumption, production, and the net-load, calculated based on the other two variables. The
netload is the total community demand minus the production, as represented Equation (
1):
where
is the demand in time
t, and
is the total production in time
t. The net-load can take a negative value, a positive value, or a value of zero, as shown in Equation (
2):
One critical feature of this module is the possibility of calculating metrics using the EC data, which ultimately can be used to assess the behavior of the community and the performance of a particular optimization model. The current version supports nine metrics, including the quantity of energy used from the grid, quantity of energy used from the RES, quantity of energy wasted from the RES, number of peaks, average power used from the grid, average power used from the RES, and average power wasted by the RES, Self-Sufficiency (SS), and SC. Other metrics can be easily added by extending the respective interface.
3.2. Dataset Structure
The generated EC datasets are organized as represented in
Figure 4. The data are stored in the output folder. It contains a folder for each community house with its consumption profiles: aggregate, per appliance, per user, and activity. Furthermore, it contains the following profiles: community (i.e., the total consumption of the community), community_baseload (total base load of the community), community_not_baseload (total consumption of the community minus the total base load), renewable energy (community production), and finally the net-load (demand minus the production, which corresponds to the demand that must be met by the grid).
4. Case Study
To demonstrate the main features of PROCSIM and show how to use the generated datasets, this section presents two experiments. In the first experiment, PROCIM was used to generate an EC dataset. In the second experiment, the generated dataset was used to evaluate an EC optimization model.
4.1. Experiment One: Dataset Generation
In this experiment, a week-long dataset was generated for an EC constituted of five houses, one small solar farm (15 kWp), and one small wind park (6 kWp). The characteristics of the five houses are presented in
Table 1, with the following appliances: F—fridge, TV—television, WM—washing machine, VC—vacuum cleaner, PC—personal computer, CM—coffee maker, K—Kettle, BC—bread cutter, CS—cooking stove, DW—dishwasher, DM—dryer machine, WH—water heater, M—microwave, T—toaster, CP—CD player and A—amplifier.
The four steps of the dataset generation process took around 7 min. These steps are summarized next.
4.1.1. Step 1: Generation of the Consumption Profiles
In the first step, after having the JSON file with all the community configurations, the Consumption Generator module is used. This class has multiple functions that can be used separately. However, in order to simplify, each class has its own execute function, which allows executing the whole behavior by aggregating multiple functions (i.e., convert to the format supported by ANTGen, generate all the consumption profiles of the community houses, resample to the desired frequency (in this case 1/60 Hz), and calculate the total community load profile by summing all the individual ones).
When instantiating the
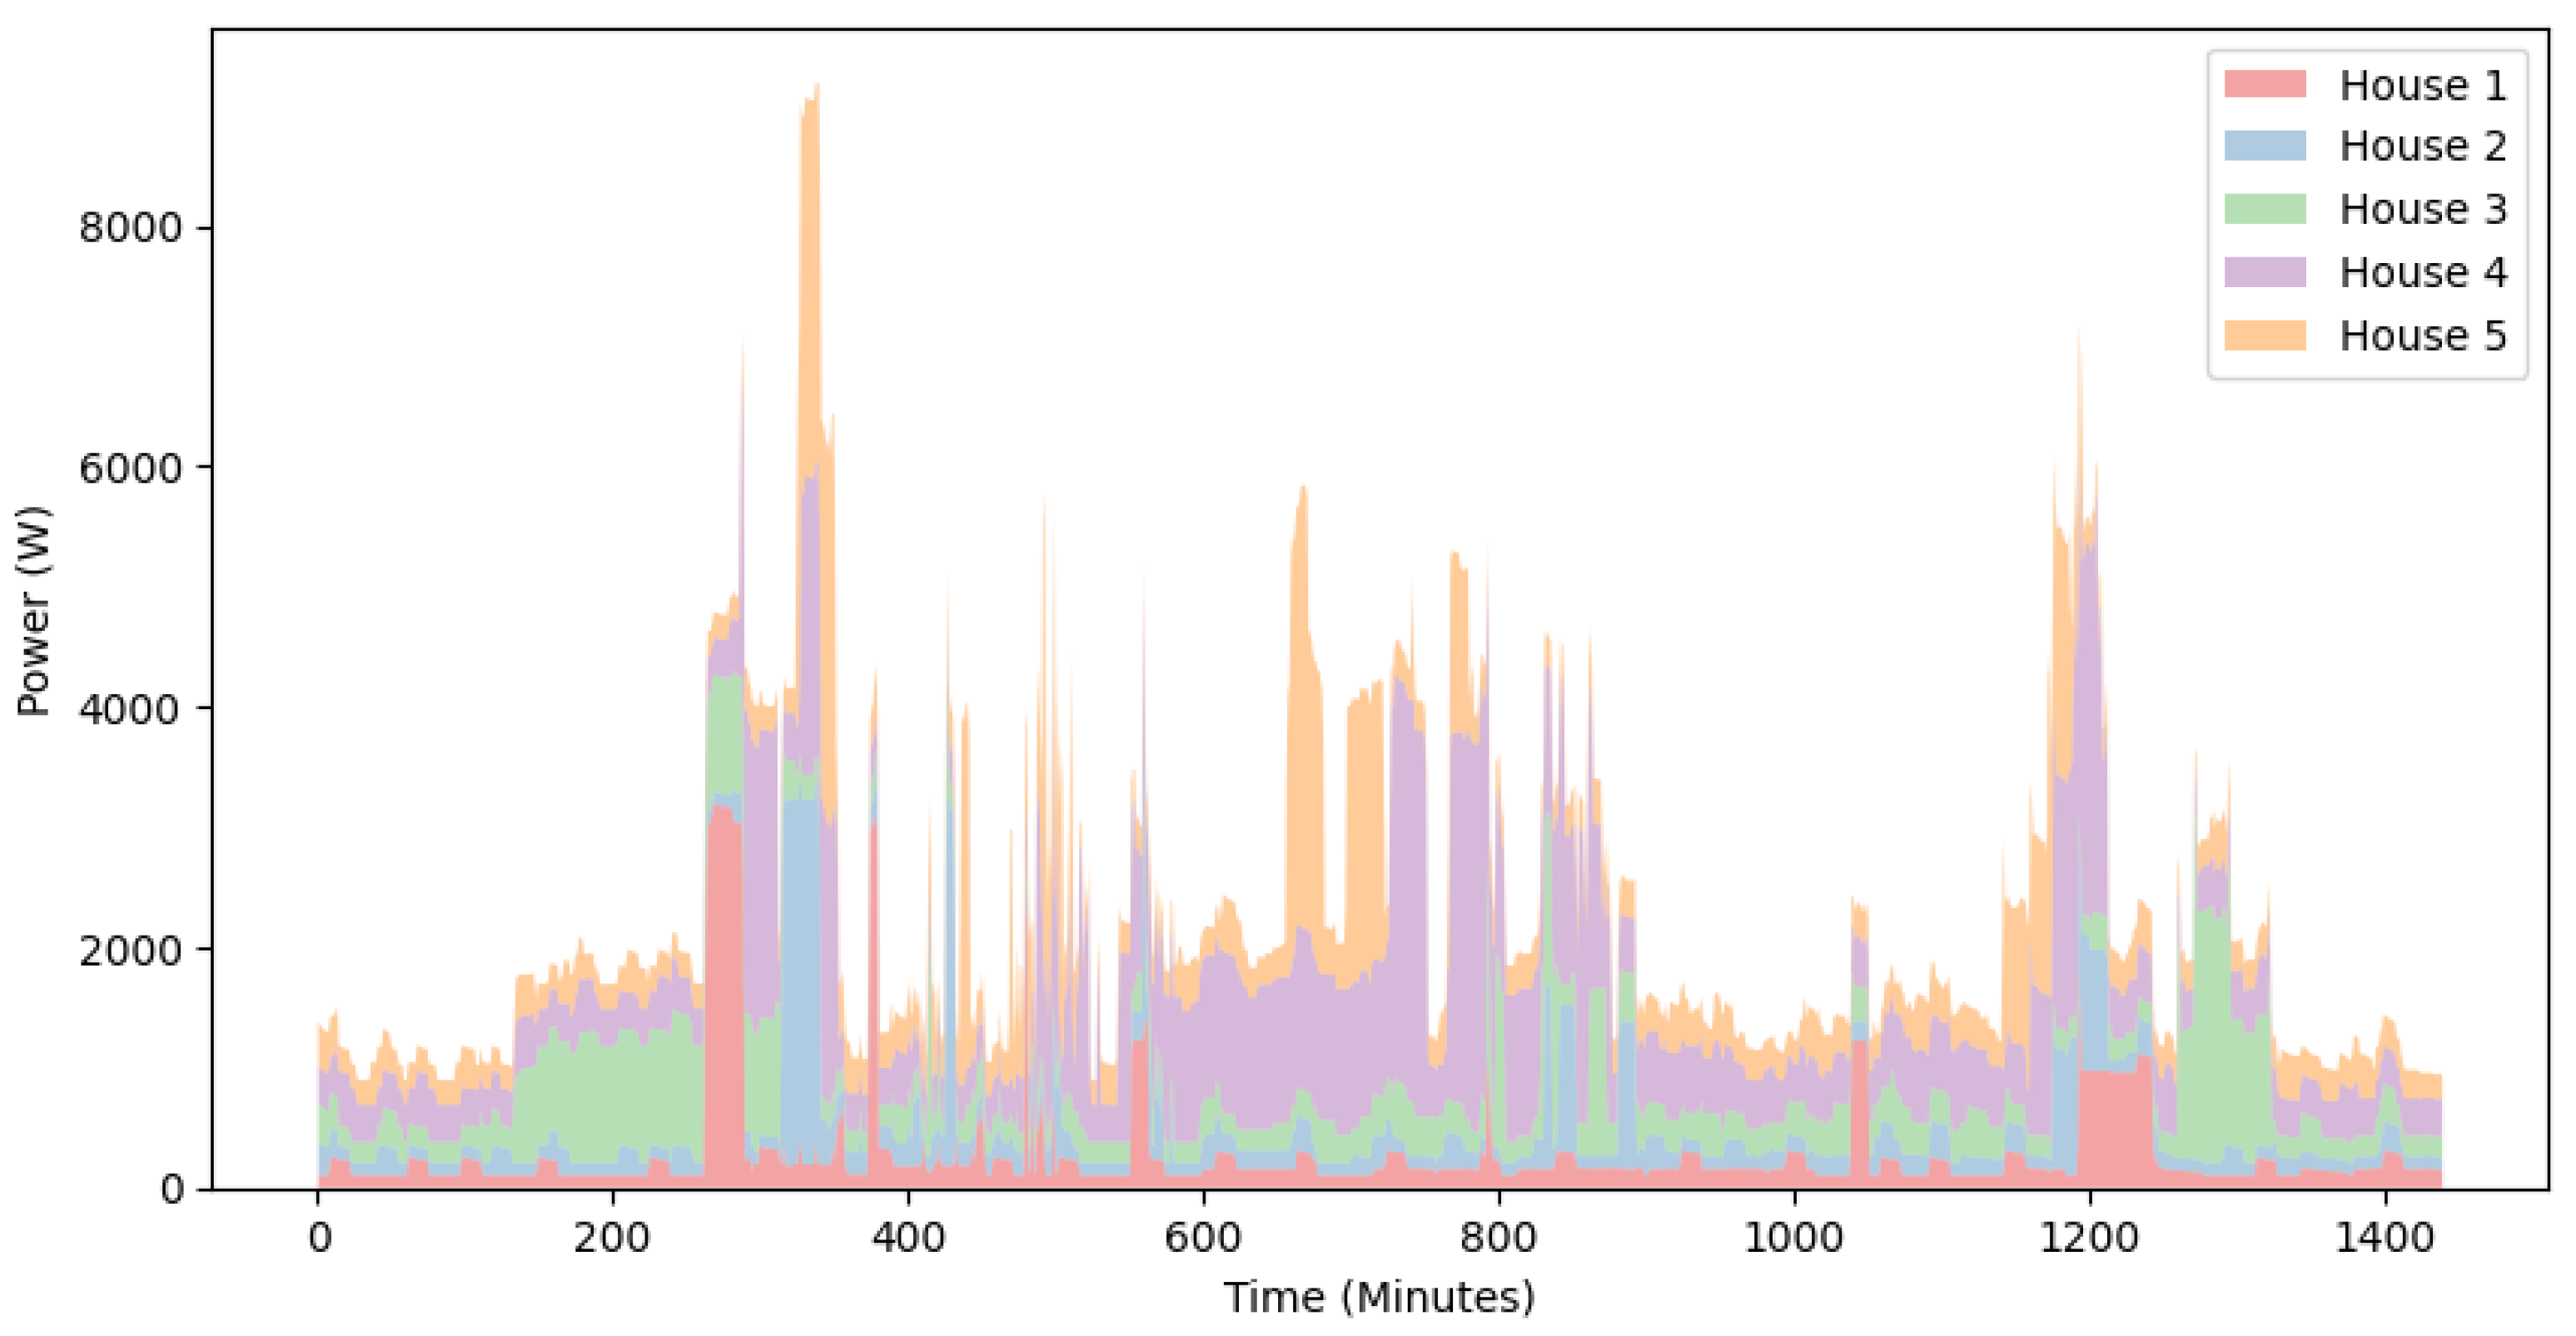
ConsumptionGenerator class, three arguments are required: the location of the JSON configuration file, the location where the consumption profiles generated by ANTGen will be created, and the location of the profiles after the resampling. Then, when calling the execute function of this class, the two following arguments must be provided: the number of days to simulate and the folder of the configuration files in the ANTGen format. In our case, consumption profiles for a week were generated (the first day is shown in
Figure 5).
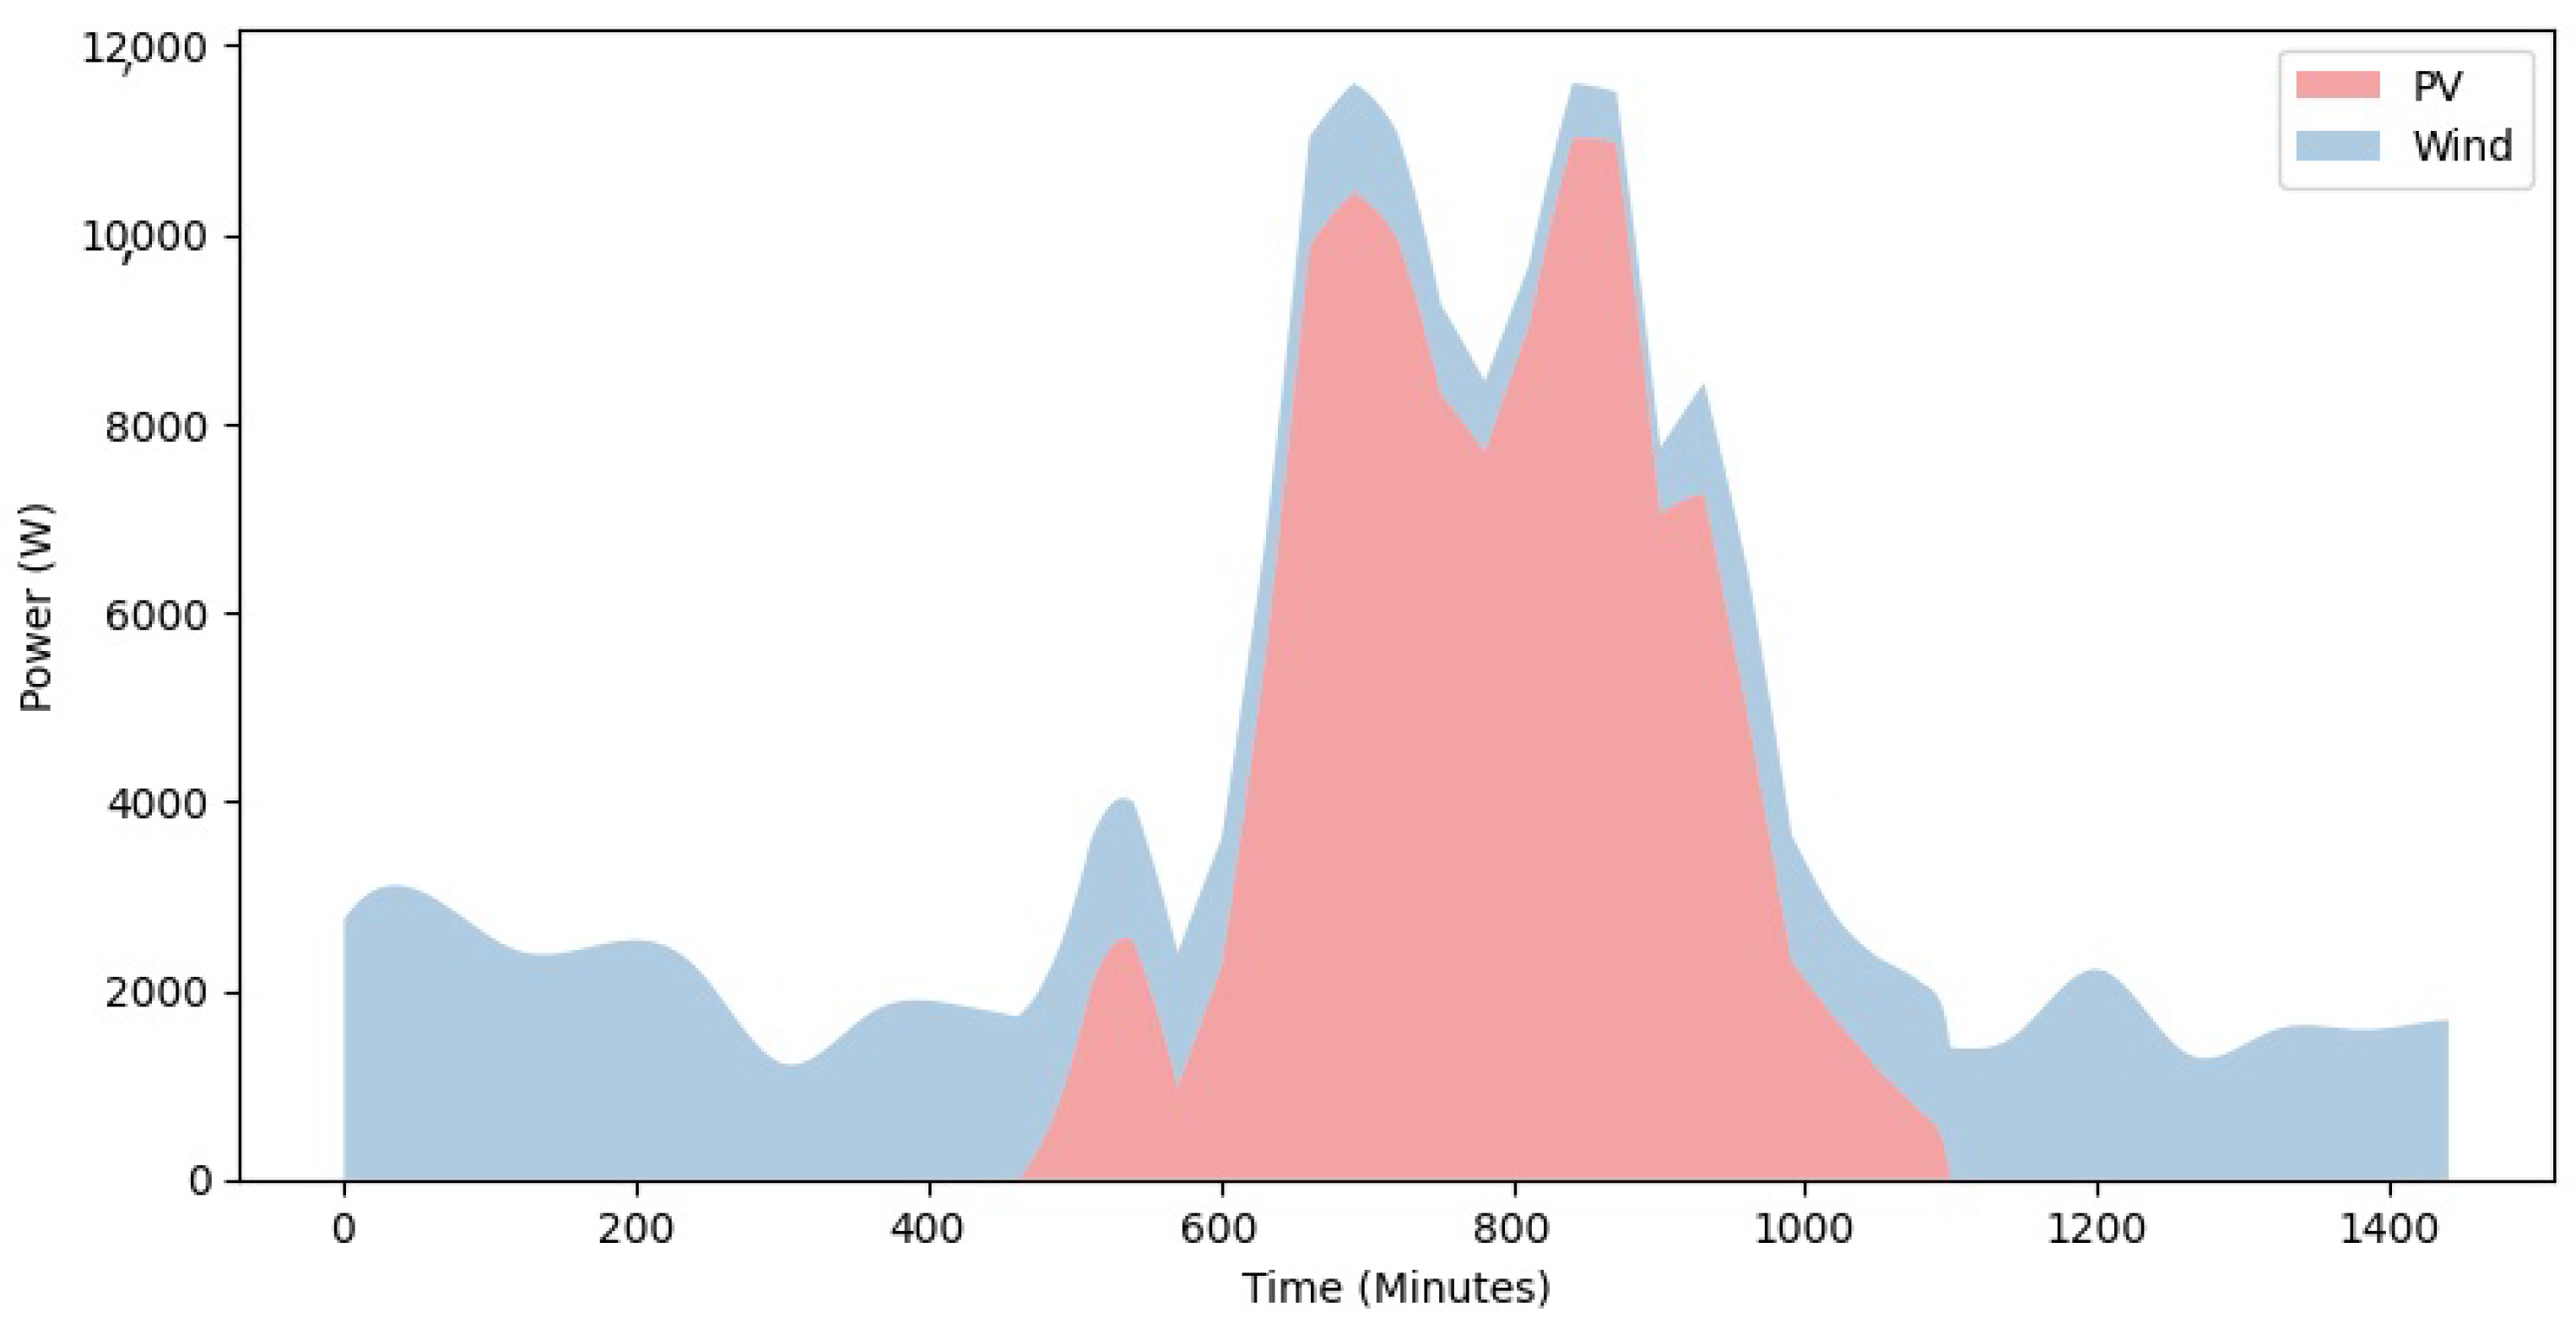
4.1.2. Step 2: Generation of PV and Wind Production
After generating the demand, this second step uses the Renewable Energy Generator module to generate PV and wind production (as shown in
Figure 6). In order to generate realistic profiles, weather data were acquired from two different sources: from Solcast API when considering PV production with a resolution of 30 min, and Tomorrow.io API when considering wind production with a resolution of 1 h.
When using the RenewableEnergyGenerator class, four arguments must be provided: the CommunityGenerator instance in order to use some of its functions, the PV and wind subclasses, and the location of the consumption profiles generated in the previous module. Then, the execute function is called without any argument to calculate the PV and wind production based on the weather data acquired. The total production is then calculated by summing the individual components.
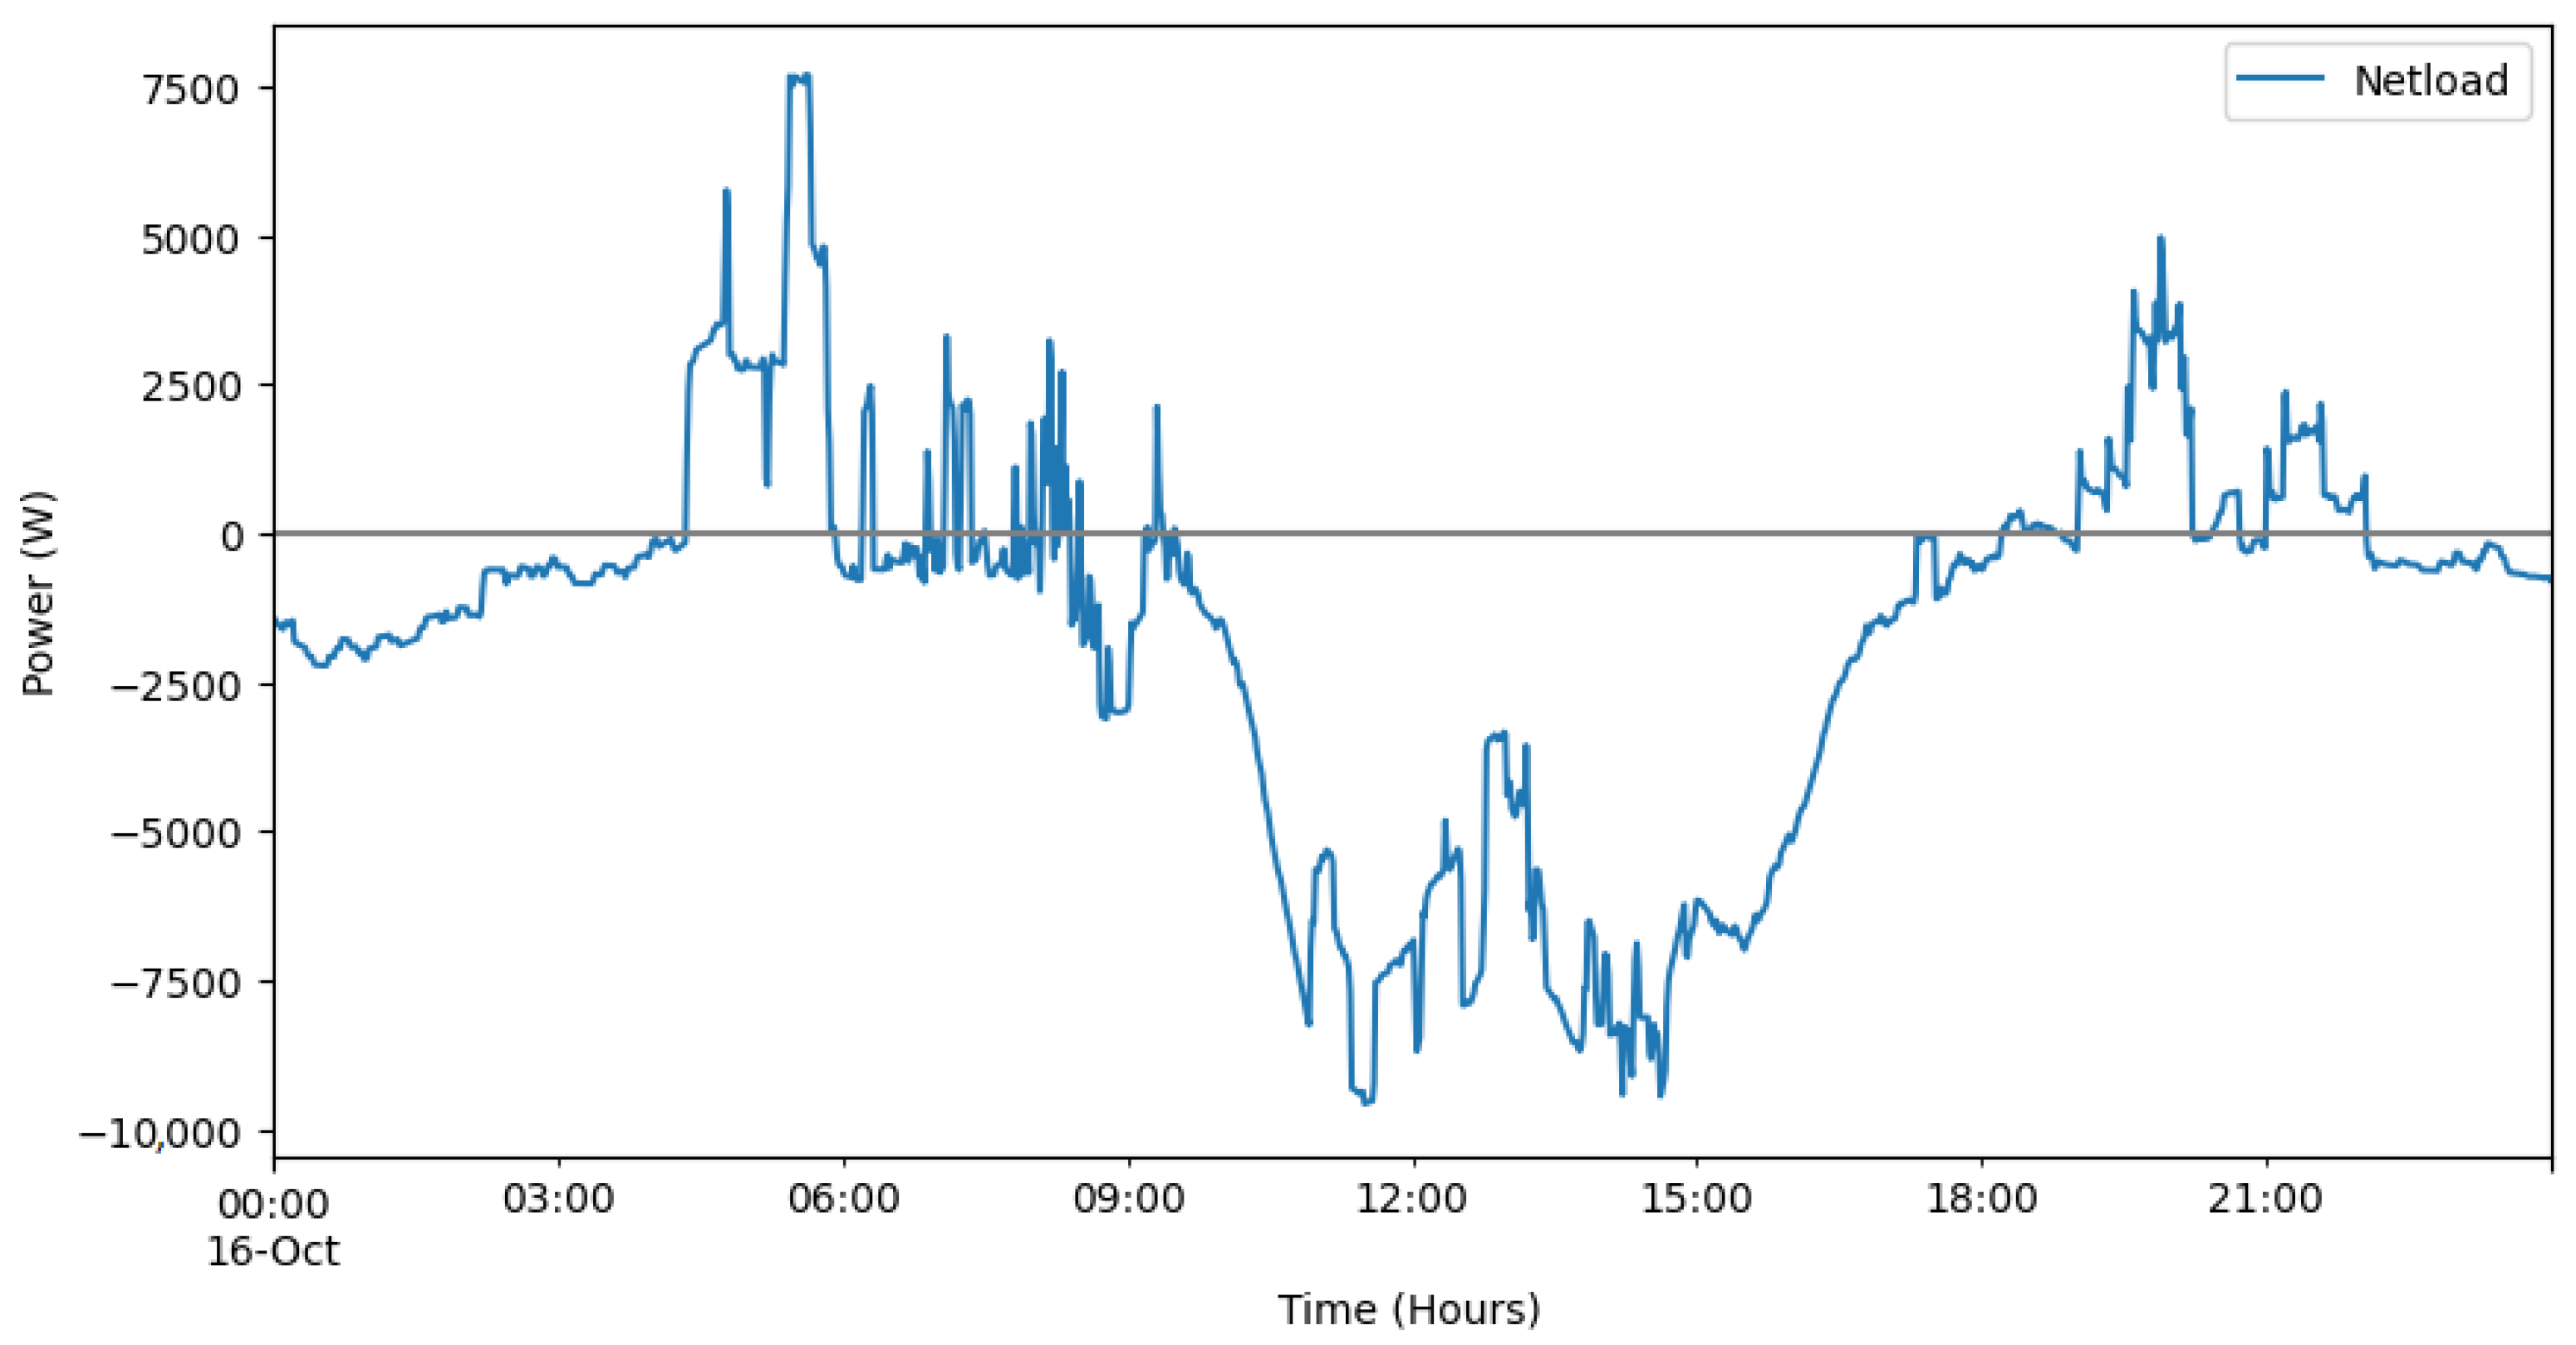
4.1.3. Step 3: Calculation of Net-Load and Generation of the EC Dataset
In this third step, the Community Generator module is used to calculate the community net-load (see
Figure 7). When instantiating this class, it is only necessary to specify the path of the EC dataset (where it will be stored).
After this calculation, the EC dataset was fully generated, with the structure presented in
Figure 4. As aforementioned, since the dataset does not only contain consumption at the house level but also consumption at the appliance level, activity level, and user level, it can be used to evaluate algorithms for specific appliances and specific activities instead of evaluations of the whole house or the whole community.
4.1.4. Step 4: Calculate Metrics in the EC Dataset
Finally, to conclude the first experiment, after generating the EC dataset, some metrics were calculated based on the consumption and production profiles. In order to do that, the class receives the community data where the metrics will be calculated and calculates all the metrics chosen by the user.
Table 2 shows the values obtained for the different metrics calculated for this dataset.
4.2. Experiment Two: Community Battery Energy Storage Optimization
Energy management systems are generally developed based on optimization algorithms. The objective function used on such algorithms is normally the minimization of the costs or the maximization of the SC and SS [
31]. The second experiment of this paper demonstrates how the previously generated EC dataset can be used to evaluate a Mixed Integer Linear Programming (MILP) problem [
32] to optimize the energy costs of the community considering the use of a Battery Energy Storage System (BESS).
In this scenario, the Energy Community comprises two renewable generators (PVs and wind) with a peak production capacity of 21 kWp: five loads (one for each house) with a peak demand of 29.9 kW (i.e., the sum of all five PPC values) and one BESS with a capacity of 10 kWh and a 3 kW inverter. It is also possible to import and export energy from/to the main grid. The import price was defined by a time of use (ToU) tariff with four different prices during the day, whereas the export price was set to a flat rate.
The initial State of Charge (SOC) of the BESS was set to 20%; the lower and upper limits of the SOC were set to 20% and h, respectively. The simulation had a total duration of seven days and a time resolution of one hour.
4.2.1. Constraints
The MILP includes the operating constraints of each resource. The constraints for each period t are the following:
The power exchange between the EC and the main grid ( and ) is limited by the thermal limits of the cables or by contracts.
The power of generators () is limited by their nominal power and by the generation forecast of PV and wind.
For the loads (), we assume continuous flexibility of 10% () of their power consumption at each instant and 5% flexibility with discrete activation (). A relaxation variable () is also considered in the problem. This variable is important when the generation resources are insufficient to supply all the demand.
The batteries are limited by the maximum values of power charge () and discharge () and by their maximum capacity. Afterward, a constraint to model the BESS balance is required to update the of the BESS in each instant t.
Finally, the balance between power consumed and injected in the EC is required. This equation is represented in Equation (
3).
4.2.2. Objective Function
In terms of the objective function (OF), there is a cost (represented as
) associated with all the different components: generators, loads, storage, and grid. The OF corresponds to the goal of minimizing the sum of all these costs, as represented in Equation (
4).
4.2.3. Results
Using Pyomo [
33], a Python package for solving different optimization techniques, and IBM ILOG Constraint Programming Language EXecutor (CPLEX) Optimization Studio solver, the model was executed for the one week of data. The optimization took 67.87 s. The results obtained for the different days are displayed in
Table 3,
Table 4 and
Table 5, grouped by day.
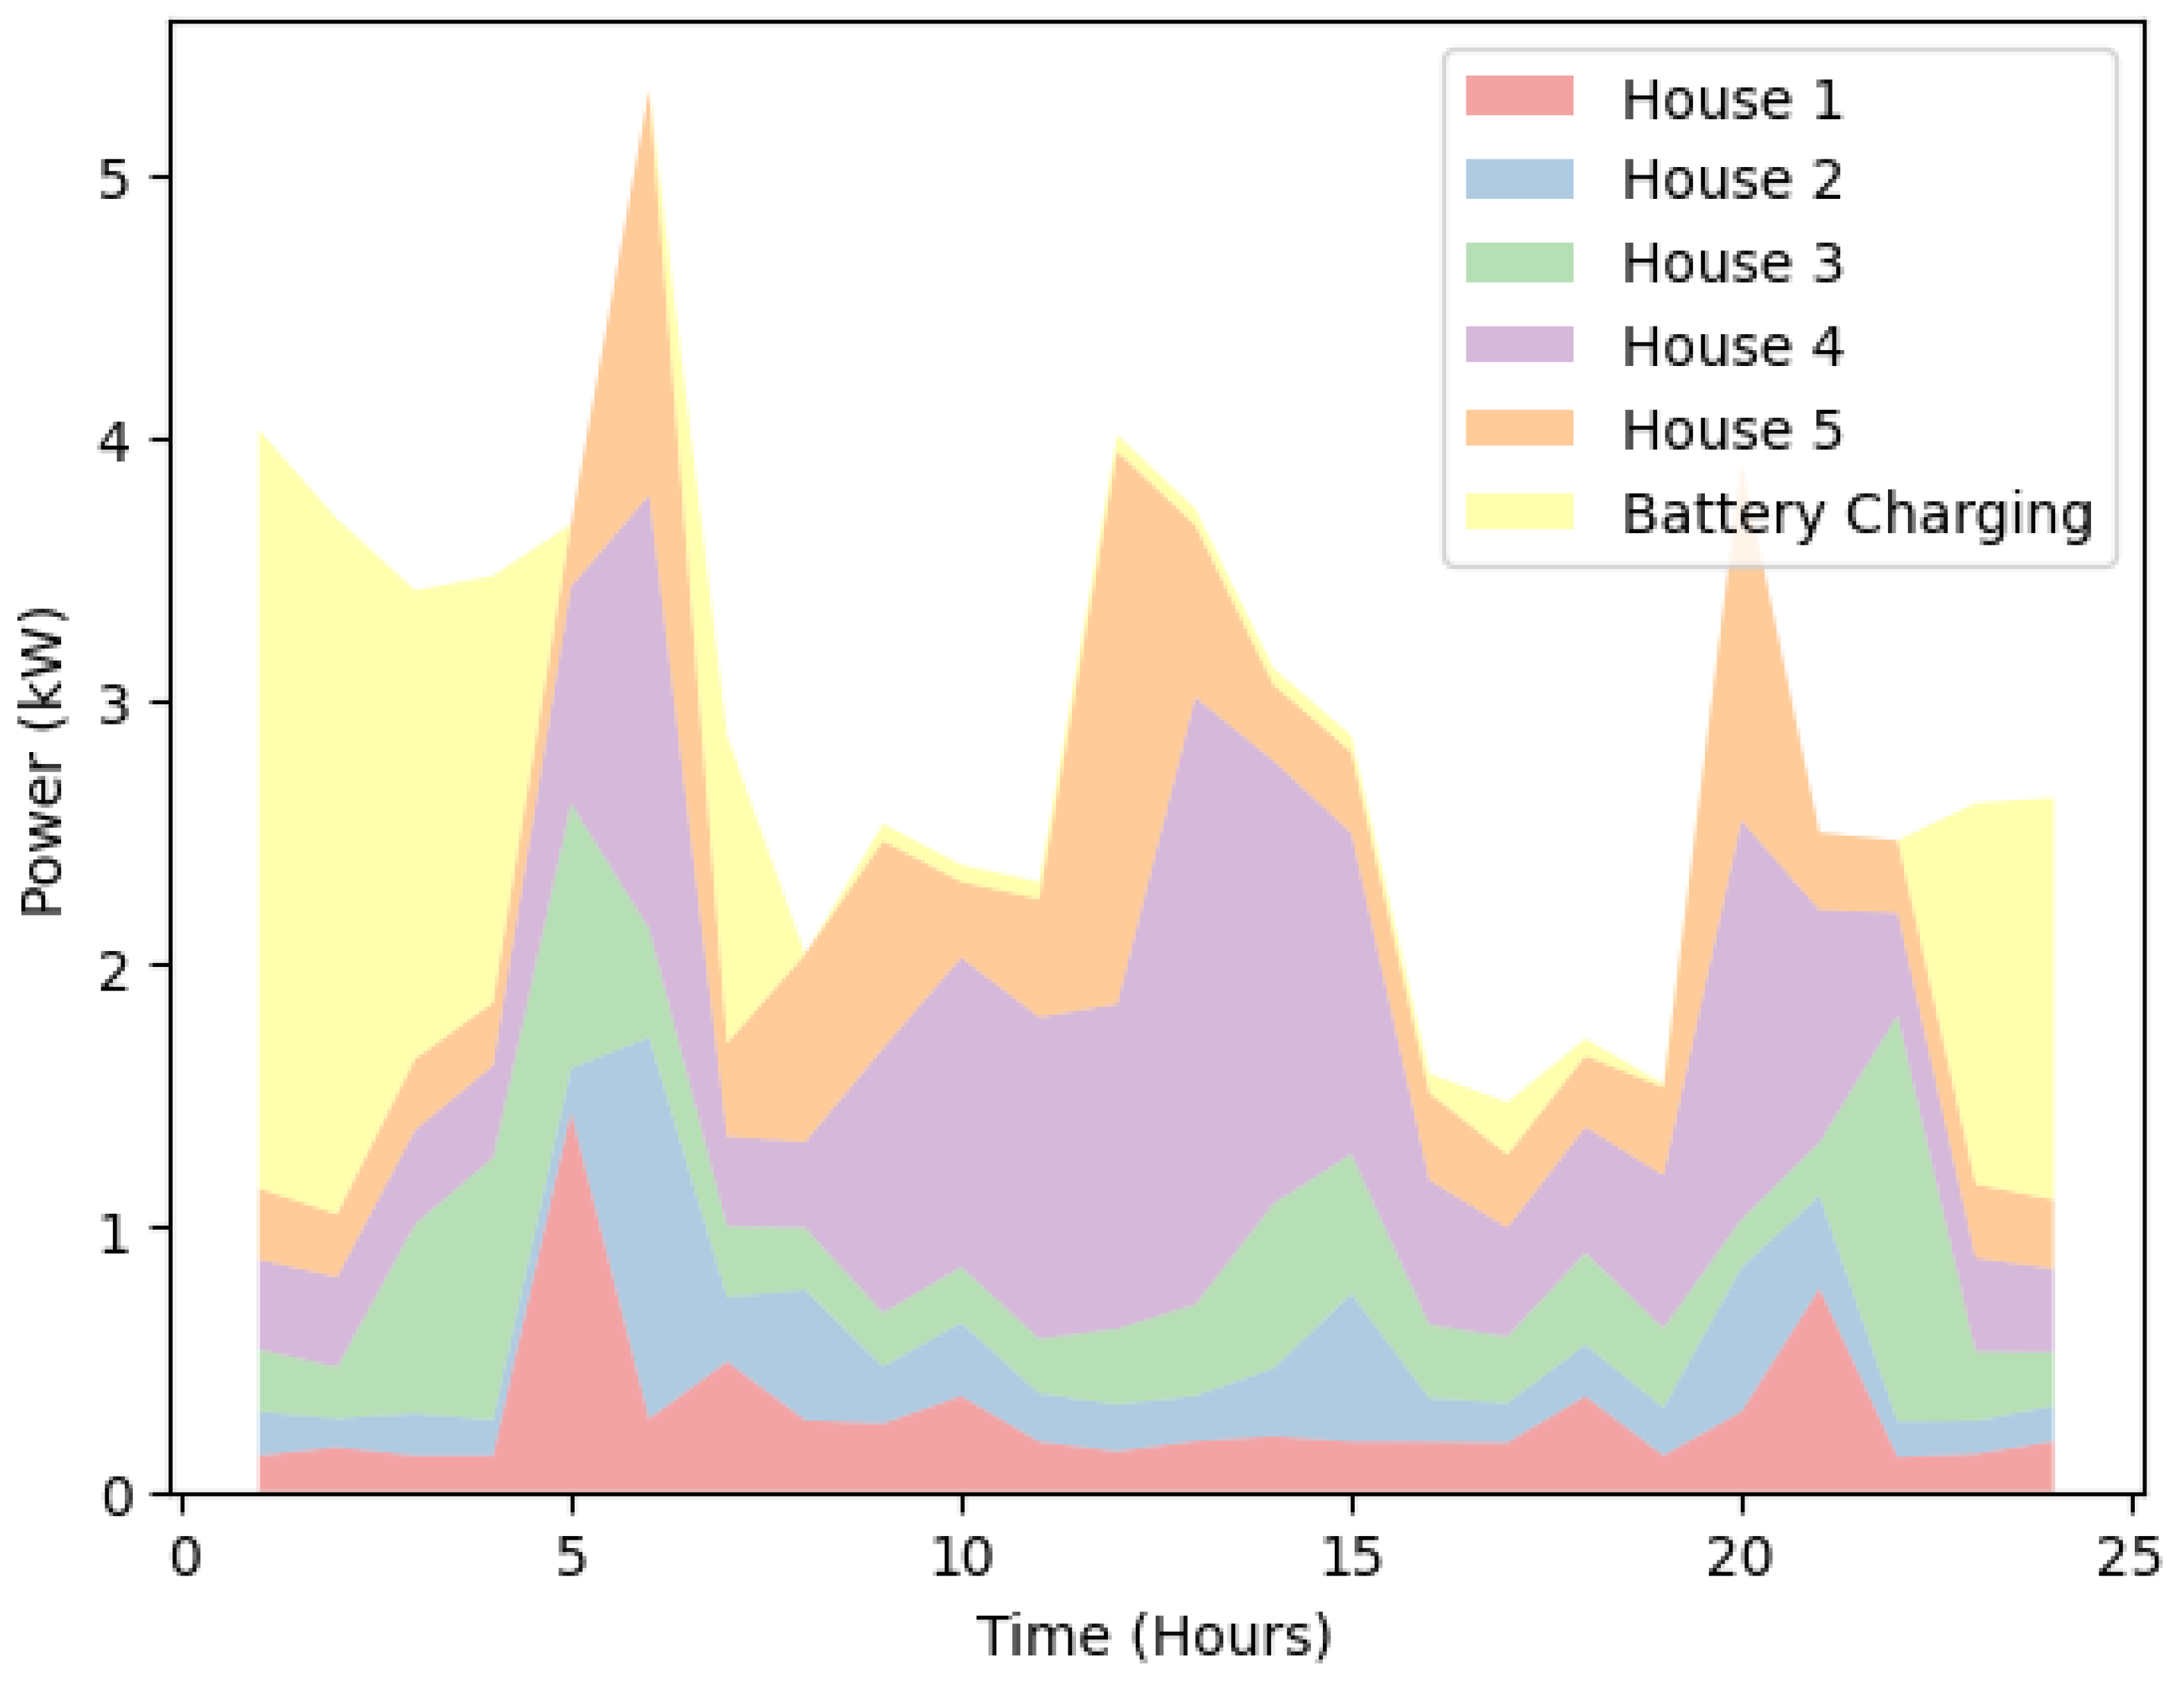
The consumption values of each house and the battery charging are illustrated in
Table 3. The production of the two renewable sources, the battery discharging, and grid imports are represented in
Table 4. Additionally, in
Table 5, it is possible to observe the energy charged and discharged from the battery on the different days of the week, along with the average state of charge in percent.
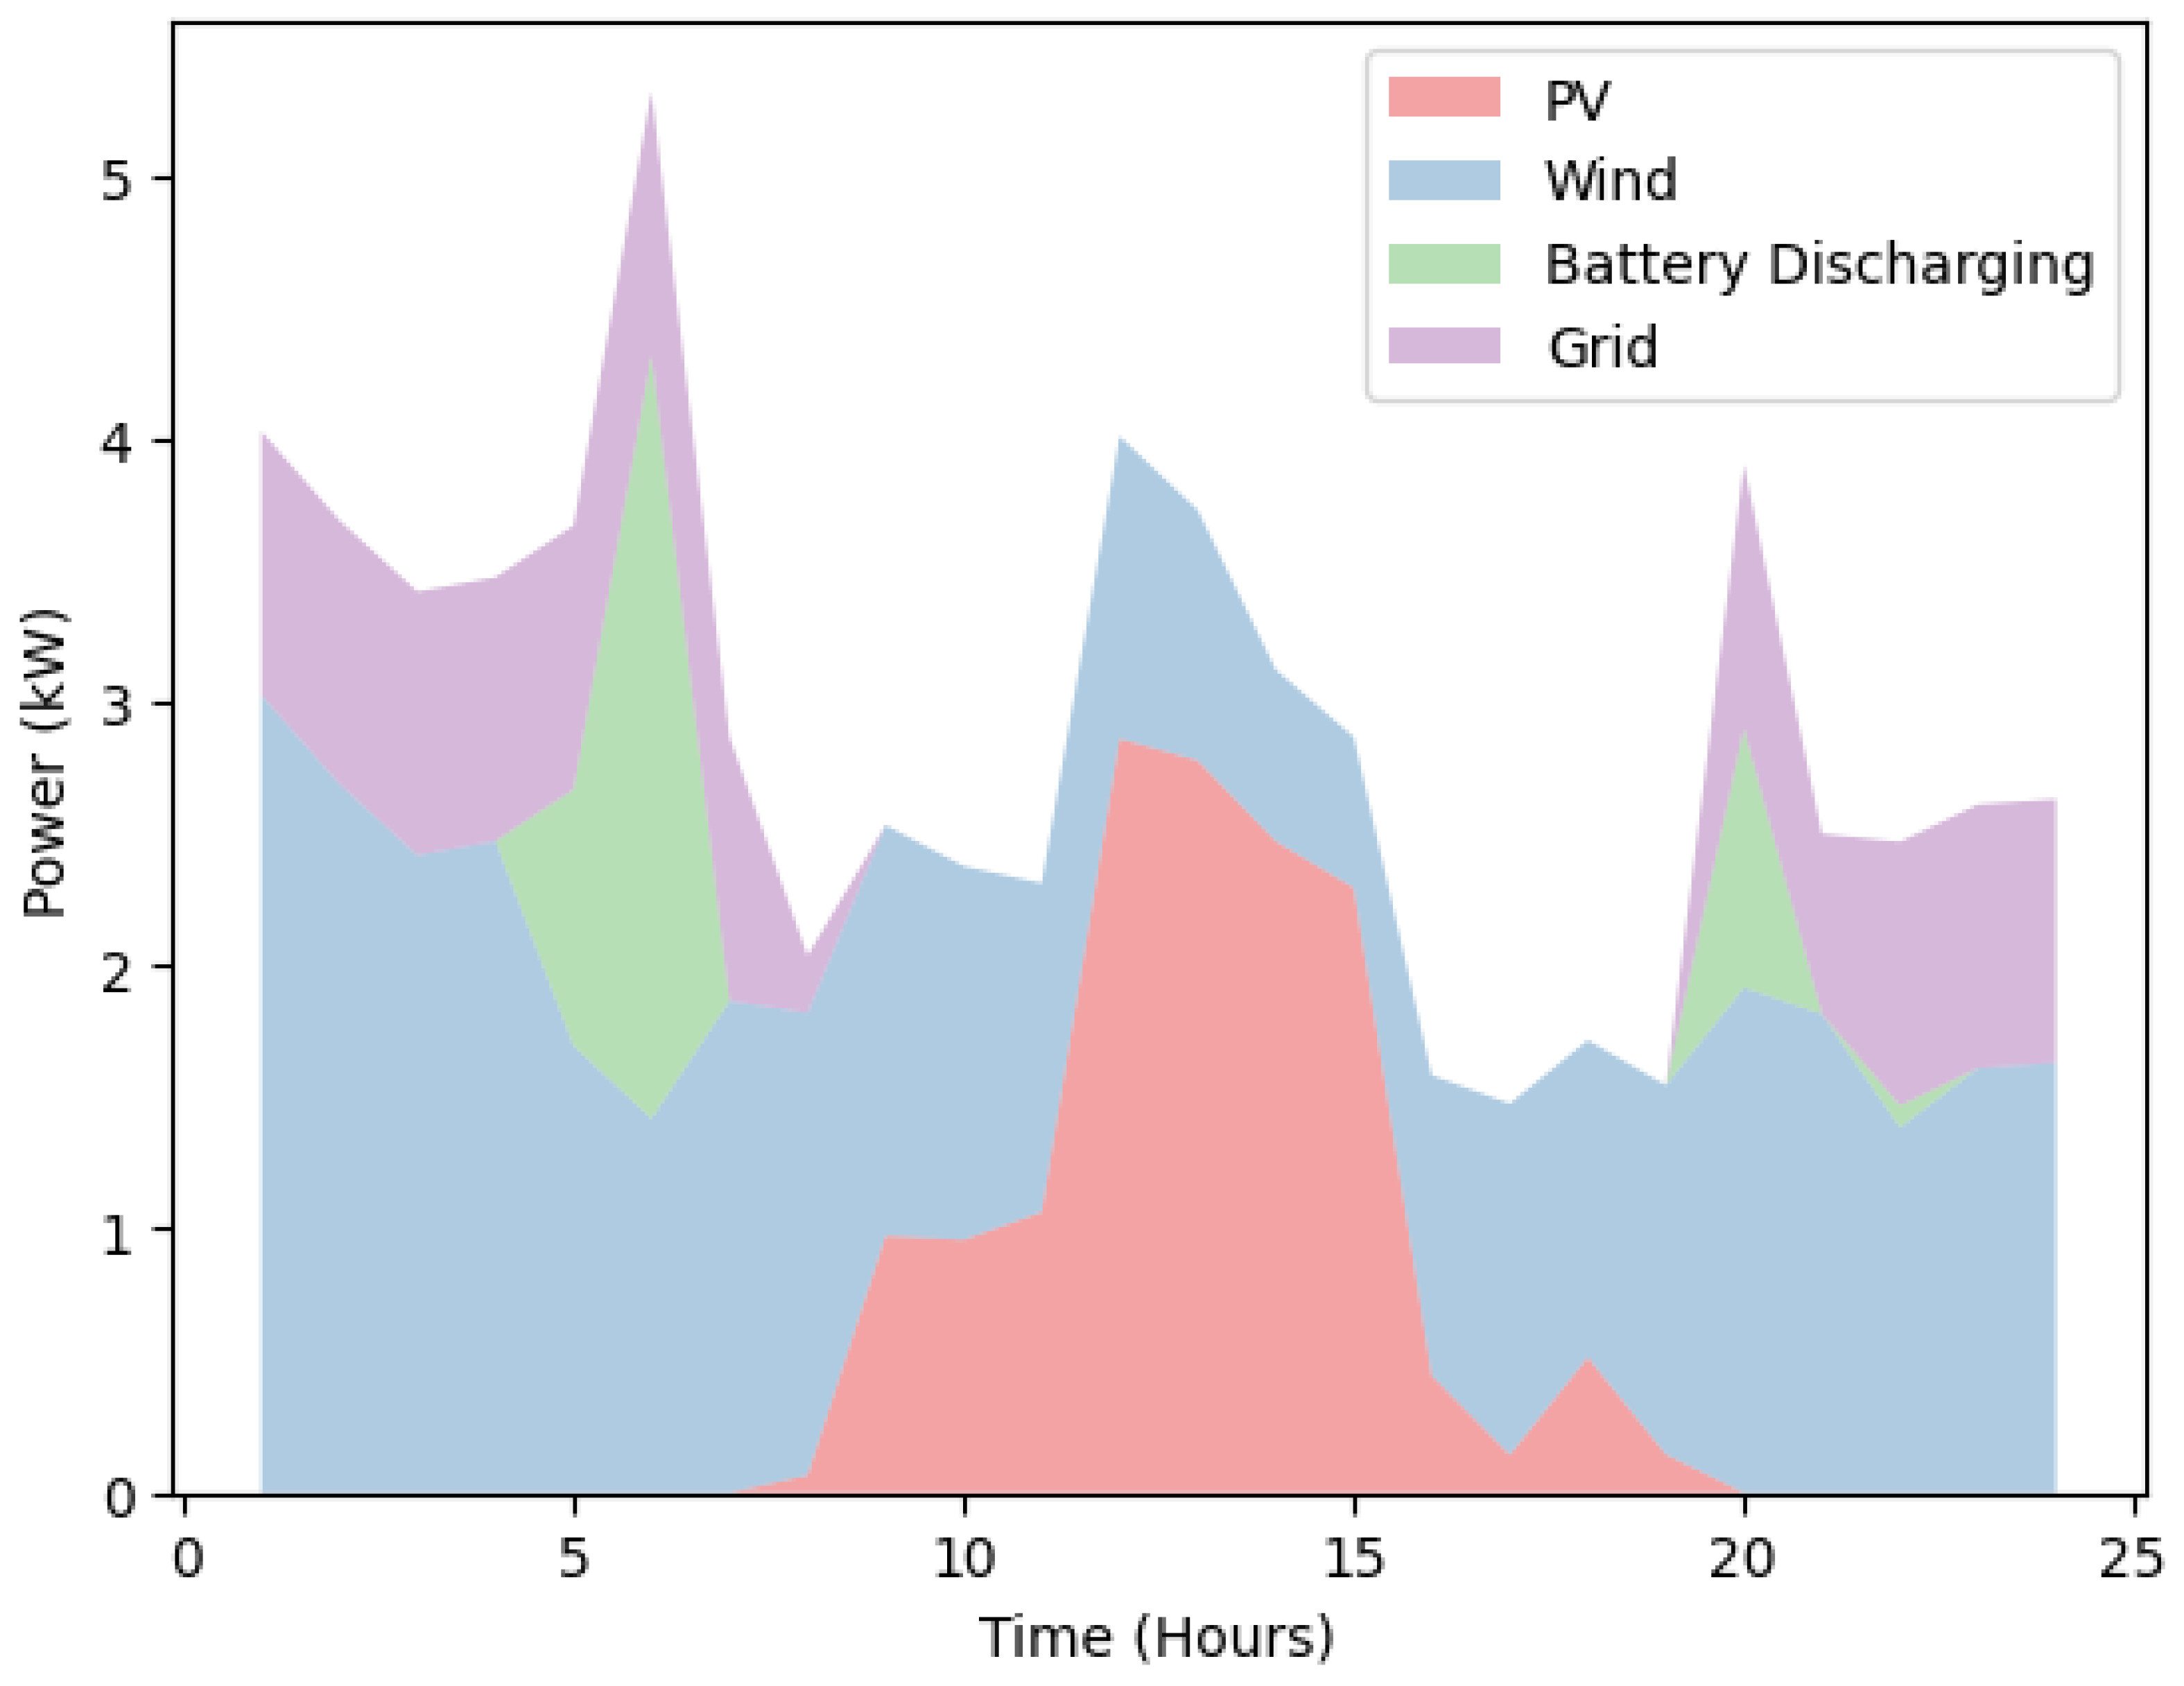
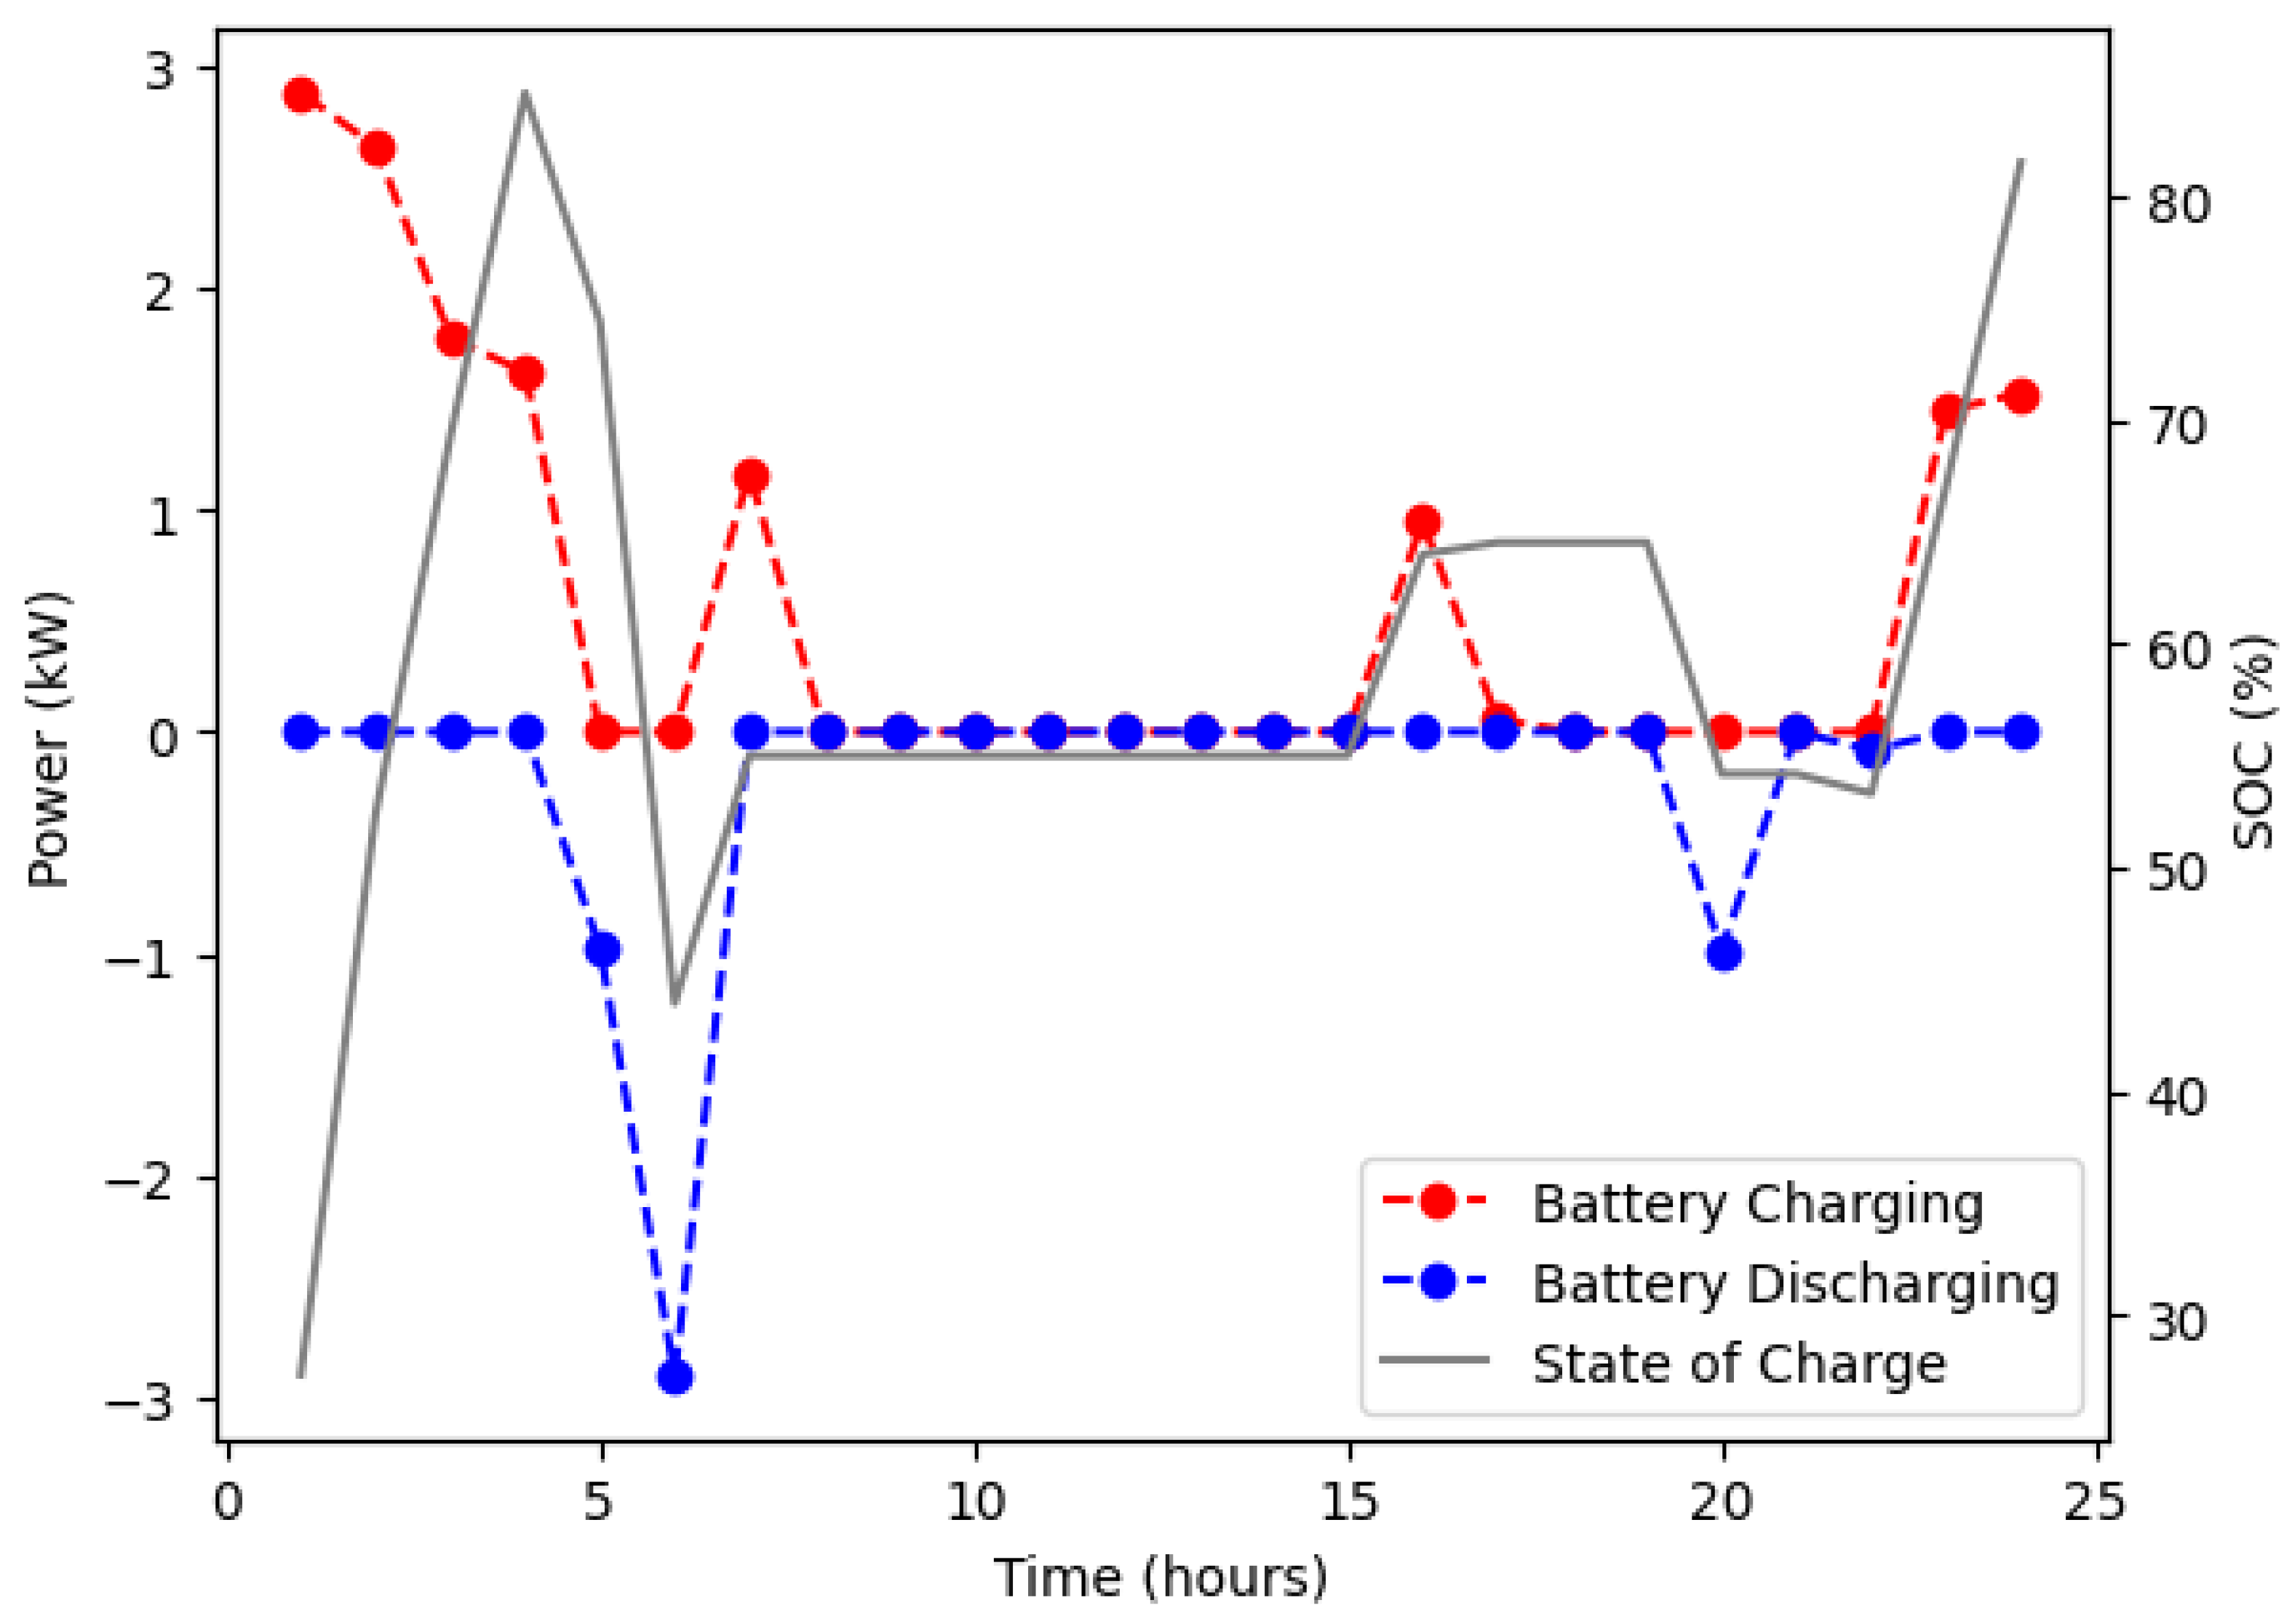
Figure 8,
Figure 9 and
Figure 10 graphically show the aforementioned results only for the first day of the week. When comparing the first two graphs, it is easy to visualize that the load is balanced at every instant of the day. Moreover, when visualizing the third one, it is easily visible that the charge and discharge maximum power constraints (i.e., 3 kW) are being fulfilled. Furthermore, it is possible to see that the minimum and maximum SOC limits are respected.
5. Conclusions
In this paper, PROCSIM, an open-source Python energy community simulator that enables researchers to develop and customize multiple scenarios for creating ECs datasets for various purposes is proposed. It allows researchers to evaluate different load balancing strategies, which is very relevant in a context where EC datasets are very scarce. The implementation employs a modular approach, hence enabling researchers to re-use, replace, or add new modules. The simulator also comprises integration with a household consumption generation tool, a weather forecasting tool, and a photovoltaic energy system. Lastly, it has a module for implementing various control strategies and provides implementations of multiple energy-related metrics that can be used to quickly assess the impact of the developed approaches on the communities.
We also demonstrated how to use PROCSIM through a case study with two experiments. The first one showed how a dataset can be created, whereas the second one showed how to use the generated dataset to implement and evaluate an optimization model that uses a battery to minimize consumption costs.
Ultimately, it has been shown that PROCSIM is capable of generating energy community power demand and generation scenarios considering different types and characteristics of ECs, which can be adapted and personalized according to the user’s objectives. The datasets generated by PROCSIM are useful for a range of purposes. While the presented case study only considers the optimal control of a community BESS, the generated datasets can be used in a myriad of scenarios. For example, to evaluate NILM algorithms or new methodologies for understanding consumption patterns in households.
However, despite the promising results, there are some limitations and some future work that will continue to be developed. This includes the need to develop a Graphical User Interface (GUI) and an automatic way to generate realistic houses with the minimum user effort. In the current version, this process is manual and requires a long time to define the house’s behavior and configure the communities. Future work will also focus on implementing Electric Vehicles (EVs) and charging stations in the simulator with driving patterns and charging behaviors that are coupled with the household routines. Other future improvements will be related to the implementation of tools to simulate and analyze the power system’s quality which is an important feature to take into consideration. Furthermore, it should be possible to easily integrate an open-source tool such as pandapower to co-simulate the power grid. Future iterations of this work should also consider the addition of new domestic appliances (e.g., HVAC) which are not available in ANTGen. Likewise, it would also be interesting to add modules that increase the utility of the simulator in the research community (for instance, adding new external sources to acquire market prices).
Finally, in future work, PROCSIM could also be used to test other load balancing schemes for ECs. In this regard, it is, particularly interesting to study pro-social energy management schemes in which agents working on behalf of EC members are willing to undertake costly actions for the good of the community.
Author Contributions
Conceptualization, N.V. and L.P.; methodology, N.V., E.G., L.P. and H.M.; formal analysis, L.P. and H.M.; writing—original draft preparation, N.V.; review and editing, L.P. and H.M.; supervision, L.P. and H.M. All authors have read and agreed to the published version of the manuscript.
Funding
This work received funding from the Portuguese Foundation for Science and Technology (FCT) under grant 2021.07754.BD (E.G.), CEECIND/01179/2017 (L.P.), UIDB/50009/2020 (E.G., L.P.), and UIDB/50021/2020 (H.M.).
Data Availability Statement
Conflicts of Interest
The authors declare no conflict of interest.
Nomenclature
| Cost of using energy from generators |
| Active power curtailment (on/off control) in load l in instant t [kW] |
| Active power not supplied (relaxation variable) in load l in instant t [kW] |
| Active power reduction (continuous control) in load l in instant t [kW] |
| Cost of charging the storage |
| Cost of discharging the storage |
| Cost of buying energy from the grid |
| Cost of selling energy to the grid |
| Active Power exported to the grid at instant t [kW] |
| Active Power imported from the grid at instant t [kW] |
| Active Power of generated g at instant t [kW] |
| Flexibility with discrete activation of load l at instant t [%] |
| Relaxation variable of load l at instant t |
| Active Power of load l at instant t [kW] |
| Flexibility of active power consumption of load l at instant t [%] |
| Active Power charge of storage s at instant t [kW] |
| Active Power discharge of storage s at instant t [kW] |
Abbreviations
The following abbreviations are used in this manuscript:
| API | Application Programming Interface |
| BESS | Battery Energy Storage System |
| CPLEX | Constraint Programming Language EXecutor |
| CSV | Comma Separated Values |
| DHI | Direct Horizontal Irradiance |
| DNI | Direct Normal Irradiance |
| DR | Demand Response |
| EC | Energy Community |
| EV | Electric Vehicle |
| GFS | Global Forecast System |
| GHI | Global Horizontal Irradiance |
| GUI | Graphical User Interface |
| HEMS | Home Energy Management System |
| HRRR | High Resolution Rapid Refresh |
| JSON | JavaScript Object Notation |
| MILP | Mixed Integer Linear Programming |
| NAM | North American Mesoscale |
| NFDF | National Digital Forecast Database |
| NILM | Non-Intrusive Load Monitoring |
| OF | Objective Function |
| PPC | Peak Power Contract |
| PV | Solar Photovoltaic |
| RAP | Rapid Refresh |
| REC | Renewable Energy Community |
| RES | Renewable Energy Sources |
| SC | Self-Consumption |
| SOC | State of Charge |
| SS | Self-Sufficiency |
| UML | Unified Modeling Language |
| WPL | Wind Power Library |
References
- Akpan, U.F.; Akpan, G.E. The Contribution of Energy Consumption to Climate Change: A Feasible Policy Direction. Int. J. Energy Econ. Policy 2011, 2, 21–33. [Google Scholar]
- Eltamaly, A.M.; Alotaibi, M.A.; Alolah, A.I.; Ahmed, M.A. A Novel Demand Response Strategy for Sizing of Hybrid Energy System With Smart Grid Concepts. IEEE Access 2021, 9, 20277–20294. [Google Scholar] [CrossRef]
- Brooks, N.A.; Powers, S.T.; Borg, J.M. A mechanism to promote social behaviour in household load balancing. arXiv 2020, arXiv:2006.14526. [Google Scholar]
- Bhamidi, L.; Sadhukhan, A.; Sivasubramani, S. Multi-objective optimization for demand side management in a smart grid environment. In Proceedings of the 2017 7th International Conference on Power Systems (ICPS), Shivajinagar, India, 21–23 December 2017; p. 205. [Google Scholar] [CrossRef]
- Alfaverh, F.; Denaï, M.; Sun, Y. Demand Response Strategy Based on Reinforcement Learning and Fuzzy Reasoning for Home Energy Management. IEEE Access 2020, 8, 39310–39321. [Google Scholar] [CrossRef]
- Chavali, P.; Yang, P.; Nehorai, A. A Distributed Algorithm of Appliance Scheduling for Home Energy Management System. IEEE Trans. Smart Grid 2014, 5, 282–290. [Google Scholar] [CrossRef]
- Kazmi, H.; Munne-Collado, I.; Mehmood, F.; Syed, T.A.; Driesen, J. Towards data-driven energy communities: A review of open-source datasets, models and tools. Renew. Sustain. Energy Rev. 2021, 148, 111290. [Google Scholar] [CrossRef]
- Berg, K.; Löschenbrand, M. A data set of a Norwegian energy community. Data Brief 2022, 40, 107683. [Google Scholar] [CrossRef]
- Goncalves, C.; Barreto, R.; Faria, P.; Gomes, L.; Vale, Z. Energy Community Consumption and Generation Dataset with Appliance Allocation. IFAC-PapersOnLine 2022, 55, 285–290. [Google Scholar] [CrossRef]
- Cosic, A.; Stadler, M.; Mansoor, M.; Zellinger, M. Mixed-integer linear programming based optimization strategies for renewable energy communities. Energy 2021, 237, 121559. [Google Scholar] [CrossRef]
- Giordano, A.; Mastroianni, C.; Scarcello, L.; Spezzano, G. An Optimization Model for Efficient Energy Exchange in Energy Communities. In Proceedings of the 2020 Fifth International Conference on Fog and Mobile Edge Computing (FMEC), Paris, France, 20–23 April 2020; pp. 319–324. [Google Scholar] [CrossRef]
- Buneeva, N.; Reinhardt, A. AMBAL: Realistic load signature generation for load disaggregation performance evaluation. In Proceedings of the 2017 IEEE International Conference on Smart Grid Communications (SmartGridComm), Dresden, Germany, 23–26 October 2017; pp. 443–448. [Google Scholar] [CrossRef]
- Albouys, J.; Sabouret, N.; Haradji, Y.; Schumann, M.; Inard, C. SMACH: Multi-agent Simulation of Human Activity in the Household. In Advances in Practical Applications of Survivable Agents and Multi-Agent Systems: The PAAMS Collection, 17th International Conference, PAAMS 2019, Ávila, Spain, 26–28 June 2019; Lecture Notes in Computer Science; Demazeau, Y., Matson, E., Corchado, J.M., De la Prieta, F., Eds.; Springer International Publishing: Cham, Switzerland, 2019; pp. 227–231. [Google Scholar] [CrossRef]
- Pflugradt, N. LoadProfileGenerator. 2015. Available online: https://www.loadprofilegenerator.de/ (accessed on 18 October 2022).
- Pereira, L.; Nunes, N. Performance evaluation in non-intrusive load monitoring: Datasets, metrics, and tools—A review. WIREs Data Min. Knowl. Discov. 2018, 8, e1265. [Google Scholar] [CrossRef]
- Kelly, J.; Knottenbelt, W. The UK-DALE dataset, domestic appliance-level electricity demand and whole-house demand from five UK homes. Sci. Data 2015, 2, 150007. [Google Scholar] [CrossRef]
- Murray, D.; Stankovic, L.; Stankovic, V. An electrical load measurements dataset of United Kingdom households from a two-year longitudinal study. Sci. Data 2017, 4, 160122. [Google Scholar] [CrossRef]
- Pereira, L.; Quintal, F.; Gonçalves, R.; Nunes, N.J. SustData: A Public Dataset for ICT4S Electric Energy Research. In Proceedings of the 2014 conference ICT for Sustainability, Stockholm, Sweden, 24–27 August 2014; Advances in Computer Science Research. Atlantis Press: Amsterdam, The Netherlands, 2014. [Google Scholar] [CrossRef]
- Pereira, L.; Costa, D.; Ribeiro, M. A residential labeled dataset for smart meter data analytics. Sci. Data 2022, 9, 1–11. [Google Scholar]
- Kriechbaumer, T.; Jacobsen, H.A. BLOND, a Building-Level Office Environment Dataset of Typical Electrical Appliances. Sci. Data 2018, 5, 180048. [Google Scholar] [CrossRef]
- Batra, N.; Parson, O.; Berges, M.; Singh, A.; Rogers, A. A Comparison of Non-Intrusive Load Monitoring Methods for Commercial and Residential Buildings. arXiv 2014, arXiv:1408.6595. [Google Scholar]
- Pereira, L. FIKElectricity: A Electricity Consumption Dataset from Three Restaurant Kitchens in Portugal. Data 2021, 6, 26. [Google Scholar] [CrossRef]
- Klemenjak, C.; Kovatsch, C.; Herold, M.; Elmenreich, W. A synthetic energy dataset for non-intrusive load monitoring in households. Sci. Data 2020, 7, 108. [Google Scholar] [CrossRef]
- Harell, A.; Jones, R.; Makonin, S.; Bajic, I.V. PowerGAN: Synthesizing Appliance Power Signatures Using Generative Adversarial Networks. arXiv 2020, arXiv:2007.13645. [Google Scholar]
- Reinhardt, A. Areinhardt/Antgen. 2020. Original-Date: 2020-05-14T08:42:49Z. Available online: https://github.com/areinhardt/antgen (accessed on 18 May 2022).
- Amouroux, E.; Huraux, T.; Sempe, F.; Sabouret, N.; Haradji, Y. SMACH: Agent-Based Simulation Investigation on Human Activities and Household Electrical Consumption. In Proceedings of the Agents and Artificial Intelligence, Lisbon, Portugal, 10–12 January 2014; Communications in Computer and Information Science. Filipe, J., Fred, A., Eds.; Springer: Berlin/Heidelberg, Germany, 2014; pp. 194–210. [Google Scholar] [CrossRef]
- Holmgren, W.F.; Hansen, C.W.; Stein, J.S.; Mikofski, M.A. Review of Open Source Tools for PV Modeling. In Proceedings of the 2018 IEEE 7th World Conference on Photovoltaic Energy Conversion (WCPEC) (A Joint Conference of 45th IEEE PVSC, 28th PVSEC & 34th EU PVSEC), Waikoloa Village, HI, USA, 10–15 June 2018; pp. 2557–2560, ISSN 0160-8371. [Google Scholar] [CrossRef]
- Andrews, R.W.; Stein, J.S.; Hansen, C.; Riley, D. Introduction to the open source PV LIB for python Photovoltaic system modelling package. In Proceedings of the 2014 IEEE 40th Photovoltaic Specialist Conference (PVSC), Denver, CO, USA, 8–13 June 2014; pp. 0170–0174, ISSN 0160-8371. [Google Scholar] [CrossRef]
- Klise, K.A.; Stein, J.S. Automated performance monitoring for PV systems using pecos. In Proceedings of the 2016 IEEE 43rd Photovoltaic Specialists Conference (PVSC), Portland, OR, USA, 5–10 June 2016; pp. 3431–3435. [Google Scholar] [CrossRef]
- Donatelli, M.; Bellocchi, G.; Habyarimana, E.; Confalonieri, R.; Micale, F. An extensible model library for generating wind speed data. Comput. Electron. Agric. 2013, 69, 165–170. [Google Scholar] [CrossRef]
- Fernandes, F.; Morais, H.; Vale, Z. Near real-time management of appliances, distributed generation and electric vehicles for demand response participation. Integr.-Comput.-Aided Eng. 2022, 29, 313–332. [Google Scholar] [CrossRef]
- Morais, H.; Kádár, P.; Faria, P.; Vale, Z.A.; Khodr, H. Optimal scheduling of a renewable micro-grid in an isolated load area using mixed-integer linear programming. Renew. Energy 2010, 35, 151–156. [Google Scholar] [CrossRef]
- Hart, W.E.; Watson, J.P.; Woodruff, D.L. Pyomo: Modeling and Solving Mathematical Programs in Python. Math. Program. Comput. 2011, 3, 219. [Google Scholar] [CrossRef]
| Disclaimer/Publisher’s Note: The statements, opinions and data contained in all publications are solely those of the individual author(s) and contributor(s) and not of MDPI and/or the editor(s). MDPI and/or the editor(s) disclaim responsibility for any injury to people or property resulting from any ideas, methods, instructions or products referred to in the content. |
© 2023 by the authors. Licensee MDPI, Basel, Switzerland. This article is an open access article distributed under the terms and conditions of the Creative Commons Attribution (CC BY) license (https://creativecommons.org/licenses/by/4.0/).


