1. Introduction
China announced a very ambitious goal of lowering its carbon intensity regarding GDP decreased by 60–65% in 2030 compared with 2005 [
1]. Furthermore, China has voluntarily pledged to achieve a carbon emissions peak and increase the share of non-fossil fuels in primary energy consumption to around 25% by 2030 [
2]. With the greatest CO
2 emissions and as a responsible country globally, China has adopted a series of ambitious domestic policies to meet the targets. To achieve these goals, in the 14th Five-Year Plan (2020–2025), the Chinese government set a 14.5% reduction target in energy intensity during that time period [
3,
4]. China will need to adopt tangible measures and realistic actions, such as constructing the national carbon market, reporting and verifying the carbon emissions from different sectors, allocating the allowances to the provinces, setting carbon intensity reduction targets at the province level, assigning responsibility for different levels of coal control, and non-fossil energy development target to China’s provinces. The seven regional emissions trading pilots of Guangdong, Hubei, Beijing, Shanghai, Tianjin, Chongqing, and Shenzhen were built in 2013, with the national carbon market launched in 2021 [
5].
Existing studies have proved that a market-based method of carbon pricing is more flexible and better than the obligated regulation, especially not so much to harm social welfare [
6]. Carbon pricing includes carbon market trading and carbon tax, but the implementation methods are different. Moreover, there is a trend to make a resource and environmental tax reform in the plan [
7]. Carbon tax through the Department of Price Monitory would play a role in managing the cost and fluctuation [
8]. So carbon tax is an effective method to complete the emission reduction target [
9].
The government has promised the CO
2 emissions peak in 2030, but it is a very tough job to complete this reduction target. To discuss the feasibility and economic impact of this target, it needs to construct a model to simulate the impact of carbon cost on the economy and industry output. Especially, there is a large regional disparity between resource endowment and socio-economic development in China’s regions [
10]. How do we allocate the reduction target in the different regions and bring the least cost to the whole of China’s economy and industry competitiveness and leakage of CO
2 between these regions? What is the reasonable carbon price to cause the emission peak needed to test? What is the effect of setting different carbon prices that impact the different provinces' reduction according to the region disparity? It is necessary to research these questions in the whole economy under the peak emission target under the constraint of carbon pricing.
Against this background, the computable general equilibrium (CGE) models are used in estimating the impacts of policies such as carbon pricing, carbon emission trading, or transfer instruments under the obligation reduction target between regions' inflow and outflow [
11,
12,
13,
14]. The supply and demand of products are equalized across the markets, and the price will support the equilibrium [
15]. Existing studies using a CGE model to assess the effect of a carbon tax levied in such countries as New Zealand, Denmark, Ireland, and China concluded that the carbon tax policy would promote carbon emissions reduction but affect GDP [
16,
17,
18,
19,
20,
21]. Chen finds that the carbon tax will impact the industrial output [
22]. Liu investigates that the carbon tax rate at 10–30 yuan/t-CO
2 would be preferable and realistic in China but on the condition of allowing tax relief in energy-intensive sectors [
23]. Liang et al. analyzed the carbon tax on different sector outputs and the changes in exports based on a CGE model and discussed the effect of the border tax adjustment [
24]. In addition, a review of the carbon tax policy is investigated with different methods by different researchers in different countries [
25]. Zhai used a multi-dimensional carbon policy (CMDCP) model to find that the carbon tax was 100 yuan/ton and would cause Guangdong’s GDP to drop less than 0.5% [
26]. To achieve the carbon neutralization target, carbon pricing will need to be considered, but the impact on the economy and society should be estimated [
27,
28].
Li et al. analyzed the impact of a carbon tax on GDP in Liaoning Province through the CGE model; research shows that when the carbon tax reaches 221 USD/ton, it will lead to a reduction of 44.92% in carbon emissions and a loss of 5.54% in GDP [
29]. Huijuan Dong and others studied the impact on the economy of six carbon tax schemes in 30 provinces of China. The results show that the power, metal, and chemical industries have high emission reduction to carbon tax policies. Inner Mongolia, Shandong, Shanxi, and Hebei have the largest carbon dioxide emission reduction after the introduction of carbon taxes [
30]. Jian Tong analyzed the path of a carbon tax to achieve the peak of carbon emissions by building a CGE model [
31], which showed that compared with other greenhouse gas (GHG) mitigation regulations, a carbon tax is more effective in curbing pollution emissions. Garabedian Sabine and others simulated the carbon tax policy of Reunion Island through the CGE model [
32], which showed that a carbon tax could replace fossil energy with renewable energy production and reduce carbon dioxide emissions. However, tax has a negative impact on the overall economy, but the implementation of the tax recovery compensation mechanism has alleviated the negative impact. Qingwei Shi and others analyzed the impact of a carbon tax on China’s construction industry through the CGE model. The research results show that the carbon tax in the construction industry is set at about 60 yuan/t, which can achieve the goal of reaching the peak in 2025 and reduce the negative impact of macroeconomics [
33]. Linboqiang et al. quantitatively analyzed the impact of a staged carbon tax on Guangdong’s macroeconomy through a CGE-based CMDCP model. The study found that when the carbon tax is 100 yuan/ton or less, the impact on Guangdong’s economy is less than 0.5%, but it can bring about 1.2 to 1.6 million tons of carbon emission reduction. At the same time, it is suggested to implement a tiered carbon tax to flexibly adjust the carbon price [
34].
At present, many papers use the CGE model to study the carbon tax policy on the economy and CO
2 emission reduction [
29,
30,
31,
32,
33] but lack the region’s inflow and outflow evaluation and how the competitiveness loss will be estimated when reaching emission peak under the carbon price. In addition, if the input–output table is only available at several discontinuous times, a CGE model is undoubtedly an appropriate method to deal with the limited data and can be used for predicting the impact of the carbon tax, which brings the peak emission target on the economy and industry. Often, when using a CGE model, the carbon tax rate is set under several fixed scenarios, which can be used to compare different carbon tax rates in the economy and industrial outputs in and between regions.
There is a concern about the industrial competitiveness and leakage of CO2 emissions, so it is necessary to evaluate the impact of a carbon tax on the sector and a different province. Further, by using the computable general equilibrium (CGE) model, most studies focus on the whole country and the lack of different regions’ carbon tax comparison and the change in carbon tax value. Most studies consider the impact of a carbon tax on a fixed price using a static CGE model to assess the impact of a carbon tax on the sector for the future year, such as 2020 or 2030. The difference in this study compared with other studies is that the value of carbon price is to be set considering the peak of 2030 in China and Guangdong; at the same time, a further increased carbon price is to be set to ensure the carbon peak until 2030.
Guangdong Province is an important export-oriented economic province of China and takes the lead in achieving carbon peak and carbon neutrality, which will help the country to achieve its goals. At the same time, it will be conducive to exploring industrial and economic transformation models, providing an experience for other provinces. Guangdong has implemented carbon emission trading (ETS) since 2013, expanding industry coverage except for power, cement, oil refinery, iron, and steel.
Especially in this study, the difference in the carbon tax setting scheme between Guangdong and ROC is designed to study the competitiveness of the same and different sectors when implementing different carbon tax schemes. Further, not only at the macroeconomic level but also at the sector level, the relationship between the industrial competitiveness of different sectors and carbon tax schemes is identified, and the results are suitable for regional policymakers to support the national carbon trading cap construction and to avoid the loss of competitiveness and carbon leakage.
More especially, China has different regions and more inter-region trade between each other. If one region adds the carbon tax, it will not only impact the sector benefit of this region directly, but it will also impact the provincial import and export indirectly. The study attempts to integrate these topics, which are usually covered in isolation both in empirical and theoretical studies: carbon taxation schemes, carbon market, industrial policy, and the interconnection between carbon taxation and modern industrial policy. A well-rounded understanding of interactions between these factors is crucial for assuring a stable functioning of the carbon dioxide emissions market and steady progress toward the achievement of environmental and sustainable development goals. So, it is necessary to assess the impact of the quantity and value of the carbon tax in one region and how the carbon price brings further impact on the other regions, such as the provincial trade products, with each other.
The rest of the paper is organized as follows:
Section 2 introduces the methodology and data, the scenario setting, and the setting of carbon tax schemes. The results are presented in
Section 3. Some discussions and corresponding policy recommendations are presented in
Section 4. Finally, conclusions and further work are presented in
Section 5.
2. Methodology and Data
2.1. Overview of China and the Focused Regions
In 2020, China’s energy consumption was 4.98 billion tons of standard coal, of which coal consumption accounts for 57%, and CO
2 related to energy consumption was about 9.79 billion tons [
10]. As the biggest economy province of Guangdong, its energy consumption was 0.345 billion standard tons in 2020, and CO
2 related to energy consumption was about 0.569 billion tons, accounting for 6% of China's total emissions [
35].
Guangdong consumes a huge amount of energy thanks to its economic size, as shown in
Table 1. Guangdong consumed 4%, 10%, 8%, and 14% of the national total coal, oil, natural gas, and primary electricity in 2020, respectively. Guangdong Province’s primary energy consumption was 345 million tons of coal equivalence (mtce), with the shares of coal, crude oil, natural gas, and primary electricity being 31%, 27%, 10%, and 31%, respectively. Meanwhile, Guangdong’s energy and emissions account for 7% and 6% of China and contribute 11% of China's GDP. So, from different region disparity and manufacturing- and export-oriented province perspectives, it is important to evaluate the impact of carbon tax policy on the provincial industry and inter-region industry competitiveness and carbon leakage under the complete peak emission target for China and the world.
2.2. Model
This research uses a two-region recursive CGE model that includes Guangdong (GD) Province and the rest of China (ROC). The technical in-detail description of the module is provided [
36]. The power sector has been separated into eight power technologies, shown in
Table 2 [
37]. The model data use the input and output table of China and Guangdong in 2007 [
38]. The features of the two-region CGE model are similar to the one-region version [
39]. To evaluate the carbon tax impact, the module includes a production block, a market block with domestic and international transactions, government and household income, and expenditure blocks built for computing the GDP, added value, energy consumption, and carbon emissions. The concept and the index are defined in the
Appendix A.
The GD_CGE model is solved by a one-year step in a recursive dynamic manner toward 2030. Some assumptions and relationship parameters such as energy efficiency improvement (EEI), total factor productivity (TFP), GDP, and population are designed in
Table 3.
2.3. Scenarios
The time horizon of this study is from 2007 to 2030, and the economic growth is driven by exogenous assumptions on investment and technology improvement. The common assumptions, such as GDP, TFP, EEI, and population growth rate, are given based on China and Guangdong’s development plan and research assumptions in
Table 3.
The projections on the population and GDP of China are based on the IEA economic development prediction and research assumptions in China. For Guangdong, the projection of GDP is based on the economic plan and research assumption, and the population increased from 97.3 million in 2010 to 108.5 million in 2015, reaching 111.24 million in 2020. Where each scenario set the same rate of population growth in Guangdong, for Guangdong in 2030, the population reached 11,323,9844 people from 94,490,000, 1.198 times the 2007 population in
Table 3.
As shown in
Figure 1, based on the assumptions in the BaU (Business As Usual, BaU) scenario, the six carbon tax scenarios envision that the different manner of the carbon tax is imposed on all economic sectors of the two regions so that the carbon intensity in terms of GDP will fall by 65% from 2005 to 2030, which is consistent with the national INDCs commitment. As shown in
Figure 1, there is only one carbon tax pathway for Guangdong, increasing to 700 yuan/ton-CO
2 in 2030. By contrast, as implied by the scenario name, the tax rate of ROC is 0/4, 2/4, 3/4, 4/4, 5/4, or 6/4 of the level of Guangdong Province in 2030, which are T0_4, T2_4, T3_4, T4_4, T5_4, and T6_4 scenarios, respectively [
31,
40,
41]. The purpose of such a setting is to test the impacts on Guangdong’s industry activity when Guangdong and the rest of China are faced with different levels of carbon mitigation costs.
3. Results and Analysis
3.1. The Trend of Energy Consumption, CO2 Emissions, and Their Intensity
In this section, we consider the output implications of seven scenario policy options. Before analysis of the main results of this study, an overall view of the socio-economic circumstances from 2007 to 2030 in GD and ROC is demonstrated in
Figure 1 and
Figure 2, respectively.
The economy of China continues to grow as investment increases and productivity improves, and energy consumption and emissions steadily rise in the BaU scenario where climate policy intervention is not in place. For instance, the per capita GDP of GD and ROC will grow by approximately 4.6- and 4.8-fold over the next two decades, increasing to approx. 19,630 and 12,180 USD in 2030. As a result, China’s consumption of primary energy and electricity in 2030 will increase to 6.21 billion tons of coal equivalent (btce) and 6.72 Peta Watt Hour (PWh), equivalent to an increase of 2.35 and 1.97 times from 2007 levels, respectively.
Consequently, China could achieve an emissions peak around 2025 under the T2_4 scenario, in which the carbon tax is 350 yuan/tCO
2 in ROC and 700 yuan/tCO
2 in Guangdong. The peak emissions will reach 788–800 million tons and 12.5 billion tons for Guangdong and China, respectively, equivalent to per capita emissions of 8.59 tons for China. The carbon intensity of GD and ROC would decrease by 61–62% and 58–70% in the mitigation scenarios from 2010 to 2030, which is more than the INDC targets in
Figure 2.
3.2. Carbon Tax in One Region Would Affect Carbon Mitigation and Economic Effects in the Other Region
3.2.1. The Change in Production Price
Figure 3 indicates that comparing the T6_4 with the BaU scenario, Guangdong’s production prices of electricity, cement, other manufacturing, glass, non-metal, and iron and steel sectors increase by 63%, 33%, 13%, 13%, 11%, and 10%, respectively. For the rest of China, the top five sectors with the biggest production price increase are electricity (increasing by 124%), iron and steel (by 29%), other manufacturing (by 26%), cement (by 15%), and mining (13%).
The reason is that most power generations in ROC are fossil fuel powers, which caused its power structure to be not cleaner than GD, so the electricity price increases higher than the GD region. As the electricity price impacts the behavior, GD will sell electricity to the ROC region for GD’s cheaper electricity price in the T6_4 scenario.
The results demonstrate that the GD’s power sector, which creates more nuclear and renewable energy, has better competitiveness than ROC’s power sector of the different power generation structures.
3.2.2. The Change in Production Output
It indicated that the sectors of electricity, iron and steel, non-metal, glass, cement, oil refinery, paper and pulp, and mining suffer more production output loss caused by the carbon tax (
Figure 4). On the opposite, some sectors, such as machinery, chemicals, textiles, and agriculture, appeared to have a positive output increase.
It is because the carbon tax lifts up the cost of energy-intensive sectors, which causes distortion in the capital return rate of the sector. This distortion brings three aspects that impact the sectors. First, the producer reduces production as the production cost increases. Second, the consumer reduces consumption as the product price increases. Third, as the sector capital return rate changes, it causes investment flow in different sectors.
Figure 4 shows another meaning, that from scenario T0_4 to T6_4, as the carbon tax rate increases in ROC, it brings some impact on GD, although the carbon tax price in GD has no change and the impacted sectors in the two regions are different. The results indicated that GD is not an isolated economy whose economy and industry will impact ROC’s mitigation policy. In GD, the output of iron and steel, oil refinery, and mining are decreasing more seriously with the increase in ROC’s carbon tax compared with BaU, as the demand for these products shrinks due to the carbon tax. Some output of machinery and electronic products are increasing to supplement the scarce domestic demand, which shows that these products are more competitive in GD than ROC.
As shown in
Figure 4, in ROC, the output of electricity, metal products, non-metal product, oil refinery, and mining is decreasing gradually. Comparing GD with ROC, the effect of loss in GD is more serious than in ROC. Because GD is an outflow-oriented province, when the ROC region implements the carbon tax further, it will bring an adverse effect on the direct outflow sector and upstream and downstream sectors related to the production chain.
3.3. Different Allocation of Carbon Tax Level among Regions
Next, we further consider the impacts of mitigation policy fairness between the two regions. T4_4 is considered a fair scenario since both regions are faced with the same carbon reduction cost, whereas other scenarios are regarded as unfair cases. T0_4, T2_4, and T3_4 scenarios are advantageous for the rest of China since it faces less mitigation costs than Guangdong, while T5_4 and T6_4 are beneficial for Guangdong. All these scenarios are compared with T4_4 to see how activity levels of Guangdong’s different industries are affected by the extent of tax unfairness.
3.3.1. Output Change
As shown in
Figure 5, surrounding GD, when comparing other scenarios with T4_4, the sector output change is positive or increased. These sectors are defined as competitive sectors, such as chemicals, non-ferry (NF) metal, machinery, electronics, and construction, and others are defined as non-competitive sectors.
The iron and steel sector output change rate in GD is changing from positive output (40%) in T0_4 to negative output (−20%) in T6_4, but ROC’s iron and steel output is changing from 20% to −10%.
The results show that the output of both regions improves in T0_4 to T3_4, but in T5_4 and T6_4, the output deteriorates. So, compared with the equal carbon tax rate mitigation scenarios, the T0_4 to T3_4 scenario is better than T5_4 and T6_4.
When GD’s external environment as ROC suffers tax from T0_4 to T6_4, the sector output of chemicals, NF metal, machinery, electronics, and construction indicated a growth, which means the competitive sectors in these scenarios. The other sectors, such as agriculture, food, other manufacturing, transport, and service, suffer output loss in T6_4 compared with T4_4, which are non-competitive.
The reason the sector's output benefited is that cost increases in the ROC products sector, which results in the product sector in Guangdong having market competition in domestic and international demand, further resulting in the increased output.
Because the carbon tax settings in scenarios (T0_4 to T6_4) lead to the uneven distribution of the reduction burden, each industry of the two regions is facing the unequal cost upward price caused by the uneven reduction pressure. Then, this uneven production price of each industry will impact the outflow, inflow, import, and export, which further affects the sector output of the two regions.
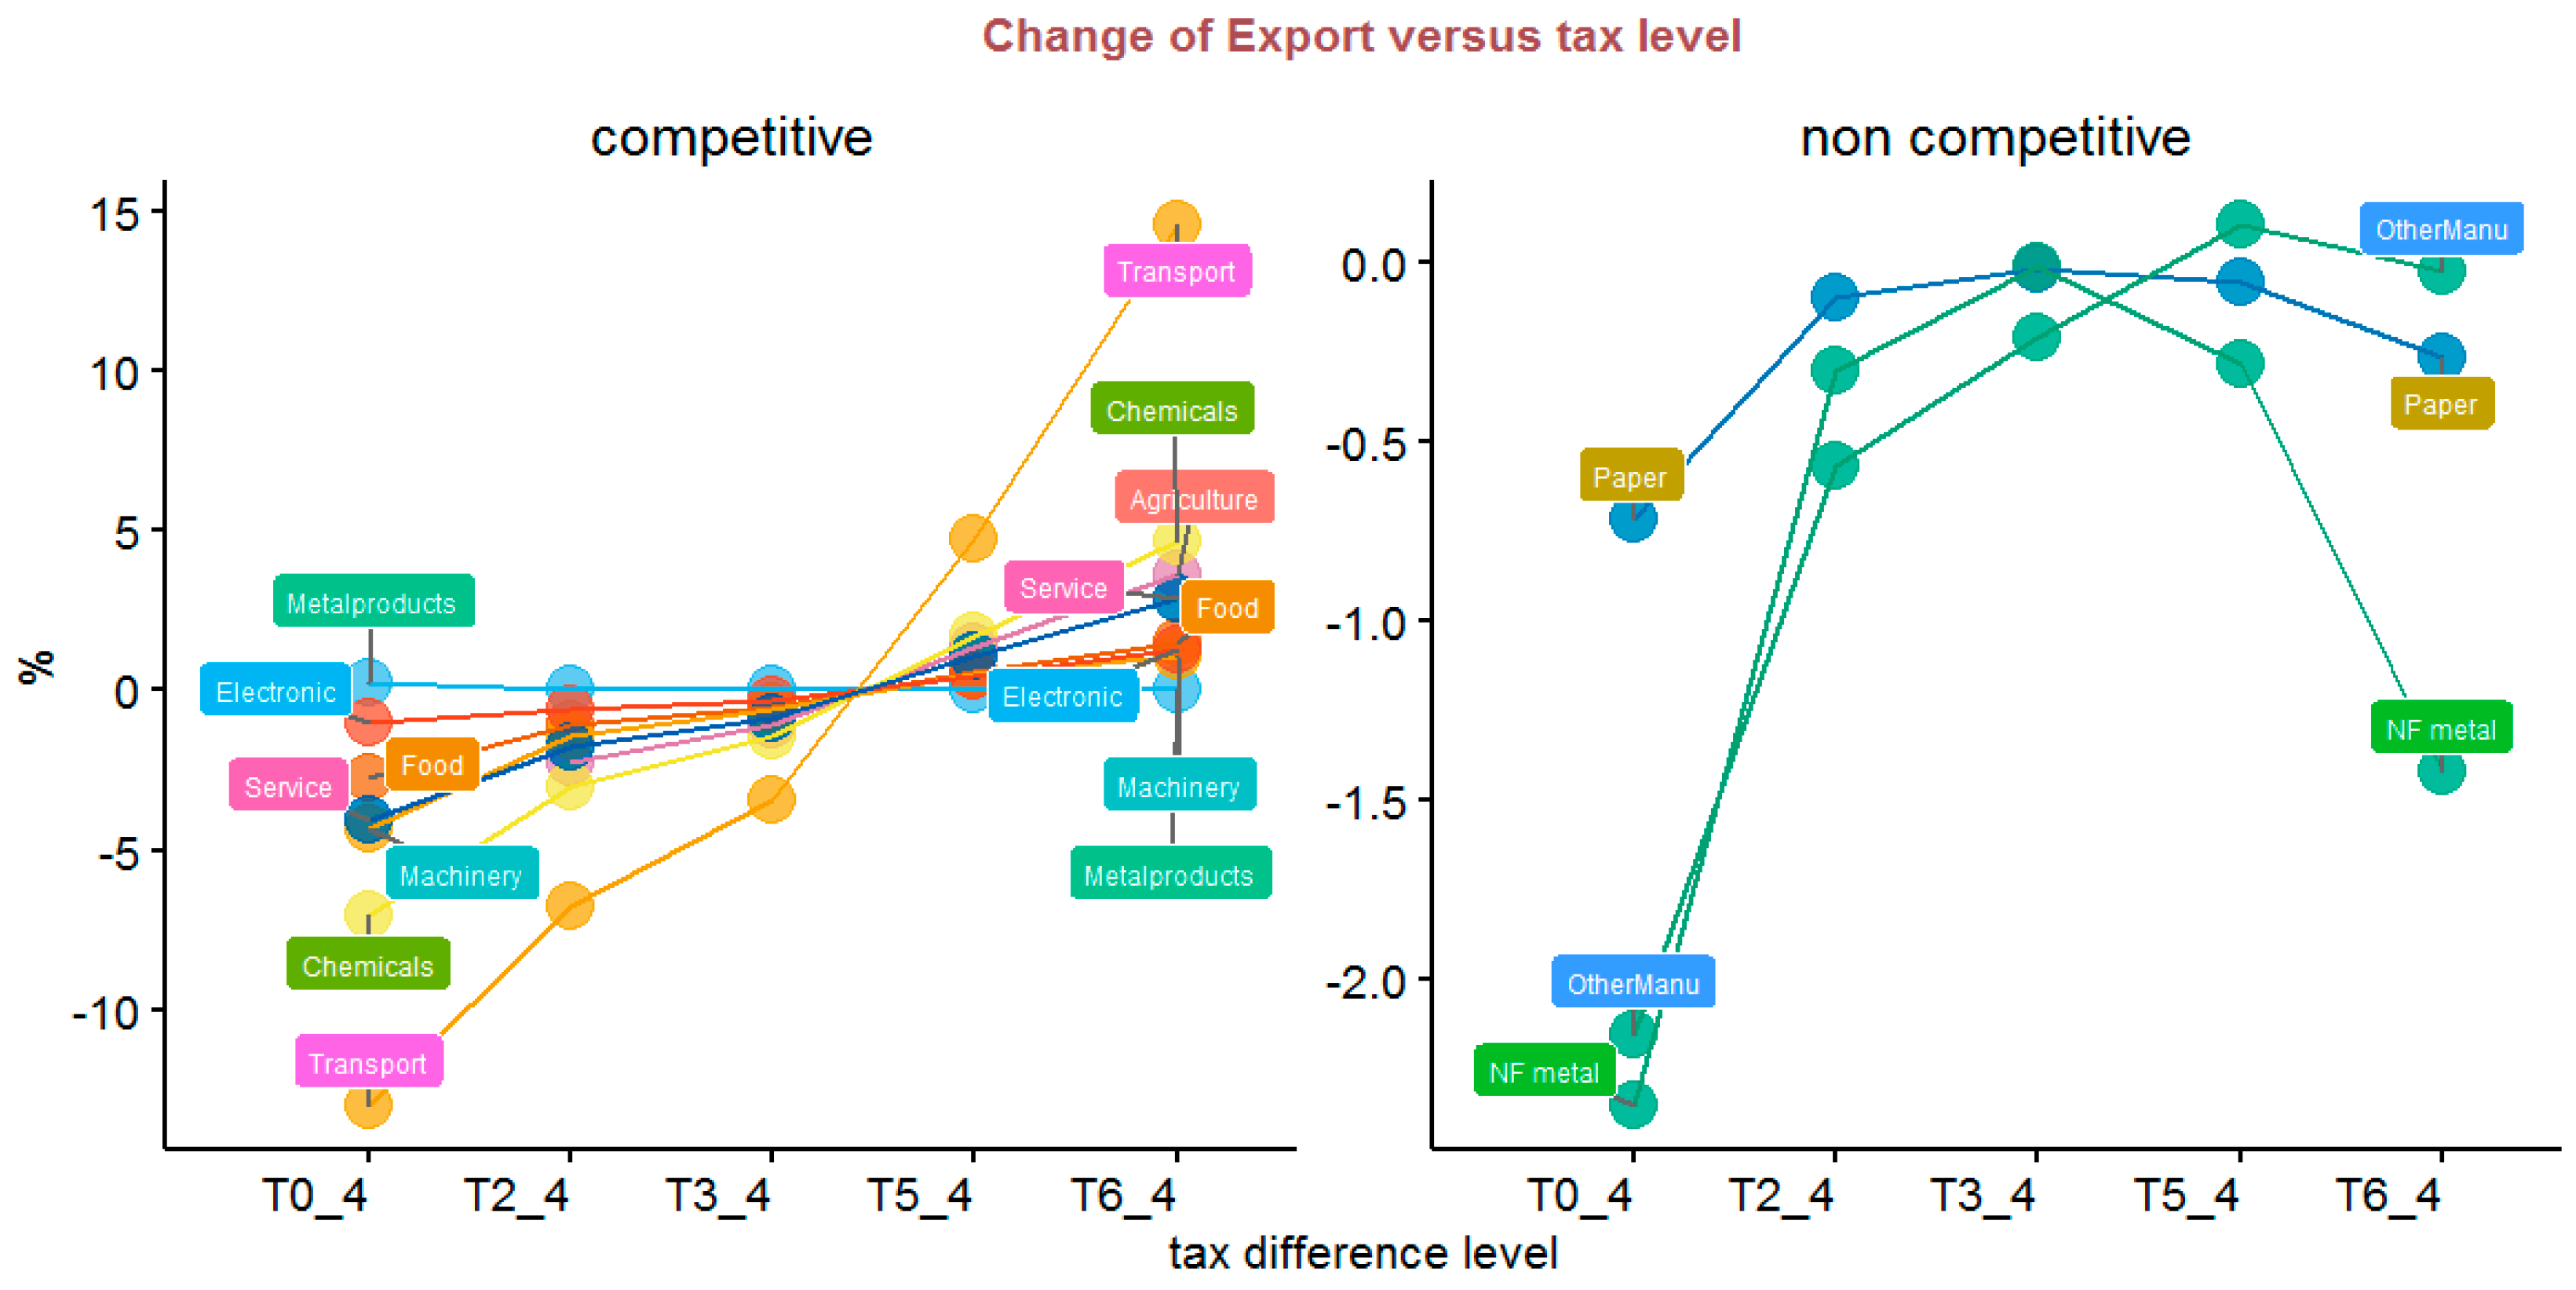
3.3.2. Export Change
As shown in
Figure 6, in T0_4, T2_4, and T3_4, when GD faces more reduction pressure than ROC, compared with affording the same reduction mitigation cost of T4_4, the sector export of iron and steel benefited by 9.8% to 60%, although the valued added of the iron and steel sector is not big, while the sector export of goods, chemicals, metal products, machinery, electronics, transport, and service is damaged by 0.308% to 12.986%.
When the distribution of the carbon tax is not uniform for the two regions, the two regions will compete to export products to satisfy the international market demand. In T5_4 and T6_4, as the ROC carbon tax pressure is greater than Guangdong, Guangdong’s agricultural, food, chemicals, metal products, machinery, electronics, transportation, and service industries are at an advantage in the competition of export products.
It shows that these sectors belong to the high added value and relatively low-carbon sector in Guangdong (
Figure 6). These products are more competitive than ROC products, which have more chances to go into the international market. In contrast, the paper, iron and steel, nonferrous metal, and other manufacturing industries in GD are less competitive than ROC and more difficult to enter the overseas market to benefit.
3.3.3. Outflow Change
As demonstrated in
Figure 7, in T0_4, T2_4, and T3_4 scenarios, the sector products of agriculture, food, paper, iron and steel, other manufacturing, and service bring benefits for outflow to ROC, and the iron and steel sector brings more benefits for export. It indicated that the domestic ROC demand for agriculture, food, paper, other manufacturing, and service and the international demand for iron and steel can together pull these sectors' outflow growth.
When the relatively less reduction burden on Guangdong’s chemical industry, nonferrous metals, metal products, machinery manufacture, and traffic department increases, it indicates that these products will have more opportunities to enter the ROC market. When GD is in a higher reduction burden than ROC, the price of agriculture, food, paper making, iron and steel, other electronic manufacturing, and service industries in ROC is lower, so it is difficult for GD to compete with ROC products and will cause it to lose some outflow.
3.3.4. Inflow Change
In T0_4, T2_4, and T3_4 scenarios, the sector inflow of paper, chemicals, iron and steel, NF metal, metal products, machinery, other manufacturing, construction, and transport will grow by 0.074–16.682%, and agriculture, food, and service will decline by 0.131–3.667%. In T5_4 and T6_4, agriculture, food, and service will grow by 0.911–5.618%, while the inflow of paper, chemicals, iron and steel, NF metal, metal products, machinery, other manufacturing, construction, and transport will decline by 0.132–20.853% (
Figure 8).
With the increasing inflow of products of paper, chemicals, iron and steel, NF metal, metal products, machinery, other manufacturing, construction, and transport from ROC in T0_4, T2_4, and T3_4, it is the big impact factor to impair the output of the GD sector. At the same time, with the decrease in the inflow of agriculture, food, and paper products from ROC, this trend promotes the production of these products by GD’s local producing sectors.
With the increase in carbon tax in ROC, Guangdong increases the demand for agriculture, food, and service from ROC. The ROC carbon tax promotes the transfer of capital and labor to the low-carbon industry, which can bring a higher return rate, so it causes the cost decrease in food, agriculture, and services and increases the competitiveness of the three industries in ROC. Thereby, Guangdong increased the inflow from ROC of the three industries.
When Guangdong is assumed to afford greater responsibility for emissions reductions, the papermaking, machinery, and manufacturing industries of ROC will increase the inflow to Guangdong Province from outside, and other industries, such as food, agriculture, service, and electronics, from ROC will reduce from outside. Because the manufacturing cost of GD is higher than that of ROC, Guangdong will increase manufacturing products from ROC.
3.3.5. Import Change
When the distribution of the carbon tax is not uniform, the rising costs of industry in the two areas are not consistent (
Figure 9). When Guangdong bears relatively high costs, the agriculture, food, paper, steel, electronics, other manufacturing, services, and metal products in these industries will lead to higher prices, and the GD province will increase imports of these products from outside. The import of chemicals, nonferrous metals, and machinery will be damaged.
3.3.6. Employment Change
In T0_4, T2_4, and T3_4 scenarios, compared with T4_4 of Guangdong, the sector employment of agriculture, food, transport, and service benefited by 0.062% to 1.381%, while the sector output of chemicals, NF metal, machinery, electronics, and construction is damaged by 0.106% to 5.884% (
Figure 10). When Guangdong bears the greater cost of emission reduction, the employment in agriculture, food, steel, transportation, and service sectors increases due to the increase in their production output. Other industries of employment decreased, such as paper, chemicals, metals, and manufacturing.
This reason is that as the higher carbon tax led to rising manufacturing costs, it decreased demand for exports and outflow, which led to the decline in output, and further impact the labor employment.
The results show that the chemicals, NF metal, machinery, and electronics industries in GD are of the low-carbon industry, compared to the manufacturing industry, which has a competitive advantage in product prices, which guides the consumers to choose low-carbon products and alternatives. Conversely, the agriculture, food, transportation, and services in GD do not have a low-cost competitive advantage compared with ROC.
3.4. Impacts on GDP
It is necessary to understand how the six carbon schemes impact the macroeconomy and which scheme is best for execution needed to evaluate using the CGE model. The economic impact of a carbon tax on the GD and ROC is designed in
Figure 1. From
Table 4, we can see that the GD province always suffers GDP loss, whatever the carbon tax scheme change of ROC in six scenarios. Following the increase in the ROC tax rate, the GD region suffers more GDP loss, output decrease, and outflow reduction. However, for the ROC, when GD implements the carbon tax, ROC has a suitable chance to develop itself and appear more competitive than GD’s same sector. Certainly, it will cause carbon leakage as the energy-intensive industry will move the ROC region to produce and outflow to GD. That is the reason why we need to implement the carbon tax rate in ROC. When ROC implements the carbon tax rate, it will improve competitiveness in the local region industry. It shows that although the two regions have been forced to implement the carbon tax, they all have the chance to develop their comparative advantage industry to avoid economic loss and obtain more production output. For ROC, in the T0_4 scenario, it will bring more GDP growth as it has no carbon tax for ROC, but this scenario will not complete the peak emission target. From the T2_4 to T6_4 scenarios, the five scenarios all achieve the carbon intensity 65% reduction target and peak emission target (
Figure 11).
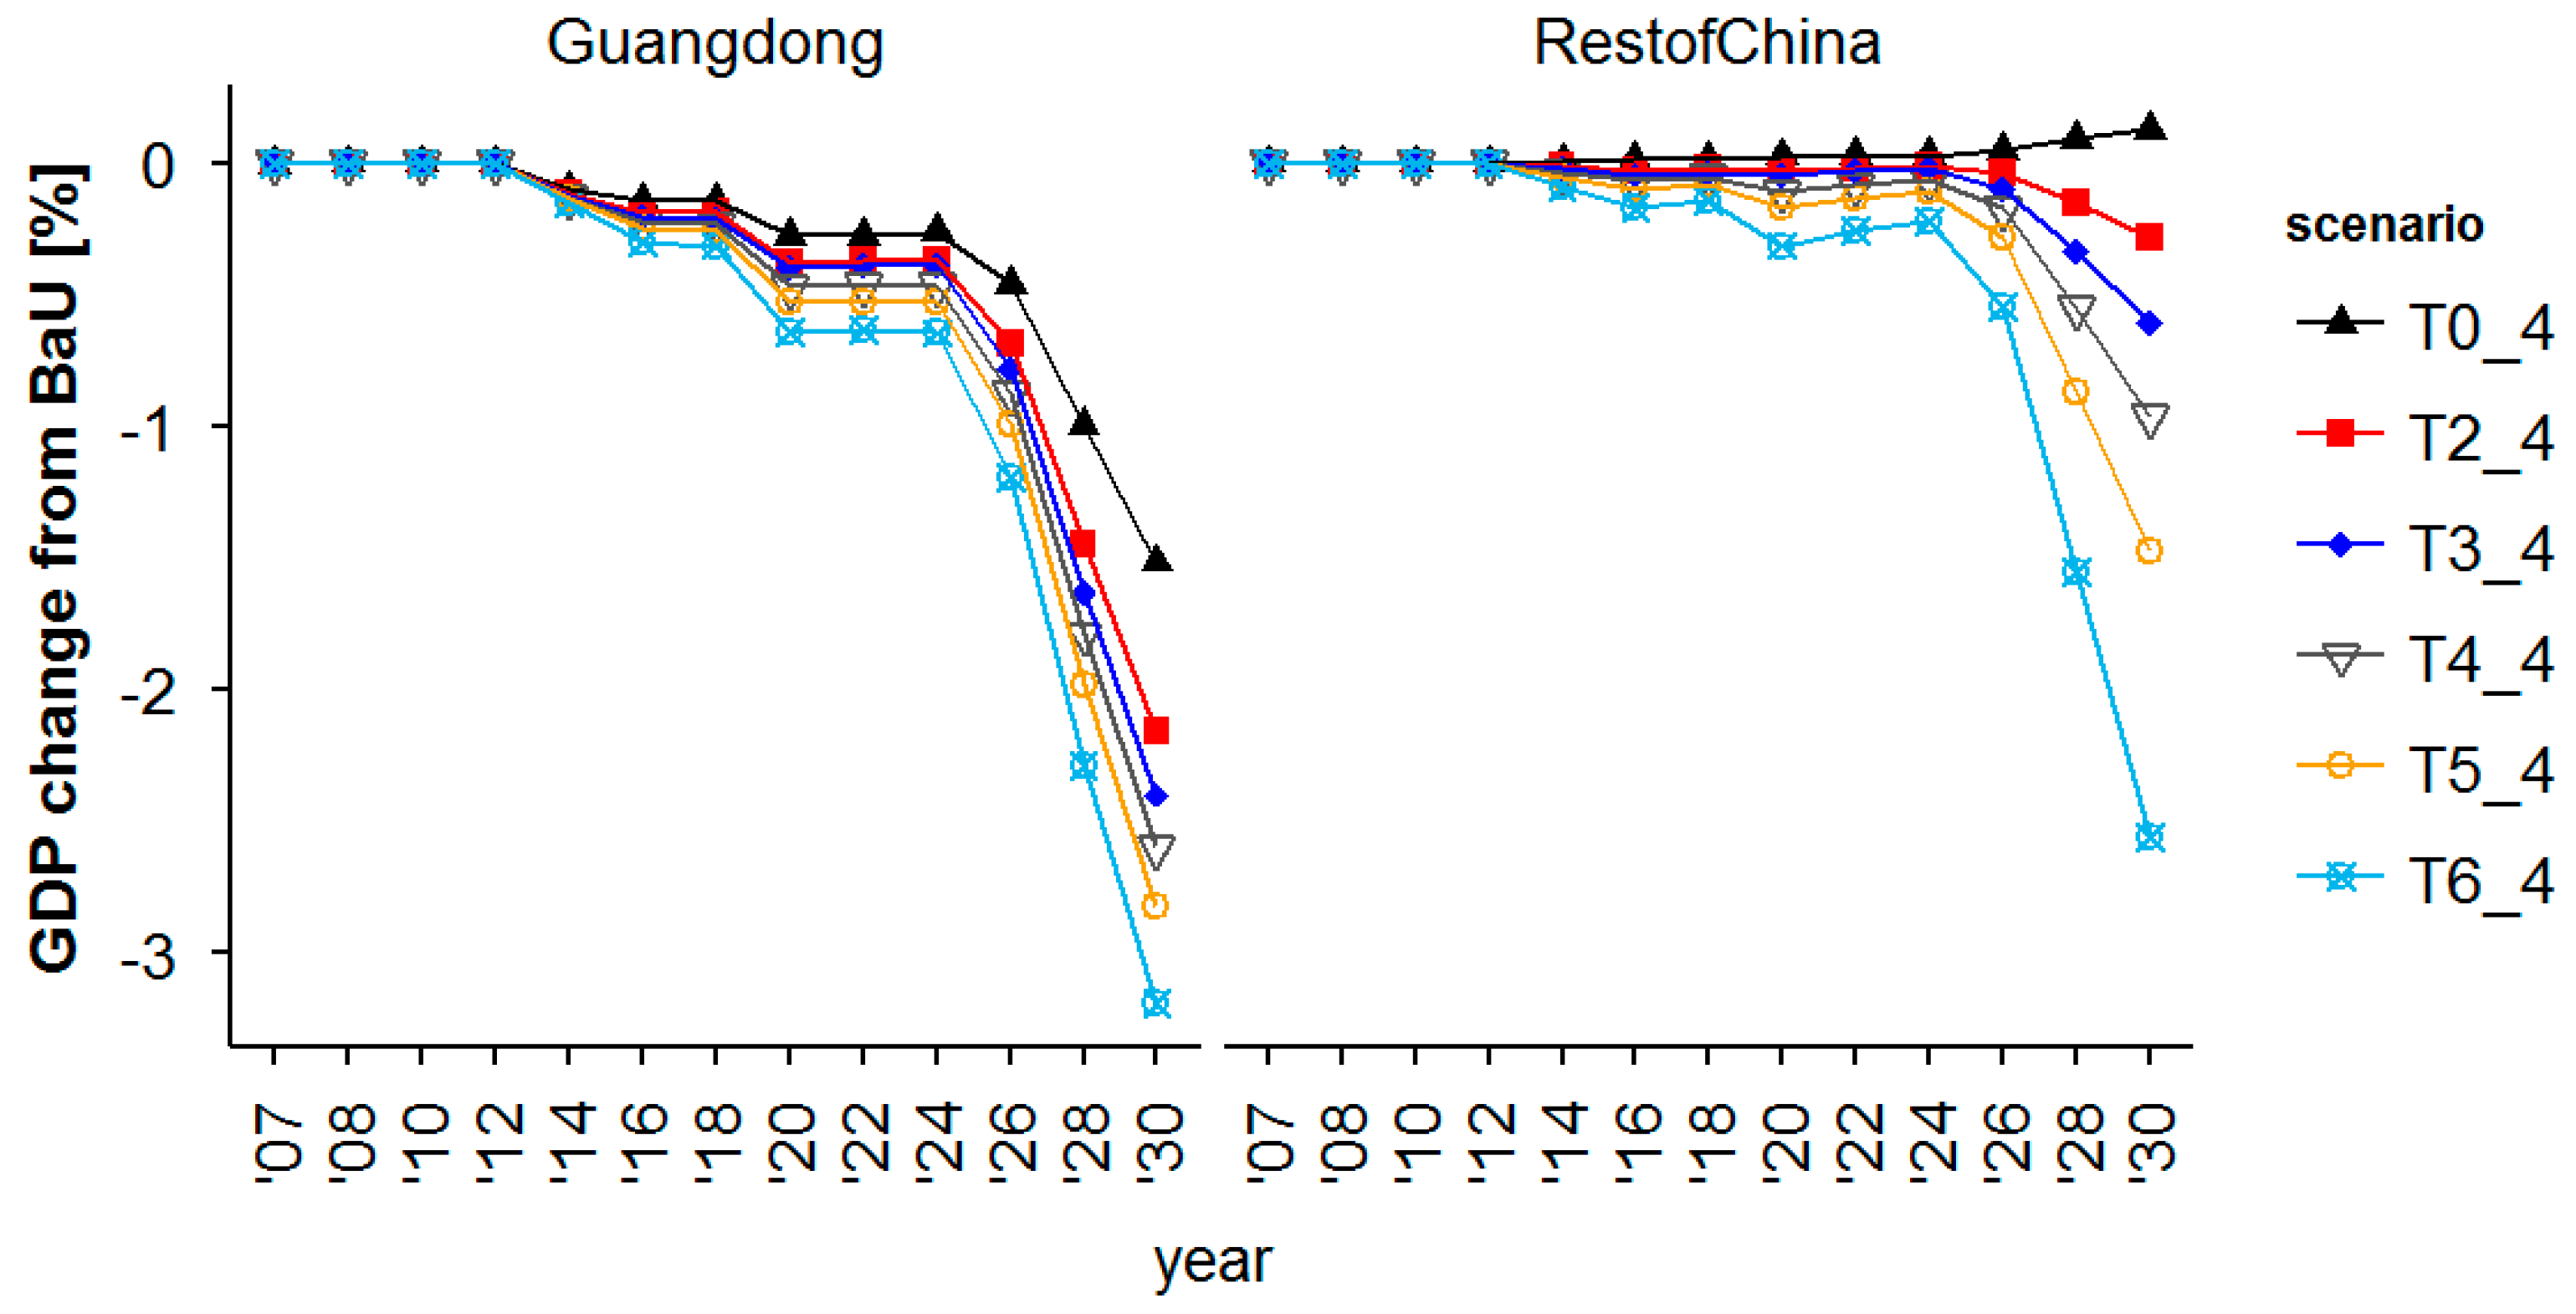
From
Figure 12, we can see that the more the carbon tax rate increases, the more GDP loss for the two regions. For GD, the severe GDP loss is 3.2%, and for ROC, the severe GDP loss is 2.6% compared with the GDP value in BaU. For the whole of China, the severe GDP loss is 2.6%, and the loss value will reach 3752 billion yuan in 2030.
When GD faces greater abatement costs, some industries are significantly impaired, and the output declines. Conversely, when the ROC faces greater costs, some industries in Guangdong will have relative price advantages that are helping GD to seize the domestic and international markets.
The GDP of T0_4, T2_4, and T3_4 scenarios is bigger than T4_4 by 0.2–1%, while the GDP of T5_4 and T6_4 is lower than T4_4 by 0.2–0.5%. In total, it shows that GD’s GDP will decrease as the impact of ROC’s tax increases.
4. Discussions and Policy Implications
The annual investment growth rate is set to 7.5% based on the “13th Five-Year” economic development plan of Guangdong Province. Seven scenarios are constructed considering two dimensions, including no carbon tax constraint and different carbon tax settings in two regions, which reflect the actual carbon tax policies practiced in Guangdong and the ROC region. The business-as-usual (BaU) scenario assumes that the economy develops following the conventional mode and that there are no constraints on energy consumption and carbon emissions.
A carbon tax was levied for six carbon tax schemes from the year 2014, the target of which was to obtain a specific reduction in CO2 emissions in the 2030 peak from the corresponding baseline level. Except for the BaU scenario, the setting of six carbon tax scenarios was designed to reach the same reduction target in the 2030 peak. However, to realize the same reduction target of China in 2030, the different carbon tax schemes between the two regions, respectively.
From the model analysis, we can obtain the policy implications that when the ROC’s carbon price increases, the general output of GD and China would be impacted. Certainly, As the relative advantage is different, the sectors in different scenarios indicated different results, which provide us more implications about GD’s industry situation.
It interprets that GD is not an isolated economy; the growth or shrinking of the economy will relate to the neighboring province. A carbon tax will increase the cost of the production sector and induce the product price, further impacting the demand for this product. The impact of a carbon tax on different sectors is also different, with some sectors’ output increasing and others decreasing.
When comparing T4_4 with T2_4 or T4_4 with T6_4, the inflow and outflow will change in different scenarios. Comparing the change in the trading intensity indicator change, it can tell us which region and which sector has more trading intensity and will be impacted more by the carbon tax policy.
The reason that causes some sector output and employment decrease is that the input materials price or the output product price increase, which causes the producer to reduce production to avoid profit loss, or the consumer abates the consumption by facing the higher production price. To further analyze the impact factor of this reason and find which sector is impacted more seriously, the production price change of the 33 sectors is simulated by the two-region GD_CGE model. From
Figure 4, we can see that most of the production price increases except for agriculture and service industries for both GD and ROC. The growth rate of production price in the electricity sector is the most impacted sector as the power sector needs coal, oil, and natural gas energy as the input materials. Because this sector needs more primary energy and electricity accounts for the most part for their production cost, the carbon tax cost was converted to their production cost.
From the above analysis, we can see the obvious effect of a carbon tax on the reduction of energy consumption and CO
2 emissions actively. The economy that exerts carbon taxes inevitably faces some economic distortion and loss of economic efficiency for correcting the externalities. How to identify and judge this passive effect at the sector level is a start to further subsidize or offset this negative effect using another policy instrument. In our two-region model, the sectors are divided into 33 sectors, and the service industries are aggregated by 1 sector together.
Figure 4 shows that the six reduction scenarios of sectoral output change compared with the BaU scenario sector output.
As the national carbon emission trading market will start from 2016 to 2020, how to allocate the allowances to different sectors and regions needs to be researched in detail because it will bring more GDP loss and harm the industry competitiveness. Especially for the backward provinces, it is a different choice to develop industry or protect the resource for getting the offset from the selling allowances. When implementing the carbon tax for six scheme scenarios on the GD and ROC, it brings an effective emission reduction for carbon intensity decrease and peak emission for China. Followed by this efficient policy instrument to reduce emissions, the output decreased by 7.3%, the employment increased by 2.3%, the inflow and outflow decreased by 2.6%, and the average production price increased by 10% compared to T6_4 to BaU. In total, it seems that the impact of the carbon tax will not cause all negative effects, and certainly, it will promote the energy and industry structure adjustment and increase the employment rate through economic change. However, its impact on some sectors shows a serious influence on the sector output and competitiveness, especially in the power sector, iron and steel, oil refinery, cement, and non-metal industries. Implementing this carbon tax policy instrument and evaluating the cost and benefit of these six schemes from the whole economic view can provide the policymaker more confidence about how to use this carbon tax to adjust the industry structure and match this policy with other policies, such as emission trading. If this policy is used to coexist with other policies, the carbon tax will be effective for small companies and is cost-efficient for them. The carbon tax policy can bring more employment to the economy and promote the transition of the backward economy.
As shown in
Table 4, when the ROC bears higher abatement costs, Guangdong increases the imports of chemical, nonferrous metals, metal products, and mechanical products and reduces the imports of agricultural, food, iron and steel, electronics, and other service industries. Because the ROC undertakes more reduction pressure, the cost of high energy-consuming industries of ROC will increase, and Guangdong will import chemical products from foreign countries.
Under the pressure of carbon tax in ROC, it will attract investment and change the industry structure to form the low-carbon industry in ROC at the same time that occurred in GD. It will conduct GD to reduce the foreign imports of agriculture, food, paper, steel, electronics, and other products and be more inclined to produce these products from its own sector or ROC.
One limitation of this study is to consider the regions outside Guangdong Province as a whole. In fact, another 20 provinces need to be included outside Guangdong Province. It is necessary to further investigate the impact of a carbon tax on different industries in different provinces and propose methods for industrial upgrading and reducing carbon emission reduction costs.
5. Conclusions
In this study, we constructed a two-region CGE model to analyze the impact of a carbon tax on the industry output, production price, employment, inflow and outflow, GDP, and CO2 emissions. The study demonstrates that the carbon taxation system should be unified across the entire Chinese market in order to achieve the desired goals related to the reduction of carbon emissions in the medium and long term.
The carbon reduction policy in GD is not only decided by itself, but it will also impact other provincial carbon reduction policies, so we evaluate the carbon tax policy on GD’s CO2 emissions reduction at the same time.
We see the carbon emission change in different scenarios: the carbon emissions, energy consumption, and electricity trends in the future. The emission and energy consumption change as the carbon tax policy is induced by GD. When the ROC implements the carbon tax policy, it makes GD emissions decrease. So, the simulation results support our assumption. Furthermore, when implementing a carbon reduction policy in China focusing on different regions, it needs to consider the justice of emission reduction.
First, as the carbon tax was implemented by the two regions, the third industry of GD and ROC improved by 0.1%, and the heavy industry, for example, the power, oil refinery, and iron and steel industries, decreased, and the machinery, agriculture, and service industries increased.
Second, for GD and ROC, except for BaU and T0_4 scenarios, the T2_4 to the T6_4 scenarios can complete the emission intensity 65% reduction target and peak emission until 2030. When we compare the T6_4 with the BaU scenario, we can find that the total employment population will increase by 2.3% and reach 890.016 million in the year 2030. It indicates that the carbon tax policy will promote employment in the long term and promote the industry structure change.
Third, through the inflow and outflow analysis, the chemical, nonferrous metal, and machinery industries are GD’s competitive sectors. For the ROC, the agriculture, food, textile, paper, cement, construction, and service industries are ROC’s competitive industries, as cheaper labor and more land are suitable for developing those industries.
At last, for ROC in the T0_4 scenario, it will bring more benefits as no carbon tax and GDP will increase sharply but will not complete the peak emission target. From the T2_4 to T6_4 scenarios, the five scenarios of the two regions all achieve the carbon intensity 65% reduction target and peak emission target. However, the more the carbon tax rate increases, the greater the GDP loss for the two regions. For GD, the severe GDP loss is 3.2%, and for ROC, the severe GDP loss is 2.6% compared with BaU in GDP. For the whole of China, the GDP loss is 2.6%, and the GDP loss will reach 3752 billion yuan in the year 2030.
This research verifies an approach to the assessment of the possible impact of its unified CO2 emissions taxation mechanism on the industrial development of Guangdong Province and the rest of China. The findings reported in the study may be helpful in establishing the tenets of the competitiveness policies as well as helping to design better mechanisms for the coordination of carbon taxation and carbon trading mechanisms in China, which is statistically one of the largest carbon emitters globally. In this work, we do not consider the carbon tax revenue recycling, and it will cause more loss in industry output and GDP. Our next research direction is to research the impact of different carbon tax revenue recycling manners on two regions with different carbon tax rates.


