Article

An Assessment of the Conversion of Biomass and Industrial Waste Products to Activated Carbon

1
Sandia National Laboratories, Albuquerque, NM 87123, USA
2
Department of Mechanical Engineering, Howard University, Washington, DC 20059, USA
3
Department of Mechanical Engineering, National Defense University, 06654 Ankara, Turkey
*
Author to whom correspondence should be addressed.
Energies 2023, 16(4), 1606; https://doi.org/10.3390/en16041606
Submission received: 23 December 2022 / Revised: 30 January 2023 / Accepted: 31 January 2023 / Published: 6 February 2023
(This article belongs to the Special Issue Biomass and Bio-Energy)

Abstract

:
The production of biochar from biomass and industrial wastes provides both environmental and economic sustainability. An effective way to ensure the sustainability of biochar is to produce high value-added activated carbon. The desirable characteristic of activated carbon is its high surface area for efficient adsorption of contaminants. Feedstocks can include a number of locally available materials with little or negative value, such as orchard slash and crop residue. In this context, it is necessary to determine and know the conversion effects of the feedstocks to be used in the production of activated carbon. In the study conducted for this purpose; several samples (piñon wood, pecan wood, hardwood, dried grass, Wyoming coal dust, Illinois coal dust, Missouri coal dust, and tire residue) of biomass and industrial waste products were investigated for their conversion into activated carbon. Small samples (approximately 0.02 g) of the feedstocks were pyrolyzed under inert or mildly oxidizing conditions in a thermal analyzer to determine their mass loss as a function of temperature and atmosphere. Once suitable conditions were established, larger quantities (up to 0.6 g) were pyrolyzed in a tube furnace and harvested for characterization of their surface area and porosity via gas sorption analysis. Among the samples used, piñon wood gave the best results, and pyrolysis temperatures between 600 and 650 °C gave the highest yield. Slow pyrolysis or hydrothermal carbonization have come to the fore as recommended production methods for the conversion of biochar, which can be produced from biomass and industrial wastes, into activated carbon.

1. Introduction

Biochar is a term used to refer to biomass-based charcoal that is largely used for agriculture but can also be used to describe biomass-based charcoal that is used for any purpose [1]. Biochar is the main term used when the substance is being used for agriculture, activated carbon is used when filtration or purification is the intended use, and charcoal is the term used when heating or cooking is the purpose, although all can be used to describe the same product. Due to its low cost and simplicity of production, biochar has the potential to be used for many purposes [2,3]. It can be defined as charcoal that is suited to be used in agriculture, although it can be used in various ways. Other uses of biochar include energy storage for gaseous fuels, catalysts for biofuel production, power/heat generation, automotive diesel engines, iron and steel production, and the filtration of water [4]. Recent interest in biochar has been largely centered around the potential for its use in soil to mitigate climate change [1,2,5]. It is believed that if the amount of carbon sequestered in soils is increased by 0.4% each year, the annual increase in atmospheric CO2 could be offset [3,6]. Biochar’s use as an adsorbent has been researched due to its high porosity and surface area, surface functional groups, low ash content, and greater potential than other low-cost sorbents [4,7,8]. Barriers to biochar include the price being too high and limited suppliers when compared to fossil-based resources [9,10]. In recent studies, there has been great interest in determining and optimizing pyrolysis conditions to improve the yield and quality of biochar [11,12,13,14,15]. In addition, the potential of biochar as a catalyst or catalyst support has been extensively studied in the current literature [5,7,9]. The properties of biochar, influenced by the biomass feedstock and preparation conditions, determine its potential for a particular application. However, there is still a lack of research on the structure-application relationship between the production, transformation, physicochemical properties, and applications of biochar from different raw materials.
Considering the mentioned advantages of biochar, it is necessary to examine the production of biochar with different production techniques from different raw materials. For this purpose, in this study, biochar production, modification, and characterization methods were compared, and then experimental conditions were determined according to the superiority of these methods. Afterwards, the conversion performances of the samples with different properties (piñon wood, pecan wood, hardwood, dried grass, Wyoming coal dust, Illinois coal dust, Missouri coal dust, and tire residue) to activated carbon were examined comparatively.

1.1. Biochar Production

Production of biochar can be achieved in a variety of ways. The main production methods are pyrolysis (which itself has several different methods), gasification, hydrothermal carbonization, and torrefaction. Biochar can be either the primary or secondary product in these methods, but production of biochar is best accomplished with pyrolysis and hydrothermal carbonization [5,11]. Sources of feedstock for biochar theoretically include any carbonaceous material. Both the feedstock properties and the reaction conditions are important for the properties and yield of the biochar. Feedstock mainly influences the content of the biochar and some physical properties, while reaction conditions have a larger effect on the physical properties of the biochar. The surface area and pH of biochar are mainly affected by the peak temperature of production [6,12]. Heating rate is shown to have little effect on the properties of the biochar but does affect the contents of the biochar, as it has been found that lower heating rates yield higher percentages of char, up to an asymptote at which the yield cannot increase [7,13]. However, Byrne and Nagle reported that under 15 °C/h, the secondary cracking reactions of wood biochar do not occur [8,14]. In wood, the three main components breakdown at the following temperatures: hemicellulose at 200–260 °C, cellulose at 240–350 °C, and lignin at 280–500 °C. It has also been reported that higher lignin content results in higher char yields [7,9].

1.1.1. Pyrolysis

Pyrolysis is commonly used due to its inexpensiveness and simplicity. The methods of pyrolysis include slow or conventional pyrolysis, fast pyrolysis, flash pyrolysis, hydro-pyrolysis, ultra-pyrolysis, and methanol pyrolysis. The three main products of pyrolysis are biochar, bio-oil, and syngas, with different methods better suited for the production of each of those products [15].
Slow pyrolysis has long been used in the production of biochar, which is the preferred product of this method. Slow pyrolysis consists of a low heating rate, ~0.1–1 °C∙s−1, a relatively long residence time that can range from hours to days, and a temperature in the range from 300 to 800 °C typically, in an inert atmosphere with 0–2% O2. The long residence time favors secondary cracking reactions [5]. Peak temperature has been shown to have an effect on the properties of the biochar [6,10,11]. Temperature exhibited a positive correlation with pH, fixed carbon (FC), ash content, surface area, and pore size and a negative correlation with biochar yield, O:C/H:C mass ratios, and the number of surface functional groups. It is also true, however, that if the peak temperature is too high, the biochar will lose or have reduced some of the properties mentioned above [16]. Peak temperature is not the only influencing factor on the properties of biochar, as residence time and heating rate, for example, also have an effect on the properties but not to the same degree as peak temperature [11]. Slow pyrolysis is recommended for the production of wood biochar, which can be produced at temperatures ranging from 250 to 850 °C [4], with the surface area peaking in the range 500–600 °C. The downside of slow pyrolysis is the time-consuming nature of the process and the low energy efficiency; however, it does produce a high yield of biochar.
Fast pyrolysis is not as useful in the production of biochar as it is only a secondary product, with the primary product being bio-oil. In fast pyrolysis, the heating rate is much higher than slow pyrolysis, at ~1000 °C∙s−1 [12]. The residence time is also very short in order to maximize the production of bio-oil. The process for fast pyrolysis is very similar to that of slow pyrolysis, other than the heating rate and residence times. Once the sample has been heated, the volatile gasses are separated out, typically by a high flow rate of inert gas, and then condensed out of the gas phase to produce bio-oil at ~70% wt. yield. Flash pyrolysis uses moderate pressure (2–25 atm) to reduce the reaction time and increase biochar yield [12]. The increased pressure both favors char production and increases the rate of reaction [16,17,18]. The heating rate can exceed 1000 °C∙s−1. Table 1 shows specifications for thermochemical processes.

1.1.2. Hydrothermal Carbonization

Hydrothermal carbonization is more suitable with feedstocks with high moisture contents [5]. The process yields biochars with higher amounts of carbon; however, they are not appropriate for use as adsorbents as they have a low surface area and minimal pores. The product does possess more surface functional groups and higher yields [22]. The products are spherical, microsized particles. Hydrothermal carbonization is typically done in a closed reactor in the presence of water. The process can be used for the synthesis of biochar (<250 °C), bio-oil (250–400 °C), and gaseous products (>400 °C). The biomass is treated with hot, compressed water and is typically separated into stages when real biomass is being used [13].

1.1.3. Torrefaction

Torrefaction is used in order to make the biomass or biochar easier to transport, grind, and store. The produced biochar is not suitable for direct use but is energy dense [4]. It is similar to slow pyrolysis, only at a lower temperature. The process is done at an atmospheric pressure in the range of 200–300 °C with little to no O2, a low heating rate (<50 °C∙min−1), and a long residence time [23].

1.1.4. Gasification

Gasification favors the synthesis of gases and produces biochar as a byproduct. The process converts carbonaceous materials to produce syngas (H2 and CO2, with small amounts of H2O and CO2) and biochar as a byproduct [24]. Syngas can be used as an alternative to natural gas although much less energy dense [12]. Unlike in pyrolysis, some O2, ~25%, is included. As gaseous fuels are the intended product in this method, the main use of the char developed as a byproduct is not the same as in other methods but rather as a potential catalyst to reduce the production of undesirable tar in the process [14].

1.2. Biochar Modification

Biochar properties can be engineered in order to accomplish specific tasks. Some modification methods include activation, amination, surface oxidation, surface acidification, heteroatom doping, and magnetization. Different modifications can affect different properties of the biochar, allowing it to achieve a specific task [25]. Activation can be either physical or chemical and transforms the biochar into activated carbon, greatly increasing the surface area and pore volume.

1.2.1. Physical Activation

Physical activation is accomplished by exposing the biochar to a flow of steam and/or CO2 at temperatures above 700 °C. Carbon atoms with high reactivity are then removed by the reactions in Equations (1) and (2). The steam reaction has been shown to be more efficient than the use of CO2. Microwave heating can also be used for physical activation along with conventional heating [26]. The activation time is relatively short, as long activation times can lead to the growth of micropores to the point of destruction, thus reducing the surface area. Gonzalez, Roman, Encinar, and Martinez found that by activating four biochars at 850 °C for 30 min with steam, the surface areas increased from 280 to 792 m2/g (walnut shell), 204–1080 m2/g (almond tree pruning), 42–601 m2/g (almond shell), and from 53–813 m2/g (olive stone) [15]:
C + H2O = CO + H2
C + CO2 = 2CO

1.2.2. Chemical Activation

Chemical activation has similar results to physical activation but is typically done before the biomass has been pyrolyzed. The process involves first adding the activator to the biomass and then pyrolyzing it in the same manner as would usually be done. It can also be done by adding the activators after the initial pyrolyzation and then treating the sample with heat [27]. Benefits lie in the fact that lower temperatures than physical activation can be used to achieve similar results. Some downsides include the potential for equipment corrosion and the need for product purification and chemical recycling. The simplified process of what occurs is that the activator etches the biochar, gaseous products escape, forming micropores, and the formation of H2O and CO2 can then also cause physical activation to occur. Several different activators can be used, including KOH, K2CO3, H3PO4, and ZnCl2 [5]. Chemical activation of rice straw and sewage char by KOH resulted in increases in surface area from 140 to 772 m2/g and from 18 to 783 m2/g [16]. KOH reactions that may occur when used as an activator are listed below [5]. Ros et al. found that the porosity of sewage sludge-based biochar activated by KOH increased more when the KOH was added by physical mixing of the hydroxide lentils and the precursor than by an impregnation method and was most successful at increasing porosity when the hydroxide was ground first; they also found that increasing the hydroxide: precursor ratio increased the adsorption capability [17]. It can be defined from Equations (3)–(8):
6KOH + 2C→2K + 2H2 + 2K2CO3
6KOH + 3CO2→3K2CO3 + 3H2O
K2CO3→K2O + CO2
CO2 + C→2CO
K2CO3 + C→2K + 3CO
K2O + C→2K + CO

1.2.3. Surface Oxidation/Acidification

Surface oxidation can be used to add extra oxygenated functional groups. The process is typically done by thermally treating the biochar under aerobic conditions [28]. Surface acidification can be used to produce biochar-based solid acid, which can be used as a catalyst. A common method is sulfonation, which can be accomplished by either soaking the biochar in H2SO4 or heating it in the presence of SO3 in the range of 25–150 °C. Studies have shown the two methods to reduce the surface area and pore volume, although one study showed an increase in surface area when using the H2SO4 method [19].

1.2.4. Magnetization

Magnetization can be used to engineer biochar for heavy metal adsorption. The process showed a high adsorption capability for heavy metal ions despite having a low surface area [18,29]. Son et al. magnetized kelp and hijikia biochar by mixing the biomass with a FeCl3 solution (0.01–0.1M) for 30 min with vigorous stirring and then aging it at 70 °C in a drying oven for 30 min and then separating it from the FeCl3 solution [18].

1.3. Biochar Characterization

Both feedstock and reaction conditions affect the resulting biochar. Biochar can be characterized by its surface area, porosity, hydrobility, pH, elemental composition, and surface functional groups. The content of biochar can be characterized by the standard method for chemical analysis of wood charcoal (ASTMD1762) in which moisture is lost weight when heated at 105 °C, volatile matter is lost at 950 °C in an inert atmosphere, and ash content is the remaining weight when burned under oxygen to 750 °C. The ash content of quality charcoal is accepted as 0.5–5%. Fourier-transform infrared spectroscopy (FTIR), X-ray photoelectron spectroscopy (XPS), and Raman spectroscopy can be used in determining surface functional groups. The cation exchange capacity can be measured by mixing the biochar with an extracting solution and allowing the system to equilibrate [12,18]. However, it is difficult to measure with biochar due to some of its properties. In elemental composition measurements, the sample is combusted at high temperatures with excess O2, and the produced species is then quantified and reported in terms of %wt. of the dry sample [12,21]. In general, the higher the temperature of pyrolyzation and the longer the residence time, the lower the O/C and H/C ratios in the biochar. The lower the H/C ratio, which indicates a higher degree of carbonization, while the O/C ratio can be used to determine the hydrophilic nature of the biochar [4,29]. Surface area is commonly measured using gas adsorption, with N2 and CO2 being the two most commonly used for biochars, and N2 being the most commonly used, though its accuracy for lower surface areas has been questioned [3]. The method that is most commonly used in the calculation of surface area is the Brunauer–Emmett–Teller method (BET). Surface area is highly affected by the pyrolysis temperature and is a key indicator of biochar’s adsorptive properties [3,30]. Pore size is important for both the surface area and adsorptive capabilities of biochar. Pore sizes can be defined as micropores as <2 nm, mesopores 2–50 nm, and macropores as >200 nm. The majority of pores in activated carbon are micropores [12,31]. Additionally, FC can be calculated using Equations (9) and (10):
FC = 100 − %VM − %ash
yfc = ychar (%FC/100 − %feed ash)

2. Material and Methods

Activated carbon can be prepared from a wide variety of raw materials, which should be abundant and cheap, with high carbon content and low inorganic content; the raw materials should be easily activated and have low degradation with age. In this study, piñon wood, pecan wood, dried grass, Wyoming coal dust, Illinois coal dust, and tire residue samples were used. In addition, the following feedstock samples were procured from existing stocks in the laboratory: hardwood (commercial lumber, unidentified source) and Missouri coal dust.
Thermogravimetric Analysis (TGA) is widely used to characterize and evaluate the thermal behavior of various samples. TGA measures weight change (loss or gain) and the rate of weight change as a function of temperature, time, and atmosphere. Initial trials involved placing a small quantity of each feedstock sample in an alumina cup and heating it under an inert atmosphere (nitrogen, 100 mL min−1) to 1000 °C at a rate of 10 °C min−1, while monitoring the sample’s mass and energy flow in/out of the sample using a thermal analyzer (TA Instruments, STD2960, New Castle, DE, USA). To assess the effect of mild oxidation during the above-described thermal treatment, the inert atmosphere was changed to either 1% (vol.) oxygen in nitrogen or 0.11% (vol.) oxygen in nitrogen for a small number of tests. Once suitable conditions were identified, where the samples had lost a significant portion of their mass, isothermal tests were carried out in the thermal analyzer. In these tests, the samples were heated to the desired temperature at a rate of 10 °C min−1 and held there for one hour in an inert or mildly oxidizing atmosphere. The identical temperature profile and gas atmosphere were used in a tube furnace configuration to produce sufficient activated carbon for surface area analysis. For the tube furnace runs, the feedstock samples were loaded into a quartz boat that was then placed in the center of an alumina process tube within a tube furnace. End caps on the process tube allowed gas to be flowed across the sample and prevented air from entering.
Selected materials produced in the tube furnace were subjected to an additional thermal analysis run under flowing air to determine the ash content of the material. The schematic view of the pyrolysis furnace is given in Figure 1. Gas sorption can be defined as the relative accumulation of gas molecules due to the presence of a more or less static condensed phase, which may be a solid or a liquid. The molecules may accumulate on the surface, at an interface, or in the bulk of the condensed phase. The gas adsorption method is a widely known method to measure the specific surface area and pore size distribution of materials. The principle is based on the characteristics of gas absorption on solid surfaces. Gas sorption analysis was conducted using a Quantachrome AutoSorb iQ2 instrument (Boynton Beach, FL, USA). Samples were loaded into quartz glass tubes and degassed under vacuum at 300 °C prior to analysis, and nitrogen adsorption isotherms were measured at −196 °C (77 K). The Brunauer–Emmett–Teller (BET) method was used to calculate the specific surface area of each sample from the nitrogen adsorption isotherm. Pore volumes were calculated from the nitrogen adsorption isotherms near the maximum pressure (P/P0 approaching 1) [30,32].

3. Results and Discussion

3.1. Initial Thermogravimetric Analysis

Figure 2, Figure 3, Figure 4 and Figure 5 summarize the initial TGA scans on each of the raw materials investigated. Tire residue (Figure 2) lost about 60% of its mass by 500 °C during heating under nitrogen. Only minimal further mass loss was observed above 750 °C. Two runs were conducted with excellent reproducibility. Figure 3 summarizes TGA data for four different coal samples. The mass losses were between 32 and 46% and tended to be more gradual than for tire residue.
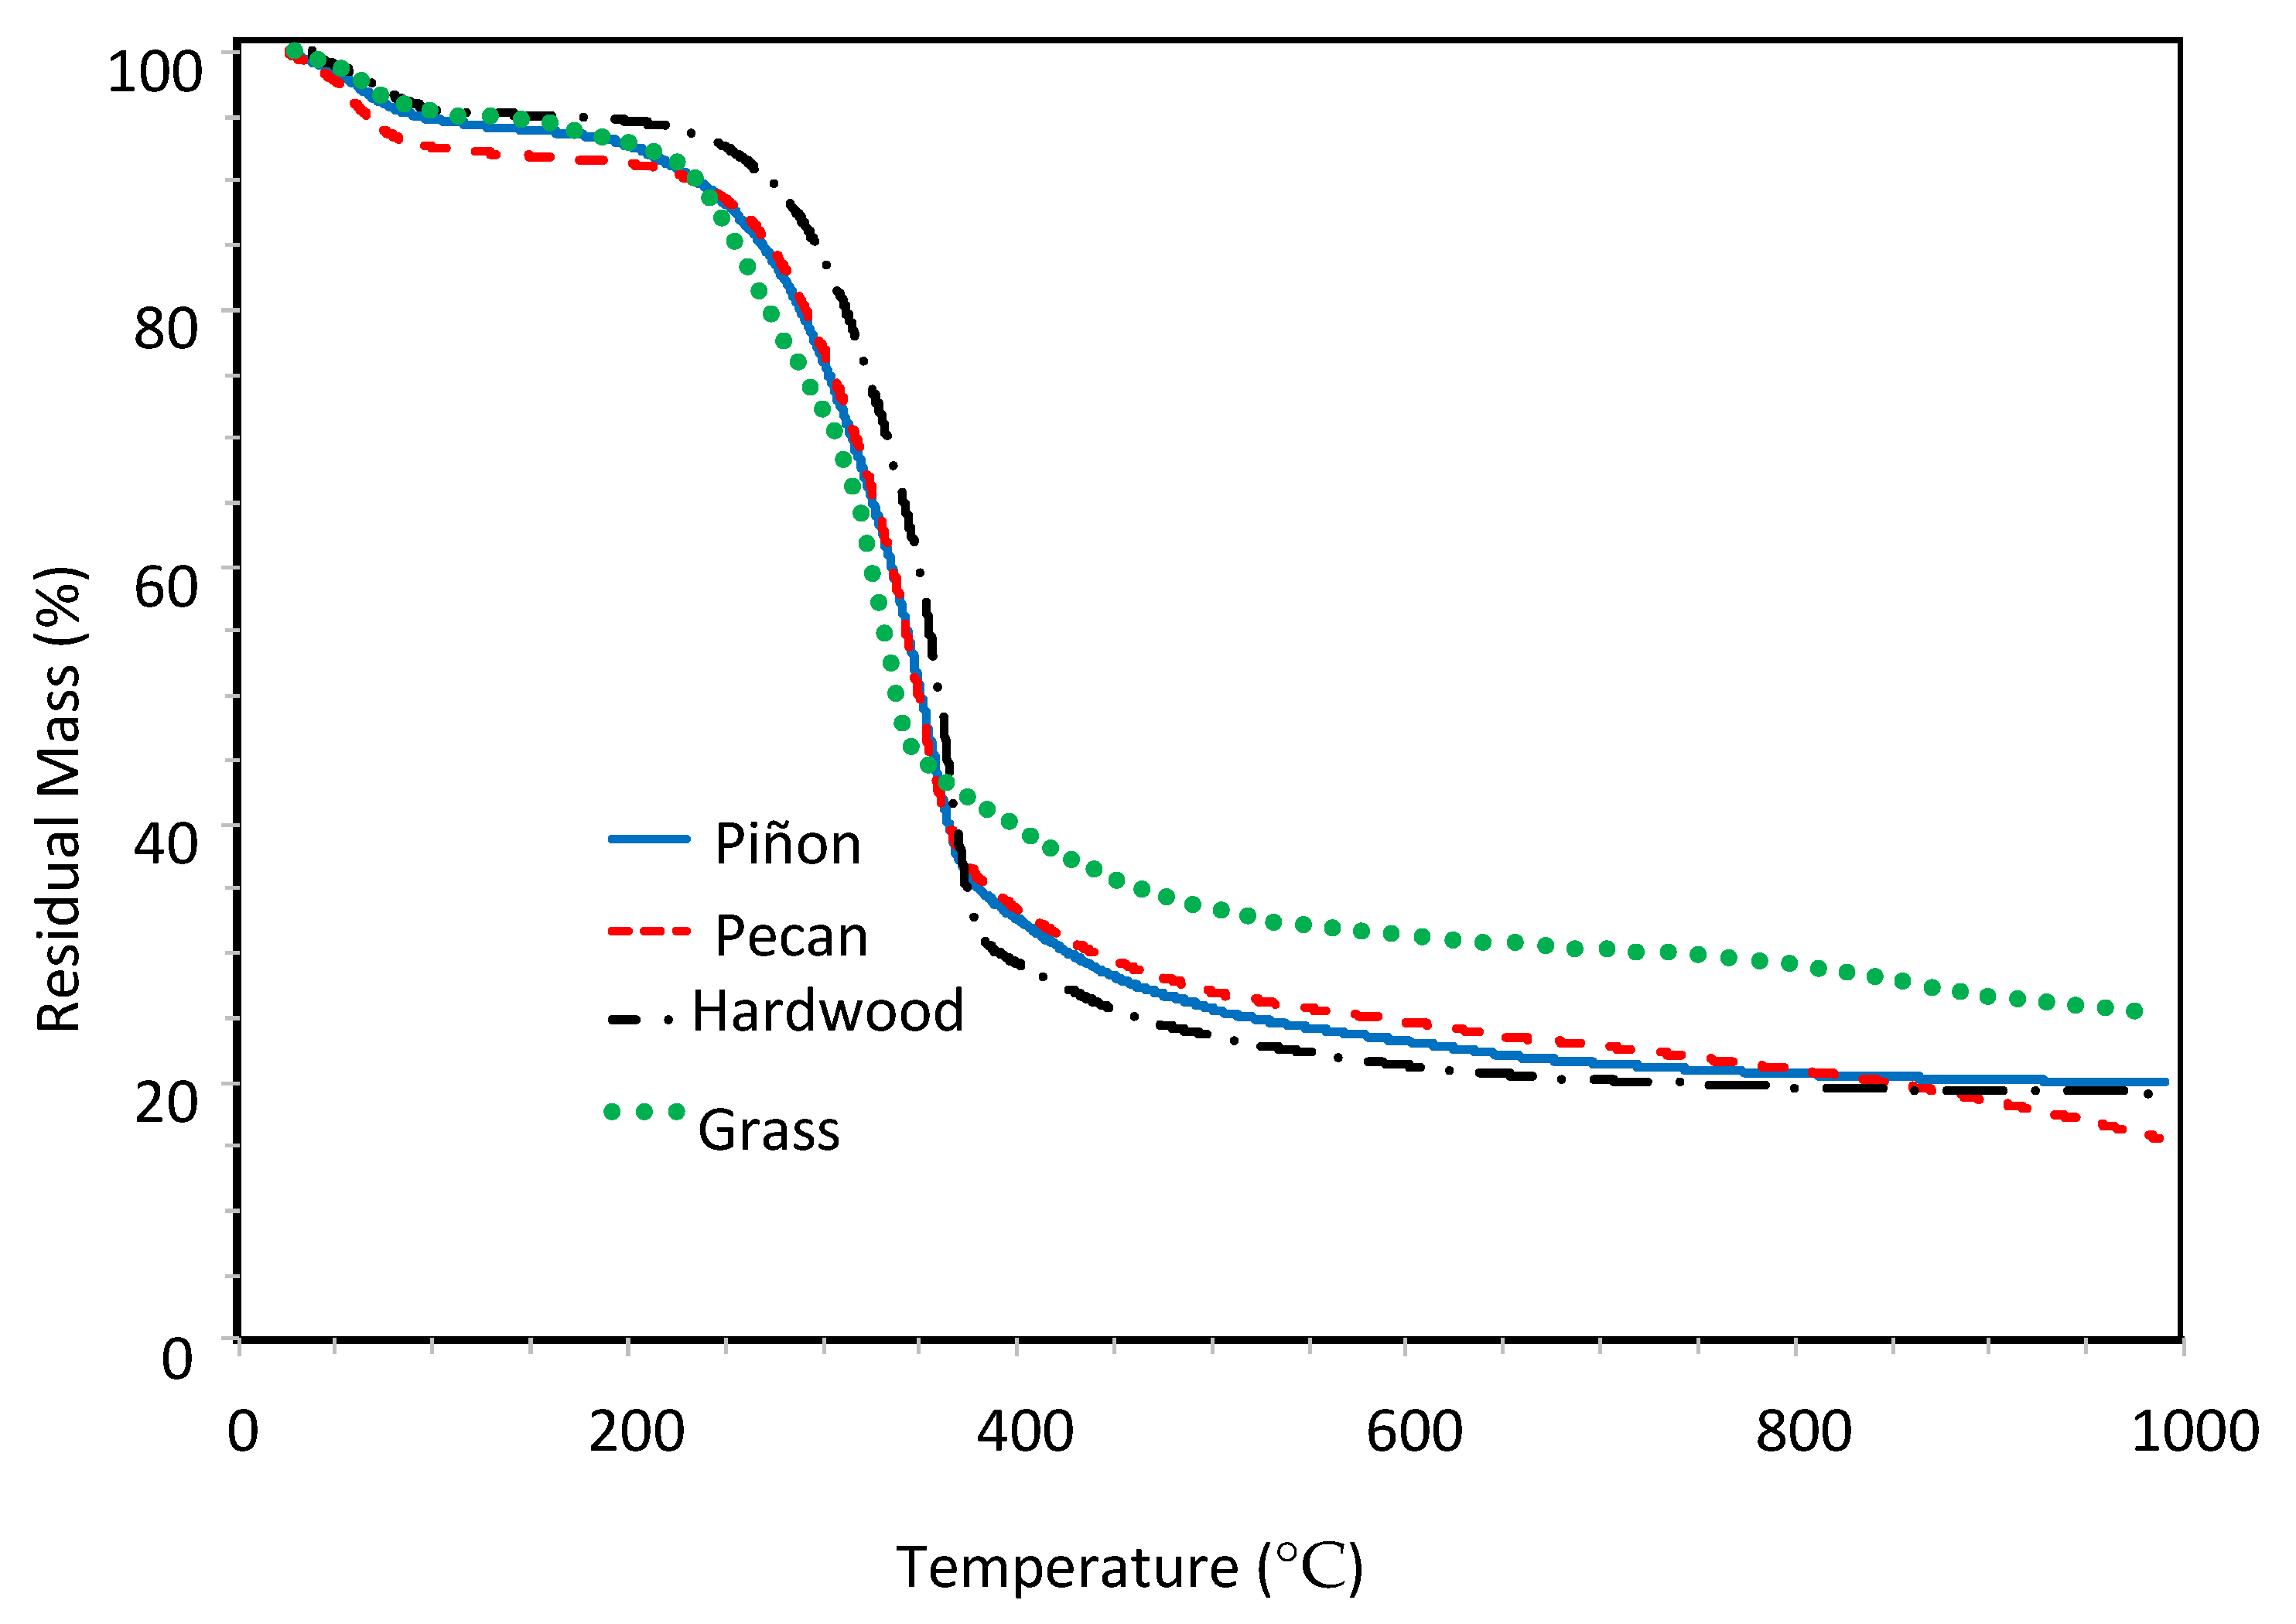
The biomass samples shown in Figure 4 all lost around 80 % of their mass during the run, with the majority of the loss occurring below 400 °C. An initial 5–8% mass loss below 100 °C is attributed to water. Pecan wood appeared to continue losing mass at a faster rate than the other biomass samples as the temperature approached 1000 °C.
Figure 5 shows the effect of varying oxygen concentrations during heating to 1000 °C under nitrogen for piñon wood. The addition of 1% (vol.) oxygen into the gas stream results in complete combustion of the wood by 650 °C, whereas 0.11% (vol.) oxygen looked similar to the pure nitrogen data, with only slightly higher mass loss up to 800 °C. Nitrogen containing 0.11% (vol.) oxygen was used for a few sample preparation runs.

3.2. Isothermal TGA Tests and Tube Furnace Runs

Based on the initial TGA screening results, specific temperatures were chosen to conduct isothermal pyrolysis experiments. The temperatures were mostly chosen to be near the end of the largest mass loss step, but some were closer to the maximum temperature. The isothermal tests were conducted in both the TGA and in a tube furnace. The latter allowed a sufficient quantity of material to be produced to enable subsequent surface area analysis. Figure 6 summarizes the residual mass of each sample (i.e., what remained after the experiment) as a function of isothermal pyrolysis temperature and, in some cases, as a function of oxygen concentration.
From an idealistic standpoint, the smallest residual mass is desired, provided the residue that remains has sufficient porosity. The biomass samples, therefore, appear to be of the greatest interest as they have potential for the highest specific surface areas [32].

3.3. Textural Properties of the Produced Activated Carbon Materials

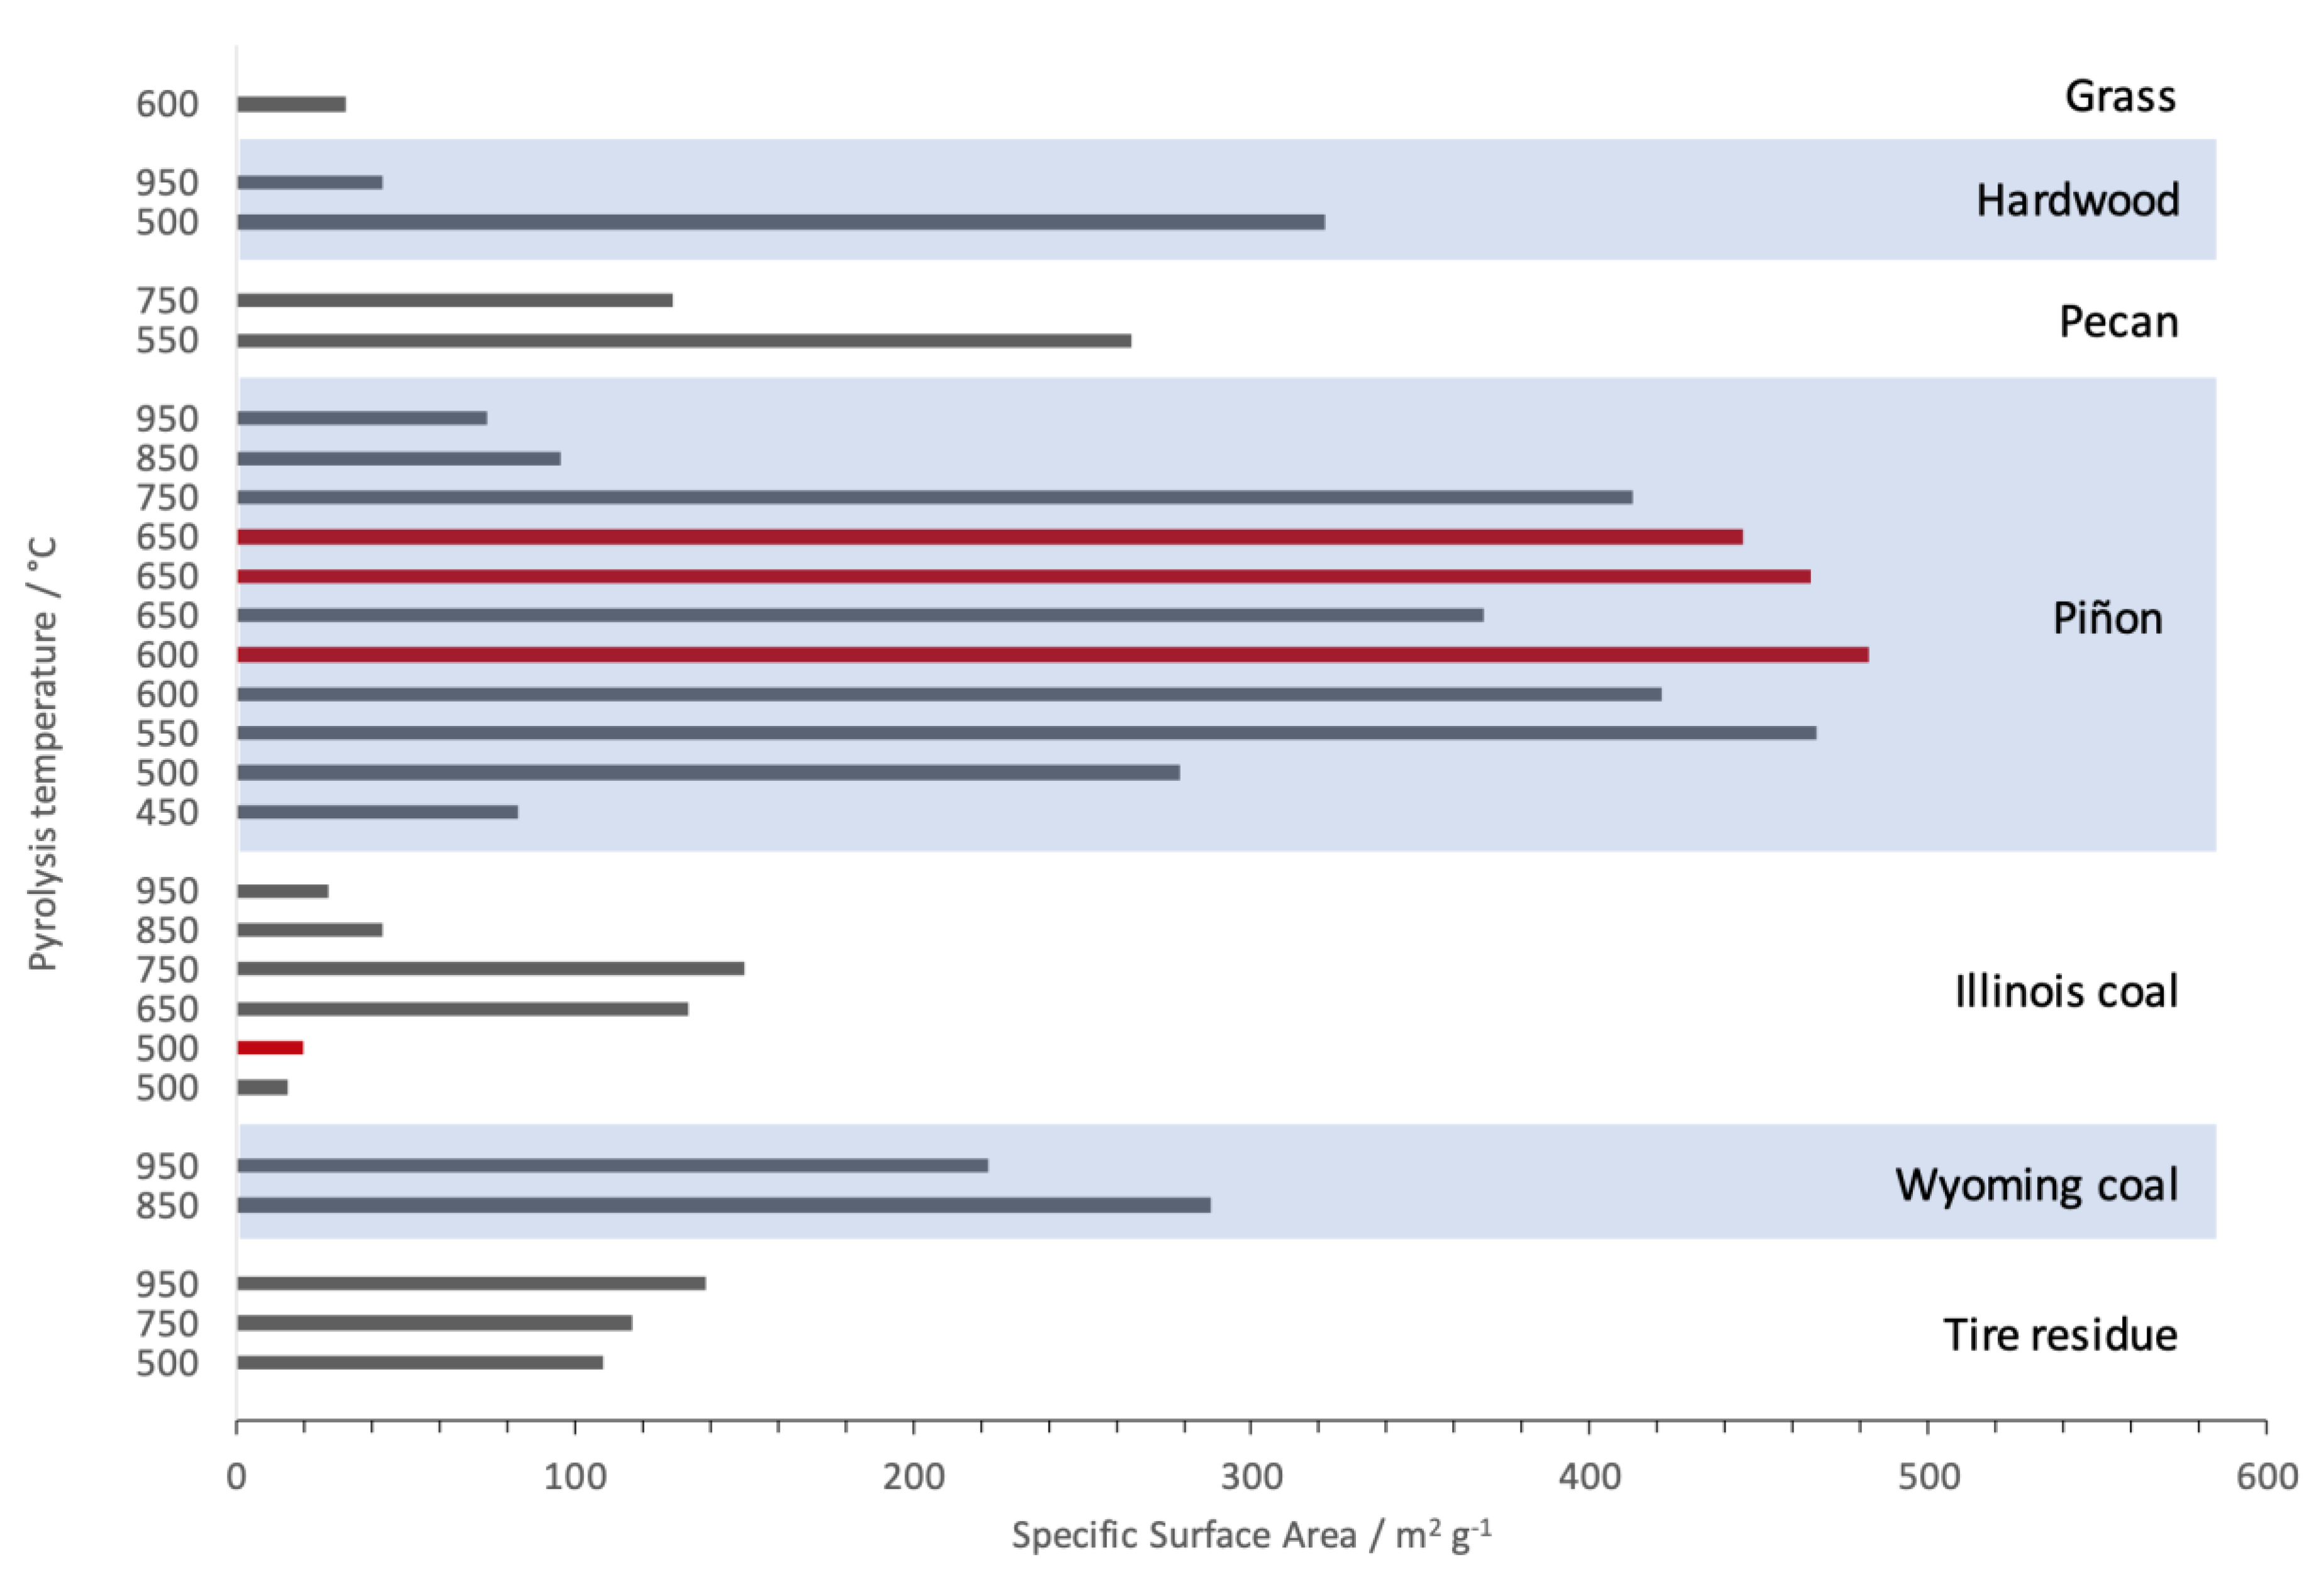
The carbons harvested from the tube furnace runs were transferred into quartz glass tubes, degassed under vacuum at 300 °C, and characterized using nitrogen adsorption under cryogenic conditions. Figure 7 shows the variation of the measured specific surface area (SSA) for each feedstock as a function of isothermal pyrolysis temperature and oxygen concentration during pyrolysis. As is normal for gas sorption data, the SSAs are normalized to the mass of the activated carbon.
The coal samples and tire residue all showed moderate SSA, although the Wyoming coal outperformed all others, achieving almost 300 m2 g−1 after pyrolysis at 850 °C. Of the biosolid samples, piñon showed the highest SSA, with values in the mid-to-high 400s over a wide range of pyrolysis temperatures. Where sufficient data exists (i.e., for piñon and Illinois coal), it is clear that SSA values increase with increasing pyrolysis temperature, pass through a maximum, and then decrease with further increases in temperature. This can be explained as follows: at low temperatures, only a portion of the organic material has been carbonized within the sample, and thus the porosity has not yet been opened to the gas phase. At intermediate temperatures, all the organics that can be readily pyrolyzed have been converted to carbon, and gas percolation is possible through the resulting pores [33,34]. After pyrolysis at the highest temperatures, the porous structures that were present after intermediate temperature treatment are no longer stable and tend to condense further to close some porosity.
A comparison of SSA values for pairs of samples prepared at the same pyrolysis temperature, but under varying oxygen concentrations shows a significant boost when 0.11% (vol.) oxygen was used compared to when no oxygen was added to the gas stream. Figure 8 shows the same data as Figure 7, but normalized to the mass of feedstock used to prepare the activated carbon (i.e., values are m2 of gas adsorbed per gram of raw starting material). This shows that, on a raw feedstock basis, Wyoming coal offers the greatest potential surface area per ton.
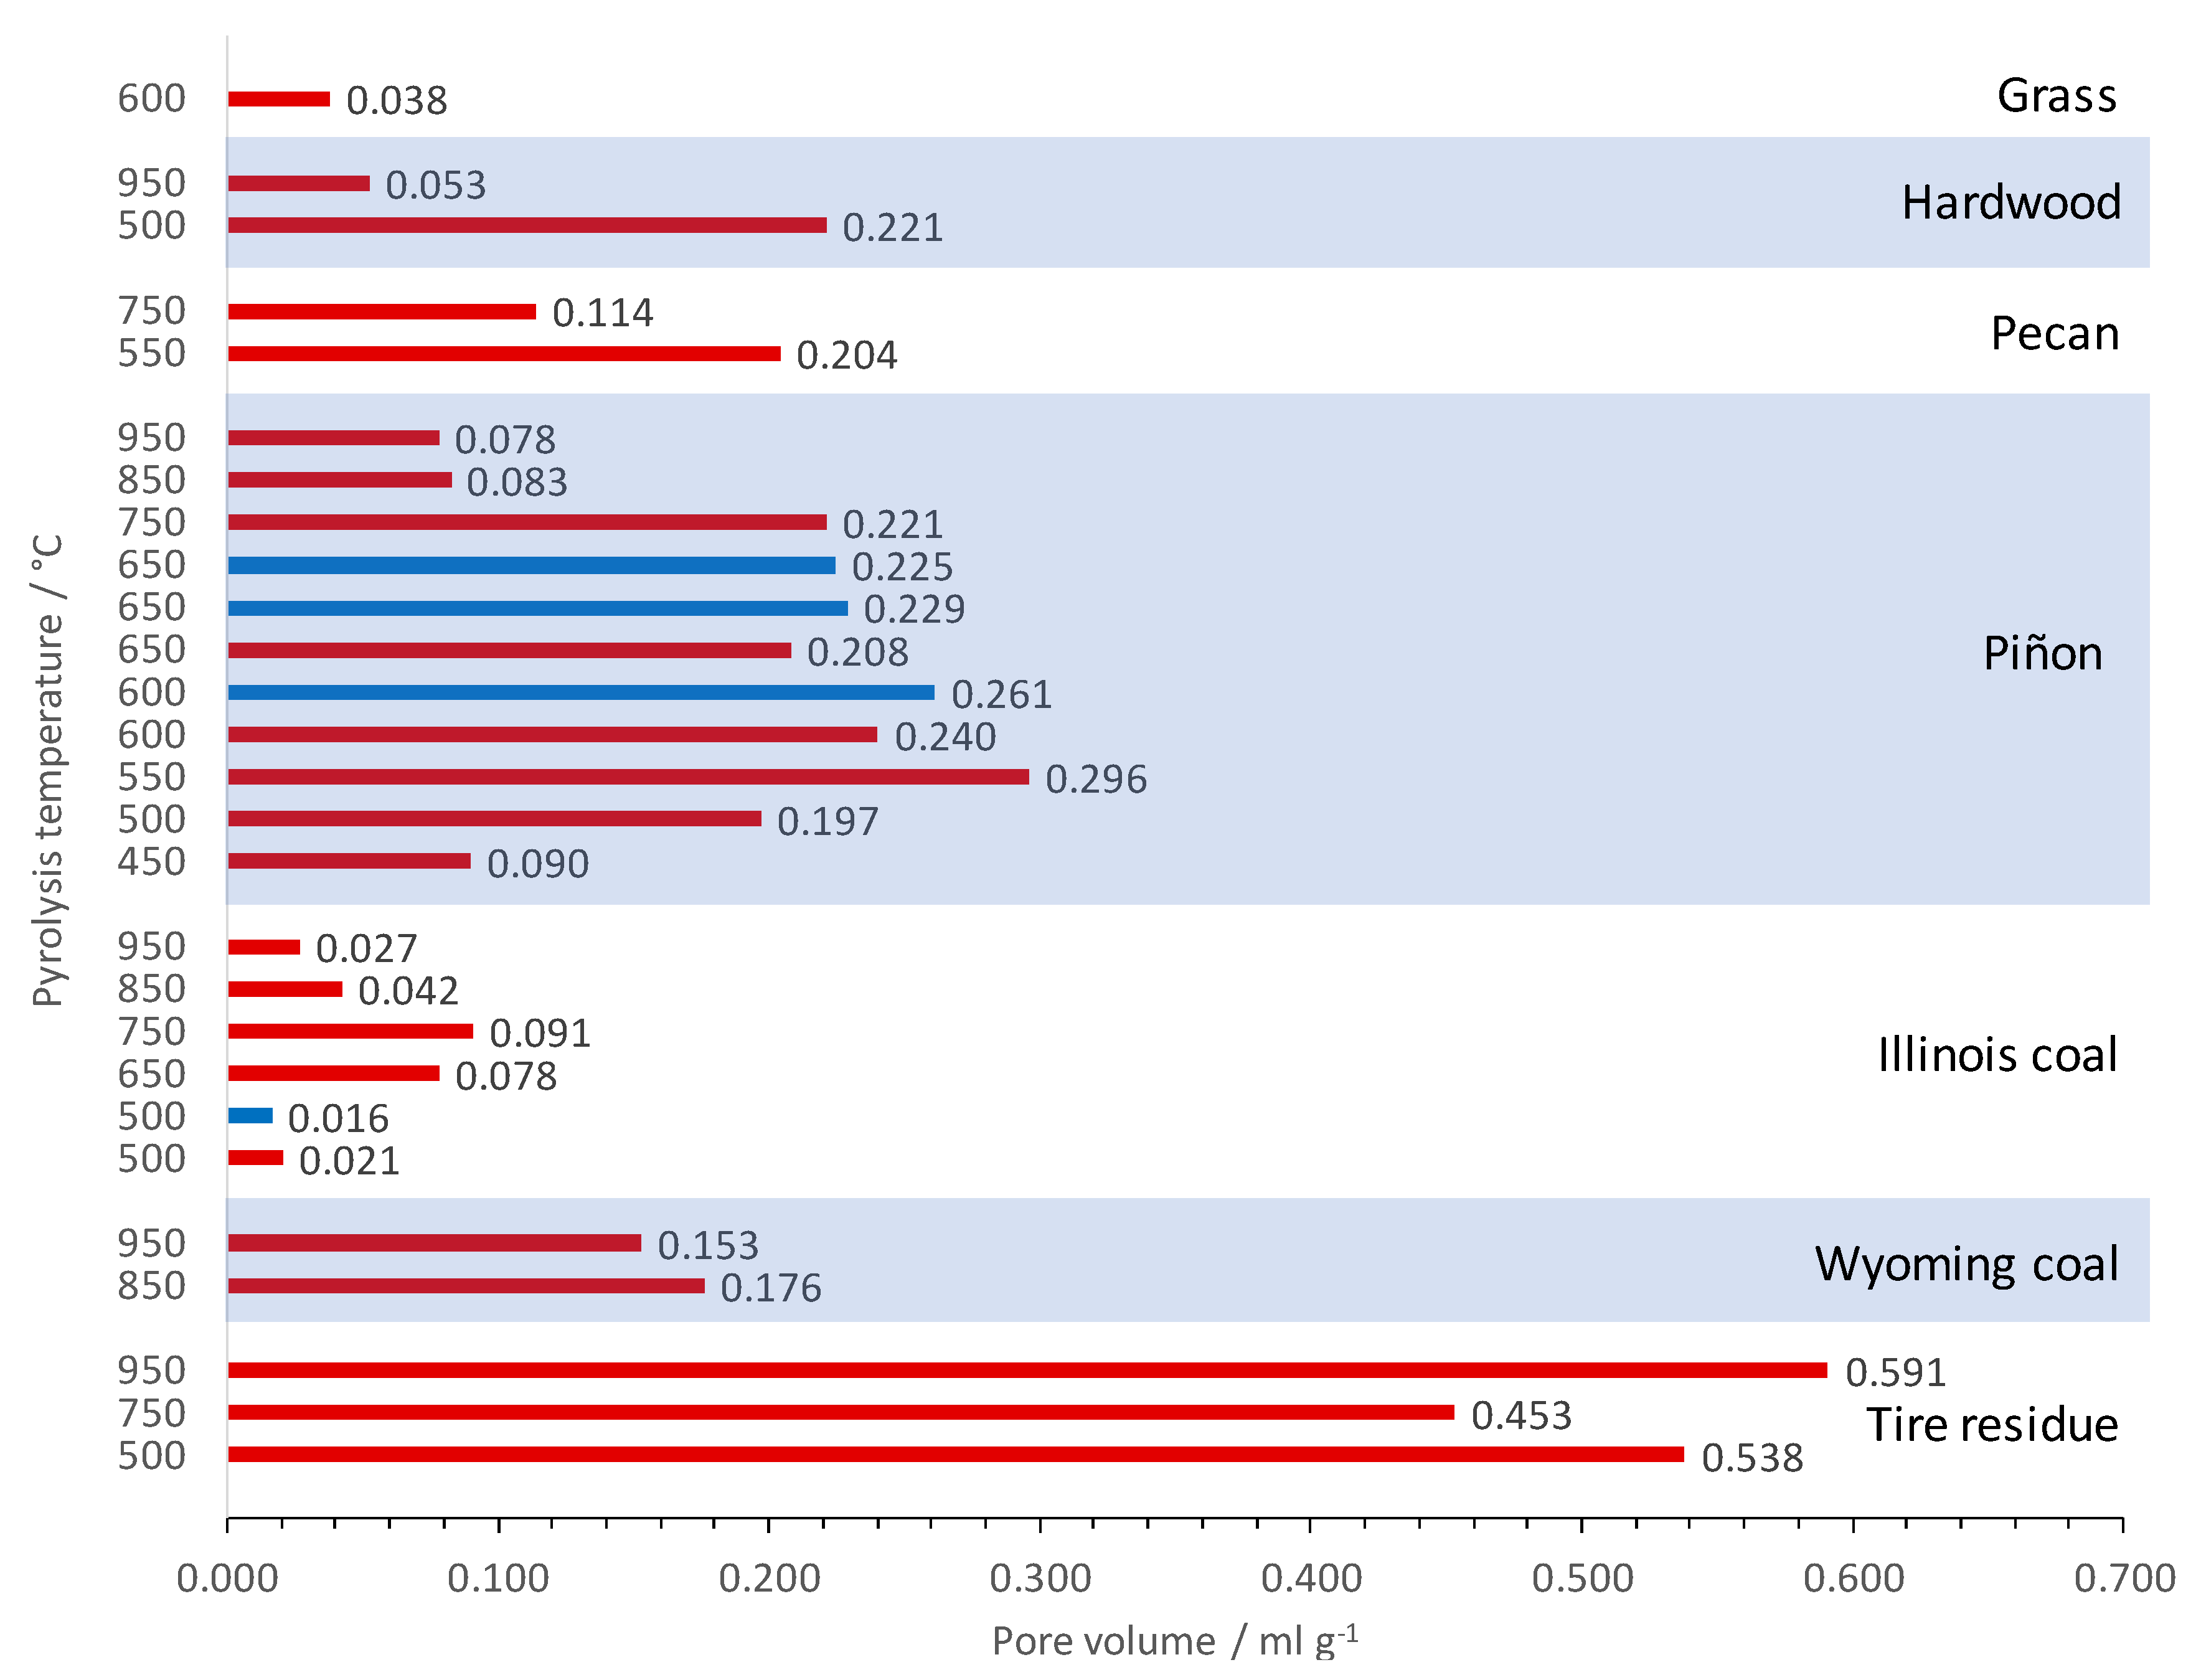
Another important metric for adsorbents, particularly when considering liquid adsorption, is their total available pore volume. This is measured from the nitrogen adsorption isotherm near saturation (i.e., how much nitrogen is adsorbed as the pressure approaches atmospheric pressure) [35]. The pore volume data is shown in Figure 9 and Figure 10, normalized to mass of activated carbon and mass of raw feedstock, respectively. Tire residue proved to have the highest pore volume of all the materials tested. Given its moderate SSA, the high pore volume suggests that the pores formed in pyrolyzed tire residue are larger than those in the biosolid materials. Similar observations were made for SSA in terms of pore volume variations with pyrolysis temperature and the oxygen content of the pyrolysis gas [36].

4. Conclusions

Biochars are widely produced and, as biosorbents, are of great importance for the treatment of environmental pollutants. The feedstocks and methods used in biochar production are very important factors in increasing the amount of conversion. In particular, it is necessary to know the conversion performances of biomass and industrial wastes with different properties in order to play a role in regional development and environmental protection. In order to make this comparison, the general results obtained in this study are as follows;
(1)
For applications such as municipal water treatment, in particular, the biomass feedstocks are most desirable in comparison to hydrocarbon feedstocks because of their significantly higher yield and because they are a more socially acceptable source;
(2)
While piñon wood gave the best results, this and some of the other biomass feedstocks have a negative value, so a double benefit is realized: both the production of a valuable and useful product, activated carbon, and the disposal of plant fiber without incineration;
(3)
In addition, the optimal process variables are indicated by the results. Pyrolysis temperatures in the range 600–650 °C give the highest yield, and an atmosphere with trace oxygen gives the best results.
In conclusion, the many different methods of production of biochar result in different characteristics that allow for biochar to be used in a wide variety of ways. Biochar can also be modified to better suit the task that is needed and can be turned into activated carbon through either physical or chemical activation. If biochar is the desired product, slow pyrolyzation or hydrothermal carbonization are the recommended methods of production.

Author Contributions

Conceptualization, E.N.C., X.L.-F., B.D. and N.Y.; methodology, E.N.C., X.L.-F., B.D. and N.Y.; software, E.N.C., X.L.-F., B.D. and N.Y.; validation, E.N.C., X.L.-F., B.D. and N.Y.; formal analysis, E.N.C., X.L.-F., B.D., N.Y. and A.A.; investigation, E.N.C., X.L.-F., B.D. and N.Y.; data curation, E.N.C., X.L.-F., B.D., N.Y. and A.A.; writing—original draft preparation, E.N.C., X.L.-F., B.D. and N.Y.; writing—review and editing, E.N.C., X.L.-F., B.D., N.Y. and A.A. All authors have read and agreed to the published version of the manuscript.

Funding

This research received no external funding.

Data Availability Statement

Not applicable.

Acknowledgments

The Sandia National Laboratories are multi-mission laboratories managed and operated by National Energy Solutions, LLC, a wholly owned subsidiary of Honeywell International, Inc., for the U.S. Department of Energy’s National Nuclear Security Administration under contract DE-NA-0003525. The views expressed in this article do not necessarily represent the views of the US Department of Energy or the United States Government.

Conflicts of Interest

The authors declare no conflict of interest.

References

  1. Sohi, S.; Krull, E.; Lopez-Capel, E.; Bol, R. A Review of Biochar and Its Use and Function in Soil. Adv. Agron. 2010, 105, 47–82. [Google Scholar]
  2. Rosa, J.; Paneque, M.; Miller, A.Z.; Knicker, H. Relating physical and chemical properties of four different biochars and their application rate to biomass production of Lolium perenne on a Calcic Cambisol during a pot experiment of 79 days. Sci. Total Environ. 2014, 499, 175–184. [Google Scholar] [CrossRef]
  3. Erickson, B. Regenerating degraded dirt. CEN Glob. Enterp. 2016, 94, 40–43. [Google Scholar] [CrossRef]
  4. Shaheen, S.M.; Niazi, N.K.; Hassan, N.E.E.; Bibi, I.; Wang, H.; Tsang, D.C.W.; Ok, Y.S.; Bolan, N.; Rinklebe, J. Wood-based biochar for the removal of potentially toxic elements in water and wastewater: A critical review. Int. Mater. Rev. 2018, 64, 216–247. [Google Scholar] [CrossRef]
  5. Cheng, F.; Li, X. Preparation and Application of Biochar-Based Catalysts for Biofuel Production. Catalysts 2018, 8, 346. [Google Scholar] [CrossRef]
  6. Zhao, L.; Cao, X.; Mašek, O.; Zimmerman, A. Heterogeneity of biochar properties as a function of feedstock sources and production temperatures. J. Hazard. Mater. 2013, 256–257, 1–9. [Google Scholar] [CrossRef]
  7. Antal, M.J.; Grønli, M. The Art, Science, and Technology of Charcoal Production. Ind. Eng. Chem. Res. 2003, 42, 1619–1640. [Google Scholar] [CrossRef]
  8. Wang, Y.; Hu, Y.; Zhao, X.; Wang, S.; Xing, G. Comparisons of Biochar Properties from Wood Material and Crop Residues at Different Temperatures and Residence Times. Energy Fuels 2013, 27, 5890–5899. [Google Scholar] [CrossRef]
  9. Wu, W.; Yang, M.; Feng, Q.; McGrouther, K.; Wang, H.; Lu, H.; Chen, Y. Chemical characterization of rice straw-derived biochar for soil amendment. Biomass Bioenergy 2012, 47, 268–276. [Google Scholar] [CrossRef]
  10. Byrne, C.E.; Nagle, D.C. Carbonization of Wood for Advanced Materials Applications. Carbon 1997, 35, 259–266. [Google Scholar] [CrossRef]
  11. Mok, W.S.L.; Antal, M.J.; Szabo, P.; Varhegyi, G.; Zelei, B. Formation of Charcoal from Biomass in a Sealed Reactor. Ind. Eng. Chem. Res. 1992, 31, 1162–1166. [Google Scholar] [CrossRef]
  12. Brewer, C.E. Biochar Characterization and Engineering. Ph.D. Thesis, Iowa State University, Ames, IA, USA, 2012; pp. 12–84. [Google Scholar]
  13. Titirici, M.M.; White, R.J.; Falco, C.; Sevilla, M. Black perspectives for a green future: Hydrothermal carbons for environment protection and energy storage. Energy Environ. Sci. 2012, 5, 6796–6822. [Google Scholar] [CrossRef]
  14. Buentello-Montoya, D.; Zhang, X.; Li, J. The use of gasification solid products as catalysts for tar reforming. Renew. Sustain. Energy Rev. 2019, 107, 399–412. [Google Scholar] [CrossRef]
  15. González, J.F.; Román, S.; Encinar, J.M.; Martínez, G. Pyrolysis of various biomass residues and char utilization for the production of activated carbons. J. Anal. Appl. Pyrolysis 2009, 85, 134–141. [Google Scholar] [CrossRef]
  16. Cha, J.S.; Choi, J.C.; Ko, J.H.; Park, Y.K.; Park, S.H.; Jeong, K.-E.; Kim, S.-S.; Jeon, J.-K. The low-temperature scr of no over rice straw and sewage sludge derived char. Chem. Eng. J. 2010, 156, 321–327. [Google Scholar] [CrossRef]
  17. Ros, A.; Lillo-Ródenas, M.; Fuente, E.; Montes-Morán, M.; Martín, M.; Linares-Solano, A. High surface area materials prepared from sewage sludge-based precursors. Chemosphere 2006, 65, 132–140. [Google Scholar] [CrossRef]
  18. Son, E.; Poo, K.; Chang, J.; Chae, K.-J. Heavy metal removal from aqueous solutions using engineered magnetic biochars derived from waste marine macro-algal biomass. Sci Total Environ. 2018, 615, 161–168. [Google Scholar] [CrossRef]
  19. Shahbaz, M.; AlNouss, A.; Parthasarathy, P.; Abdelaal, A.H.; Mackey, H.; McKay, G.; Al-Ansari, T. Investigation of biomass components on the slow pyrolysis products yield using Aspen Plus for techno-economic analysis. Biomass Convers. Biorefin. 2022, 12, 669–681. [Google Scholar] [CrossRef]
  20. Danish, M.; Ahmad, T. A review on utilization of wood biomass as a sustainable precursor for activated carbon production and application. Renew. Sustain. Energy Rev. 2018, 87, 1–21. [Google Scholar] [CrossRef]
  21. Sajjadi, B.; Chen, W.Y.; Egiebor, N.O. A comprehensive review on physical activation of biochar for energy and environmental applications. Rev. Chem. Eng. 2019, 35, 735–776. [Google Scholar] [CrossRef]
  22. Oliveira, F.R.; Patel, A.K.; Jaisi, D.P.; Adhikari, S.; Lu, H.; Khanal, K. Environmental application of biochar: Current status and perspectives. Bioresour. Techno. 2017, 246, 110–122. [Google Scholar] [CrossRef]
  23. Wu, P.; Wang, Z.; Bolan, N.S.; Wang, H.; Wang, Y.; Chen, W. Visualizing the development trend and research frontiers of biochar in 2020: A scientometric perspective. Biochar 2021, 3, 419–436. [Google Scholar] [CrossRef]
  24. Chen, Y.D.; Wang, R.; Duan, X.; Wang, S.; Ren, N.Q.; Ho, S.H. Production, properties, and catalytic applications of sludge derived biochar for environmental remediation. Water Res 2020, 187, 116390. [Google Scholar] [CrossRef] [PubMed]
  25. Ahmed, M.B.; Zhou, J.L.; Ngo, H.H.; Guo, W. Biomass and Bioenergy Insight into biochar properties and its cost analysis. Biomass Bioenergy 2016, 84, 76–86. [Google Scholar] [CrossRef]
  26. Djellabi, R.; Aboagye, D.; Galloni, M.G.; Andhalkar, V.V.; Nouacer, S.; Nabgan, W.; Rtimi, S.; Constantí, M.; Cabello, F.M.; Contreras, S. Combined conversion of lignocellulosic biomass into high-value products with ultrasonic cavitation and photocatalytic produced reactive oxygen species—A review. Bioresour. Technol. 2022, 368, 128333. [Google Scholar] [CrossRef] [PubMed]
  27. Ao, W.; Fu, J.; Mao, X.; Kang, Q.; Ran, C.; Liu, Y.; Zhang, H.; Gao, Z.; Li, J.; Liu, G.; et al. Microwave assisted preparation of activated carbon from biomass: A review. Renew. Sustain. Energy Rev. 2018, 92, 958–979. [Google Scholar] [CrossRef]
  28. Malyan, S.K.; Kumar, S.S.; Fagodiya, R.K.; Ghosh, P.; Kumar, A.; Singh, R.; Singh, L. Biochar for environmental sustainability in the energy-water-agroecosystem. nexus. Renew. Sustain. Energy Rev. 2021, 149, 11137. [Google Scholar] [CrossRef]
  29. Amalina, F.; Razak, A.S.A.; Krishnan, S.; Sulaiman, H.; Zularisam, W.A.; Nasrullah, M. Advanced techniques in the production of biochar from lignocellulosic biomass and environmental applications. Clean. Mater. 2022, 6, 100137. [Google Scholar] [CrossRef]
  30. Cao, X.; Sun, S.; Sun, R. Application of biochar-based catalysts in biomass upgrading: A review. RSC Adv. 2017, 7, 48793–48805. [Google Scholar] [CrossRef]
  31. Kambo, H.S.; Dutta, A. A comparative review of biochar and hydrochar in terms of production, physico-chemical properties and applications. Renew. Sustain. Energy Rev. 2015, 45, 359–378. [Google Scholar] [CrossRef]
  32. Weber, K.; Quicker, P. Properties of biochar. Fuel 2018, 217, 240–261. [Google Scholar] [CrossRef]
  33. Amalina, F.; Razak, A.S.A.; Krishnan, S.; Zularisam, A.; Nasrullah, M. A comprehensive assessment of the method for producing biochar, its characterization, stability, and potential applications in regenerative economic sustainability—A review. Clean. Mater. 2022, 3, 100045. [Google Scholar] [CrossRef]
  34. Shabir, R.; Li, Y.; Zhang, L.; Chen, C. Biochar surface properties and chemical composition determine the rhizobial survival rate. J. Environ. Manag. 2023, 326, 116594. [Google Scholar] [CrossRef]
  35. Liu, P.; Zhuang, H.; Qian, Y.; Yang, J.; Pan, Y.; Zhou, Z.; Jia, L.; Qi, F. Recent advances in mass spectrometric studies on the reaction process of biomass pyrolysis. Fuel Process. Technol. 2022, 237, 107473. [Google Scholar] [CrossRef]
  36. Vuppaladadiyam, A.K.; Vuppaladadiyam, S.S.V.; Awasthi, A.; Sahoo, A.; Rehman, S.; Pant, K.K.; Murugavelh, S.; Huang, Q.; Anthony, E.; Fennel, P.; et al. Biomass pyrolysis: A review on recent advancements and green hydrogen production. Bioresour. Technol. 2022, 364, 128087. [Google Scholar] [CrossRef] [PubMed]
Figure 1. The schematic view of the pyrolysis furnace.
Energies 16 01606 g001
Figure 2. TGA of tire residue pyrolyzed under nitrogen. Two runs were performed under identical conditions. The heating rate was 10 °C min−1.
Energies 16 01606 g002
Figure 3. TGA of coal specimens pyrolyzed under nitrogen. The two Illinois coal samples were from different batches. All specimens were pulverized. The heating rate was 10 °C min−1.
Energies 16 01606 g003
Figure 4. TGA of biomass samples pyrolyzed under nitrogen. The heating rate was 10 °C min−1.
Energies 16 01606 g004
Figure 5. TGA of piñon samples pyrolyzed under nitrogen (“0%” oxygen), 0.11% (vol.) oxygen in nitrogen, or 1% (vol.) oxygen in nitrogen. The heating rate was 10 °C min−1.
Energies 16 01606 g005
Figure 6. Summary of residual masses of different feedstocks after heating to the indicated isothermal pyrolysis temperature. All samples were prepared in the tube furnace under flowing nitrogen (red bars) or flowing 0.11% (vol.) oxygen in nitrogen (blue bars).
Energies 16 01606 g006
Figure 7. Summary of surface area data for samples prepared in the tube furnace at the indicated pyrolysis temperatures under flowing nitrogen (grey bars) or flowing 0.11% (vol.) oxygen in nitrogen (red bars). All data are normalized to the mass of the activated carbon analyzed.
Energies 16 01606 g007
Figure 8. Summary of surface area data for samples prepared in the tube furnace at the indicated pyrolysis temperatures under flowing nitrogen (red bars) or flowing 0.11% (vol.) oxygen in nitrogen (purple bars). All data are normalized to the mass of the feedstock before pyrolysis.
Energies 16 01606 g008
Figure 9. Summary of pore volume data for samples prepared in the tube furnace at the indicated pyrolysis temperatures under flowing nitrogen (red bars) or flowing 0.11% (vol.) oxygen in nitrogen (blue bars). All data are normalized to the mass of the activated carbon analyzed.
Energies 16 01606 g009
Figure 10. Summary of pore volume data for samples prepared in the tube furnace at the indicated pyrolysis temperatures under flowing nitrogen (red bars) or flowing 0.11% (vol.) oxygen in nitrogen (blue bars). All data are normalized to the mass of the feedstock before pyrolysis.
Energies 16 01606 g010
Table 1. Specifications for thermochemical processes [19,20,21].
Thermochemical ProcessRange (°C)Heating RatePressureResidence Time Primary Product
Slow Pyrolysis350–800Slow <10 °C/minAtmosphericHours
Days
Char
Torrefaction200–300Slow <10 °C/minAtmosphericMinutes
Hours
Stabilized, friable biomass
Fast Pyrolysis400–600Very Fast ~1000 °C/sVacuum-AtmosphericSecondsBio-oil
Flash Pyrolysis300–800FastElevatedMinutesBiocarbon/Char
Gasification700–1500Moderate-Very FastAtmospheric-ElevatedSeconds
Minutes
Syngas/Producer gas
Disclaimer/Publisher’s Note: The statements, opinions and data contained in all publications are solely those of the individual author(s) and contributor(s) and not of MDPI and/or the editor(s). MDPI and/or the editor(s) disclaim responsibility for any injury to people or property resulting from any ideas, methods, instructions or products referred to in the content.