Article

Feasibility of 10 MW Biomass-Fired Power Plant Used Rice Straw in Cambodia

1
Transdisciplinary Science and Engineering Program, Graduate School of Advanced Science and Engineering, Hiroshima University, 1-5-1 Kagamiyama, Higashi-Hiroshima 739-8529, Japan
2
Division of Distributive and Business, Electricité du Cambodge, Phnom Penh 12202, Cambodia
3
Center for the Planetary Health and Innovation Science (PHIS), The IDEC Institute, Hiroshima University, 1-5-1 Kagamiyama, Higashi-Hiroshima 739-8529, Japan
*
Author to whom correspondence should be addressed.
Energies 2023, 16(2), 651; https://doi.org/10.3390/en16020651
Submission received: 9 November 2022 / Revised: 23 December 2022 / Accepted: 29 December 2022 / Published: 5 January 2023
(This article belongs to the Special Issue Biomass and Bio-Energy)

Abstract

:
This study investigates the feasibility of rice straw for energy production in Cambodia. The potential areas for a 10 MW biomass-fired power plant installation are estimated based on rice straw availability displayed in a graphic information system (GIS). The discounted cash flow (DCF) method on the profitability index (PI) was executed by Mathlab software, which was used to determine the period of the power plant profitability. The reduction of CO and CO2 emissions from the proposed rice straw biomass-fired power plant with 10 MW capacity was calculated and compared with the coal-fired power plant and open field burning. Prey Veng, Takeo, and Battambang are potential provinces that have an estimated rice straw source of 804,796 t/annum, 720,040 t/annum, and 603,273 t/annum, respectively. Within a 20-year project, the biomass-fired power plant can reach profitability between six and ten years with the operation of the rice-straw price of 20 USD/t to 40 USD/t. The total energy produced by these potential areas is 1251 GWh/annum, with a CO2 emission avoidance of 1.06 million t/annum compared to the coal-fired power plant operation. Simultaneously, the emission savings of the biomass-fired power plant compared to open-field burning are 0.61 million t/annum of CO2 and 0.02 million t/annum of CO in the study site. The findings are prospectively essential for further designing of a small-scale biomass-fired power plant in Cambodia.

1. Introduction

Cambodia is a country that depends on agriculture, where eighty percent of the population consists of farmers who work in rice production [1]. After harvesting, abundant rice straw is burnt or left out to decompose in the field without proper treatment because of its low value. The quantity of rice straw burning in the open field is about 30% of annual rice straw production [2]. Biomass is a part of energy in terms of producing electricity from agricultural waste [3]. Biomass is a carbon-neutral renewable energy source that has several advantages for use in the energy sector as pure feed stock or a co-gasification source, namely large reserves, renewable sources, high reactivity, low pollutant emissions, and high alkali and alkaline earth metal content [4,5]. Biomass gasification for power production with clean technology is a practical alternative to fossil fuels. Mohammad et al. investigated a biomass integrated gasification combined cycle based on olive pits as fuel by conventional and advanced exergy, exergoeconomic, and exergoenvironmental analyses [6]. In order to further reduce CO2 emissions, biomass is considered as a replacement fuel for coal in the oxy-fuel combustion power plant, and the proposed process becomes a type of bioenergy with carbon capture and storage (CCS) [7]; biomass gasification was used as fuel as an oxygen carrier in the chemical looping combustion process [8]; and co-firing biomass and coal in power plants with CCS was studied by life-cycle cost assessment as an efficient measure for deep decarbonization in the energy sector [9]. In the study [10], the biomass gasification process is investigated and analyzed considering 23 different kinds of biomass sources. Because of the greatest exergy destruction rate of the rice husk among the selected biomasses, rice biomass-fired power plants’ sources should consider the optimized tar combustion in thermodynamic analysis. Rice straw and rice husk were considered as biomass for energy production [11]. Gadde et al. stated that they burned 48% of rice straw production in Thailand, 30% was unused, 15% was fed to animals, 5% was used for agricultural activities, and the rest of the rice straw was used for other purposes [12]. In the Philippines, people burned 95% of generated rice straw, and 5% was used for other activities. Based on these experiences of rice straw management, without the presence of a bioenergy power plant, the amount of rice straw available is around 80% to 95% of generated rice straw [13]. Therefore, it is a suitable opportunity to install a rice straw-fired power plant in Cambodia. According to an earlier report, the share of coal in power generation is 30% of global CO2 emissions [14]. Rice straw burning in an open field is a kind of non-controlled combustion [12]; because of emission reduction and CO2-neutral energy resources, biomass is considered a renewable energy source [15]. The co-firing biomass helps to cut down the net CO2 pollution from coal combustion [16]. These studies reflect evidence that the biomass application is a part of emission savings.
In Cambodia, electricity depends on two primary power sources including domestic power production and international power importation. The international imported power capacity is 980.75 MW [17]. The total installed capacity and power production are 3896.77 MW and 12,498.66 GWh, respectively. In 2020, the installed capacity of domestic power sources was 2916.02 MW. This power production is based on traditional power plants, namely coal-fired power plants (675 MW) and fuel oil-fired power plants (643.95 MW) and renewable energy sources, namely hydropower plants (1329.70 MW), solar power plants (236.80 MW), and biomass-fired power plants (30.57 MW). The total installed capacity percentage equivalence is 23.15% and 22.08% for non-renewable sources, and 45.60%, 8.12%, and 1.05% for renewable sources, respectively.
According to the purchasing cost of electricity in 2020 by Electricity of Cambodia (EDC), the country has purchased electrical energy from the local power plants with the highest maximum cost in biomass- and fuel oil-fired power plants, which equal to 0.122 USD/kWh and 0.158 USD/kWh, respectively. In the case of minimum cost, the same situation can be observed with 0.095 USD/kWh and 0.132 USD/kWh, as shown in Table 1.
In addition, Cambodia has also purchased electrical energy from neighboring countries, namely Thailand, Laos, and Vietnam, with an overall maximum cost of 0.129 USD/kWh and a minimum cost of 0.081 USD/kWh. Throughout the observation, the purchasing price of energy from the biomass-fired power plant was still lower than the fuel oil plant and the maximum cost of imported energies. Cambodia commonly harvested rice twice per year, during rainy and dry seasons. The potential of rice-grain production among the provinces could reach 1.2 million tons on average based on rice-grain production of the Ministry of Agriculture, Forestry, and Fisheries of Cambodia data from 2010–2019. This residue throughout rice production is considered as a potential biomass source for running the biomass-fired power plant. Therefore, this study is conducted to figure out the estimated rice straw resource and the potential areas in Cambodia that are appropriate to apply biomass-fired power plants from the rice straw resource. The economic investment and determination of the profit period of the proposed power plant by the variation of rice straw cost, distribution cost, and purchasing price of electricity are analyzed. Additionally, the estimation of energy production and emission savings of the biomass-fired power plant application in comparison with coal-fired power plants and open field burning is reported.

2. Materials and Methods

2.1. Calculation and Map Representation of Rice Straw Resource

The quantity of rice straw was calculated using the following equation [12]:
Q R S = P R R × S G R
where QRS—Quantity of rice straw (kt a−1); PRR—Rough rice production (kt a−1).
This equation is applicable for Asian countries in general, with the straw-to-grain ratio (SGR) equal to 0.75. Rice straw management in Cambodia is similar to the overview of rice straw management in the two Asian countries, Thailand and the Philippines. By expecting that only 85% of annual rice straw production is available for the bioenergy option, the equation above has been modified and reposted:
S p r o d ( i ) = P R   ( i ) × S G R × A v a i l a b i l i t y
where Sprod (i)—Amount of rice straw in a specific province (t/year); PR (i)—Amount of rice-grain production in a specific province (t/year). The estimation of rice straw quantities was calculated from the average grain production, which is presented in Supplementary Data, Table S1.
Indicator Index Resources (IIR) is a method to scale down the quantity of rice straw to a small number from zero to one. It is represented as a factor to indicate the level of rice straw in the GIS map. The indicator index resources (IIRi) in a specific province are shown using the following equation:
I I R i = R e s i d u e i R e s i d u e M a x

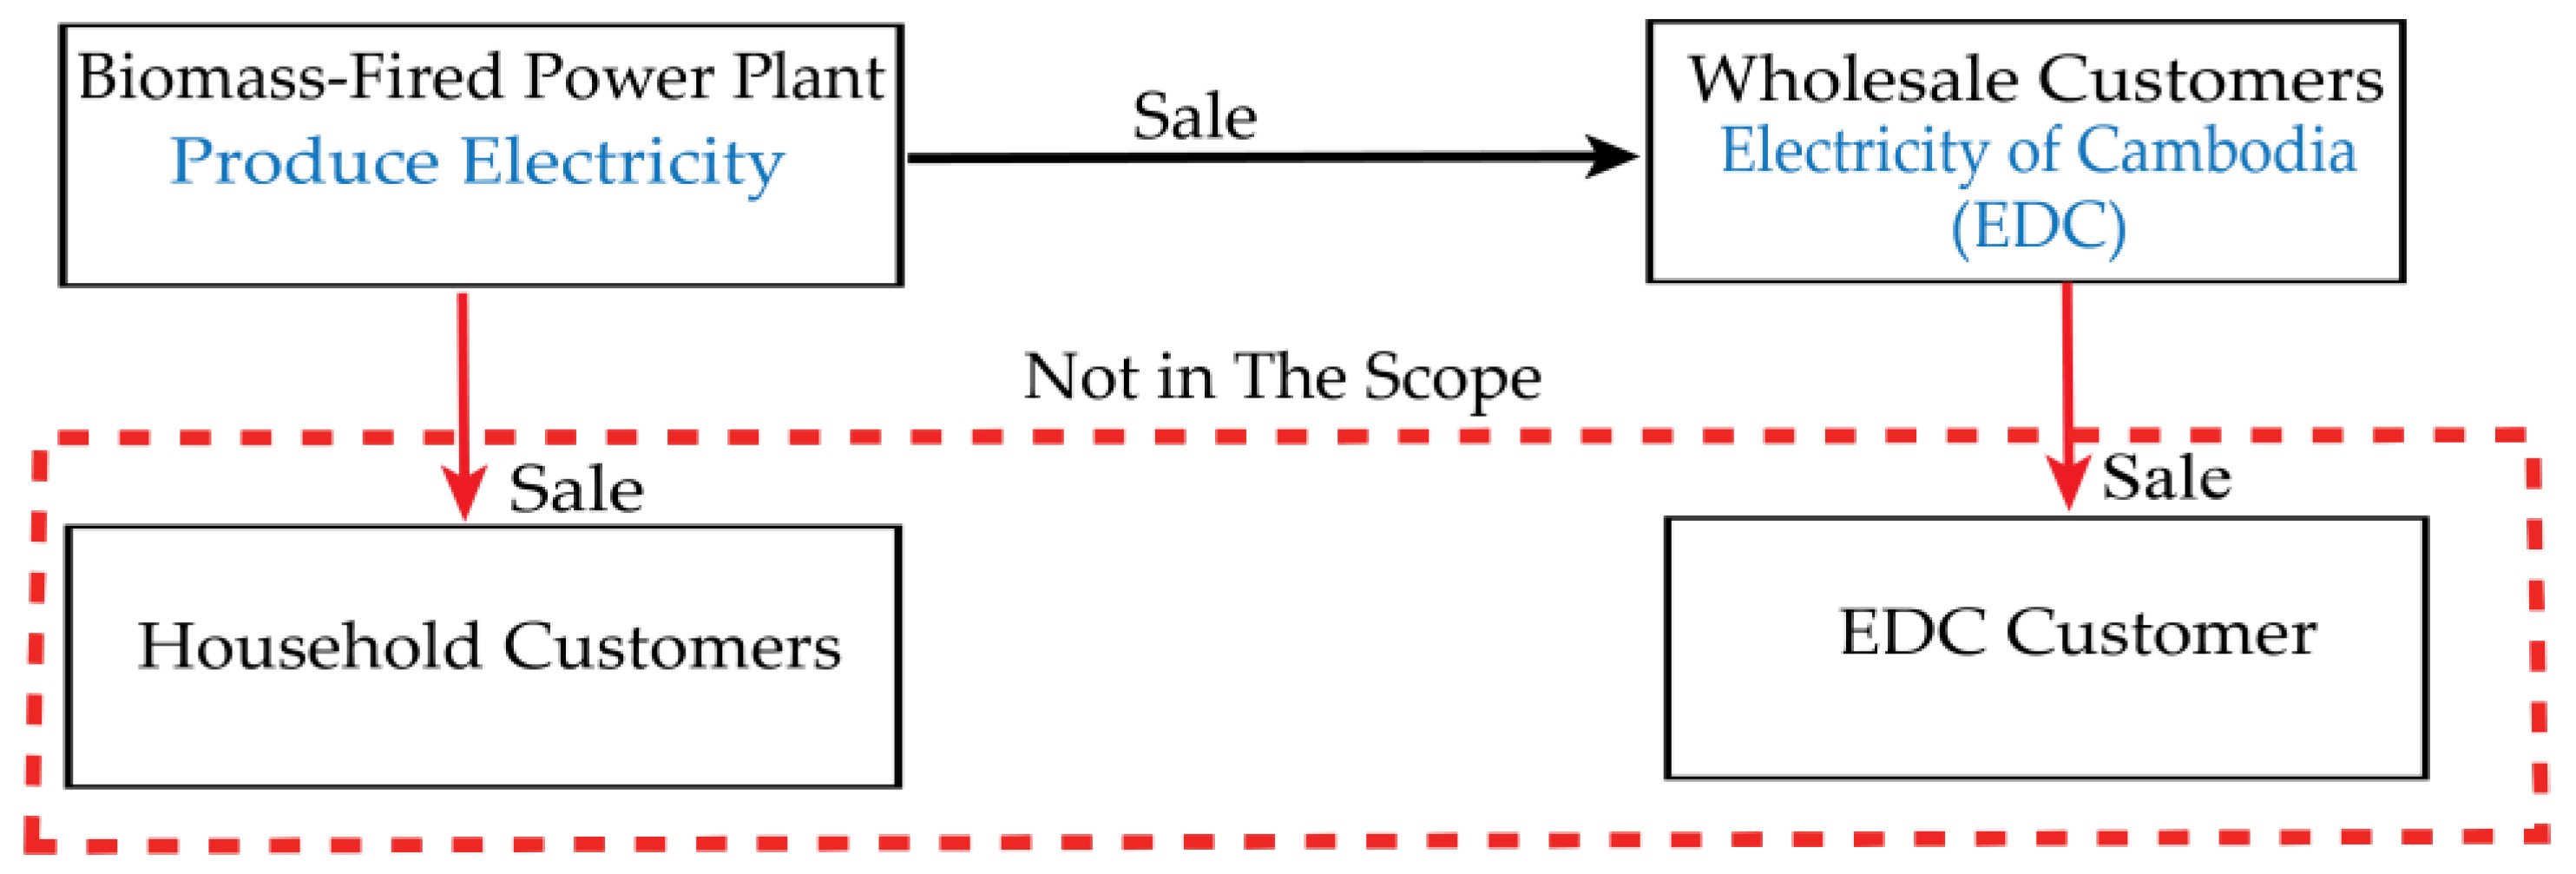
2.2. Business and Power Flow Model

In this analysis, the business scenario was that the biomass power plant had sold the produced electricity to the wholesale customer target EDC. Thus, the levelized cost of electricity (LCOE) was considered using customers’ experience purchasing electricity from the local biomass plant. The type of businesses in which biomass-fired power plants sold electricity to the household customers and in which the wholesale customer delivered electricity to their customers are not in the scope of this study, as shown in Figure 1.
Commonly, the power plants always divide the produced electricity to use on the site. According to the paper [18], the selected generator size (PCGen) was 11.50 MW, and electrical consumption onsite purposes (PCOnsite) of 1.50 MW for providing 10 MW to the grid system (PCNet) is shown in Figure 2. The specifications of the generator with 11.5 MW capacity is provided in Table 2.
The zone of possible agreement (ZOPA) of LCOE is the area of negotiation between vendors and purchasers. Table 3 describes the overall LCOE of Electrical of Cambodia, the target customer, in different situations such as trading price, domestic purchasing price, and international purchasing price. Throughout the comparison of this LCOE, the expected LCOE for this analysis is upwards of 5% and 10% from the local biomass purchasing price.

2.3. Amount of Rice Straw Requirement in Operation

The rice straw requirement to operate the biomass-fired power plant is defined in Equation (4) [19]. In this study, the rice straw requirement was variated with the rank of time operation in 6000–8000 h:
S p r o d = E × 3.6 × t η × L H V
where Sprod—Rice Straw Requirement (t); E = PCGen—Electricity Output (MW); t—Time Operation (h); LHV—Low Heating Value (MJ/kg); and ŋ—Efficiency of Generator (%).

2.4. Initial Cost of Operation

2.4.1. Rice Straw Cost

The specific cost of rice straw in Thailand was about 20–23 USD/t. This cost included some activities of rice straw preparation such as rolling rice straw in the field, collecting and loading rice straw rolls into the truck, transporting rice straw to the power plant site, dropping down and arranging the rice straw in the storage at the site [20]. Ghana’s specific rice straw cost varied from 39 USD/t to 47 USD/t, which is the same as preparation activities in Thailand’s case [21]. The total rice straw cost can be found using Equation (5), with the unit rice straw cost from 20 USD/t to 50 USD/t:
R S C = S p r o d × U C S
where RSC—Total Rice Straw Cost in Operation (USD); Sprod—Rice Straw Requirement (t); and UCS—unit Cost Rice Straw (USD/t).

2.4.2. Installation Cost

Biomass installation cost has varied by the region of the installation site. The intention to reduce the economy of installation has the side effect of increasing the local pollutant emissions. Installation of combined heat and power (CHP) generators have resulted in a higher capital cost. However, it can provide higher overall efficiency (80–85%). The ability to produce heat and steam (hot water) through the district heating network is the pivotal point for economic savings. In 2019, the global weighted average of the total installed biomass-fired cost was 2241 USD/kW. This cost was based on bioenergy experience from different countries and regions such as Europe, North America, Asia, and South America [22]. The installation cost of a biomass-fired power plant with the variation of unit installed capacity is calculated by Equation (6):
I C = P C G e n × U C I
where IC—Installation Cost (USD); UCI—Unit Installation Cost (USD/kW).

2.4.3. Maintenance and Operation Costs

Fixed maintenance and operation costs (M&OC) variated from 2% to 6% of the total installed cost per year, depending on the size of the power plant. This cost included labor, insurance, maintenance, and routine plant components such as boilers, gasifiers, feedstock handling equipment, etc. [22]. In this study, the selected M&OC with 4% of installation cost was chosen for economic analysis. Equation (7) was used to calculate the maintenance and operation costs.
M & O C = I C × P e r c e n t a g e
where M&OC—Maintenance and Operation Cost (USD); IC—Installation Cost (USD).

2.4.4. Distribution Cost

Distribution cost is the considering cost of the distribution medium voltage (MV) system from the power producer to the national grid system in Cambodia. The unit cost in one kilometer (UCD) has been designed based on the standard of JICA in Cambodia. The price of equipment has been adapted from the price list of Electricity of Cambodia. The relation of distribution cost and distribution length is shown using the equation as follows:
D C = L e n g t h   × U C D
where DC—Distribution Cost (USD); Length—The distance of MV line (km); and UCD—Unit Cost of Distribution in 1 km (USD/km).
Table 4 illustrates the equipment and corresponding price in a price list to install medium voltage distribution in one kilometer.

2.5. Biomass-Fired Power Plant Profit

Initial profit before tax payment (IP) is the amount of income the biomass-fired power plant is expected to acquire at the end of the year. The IP in USD could be calculated with the multiplication of the amount of electricity that plant sold to the customer (PCNET) in kilowatts by the time operation of the power plant (t) in hours and by the LCOE in USD/kWh that was in ZOPA. Equation (10) shows the calculation of IP. However, in the middle process of generating and selling electricity, some tasks such as maintenance and operating the power plant (M&OC) in USD and purchasing rice straw (RSC) in USD were considered extra work. Thus, the additional cost (ADC) is obtained using Equation (9):
A D C = R S C + M & O C
I P = ( P C N E T × t   × L C O E   ) A D C
In this analysis, the post profit after tax payment (EAT) followed the tax system in Cambodia. For the types of businesses that earned an annual income over 150,000,000 Riel, equal to 36,585.36 USD (1USD = 4100 Riel), the tax reduction is 20% of annual income [23]. Moreover, the tax reduction was selected as 20% of the annual income as shown in Equation (11):
E A T = I P ( I P × 20 % )

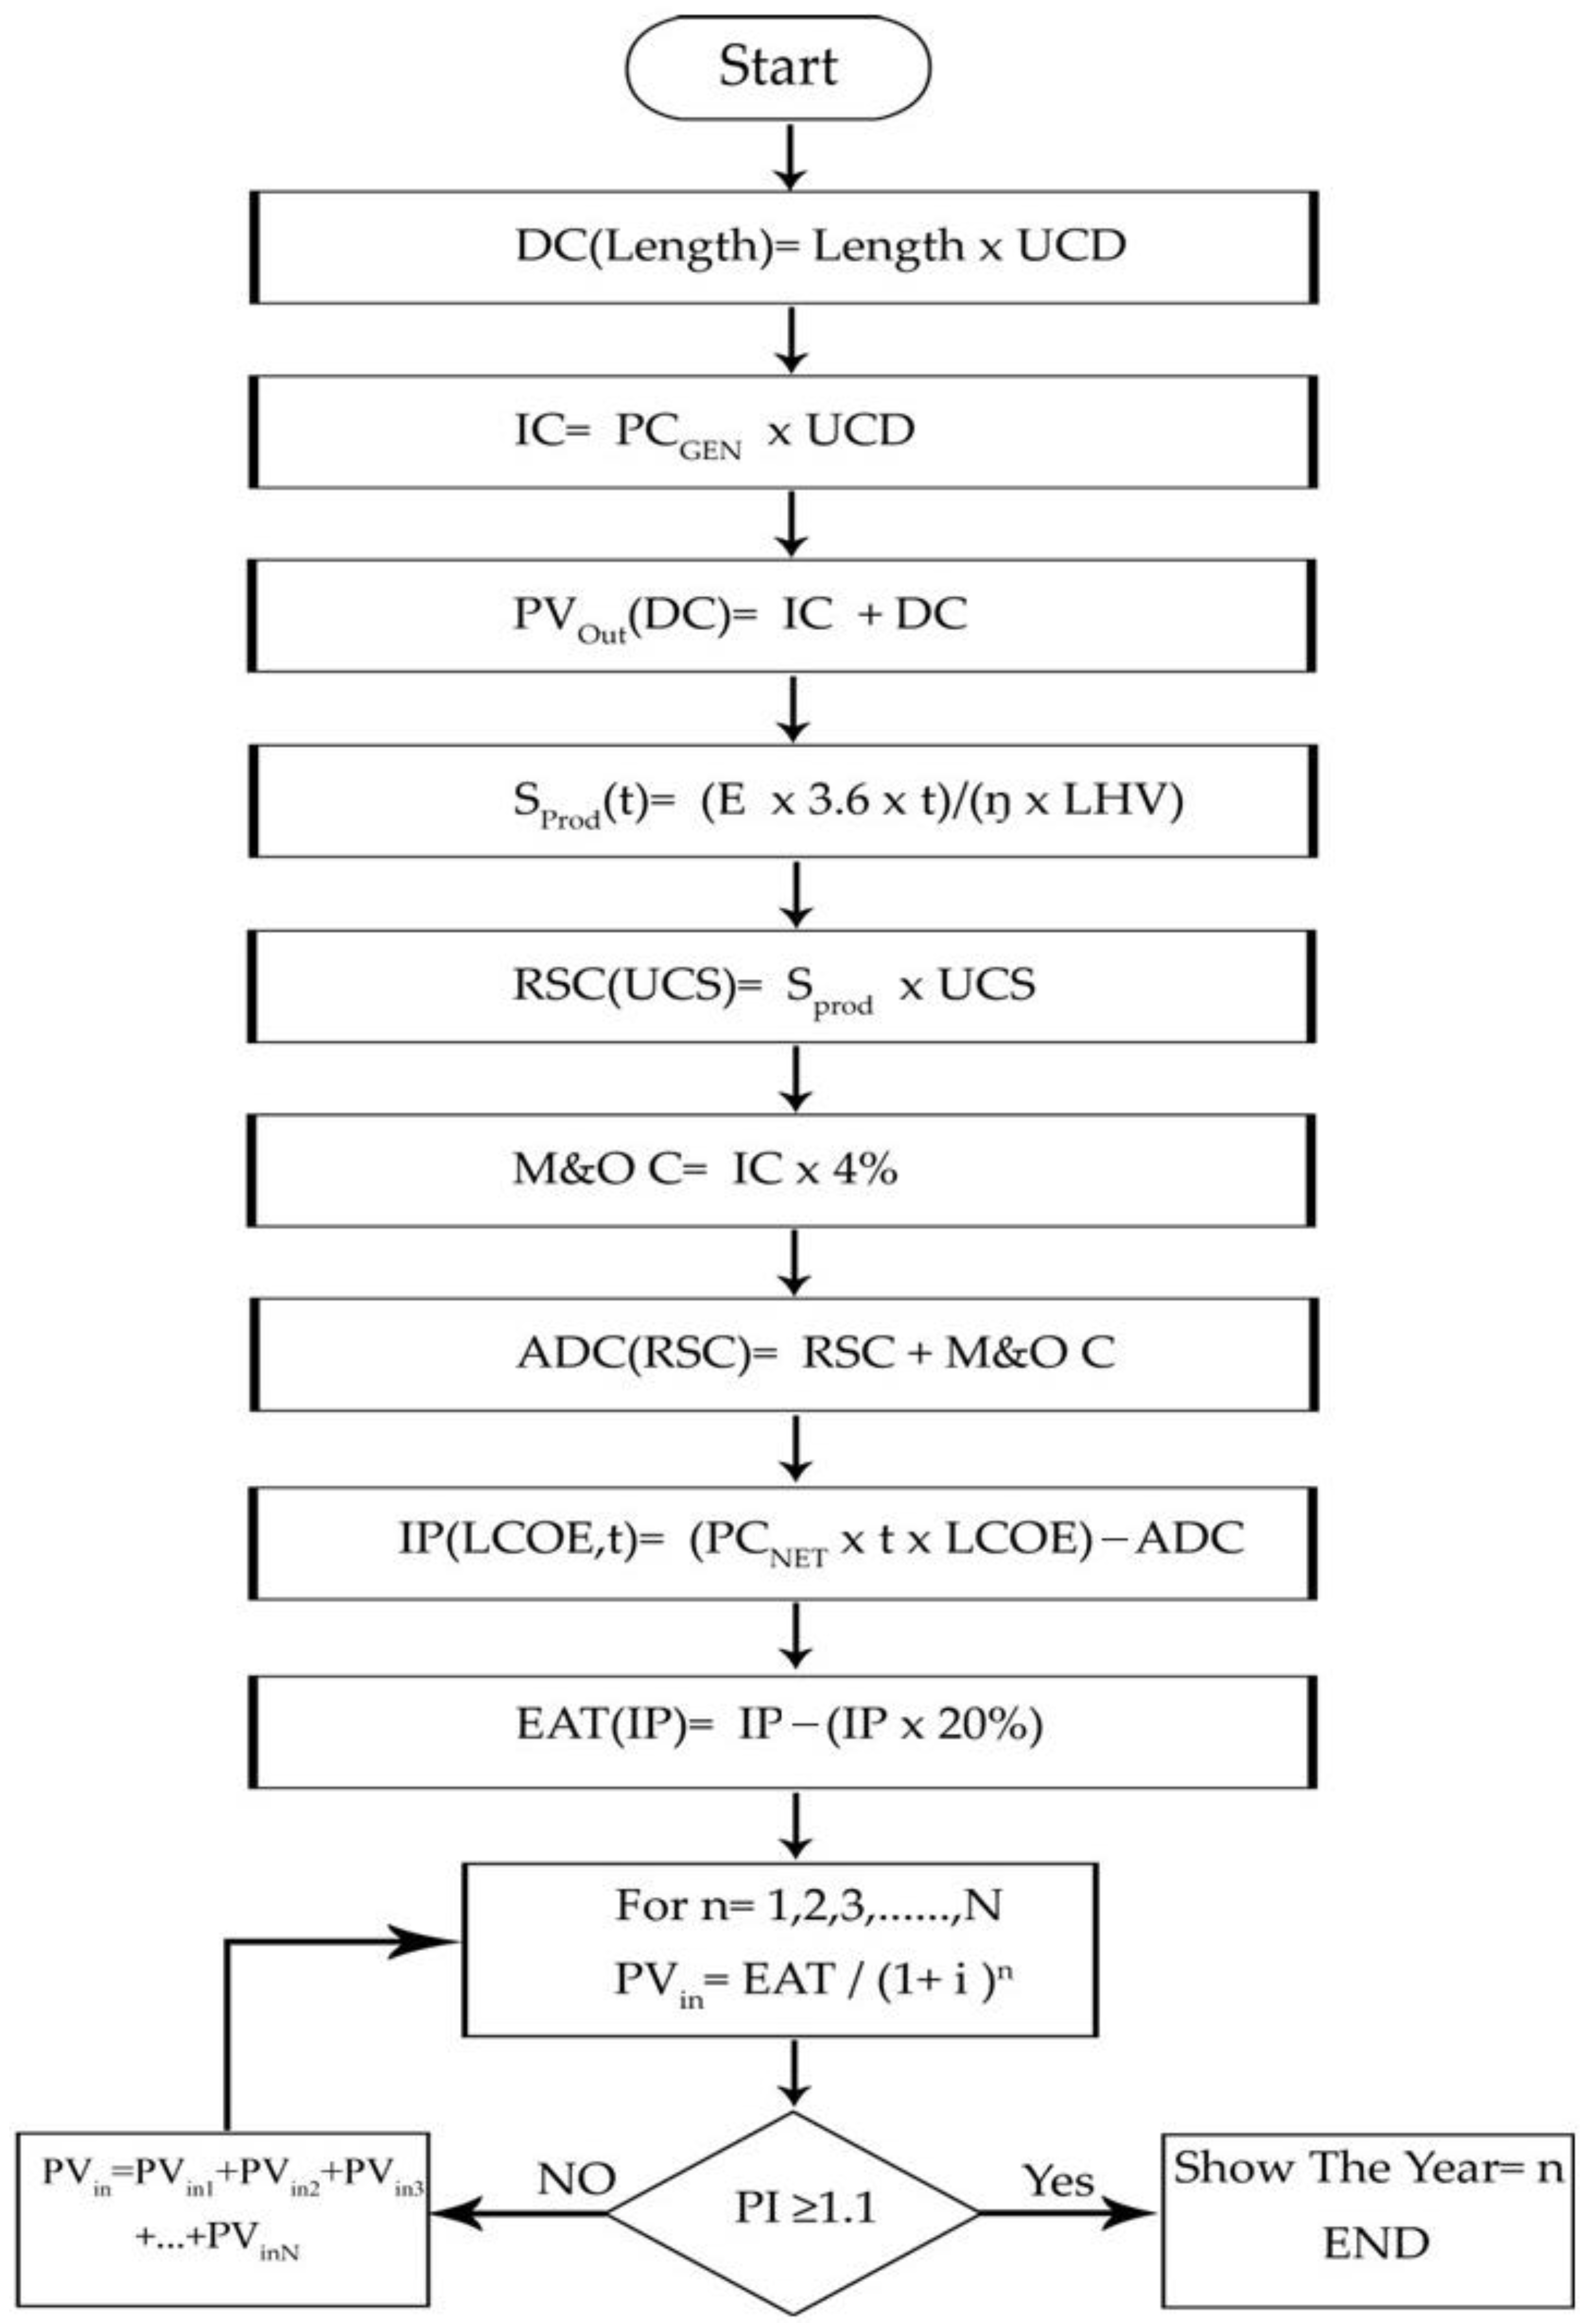
2.6. Discounted Cash Flow on Profitability Index

Discounted cash flow was the method applied to estimate the investment value in the present time by predicting the expected money value that would be generated in the future. The profitability index (PI) was the ratio of the total discounted future value of benefits over the initial investment cost in the present time. PI was used to indicate the investment profitability for other similar investments. PI also had a relation to net present value (NPV). Therefore, when the number of the PI was greater than one, it meant that the NPV was bigger than zero. As a result, the investment has had profitability. Otherwise, when PI was less than one, it meant that the NPV was less than zero. Therefore, the project has not created any profitability [24]. The simplification of Equation (12) was written as Equation (13):
P I = t = 1 n C F D t × ( 1 + k ) t I 0
where PI—Profitability Index; I0—Initial Investment; CFDt—available Cash Flow; n—Lifespan of the Project Investment (year); t—Considered Period (year); and k—Discounted Rate (%).
P I ( j ) = 1 j P r e s e n t   V a l u e   C a s h   I n f l o w   ( j ) P r e s e n t   V a l u e   C a s h   O u t f l o w
where j—Year of investment.
In this study, PI has been used to indicate the estimated year that the power plant would begin receiving profits with the internal rate of return (IRR) greater or equal to 10% of initial investment or cash outflow. In this case, it was similar that PI was greater or equal to 1.1. The executed method was coded in Matlab 2018 and followed by the flowchart in Figure 3.
Discounted rate is the percentage of reduction in the value of profit or money from the future time backward to the present time. The interest rate from the loan was 8.8% observing the change value of the money in the local bank of Cambodia in 2019 [25]. The value of the interest rate has been chosen as the discount rate in this study.
Throughout the previous study, the time operation for biomass-fired power plants started from 6500 h up to 7008 h or more. The rice straw purchasing unit variated from 20 USD/t to 47 USD/t, and the lifetime project was around 20 years, as presented in Table 5.
The experience from previous studies was essential in selecting parameters for analysis. Table 6 illustrates the parameters that have been used to analyze the economic model in this study.

2.7. Estimated Energy from Rice Straw Residue

Garba et al. stated that converting rice straw or rice husk to electrical energy required the residue to electrical energy conversion factor (RECF) of 0.588 [11]. Therefore, Equation (14) poses the conversion of rice straw to electrical energy:
E P S t r a w = S t r a w P r o d × R E F C
where EPStraw—Electricity production from rice straw (million MWh/annum); StrawProd—Amount of rice straw production in a specific area (million t/annum); and RECF—Residue to the electrical energy conversion factor.

2.8. Emission Avoidance

2.8.1. Emission Avoidance between Coal and Rice Straw Biomass Plant

Emission factors produced by the application of rice straw bioenergy plants was reported in the work [28]. Within a life cycle assessment (LCA) to produce 1 kWh of electricity, the rice straw has gone through three stages, namely paddy farming, rice straw collecting, and transportation to the power plant. Paddy farming pollution occurred with some activities such as fertilizer utilization, operation of the machine in land preparation, and irrigation. Meanwhile, the pollution from the second stage was caused by rice straw management methods such as mechanical harvesting and balling the rice straw. The transportation of rice straw consisted of two steps of collection, namely field-storage and power plant-storage. This study analyzed 58 km in the base case and 250 km in each stage within the length of transportation. The comparison between the emission factor of rice straw and coal illustrated in Table 7 and Equation (15) was the calculated equation of emission avoidance between coal-fired and rice straw-fired power plants:
E A   ( x ) C o a l B i o m a s s = P C G e n × t × A F   ( x )
where EA (x)Coal-Biomass—Emission avoidance of X pollutants element (kg); x—Name of pollutants element; and AF (x)—Avoidance factor of X element between coal and rice straw.

2.8.2. Emission Avoidance between Open Field Burning and Rice Straw Biomass-Fired Power Plants

Burning rice straw in the open field was a non-controllable combustion type. Gadde et al. stated the formula to calculate the number of pollutants [13] as below:
E m i s s i o n   ( x ) O p e n e d   F i e l d = Q R S × E F ( x ) × F C o
where Emission (x)Opened Field—Quantity of emission (kg); QRS—Quantity of rice straw burn in the open field (t); EF (x)—Emission factor of x element (kg/t); and FCo—Combustion Factor (0.8).
The combustion factor (FCo) in the procedure referred to the amount of rice straw that was wholly burned, and the emission factor is illustrated in Table 8.
Equation (17) is the expression of emission avoidance calculation between rice straw open field burning and biomass-fired power plants:
E S O p e n e d   F i e l d B i o m a s s = E m i s s i o n   ( x ) O p e n   F i e l d E m i s s i o n ( x ) B i o m a s s
where ESOpened Field-Biomass—Emission avoidance between opened field burning and biomass-fired power plant (kg); Emission (x)Open Field—Emission of x element from opened field burning (kg); and Emission (x)Biomass—Emission of x element from the biomass-fired power plant (kg).

3. Results

3.1. Biomass Resources

The total estimated amount of rice straw was 6.157 million t/annum. Within the 25 provinces, the highest rice straw production was 804,796 tons, while the lowest rice straw production was 7299 tons, as shown in Figure 4.
Figure 5 shows the availability of rice straw in the geography of Cambodia. From the overall look, within the classification of five IIR classes, three provinces that contained the highest IIR, 0.74–1, are Prey Veng, Takeo, and Battambang. In the northeast and southwest, Stung Treng, Ratanakiri, Mondulkiri, and Koh Kong provinces produce the lowest rice straw resources with the IIR class 0.01–0.06. The provinces Oddar Meanchey and Preah Vihear in the north and southeast, with IIR 0.06 to 0.024, are lower than the middle of the IIR classification. The areas in the center of the country, Siem Reap, Pursat, Kampong Chhnang, and Kampong Cham, had the value of IIR, 0.24–0.44, as the middle class of IIR.
The rice straw amount to feed the biomass-fired power plant with power output of 10 MW was variable based on the time operation. The annual rice straw amount was 71.90 kt at 6000 h and 95.87 kt at 8000 h. Increasing 500 h of time operation has adjusted about 6 kt of rice straw from the previous amount.
The results of the case study areas are shown in Table 9. Three provinces in the case study areas, Prey Veng, Takeo, and Battambang provinces, could produce rice straw amounts 804,796 t/annum, 720,040 t/annum, and 603,273 t/annum, which can feed biomass-fired power plants with the capacity of 10 MW from 11 to 8, 10 to 8, and 8 to 6 times, respectively, due to the time operation from 6000–8000 h. The resource of rice straw from Prey Veng, Takeo, and Battambang provinces could generate potential electricity of approximately 473 GWh, 423 GWh, and 355 GWh, respectively.

3.2. Economic Analysis

3.2.1. Cash Outflow

The relation between cash outflow and distribution length is shown in Figure 6. This distribution system was connected to the national grid from the biomass power plant. At 5 km of distribution length, the cash outflow was about 24.686 million US dollars (mln USD). Extension length distribution to 20 km increased the cash outflow to 24.879 mln USD. The amount of cash outflow raised 64,520 USD in every addition of the medium voltage distribution of 5 km.

3.2.2. Annual Profit after Tax Payment

Annual profit after tax payment was the amount of expected income that the power plant could make at the end of the year. Figure 7 shows the earned income relation of biomass-fire power plant with different time operations, rice straw costs, and the LCOE that sold to the largest customers.
At the LCOE of 0.128 USD/kWh, the 10 MW biomass-fired power plant could make the EAT 4.20 mln USD when invested with rice straw cost of 20 USD/t at 6000 h of operation time. The EAT dropped to 2.47 mln USD when the rice straw cost was raised to 50 USD/t. The EAT reached 5.87 and 3.56 mln USD at rice straw cost 20 USD/t and 50 USD/t, respectively, when the operating hours were increased to 8000 h per year. Adding rice straw cost 5 USD/t in each time operation 6000 h, 6500 h, 7000 h, 7500 h, and 8000 h and decreased the EAT by 0.29, 0.31, 0.34, 0.36, and 0.38 mln USD, respectively. Adjusting 500 h of time operation resulted the growth of EAT as shown in Table 10.
At the LCOE 0.134 USD/kWh, the lowest operation time, 6000 h, could make EAT 4.49 mln USD for rice straw cost 20 USD/t. Simultaneously, the EAT dropped to 2.77 mln USD when the rice straw was increased, at a cost 50 USD/t. Adjusting the time operation to 8000 h per year, the EAT grew to 6.25 mln USD and 3.95 mln USD for rice straw costs of 20 USD/t and 50 USD/t. Adding rice straw cost 5 USD/t in each time operation from 6000 h to 8000 h, and the EAT went down correspondently 0.29, 0.31, 0.34, 0.36, and 0.38 mln USD. Increasing 500 h of operation time could grow the EAT by 0.44, 0.42, 0.39, 0.37, 0.34, 0.32, and 0.30 mln USD corresponding to the level cost of rice straw at 20 USD/t, 25 USD/t, 30 USD/t, 35 USD/t, 40 USD/t, 45 USD/t, and 50 USD/t, respectively.
Stepping up the LCOE from 0.128 USD/kWh to 0.134 USD/kWh, or about 5%, boosted the EAT in each cost of rice straw by 2.88, 3.12, 3.36, 3.60, and 3.86 mln USD at the different time operations, 6000 h, 6500 h, 7000 h, 7500 h, and 8000 h.

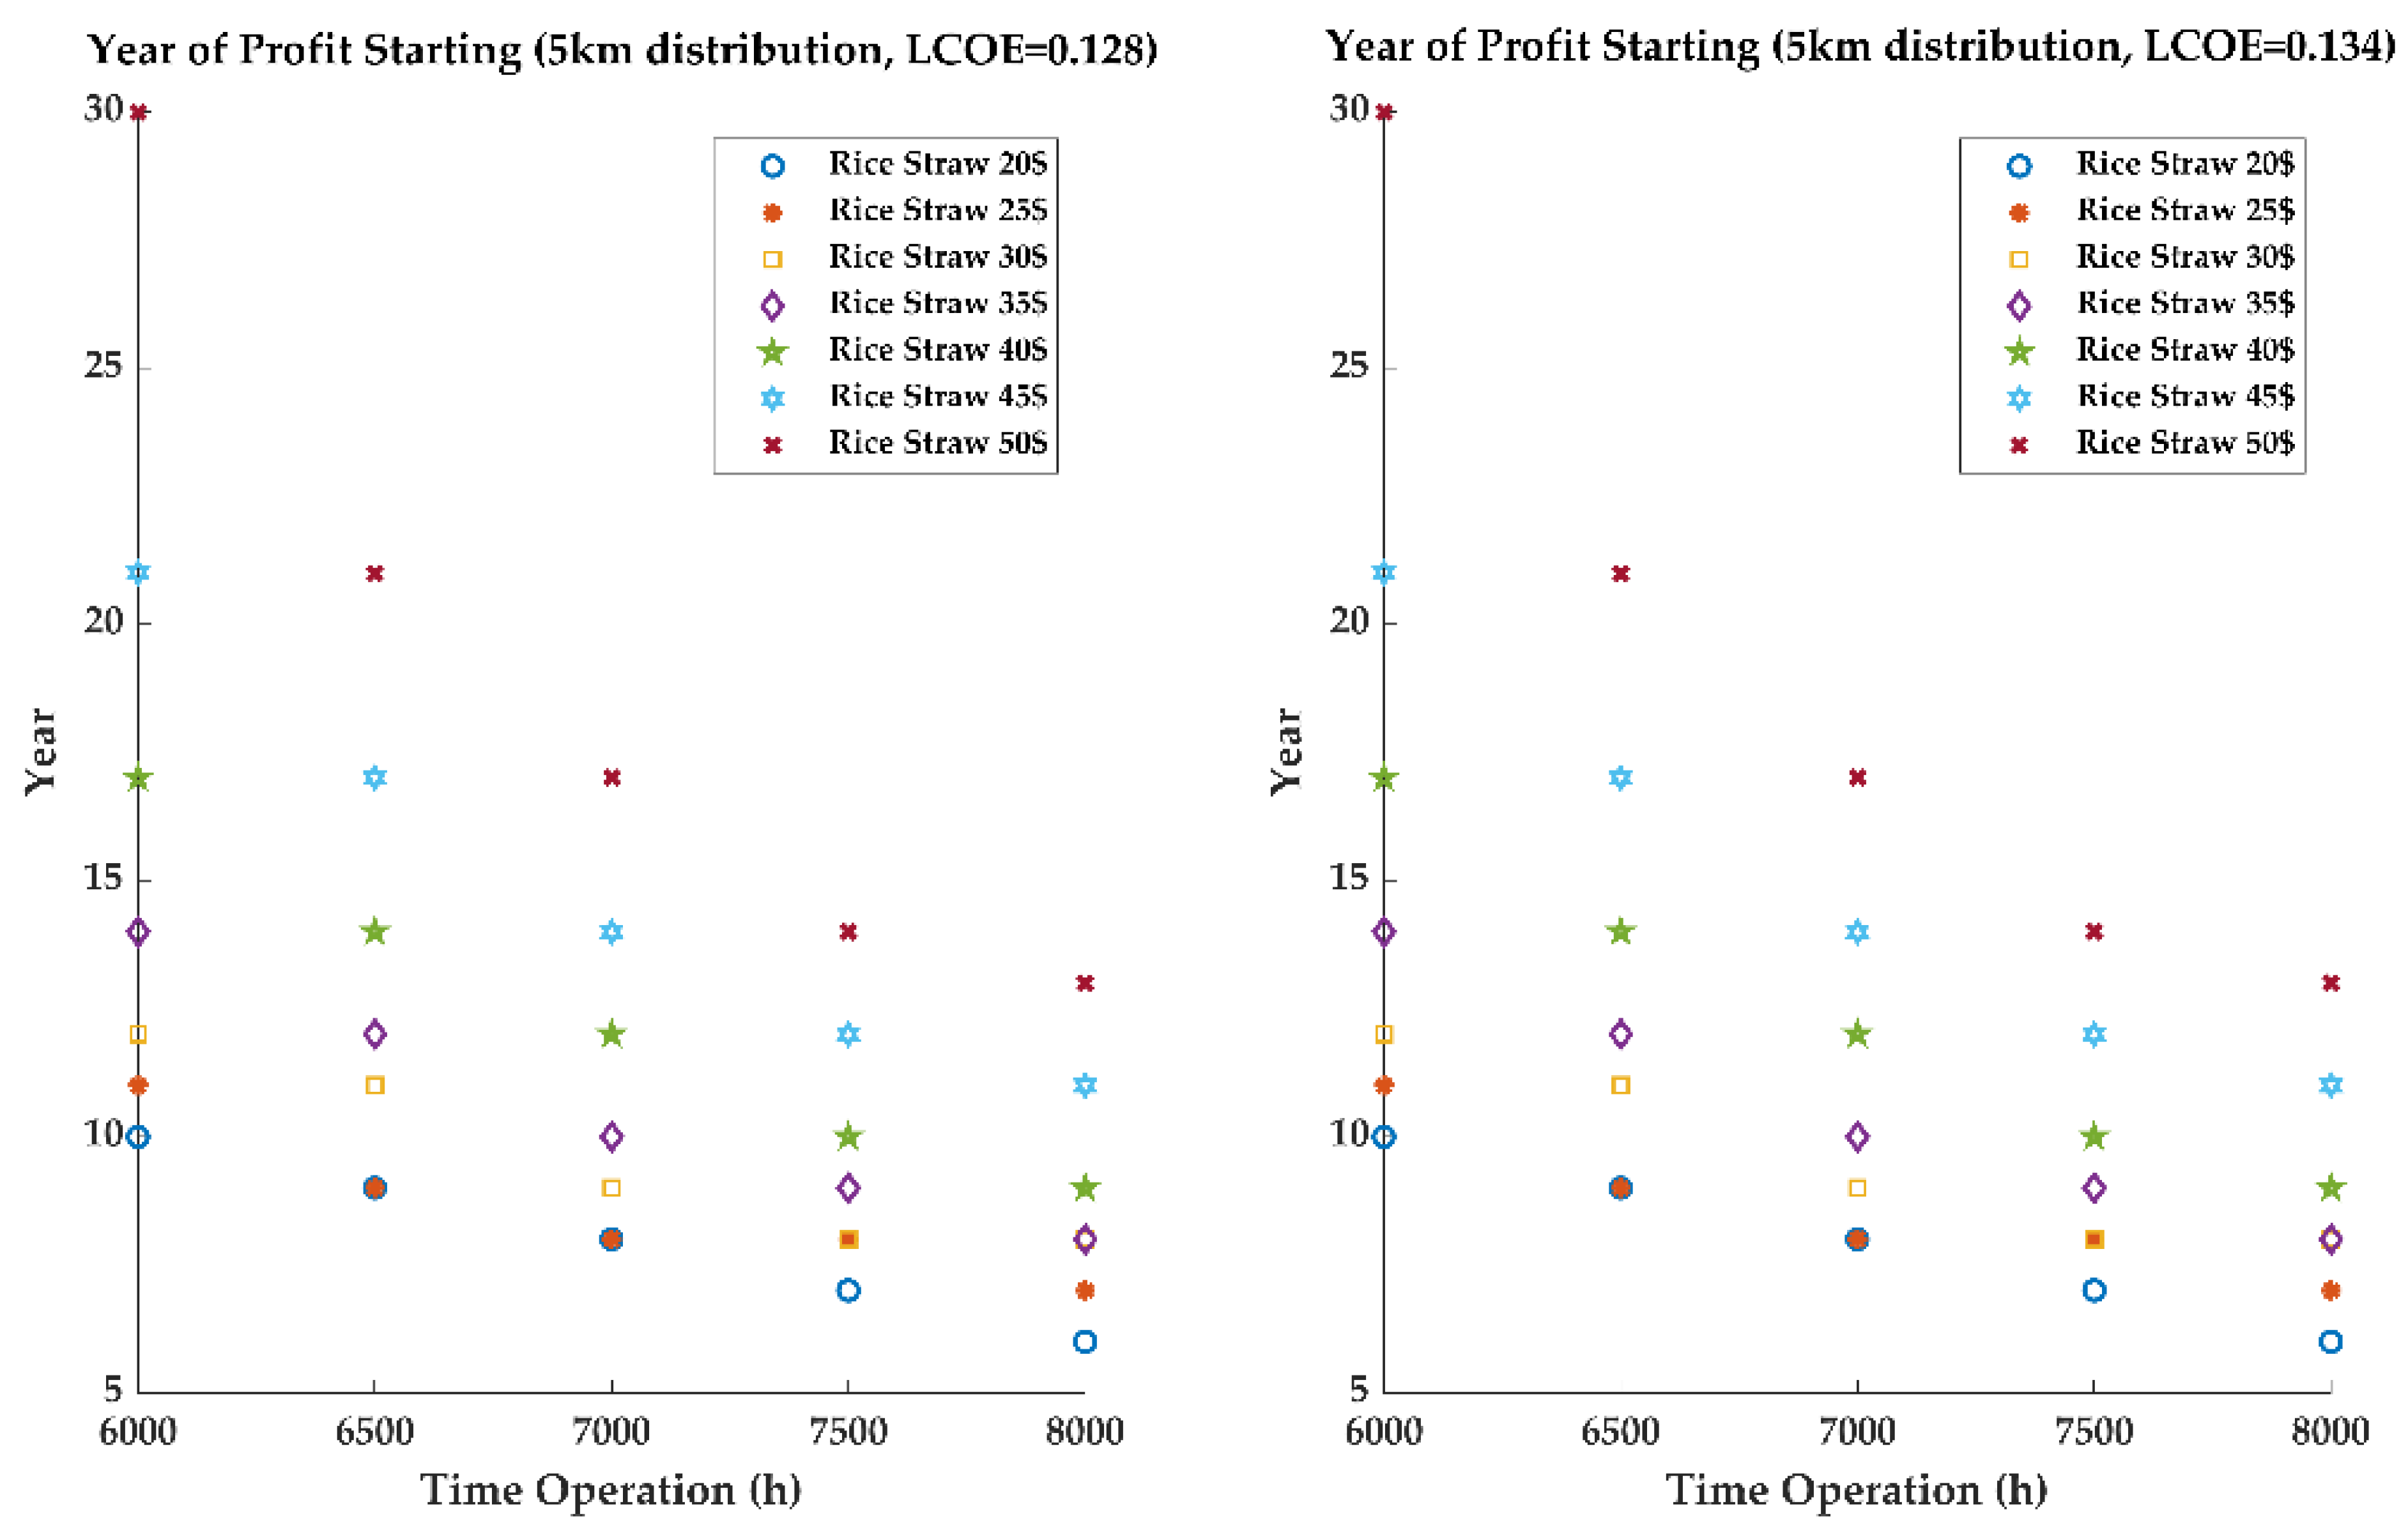
3.2.3. Year of Profit Starting

The starting point of years of profit generated by the biomass-fired power plant from rice straw is when the power plant can make profits greater than or equal to 10% of the initial investment or cash outflow. Figure 8 and Figure 9 represent the year that the power plant starts making profits with the different scenarios of LCOE 5% and 10% of the local biomass purchasing price. The length of medium voltage distribution is 5 km and 20 km. Within each scenario, the variation in rice straw cost is from 20 USD/t to 50 USD/t, and operation time varies from 6000–8000 h/annum present told the different years of profit starting.
The analysis of the 5 km distribution, which adjusted the LCOE from 0.128 USD/kWh to 0.134 USD/kWh, did not change the year of profit starting. At the low time operation, 6000 h, the year of profits started in the 10th year when invested with the rice straw cost of 20 USD/t. Concurrently, the year of profits was delayed to the 30th year when the rice straw cost was increased to 50 USD/t. The year profits started dropped rapidly in the 6th and 13th years, when the operation time rose to 8000 h corresponding to rice straw costs of 20 USD/t and 50 USD/t for LCOE 0.128 USD/kWh and 0.134 USD/kWh. Increasing the time operation is essential to reduce the year that profits begin.
At the analysis scenario of 20 km of distribution length, the year of profits started at the 10th year for a rice straw cost of 20 USD/t and at the 32nd year for a rice straw cost of 50 USD/t. Increasing the 15 km by 75% of the distribution length delayed two years of profits starting. When the time operation enlarged to 8000 h per year, the profit-starting year began at the 6th and 13th years with the rice straw costs of 20 USD/t and 50 USD/t. The year that profits started extended when the power plant operated at a low operation but fuel biomass cost was high. However, the year of profits starting remained the same as the analysis case with a 5 km distribution in the highest time operation even though the distribution length reached 20 km. The extension of distribution length resulted in adding more cash outflow amounts. It illustrated that if the power plant could not reduce the cash outflow, increasing the operation time could be an excellent solution to reduce the year of profits starting. The expectation of receiving profit in the 5th year in this analysis was unsuccessful within the conditions of time operation from 6000 h to 8000 h, rice straw fuel costs from 20 USD/t to 50 USD/t, the length of distribution up to 20 km, and LCOE being over 10% more than the local biomass purchasing price. Expanding the profit starting year to year 10 could match the rice straw costs to 20 USD/t, 25 USD/t, 30 USD/t, 35 USD/t, and 40 USD/t with the correspondent time operations from 6000 h to 8000 h, 6500 h to 8000 h, 7000 h to 8000 h, 7500 h to 8000 h, and 8000 h, respectively, in the lengths of 5 km and 20 km distribution.

3.3. Emission Avoidance of the Rice Straw Biomass versus Coal-Fired Power Plants and Open-Field Burning

The operation of a rice straw biomass-fired power plant with 10 MW capacity compared to coal-fired in a life cycle assessment (LCA) with the same time operation could reduce CO2 from 58.650 to 78.200 mln Kg, but it injected CO 0.184 to 0.245 mln kg, CH4 0.718 to 1.321 mln kg, and N2O 0.019 to 0.026 mln kg with the corresponding annual time operation of 6000 h–8000 h. The variations in avoided emissions that depended on the time operation is shown in Table 11. The estimation is that rice straw biomass application in the case study provinces, Prey Veng, Takeo, and Battambang, can avoid CO2 emissions as compared to coal power plants by 402, 360, and 302 mln kg/annum, respectively.
The 10 MW biomass-fired power plant from rice straw could lower CO2 from 59.145 to 78.860 mln kg and CO from 1.797 to 2.396 mln kg compared to open-field burning. However, it could release CH4 from 1.035 to 1.380 mln kg and N2O from 0.015 to 0.020 mln kg with the corresponding annual time operation from 6000 h to 8000 h as shown in Table 12. The application of rice straw biomass-fired compared to open-field burning in the case study regions, Prey Veng, Takeo, and Battambang, can reduce the emission of CO2 by 231, 207, and 173 mln kg, respectively, and CO by 6, 5, and 5 mln kg, respectively.

4. Discussion

Through analysis of three provinces, Prey Veng, Takeo, and Battambang, it was determined that each can be the potential location for the installation of small-scale biomass-fired power plants with rice straw. The estimated rice straw sources with 85% availability are 804,796 t/annum, 720,040 t/annum, and 603,273 t/annum, respectively. Within the analysis condition at the LCOE, the biomass-fired power plant sales to the grid are upwards of 5% and 10% of the maximum local biomass purchasing at 0.122 USD/kWh. This power plant cannot achieve the profit-earning statement for five years even though the rice straw’s cost reached 20 USD/t. The profit-earning statement’s failure occurs when rice straw’s price is greater than or equal to 45 USD/t at below ten recovery years, even when the operation reaches 8000 h per year during the lifetime project of 20 years. As reported in the study of a biomass-fired power plant from rice husks with 1 MW capacity in Cambodia [1], the project’s lifetime and restoration periods were 15 years and 9 years when LCOE was 0.12–0.16 USD/kWh. The investment recovery period of a wood biomass-fired power plant with 10 MW capacity was 5 years within a 20-year lifetime project in Sri Lanka [18]. The project sponsor provided a significant business fund when the local partners invested only 10–30%. At the same power plant in Malaysia, the payback period was 5.84 years without loan financing and 10.35 years in the case of 50% loan financing. The operation of the power plant in high efficiency was a cause to save fuel biomass [27]. The reduced biomass fuel amount in the process is a reason to decrease cash expended on purchasing biomass fuel. Based on the records from the previous studies, biomass-fired power plant operation could reach different regeneration periods because of the handled plant with specific conditions. To reduce this period for profits in their initial years, incomes and expenses must be increased and decreased, respectively, at the biomass-fired power plants. To enhance the incomes, effective operation of the power plant, rice straw fuel cost reduction, and enhancement of the time operation and LCOE are suggested. On the other hand, to shrink the expenses, the power plant needs to reduce the length of distribution connecting to the grid, providing funds instead of loading all investment financing from the bank. In this study, the method for economic analysis is discounted cash flow (DCF). Unlike the parallel analysis method, in which analyzers try to adjust the cost of expenses to avoid their increase, the DCF uses the discounted rate to avoid the inflation value of money that may occur in the future. Both methods focus on the same direction. The EAT, or income, decreases annually and cares about the sensitivity analysis concept.
In the three best potential provinces, the total electrical energy produced by rice straw biomass is approximately 1251 GWh/year, which equals 14.69% of domestic energy production and 31.38% of imported energy in 2020. In the present study, the application of 10 MW rice straw-fired power plants is estimated to avoid 1.06 mln t CO2/annum emissions compared to the same power generation at the coal-fired power plant. It also produces emission avoidance of 0.61 mln t CO2/annum and 0.02 mln t CO/annum compared to those from open-field burning. In terms of potential solutions, the energy generation from the grid energy mix may be a tool that can balance the emissions. However, a cost–benefit analysis should be carefully carried out in order to ensure national capacity, especially for a developing country such as Cambodia.

5. Conclusions

Findings from this study are essential for the 10 MW biomass-fired power plant planning in Cambodia. Our principal conclusions are presented, as follows:
(1)
In the operation of biomass plants with profitability occurring in earlier years, it is vital to aim at the factors that reduce the initial investment cost in the analysis. However, the crucial points are to maximize the income.
(2)
The two valuable points to boost the income are increasing the LCOE and the operation time. Therefore, before operating small-scale biomass-fired power plants, how much the LCOE can request from the customers within the zone of possible agreement should be studied in detail.
(3)
Enhancement of the time operation counts as the boosted factor. The amount of annual electricity customers require and the study of biomass feedstock to feed the power plant are critical points in the operation of the biomass-fired power plant.
(4)
In the current study, the estimation was just based on rice-grain production to find the potential rice straw residue, energy conversion, and emission avoidance. Nevertheless, the actual situation should focus on the rice straw’s density collection to make the biomass operation more practical.
(5)
The application of rice straw conversion to bioenergy provides electrical energy and emission avoidance. Moreover, worthless waste could be utilized by causing the improvement of villagers’ economies.

Supplementary Materials

The following supporting information can be downloaded at: https://www.mdpi.com/article/10.3390/en16020651/s1. Figure S1. Rice grain production of Cambodia by provinces from 2010–2019 (Data retrieved from the Ministry of Agriculture, Forestry and Fisheries, Cambodia). Table S1. Rice grain production (tons) in 2010–2019.

Author Contributions

Conceptualization, methodology, software, visualization, formal analysis, validation, data curation, writing—original draft preparation, S.S., Z.A., N.V.Q. and T.D.X.; writing—review and editing, supervision, N.V.Q. and T.D.X. All authors have read and agreed to the published version of the manuscript.

Funding

This research received no external funding.

Institutional Review Board Statement

Not applicable.

Informed Consent Statement

Not applicable.

Data Availability Statement

The data on rice grain was retrieved from the Ministry of Agriculture, Forestry and Fisheries, https://elibrary.maff.gov.kh/books/5af3a999a04a5, accessed on 9 October 2022. The unit costs of medium voltage distribution in 2020 are available from the authors upon request.

Acknowledgments

The authors thank the Project for Human Resource Development Scholarship (JDS) for providing a scholarship for S.S. We appreciate Electricity of Cambodia (EDC) for supplying necessary data for this study. We are grateful to Khusniddin Alikulov for his suggestions on preparing the manuscript.

Conflicts of Interest

The authors declare no conflict of interest.

References

  1. Survey on Rice Husk Power Generation Project in Cambodia (Small and Medium-Sized Enterprise Partnership Promotion Survey)—Final Report (Summary). Available online: https://openjicareport.jica.go.jp/pdf/12120077.pdf (accessed on 18 May 2020).
  2. Kosal, N. Rice Straw Management in Cambodia; Department of Agricultural Engineering, Ministry of Agriculture, Forestry and Fisheries: Phnom Penh, Cambodia, 2019. Available online: http://un-csam.org/sites/default/files/2020-11/RiceStrawManagementinCambodia_Mr.NginKosal.pdf (accessed on 20 June 2020).
  3. Brigagão, G.V.; de Queiroz Fernandes Araújo, O.; de Medeiros, J.L.; Mikulcic, H.; Duic, N. A techno-economic analysis of thermochemical pathways for corncob-to-energy: Fast pyrolysis to bio-oil, gasification to methanol and combustion to electricity. Fuel Process. Technol. 2019, 193, 102–113. [Google Scholar] [CrossRef]
  4. Wei, J.; Wang, M.; Xu, D.; Shi, L.; Li, B.; Bai, Y.; Yu, G.; Bao, W.; Xu, J.; Zhang, H.; et al. Migration and transformation of alkali/alkaline earth metal species during biomass and coal co-gasification: A review. Fuel Process. Technol. 2022, 235, 107376. [Google Scholar] [CrossRef]
  5. Wang, M.; Wan, Y.; Guo, Q.; Bai, Y.; Yu, G.; Liu, Y.; Zhang, H.; Zhang, S.; Wei, J. Brief review on petroleum coke and biomass/coal co-gasification: Syngas production, reactivity characteristics, and synergy behavior. Fuel 2021, 304, 121517. [Google Scholar] [CrossRef]
  6. Khoshgoftar Manesh, M.H.; Jadidi, E. Conventional and advanced exergy, exergoeconomic and exergoenvironmental analysis of a biomass integrated gasification combined cycle plant. In Energy Sources, Part A: Recovery, Utilization, and Environmental Effects; Taylor and Francis Ltd.: London, UK, 2020; pp. 1–22. [Google Scholar]
  7. Wei, X.; Manovic, V.; Hanak, D.P. Techno-economic assessment of coal- or biomass-fired oxy-combustion power plants with supercritical carbon dioxide cycle. Energy Convers. Manag. 2020, 221, 113143. [Google Scholar] [CrossRef]
  8. Mehrpooya, M.; Moftakhari Sharifzadeh, M.M.; Rajabi, M.; Aghbashlo, M.; Tabatabai, M.; Hosseinpour, S.; Ramakrishna, S. Design of an integrated process for simultaneous chemical looping hydrogen production and electricity generation with CO2 capture. Int. J. Hydrogen Energy 2017, 42, 8486–8496. [Google Scholar] [CrossRef]
  9. Yang, B.; Wei, Y.-M.; Liu, L.-C.; Hou, Y.-B.; Zhang, K.; Yang, L.; Feng, Y. Life cycle cost assessment of biomass co-firing power plants with CO2 capture and storage considering multiple incentives. Energy Econ. 2021, 96, 105173. [Google Scholar] [CrossRef]
  10. Mehrpooya, M.; Khalili, M.; Sharifzadeh, M.M.M. Model development and energy and exergy analysis of the biomass gasification process (Based on the various biomass sources). Renew. Sustain. Energy Rev. 2018, 91, 869–887. [Google Scholar] [CrossRef]
  11. Garba, N.A.; Zangina, U. Rice straw & husk as potential sources for mini-grid rural electricity in Nigeria. Int. J. Appl. Sci. Eng. Res. 2015, 4, 523–530. [Google Scholar]
  12. Gadde, B.; Menke, C.; Wassmann, R. Rice straw as a renewable energy source in India, Thailand, and the Philippines: Overall potential and limitations for energy contribution and greenhouse gas mitigation. Biomass Bioenergy 2009, 33, 1532–1546. [Google Scholar] [CrossRef]
  13. Gadde, B.; Bonnet, S.; Menke, C.; Garivait, S. Air pollutant emissions from rice straw open field burning in India, Thailand and the Philippines. Environ. Pollut. 2009, 157, 1554–1558. [Google Scholar] [CrossRef] [PubMed]
  14. Global Energy & CO2 Status Report 2019—Emissions. Available online: https://www.iea.org/reports/global-energy-co2-status-report-2019/emissions (accessed on 12 June 2020).
  15. Agbor, E.; Zhang, X.; Kumar, A. A review of biomass co-firing in North America. Renew. Sustain. Energy Rev. 2014, 40, 930–943. [Google Scholar] [CrossRef]
  16. Baxter, L. Biomass-coal co-combustion: Opportunity for affordable renewable energy. Fuel 2005, 84, 1295–1302. [Google Scholar] [CrossRef] [Green Version]
  17. ADB Concept Paper—Proposed Loans Kingdom of Cambodia: Energy Efficiency Sector Development Program. Available online: https://www.adb.org/sites/default/files/project-documents/54430/54430-001-cp-en.pdf (accessed on 22 November 2021).
  18. MOEJ/GEC JCM Feasibility Study (FS) 2014—Summary of Final Report “10 MW-Scale Biomass Base Power Generation”. Available online: http://gec.jp/jcm/en/wp-content/uploads/2017/05/2014FS215_12_sum.pdf (accessed on 23 December 2021).
  19. Delivand, M.K.; Barz, M.; Gheewala, S.H. Logistics cost analysis of rice straw for biomass power generation in Thailand. Energy 2011, 36, 1435–1441. [Google Scholar] [CrossRef]
  20. Delivand, M.K.; Barz, M.; Gheewala, S.H.; Sajjakulnukit, B. Economic feasibility assessment of rice straw utilization for electricity generating through combustion in Thailand. Appl. Energy 2011, 88, 3651–3658. [Google Scholar] [CrossRef]
  21. Ramamurthi, P.V.; Fernandes, M.C.; Nielsen, P.S.; Nunes, C.P. Utilisation of rice residues for decentralised electricity generation in Ghana: An economic analysis. Energy 2016, 111, 620–629. [Google Scholar] [CrossRef] [Green Version]
  22. IRENA. Renewable Power Generation Costs in 2019; International Renewable Energy Agency: Abu Dhabi, United Arab Emirates, 2020; pp. 111–119. [Google Scholar]
  23. Income Tax 2020. Available online: https://www.tax.gov.kh/km/content-detail/XeALY78520499 (accessed on 11 December 2021).
  24. Gurau, M.A. The use of profitability index in economic evaluation of industrial investment projects. Proc. Manuf. Syst. 2012, 7, 55–58. [Google Scholar]
  25. National Bank of Cambodia—Annual Supervision Report 2019. Available online: https://www.nbc.org.kh/download_files/supervision/sup_an_rep_eng/Annual_Report_2019_English_Final.pdf (accessed on 6 October 2021).
  26. Singh, J.; Panesar, B.; Sharma, S. Energy potential through agricultural biomass using geographical information system—A case study of Punjab. Biomass Bioenergy 2007, 32, 301–307. [Google Scholar] [CrossRef]
  27. Malek, A.B.M.A.; Hasanuzzaman, M.; Rahim, N.A.; Al Turki, Y.A. Techno-economic analysis and environmental impact assessment of a 10 MW biomass-based power plant in Malaysia. J. Clean. Prod. 2017, 141, 502–513. [Google Scholar] [CrossRef]
  28. Shafie, S.M.; Masjuki, H.H.; Mahlia, T.M.I. Life cycle assessment of rice straw-based power generation in Malaysia. Energy 2014, 70, 401–410. [Google Scholar] [CrossRef]
Figure 1. Block diagram of business model.
Energies 16 00651 g001
Figure 2. Block diagram of power flow model.
Energies 16 00651 g002
Figure 3. Algorithm for the calculation of the profitability index.
Energies 16 00651 g003
Figure 4. Annual rice straw estimation in 25 provinces of Cambodia.
Energies 16 00651 g004
Figure 5. The level of rice straw among provinces in Cambodia.
Energies 16 00651 g005
Figure 6. The relation of cash outflow and distribution length.
Energies 16 00651 g006
Figure 7. The annual earnings after tax payment.
Energies 16 00651 g007
Figure 8. Year of profit starting at 5 km of medium voltage distribution length.
Energies 16 00651 g008
Figure 9. Year of profit starting at 20 km of medium voltage distribution length.
Energies 16 00651 g009
Table 1. Purchasing cost of electricity in Cambodia in 2020.
Power PlantsSolar-BasedCoal-FiredBiomass-FiredHydroFuel Oil-Fired
Maximum cost
USD/kWh
0.0900.0910.1220.0840.158
Minimum cost
USD/kWh
0.0810.0760.0950.0620.132
Table 2. The specifications of generator [18].
DescriptionUnitQuantity
Generator CapacitykW11,500.00
Inlet Steam Pressureata67.00
Inlet Steam Temperature°C485.00
Inlet Enthalpykcal/kg807.70
Inlet Steam Flow Ratet/h51.60
Amount of Steam Consumptionkg/kWh4.49
Efficiency%23.80
Operation Rate%80.00
Table 3. The LCOE of trading and purchasing of electricity in Cambodia.
Tariff on Levelized Cost of Electricity in Cambodia (USD/kWh)
TradingDomestic PurchasingInternational Purchasing
MV Customers0.110–0.150
LV Customers0.093–0.178
Biomass Plant 0.095–0.122
Fuel Oil Plant 0.132–0.158
Thailand, Vietnam, and Laos 0.081–0.129
Source: The data of trading and purchasing electricity in Cambodia is retrieved from Electricity of Cambodia (EDC).
Table 4. The unit cost of medium voltage distribution in one kilometer.
Equipment (I)
NameUnitQuantityPrice/Unit (USD)Total Price (USD)
Concrete Pole MV-12 m, 3 kNPole11156.401720.40
Concrete Pole MV-12 m, 9 kNPole2327.21654.42
Crossarm 2.20 mSet1537.37560.55
Pin Insulator and Fitting, 24 kVSet3310.98362.34
Preformed Tie for Pin Insulator
with Cable 150 mm2
Pcs331.9965.67
String Insulator and Fitting, 24 kVSet613.9383.58
Preformed Tie for String
Insulator with Cable 150 mm2
Pcs69.7958.74
Partially Insulated Cable
Al- 1 × 150 mm2, 24 kV
m30001.654950
Total (I) 8455.70
Vat (10%) 845.57
Total (I’) = Total (I) + VAT (10%) 9301.27
Labor (II)
Install Concrete Pole MV-12 m, 3 kNPole1160660
Install Concrete Pole MV-12 m, 9 kNPole270140
Install Crossarm and InsulatorSet15575
Install Partially Insulated
Cable Al- 1 × 150 mm2
m30000.802400
Total (II) 3275
VAT (10%) 327.50
Total (II’) = Total (II) + VAT (10%) 3602.50
Grand Total = Total (I’ + II’) 12,903.77
Span = 80 m, not including transformer cost.
Table 5. Corresponding parameters from previous studies.
Time
Operation
(h/year)
Rice Straw’s Cost
(USD/t)
Initial Cost
(USD)
Low Heat Value
(MJ/kg)
Discount Rate
(%)
Project Lifetime
(Year)
References
---15.03--[26]
---14--[12]
657020–23--920[20]
≥7008-20,833,333 *--20[18]
650039–47--1120[21]
-----21[27]
-, no value is detected, *, not include distribution cost.
Table 6. Parameters for analyzing.
Analysis ParametersPlant
Efficiency
(%)
Time
Operation
(h)
Rice Straw’s Cost
(USD/t)
Unit
Installation Cost
(USD/kW)
Unit
Distribution Cost
(USD/km)
Low Heat Value
(MJ/kg)
Discount Rate
(%)
Levelized Cost of
Electricity
(USD/kWh)
Value23.86000–800020–5021411290414.5158.800 0.128; 0.134
Table 7. Emission avoidance factor between coal and rice straw in producing 1 kWh [19].
Emission Avoidance Factor for 1 kWh Electricity Generated (kg/kWh)
Emission ComponentsCO2COCH4N2O
Coal Power1.2102.130 × 10−41.640 × 10−32.020 × 10−8
Rice Straw0.3602.880 × 10−31.600 × 10−22.860 × 10−4
Avoidance Factor0.850−2.667 × 10⁻³−14.360 × 10⁻³−2.859 × 10⁻⁴
Table 8. Emission released from rice straw open field burning [6].
Rice Straw Emission Factor of Open-Field Burning (kg/t)
EmissionCO2COCH4N2O
Unit146034.701.200.07
Table 9. Rice straw resources and electricity generation in case study area.
ParametersPrey VengTakeoBattambang
Rice Straw Resources (ton/annum)804,796720,040603,273
Rice Straw Open Field Burning (ton/annum)241,439216,012180,982
Scale of Rice Straw at Time Operation 6000 h (time)11108
Scale of Rice Straw at Time Operation 6500 h (time)1098
Scale of Rice Straw at Time Operation 7000 h (time)1097
Scale of Rice Straw at Time Operation 7500 h (time)987
Scale of Rice Straw at Time Operation 8000 h (time)886
Potential of Electricity Generation (GWh/annum)473423355
Table 10. The growth of EAT when adjusting 500 h of time operation.
Time Operation Adjustment (h)Rice Straw Cost (USD/t)EAT Growth (mln USD)
500200.42
500250.39
500300.37
500350.35
500400.32
500450.30
500500.27
Table 11. Emission avoidance between coal- and rice straw-fired power plants.
ElementsTime Operation (h)
60006500700075008000
CO258.65063.53768.42573.31278.200
CO−0.184−0.199−0.214−0.230−0.245
CH4−0.718−1.073−1.155−1.238−1.321
N2O−0.019−0.021−0.023−0.024−0.026
Quantity of emission avoidance elements (×106 kg).
Table 12. Emission avoidance between open-field burning and rice straw-fired power plants.
ElementsTime operation (h)
60006500700075008000
CO259.14564.07369.00273.93178.860
CO1.7971.9472.0962.2462.396
CH4−1.035−1.121−1.207−0.293−1.380
N2O−0.015−0.017−0.018−0.019−0.020
Quantity of emission-saving elements (×106 kg).
Disclaimer/Publisher’s Note: The statements, opinions and data contained in all publications are solely those of the individual author(s) and contributor(s) and not of MDPI and/or the editor(s). MDPI and/or the editor(s) disclaim responsibility for any injury to people or property resulting from any ideas, methods, instructions or products referred to in the content.

