Abstract
Low-salinity surfactant nanofluids have recently shown promising results in the wettability alteration of reservoir rocks from oil-wet state towards more water-wet state. However, the investigation of pore-level interactions of nanofluids injection in real oil carbonate rocks at reservoir conditions, which determines the overall fluid dynamics, is lacking. Therefore, in this work, we studied the effect of nanoparticles augmented low-salinity surfactant flooding on the wettability alteration of hydrophobic carbonate rocks with harsh reservoir conditions via X-ray micro-tomography. The designed experiment scheme involved core flooding with an X-ray transparent core-holder developed for studying the flow properties of fluids at the micro level (pore scale). The wettability was quantified by measuring the differences in contact angles after the injection of low salinity, low-salinity surfactant, and low-salinity surfactant nanofluid. The findings illustrate that surfactant flooding with silica nanoparticles had a more pronounced influence on the contact angle among other injected fluids. The contact angle of the rock fell from 144° to 49°, corresponding to the water-wet conditions of carbonate rocks. The results show that the addition of a low concentration (0.005 wt.%) of SiO2 nanoparticles was enough for wettability changes in oil carbonate rocks. This study illustrates that a combination of surfactant, low-salinity, and nanoparticle features has a more pronounced effect on the three-phase contact angle than if applied separately.
1. Introduction
Carbonate reservoirs, where many of the world’s largest oil fields have been discovered, are known to contain 50–60% of the world’s oil reserves and 40% of the overall gas reserves [1,2]. Generally, carbonate reservoirs can be characterized as intermediate and oil-wet formations with heterogeneous permeability and porosity [3,4]. As such, carbonate reservoirs require the application of more complex methods for oil production in comparison to sandstone reservoirs [5,6,7,8].
It is known that, unlike sandstones, more than half of the world’s carbonate reserves exhibit hydrophobic wetting properties (oil-wet), resulting in low oil recovery by conventional waterflooding [9,10]. Therefore, wettability alteration to water-wet state is more critical for carbonate surfaces, as it controls fluid distributions in the porous media, which ultimately influence the multiphase flow and oil recovery factor. Indeed, many studies revealed that an increase in the oil recovery factor in carbonates (limestones or dolomites) mainly stems from an wettability alteration in the rocks to less oil-wet states [11,12]. It has been explained in terms of capillary forces reduction that facilitates free and easy oil movement through the pore throats towards a production well.
Interestingly, carbonate minerals (e.g., calcite) show hydrophilic wetting preferences (water-wet) before contact with hydrocarbons. However, when carbonate rocks come into contact with oil, their wettability can be altered from water-wet to more oil-wet due to the adsorption of some oil components [13,14,15]. This fact makes the development of carbonate reservoirs challenging by traditional approaches and requires the application of more advanced technologies, such as enhanced oil recovery (EOR) methods.
As carbonate formations aroused interest, the need for greater research and developments in relation to advanced production methods has increased. Enhanced oil recovery is becoming a promising strategy in global oil recovery, as production from matured reservoirs gradually declines and new hydrocarbon discoveries are insufficient to fulfill rising energy demands. Advantages of EOR application include an increase in oil production and field life extension. There are several different EOR methods with the most promising one—chemical flooding. A broad range of different chemicals are engaged in chemical EOR such as surfactants, polymers, alkalis, ionically modified water, and nanoparticles, or a mixture thereof [16,17,18,19,20].
Due to the surfactants’ ability to lower water–oil interfacial tension (IFT), alter wettability towards water-wet states, and change the rheological properties of injected fluid, they are the most often used chemicals in flooding [19,21]. However, owing to the high surfactant adsorption during flooding, its application in carbonate oil fields is technologically and economically limited [19]. Such adsorption and surfactant loss are influenced by several factors, including electrostatic attraction, covalent or hydrogen bonding, non-polar interaction between adsorbed parts, etc. [21]. Therefore, there is a need to develop a technology that, when applied together with surfactant injection, can not only reduce unfavorable adsorption and the loss of carbonate rocks, but can also be economically feasible.
Recently, it was shown that the addition of nanoparticles (NPs) to surfactant solutions can significantly improve surfactant flooding, with benefits such as the prevention of surfactant adsorption, wettability alteration, and IFT reduction [17,22,23]. Indeed, it was reported that the addition of non-metallic nanoparticles, such as CaCO3 and SiO2, to a surfactant solution further lowers the IFT between oil and brine and also changes the wettability of calcite from hydrophobic to hydrophilic [24]. The same results were also obtained with other mixtures of nanoparticles and surfactants [25,26], illustrating their great potential in surfactant EOR. Furthermore, authors [27] reported that adding silica NPs to the amino-acid surfactants improved the oil recovery factor more than surfactant flooding by 13.1%. Such an increase was attributed to a significant effect of NPs on IFT reduction and wettability alteration in comparison with just surfactant solutions. Although there are promising results reported for nanofluids, they are yet to advance to turn into injection fluids for EOR.
In recent years, low-salinity water (LSW) injection has been regarded as a potential strategy for carbonates as it has an ion composition that promotes the improvement of oil recovery. The general idea of LSW flooding is to alter the hydrophobic wetting properties of carbonate rocks by an ion-exchanging mechanism, which in turn enhances oil recovery [28,29,30]. The ion composition of LSW depends on the rock type and reservoir brine, and thus should be selected in accordance with particular reservoir properties.
Although many studies have been published on the influence of NPs on surfactant properties [17,22,23,24,25,26,27], there is a lack of systematic research conducted with real core samples that can realistically mimic fluid–fluid and fluid–rock interactions in the formation. Furthermore, researchers have mostly studied the effect of nanofluids with LSW on the wetting properties of sandstone pore surfaces, leaving an effect on the wettability of poorly investigated carbonates [31,32]. As such, in this study, we investigated the effect of surfactant nanofluids with LSW by high-resolution X-ray tomography coupled with the core-flooding technique. We aimed to achieve a positive synergism by combining the properties of surfactant and silica nanoparticles in low-salinity water for an effective application in oil-saturated carbonate reservoirs. In this work, we studied the effect of nanoparticles that augmented low-salinity surfactant flooding on wettability alterations in hydrophobic carbonate rocks with harsh reservoir conditions (T = 70 °C, total salinity = 201 g/L) via X-ray micro-tomography (μCT). The designed experiment scheme involved core flooding with an X-ray transparent core holder developed for studying the flow properties of fluids on the pore scale. μCT is a non-destructive imaging technique that helps to visualize fluid distributions and analyze fluid–rock interactions at a scale of a few microns (3–5 µm) and could provide a possible explanation of oil recovery when using nanofluids.
This work highlights the role and effect of LSW, surfactant with LSW, and surfactant nanofluids with LSW on three-phase contact angles of carbonate pore surfaces with the empathies for EOR. We developed a design suitable for the μCT core-flood study of consequential chemical flooding in order to investigate the saturation distribution and further analysis of associated effects.
2. Materials and Methods
2.1. Oil Preparation
The oil samples were taken from a Western Siberia oil field. All experiments were carried out with the isoviscous model that was prepared by adding 33% toluene to the initial oil. Further, oil was deasphalted with nitrogen at 25 MPa and 60 °C in order to make oil more colloidally stable. Isoviscous oil before and after deasphalting was also studied via SARA analysis (Table 1). The results on the composition of hydrocarbons, including saturated and aromatic hydrocarbons, resins, and asphaltenes (SARA components), showed that around 3.5% of asphaltenes were removed from the oil, illustrating the good colloidal stability of oil (Table 1).

Table 1.
SARA components of oil before and after deasphalting with N2.
Then, 5% iodooctane was added to isoviscous oil to improve the contrast between phases (oil and injected fluids), and thus to enhance the sensitivity of the X-ray micro-tomograph’s point detector.
2.2. Rock Preparation
The carbonate rock samples were taken from the oil-saturated zone of an oil carbonate reservoir (the same oil field as the oil samples). All of the cores consisted of 99.8% of calcite with small impurities of magnetite and quartz.
In order to achieve a resolution of 3–5 µm in X-ray micro-tomography studies and to analyze pore-scale fluid flow, the cores were cut into cylinder shapes with a length of 1.60 cm and a diameter of 0.79 cm.
2.3. Preparation of Surfactants and Nanoparticle Dispersions
For the preparation of the nano-surfactant formulations, three ionic surfactants were used: cetyltrimethylammonium bromide (CTAB, 99 wt.%, Sigma-Aldrich, Gillingham, UK, solid form, 364.45 g/mol), sodium dodecyl sulfate (SDS, 99 wt.%, Sigma-Aldrich, UK, solid form, 288.38 g/mol), and alpha-olefin sulfonate (AOS, 39.4 wt.% BIO-TERGE AS-40 KSB, Stepan, Northbrook, IL, USA).
Silica nanoparticles (SiNPs) were used in dispersion form with an active silicon dioxide content (SiO2) of 30.4 wt.% (LLC Khimuniverse, Russia). The average particle size was less than 50 nm.
Nano-surfactant dispersions were prepared by adding desired concentrations of nanoparticles to the surfactant solutions and mixing them on a magnetic stirrer until dispersions become homogeneous. Note that ultrasonication is recommended for NPs and to prepare surfactant dispersions [18,25]. However, in this study, a magnetic stirrer was utilized given that nanoparticles are not in powder form, but rather are in dispersion form.
The stability of dispersions was checked visually after preparation, after 7 days, and after 14 days in the oven at a reservoir temperature of 70 °C.
Low-salinity water and reservoir brine water content are shown in Table 2. The salts in LSW duplicate the salts in the reservoir brine with a concentration difference that is only 15 times smaller.
Table 2.
The composition and IFT of LSW and reservoir brine.
2.4. Interfacial Tension (IFT) Measurements
A KRÜSS spinning drop tensiometer was applied for IFT measurements between aqueous and oil phases. The experiments were carried out at a reservoir temperature (70 °C) with isoviscous oil (see preparation section). Once the temperature was set, the chamber was allowed to achieve the desired temperature before the tests were started. Solutions were assumed to be equilibrated when the measured IFT values remained unchanged (±5%) for 30 min. KRÜSS advance software was used to calculate the IFT values by Vonnegut or Laplace equations depending on the droplet shape. The densities of tested dispersions for IFT calculations were measured by a densitometer (Anton Paar DMA 4200 M) at 70 °C.
The concentrations of surfactants tested in this study were: 0.0001 wt.%, 0.001 wt.%, 0.01 wt.%, 0.02 wt.%, 0.03 wt.%, 0.04 wt.%, 0.06 wt.%, 0.08 wt.%, 0.1 wt.%, 0.2 wt.%, and 0.4 wt.%. The concentrations of silica nanoparticles tested in this study were: 0.005 wt.%, 0.01 wt.%, 0.025 wt.%, 0.05 wt.%, and 0.1 wt.%.
The IFT value was calculated as a mean value of at least three measurements and the standard deviation was also determined.
To avoid the influence of impurities on the results, before and after each experiment, the tube was cleaned with toluene and water and then dried with air.
2.5. Core-Flooding Experiments
In order to achieve representative measurements, the wettability of rock samples should be mimicked to the true reservoir conditions [13,32]. Therefore, in this study, the wettability was rendered to oil-wet by immersing the sample into an isoviscous oil model at 70 °C and subsequently aging it for two weeks. Afterwards, the sample was washed with toluene to remove excess oil and dried for 24 h at 70 °C.
A core-flooding unit was used to pump fluids through the core holder, and to record the pressure drop for μCT experiments. Studies were carried out using a core holder (Figure 1), three high-pressure pumps, a differential pressure sensor, L-series fine-adjustment valves, and a computer control, together with the necessary signal converters. Fluid supply through the core holder was carried out by using pumps with an accurate fluid flow rate. To maintain pore pressure, a reverse pressure regulator (BPR) was used. To collect the volume of liquid fluids at the outlet, Duran 200 dm3 collecting tanks were used.
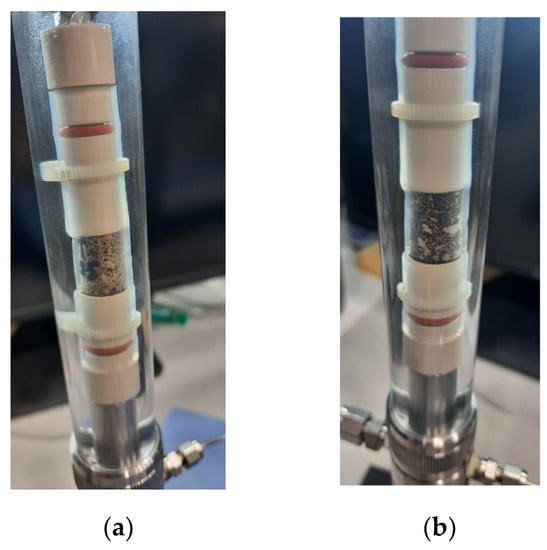
Figure 1.
Images of coreholder before oil (a) and after oil (b) saturation.
Importantly, Figure 1 also shows that no bypass of fluids occurred during the saturation process.
The tests were conducted as follows:
- First, 70 mL of dehydrated toluene was pumped through the core in order to ease the flow of isoviscous oil and to remove air bubbles.
- Then, the sample was consequently flooded with isoviscous oil and reservoir brine to achieve the residual oil and water saturation. The injection rates were 0.1 mL/min, 0.2 mL/min, 0.3 mL/min, and 0.6 mL/min. Permeability was calculated as 140 mD and 15 mD for oil and water, respectively.
- Afterwards, the core sample was consequently flooded with LSW, surfactant with LSW, and surfactant nanofluid with LSW. It is noteworthy that the injection rates were the same for both oil and water. The permeability rates were as follows: 14 mD, 16 mD, and 17 mD. After each step of flooding, X-ray μCT images were taken and wettability changes were analyzed. The concentrations of used surfactant and nanoparticles were chosen according to the screening tests.
2.6. X-ray Micro-Tomography Experiments
A tomography system GE Phoenix v|tome|x L 240 was used to obtain a 3D sample model of the distribution of fluids. Scans were completed using a nanofocus X-ray tube with a voltage of 100 kV, a current of 199 mkA, and a signal accumulation of 500 ms, which gave the resolution of 5 μm per voxel. During μCT scanning, a special X-ray transparent core holder, used during the whole experiment, was kept under a static confining pressure of 2.5 MPa and a pore pressure of 2 MPa.
Reconstructed 3D models were processed using Thermo Fisher’s Pergeos software. Images for wettability measurements were chosen by comparing dry scans with geometrically aligned scans from each experiment stage. In order to study the process of wettability alteration by different chemicals, the same slices (places) in the middle of the sample were used after the core-flooding tests. Figure 2 illustrates the used slices in XY and ZX planes.
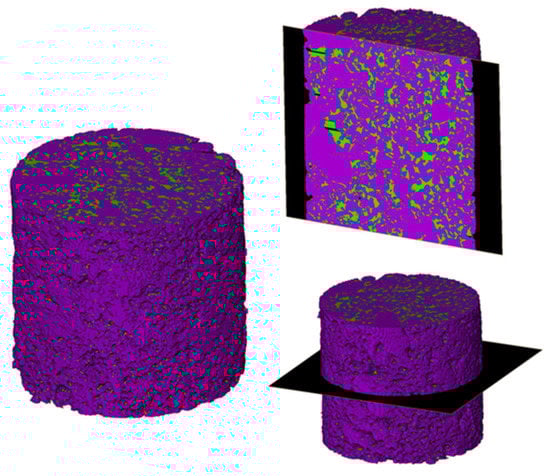
Figure 2.
Illustration of slices used for wettability studies among XY and ZX planes. Colors represent: green—oil and purple—rock.
2.7. Wettability Measurements
Wettability was accessed by calculating a contact angle between water–oil–rock phases. The contact angles (θ) were calculated using the height (h) and radius (r) of the droplet profiles following the procedure in [13]. The droplet profiles can be approximated in the circle form given that its size is small. Therefore, the following procedure was used to calculate the contact angle value on the microscale (µm):
- The droplet profiles were extracted from the µCT images using the open-source image processing software ImageJ.
- In order to make the contact line with a sharp appearance, the extracted droplet profiles were rotated to a horizontal position (normal) in the image coordinates (pixels) (Figure 3, for example).
 Figure 3. μCT images of the sample after LSW (top) and surfactant nanofluids with LSW (bottom), illustrating different three-phase contact angles and wetting behaviors (red squares).
 - The length in pixels was then converted into the length dimension (µm) using ImageJ software.
- Once optimal orientation and length conversion were determined, the radius (r) and height (h) of the droplets were obtained by measuring the length of the corresponding edges of droplets using ImageJ software.
- Once the geometric parameters (h, r) were determined, the contact angles (θ) were calculated using the equations:
Please note that contact angles were calculated from two sides of the droplets, given the slight variations in left and right radii.
When the droplet could not be formed in the porous structure, the contact angle was estimated by a menisci form. An example is shown in Figure 3. As shown in Figure 3 (top), the porous media surface was mainly oil-wet, as the water droplets displayed a spherical form with an average contact angle of 147°. Whereas, Figure 3 (bottom) illustrates an example of water-wet surfaces after flooding with surfactant nanofluids with LSW with an average angle of 53°.
The wetting properties were defined by the contact angle value. The surface was considered to be hydrophobic if θ > 90° and hydrophilic if θ < 90°.
3. Results and Discussion
3.1. Effect of Nanoparticles and Different Surfactants on the IFT of Water–Oil System
The IFT reduction between oil and brine is one of the main mechanisms of surfactant flooding. Low IFT values help to improve oil recovery due to the increased capillary number. Therefore, it is important to study the ability of surfactants to reduce IFT at harsh reservoir conditions and to choose an optimal concentration, at which the minimum IFT can be achieved.
Therefore, before testing the effect of nanoparticles on the surfactants’ ability to reduce IFT, it is important to find the optimal surfactant concentration. For this purpose, the influence of surfactants (CTAB, SDS, and AOS) with different concentrations on oil–brine IFT was studied. The dependence of interfacial tension values of aqueous surfactant solutions on surfactant concentrations is shown in Figure 4. The concentration at which surfactants have minimum IFT values is known as the critical micelle concentration (CMC). The graphs show that the CMC values were 0.01 wt.% for CTAB, 0.1 wt.% for SDS, and 0.06 wt.% for AOS. The corresponding interfacial tension values at these surfactant concentrations were 0.74 ± 0.06 mN/m, 0.54 ± 0.04 mN/m, and 1.4 ± 0.12 mN/m, respectively. However, taking into account possible surfactant adsorption onto carbonate rocks, concentrations of 0.05 wt.% CTAB, 0.1 wt.% SDS, and 0.1 wt.% AOS were used in further experiments. Note that the IFT values at these concentrations were higher than at the CMC point, but were still low (~2 mN/m).
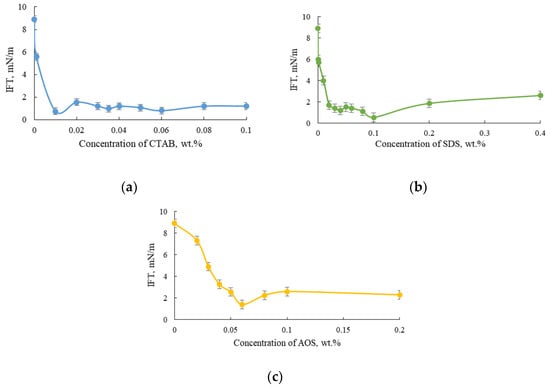
Figure 4.
The interfacial tension at different surfactant concentrations: (a) CTAB; (b) SDS; and (c) AOS at different concentrations at 70 °C.
Then, in order to study the effect of nanoparticles, various concentrations of silica nanoparticles were added to the surfactant solutions with optimal concentrations. The following five concentrations of silica nanoparticles were chosen for the study: 0.005 wt.%, 0.01 wt.%, 0.025 wt.%, 0.05 wt.%, and 0.1 wt.%. The CTAB solutions with the addition of 0.025 wt.%, 0.05 wt.%, and 0.1 wt.% SiO2 resulted in the precipitation of nanoparticles. Furthermore, the addition of only 1 wt.% of NaCl to 0.05 wt.% CTAB with 0.005 wt.% and 0.01 wt.% SiO2 also led to precipitation, and thus CTAB surfactant was not used in further experiments. Importantly, the addition of SiO2 showed better stability with anionic surfactants than with the cationic ones. Figure 5 shows that all SDS solutions were transparent upon the addition of nanoparticles in the whole range of studied concentrations after 14 days at 70 °C. The influence of different NP concentrations on IFT values of 0.1 wt.% SDS without and with 1 wt.% NaCl is shown in Figure 6.
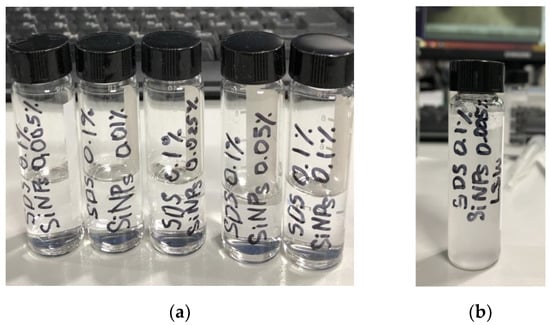
Figure 5.
(a) The 0.1 wt.% SDS solutions with 0.005 wt.%, 0.01 wt.%, 0.025 wt.%, 0.05 wt.%, and 0.1 wt.% SiO2; (b) the 0.1 wt.% SDS solution with 0.005 wt.% SiO2 in LSW.

Figure 6.
The effect of nanoparticles on the IFT of SDS solutions without salt (blue line) and with 1 wt.% NaCl (red line) 70 °C.
Figure 6 shows that the interfacial tension values of SDS increased upon the addition of nanoparticles but remained almost unaffected in the presence of 1 wt.% NaCl. The increase in the IFT values of surfactant with nanoparticles can be attributed to several reasons. First, nanoparticles can reach the interface between oil and brine, and thus block surfactant molecules from approaching it, resulting in higher IFT values. Second, nanoparticles can interact with surfactant molecules, and thus less surfactant can adsorb at the interface and reduce IFT. However, it should be pointed out that the IFT of nano-surfactant dispersions is still less than the IFT of brine–oil without surfactant (Figure 4).
Although the addition of 1 wt.% NaCl had an insignificant influence on the IFT of nano-surfactant dispersions, the addition of LSW (Table 1) led to the high instability of dispersion. The resulting solution precipitated almost immediately after preparation (Figure 5b). Therefore, it was decided not to use SDS surfactant in further experiments. These results show the importance of testing surfactant or nano-surfactant dispersions under reservoir conditions and screening their properties at different salinities to avoid precipitation and negative synergism. Notably, the AOS surfactant showed better stability in the LSW than the CTAB and SDS. Moreover, upon the addition of salts with concentrations corresponding to LSW, the IFT of 0.1 wt.% AOS reduced from 2.6 mN/m (Figure 4c) to 0.12 mN/m (Figure 7).
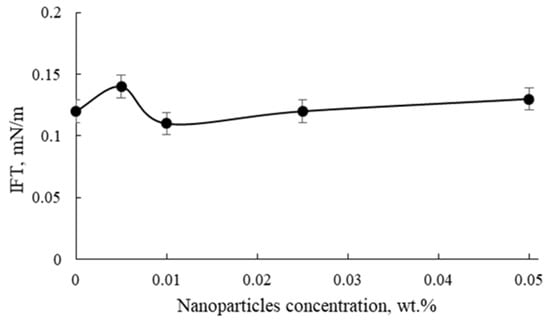
Figure 7.
The influence of different concentrations of nanoparticles on the IFT of 0.1 wt.% AOS with LSW at 70 °C.
In Figure 7, the influence of different concentrations of nanoparticles on the IFT of 0.1 wt.% AOS with LSW is presented. As demonstrated, the addition of nanoparticles showed an insignificant effect on IFT in comparison with the addition of salts (NaCl, MgCl2, CaCl2, and Na2SO4), illustrating that salt ions have a more pronounced influence on IFT than NPs. The same results were obtained in other works [20,33], where the IFT of surfactants was studied with the addition of different nanoparticle concentrations. The authors [33] stated that the CMC of SDS was strongly influenced by salt concentrations, while the CMC was only slightly affected by SiO2 nanoparticles. Moreover, the authors reported that the synergism of IFT reduction of surfactants and NPs can be achieved at particular NP concentrations that are usually small and do not exceed 0.1–0.3 wt.%. However, reservoir brine consists of high salt concentrations, and thus the influence of salt ions on nanofluids should be tested in order to realistically mimic the nanofluids’ behavior under reservoir conditions.
Afterwards, 0.1 wt.% AOS in LSW with different nanoparticle concentrations were tested for thermal stability at 70 °C (reservoir temperature) for at least 14 days. Thermal stability results showed that dispersions with only 0.005 wt.% and 0.01 wt.% SiO2 were the most stable among others (no precipitation occurred). Therefore, for further core-flooding and μCT experiments, AOS surfactant was chosen with a concentration of 0.1 wt.% in a mixture with 0.005 wt.% SiO2 nanoparticles in LSW.
3.2. Investigation of the Effect of Different Fluids on Wettability Using X-ray Micro-Tomography
LSW and nanoparticles have been regarded as promising wettability modifiers of rock surfaces [29,30,34]. Therefore, in this work, we studied and compared the effect of different fluids, including just LSW, surfactant with LSW, and surfactant nanofluids with LSW, on the wetting properties of oil-saturated carbonate rocks. It should be noted that the composition of LSW was the same in all experiments.
For this purpose, the rock sample was first saturated with oil and reservoir brine (see the methods section) to create the residual oil and water saturation. Afterwards, the rock sample was consequently flooded with low-salinity water with 0.1 wt.% AOS and 0.1 wt.% AOS in a mixture with 0.005 wt.% SiO2 (Table 1). Such a flooding design was applied in order to study the impact of each chemical on the wetting properties of carbonates. Moreover, an application of μCT allowed the three-phase contact angle change on a pore-level to be studied after each flooding process.
Examples of μCT images of the sample’s slices after different core flooding tests are presented in Figure 8. In order to visualize and study the dynamics of wettability alteration, the same sample’s parts were analyzed. The images were processed and contrasted to define the phases. The darkest phase is the non-wetting phase (brine), the intermediate phase is the wetting phase (oil), and the brightest phase is the solid (rock surface). In Figure 8a,c, the oil trapped in the pore throat can be seen after filtration with brine and LSW with the strong hydrophobic properties of surfaces. However, after filtration with 0.1 wt.% AOS in LSW and 0.1 wt.% AOS with 0.005 wt.% SiO2 in LSW, the trapped oil was fully removed from the pore throats (Figure 8e,g). By comparing the stages of filtration, it can be noticed that, at the final stage of filtration (surfactant nanofluid in LSW), the non-wetting phase (water) further spread over the rock surface (Figure 8h), which could be the result of wettability alternations towards more water-wet states. As such, after surfactant and surfactant nanofluid flooding, carbonate pore surfaces became more prone to a hydrophilic wetting state, illustrating the significant change in water contact angles and the displacement of oil droplets. The surfactant ability to initiate wettability alternations from oil-wet states to water-wet states is well known [19,21] and is described by means of surfactant adsorption onto rock surfaces covered by hydrocarbons. Importantly, depending on the surfactant ionic type, the mechanism of wettability alterations will be different. In this study, we used AOS, which is a strong anionic surfactant with a liner alkyl tail and an anionic sulfonate headgroup, with a sodium ion as a counterion. Therefore, such surfactant will tend to adsorb on hydrocarbons via hydrophobic interactions rather than electrostatic ones. This occurs due to the electrostatic repulsion between the same negative charge in the surfactant headgroups and adsorbed polar oil components on carbonate surfaces. As such, it is energetically favorable for surfactant molecules to interact by weak hydrophobic bonding with hydrocarbons, thereby leaving the hydrophilic groups on top, which contribute to hydrophilic surface wettability. When hydrophobic interaction is more than the binding force, the polar oil components desorb from the surface, rendering it more water-wet.
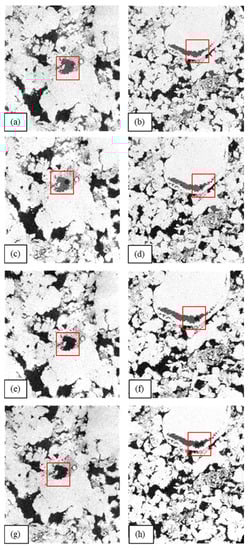
Figure 8.
The images of core sample slices obtained by μCT after: (a,b) brine filtration; (c,d) LSW filtration; (e,f) filtration with LSW with 0.1 wt.% AOS; (g,h) filtration with LSW with 0.1 wt.% and 0.05 wt.% SiO2.
When nanoparticles are introduced to the system, the change in contact angle is more pronounced than when only the surfactant is used. This can be attributed to the disjoining pressure buildup in the wedge film between the oil and rock surface [35,36]. This phenomenon stems from the fact that nanoparticles tend to order inside the confined geometry of the wedge as it increases the entropy of the dispersion (more freedom to nanoparticles in the bulk). Thus, the spreading of nanoparticle films on surfaces is driven by the structural disjoining pressure gradient directed towards the wedge from the bulk solution. This results in the oil droplet becoming detached from the surface and instigates water-wet changes in the wetting state. In a mixture with the surfactant, this effect is more pronounced as nanoparticles form aggregates with surfactant molecules that further facilitate the detachment process of hydrocarbons from the surfaces by the structural disjoining pressure phenomenon.
This can be further supported by the three-phase contact angle calculations, for which ImageJ software was utilized (Figure 9). The changes in contact angles indicated that the rock sample from strongly oil-wet states (144°) became more water-wet (49°) through the flooding stages. It is noteworthy that almost all the oil was displaced from porous media with only a few droplets left after the surfactant nanofluid with LSW. Moreover, as can be noticed, the water shape significantly changed, illustrating a more prolonged form (Figure 9).

Figure 9.
The contact angle measurements by ImageJ software on the images obtained by μCT after filtration: (a) brine; (b) LSW; (c) 0.1 wt.% AOS in LSW; (d) 0.1 wt.% AOS and 0.005 wt.% SiO2 in LSW.
Furthermore, it can be concluded that LSW had an insignificant influence on the wettability of carbonate rock, which still exhibited strong hydrophobic properties after LSW flooding. This can be attributed to the fact that the ionic strength of LSW was not suitable in this case to expand the electrical double layer, and thus to increase the electrostatic repulsion between charged polar oil components and the surface, which in turn could facilitate the detachment process of oil.
However, after the addition of 0.1 wt.% AOS to LSW, the effect became more pronounced, resulting in a contact angle reduction of up to 79°. Moreover, the inclusion of only 0.005 wt.% SiO2 to surfactant solution with LSW further decreased the contact angle of carbonate surface to 49°, indicating that nanoparticles can aid in the wettability alteration towards a more hydrophilic state. This observation illustrates that if the type and concentrations of chemicals are accurately selected, it is possible to achieve a positive synergizing effect.
Although the adsorption measurements were not conducted in this work, a quantitative evaluation was performed. For this purpose, the fluids after filtration were collected to measure the IFT. As such, it was suggested that an increase in IFT values after filtration illustrates that some surfactant molecules were adsorbed onto surfaces, and a fewer number of them approached the interface. The results are presented in Table 3. As demonstrated (Table 3), both the IFT values of brine and LSW slightly decreased in comparison with the results before filtration up to 20% and 30%, respectively. It is also interesting to point out that the IFT of 0.1 wt.% AOS significantly increased from 0.15 mN/m to 1.15 mN/m after filtration. This can be attributed to the adsorption of surfactant onto rock surfaces and its uncontrollable and unfavorable loss during flooding. Meanwhile, the IFT of 0.1 wt.% AOS and 0.005 wt.% SiO2 in LSW changed from 0.14 mN/m to 0.46 mN/m, which is much less than for just surfactant. This observation suggests that nanoparticles can serve as sacrificial agents to prevent surfactant adsorption.
Table 3.
Interfacial tension measurements with fluids before and after filtration.
It should be pointed out that the application of nanoparticles in chemical EOR can be limited by nanoparticle precipitation, which in turn reduces the stability of the dispersion. This can result in pore blockage during flooding and thus lead to formation damage. In order to avoid this, the optimal concentration of nanoparticles in surfactant dispersion at which the solution will be stable under reservoir conditions should be determined.
4. Conclusions
In this study, the effect of different fluids, including LSW, surfactant with LSW, and surfactant nanofluid with LSW, on the wetting properties of oil-saturated carbonate rocks was studied at the micro level (pore level) for the first time.
This work demonstrates that the use of surfactant nanofluid in optimal concentrations (0.1 wt.% AOS and 0.005 wt.% SiO2) with LSW significantly makes the wetting properties of carbonate surfaces more water-wet, illustrating the synergetic effect. The average three-phase contact angle of water changed from 144° to 49° upon the flooding process, corresponding to a wettability alteration from strong oil-wet conditions to water-wet conditions. An increase in the concentration of SiO2 nanoparticles has an adverse effect on the stability of surfactant solutions at reservoir conditions, possibly mainly due to the formation of nanoaggregate complexes that precipitate fast. This indicates the importance of preliminary screening procedures for nanoparticles and surfactants in order to avoid negative synergism.
It was also shown that the high-resolution micro-visualization technique (μCT) can be applied for pore-level investigations and to gain an understanding of flow fluid distributions. This method is recommended for the calculation of three-phase contact angles (rock–oil–injected fluid), which is more accurate than contact angle measurements (rock–oil–air) as it represents and mimics reservoir conditions more realistically.
Furthermore, the quantitative evaluation of surfactant adsorption showed that nanoparticles can also serve as sacrificial agents, and thus block active surface adsorption sites for surfactant molecules. As such, less surfactant is adsorbed and lost, which has both economic and technological benefits.
Overall, this study shows that nanoparticles are promising additives to surfactant injection fluids for carbonate reservoirs, as they have positive synergism in wettability alterations and can prevent the adsorption of surfactants onto rock surfaces. This study has implications for the performance enhancement of chemical flooding and facilitates the application of nanofluids for EOR in real carbonate fields.
Author Contributions
A.I.: conceptualization, methodology, validation, formal analysis, investigation, data curation, writing—review and editing, visualization, and project administration; A.K., A.R., A.M. and A.B.: investigation, data curation, writing—review and editing, and visualization; A.C.: supervision, project administration, and funding acquisition. All authors have read and agreed to the published version of the manuscript.
Funding
This work was supported by the Ministry of Science and Higher Education of the Russian Federation under agreement no. 075-10-2022-011 within the framework of the development program for a world-class Research Center.
Data Availability Statement
Not applicable.
Conflicts of Interest
The authors declare no conflict of interest.
References
- Klemme, H.; Ulmishek, G.F. Effective petroleum source rocks of the world: Stratigraphic distribution and controlling depositional factors. AAPG Bull. 1991, 75, 1809–1851. [Google Scholar]
- Burchette, T. Carbonate Rocks and Petroleum Reservoirs: A Geological Perspective from the Industry; Geological Society London Special Publications: London, UK, 2012; Volume 370, pp. 17–37. [Google Scholar]
- Abdallah, W.; Buckley, J.S.; Carnegie, J.; Edwards, J.; Fordham, B.H.E.; Graue, A.; Habashy, T.; Seleznev, N.; Signer, C.; Hussain, H.; et al. Fundamentals of wettability. Oilfield Rev. 2007, 19, 44–61. [Google Scholar]
- Characterization of Fractured Reservoirs. Schlumberger Market Analysis. 2007. Available online: https://www.slb.com/-/media/files/theme/brochure/cb-characterization-09os0003.ashx (accessed on 1 January 2023).
- Tabary, R.; Fornari, A.; Bazin, B.; Bourbiaux, B.J.; Dalmazzone CS, H. Improved Oil Recovery with Chemicals in Fractured Carbonate Formations. In Proceedings of the SPE International Symposium on Oilfield Chemistry, Galveston, TX, USA, 8–9 April 2009. [Google Scholar]
- Anderson, W.G. Wettability literature survey—Part 5: The effects of wettability on relative permeability. J. Pet. Technol. 1987, 39, 1453–1468. [Google Scholar] [CrossRef]
- Wu, Z.; Liu, H.; Pang, Z.; Wu, C.; Gao, M. Pore-Scale Experiment on Blocking Characteristics and EOR Mechanisms of Nitrogen Foam for Heavy Oil: A 2D Visualized Study. Energy Fuels 2016, 30, 9106–9113. [Google Scholar] [CrossRef]
- Dordzie, G.; Dejam, M. Enhanced oil recovery from fractured carbonate reservoirs using nanoparticles with low salinity water and surfactant: A review on experimental and simulation studies. Adv. Colloid Interface Sci. 2021, 293, 102449. [Google Scholar] [CrossRef] [PubMed]
- Jadhunandan, P.P.; Morrow, N.R. Effect of wettability on waterflood recovery for crude oil/brine/rock systems. In Proceedings of the 66th Annual Technical Conference and Exhibition, Dallas, TX, USA, 6–9 October 1991. Paper SPE 22597. [Google Scholar]
- TTetteh, J.; Barimah, R.; Kow Korsah, P. Ionic Interactions at the Crude Oil–Brine–Rock Interfaces Using Different Surface Complexation Models and DLVO Theory: Application to Carbonate Wettability. ACS Omega 2022, 7, 7199–7212. [Google Scholar] [CrossRef] [PubMed]
- Ruidiaz, E.M.; Winter, A.; Trevisan, O.V. Oil recovery and wettability alteration in carbonates due to carbonate water injection. J. Petrol. Explor. Prod. Technol. 2018, 8, 249–258. [Google Scholar] [CrossRef]
- Souayeh, M.; Al-Maamari, R.S.; Aoudia, M.; Karimi, M.; Hadji, M. Experimental investigation of wettability alteration of oil-wet carbonates by a non-ionic surfactant. Energy Fuels 2018, 32, 11222–11233. [Google Scholar] [CrossRef]
- Ivanova, A.A.; Mitiurev, N.A.; Shilobreeva, S.N.; Cheremisin, A. NExperimental Methods for Studying the Wetting Properties of Oil Reservoirs: A Review. Izv. Phys. Solid Earth 2019, 55, 496–508. [Google Scholar] [CrossRef]
- Buckey, J.S.; Liu, Y.; Monsterleet, S. Mechanisms of wetting alteration by crude oils. SPE J. 1998, 3, 54–61. [Google Scholar] [CrossRef]
- Ivanova, A.; Orekhov, A.; Markovic, S.; Iglauer, S.; Grishin, P.; Cheremisin, A. Live imaging of micro and macro wettability variations of carbonate oil reservoirs for enhanced oil recovery and CO2 trapping/storage. Sci. Rep. 2022, 12, 1–12. [Google Scholar] [CrossRef]
- Sun, X.; Zhang, Y.; Chen, G.; Gai, Z. Application of nanoparticles in enhanced oil recovery: A critical review of recent progress. Energies 2017, 10, 345. [Google Scholar] [CrossRef]
- Dordzie, G.; Dejam, M. Experimental Study on Alternating Injection of Silica and Zirconia Nanoparticles with Low Salinity Water and Surfactant into Fractured Carbonate Reservoirs for Enhanced Oil Recovery. Ind. Eng. Chem. Res. 2022, 61, 16328–16340. [Google Scholar] [CrossRef]
- Ivanova, A.A.; Cheremisin, A.N.; Spasennykh, M.Y. Application of Nanoparticles in Chemical EOR. In IOR 2017-19th European Symposium on Improved Oil Recovery; European Association of Geoscientists & Engineers: Utrecht, The Netherlands, 2017; Volume 2017, pp. 1–10. [Google Scholar] [CrossRef]
- Sheng, J.J. Status of surfactant EOR technology. Petroleum 2015, 1, 97–105. [Google Scholar] [CrossRef]
- Bello, A.; Ivanova, A.; Cheremisin, A. Enhancing N2 and CO2 foam stability by surfactants and nanoparticles at high temperature and various salinities. J. Pet. Sci. Eng. 2022, 215, 110720. [Google Scholar] [CrossRef]
- Sheng, J.J. Review of surfactant enhanced oil recovery in carbonate reservoirs. Adv. Pet. Explor. Dev. 2013, 6, 1–10. [Google Scholar] [CrossRef]
- Esmaeilzadeh, P.; Hosseinpour, N.; Bahramian, A.; Fakhroueian, Z.; Arya, S. Effect of ZrO2 nanoparticles on the interfacial behavior of surfactant solutions at air-water and n-heptane-water interfaces. Fluid Phase Equilibria 2014, 361, 289–295. [Google Scholar] [CrossRef]
- Ravera, F.; Santini, E.; Loglio, G.; Ferrari, M.; Liggieri, L. Effect of nanoparticles on the interfacial properties of liquid/liquid and liquid/air surface layers. J. Phys. Chem. B 2006, 110, 19543–19551. [Google Scholar] [CrossRef]
- Scerbacova, A.; Ivanova, A.; Grishin, P.; Cheremisin, A.; Tokareva, E.; Tkachev, I.; Sansiev, G.; Fedorchenko, G.; Afanasiev, I. Application of alkalis, polyelectrolytes, and nanoparticles for reducing adsorption loss of novel anionic surfactant in carbonate rocks at high salinity and temperature conditions. Colloids Surf. A Physicochem. Eng. Asp. 2022, 653, 129996. [Google Scholar] [CrossRef]
- Ivanova, A.A.; Phan, C.; Barifcani, A.; Iglauer, S.; Cheremisin, A.N. Effect of Nanoparticles on Viscosity and Interfacial Tension of Aqueous Surfactant Solutions at High Salinity and High Temperature. J. Surfactants Deterg. 2020, 23, 327–338. [Google Scholar] [CrossRef]
- Ogolo, N.A.; Olafuyi, O.A.; Onyekonwu, M.O. Enhanced oil recovery using nanoparticles. In Proceedings of the SPE Saudi Arabia Section Technical Symposium and Exhibition, Al-Khobar, Saudi Arabia, 8–11 April 2012. [Google Scholar] [CrossRef]
- Asl, H.F.; Zargar, G.; Manshad, A.K.; Takassi, M.A.; Ali, J.A.; Keshavarz, A. Effect of SiO2 nanoparticles on the performance of L-Arg and L-Cys surfactants for enhanced oil recovery in carbonate porous media. J. Mol. Liq. 2020, 300, 112290. [Google Scholar] [CrossRef]
- Shehata, A.M.; Alotaibi, M.B.; Nasr-El-Din, H.A. Waterflooding in carbonate reservoirs: Does the salinity matter? SPE Reserv. Eval. Eng. 2014, 17, 304–313. [Google Scholar] [CrossRef]
- Katende, A.; Sagala, F. A critical review of low salinity water flooding: Mechanism, laboratory and field application. J. Mol. Liq. 2019, 278, 627–649. [Google Scholar] [CrossRef]
- Tetteh, J.T.; Brady, P.V.; Barati Ghahfarokhi, R. Review of low salinity waterflooding in carbonate rocks: Mechanisms, investigation techniques, and future directions. Adv. Colloid Interface Sci. 2020, 284, 102253. [Google Scholar] [CrossRef] [PubMed]
- Guo, C.; Wang, X.; Wang, H.; He, S.; Liu, H.; Zhu, P. Effect of pore structure on displacement efficiency and oil-cluster morphology by using micro computed tomography (μCT) technique. Fuel 2018, 230, 430–439. [Google Scholar] [CrossRef]
- Iglauer, S.; Paluszny, A.; Blunt, M.J. Simultaneous oil recovery and residual gas storage: A pore-level analysis using in situ X-ray micro-tomography. Fuel 2013, 103, 905–914. [Google Scholar] [CrossRef]
- Al-Anssari, S.; Wang, S.; Barifcani, A.; Iglauer, S. Oil-water interfacial tensions of silica nanoparticle-surfactant formulations. Tenside Surfactants Deterg. 2017, 54, 334–341. [Google Scholar] [CrossRef]
- Ali, J.A.; Kolo, K.; Manshad, A.K.; Stephen, K.D. Potential application of low-salinity polymeric-nanofluid in carbonate oil reservoirs: IFT reduction, wettability alteration, rheology and emulsification characteristics. J. Mol. Liq. 2019, 284, 735–747. [Google Scholar] [CrossRef]
- Nikolov, A.; Kondiparty, K.; Wasan, D. Nanoparticle self-structuring in a nanofluid film spreading on a solid surface. Langmuir 2010, 26, 7665–7670. [Google Scholar] [CrossRef]
- Wasan, D.; Nikolov, A.; Kondiparty, K. The wetting and spreading of nanofluids on solids: Role of the structural disjoining pressure. Curr. Opin. Colloid Interface Sci. 2011, 16, 344–349. [Google Scholar] [CrossRef]
Disclaimer/Publisher’s Note: The statements, opinions and data contained in all publications are solely those of the individual author(s) and contributor(s) and not of MDPI and/or the editor(s). MDPI and/or the editor(s) disclaim responsibility for any injury to people or property resulting from any ideas, methods, instructions or products referred to in the content. |
© 2023 by the authors. Licensee MDPI, Basel, Switzerland. This article is an open access article distributed under the terms and conditions of the Creative Commons Attribution (CC BY) license (https://creativecommons.org/licenses/by/4.0/).