Article

Life Cycle Environmental Impacts Assessment of Post-Combustion Carbon Capture for Natural Gas Combined Cycle Power Plant in Iraq, Considering Grassroots and Retrofit Design

by
Rudha Khudhair Mohammed
1 and
Hooman Farzaneh
1,2,*
1
Interdisciplinary Graduate School of Engineering Sciences, Kyushu University, Fukuoka 816-8580, Japan
2
Transdisciplinary Research and Education Center for Green Technologies, Kyushu University, Fukuoka 816-8580, Japan
*
Author to whom correspondence should be addressed.
Energies 2023, 16(3), 1545; https://doi.org/10.3390/en16031545
Submission received: 26 December 2022 / Revised: 23 January 2023 / Accepted: 28 January 2023 / Published: 3 February 2023

Abstract

:
In this work, the Life Cycle Assessment (LCA) methodology is used to examine the implications of CO2 capture from a natural gas combined cycle power plant with post-combustion carbon capture (NGCC-CCS) in Iraq, taking into account two different design scenarios. In the first scenario (retrofit), the carbon capture unit is considered as an end pipe technology that can be linked to an existing power plant. The second scenario considers a grassroots design, in which a new power plant equipped with a carbon capture unit needs to be constructed. The LCA is carried out based on different impact assessment (LCIA) methodologies of ReCipe 2016 Midpoint (H), TRACI 2.1, and IMPACT 2002+ to investigate whether the chosen LCIA method influences the LCA scenario analysis for decision support in process development. The results of three impact categories applied to both scenarios reveal a 28% reduction in Global Warming Potentials (GWPs) and a 14% and 17% increase in the Particulate Matter Formation Potential (PMFP) and Acidification (AP) potential in the grassroots scenario, respectively. Finally, an uncertainty analysis is performed to more accurately reflect the influence of uncertain factors on the statistical significance of the environmental impact evaluation in this research, indicating that these uncertainties may significantly affect the ultimate decision.

1. Introduction

1.1. Background

Global warming is the world’s most challenging concern nowadays. Energy demand is rising due to population growth and industrial activities [1]. Apart from natural causes, human activities such as burning fossil fuels (coal, lignite, and natural gas) increase carbon dioxide emissions into the atmosphere, increasing the earth’s natural greenhouse effect. Due to rising electricity demand and a growing population, Iraq increasingly relies on fossil fuels to produce its electricity [2]. The absence of a steady power supply is a major barrier to Iraq’s growth. Power plants in Iraq now produce more power than ever, but there is still not enough to satisfy demand [3]. Iraq’s long-term mitigation plans aim to cut greenhouse gas (GHG) emissions through sector and national plans, aligning with the country’s development aspirations and employing the appropriate tools to lower costs and bring about transformational and long-lasting improvements [4]. The Intended Nationally Determined Contributions (INDC) were submitted by Iraq to the UNFCCC in 2015 to set targets for reducing emissions of greenhouse gas (GHG) equivalent to 14% below business-as-usual (BAU) emissions during the period between 2020 and 2035 [4]. In the OECD countries, natural gas contributes about 31.6% of the energy source used in the electric power generation mix, indicating a strong relationship between economic growth and natural gas demand [5]. Natural Gas Combined Cycle Power Plants (NGCC), in particular, have lower emissions than other fossil fuel-based power plants. In this regard, switching from coal and oil to natural gas could be a key solution considered for future sustainable energy systems, which could be realized by combining NGCC power plants with CO2 capture and storage systems [6,7]. Nonetheless, despite advantages over conventional nonrenewable energy sources, hazardous pollutants are released into the environment during the operation of NGCC power plants [8].
Carbon capture and storage (CCS) has emerged as a medium-term mitigation strategy for reducing CO2 emissions from power plants [9]. The benefits from the CO2 capture and utilization chain are twofold: first, mitigating climate change and reducing harmful environmental effects, and second, creating economic value by using captured CO2 to produce other valuable materials and enhancing oil production before being stored. Global interest is growing in new CO2 use pathways for the manufacture of fuels, chemicals, and construction materials. The fertilizer industry has the largest consumer share, with 130 Mt CO2 utilized in urea production, followed by the oil and gas industry, with consumption of (70–80) Mt CO2 for enhanced oil recovery [10]. Food and beverage processing, cooling, metal fabrication, fire suppression, and stimulating plant growth in greenhouses are some of the other commercial applications of CO2. The environmental implications of Carbon Capture and Utilization (CCU) technologies and Carbon Capture and Storage (CCS) are generally examined using a widely established process among industrial practitioners and academics known as Life Cycle Assessment (LCA).
LCA is a process for evaluating possible benefits as well as different environmental consequences through a product’s or service’s life cycle. The LCA is based on the defined approaches of ISO 14044 [11] and ISO 14040 [12]. The standard LCA analysis is based on choosing the functional unit, background processes, system boundaries, or environmental impact assessment. During the Life Cycle Impact Assessment (LCIA) stage, a specific set of methods and models is used to estimate the environmental impacts based on flows into and out of the environment from the Life Cycle Inventory (LCI). Typically, these methods characterize and classify emissions, using impact-related reference indicators. Thus, the environmental effects of a projected system can better comprehend at an early stage by quantifying the possible environmental implications. The life cycle assessment method evaluates the environmental impacts of a CCS or CCUS plant throughout its life cycle, in different stages (extraction, production, transportation, processing, and storage), in addition to recycling and final disposal of waste materials [13]. A clear distinction should be made between carbon capture and utilization chain utility (CCU) and storage technologies (CCS), as shown in Figure 1. When evaluating the environmental performance of power plants using CCS, it is implied that upstream (e.g., extraction of fuel, transportation) and downstream activities (e.g., CO2 transport, injection, and storage) must be involved in the CCS chain designs [14].

1.2. Literature Review

LCA is recognized as a valuable method in identifying various environmental impacts over the life cycle in different phases and regions [15]. Research on LCA assessment of the CCS has been conducted to identify and evaluate the environmental implications of CCS [16]. However, the existing methodologies are inadequate, and there are discrepancies in data quality and basic assumptions that make it difficult to compare. For LCA to be widely accepted, comprehensive and specific data inventories are necessary. Data used in the LCA depend on assumptions that are unlikely to be accurate across all data sources; therefore, there will be some data with an unavoidable higher level of uncertainty. For example, unlike photochemical smog or human toxicity, data required to address various GHG emissions and acid rain precursors have been reasonably well produced for the power generation industry [17].
More life cycle assessments have been performed in the last decade to examine the environmental impact of power production systems combined with CCS. These studies take into account not only the global warming potential (GWP) connected with climate change but also other types of environmental impacts. GWP is a measure to compare the climatic impact of various greenhouse gas emissions. It is calculated by aggregating the radiative climatic forcing of a greenhouse-gas emission over a certain time horizon [18]. All these studies have revealed a trade-off regarding global warming potential, chemical effects, resource depletion, and waste treatment of CCS technologies. The focus of many of these studies has shifted away from early climate change impacts toward a variety of non-climate issues such as human health potential (HTP), eutrophication potential (EP), and acidification potential (AP) [19]. Several characterization models and category indicators are proposed for various effect categories. The Impact categories range from only GWP, as in [20], to a more extensive set of other environmental categories [21]. Therefore, studies dealing with the same effect category but using distinct categorical indices may not be directly comparable. A complete understanding of all emissions is required to convert the data into the same indicator, yet such knowledge is largely unavailable. Although CCS is a proven technology, its depiction in the literature differs significantly. The projected process performance figures for various applications represent a wide range of plants, from bench-scale studies to full-scale commercial plants.
Depending on the type of power plants under study, values for energy penalties and net efficiencies vary significantly due to specific technical and technological representation concerning the fuels used [17]. For natural gas post-combustion, efficiency values fall between 42% [22] and 61% [23] while for hard coal post-combustion, efficiency is 29.6% [24]–49% [25]. The difference between the lowest and highest efficiency for lignite power plants is even more significant [17]. Since it can be retrofitted to existing power plants without requiring major changes, post-combustion carbon capture (PCC) is an ideal technology for reducing environmental emissions [26]. Although widely acknowledged, the high energy requirements for the CO2 separation process and its repercussions (such as increased operating costs) have always been significant barriers to the scaling-up of PCC power plant development [27]. In this regard, the amine-based PCC is one of the commercialized CO2 capture technologies that use an amine solvent to absorb CO2 molecules into a liquid solution. However, adding an amine-based carbon sequestration system to an existing power plant reduces the power plant’s efficiency [28]. PCC and oxyfuel combustion CCS systems can reduce GWP by 78.8% and 80%, respectively, while other environmental effects, such as acidification, human toxicity, and ecotoxicity, differ significantly when compared to power plants without CCS [29]. Amine and ammonia-based flue gas absorption and the impact of capture efficiency on supercritical and subcritical coal-fired power plants were assessed by [30] to evaluate the environmental effects of CO2 capture using life cycle analysis. Their studies investigated how different environmental impact categories were affected by amine concentrations of 20%, 30%, and 40%, using the LCIA methods of ReCiPe 2016 Midpoint (H)V1.03, IPCC 2013 GWP 100a, TRACI 2.1 V1.05, and AWARE V1.02. The added CCS unit offered significant environmental advantages regarding global warming. Their findings showed that for additional effect categories such as ozone depletion, water footprint, fossil fuel depletion, marine eutrophication, smog, and ionizing radiation, plants with a CCS unit had a higher impact than those without it. In terms of water and carbon footprints, the MEA-based CO2 capture unit outperforms the ammonia-based CCS unit.
Using MEA for post-combustion CO2 capture, a comparative LCA study was conducted comparing chemical absorption and membrane separation techniques [31]. According to this study, LCA outcomes of CCS, based on a membrane separation technique, were highly dependent on the type of membrane used and the dense active layer thickness, both of which impact the amount the size of the membrane needed and net power used.
Previous studies have used various LCIA methods, including CML, ReCiPe, IMPACT2002+, TRACI, and IPCC. The impact categories that have been studied range from just one in [32] and [29] to ten environmental categories in [33]. Additionally, the impact categories appear to differ between studies. However, some of them are used more frequently [34] in the midpoint characterization of LCA studies for electricity generation, such as global warming potential (GWP), acidification potential (AP), human toxicity potential (HTP), eutrophication potential (EP), and ozone layer depletion potential (ODP). Among the studies, the most commonly used database was Ecoinvent, providing information on possible environmental impacts.
Table 1 displays the recent LCA studies on CCS in NGCC power plants and the methods used for the impact analysis.

1.3. Research Gap and Originalities

Despite the diversity of LCA modeling approaches highlighted in Table 1, the following challenges exist with all the aforementioned studies: (1) most studies relied on a single LCIA method to assess the environmental impact of the process. However, LCIA methods differ in several aspects. A key distinction between the LCIA methods is that they use different approaches and data sources in the chain of cause-and-effect to calculate impact. Therefore, variations between methods should be recognized, and whether these variations might influence outcomes should be evaluated, which is vital for decision support in process development. (2) A drawback of the LCAI methods is their statistical uncertainties. Data gaps and assumptions mount up throughout the cause-effect chain, so the further the environmental impacts are expressed and assessed, the lower the reliability of the results. Previous studies have not covered the uncertainty analysis of data used in their methods. (3) When dealing with the LCA of power plants, it is important to consider whether the CCS plant is linked to an existing power plant (retrofit design) or whether it should be considered from the first level of power plant construction (grassroots design). This is because the grassroots design covers the environmental impacts of the power plant construction stages, which is not seen in a retrofit design as previous studies have not addressed this issue.
To fill the previous research gaps, a comprehensive environmental lifecycle assessment is carried out for an existing power plant (Hartha Power Plant) in Iraq, with 90% CO2 capture efficiency, denoted as a retrofit scenario, utilizing traditional monoethanolamine (MEA), compared with another scenario of building a new power plant referred to as grassroots scenario. In order to find the impact of CCS implementation on the existing power plants process parameters, the Integrated Environmental Control Model (IECM) software developed by Carnegie Mellon University was used for the detailed process simulation of the proposed MEA capture process. The LCA analysis is founded on various LCIA methods such as ReCipe 2016 Midpoint (H) [46], TRACI 2.1 [47], and IMPACT 2002+ [48], using SimaPro software, 9.1.0.11. To create a robust LCA model, uncertainty analysis was performed on both retrofit and grassroots cases, as it is one of the major elements affecting the reliability of LCA outcomes. The research methodology used in this research is shown in Figure 2.
The rest of the paper is structured as follows: Section 2 presents the comparative developed framework models and the application of the model in a real case study in Iraq. Section 3 shows the life cycle data inventory. Section 4 discusses the assessment results and the sensitivity analysis.

2. Materials and Methods

2.1. Case Study

The key performance indicators of the reference plant without a CO2 capture plant studied in this research are given in Table 2. Hartha Power Plant Project provides an essential source of power for the region, frequently subjected to undesirable power outages. Figure 3 shows the proposed location of the capture plant. The selected power plant has three pressure levels of impulse-reaction turbines. The low-pressure turbine cylinder is a double flow chest; therefore, the turbines are two cylinders, single reheat, condensing double flow chest.
With a nominal capacity of 200 MW and a condenser pressure of 0.08 to 0.156 bar, the two turbines have six steps of steam bleeding. The rotor gland is a part of the turbine cylinder that insulates it from the output, preventing the HPT (high-pressure turbine) steam from venting into the environment. Due to the vacuum in the condenser, a similar gland in the LPT (low-pressure turbine) prevents air from entering the condenser. The generator is an AC type that uses hydrogen for cooling and operates at a constant speed of 3000 rpm to produce 50 Hz at 18 KV, which is subsequently transformed to a high voltage of 400 KV by the transformer. The power station’s boiler section is a natural circulation water tube boiler with a forced draught that generates steam at 538 °C and 125.5 bar pressure, using a gas and oil-fired system. The boiler is also used to reheat the steam that comes out of the high-pressure turbine to a temperature of 538 °C. The Rehabilitation construction of the 200 MW Unit-1 of the Hartha Power Station began in October 2019. When GAMA Power Systems and Mitsubishi Hitachi Power Systems (MHPS) complete the renewal process, it is hoped that the power plant’s operating life will be extended by up to ten years [51].

2.2. Proposed CO2 Capture Unit

The process of amine scrubbing is well-known among the alternatives because of the reversible interactions with CO2; thus, it is regarded as the most suitable and cost-effective choice for use in a capture plant [52]. Although utilizing the MEA method for CO2 capturing is common, the majority of current research focuses on this method due to its proven technique of capturing [53], while other studies are attempting to overcome the downsides of amine scrubbing by developing novel amines and mixes [54].
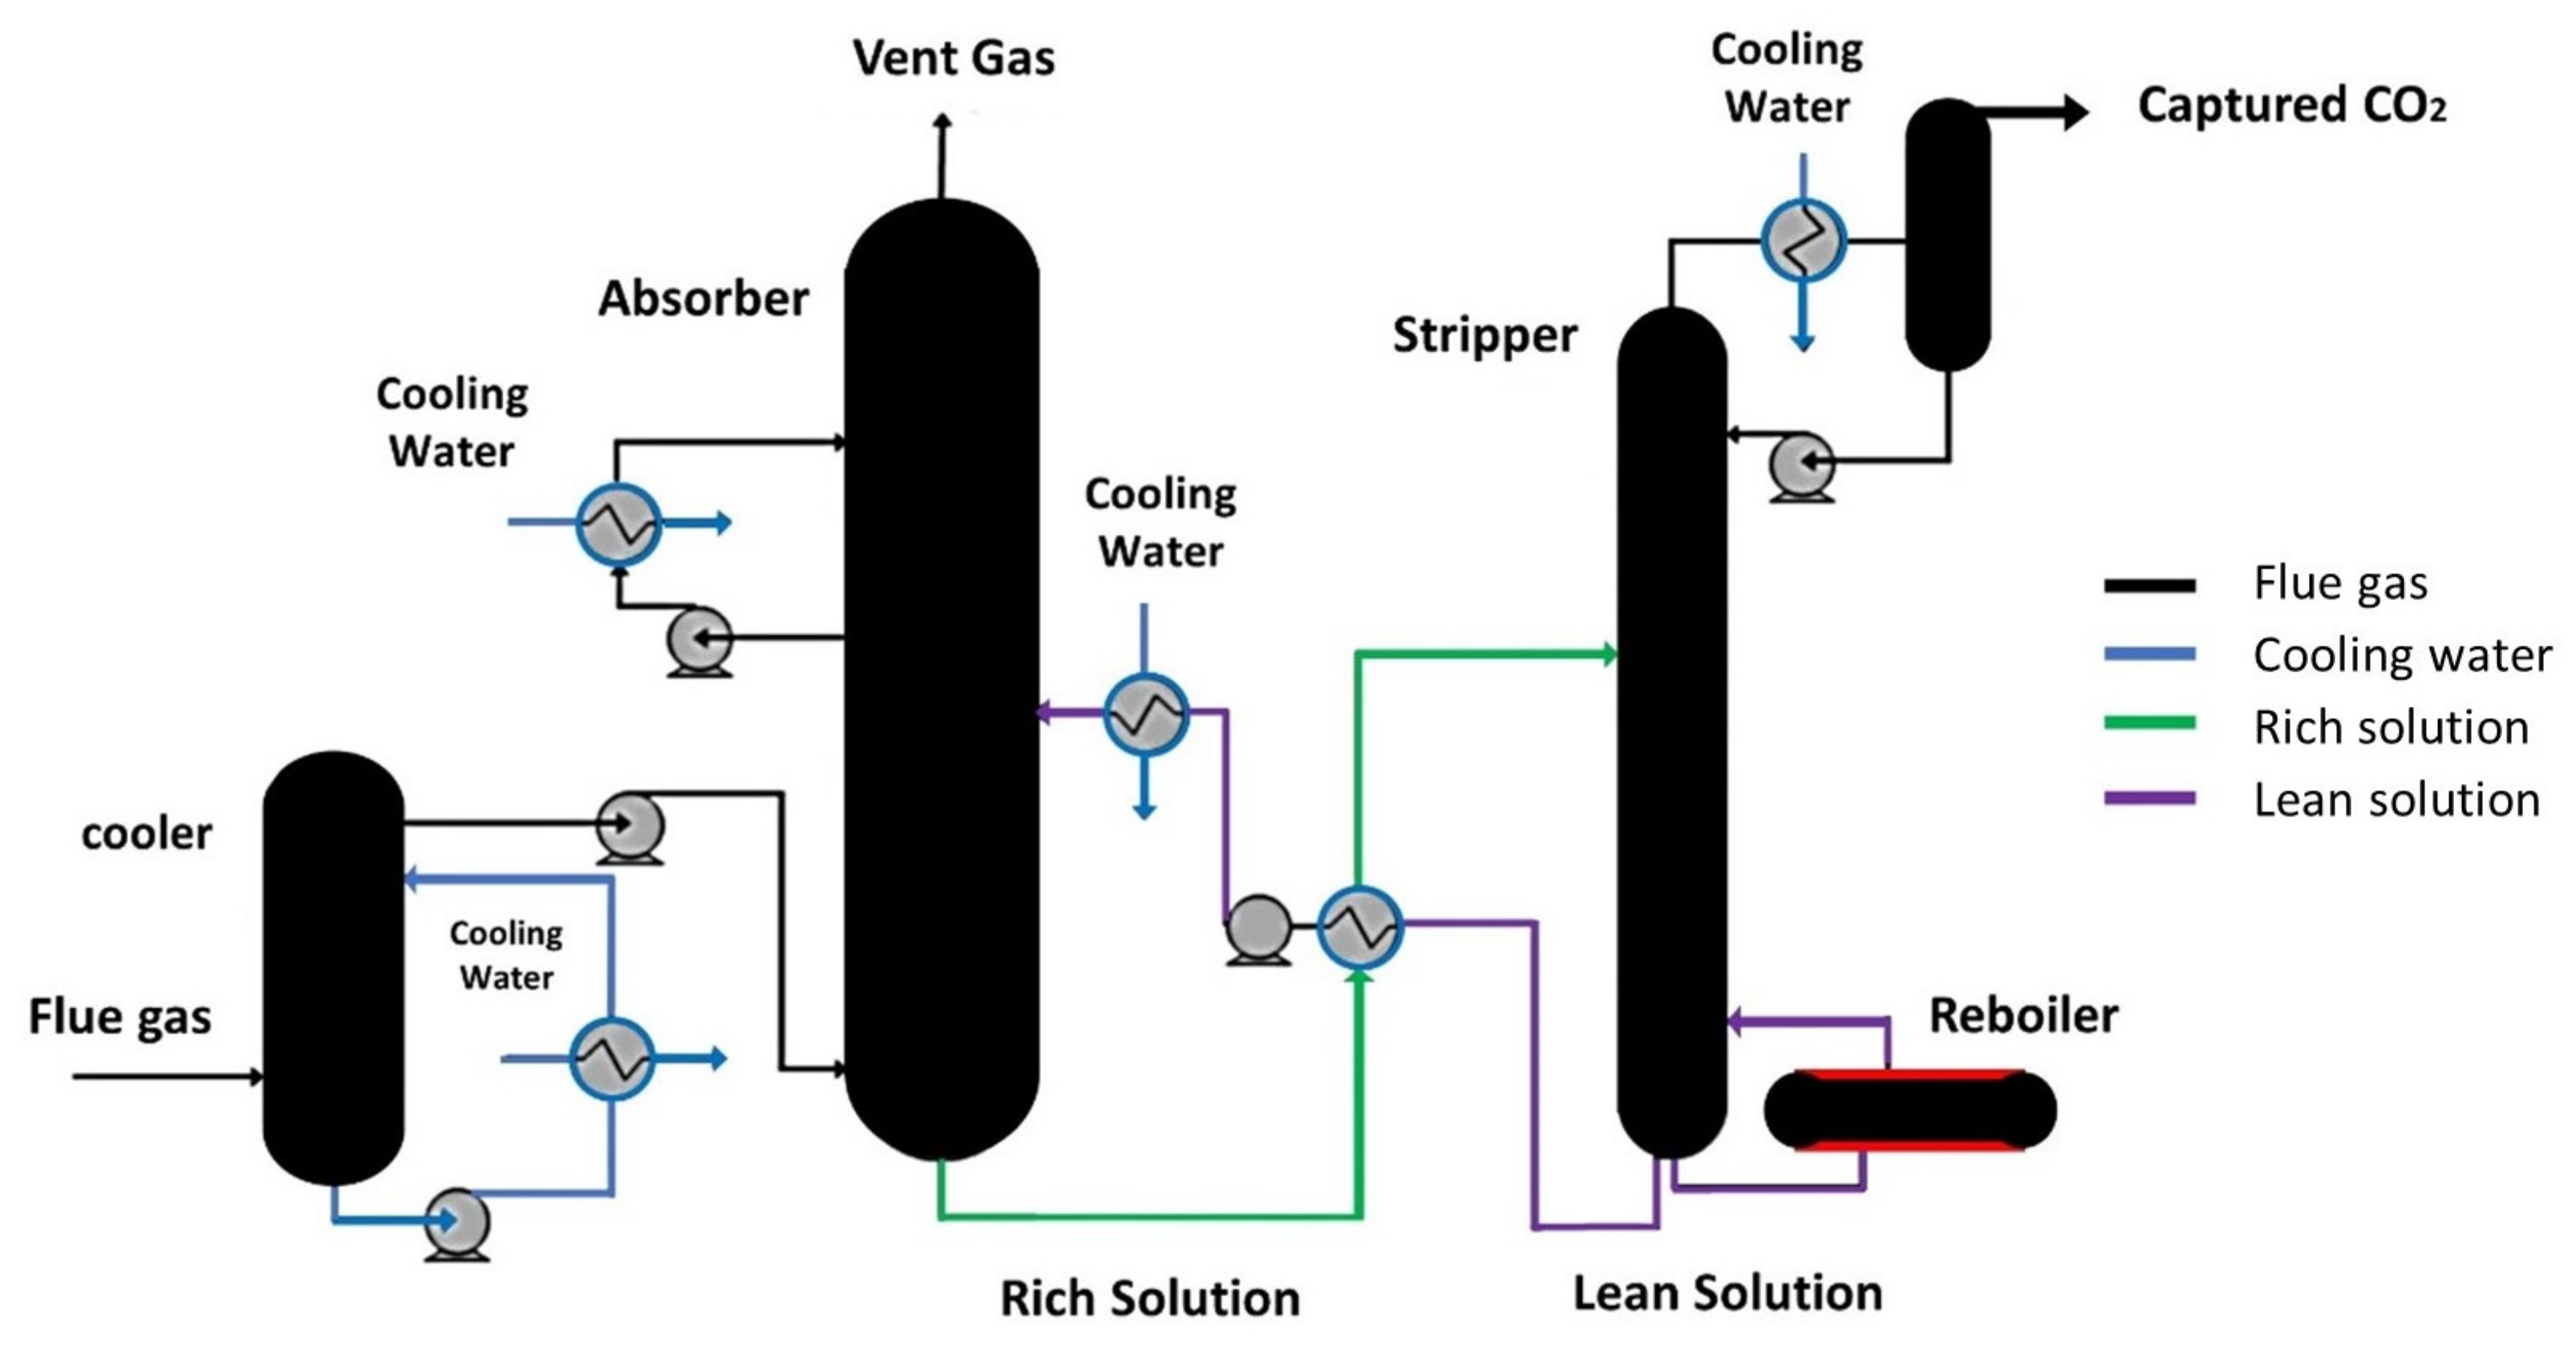
In this study, the KM-CR process provided by the Mitsubishi Heavy Industries (MHI) company is considered as the proposed CO2 capture unit, which typically comprises an absorber, a quencher, and a stripping column [55]. As shown in Figure 4, the amine solvent passes into the packed absorber column, absorbing the CO2 from the cold flue gas in a counter-current flow. A high level of CO2 absorption by the solvent (>90%) is guaranteed by using multiple tiers of spray zones, trays, and packing. Before being supplied to the solvent, flue gas must be cooled in addition to any remaining acid gases being removed. This is brought on by the solvent’s increased absorption capacity at lower temperatures. To provide this cooling, the polishing scrubber also serves as a quencher. The flue gas from the quencher/scrubber is cooled to about 37 °C. The semi-rich solvent is cooled by passing in an intercooler and sent back to the absorber regulating its temperature. A water wash is located at the top of the absorber to remove entrained solvents in the flue gas. The clean gas is discharged from the absorber via a fresh stack situated on top of the absorber. A weak link will form between the amine solvent and the dissolved CO2; to break that link, heat energy is required. This process occurs at the top of the packed stripper column at a counter-current flow when the CO2-rich solvent enters it. Low-quality steam is used in the reboiler at the bottom of the stripper as an energy source to evaporate water in the diluted solvent. The level of the water vapor increases in the CO2 stripper, supplying energy to help with amine-solvent regeneration and CO2 stripping. The CO2-free hot-lean (or regenerate) solvent is delivered back to the absorber. The hot-lean solvent is delivered to the rich and lean heat exchanger by recovering the sensible heat and preheating the rich and cool solvent from the absorber. Preheating assists in recovering a portion of the energy used during regeneration, lowering the process’s total energy consumption, particularly during the regeneration stage. The top of the stripper releases a mixture of steam and CO2, which is then transferred to the compressor system, where it is compressed and dehydrated. To compress the CO2 product stream into the pipeline, the compressor is intended. This method uses an intercooler after each of the compression stages. This procedure involves the removal of extra moisture in order to deliver a CO2 product purified to 99% at 2215 psia pressure. Amine solvents are reactive with SO2 and SO3 particles in the flue gas and are sensitive to contaminants. Such reactions pollute the solvent that produces intermediate salts, increasing the need for solvent regeneration and the operating expenses. Therefore, the CO2 capture system is equipped with further SO3 and SO2 removal for extra effective functioning, which is accomplished by passing the flue gas through a caustic scrubber. This scrubber utilizes a 10% (by weight) caustic soda (NaOH) solution to eliminate leftover acid gases. The scrubber reduces the flue gas to about 1 ppmv SO2 by passing it through a counter-current packed column with a recirculated NaOH solution. As the caustic solution is recycled, residual particles, water, sulfates, and other soluble components will accumulate; as a result, a backwash stream is necessary to lower the pollutant concentrations and total liquid volume. The energy required for the capture process is for solvent regeneration, solvent pumps, flue gas blower, cooling water pumps, and CO2 compression, resulting in a 7.9% energy penalty [56]. The thermal energy demand for CO2 recovery is lowered by 9% compared to KS-1TM [57]. By attaching the CCS system to the power plant, other resource (such as water, chemicals, and reagents), as well as environmental emissions in the form of solid waste, liquid waste, and air pollutants that the CCS system does not collect will be released [17].
Table 3 summarizes the projected CO2 capture facility requirements and estimated utility consumption for 90% capture efficiency.

2.3. Life Cycle Impact Assessment Model

Figure 5 represents the life cycle boundaries of the proposed two cases in this study, which are designed for the LCA analysis in SimaPro software.
Global warming potentials (GWPs) are utilized as characterization elements to analyze and combine the interventions for the climate change impact category (referred to as “increased greenhouse effect”) [59], as expressed by the following equations:
C l i m a t e   c h a n g e = i G W P i × m i
where m i (kg) is the mass of the element i released and G W P i is the global warming potential of the element indicator. Climate Change is expressed in kg CO2 equivalent. To compare the consequences of emissions, each greenhouse gas is assigned a global warming potential (GWP) index.
The GWP index compares the increased infrared absorption of carbon dioxide caused by the instantaneous release of 1 kg of the element to that caused by an equal instantaneous emission of CO2 combined with integration over time value:
G W P T , i = 0 T a i c i t d t 0 T a C O 2 c C O 2 t d t
where a i is the rise in greenhouse gas i concentration’s radiative forcing (w.m−2∙kg). c i t is the concentration of GHG i at time t after the release of (kg∙m−3), and T is the duration of integration (year). GWP integrates fate-related factors and measures an element’s potential impact on climate change. It only gives an overall idea of the potential climatic effects of such emissions because these depend not only on total atmospheric heat absorption but also on how that heat is distributed over time. As a baseline method of characterizing climate change, the GWPs for 100 years are recommended [60]. The intake of a pollutant is significant for the midpoint characterization factors of human health damage from PM2.5, since the consequence and damage are precursor element-independent. The primary PM2.5 equivalents of particulate matter formation potentials (PMFP) are calculated by dividing iFx,i by the emission-weighted global average iF of PM2.5:
P M F P x ,   j = i F x ,   i   i F p m 2.5   w o r l d  
.
The sum of the changes in the intake rate of PM2.5 in each receiving area j as a result of a change in the emission of a precursor element in region i was used to establish the region-specific intake fraction (dMx,i) [61]. The population (Nj) in the receptor area i, the average breathing rate per each person (BR), and the change in PM2.5 concentration in each receptor area (dCk,j) can all be used to compute the intake rate:
i F x ,   i   = j d C j . N j . B R d M x , i
.
Since the effect is precursor element-independent, the pollutant’s fate in the soil and atmosphere is significant for the characterization of the midpoint for the terrestrial ecosystem damage caused by acidification emissions [62]. According to the precursor x, the acidification fate factor (FF) brought on by emissions in grid i is calculated (FFx,i). By dividing FFx,i by the emission-weighted global average FF of SO2, the acidification potential (AP), expressed in kg SO2 equivalents, is determined by:
A P x , i = F F x , i F F SO 2 , world   average
.

3. Data Inventories

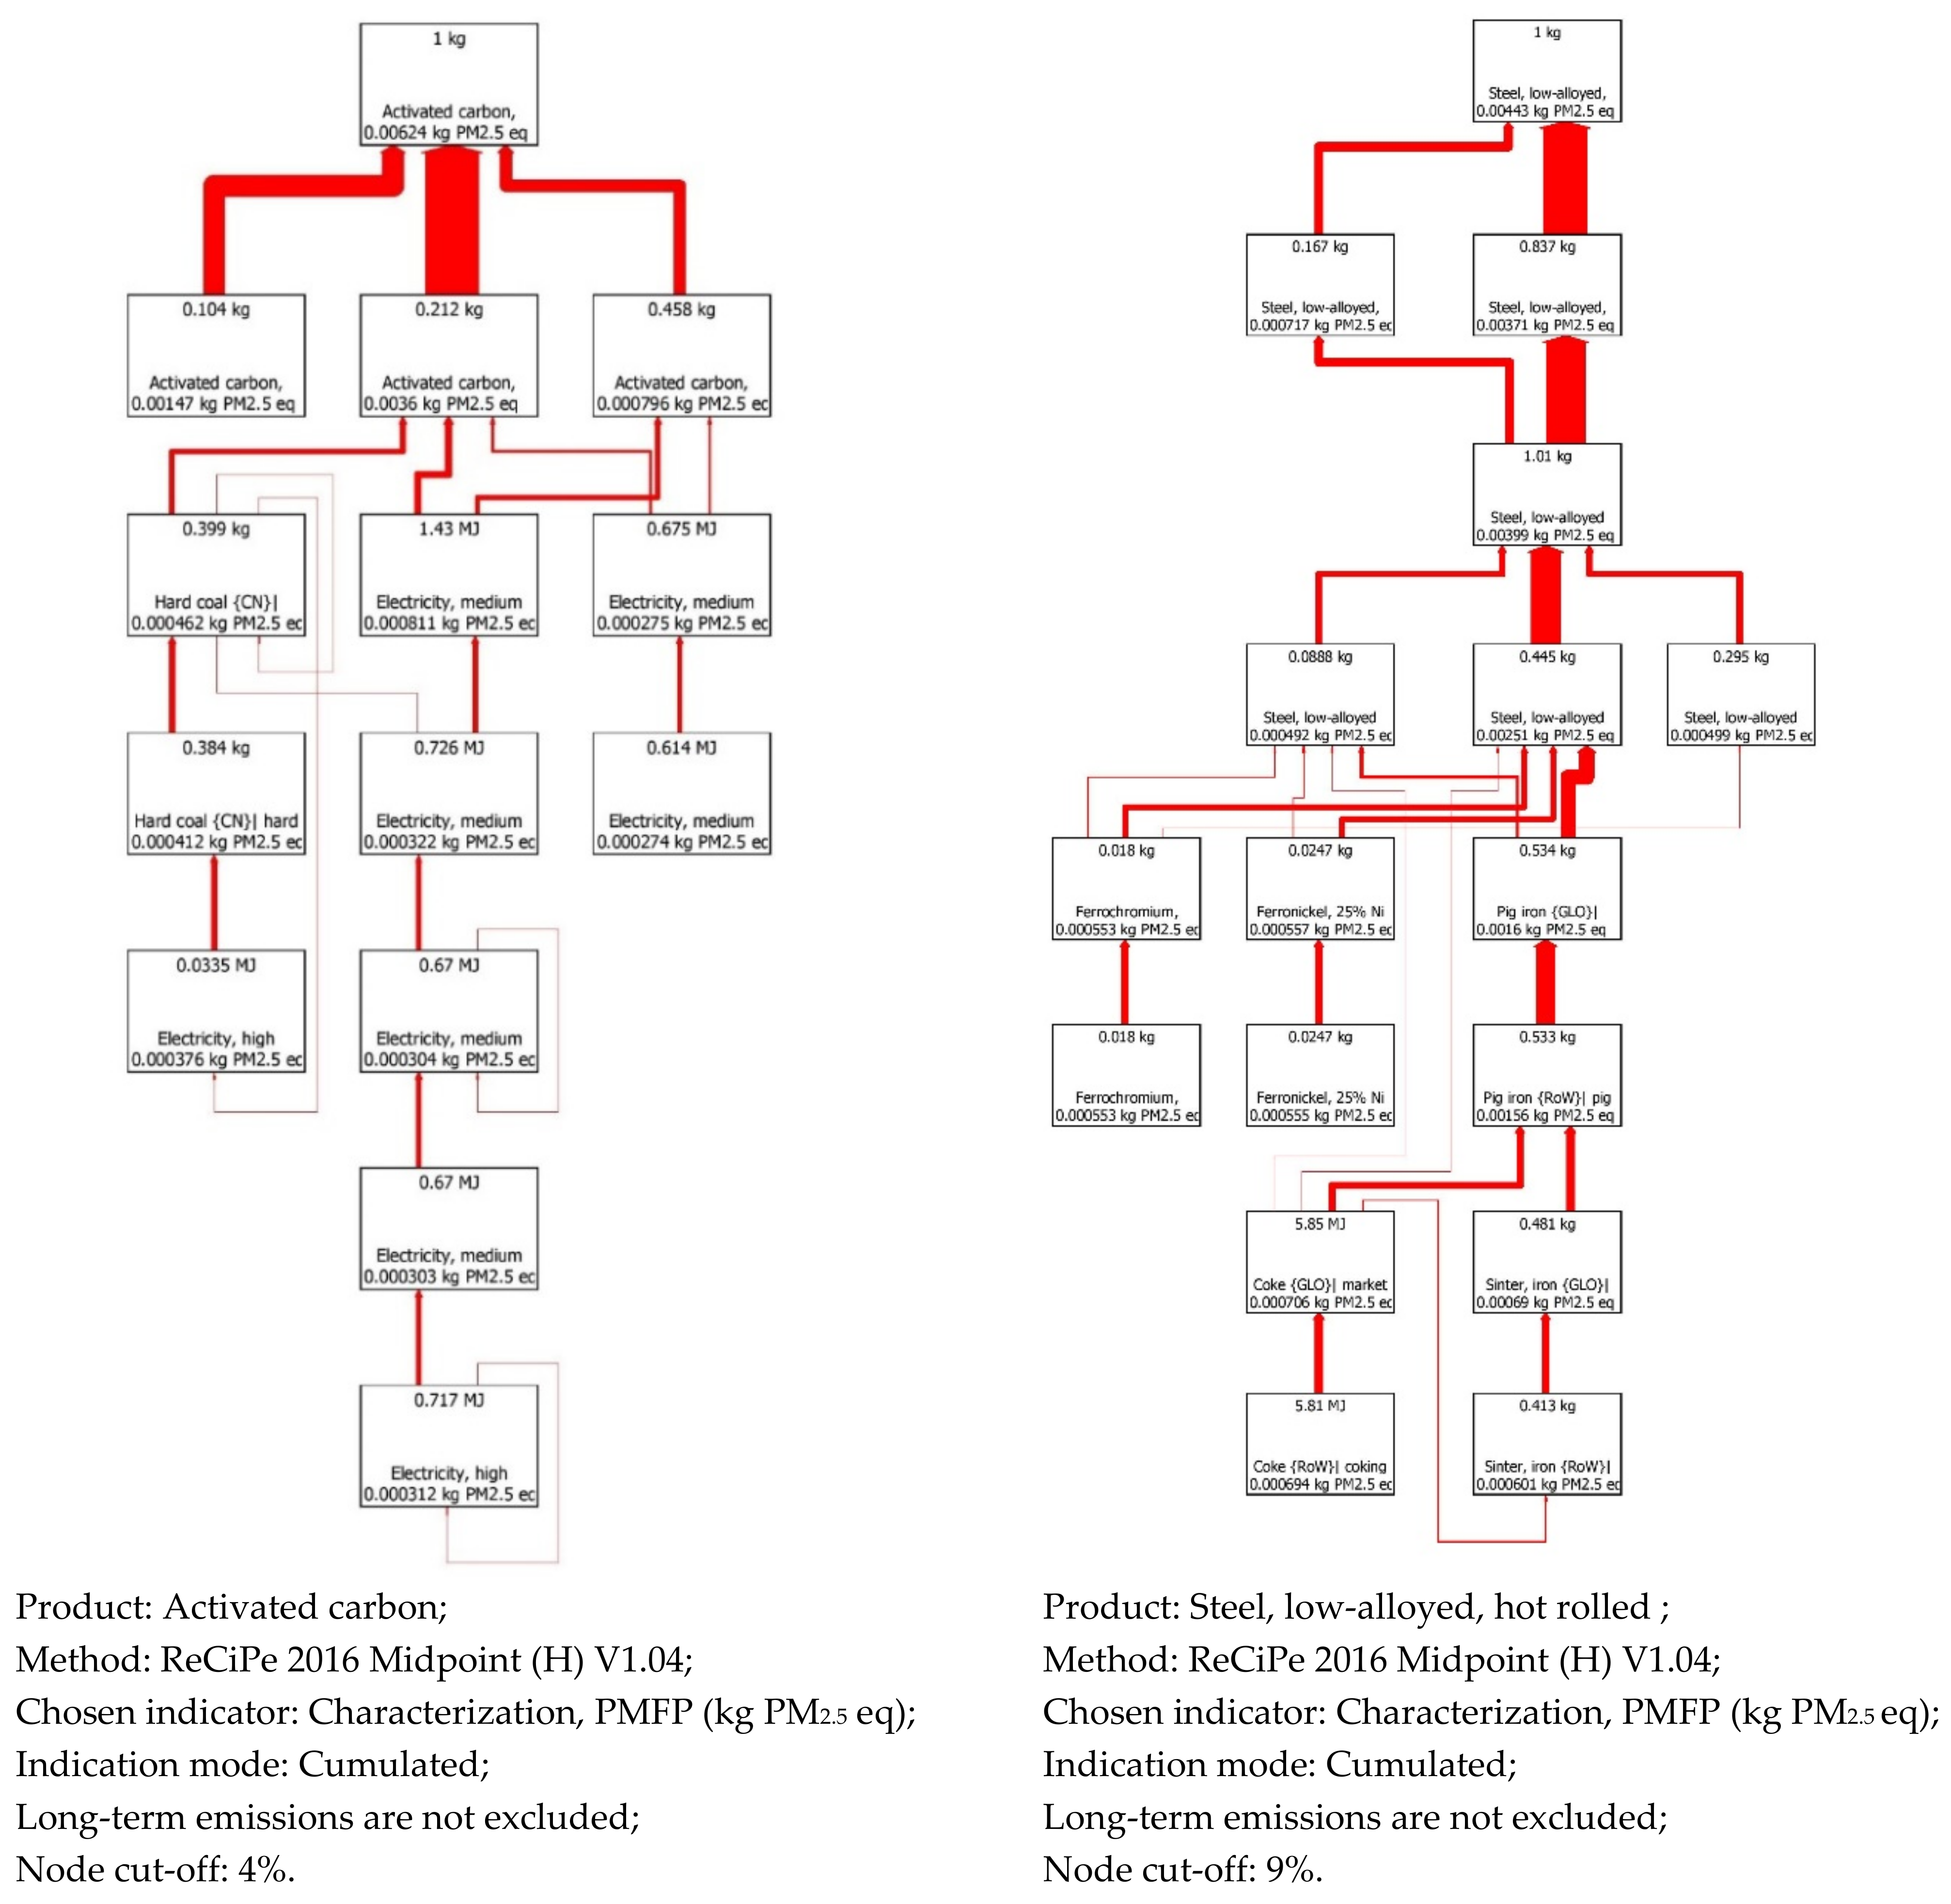
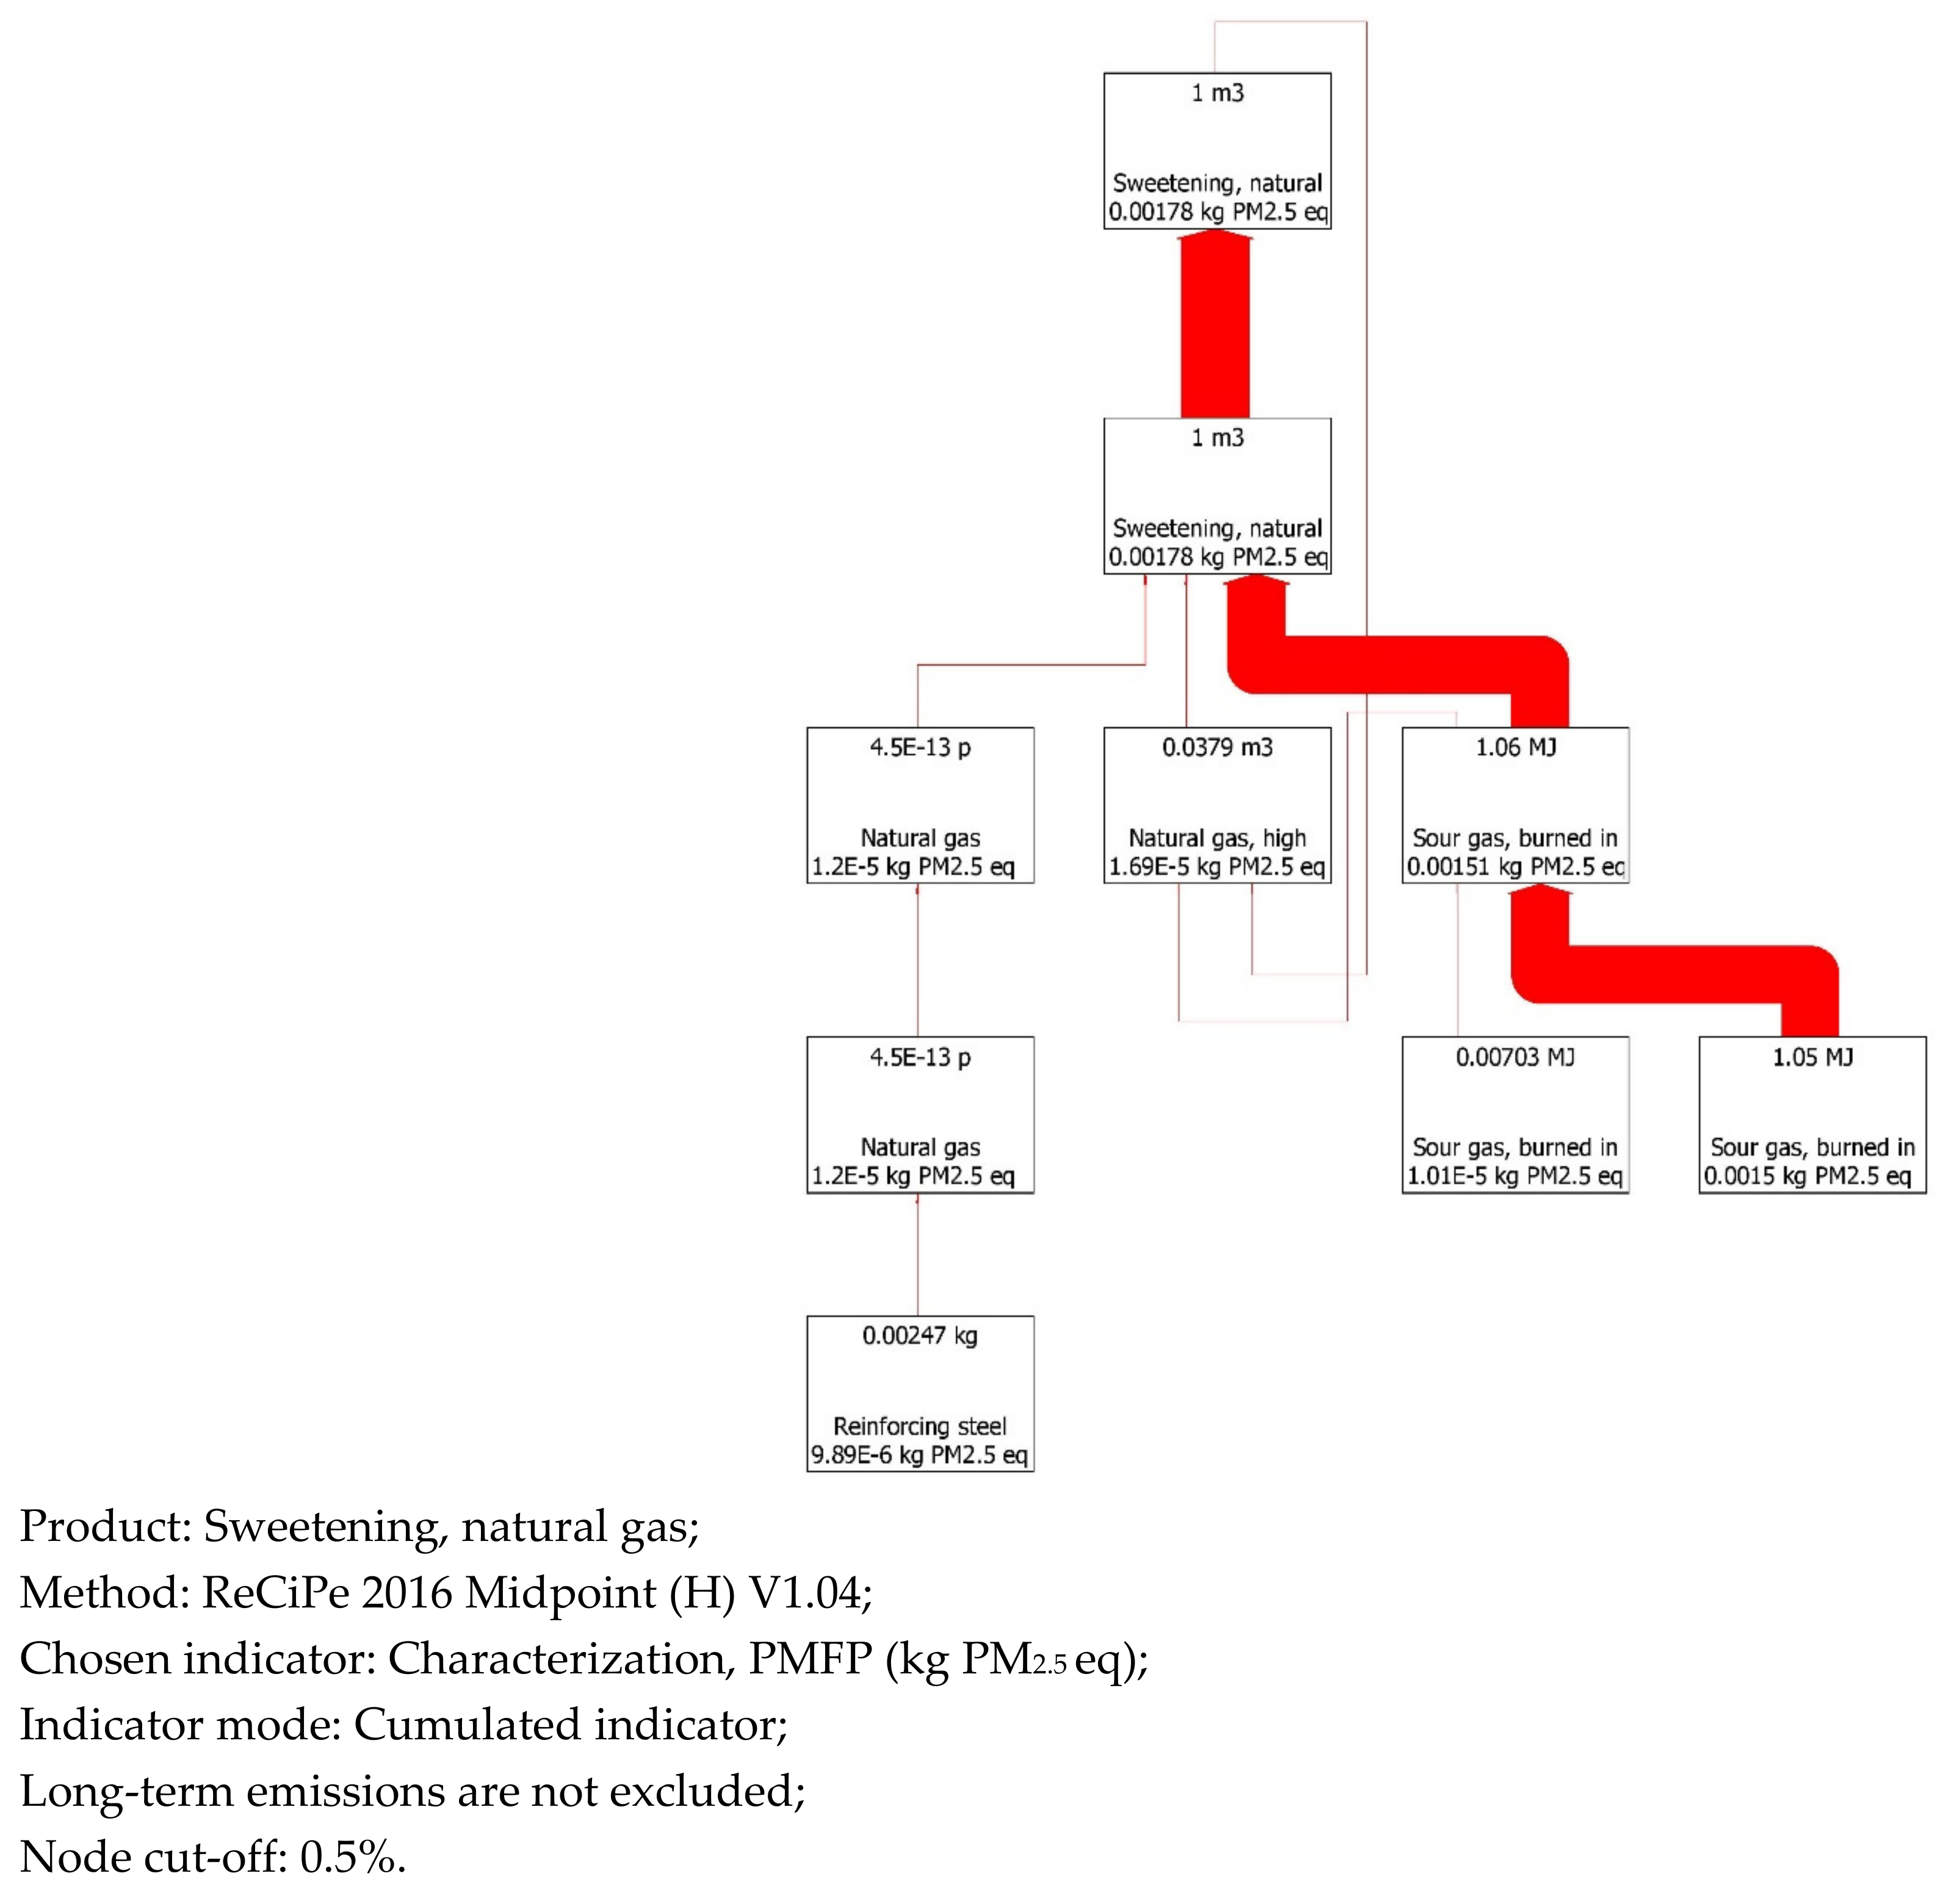
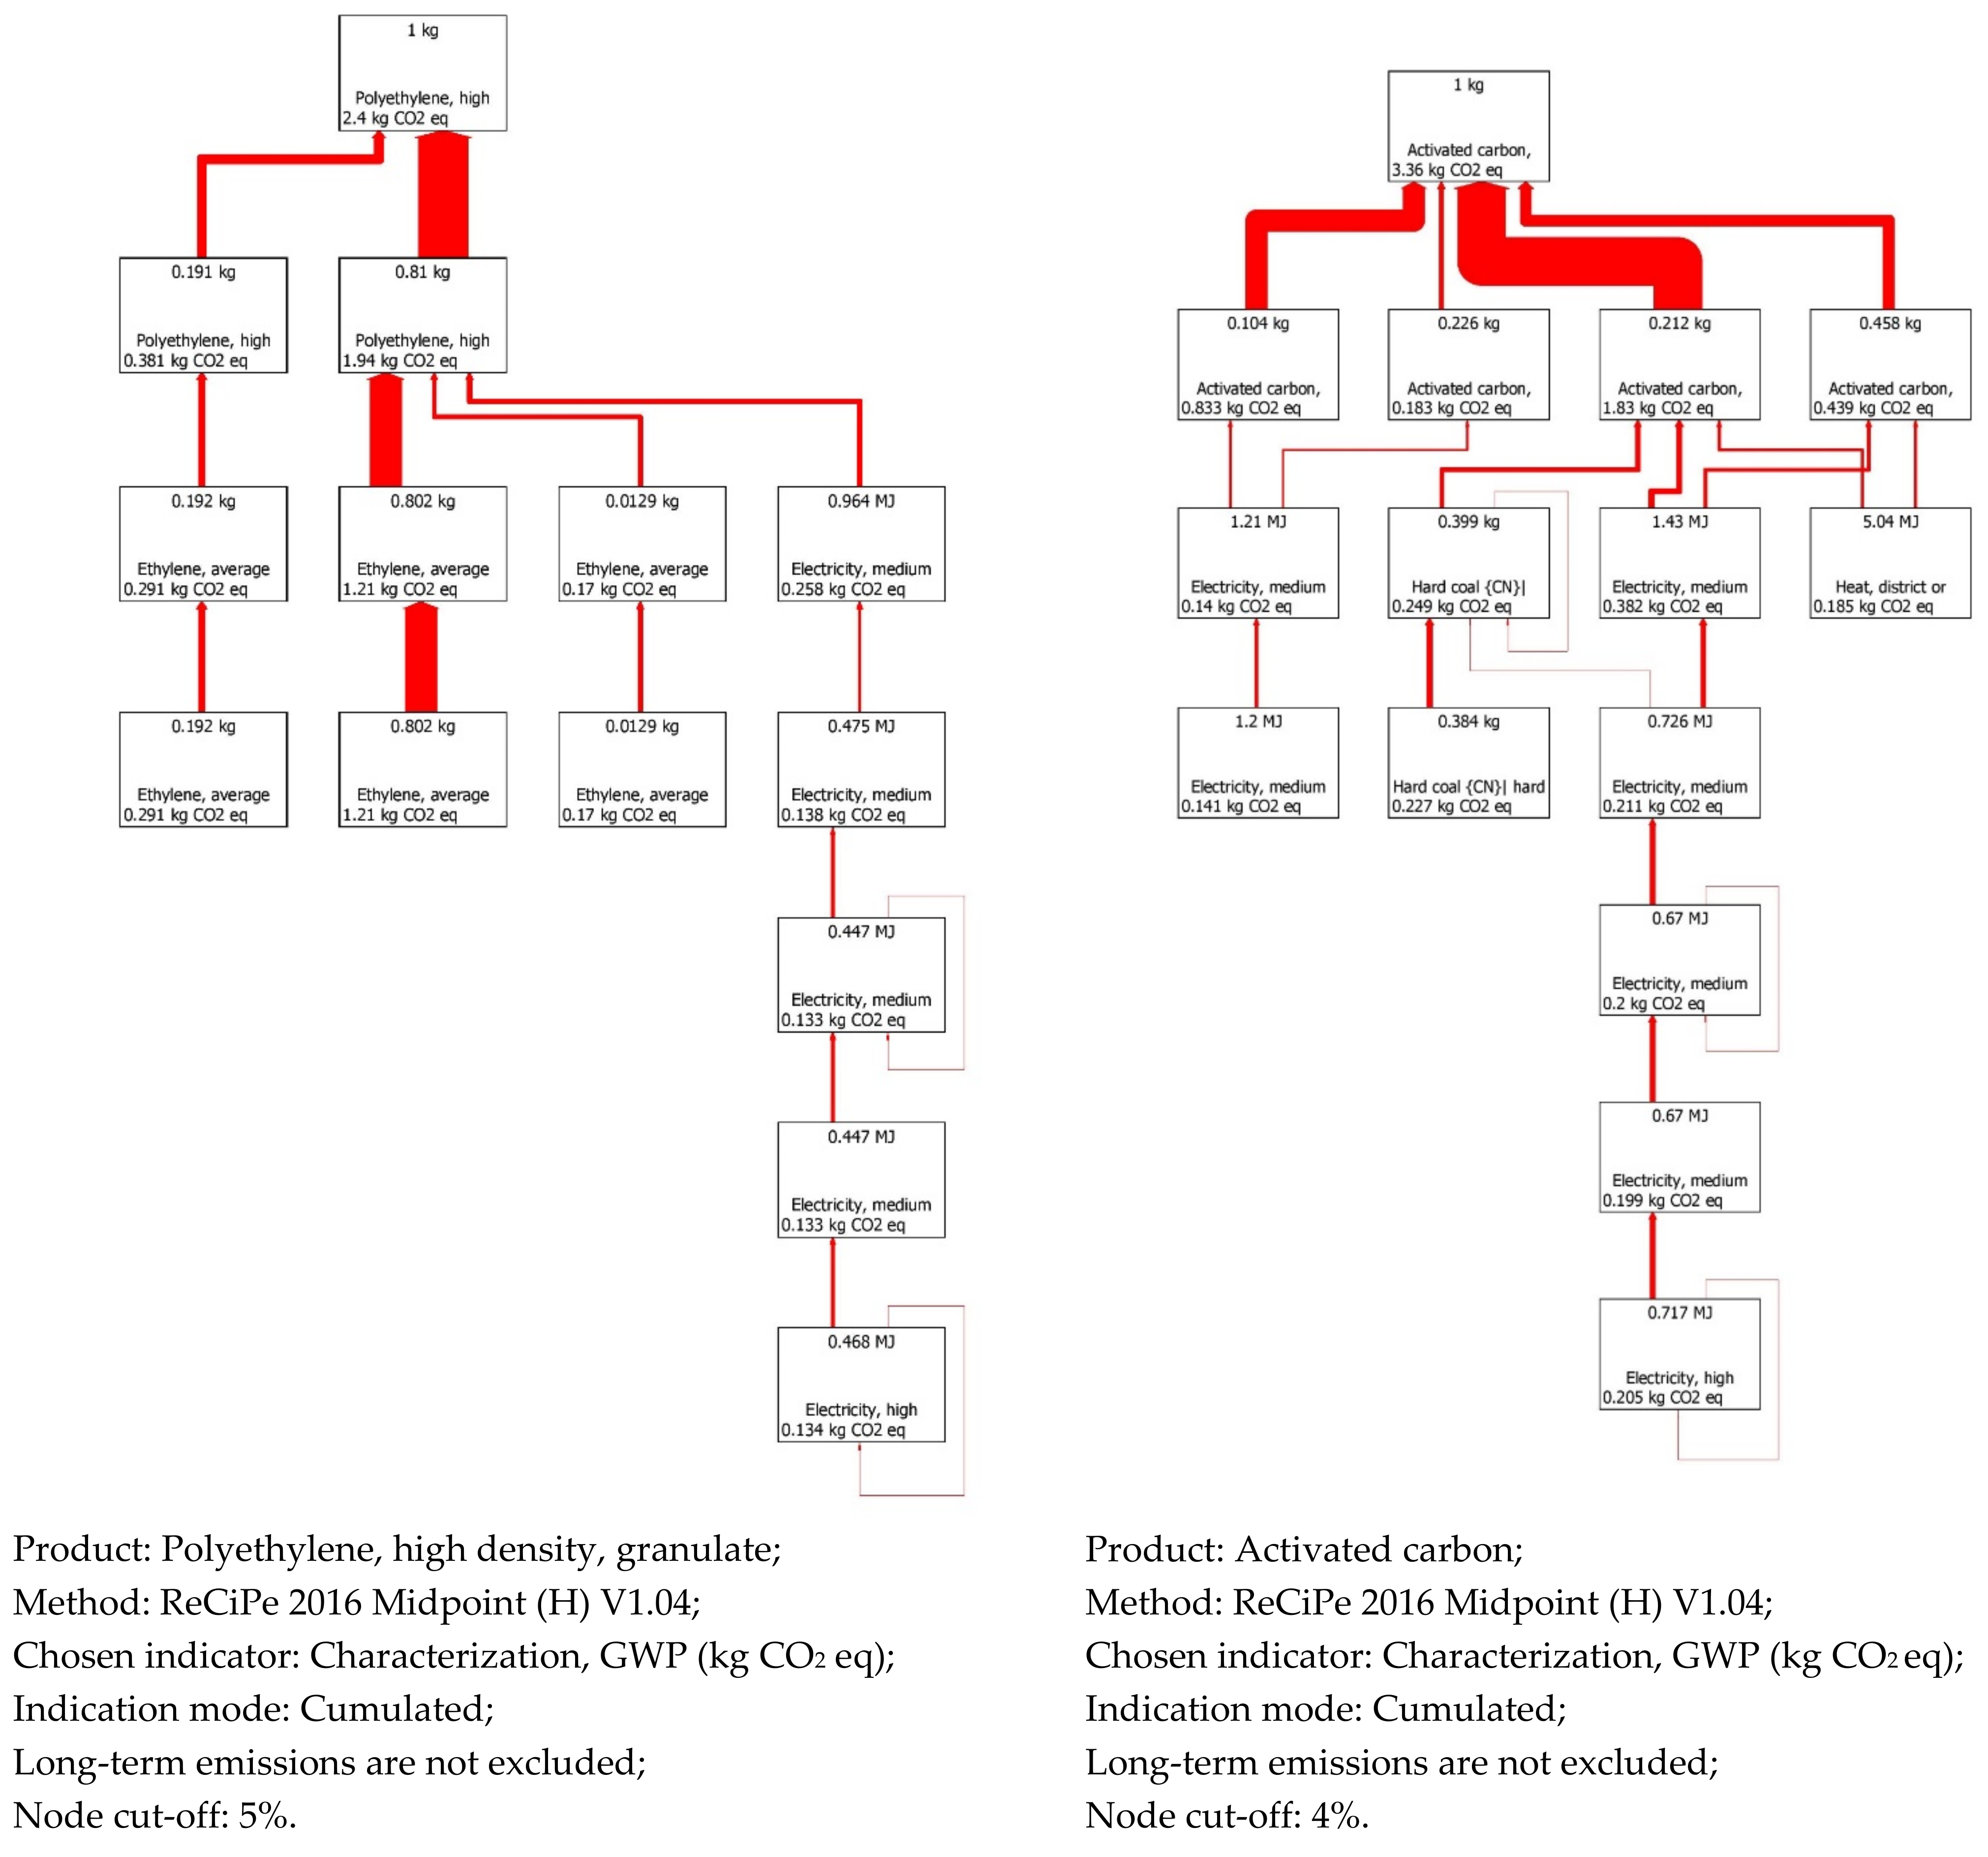
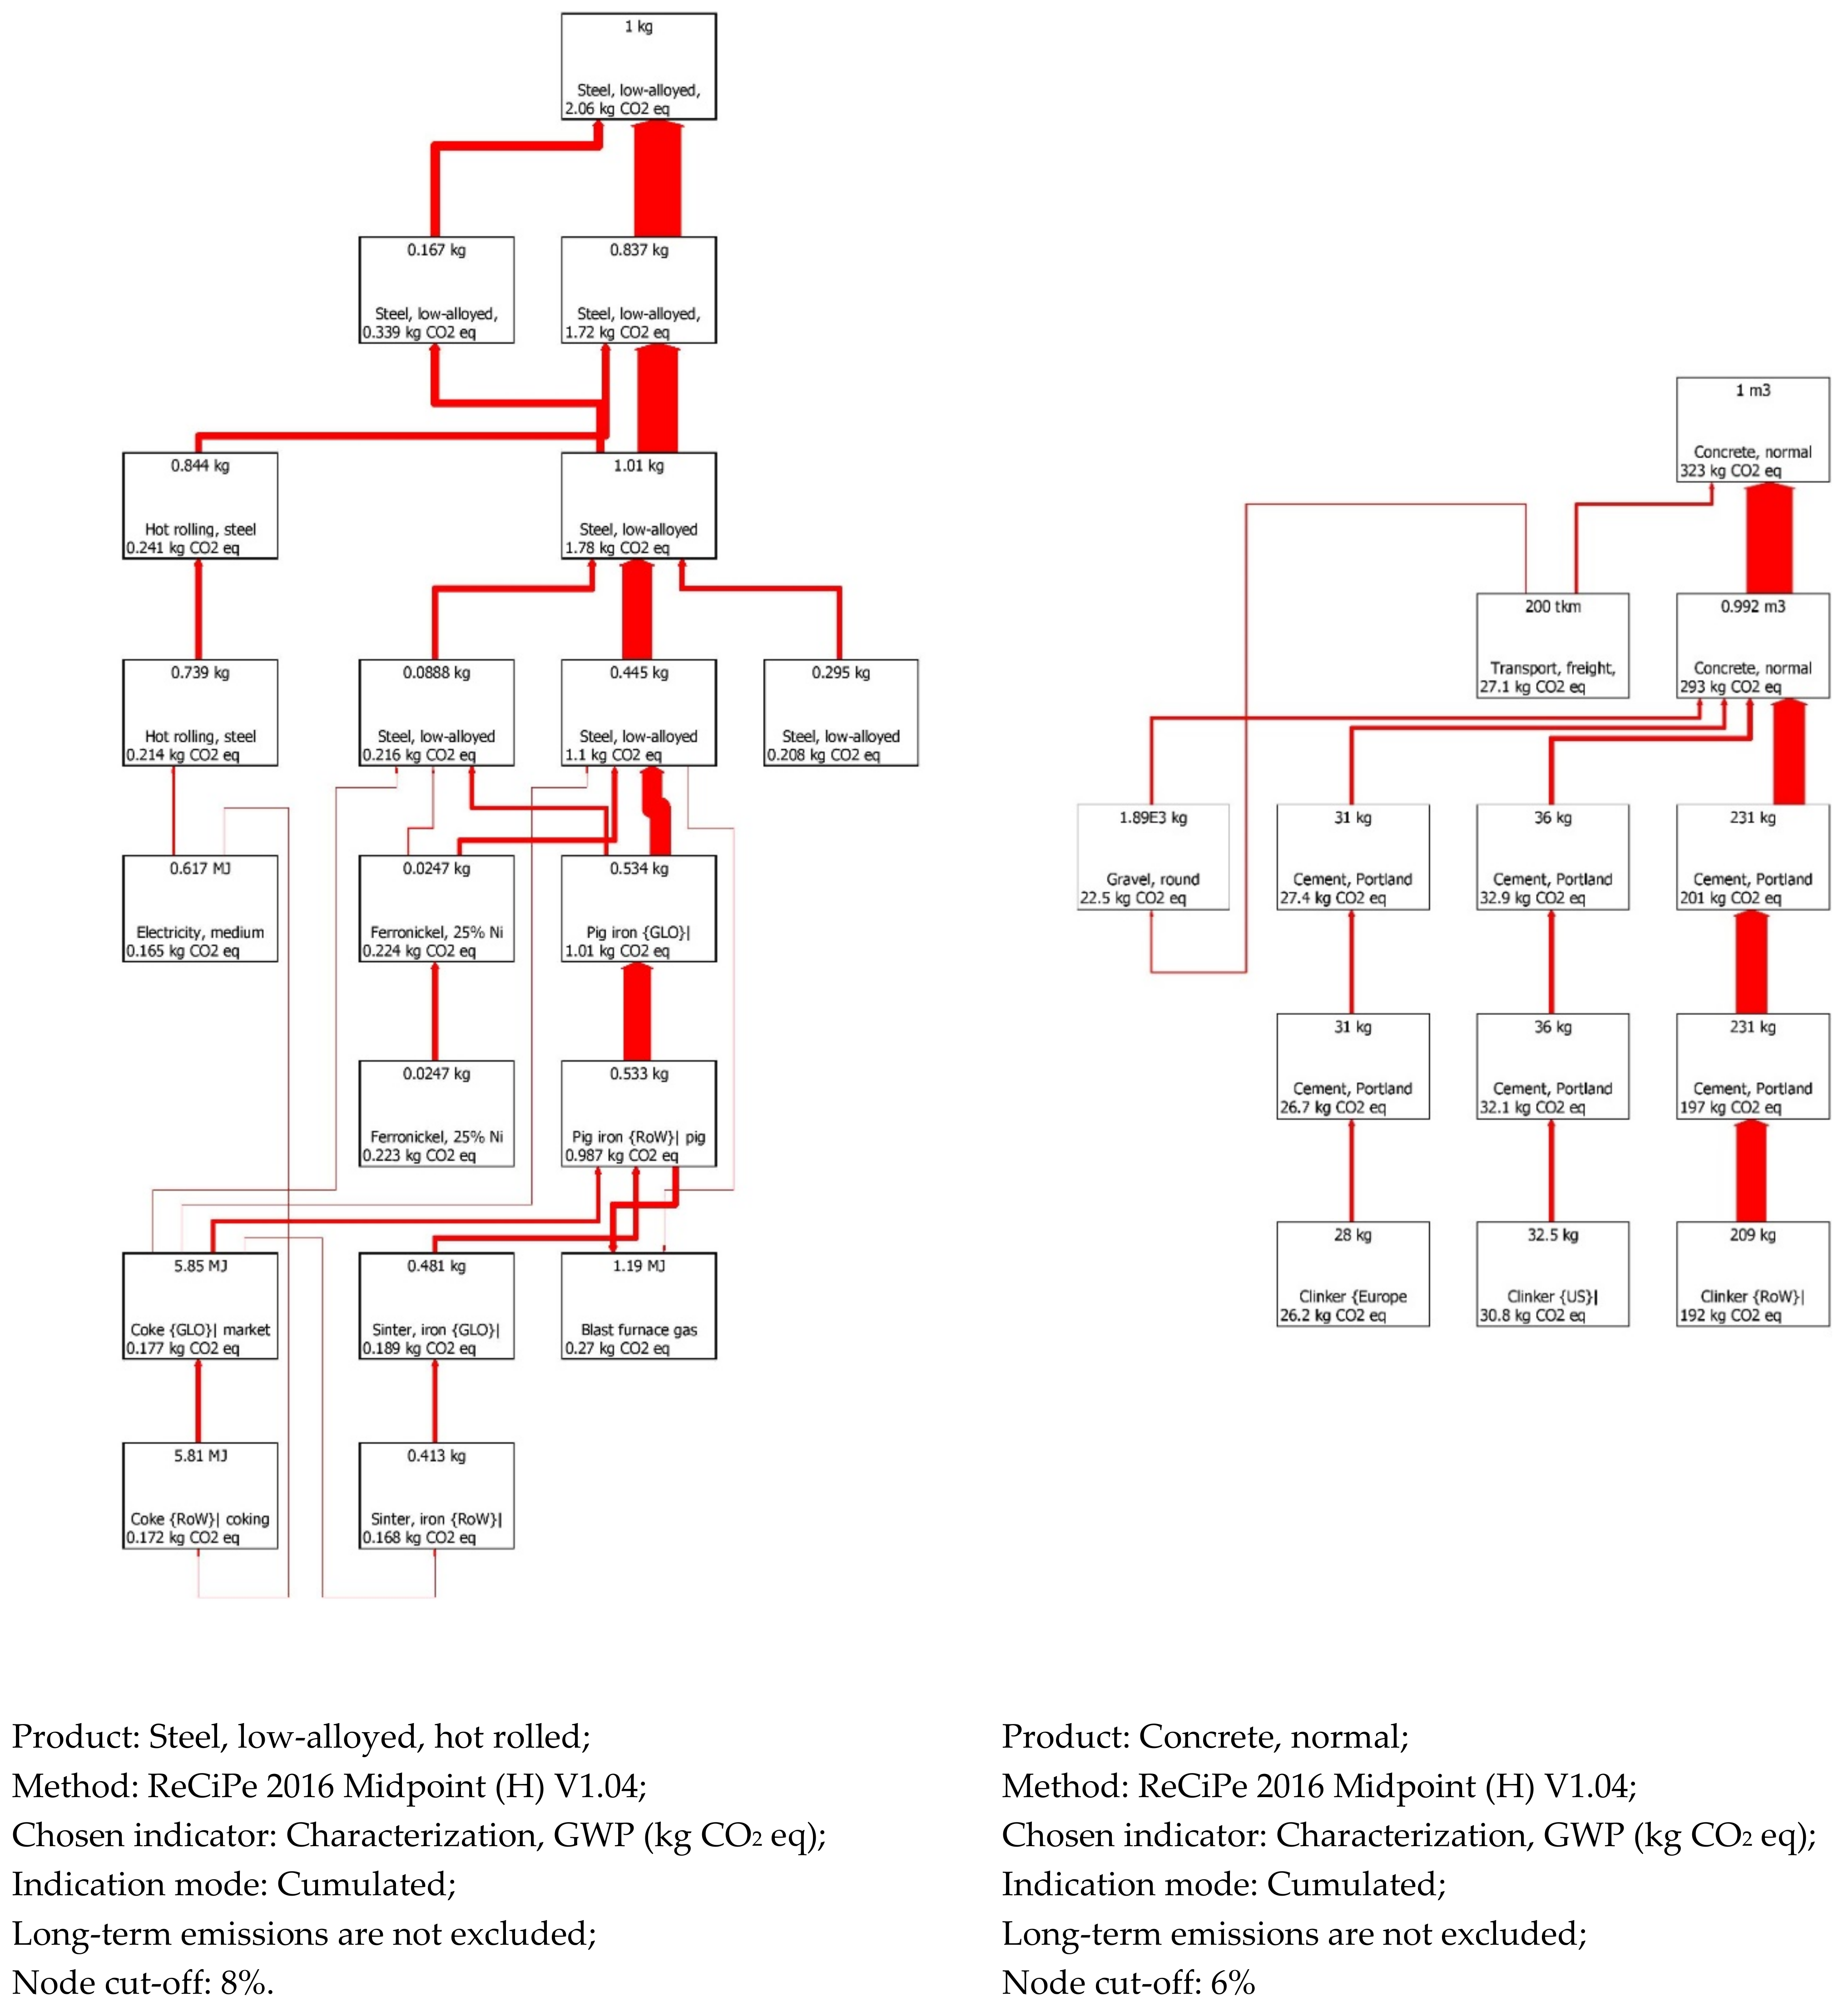
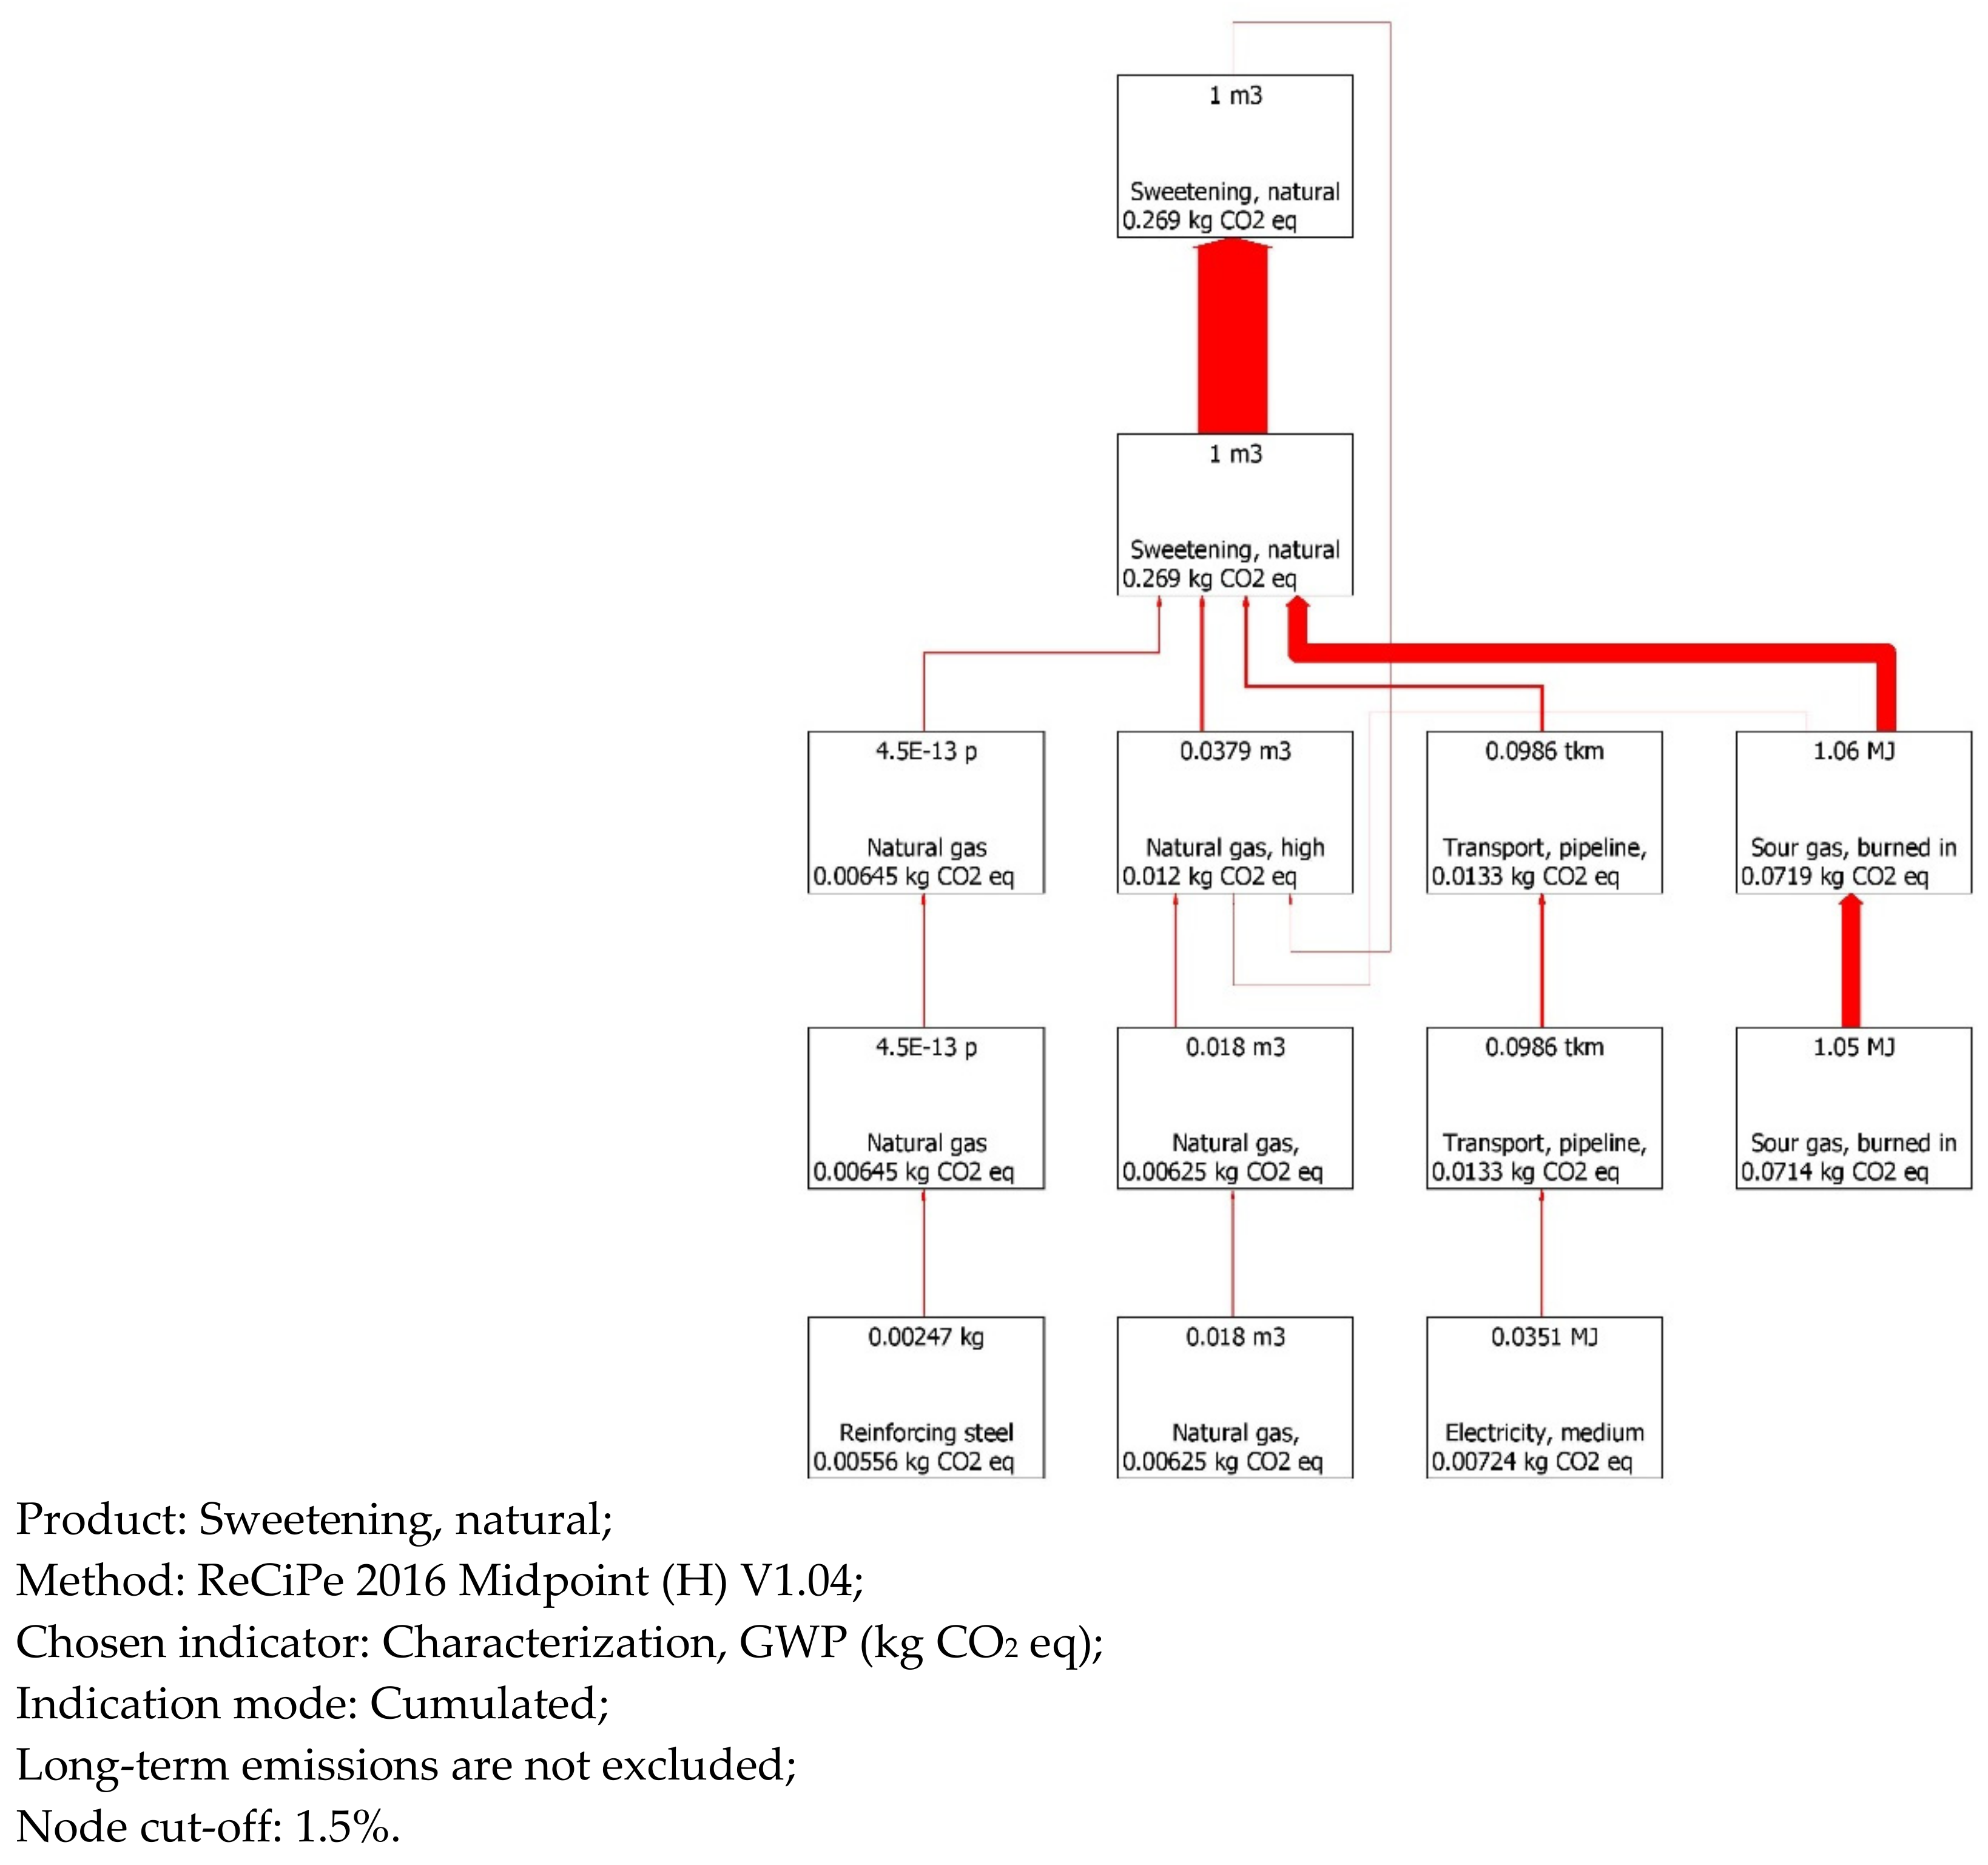
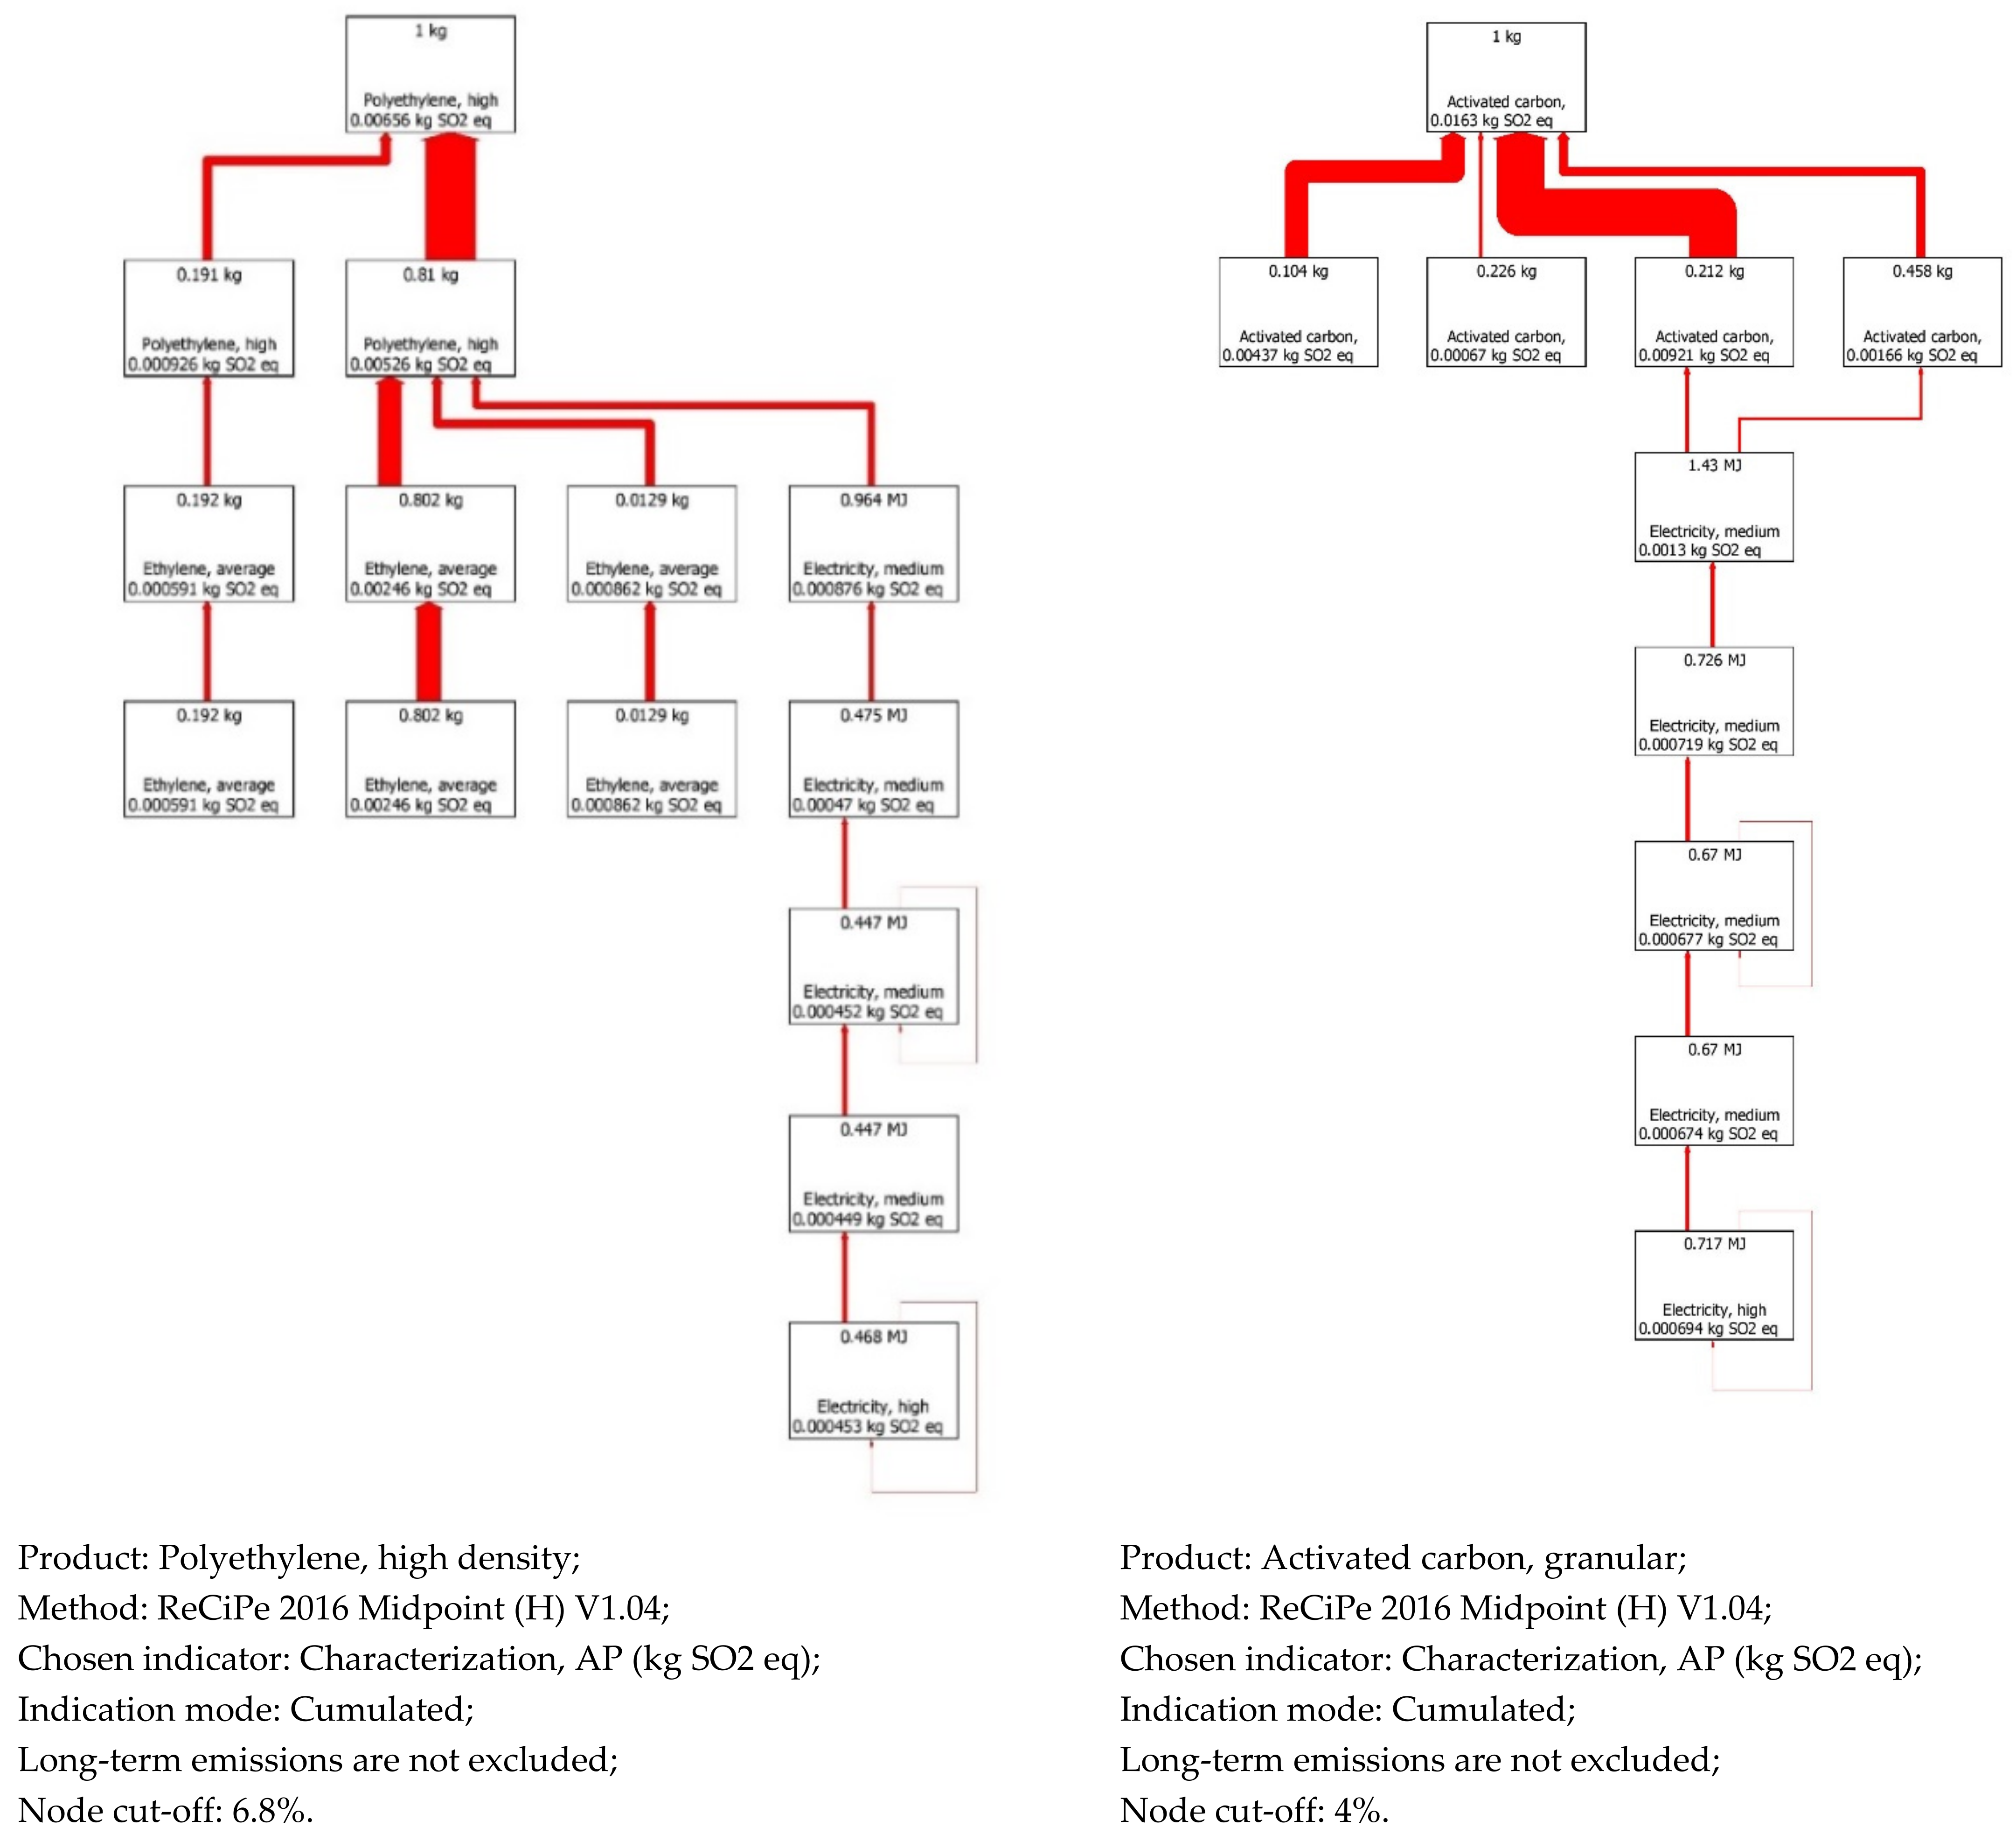
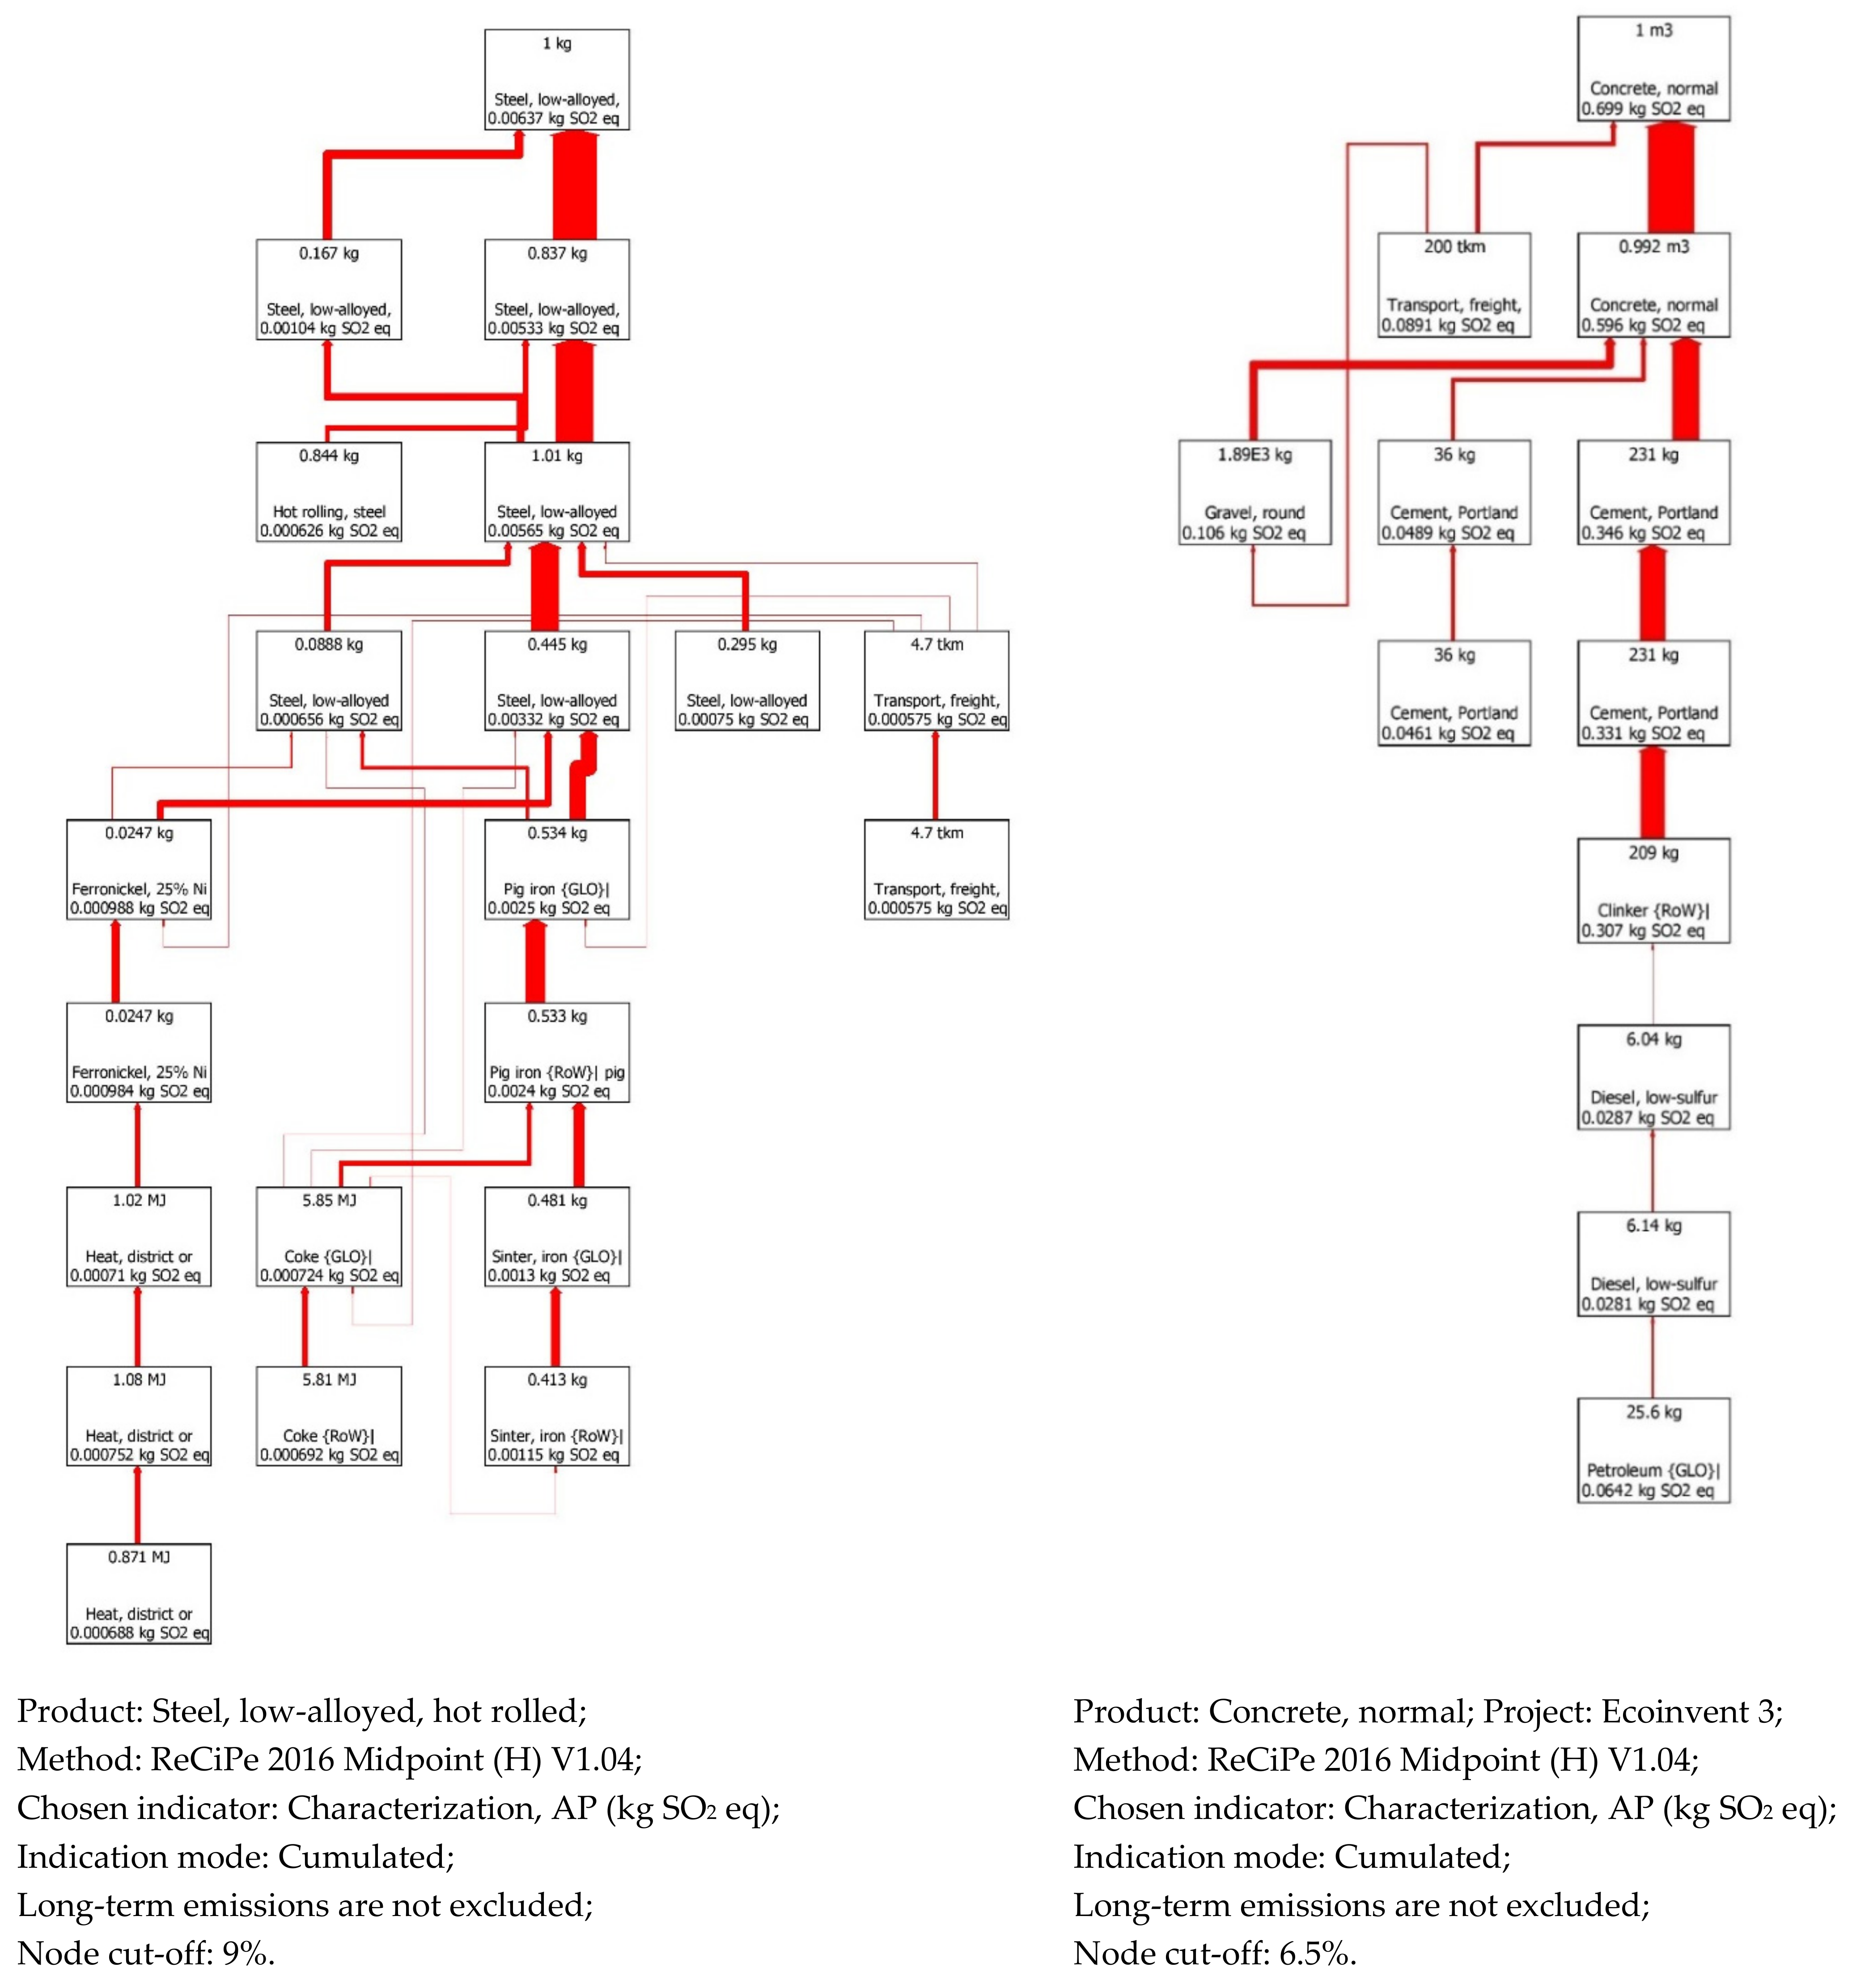
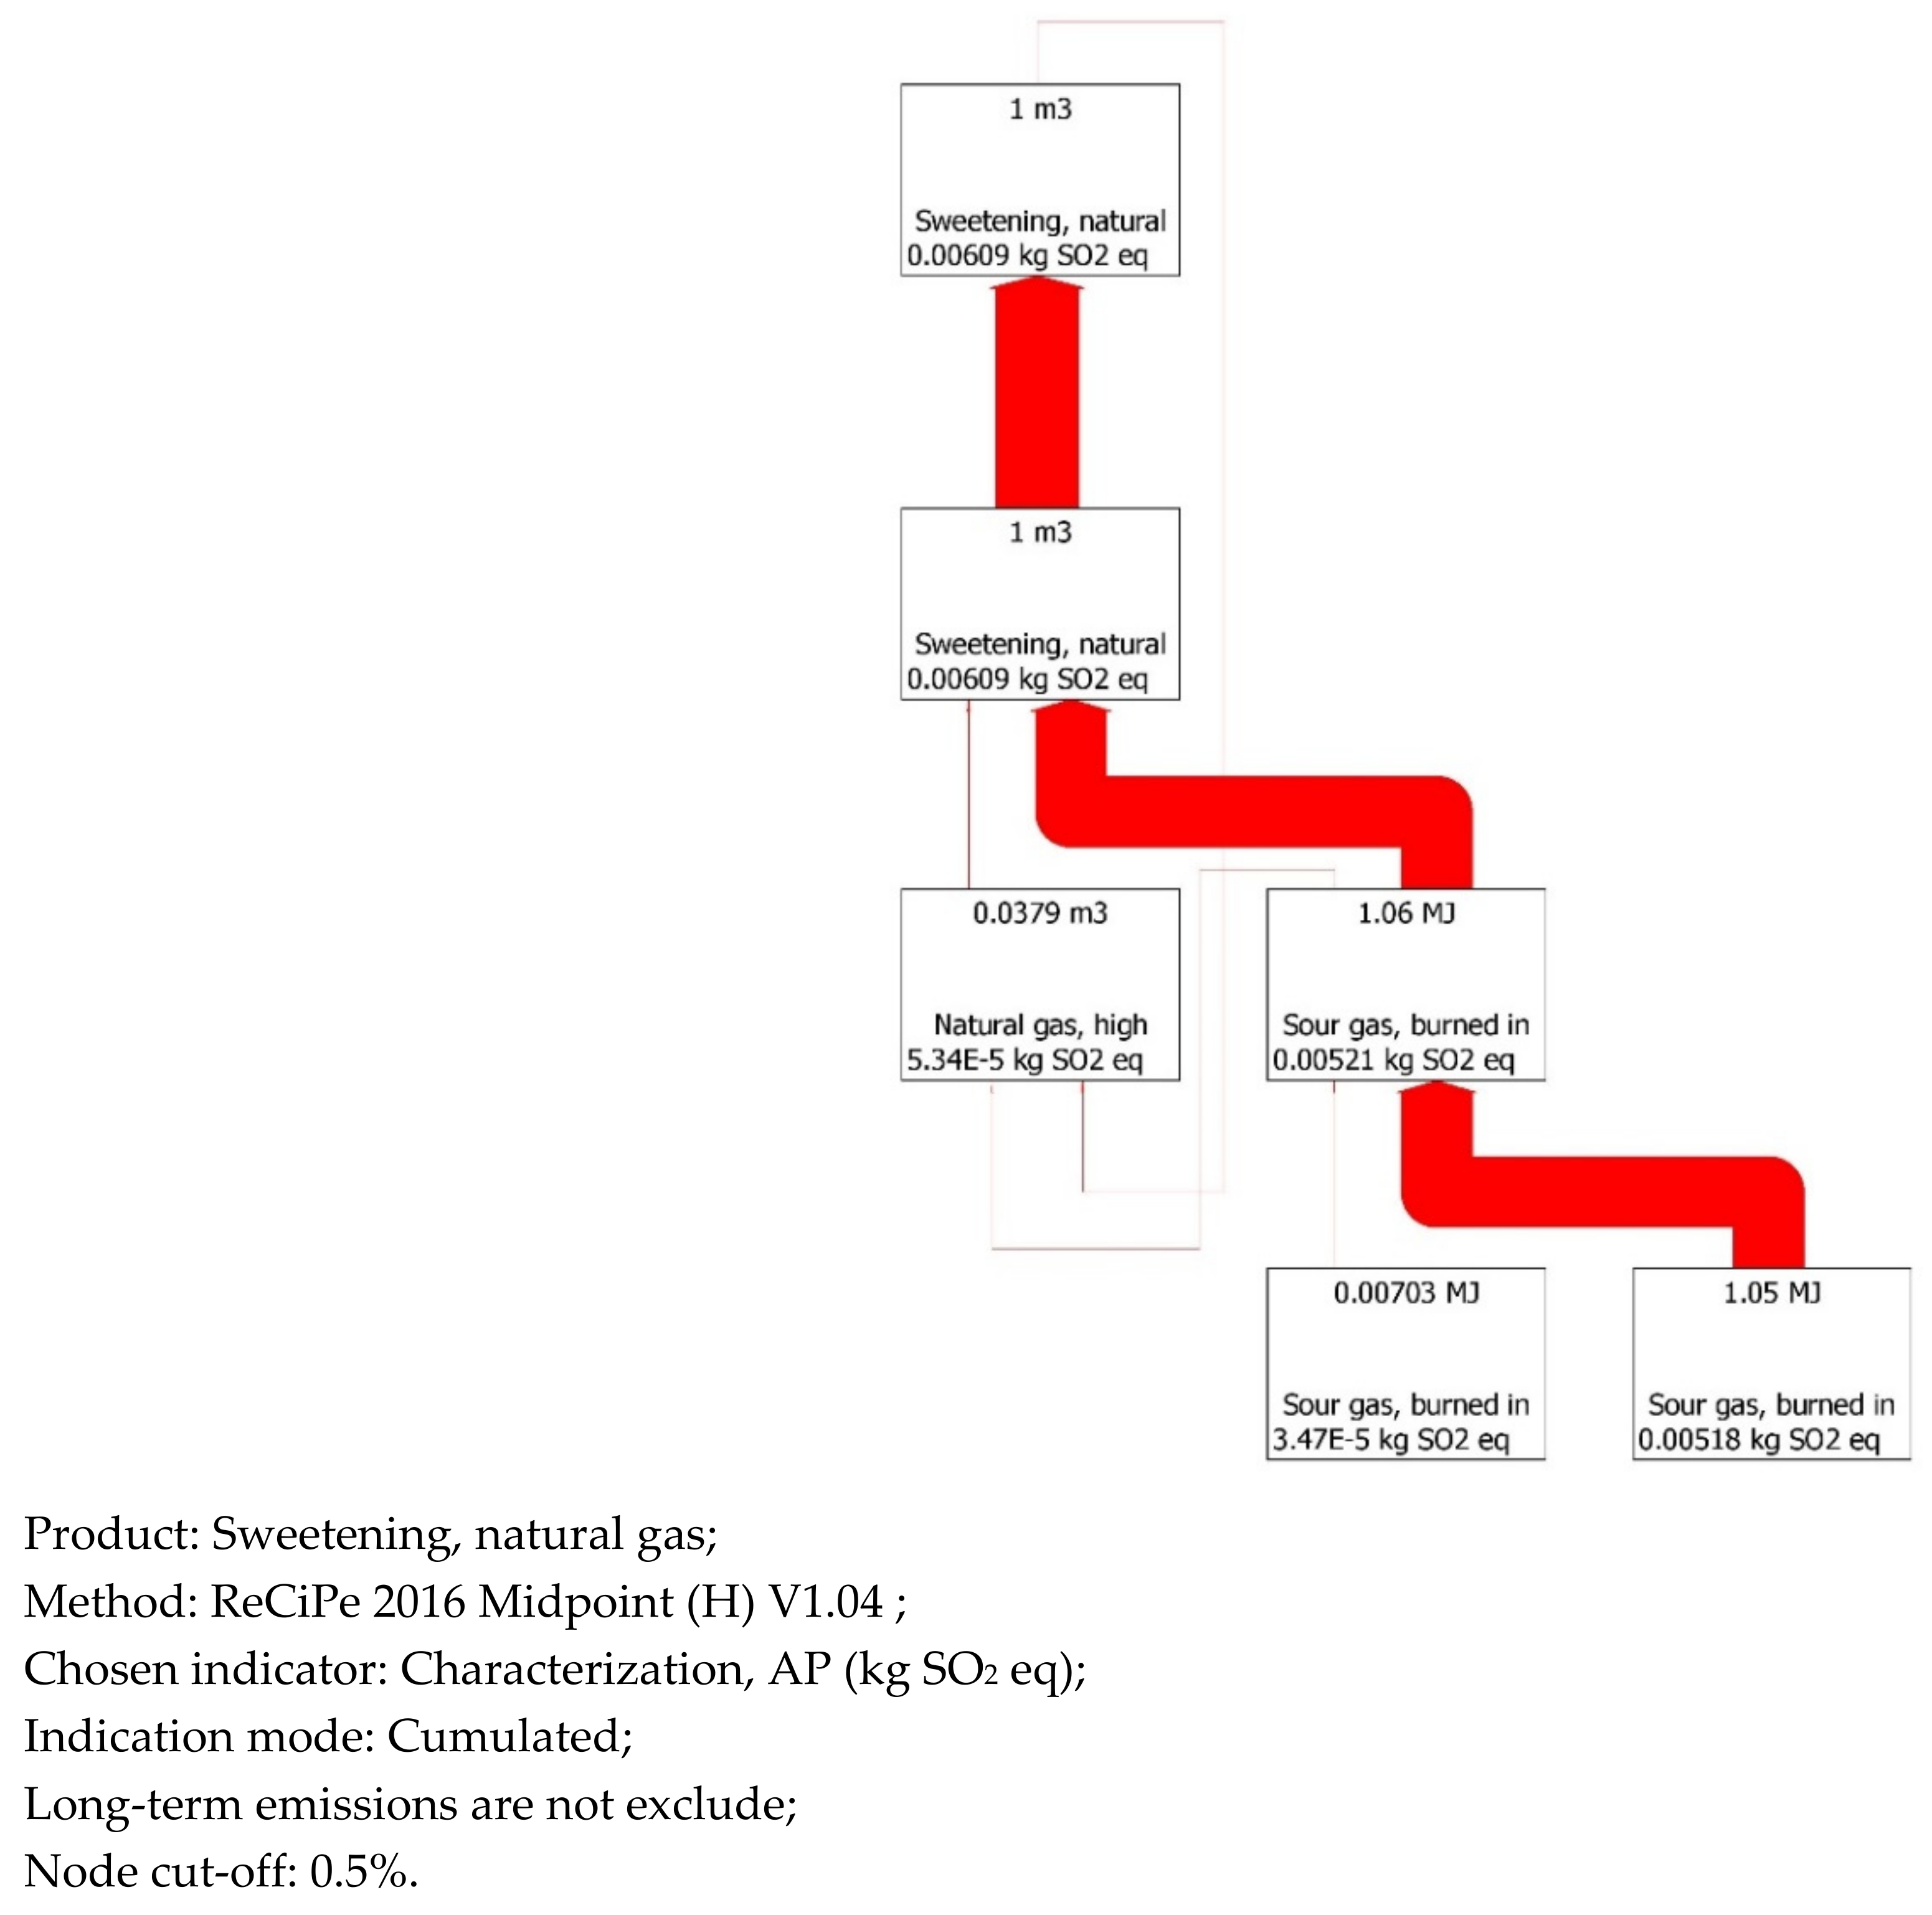
Characterization and quantification of material, energy, and emission input and output flow inside the specified system boundary are crucial elements in the gathering and processing of LCI data. As explained before, an amine-based commercially existing technology known as KM-CR Process by Mitsubishi Heavy Industries (MHI) using the KS-1TM solvent is considered as the foundation for the capture technology with 90% capture, treating 100% of flue gas [63]. In this study, the Ecoinvent database [64] was used to inventory the construction, operation, and electricity generation processes. Table 4 represents the basic components used in the LCA. The available data inventory structural flows used in the database are shown in Figure A1, Figure A2 and Figure A3 in Appendix A.

4. Results and Discussions

4.1. MEA Capture Unit Simulation Results

The detailed process simulation of the proposed MEA capture process was performed using the Integrated Environmental Control Model (IECM) software developed by Carnegie Mellon University [71]. Table 5 summarizes the simulation outcomes of the CO2 capture plant in this study. For this LCA estimation, the reliability of secondary data from the IECM software is assessed based on real data from the power plant and literature citations. Data for operational and stack characteristics at the Al-Hartha power plant were collected from the technical visit, and detailed information was given in [49]. The following are some of the primary outputs of the proposed performance model for the amine system in the Hartha power plant with a net power capacity of 371 MW: (1) MEA requirement: exhaust gas CO2 mass flow rate, MEA concentration, and CO2 capture efficiency. To purify the flue gas from impurities such as NO2, SOx and acid gases, an extra loss in solvent might occur relative to the contamination level [72]. (2) Energy requirements: the heat required for solvent recovery is determined by the lean sorbent loading. Additionally, the compression of CO2 products, circulation of solvent, as well as other system requirements demand an amount of electrical energy. (3) Emissions into the environment: the model accounts for the CO2 control system’s production of many additional waste products, primarily ammonia gas (produced by the breakdown of monoethanolamine) and possibly hazardous solid waste at the bottom of the reclaimer generated from the recovery process of spent sorbent. On the other hand, the CO2 capture technique also reduces emissions of PM and HCl, NO2, and SO2.

4.2. LCA Analysis Results

The SimaPro 9.1.0.11 software was used to perform the LCA in this study. The impact scores are calculated for the three environmental impacts under study, which are: the global warming potential (GWP), particulate matter formation potential (PMFP), and acidification potential (AP), using three different life cycle impact assessment (LCIA) methods shown in Table 6. Regionalized characterization factors (CFs) of air pollution developed by [61] were used for the impact assessment stage of an environmental life cycle assessment as in Equation (3). In order to derive the regionally-specific damage factors and effects, background concentrations, mortality rates, and years of life lost data have been used [61]. The recommended average breathing rate (BR) of 13 m3/d has been used based on [73]. Population data were collected from [74]. The two examined scenarios of grassroots and retrofit design and their contributions to the selected category with an expansion on the modeling findings, similarities from the literature with sensitivity analysis are analyzed as shown in Table 6.

4.2.1. Global Warming Potential (GWP)

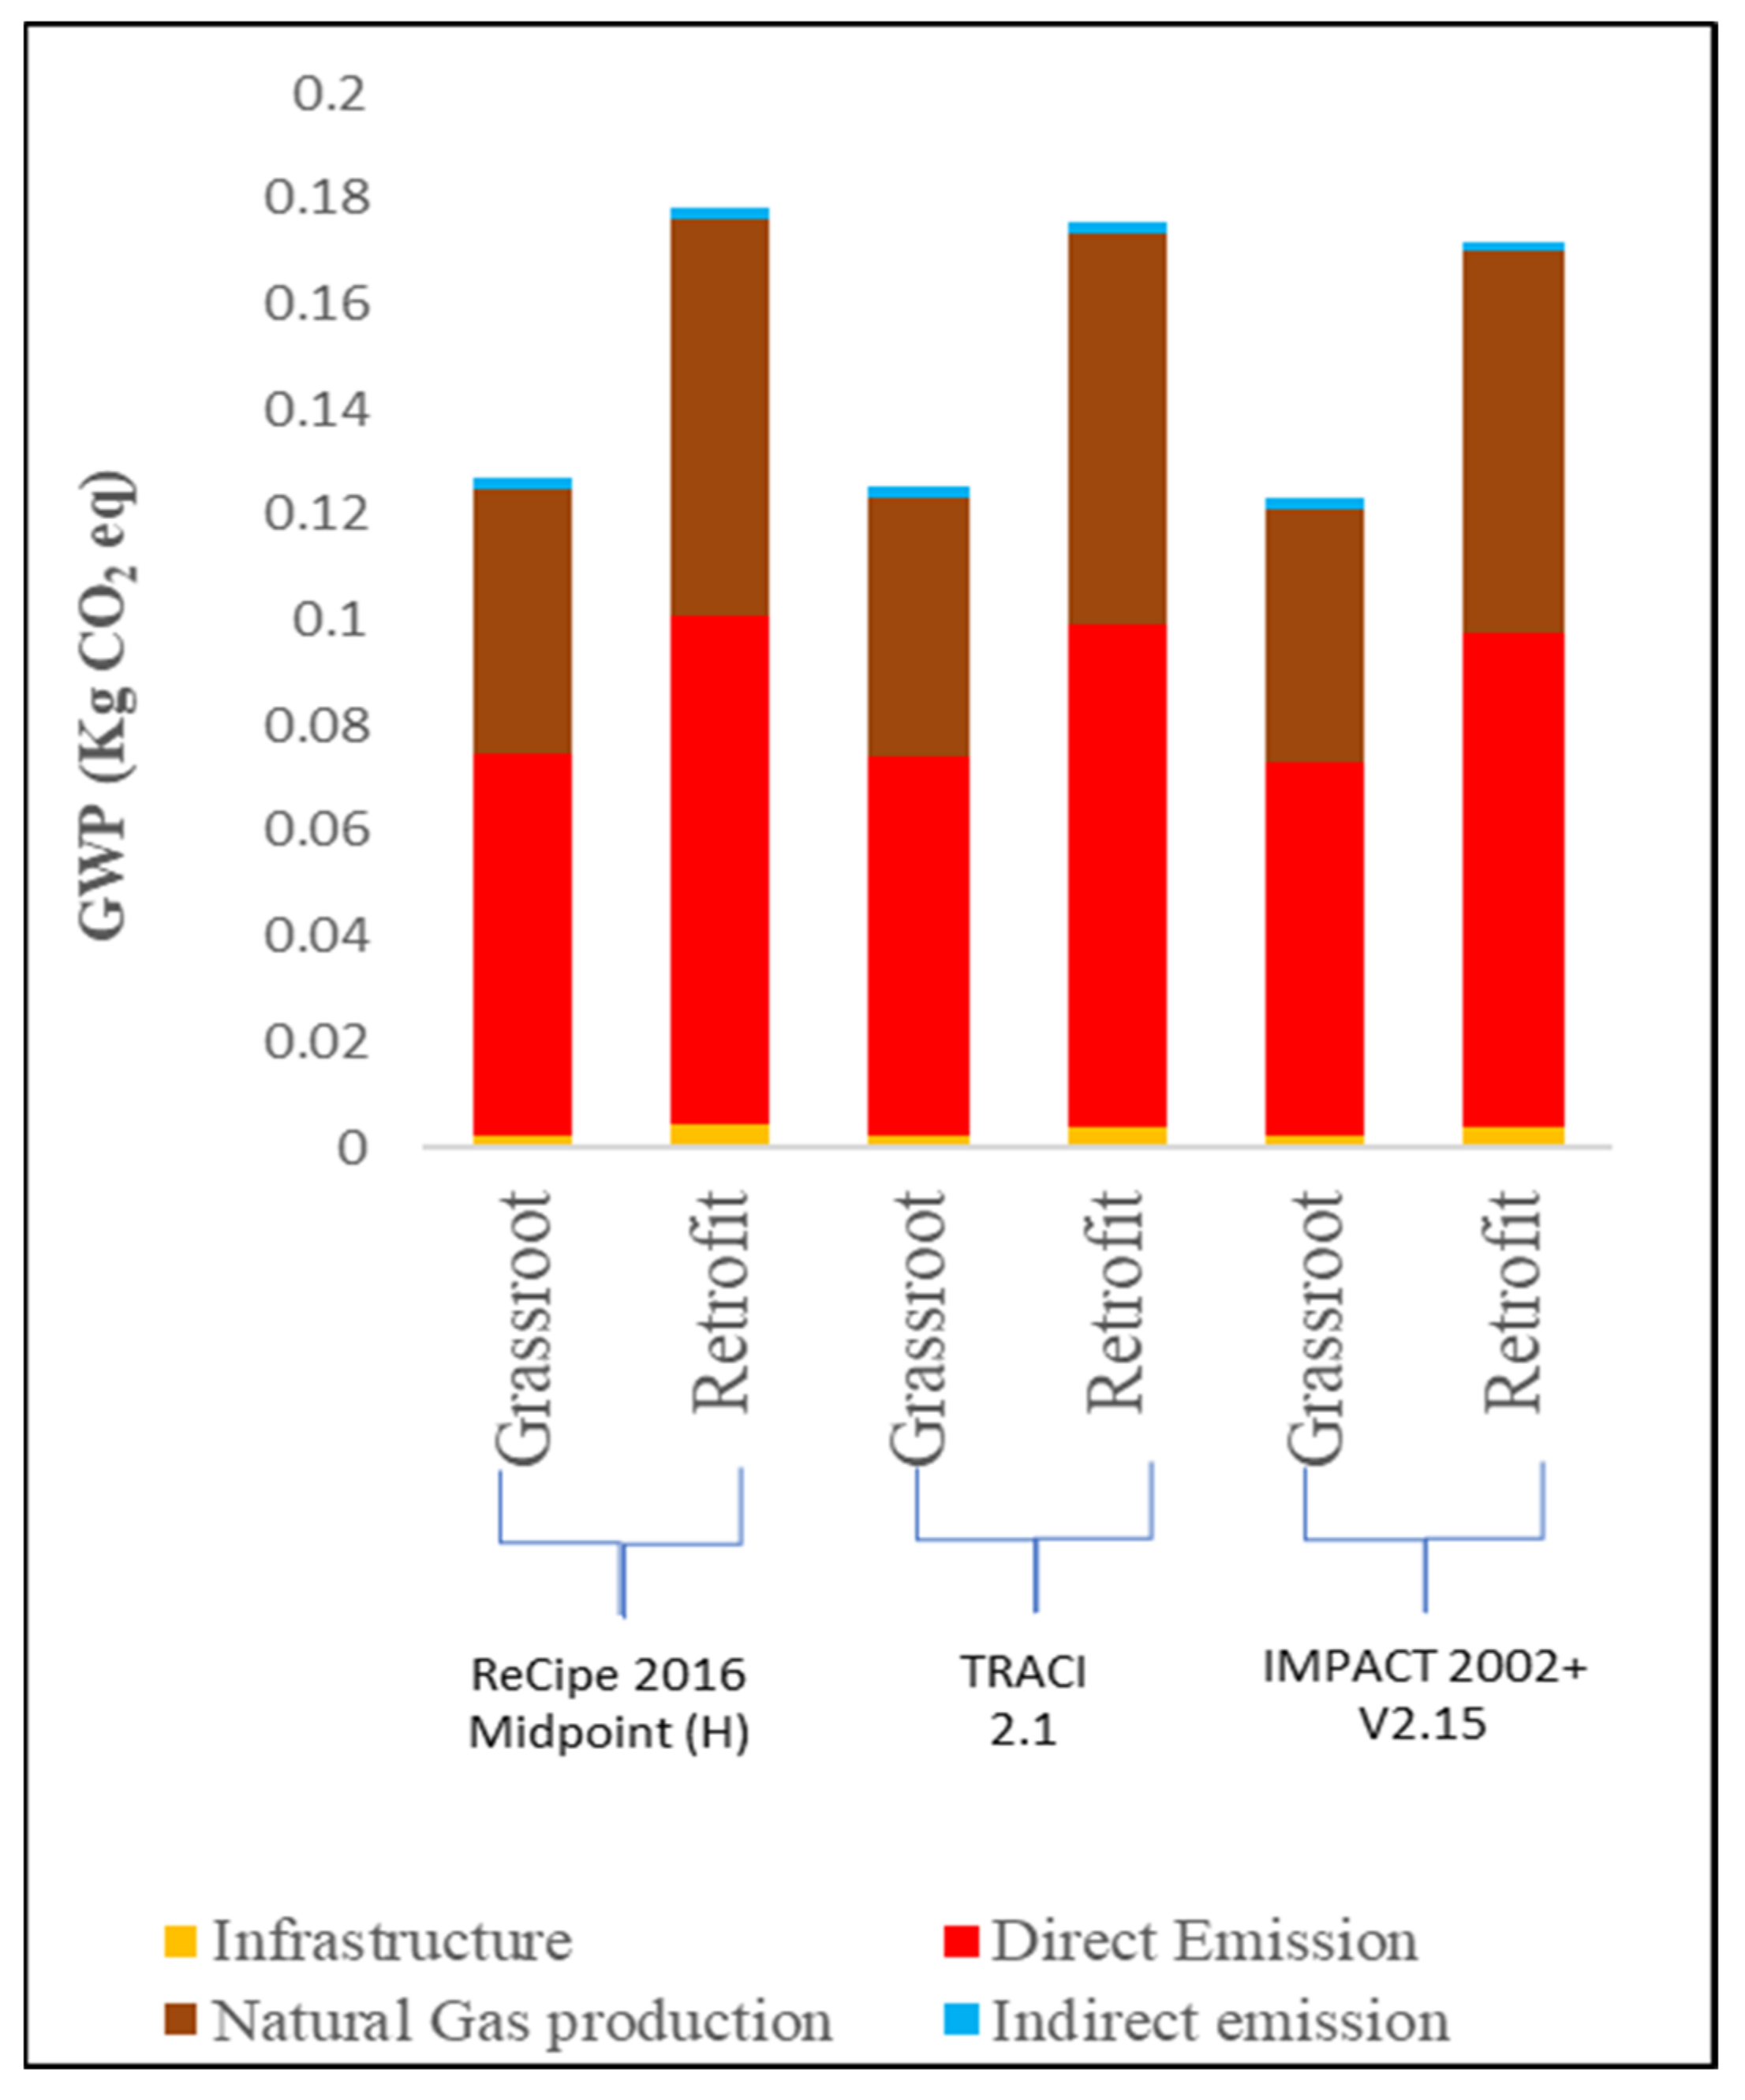
As can be shown in Figure 6, outcomes for the grassroots scenario demonstrate a considerable decrease in GWP. Generally, in the case of the grassroots design, the proposed NGCC-CCS would emit 0.123–0.127 Kg CO2 eq, while 0.172–0.178 Kg CO2 eq would be emitted in the retrofit design, when producing 1 kWh of electricity based on different impact assessment methods. This is 76% lower than base-case NGCC without a capture system, as reported by [45]. The capture plan is assumed to capture 90% of CO2 in the flue gas for both cases. In order to integrate a CO2 capture process into an existing power plant, measures must be taken to guarantee a sufficient steam supply for solvent regeneration. It is evident that CO2 capture is an energy-intensive process as the heat required for solvent regeneration in the retrofit scenario has the most significant influence on the total process power output. Compared with the grassroots scenario, in the retrofit scenario the natural gas required to generate steam for the regeneration column in the capture unit cannot be supplied internally, which is basically due to the limited existing capacity of the power plant. Thus, the GWP score for natural gas production is higher for the retrofit scenario in all methods.
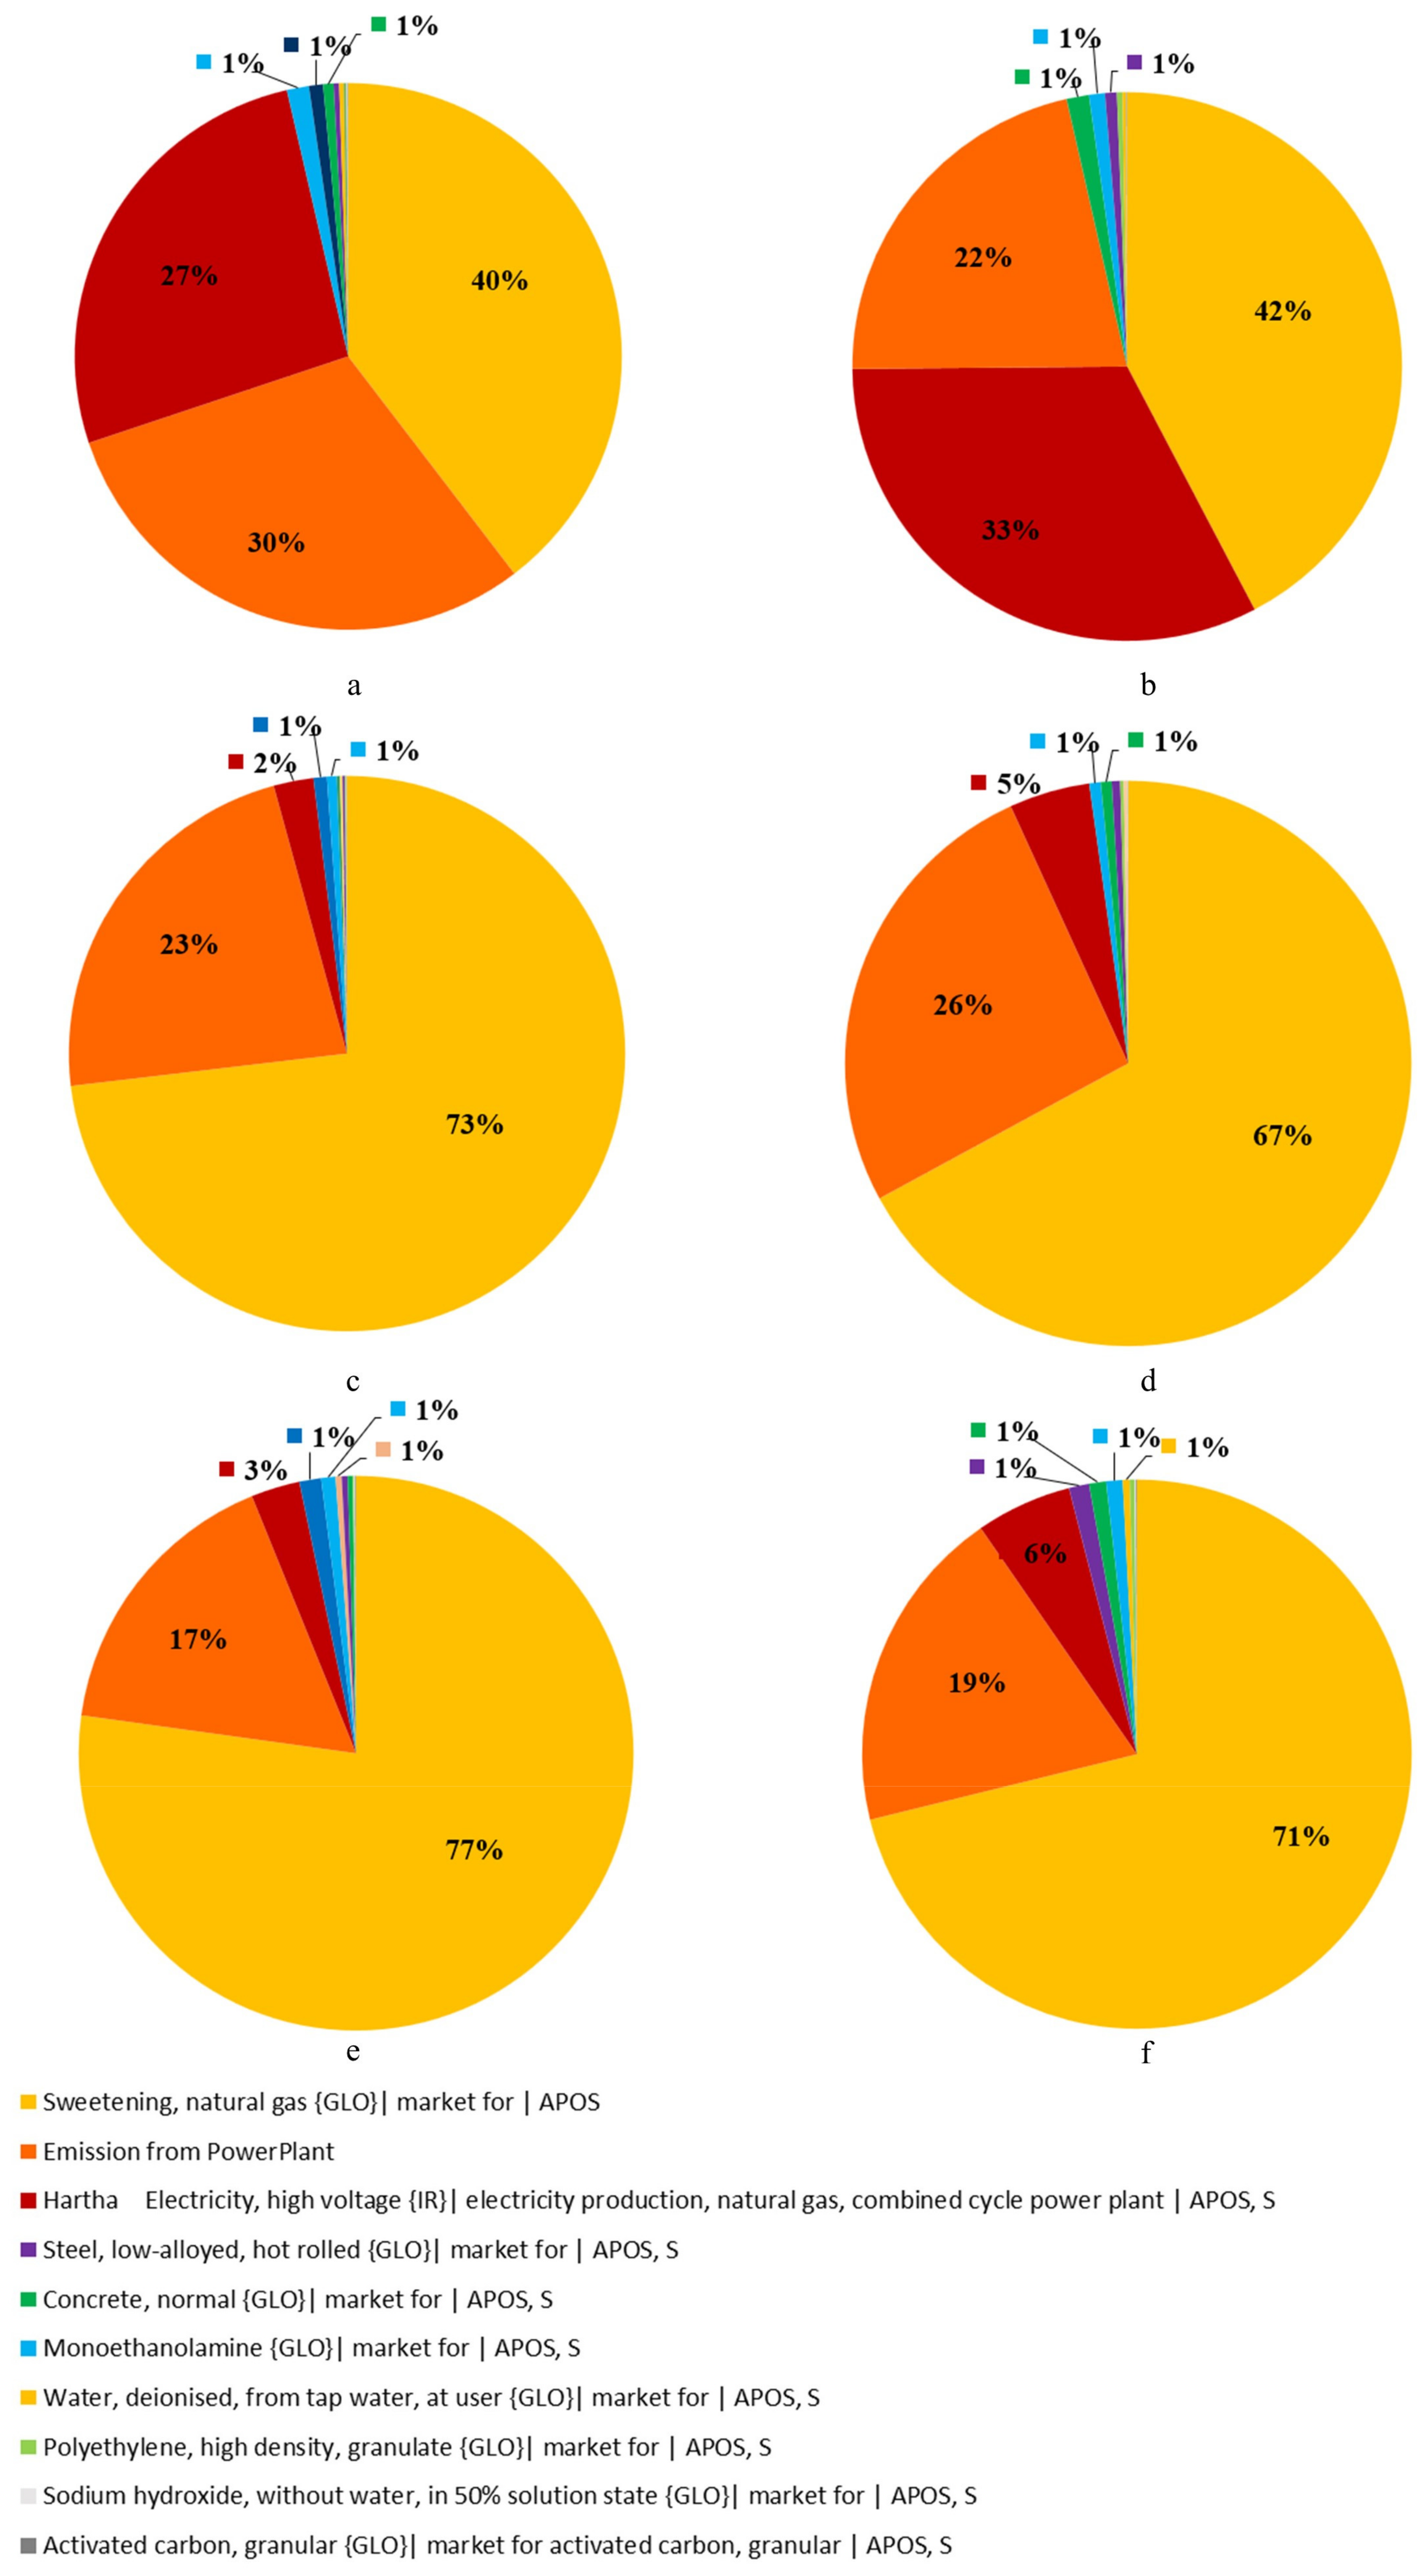
The three methods applied to calculate the GWP used in this study show a slight difference between the estimations since these methods use the common CO2 equivalency factors published in the Intergovernmental Panel on Climate Change report with a 100-year time horizon [46,48,75]. The process contribution reveals that natural gas production accounts for 40–42% of the total GWP score. The share of indirect emissions (mainly the monoethanolamine production chain) is between 2–4%, while infrastructure is responsible for less than 3%. Direct emissions (the largest share is from the natural gas consumption and energy requirements from the auxiliary capture plant) from both scenarios, Grassroots, and retrofit, account for 27% and 33%, respectively. These findings correspond to what was previously reported in many studies on NGCC with an amine capture system attached [20,42,76].

4.2.2. Acidification Potential (AP)

Results demonstrate that the ReCipe 2016 Midpoint (H) method had the most negligible impact scores for both scenarios, with the total score from the life cycle increasing by 11% for the grassroots scenario compared to the retrofit scenario. The SO2 and NO2 direct emissions are significantly reduced throughout the capture process; however, this reduction is insufficient to offset the effects of increased emissions due to the related activities, such as construction phase requirements of the grassroots scenario. The contribution analysis in Figure 7 demonstrates that the site’s direct emissions are responsible for 23% and 26%, respectively, of the overall acidification along the entire chain.
As shown in Table 6, the direct acidification impact caused by NH3 and MEA vapor discharged from the absorber is 2%. Natural gas production is another significant factor in both scenarios, contributing 73% and 67% of the total contribution to acidification potential, respectively. Using various impact assessment methods, it is evident that the TRACI 2.1 and IMPACT 2002+ have higher scores than the ReCipe 2016 Midpoint (H). For the last method mentioned, country-specific characterization parameters of terrestrial ecosystem damage owing to acidifying emissions were used. Since the effect is precursor element-independent, the fate factor of a pollutant in the soil and atmosphere is significant. TRACI 2.1 employs an acidification model that accounts for the rising hydrogen ion potential in the environment without taking into account site-specific factors such as the capacity of some environments to act as buffers [75]. Notably, characterization factors (CFs) for IMPACT 2002+ are given for emissions into the air only, and no CFs are presently available for emissions into water and soil [48].

4.2.3. Particulate Matter Formation Potential (PMFP)

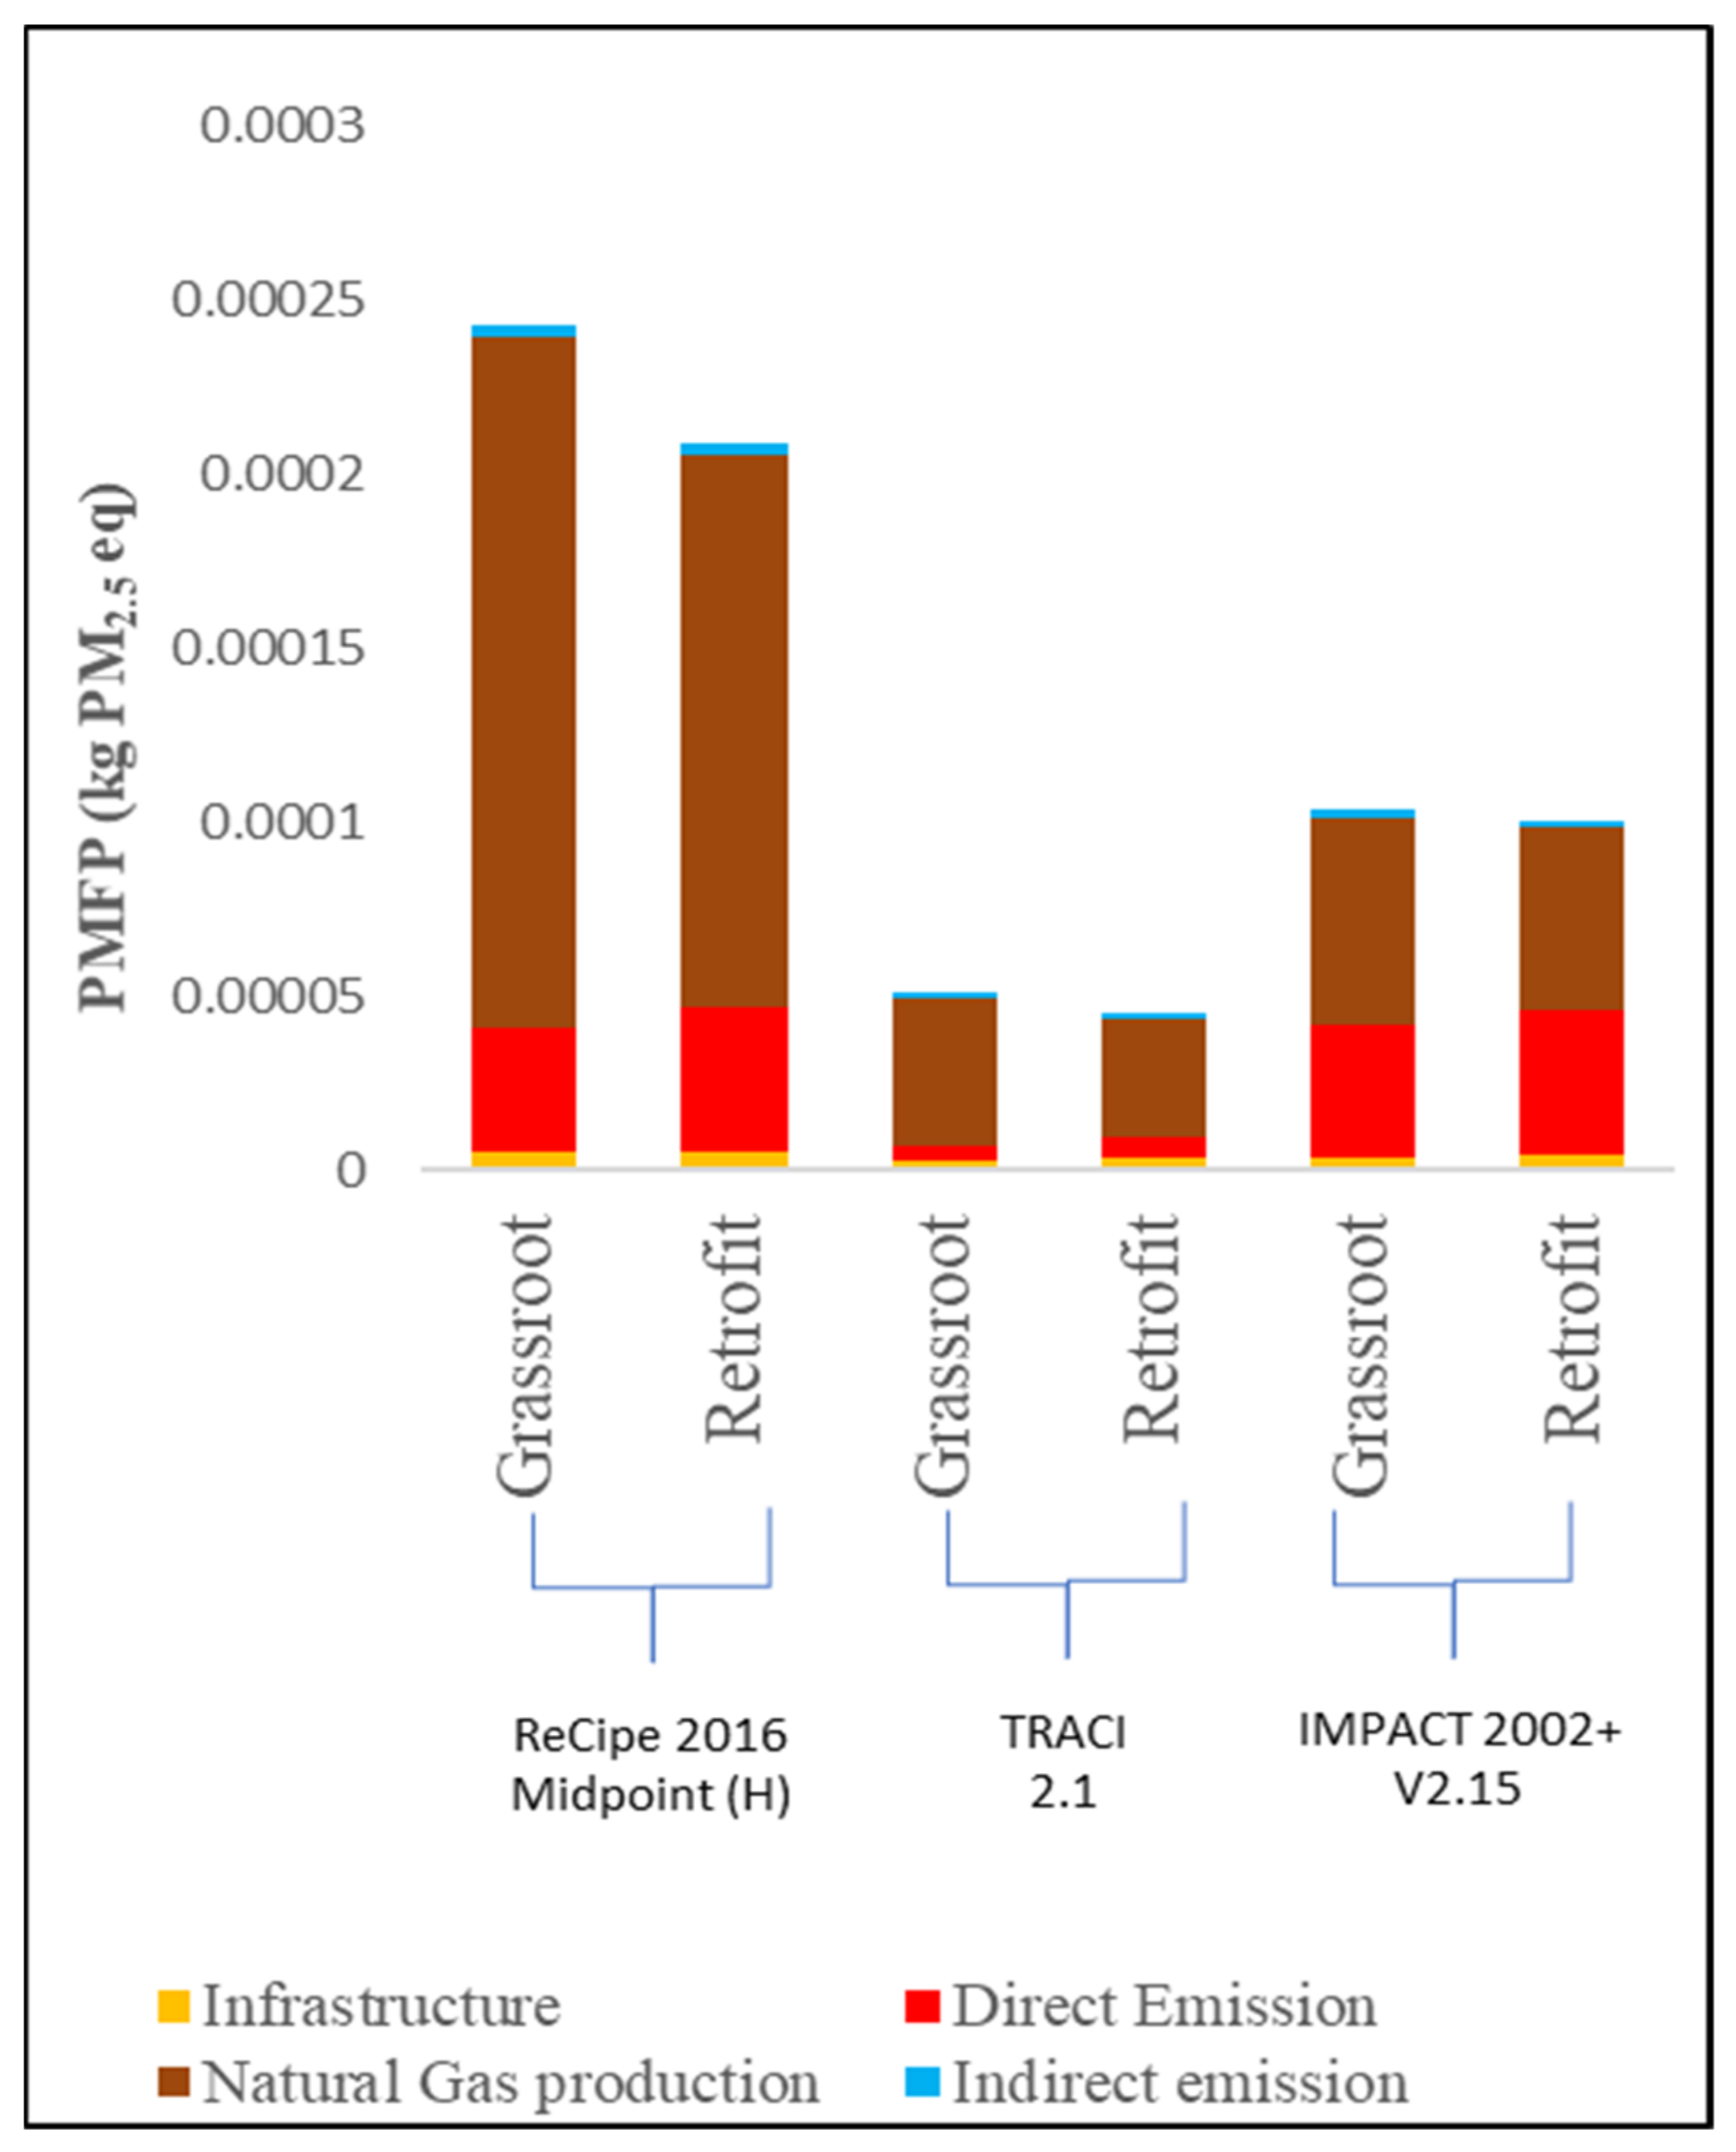
According to Figure 8, direct emissions from the plant facility are responsible for 17–19% of the overall PMFP impact for both scenarios, with NOx emissions from fuel combustion accounting for the majority of around 77%. Infrastructure demand accounts for 6% of the impact. As can be seen from the results of the three methods, the ReCipe 2016 Midpoint (H) has the higher impact scores, compared with the IMPACT 2002+ method and the TRACI method for both scenarios considered, with a higher impact on the retrofit scenario. The power plant in the grassroots scenario appears to emit more PM2.5 into the atmosphere than in the retrofit scenario. In TRACI 2.1, the reference element, PM2.5, was used to classify the elements [77]. However, the IMPACT 2002+ is based on a thorough review of CFs and intake fractions, primary PM, and secondary PM from SO2, NOx, and NH3 between 2008 and 2010, resulting in updated intake factors for respiratory inorganics [77,78]. Value choices in modeling the effect of fine particulate matter formation in Hierarchist ReCipe 2016 Midpoint are the primary and secondary aerosols from SO2 [47]. The evaluation of the environmental contribution reveals that natural gas production accounts for 40% of the total GWP score in the grassroots case, followed by direct emission (30%) and the operational energy requirements (27%), as represented in Figure 9a, while these shares are 42%, 33%, and 22%, respectively, for the retrofit scenario (Figure 9b). For the AP score, 73% of the environmental contribution comes from natural gas production, 23% from direct emission, and 2% from the energy consumption for capturing in the grassroots scenario (Figure 9c), while contributing 67%, 26%, and 5%, respectively, for the retrofit scenario as shown in Figure 9d. Figure 9e,f show the share of PMFP, indicating more than 70% of environmental contribution by the natural gas production for both scenarios; however, the share of the direct emission is estimated at 17% and 19% in the grassroots scenario and retrofit scenario, respectively.

4.3. Sensitivity Analysis of the Impact Categories

The sensitivity of the consequences of life cycle impacts was evaluated by changing the corresponding values of the main parameters from a lower limit to an upper limit in the retrofit design scenario (See Table 7).
The two scenarios investigated in this study are then compared with the impact of the grassroots scenario to determine the relationship between behavior and variation in system performance. SimaPro does not show overlapping distributions due to the possibility of incorrect interpretation. Instead, it uses an (A-B) strategy. This method determines the difference between scenarios A (here referring to the grassroots scenario) and B (referring to the retrofit scenario) in each iteration. Then it displays the relative impact of instances where scenario (A) scores worse than scenario (B). The results shown in Figure 10 indicate that the impact score of GWP is highly sensitive to the changes compared to the other impact scores. PMFP has the lowest sensitivity indicator at 5% of the system performance compared to 9% for AP, while the 17% sensitivity ratio indicator recorded for GWP is between the lower and the upper limit. Emissions from the capture processes and materials (e.g., activated carbon, MEA input) consumption account for a large portion of this difference in GWP. The key factors influencing this increase in AP are the ammonia and MEA emissions during the capture process.
As previously mentioned in the results of the PMFP, NOx emissions from fuel combustion have the largest share. They therefore have the lowest sensitivity range as it was not considered in the sensitivity variation limits. Accordingly, this analysis shows that the reduction in MEA, formaldehyde, and acetaldehyde emissions released during the capture process, will have significant control over all trade-offs.

4.4. Uncertainty Analysis of the Input Data

The uncertainty analysis was conducted to reflect more accurately the influence of uncertain factors on the statistical significance of the environmental impact evaluation in this research. The uncertainties in this study are viewed based on the method presented by the Ecoinvent database [64] as a combination of basic and additional uncertainties. The basic uncertainty is linked to the processes, potential fluctuations in quantities, and construction techniques. The uncertainty derived from the input data ranges is quantified and described using probability distributions for variable data; this rule-based procedure considered the knowledge and procedural ambiguity pertaining to the variable. The former might be evaluated either statistically or empirically, whereas the latter was often estimated using the data quality indicators (DQI) process. To convert DQIs into additional variances with respect to a lognormal distribution of data, Ecoinvent provides the default variances for fundamental uncertainty and the pedigree matrix. As a result, the total uncertainty of the input data might be calculated by adding the basic and additional variances. The data quality indicators (DQIs) are quantified in the pedigree matrix, which includes completeness, reliability, geographic correlation, temporal correlation, and additional technological correlation. The DQI assessment can be performed depending on the compilation of the preliminary data inventory to determine the significance of input data. Values ranging from low to high indicate how uncertain each category is. Table 8 shows the DQI matrix developed in this research, taking into account the fundamental characteristics of the materials in use by [79,80]. It can be seen that the distribution for DQI = 5 is significant narrower and more centralized than the one produced from DQI = 1. As stated in the screening methodology study of [75], less ambiguity or variability suggests the data are of higher quality.
The following formula is used to calculate the overall uncertainty for a flow with a lognormal distribution:
S D g 95 = σ g 2 = e ln U 1 2   + ln U 2 2 + ln U 3 2 + ln U 4 2 + ln U 5 2 + ln U b 2  
where: S D g 95 is the square of geometric standard deviation (95% interval); U 1 5 are the uncertainty factors for the completeness, reliability, geographical correlation, temporal correlation, additional technological correlation; and U b is the basic factor for uncertainty. The above formula computes the geometric standard deviation, σ g 2 , resulting from adding independent variables with lognormal distributions. It also demonstrates that the added uncertainty causes the original data’s basic uncertainty dispersion to rise. Bigger scores correspond to higher variances and lower quality data, and each level of the quality indicator is transformed into an uncertainty factor [81]. It should be highlighted that only additional uncertainties were taken into consideration with the material amounts. It is because including the basic uncertainties would require a probabilistic approach in all phases of the capture plant design, which was outside the scope of the current study. Table 9 shows the data quality assessment matrix formed based on the basic uncertainty and additional uncertainties in the Ecoinvent database.
The Monte Carlo simulation method (MCS) was used to model the uncertainty and incorporate it into the LCA framework [65]. MCS provides a quantifiable measure of what is known and what is unknown, as well as the inherent unpredictability of a process, as it is essential for creating defendable criteria for review [82]. According to [80], the underlying normal distribution variances that reflect the LCI input sample data define the lognormal distribution as the probability distribution where the natural logarithm of the observed data values is normally distributed. The outcomes of 1000 simulation iterations (and 95% confidence intervals) display all interval variations in detail, including the mean, median, standard deviation (SD), variability coefficient (CV), and standard error of the mean (SEM), as shown in Table 10.
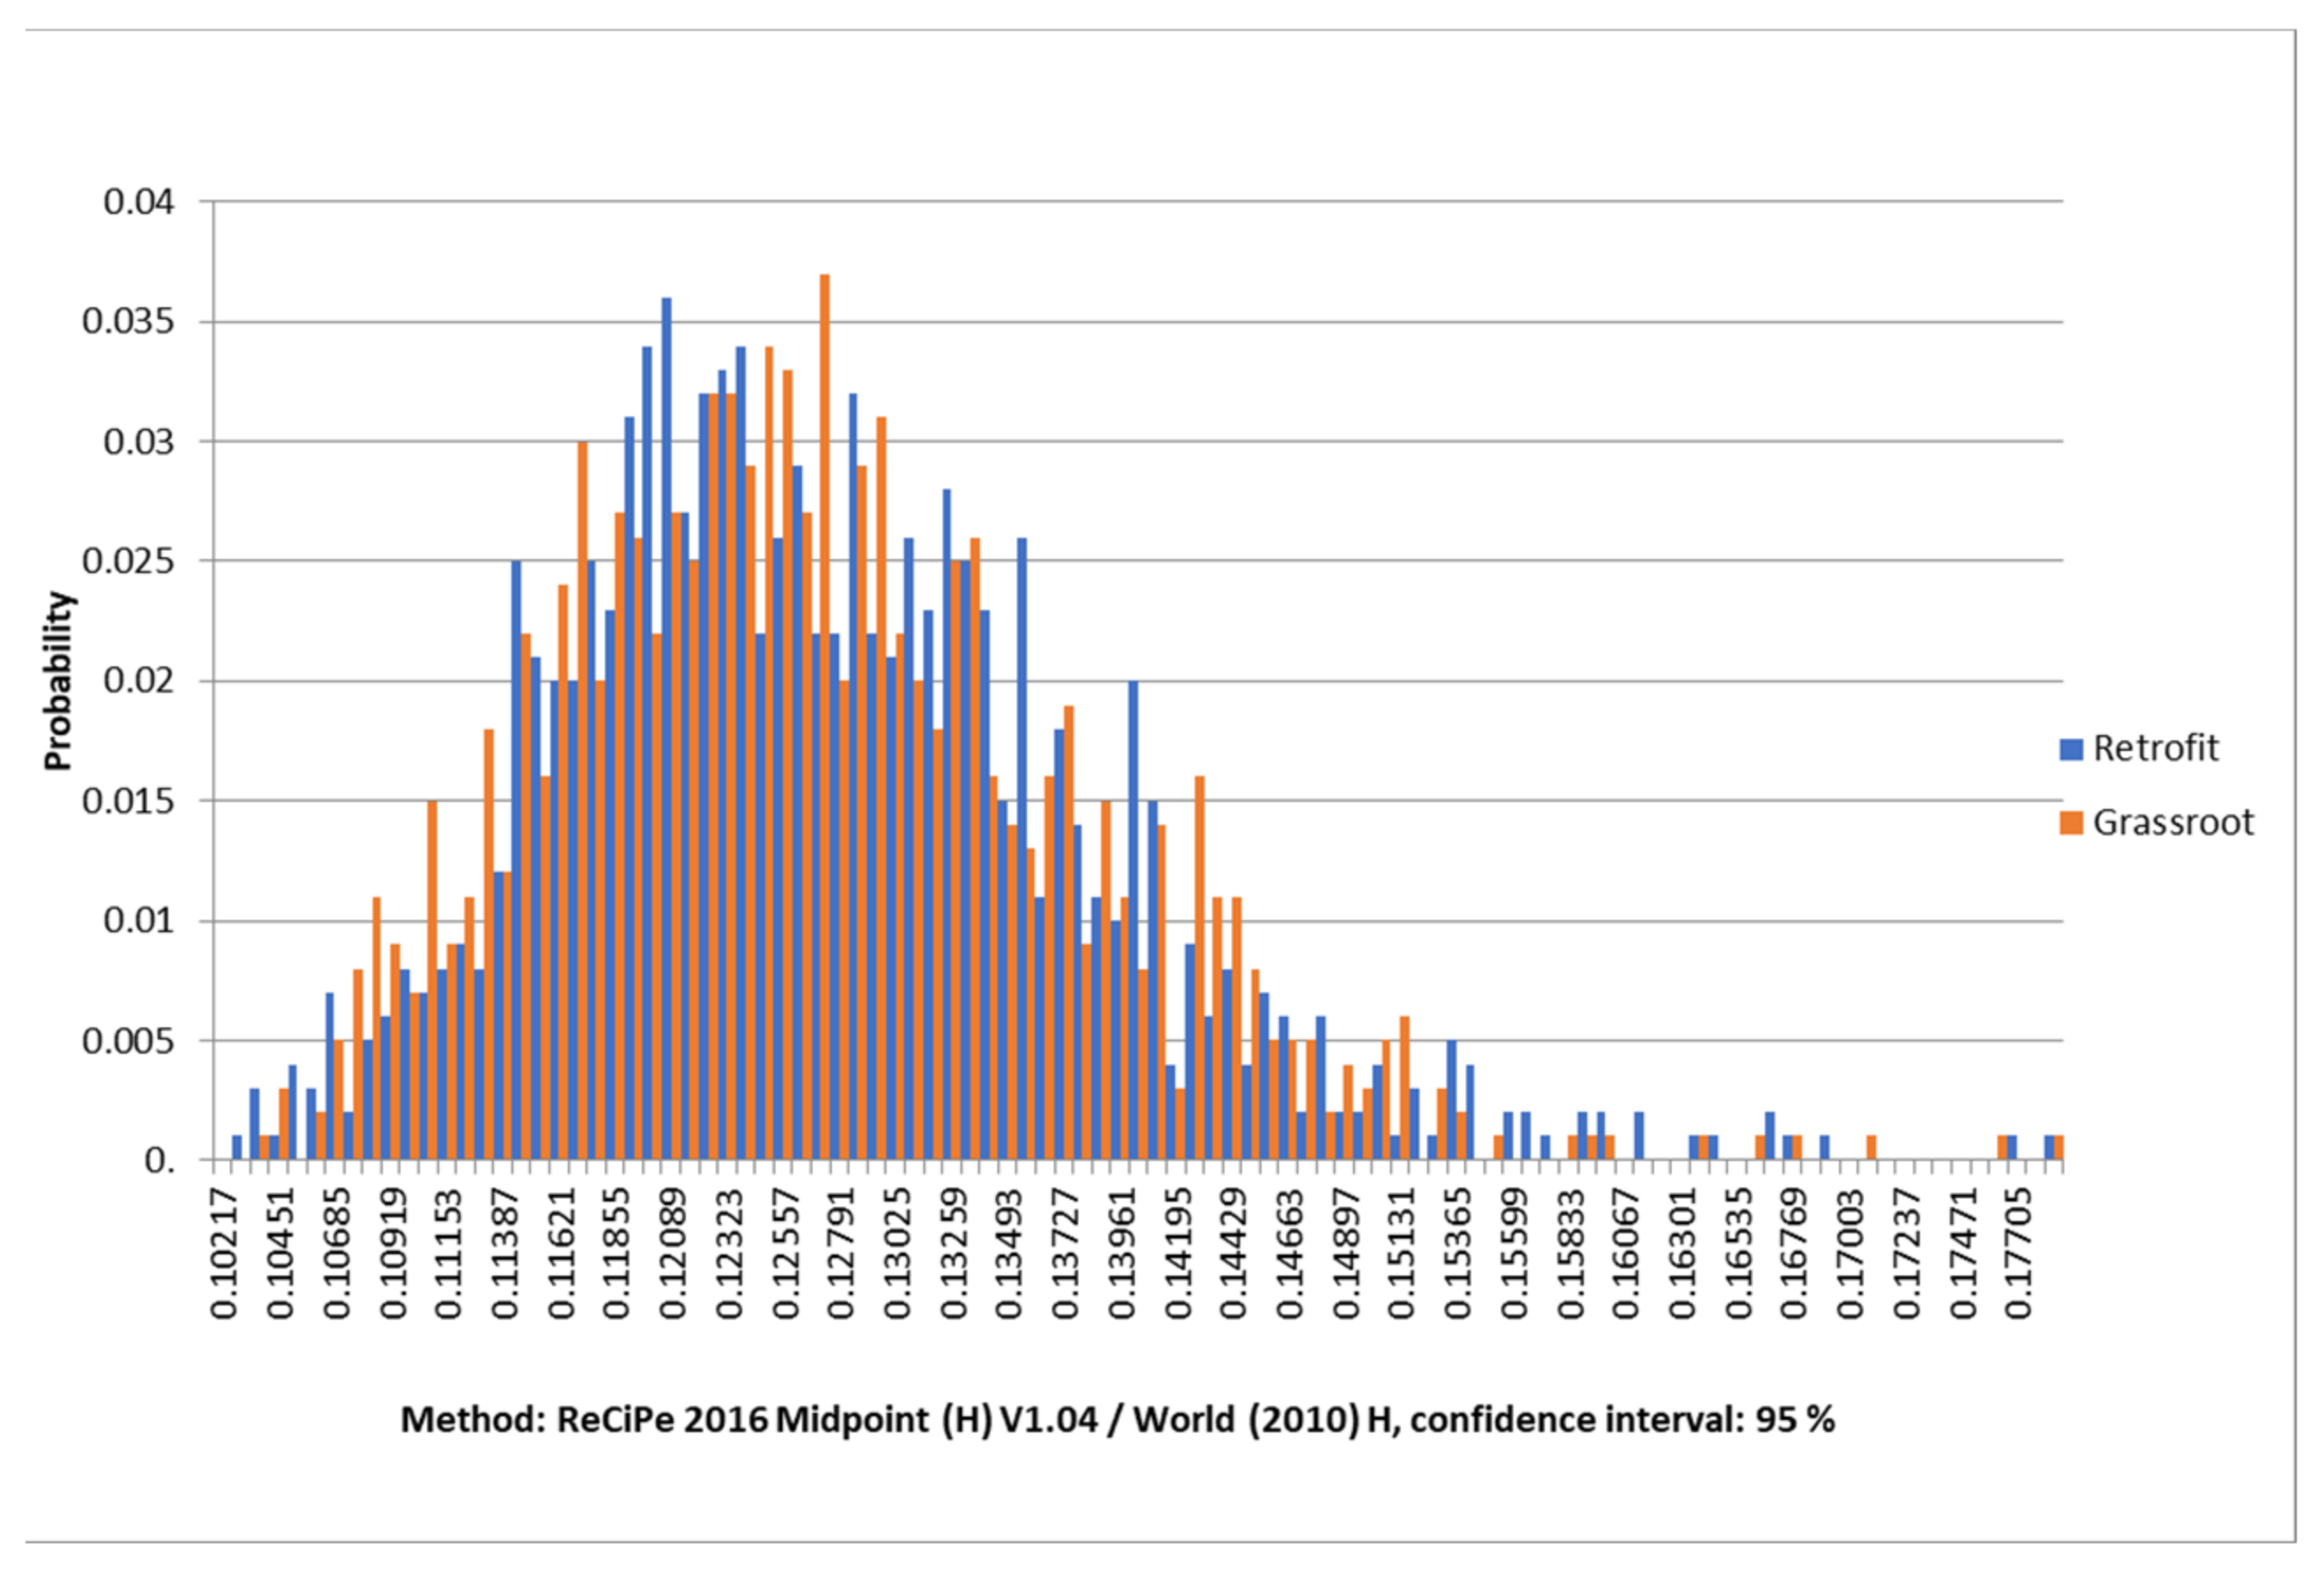
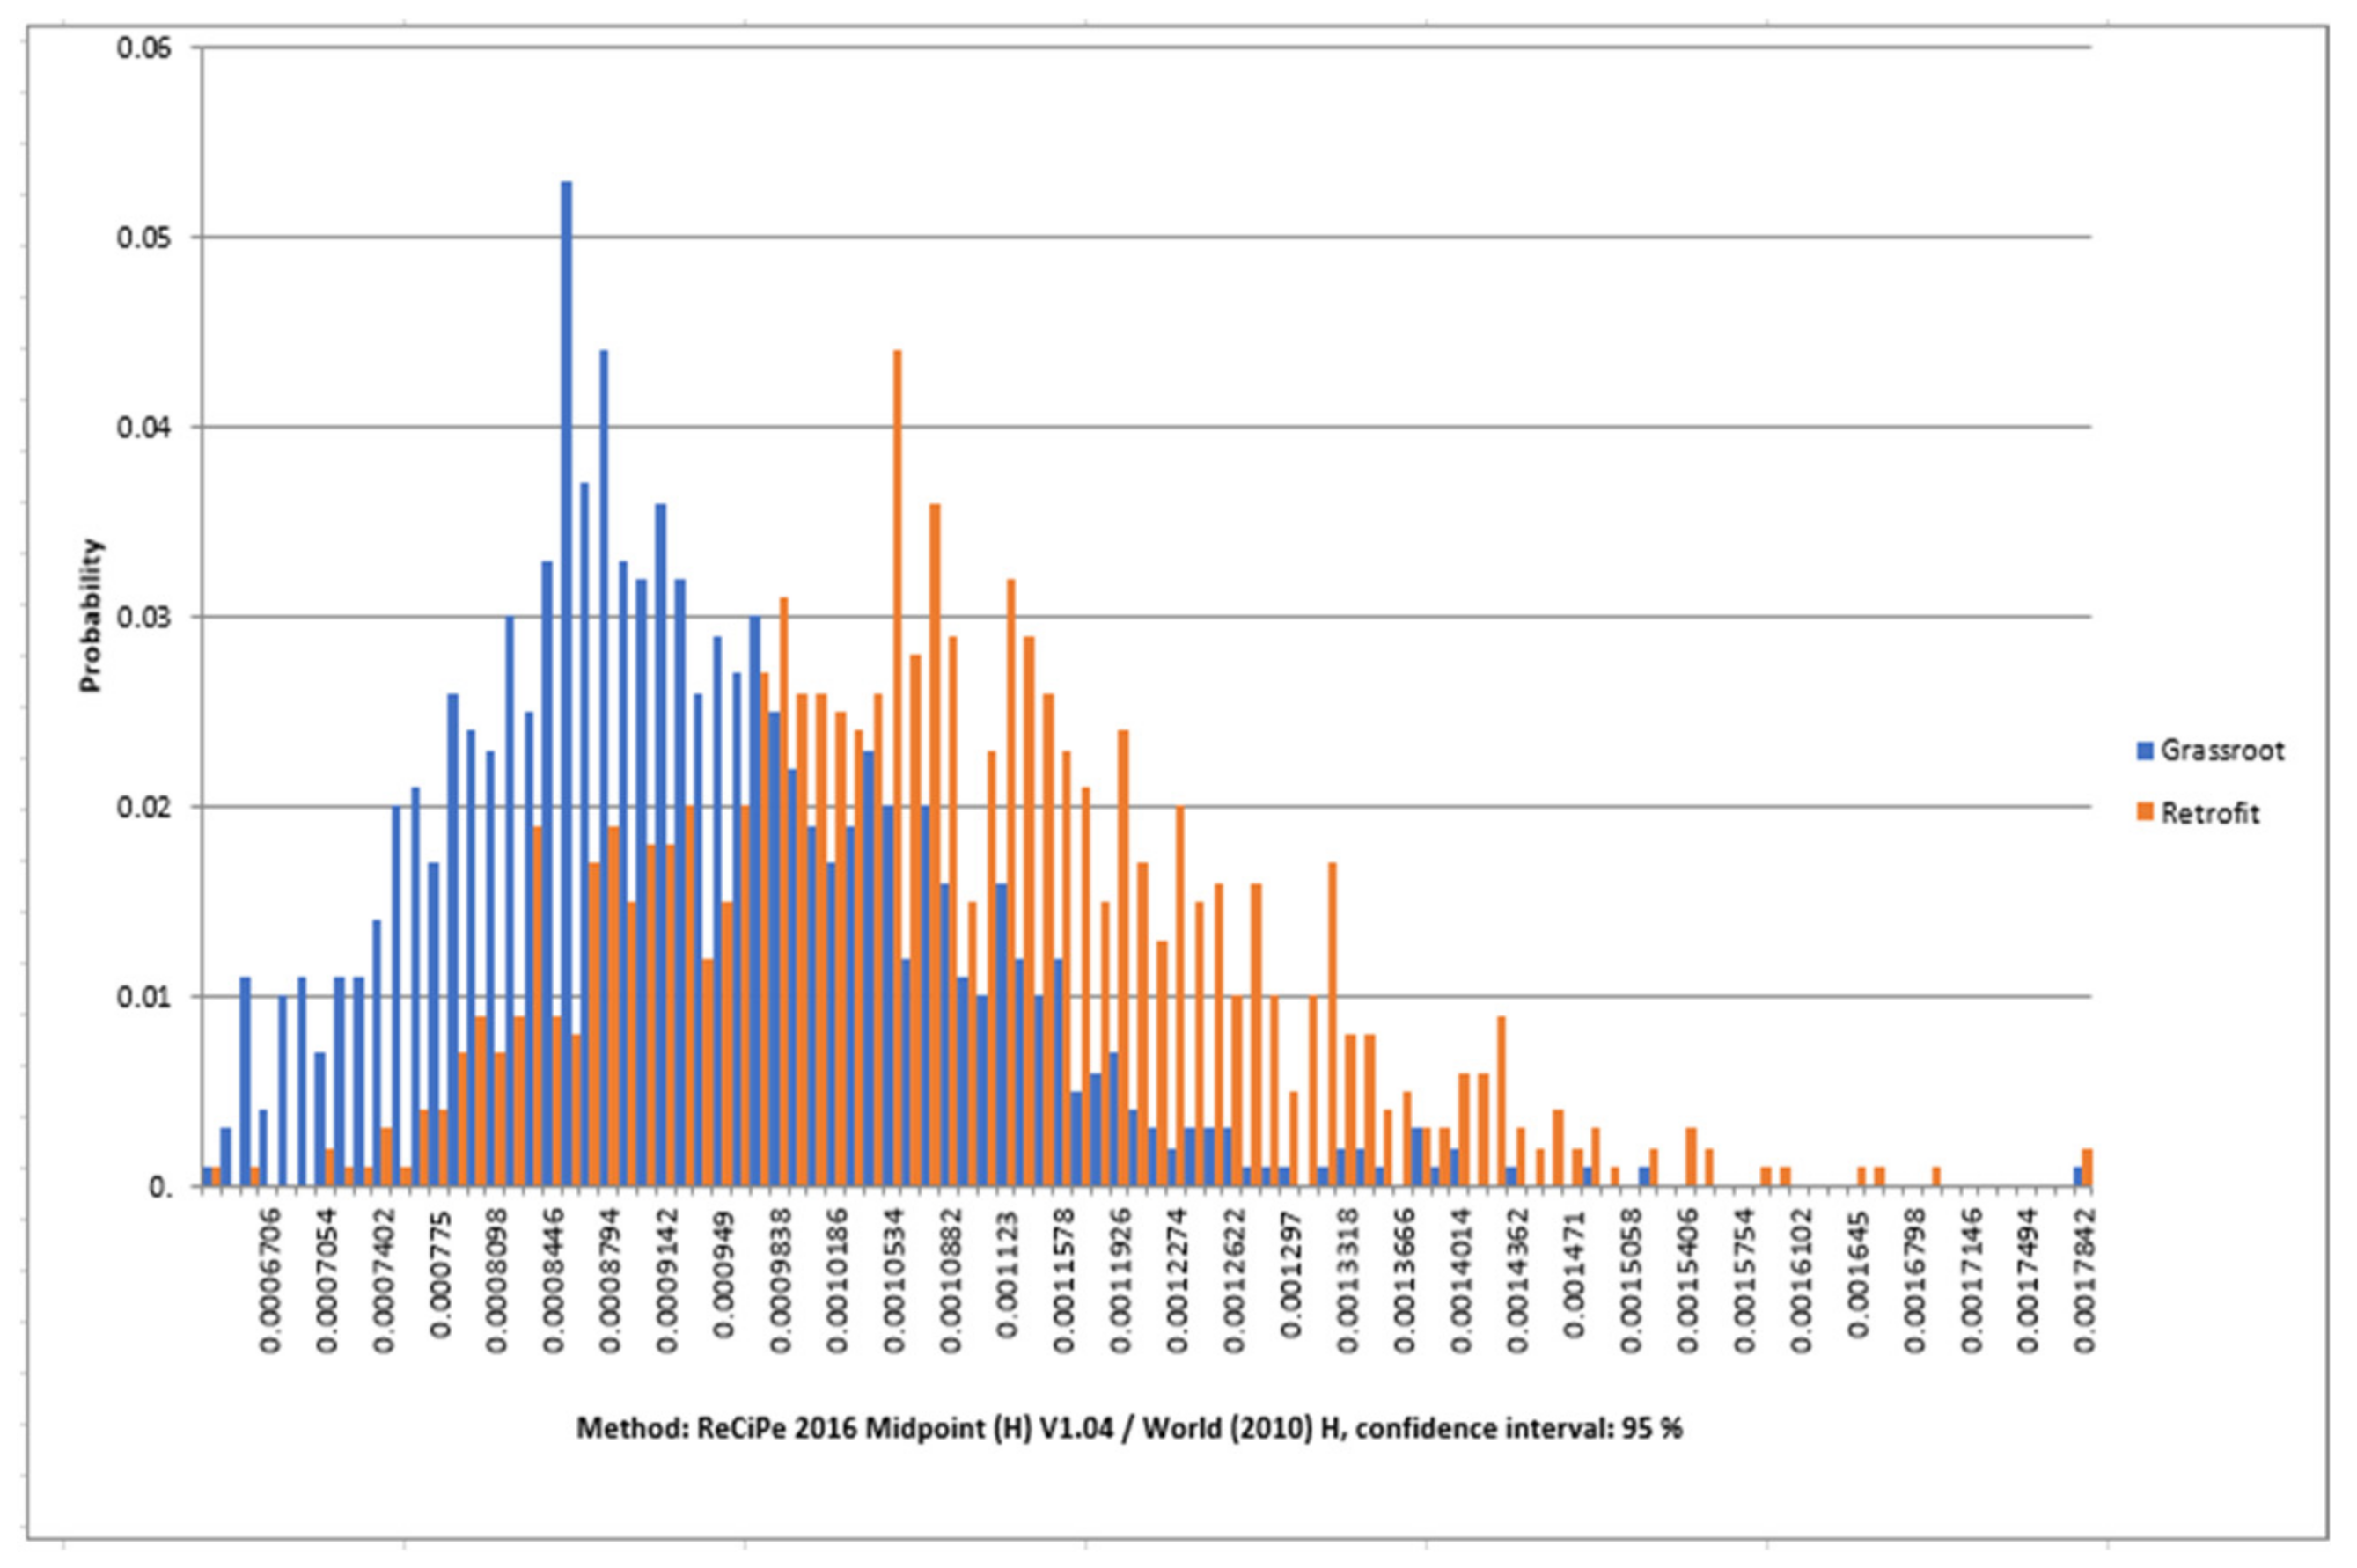
The key negative impact was presented in a small CV by GWP of (CV = 9.32%) for the retrofit scenario and (CV = 8.34%) for the grassroots scenario (see Table 10). Categories with a low impact yet a high CV value on both scenarios were caused by the uncertainty in the database used and materials by acting mainly on PMFP and AP with more effect on the grassroots scenario, as this scenario requires more assumptions to develop. The graphical representations of the probability distribution of the three environmental impacts for both scenarios are shown in Figure 11, Figure 12 and Figure 13. The result of AP impact has the highest probability index, while the results of the GWP show a minor index with a lognormal distribution for both. It is noteworthy to highlight the divergence in the sensitivity curve for the AP impact score in the two scenarios (retrofit CV = 15%, grassroots CV = 15.9%). Uncertainty in AP is due to the uncertainty in releasing NOx emissions data [83]. The uncertainty of the related activities of the grassroots scenario that emits SO2 and NO2 as direct emissions are significantly reduced throughout adding the capture process; however, this reduction is insufficient to offset the effect in the retrofit scenario. PMFP probability index score results indicate that the retrofit case has a higher score than the grassroots case (CV = 15.2%, CV = 16.8%).
However, it is noted that the risk values related to chemical transportation and storage (e.g., MEA), CO2 transport and storage, and infrastructure land occupation are not currently accounted for in the model. In addition, due to data restrictions, energy requirements for production and dismantling, energy and material requirements for infrastructure maintenance, and recycling after dismantling as well as waste processing, have not been considered.

5. Conclusions

This study evaluated the environmental impacts of a NGCC power plant coupled with post-combustion CO2 capture, using monoethanolamine as the solvent, for both retrofit and grassroots design scenarios. Applying three LCIA methods of TRACI 2.1, ReCipe 2016 Midpoint (H), and IMPACT 2002+ for three environmental impacts of GWP, PMFP, and AP, the results revealed that, the grassroots scenario would emit 28.6% less compared to the retrofit scenario. However, in the case of PMFP and AP impacts, the grassroots scenario has a higher environmental impact (14.2%, 17.3%) than the retrofit scenario. Utilizing a variety of impact assessment methods, it is clear that scores are different due to different concepts considered in each method. Comparing three LCIA methods, the ReCipe 2016 Midpoint (H) method had the most negligible impact scores for both scenarios. This study also identified several critical data limitations for the CO2 capture process’s environmental performance. This is mainly owing to a lack of specific process emission data for the CO2 capture process and, particularly, the procedure’s effect on trace elements that flue gas contains. The Uncertainty of the LCI input data effects on the LCA outcomes was explored. The probabilistic methodology used in this study allowed for a comparative evaluation and an understanding of the overall variation in the environmental impact footprint for the two scenarios considered. LCA evaluation has an influence on scenario selection based on their desirability and sustainability, hence, the vast range of LCA results indicates the crucial requirement and importance of handling the impact of uncertainty on the evaluation process appropriately. The sensitivity analysis results show that these uncertainties can have a considerable impact on the ultimate decision. According to the results, priority should be given to reducing the uncertainty in the PMFP and AP data compared to GWP.

Author Contributions

Conceptualization and methodology: R.K.M. and H.F.; Investigation: R.K.M. and H.F.; Writing: R.K.M. and H.F.; Review and editing: H.F.; Supervision: H.F. All authors have read and agreed to the published version of the manuscript.

Funding

This research received no external funding.

Institutional Review Board Statement

Not applicable.

Informed Consent Statement

Not applicable.

Data Availability Statement

Not applicable.

Acknowledgments

The authors would like to thank the Ministry of Education, Culture, Sports, Science and Technology of Japan for supporting this research, through MEXT scholarship program.

Conflicts of Interest

The authors declare no conflict of interest.

Nomenclature

ADPAbiotic Depletion Potential
APAcidification potential
CCPclimate change potential
CCSCarbon capture and storage
CCUSCarbon capture, utilization, and storage
CCUCarbon capture and utilization
CEDCumulative energy demand
COCarbon monoxide
CO2Carbon dioxide
DQIsData quality indicators
EOREnhanced oil recovery
FECFresh water ecotoxicity
FAETPFresh aquatic ecotoxicity potential
FEUFreshwater eutrophication
FRSAcidification potential fossil resource scarcity
GWPGlobal warming potential
GHGGreenhouse gas
HCTHuman carcinogenic toxicity
HDLPEHigh Density Linear Polyethylene
HETPHeight Equivalent to One Theoretical Plate
HnCTHuman non-carcinogenic toxicity
HPThigh-pressure turbine
HTPHuman toxicity potential
IEAInternational Energy Agency
IECMIntegrated Environmental Control Model
INDCIntended Nationally Determined Contributions
IPCCIntergovernmental Panel on Climate Change
IRIonizing radiation
ISOInternational Organization for Standardization
LCALife Cycle Assessment
LCIALife Cycle Impact Assessment
LCILife Cycle Inventory
LPTLow-pressure turbine
LULand use
MAETPMarine/aquatic ecotoxicity potential
MEAMonoethanolamine
MECMarine ecotoxicity
MEPMarine eutrophication potential
MEUMarine eutrophication
MRSMineral resource scarcity
NGNatural Gas
NGCCNatural Gas Combined Cycle
ODPOzone layer depletion potential
OFHHOzone formation affecting human health
OFTEOzone formation affecting terrestrial ecosystems
PCCPost-combustion carbon capture
PMFPparticulate matter formation potential
POCPphotochemical ozone creation potential
POFPPhotochemical oxidant formation potential
SDg95Overall uncertainty for a flow with a lognormal distribution
SO2Sulfur dioxide
SODStratospheric ozone depletion
TWCTotal water consumption
TETPTerrestrial ecotoxicity potential
TACTerrestrial acidification
LCILife Cycle Inventory
LPTLow-pressure turbine
LULand use

Appendix A

The general structure of the data inventory flows in the database.
Figure A1. Structural data inventory flows used in the Ecoinvent database in for the PMFP in (kg PM2.5 eq).
Energies 16 01545 g0a1aEnergies 16 01545 g0a1bEnergies 16 01545 g0a1c
Figure A2. Structural data inventory flows used in the Ecoinvent database in for the GWP in (kg CO2 eq).
Energies 16 01545 g0a2aEnergies 16 01545 g0a2bEnergies 16 01545 g0a2c
Figure A3. Structural data inventory flows used in the Ecoinvent database in for the AP in (kg SO2 eq).
Energies 16 01545 g0a3aEnergies 16 01545 g0a3bEnergies 16 01545 g0a3c

References

  1. Hoegh-Guldberg, O.; Jacob, D.; Taylor, M.; Bindi, M.; Brown, S.; Camilloni, I.; Diedhiou, A.; Djalante, R.; Ebi, K.; Engelbrecht, F.; et al. IPCC Impacts of 1.5 °C Global Warming on Natural and Human Systems. In Global Warming of 1.5 °C.; Masson-Delmotte, V., Zhai, P., Pörtner, H.O., Roberts, D., Skea, J., Shukla, P.R., Pirani, A., Moufouma-Okia, W., Péan, C., Pidcock, R., et al., Eds.; IPCC: Geneva, Switzerland, 2022; pp. 175–312. [Google Scholar] [CrossRef]
  2. Ibraheem, F.; Jassim, H.M.; Ibraheem, F.H.; Jasim, H.A. Environmental Impact of Electrical Power Generators in Iraq. Int. J. Eng. Technol. Manag. Appl. Sci. 2016, 4, 122–134. [Google Scholar] [CrossRef]
  3. IEA. World Energy Outlook 2022. 2022. Available online: www.iea.org/t&c/ (accessed on 1 October 2022).
  4. Ministry of Environment. United Nations Development Programme IraqIraq’s Nationally Determined Contributions to UNFCCC.; Ministry of Environment: Baghdad, Iraq, 2015. [Google Scholar]
  5. International Energy Agency. Key World Energy Statistics 2021; International Energy Agency: Paris, France, 2021. [Google Scholar]
  6. Faramawy, S.; Zaki, T.; Sakr, A.-E. Natural gas origin, composition, and processing: A review. J. Nat. Gas Sci. Eng. 2016, 34, 34–54. [Google Scholar] [CrossRef]
  7. Dellano-Paz, F.; Fernandez, P.M.; Soares, I. Addressing 2030 EU policy framework for energy and climate: Cost, risk and energy security issues. Energy 2016, 115, 1347–1360. [Google Scholar] [CrossRef]
  8. Atilgan, B.; Azapagic, A. Life cycle environmental impacts of electricity from fossil fuels in Turkey. J. Clean. Prod. 2015, 106, 555–564. [Google Scholar] [CrossRef]
  9. Gibbins, J.; Chalmers, H. Carbon capture and storage. Energy Policy 2008, 36, 4317–4322. [Google Scholar] [CrossRef]
  10. IEA. Putting CO2 to Use Creating Value from Emissions; International Energy Agency: Paris, France, 2019. [Google Scholar]
  11. ISO 14044; Environmental Management-Life Cycle Assessment-Requirements and Guidelines. International Standards Organization: Geneva, Switzerland, 2006.
  12. ISO 14040; Environmental Management-Life Cycle Assessment-Principles and Framework. International Standards Organization: Geneva, Switzerland, 2006.
  13. Muthu, S.S. Assessing the Environmental Impact of Textiles and the Clothing Supply Chain; Woodhead Publishing: Sawston, UK, 2014. [Google Scholar] [CrossRef]
  14. Corsten, M.; Ramirez, A.; Shen, L.; Koornneef, J.; Faaij, A. Environmental impact assessment of CCS chains—Lessons learned and limitations from LCA literature. Int. J. Greenh. Gas Control 2013, 13, 59–71. [Google Scholar] [CrossRef]
  15. Sathre, R.; Masanet, E.; Cain, J.; Chester, M. The role of Life Cycle Assessment in Identifying and Reducing Environmental Impacts of CCS Environmental Energy Technologies Division. In Proceedings of the 10th Annual Conference on Carbon Capture and Sequestration, Pittsburgh, PA, USA, 2–5 May 2011. [Google Scholar]
  16. Strazza, C.; Del Borghi, A.; Gallo, M. Development of Specific Rules for the Application of Life Cycle Assessment to Carbon Capture and Storage. Energies 2013, 6, 1250–1265. [Google Scholar] [CrossRef]
  17. Schreiber, A.; Zapp, P.; Marx, J. Meta-Analysis of Life Cycle Assessment Studies on Electricity Generation with Carbon Capture and Storage. J. Ind. Ecol. 2012, 16, S155–S168. [Google Scholar] [CrossRef] [Green Version]
  18. Metz, B.; Davidson, O.; de Coninck, H.; Loos, M.; Leo Meyer, L. Carbon Dioxide Capture and Storage; Cambridge University Press: New York, NY, USA, 2005. [Google Scholar]
  19. Wang, Y.; Pan, Z.; Zhang, W.; Borhani, T.N.; Li, R.; Zhang, Z. Life cycle assessment of combustion-based electricity generation technologies integrated with carbon capture and storage: A review. Environ. Res. 2021, 207, 112219. [Google Scholar] [CrossRef]
  20. Lombardi, L. Life cycle assessment comparison of technical solutions for CO2 emissions reduction in power generation. Energy Convers. Manag. 2003, 44, 93–108. [Google Scholar] [CrossRef]
  21. Singh, B.; Strømman, A.H.; Hertwich, E. Life cycle assessment of natural gas combined cycle power plant with post-combustion carbon capture, transport and storage. Int. J. Greenh. Gas Control 2011, 5, 457–466. [Google Scholar] [CrossRef]
  22. Odeh, N.A.; Cockerill, T.T. Life cycle GHG assessment of fossil fuel power plants with carbon capture and storage. Energy Policy 2008, 36, 367–380. [Google Scholar] [CrossRef]
  23. Dones, R.; Bauer, C.; Heck, T.; Mayer-Spohn, O.; Blesl, M. Life Cycle Assessment of Future Fossil Technologies with and without Carbon Capture and Storage. MRS Proc. 2007, 1041. [Google Scholar] [CrossRef]
  24. Schreiber, A.; Zapp, P.; Kuckshinrichs, W. Environmental assessment of German electricity generation from coal-fired power plants with amine-based carbon capture. Int. J. Life Cycle Assess. 2009, 14, 547–559. [Google Scholar] [CrossRef]
  25. Christian, B.; Thomas, H.; Roberto, D.; Mayer-Spohn, O.; Markus, B. Final Report on Technical Data, Costs, and Life Cycle Inventories of Advanced Fossil Power Generation Systems. 2008. Available online: https://www.researchgate.net/publication/272130888_Final_report_on_technical_data_costs_and_life_cycle_inventories_of_advanced_fossil_power_generation_systems (accessed on 1 December 2022).
  26. Garðarsdóttir, S.; Normann, F.; Andersson, K.; Prölß, K.; Emilsdóttir, S.; Johnsson, F. Post-combustion CO2 capture applied to a state-of-the-art coal-fired power plant—The influence of dynamic process conditions. Int. J. Greenh. Gas Control 2015, 33, 51–62. [Google Scholar] [CrossRef]
  27. Wang, J.; Yu, Z.; Zeng, X.; Wang, Y.; Li, K.; Deng, S. Water-energy-carbon nexus: A life cycle assessment of post-combustion carbon capture technology from power plant level. J. Clean. Prod. 2021, 312, 127727. [Google Scholar] [CrossRef]
  28. Bao, J.; Zhang, L.; Song, C.; Zhang, N.; Guo, M.; Zhang, X. Reduction of efficiency penalty for a natural gas combined cycle power plant with post-combustion CO2 capture: Integration of liquid natural gas cold energy. Energy Convers. Manag. 2019, 198, 111852. [Google Scholar] [CrossRef]
  29. Nie, Z.; Korre, A.; Durucan, S. Life cycle modelling and comparative assessment of the environmental impacts of oxy-fuel and post-combustion CO2 capture, transport and injection processes. Energy Procedia 2011, 4, 2510–2517. [Google Scholar] [CrossRef] [Green Version]
  30. Matin, N.S.; Flanagan, W.P. Life cycle assessment of amine-based versus ammonia-based post combustion CO2 capture in coal-fired power plants. Int. J. Greenh. Gas Control 2021, 113, 103535. [Google Scholar] [CrossRef]
  31. Giordano, L.; Roizard, D.; Favre, E. Life cycle assessment of post-combustion CO2 capture: A comparison between membrane separation and chemical absorption processes. Int. J. Greenh. Gas Control 2018, 68, 146–163. [Google Scholar] [CrossRef]
  32. Muramatsu, E.; Iijima, M. Greenhouse Gas Control Technologies; Gale, J., Kaya, Y., Eds.; Elsevier Science Ltd.: Kyoto, Japan, 2003; Volume I. [Google Scholar]
  33. Koornneef, J.; van Keulen, T.; Faaij, A.; Turkenburg, W. Life cycle assessment of a pulverized coal power plant with post-combustion capture, transport and storage of CO2. Int. J. Greenh. Gas Control 2008, 2, 448–467. [Google Scholar] [CrossRef]
  34. Barros, M.V.; Salvador, R.; Piekarski, C.M.; de Francisco, A.C.; Freire, F.M.C.S. Life cycle assessment of electricity generation: A review of the characteristics of existing literature. Int. J. Life Cycle Assess. 2019, 25, 36–54. [Google Scholar] [CrossRef]
  35. Singh, B.; Strømman, A.H.; Hertwich, E.G. Comparative life cycle environmental assessment of CCS technologies. Int. J. Greenh. Gas Control 2011, 5, 911–921. [Google Scholar] [CrossRef]
  36. Wu, Y.; Hua, J. Investigating a Retrofit Thermal Power Plant from a Sustainable Environment Perspective—A Fuel Lifecycle Assessment Case Study. Sustainability 2022, 14, 4556. [Google Scholar] [CrossRef]
  37. Hosseini, S.M.; Kanagaraj, N.; Sadeghi, S.; Yousefi, H. Midpoint and endpoint impacts of electricity generation by renewable and nonrenewable technologies: A case study of Alberta, Canada. Renew. Energy 2022, 197, 22–39. [Google Scholar] [CrossRef]
  38. Türkmen, B.A. Environmental performance of high-efficiency natural gas combined cycle plant. Energy Sources Part A Recover. Util. Environ. Eff. 2021, 44, 57–74. [Google Scholar] [CrossRef]
  39. Gargiulo, A.; Carvalho, M.L.; Girardi, P. Life Cycle Assessment of Italian Electricity Scenarios to 2030. Energies 2020, 13, 3852. [Google Scholar] [CrossRef]
  40. Viebahn, P.; Nitsch, J.; Fischedick, M.; Esken, A.; Schüwer, D.; Supersberger, N.; Zuberbühler, U.; Edenhofer, O. Comparison of carbon capture and storage with renewable energy technologies regarding structural, economic, and ecological aspects in Germany. Int. J. Greenh. Gas Control 2007, 1, 121–133. [Google Scholar] [CrossRef]
  41. Al Monsur, A.; Paddo, A.R.; Mohammedy, F.M. Life Cycle Assessment of Climate Change and GHG Emission from Natural Gas Thermal Power Plant. In Proceedings of the 2020 IEEE Region 10 Symposium (TENSYMP), Dhaka, Bangladesh, 5–7 June 2020; pp. 1628–1631. [Google Scholar] [CrossRef]
  42. Agrawal, K.K.; Jain, S.; Jain, A.K.; Dahiya, S. A life cycle environmental impact assessment of natural gas combined cycle thermal power plant in Andhra Pradesh, India. Environ. Dev. 2014, 11, 162–174. [Google Scholar] [CrossRef]
  43. Annisa, R.; Faridah, L.; Yuliawan, D.M.; Sinisuka, N.I.; Dinata, I.S.; Leilan, F.; Revina, T.; Iman, D.; Darma, S. Environmental Impact Assessment of Steam Cycle and Combine Cycle Power Plants Using Life Cycle Assessment Methodology. In Proceedings of the 2018 Conference on Power Engineering and Renewable Energy (ICPERE), Solo, Indonesia, 29–31 October 2018; pp. 1–6. [Google Scholar] [CrossRef]
  44. Kannan, R.; Leong, K.; Osman, R.; Ho, H.; Tso, C. Gas fired combined cycle plant in Singapore: Energy use, GWP and cost—A life cycle approach. Energy Convers. Manag. 2005, 46, 2145–2157. [Google Scholar] [CrossRef]
  45. Fadeyi, S.; Arafat, H.A.; Abu-Zahra, M.R. Life cycle assessment of natural gas combined cycle integrated with CO2 post combustion capture using chemical solvent. Int. J. Greenh. Gas Control 2013, 19, 441–452. [Google Scholar] [CrossRef]
  46. Huijbregts, M.A.J. ReCiPe 2016 A Harmonized Life Cycle Impact Assessment Method at Midpoint and Endpoint Level Report I: Characterization; RIVM: Bilthoven, The Netherlands, 2016. [Google Scholar]
  47. Bare, J. TRACI 2.0: The tool for the reduction and assessment of chemical and other environmental impacts 2.0. Clean Technol. Environ. Policy 2011, 13, 687–696. [Google Scholar] [CrossRef]
  48. Jolliet, O.; Margni, M.; Charles, R.; Humbert, S.; Payet, J.; Rebitzer, G.; Rosenbaum, R. IMPACT 2002+: A new life cycle impact assessment methodology. Int. J. Life Cycle Assess. 2003, 8, 324–330. [Google Scholar] [CrossRef]
  49. World Bank Group. Iraq—Emergency Electricity Reconstruction Project: Environmental Assessment (Vol. 2) Rapid Risk Assessment of Atmospheric Dispersion of Stack Emissions from Al-Hartha Power Plant (English); World Bank Group: Washington, DC, USA, 2006; Available online: http://documents.worldbank.org/curated/en/640751468253482219/Rapid-risk-assessment-of-atmospheric-dispersion-of-stack-emissions-from-Al-Hartha-power-plant (accessed on 1 November 2022).
  50. JICA. Baseline Survey for Supporting Electric Power Sector in Republic of Iraq Final Report; Japan International Cooperation Agency: Tokyo, Japan, 2004. [Google Scholar]
  51. MHPS. MHPS Receives Order for Refurbishment of Unit 1 at Hartha Thermal Power Station in Iraq—Project to Restore Gas-and Oil-Fired Steam Turbine Equipment to the Rated 200 MW; Mitsubishi Heavy Industries, Ltd.: Yokohama, Japan, 2018. [Google Scholar]
  52. Liang, Z.; Rongwong, W.; Liu, H.; Fu, K.; Gao, H.; Cao, F.; Zhang, R.; Sema, T.; Henni, A.; Sumon, K.Z.; et al. Recent progress and new developments in post-combustion carbon-capture technology with amine based solvents. Int. J. Greenh. Gas Control 2015, 40, 26–54. [Google Scholar] [CrossRef]
  53. Hasan, S.; Abbas, A.; Nasr, G. Improving the Carbon Capture Efficiency for Gas Power Plants through Amine-Based Absorbents. Sustainability 2020, 13, 72. [Google Scholar] [CrossRef]
  54. Chowdhury, F.A.; Yamada, H.; Matsuzaki, Y.; Goto, K.; Higashii, T.; Onoda, M. Development of Novel Synthetic Amine Absorbents for CO2 Capture. Energy Procedia 2014, 63, 572–579. [Google Scholar] [CrossRef] [Green Version]
  55. Hirata, T.; Kishimoto, S.; Shimada, D.; Kawasaki, S. MHI’s Commercial Experiences with CO2 Capture and Recent R&D Activities. In Mitsubishi Heavy Industries Technical Review; Mitsubishi Heavy Industries, Ltd.: Yokohama, Japan, 2018. [Google Scholar]
  56. Peeters, A.; Faaij, A.; Turkenburg, W. Techno-economic analysis of natural gas combined cycles with post-combustion CO2 absorption, including a detailed evaluation of the development potential. Int. J. Greenh. Gas Control 2007, 1, 396–417. [Google Scholar] [CrossRef]
  57. Kadono, K.; Suzuki, A.; Iijima, M.; Ohishi, T.; Tanaka, H.; Hirata, T.; Kondo, M. New Energy Efficient Processes and Newly Developed Absorbents for Flue Gas CO2 Capture. Energy Procedia 2013, 37, 1785–1792. [Google Scholar] [CrossRef]
  58. Jha, A.; Ravuru, V.; Yadav, M.; Mandal, S.; Das, A. A Critical Analysis of CO2 Capture Technologies. Hydrocarb. Process. 2021, 6, 59–65. [Google Scholar]
  59. Heijungs, R.; Guinée, J.B.; Huppes, G.; Lankreijer, R.M.; Udo de Haes, H.A.; Wegener Sleeswijk, A.; Ansems, A.M.M.; Eggels, P.G.; van Duin, R.; Goede, H.P.; et al. Environmental Life Cycle Assessment of Products: Guide and Backgrounds; Centre of Environmental Science: Leiden, The Netherlands, 1992. [Google Scholar]
  60. Eggleston, H.S.; Buendia, L.; Miwa, K.; Ngara, T.; Tanabe, K. IPCC 2006. Japan: The Institute for Global Environmental Strategies (IGES); IPCC: Geneva, Switzerland, 2006. [Google Scholar]
  61. van Zelm, R.; Preiss, P.; van Goethem, T.; Van Dingenen, R.; Huijbregts, M. Regionalized life cycle impact assessment of air pollution on the global scale: Damage to human health and vegetation. Atmospheric Environ. 2016, 134, 129–137. [Google Scholar] [CrossRef]
  62. Roy, P.-O.; Huijbregts, M.; Deschênes, L.; Margni, M. Spatially-differentiated atmospheric source–receptor relationships for nitrogen oxides, sulfur oxides and ammonia emissions at the global scale for life cycle impact assessment. Atmospheric Environ. 2012, 62, 74–81. [Google Scholar] [CrossRef]
  63. Panja, P.; McPherson, B.; Deo, M. Techno-Economic Analysis of Amine-based CO2 Capture Technology: Hunter Plant Case Study. Carbon Capture Sci. Technol. 2022, 3. [Google Scholar] [CrossRef]
  64. Ecoinvent. Database. 2019. Available online: https://www.ecoinvent.org/ (accessed on 12 November 2019).
  65. Goedkoop, M.; Oele, M.; Leijting, J.; Ponsioen, T.; Meijer, E. Introduction to LCA with SimaPro Title: Introduction to LCA with SimaPro. 2016. Available online: www.pre-sustainability.com (accessed on 10 August 2022).
  66. Mcpherson, B. Carbonsafe Rocky Mountain Phase I: Ensuring Safe Subsurface Storage of Carbon Dioxide in the Intermountain WEST Final Report; University of Utah: Salt Lake City, UT, USA, 2017. [Google Scholar]
  67. Bellotti, D.; Rivarolo, M.; Magistri, L.; Massardo, A. Feasibility study of methanol production plant from hydrogen and captured carbon dioxide. J. CO2 Util. 2017, 21, 132–138. [Google Scholar] [CrossRef]
  68. Ravikumar, D.; Keoleian, G.; Miller, S. The environmental opportunity cost of using renewable energy for carbon capture and utilization for methanol production. Appl. Energy 2020, 279, 115770. [Google Scholar] [CrossRef]
  69. Koiwanit, J.; Piewkhaow, L.; Zhou, Q.; Manuilova, A.; Chan, C.W.; Wilson, M.; Tontiwachwuthikul, P. A life cycle assessment study of a Canadian post-combustion carbon dioxide capture process system. Int. J. Life Cycle Assess. 2013, 19, 357–369. [Google Scholar] [CrossRef]
  70. von der Assen, N.; Müller, L.J.; Steingrube, A.; Voll, P.; Bardow, A. Selecting CO2 Sources for CO2 Utilization by Environmental-Merit-Order Curves. Environ. Sci. Technol. 2016, 50, 1093–1101. [Google Scholar] [CrossRef]
  71. CMU IECM Technical Documentation: Amine-based Post-Combustion CO2 Capture. Pittsburgh, PA, USA. 2018. Available online: www.iecm-online.com (accessed on 1 August 2022).
  72. Rao, A.B.; Rubin, E.S. A Technical, Economic, and Environmental Assessment of Amine-Based CO2 Capture Technology for Power Plant Greenhouse Gas Control. Environ. Sci. Technol. 2002, 36, 4467–4475. [Google Scholar] [CrossRef] [Green Version]
  73. U.S. Environmental Protection Agency. Exposure Factors Handbook; EPA/600/P-95/002Fa-c; U.S. Environmental Protection Agency: Washington, DC, USA, 1997.
  74. United Nations. World Population Prospects: The 2008 Revision; United Nations: New York, NY, USA, 2009. [Google Scholar]
  75. Jane Bare TRACI V 2.1. 2012. Available online: https://www.epa.gov/chemical-research/tool-reduction-and-assessment-chemicals-and-other-environmental-impacts-traci (accessed on 1 December 2022).
  76. Ou, Y.; Zhai, H.; Rubin, E.S. Life cycle water use of coal- and natural-gas-fired power plants with and without carbon capture and storage. Int. J. Greenh. Gas Control 2016, 44, 249–261. [Google Scholar] [CrossRef]
  77. Humbert, S. Geographically Differentiated Life-Cycle Impact Assessment of Human Health. Ph.D. Thesis, University of California, Berkeley, CA, USA, 2009. [Google Scholar]
  78. Humbert, S.; Marshall, J.D.; Shaked, S.; Spadaro, J.V.; Nishioka, Y.; Preiss, P.; McKone, T.E.; Horvath, A.; Jolliet, O. Intake Fraction for Particulate Matter: Recommendations for Life Cycle Impact Assessment. Environ. Sci. Technol. 2011, 45, 4808–4816. [Google Scholar] [CrossRef]
  79. Wang, E.; Shen, Z. A hybrid Data Quality Indicator and statistical method for improving uncertainty analysis in LCA of complex system—application to the whole-building embodied energy analysis. J. Clean. Prod. 2013, 43, 166–173. [Google Scholar] [CrossRef]
  80. Weidema, B.P.; Wesnæs, M. Data quality management for life cycle inventories—an example of using data quality in-dicators☆. J. Clean. Prod. 1996, 4, 167–174. [Google Scholar] [CrossRef]
  81. Barahmand, Z.; Eikeland, M.S. Life Cycle Assessment under Uncertainty: A Scoping Review. World 2022, 3, 692–717. [Google Scholar] [CrossRef]
  82. Heijungs, R.; Huijbregts, M.A.J. A Review of Approaches to Treat Uncertainty in LCA. International Congress on Environmental Modelling and Software. 197. 2004. Available online: https://scholarsarchive.byu.edu/iemssconference/2004/all/197 (accessed on 1 November 2022).
  83. Huijbregts, M.A.J. Uncertainty and Variability in Environmental Life-Cycle Assessment. Ph.D. Thesis, Universiteit van Amsterdam, Amsterdam, The Netherlands, 2001. [Google Scholar]
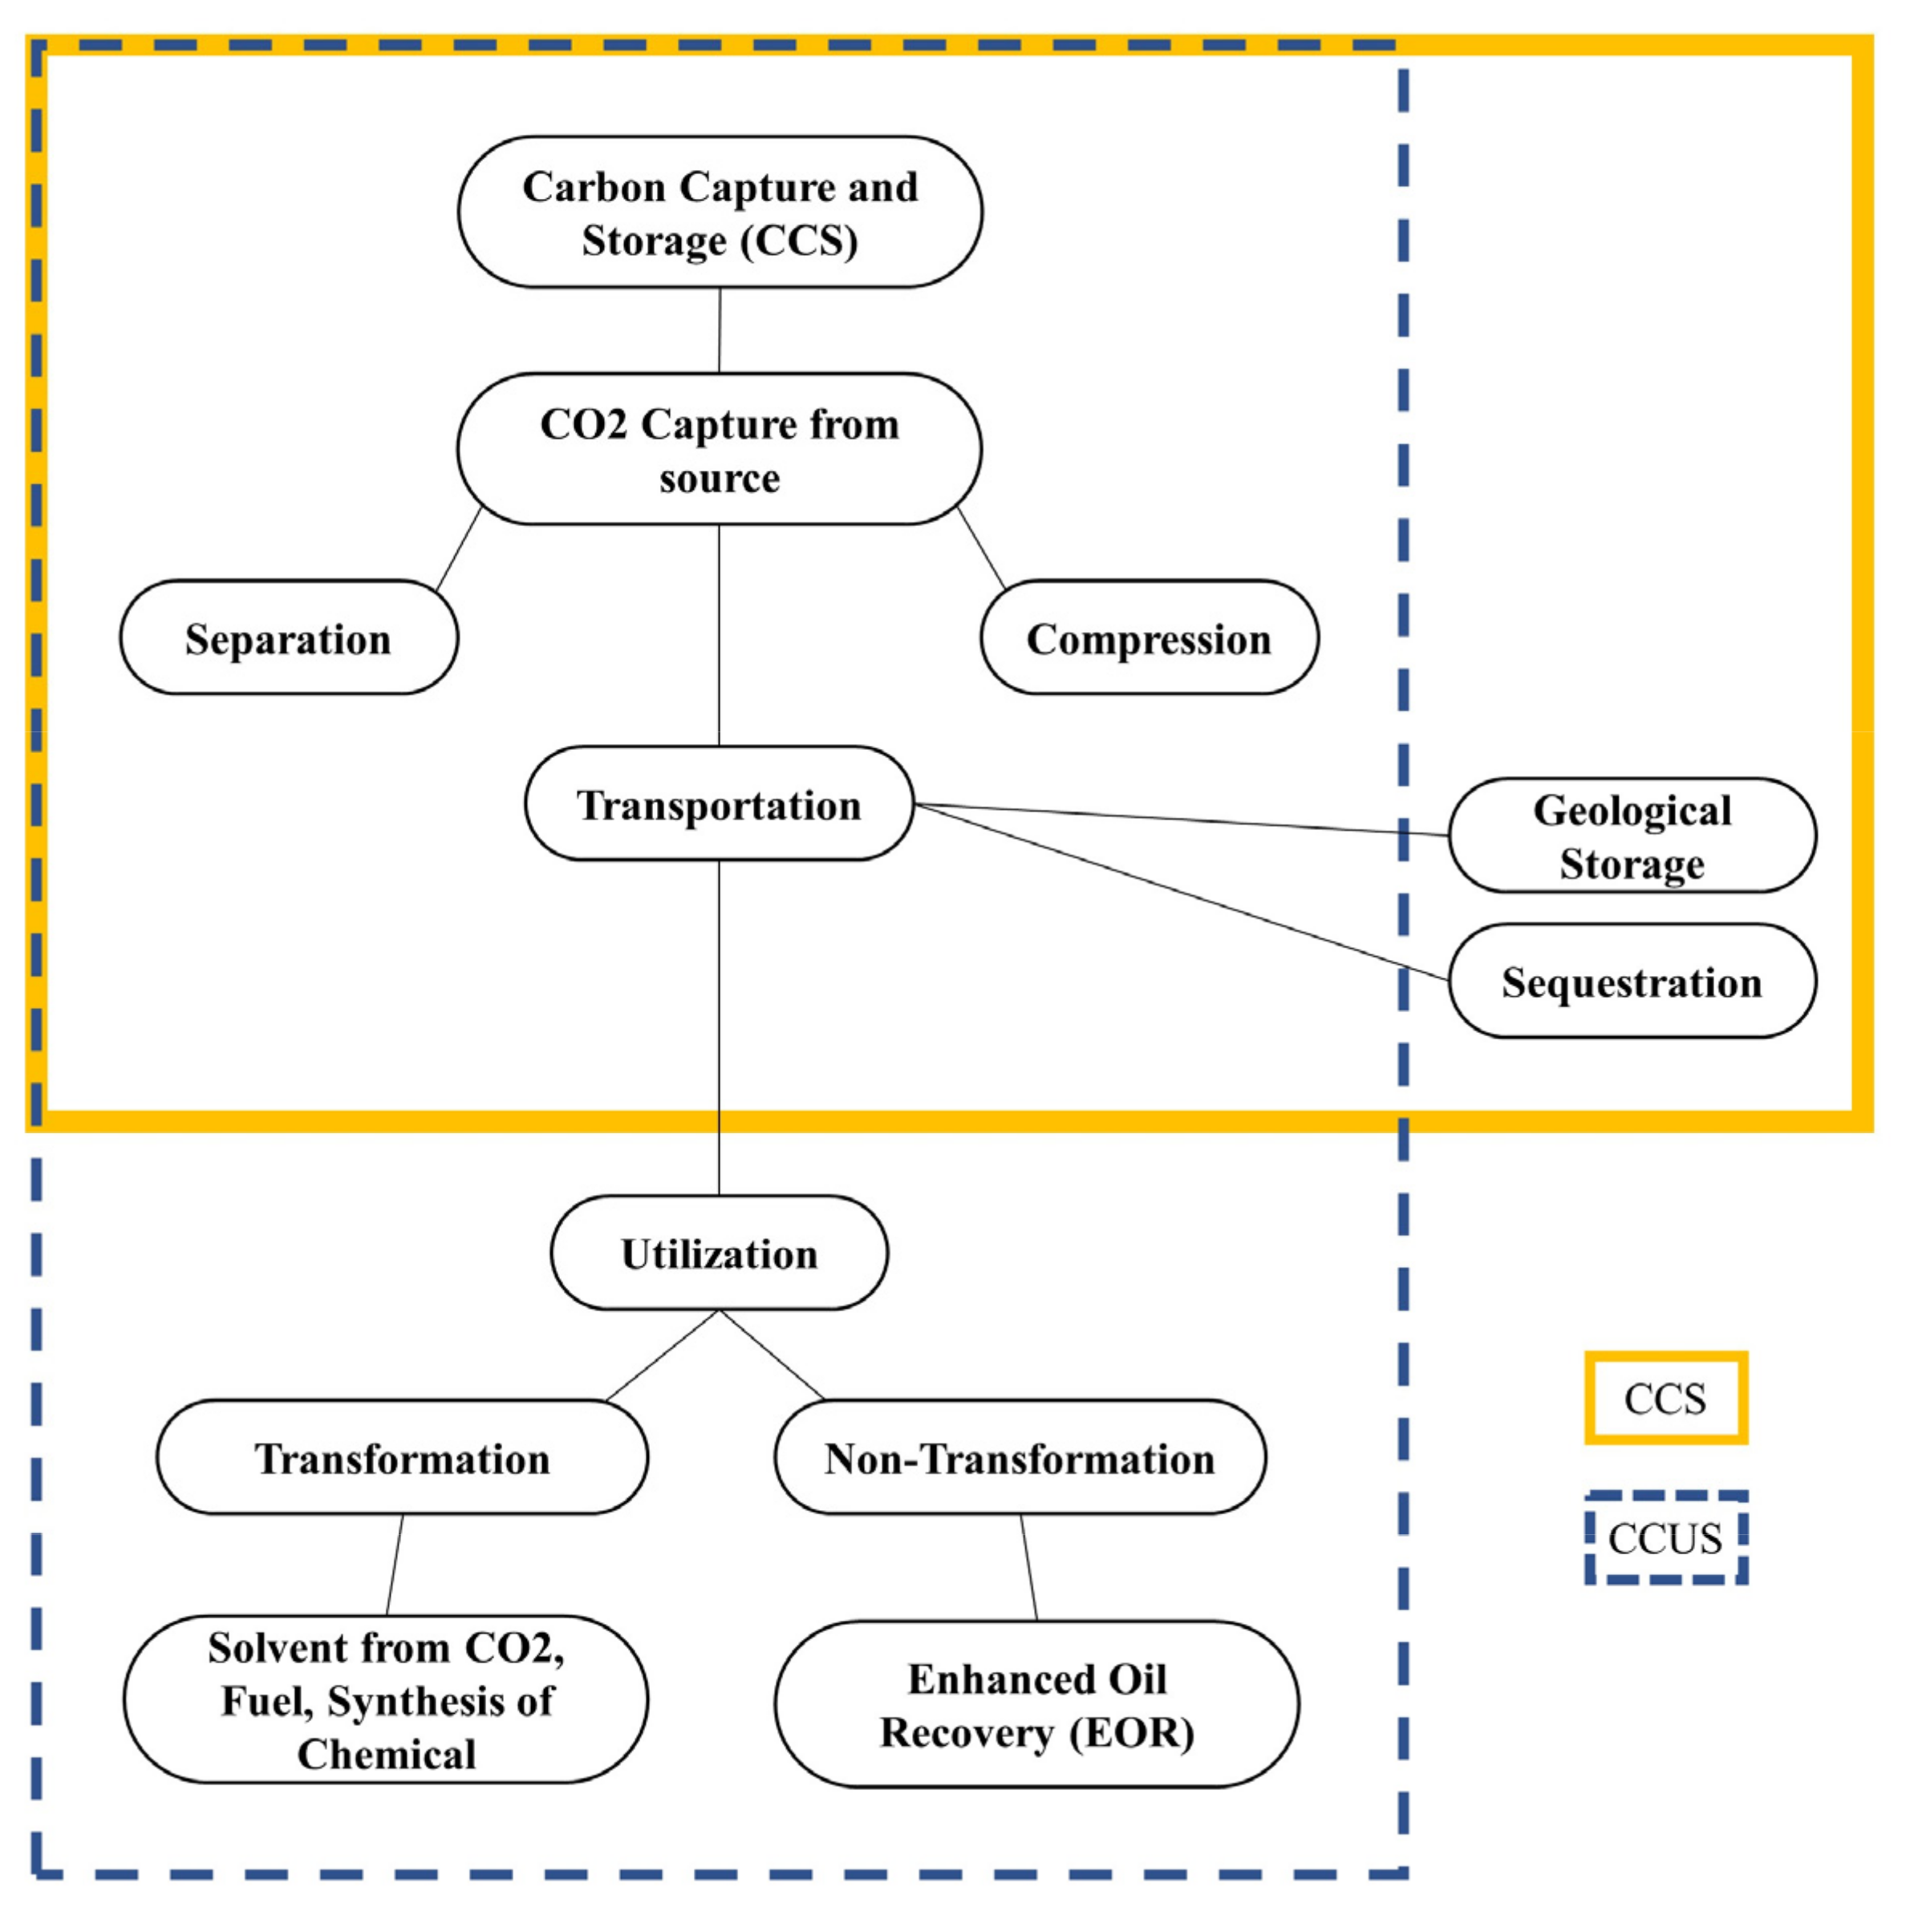
Figure 1. Difference between the CCS and CCUS plant.
Energies 16 01545 g001
Figure 2. LCA framework employed in this study to evaluate the environmental Impact assessment of NGCC with carbon capture system.
Energies 16 01545 g002
Figure 3. Hartha power plant location.
Energies 16 01545 g003
Figure 4. Amine scrubbing unit.
Energies 16 01545 g004
Figure 5. (a) Life cycle boundaries for attaching existing NGCC power plants with CO2 Capture Plant (b) Life cycle boundaries for construction of new NGCC power plants with CO2 Capture Plant.
Energies 16 01545 g005
Figure 6. GWP Impact score and process contribution.
Energies 16 01545 g006
Figure 7. AP Impact score and process contribution.
Energies 16 01545 g007
Figure 8. PMFP impact score and process contribution.
Energies 16 01545 g008
Figure 9. Process contribution (a,c,e) is the share of GWP, AP, PMFP for the grassroots scenario, respectively, (b,d,f) is the share of GWP, AP, PMFP for the retrofit scenario, respectively.
Energies 16 01545 g009
Figure 10. Relative impact analysis for both scenarios.
Energies 16 01545 g010
Figure 11. Distribution of probability index of GWP.
Energies 16 01545 g011
Figure 12. Distribution of probability index of AP.
Energies 16 01545 g012
Figure 13. Distribution of probability index of PMFP.
Energies 16 01545 g013
Table 1. Previous LCA studies and methods used for LCIA on CCS in NGCC power plants.
AreaLife Cycle InventoryLCIA MethodImpact CategoriesRef.
NorwayNorway 2000 statistical database, modeling data, Ecoinvent v2ReCiPe 2008GWP, AP, MEP, POFP, PMFP, HTP, TETP, FAETP, MAETP[35]
TaiwanEcoinvent databaseIPCC 2007, IMPACT2002+GWP, PM10, SOx, NOx, and CO[36]
CanadaEcoinvent 3.7.1 database, specific regional dataReCiPe 2016 Endpoint,
Cumulative Energy Demand (CED)
PMFP, FRS, MEC, MRS, TEC, FEC, FEU, LU, GWP, HCT, HnCT, IR, MEU, OFHH, OFTE, SOD, TWC, and TAC [37]
TurkeyEcoinvent, Öko Institute, Sphera databaseCML 2001ADP, AP, EP, FAETP, GWP, HTP, MAETP, ODP, POCP, TETP[38]
ItalyItalian power plants, Eurostat, TERNA, INECP, Ecoinvent 3.3Different methods appliedGWP, FEU, MAETP, MEP, POFP,PMFP, HTP, TETP, FAETP, ODP[39]
GermanyUmberto LCA database, Ecoinvent v1.01UBA-VerfahrenGWP, PMFP, HTP, POFP, ADP[40]
BangladeshPlant authority,
Ecoinvent database V3
CML 2001 and
Eco-Indicator 99 (H)
GHG, CCP[41]
IndiaPlant Visit, Ecoinvent
Database V2.2
Eco-Indicator 99 (H), CML 2001GWP, AP, EP
HTP, MAETP, FAETP
[42]
IndonesiaIndustrial dataCML, ILCD. and ReCiPe
IPCC 2013, IPCC 2007
GWP, AP, POCP, EP, PMFP[43]
SingaporeLiteratureIPCC 2000GWP[44]
AlgeriaEcoinvent V2.2Not mentionedGWP, AP, TETP, MAETP, FAETP, MEP, POFP[45]
Table 2. Key parameters of the Hartha power plant.
ParameterValue 1
Net power output (MW)371
Annual load (hours)7451
Net power plant efficiency (%)33
Number of stacks4
Height of stack, (m)100
Natural gas Specific gravity0.7076
Natural gas consumption rate (kg/kWh)280
Lifetime (years)10
Industrial wastewater effluents discharge (m3/h)350 2
Flow rate of cooling water (m3/h)101,400 2
CO2 flue gas (1000 m3/h)252 2
CO flue gas (1000 m3/h)194 2
SO2 flue gas (1000 m3/h)15 2
1 Power plant data [49]; 2 [50].
Table 3. KM-CDR CO2 capture facility and quality requirements.
Parameter90% Capture
Purity of CO2 stream (%)≥95
Temperature of CO2 product (°C95
Stream pressure of CO2 product (psia)2215
CO2 emissions (lb/MWh)193
Steam 1 (ton/tCO2)1.19
Cooling Water 2 (ton/tCO2)105
1 [57]; 2 [58].
Table 4. Basic components used in the power plant and MEA capture plant in this study.
ComponentRef.
Construction
Power PlantEoinvent Database, Gas power plant, combined cycle, 400 MW construction[64,65]
MEA plant 1 [tonne]
Stripper Stainless steel4107.1[66]
Absorber Stainless steel2657.4[66]
Reboiler Stainless steel3060.1[66]
Pre-scrubber Stainless steel1911.4[66]
Amine recovery tank HDLPE 2945.8[66]
Condensate tank HDLPE1527.5[66]
Amine storage tank HDLPE1436.5[66]
Reclaimer polyethylene tank HDLPE3874.3[66]
NaOH storage polyethylene tank HDLPE792.1[66]
Piping and small equipment Stainless steel4107.1[66]
Concrete Reinforced191.6[66]
Operation (Chemicals) [kg/tCO2]
Activated carbon 0.059[67,68]
MEA input 1.65[69]
NaOH 0.1565[67,70]
Water655[68,70]
Utility (kWh/tCO2)
Electricity 3230[68]
1 Based on MHI design; 2 (HDLPE) High Density Linear Polyethylene; 3 Equivalence of heat used for CO2 capture.
Table 5. Simulation results of the proposed CO2 capture plant for the Hartha power plant.
Simulation ResultsNominal Value
CO2 removal efficiency a90%
NO2 removal efficiency a25%
SO2 removal efficiency a99%
PM10 removal efficiency a50%
MEA concentration (wt) a32%
Activated Carbon Flow Rate (tonne/h)0.007245
Cooling water Make-up (tonne/h)0.0228
Captured CO2 Flow Rate (tonne/h)96.62
Scrubber Solids Disposed Flow Rate (tonne/h)0.01969
Flue Gas Fan Use (MW)3.742
Sorbent Pump Use (MW)0.1916
CO2 Compression Use (MW)8.985
Sorbent Regen. Equiv. Energy (MW)28.16
Amine Steam Use (Elec. Equiv.) (MW)28.16
CO2 Pressure (MPa)13.74
a IECM 11.5 default.
Table 6. Absolute characterization scores using various methods.
Impact CategoriesGWP (kg CO2 eq)PMFP (g PM2.5 eq)AP (g SO2 eq)
Life Cycle Impact Assessment Method (LCIA) ReCipe 2016 Midpoint (H)TRACI 2.1IMPACT 2002+ V2.15ReCipe 2016 Midpoint (H)TRACI 2.1IMPACT 2002+ V2.15ReCipe 2016 Midpoint (H)TRACI 2.1IMPACT 2002+ V2.15
Total ImpactRetrofit0.1780.1750.1720.210.0450.10.690.820.82
Grassroots0.1270.1250.1230.240.0510.10.810.90.93
InfrastructureRetrofit0.00410.004080.003980.0060.0040.0040.010.0140.014
Grassroots0.00240.002390.002330.0050.0030.0040.0110.0130.014
Direct Emissions1Retrofit0.09640.095200.093600.0420.0060.0420.1320.2340.234
Grassroots0.07210.071500.070600.0360.0040.0380.1160.2120.212
Natural Gas ProductionRetrofit0.07530.073900.072200.1590.0350.0530.5370.5660.566
Grassroots0.05030.049400.048200.1980.0430.060.6770.6960.696
Indirect Emissions2Retrofit0.00210.002060.001950.0030.0020.0020.0070.0080.008
Grassroots0.00210.002060.001950.0030.0020.0020.0070.0090.010
1 Direct emissions include flue gas emissions directly from the power plant and capture plant operation (Direct consumption of the Natural gas and electricity required for the operation of the capture plant). 2 Indirect emissions include monoethanolamine, sodium hydroxide, water used and activated carbon production chain.
Table 7. Values for the parameters in the sensitivity analysis.
VariablesLower LimitUpper Limit
Activated carbon a (kg/tone CO2)0.0380.081
MEA input b (kg/tone CO2)0.23.2
NaOH a (kg/tone CO2)0.0140.3
Ammonia emissions a (kg/tone CO2)0.0360.32
MEA emissions a (g/tone CO2)0.06280.064
Water a (kg/tone CO2)2101100
Formaldehyde emissions a (g/tone CO2)0.00020.263
Acetaldehyde emissions a (g/tone CO2)0.00010.168
a [69]; b [21].
Table 8. DQI evaluation system.
Quality ScoreData Quality Indicators
ReliabilityCompletenessGeographic FactorTechnological CorrelationTemporal Factor
5Measurable data that have been verifiedDate from all sources related to the market consideredDate from the study areaProcess-related data related to enterprises and the identical technologyMore than 15 years
or unknown
4Data either validated based on assumption or measurements-based dataDate from ≥50% of relevant sources for the considered market Average data from which the study area is includedProcess data from different
enterprises with identical technology
Less than 15 years
3Data that has not been verified and is based on qualified estimationsData from ≤50% of relevant sources for the considered market Regional dataTechnologically different data but with same materials and processLess than 10 years
2Qualified estimate, data derived from theoretical informationData from a single relevant sourceNational dataData from the process studied
of the enterprise with similar
technology on the laboratory scale
Less than 6 years
1Non-qualified estimateData from a small number of sources during a short periodUnknown data or other international dataLaboratory scale of different technologyLess than 3 years to the baseline year
Table 9. Data quality assessment matrix DQI.
PhaseDatasetReliabilityCompletenessTemporal CorrelationGeographical CorrelationAdditional Technology Correlation σ 2   *
Raw materialsCement214213.05
Steel124313.05
Polyethylene233213.02
Concrete124413.05
Air emissions Carbon dioxide123111.12
Methane123211.52
Carbon monoxide134225.06
Hydrogen dioxide123211.52
Sulfur dioxide134311.21
Nitrogen dioxide124211.56
Ammonia123111.52
PM 2.5 μm223513.05
PM 10 μm124212.05
Water emissions COD145511.59
Ammonia123411.52
Soil emissionsLead122421.51
Chromium123411.52
Arsenic214211.56
Cadmium124311.57
Mercury233211.53
Waste treatmentWater124415.06
* Square of the standard deviation, which indicates if the data used are appropriate for this investigation. Color gradients represents the chosen DQI index from (1–5).
Table 10. Uncertainty analysis of two scenarios, method: ReCipe 2016 Midpoint (H), characterization at 95% confidence level.
Impact CategoryScenario UnitMeanMedianCVSDSEM
GWPRetrofit(kg CO2 eq)0.1780.1769.32%0.01665.26 × 10−4
Grassroots0.1270.1268.34%0.01063.34 × 10−4
PMFPRetrofit(kg PM2.5 eq)2.24 × 10−42.19 × 10−415.2%3.41 × 10−51.08 × 10−6
Grassroots2.57 × 10−42.51 × 10−416.8%4.32 × 10−51.37 × 10−6
APRetrofit(kg SO2 eq)8.04 × 10−47.91 × 10−415%1.21 × 10−43.81 × 10−6
Grassroots9.27 × 10−49.06 × 10−415.9%1.47 × 10−44.66 × 10−6
Disclaimer/Publisher’s Note: The statements, opinions and data contained in all publications are solely those of the individual author(s) and contributor(s) and not of MDPI and/or the editor(s). MDPI and/or the editor(s) disclaim responsibility for any injury to people or property resulting from any ideas, methods, instructions or products referred to in the content.