1. Introduction
Transportation is responsible for a substantial portion of worldwide energy GHG (greenhouse gas) emissions. In 2019, direct GHG emissions from the transport sector accounted for 23% of global energy-related CO
2 emissions. Actually, 70% of transport emissions came from road vehicles [
1]. However, while emissions from other sectors are generally decreasing, those caused by road transport within the European Union (EU) countries have increased by almost 28% above the 1990 level [
2].
The development of advanced powertrain and driveline systems play a key role in reducing energy consumption and meeting CO
2 targets for light duty vehicles [
3]. Electric vehicles (EVs) represent an effective countermeasure to mitigate the issues concerning climate change and emissions. They have many benefits, such as high energy conversion efficiency, no exhaust emissions, the possibility of using clean energy and low noise emissions. Thus, electric vehicles offer the potential to drastically reduce GHG emissions and noise pollution. The main weakness is their limited driving range compared with conventional vehicles. Ultra-efficient lightweight EVs [
4,
5] are a practicable solution to this problem.
To this end, the energy consumption evaluation, the analysis of the main parameters affecting the power demand and their optimization are increasingly popular topics in the field of scientific research. These issues are commonly addressed by employing Model-Based Design (MBD) approaches [
6,
7,
8,
9,
10]. Major benefits are related to the potential of multidisciplinary modeling, handling the large number of variables involved and the complex nonlinear relationship between them to better understand the complex interaction between component systems and the overall system behavior.
The driving profile is one of the parameters that most affects the efficiency of vehicles during their use [
11,
12]. In the literature, driving control techniques that aim at reducing the energy demand are classified in the context of “eco-driving” strategies [
13]. The topic of driving profile optimization has been investigated in recent years [
14,
15]. Dib et al. [
16] solve the control problem of finding the optimal speed trajectory of an EV that minimizes the energy consumption over a time and distance horizon. Results assess the validity of applying eco-driving based approaches to improve vehicles’ energy saving.
The definition of the optimal driving strategy, aimed at minimizing energy consumption, is of primary importance for vehicles employed in energy-efficiency competitions. In [
5], the authors develop a tank-to-wheel multi-physics model of a battery electric vehicle (BEV) for energy-efficiency competitions. The model is employed for optimizing the driving strategy and the transmission ratio, with the objective of minimizing energy consumption. An energy saving of 9% is achieved with respect to a non-optimized driving strategy. The optimization of the BEV race strategy proposed in [
17] allows to determine the optimal timing and extent of the input throttle provided by the driver. To solve the optimal control problem, a measurement-based mathematical model of the vehicle is built, modeling the main vehicle power dissipation sources. The application of the driving strategy optimization results in about 5.5% energy saving compared to a reference strategy.
Other examples of driving strategy optimization applied to highly energy-efficient vehicles can be found in [
18,
19,
20].
However, eco-driving strategies are more difficult to manage when faced with complex urban scenarios and differing traffic conditions. In the literature, several attempts of power management strategies, considering interaction with other vehicles and the influence of urban scenarios, are proposed. Ozatay et al. [
21] seek the optimal speed profile that minimizes the fuel consumption on a given route with multiple traffic lights. The work in [
22] aims at evaluating the impact of various traffic conditions on the energy consumption of an electric vehicle. EVs appear more efficient in urban and suburban traffic conditions characterized by low average speed and frequent stop-and-go. In [
23], the energy consumption of four vehicles featuring different types of powertrains under various traffic scenarios is investigated. Wang and Lin [
24] propose a model predictive control able to define the optimal eco-driving strategy according to different urban scenarios. Simulations, performed exploiting a realistic urban traffic simulation environment, result in a 34% reduction in fuel consumption. In [
25], the adaptability to various traffic conditions provides the opportunity of enhancing the potential in energy saving for the proposed power management system.
The abovementioned eco-driving control strategies study the relationship between vehicles’ energy demand, traffic conditions and urban scenarios. However, the used simulation methods prevent considering the influence of the human factor in the driving strategy (i.e., how driver behavior can affect the energy consumption).
With the aim of filling this gap, driving simulators are broadly applied in the field of transport systems and automotive industry. The use of driving simulators has spread due to the increasing demand of fast, cost-effective and safe tools for testing the interaction between the vehicle, driver and surrounding scenario. Driving simulators enable the study of human factors [
26].
In the context of studying the effect of traffic, the urban scenario and human factors on vehicle energy management, some works have been found in the scientific literature. The work presented in [
27] combines three types of simulators (driving, traffic and network) for testing and evaluation of C-ITS (cooperative intelligent transport systems) applications. The driving simulator enables studies from the driver’s perspective, communication-related issues are addressed by the network simulator, and impacts of C-ITS on the traffic systems are analyzed using the traffic simulator. In [
28], a high-level controller is tested by a driver in the loop to assess the limits between virtual simulation and real driver response in a lap time condition. The focus is on the dynamic behavior of active safety systems—in particular, traction control. Some differences are reported between the behavior of the driver model and the driver in the loop, especially regarding the sensitivity to external disturbances. Daun et al. [
29] describe a driving simulator experiment for evaluating the effectiveness of a predictive eco-driving assistance system (EDAS). The analysis suggests that providing eco-driving instructions yields about 6% energy saving with respect to the no-support case. The purpose of the anticipatory energy saving assistant (ANESA) tool presented by Bär et al. [
30] is to give the driver precisely timed commands regarding upcoming velocity restrictions and, thus, to drive more energy efficiently. Experiments carried out in a driving simulator show that drivers saved up to 13% on average using ANESA. In [
31], the objective is to develop a control algorithm capable of handling wheels’ torques independently to enhance vehicle dynamic behavior and to improve energy efficiency. The vehicle model, developed by means of VI-CarRealTime and Matlab-Simulink, is simulated on a static simulator.
A key factor contributing to the spread of driving simulators is represented by the deployment of digital twin (DT) models. A digital twin is defined as “an integrated multi-physics, multi-scale, probabilistic simulation of a complex product, which functions to mirror the life of its corresponding twin” [
32]. This technology creates virtual models of physical entities and simulates their behavior in a real environment. In the automotive industry, digital twins are primarily utilized for complete or partial modeling of the vehicle [
33,
34,
35,
36,
37].
The objective of this paper is to develop a digital twin model of an ultra-efficient competition electric vehicle. The vehicle model is used to solve the eco-driving control optimization problem. Then, the obtained optimal driving strategy is used as a benchmark in performing an experimental campaign on the dynamic driving simulator installed at Politecnico di Milano [
38].
The presented paper aims to overcome the main limitations of the works found in the literature. These can be summarized as follows:
Since vehicles conceived for energy-efficiency competitions require a precise evaluation of the energy demand to define the optimal driving strategy, the interaction with other vehicles running on the track needs to be considered;
When different traffic scenarios are considered, the effect of the driver’s behavior is fundamental.
The paper is structured as follows:
Section 2 describes the architecture of the vehicle and the Shell Eco-marathon competition;
Section 3 reports the digital twin models of both the vehicle and the track and their validation;
Section 4 illustrates the optimization procedure; the experimental campaign is described in
Section 5; results are discussed in
Section 6; finally, the main conclusions are summarized in
Section 7.
2. Competition and Vehicle Architecture
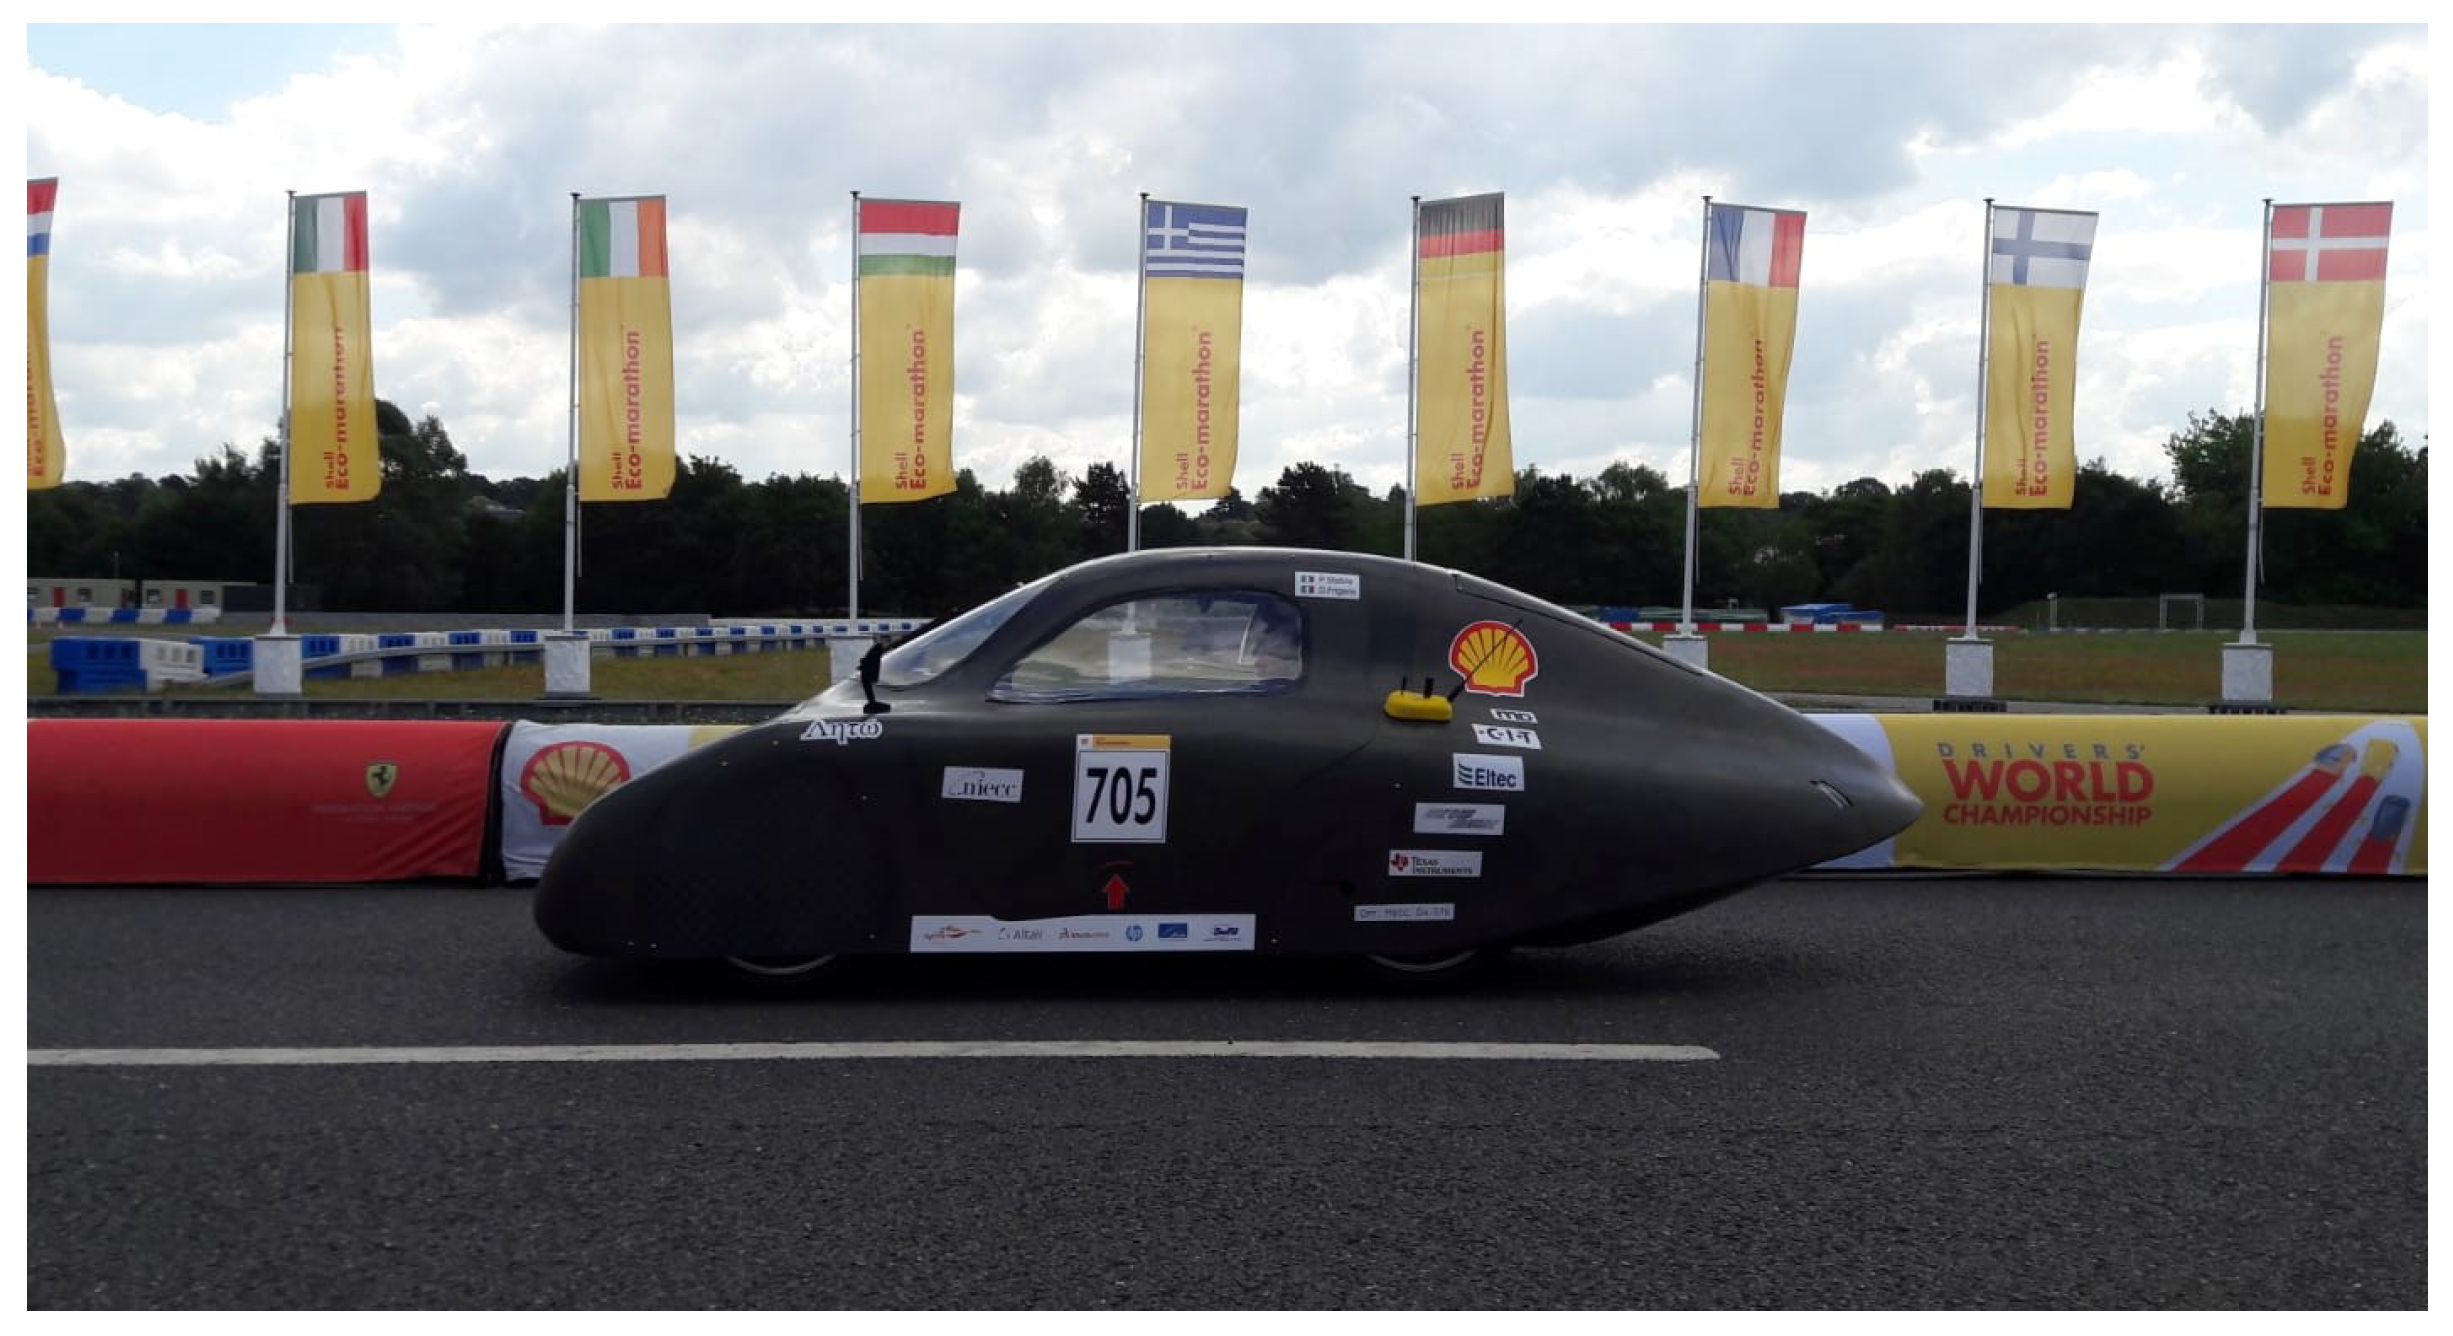
The vehicle “Leto” is a single-seater quadricycle, belonging to the urban concept class (
Figure 1). Vehicles competing in this class are closer in appearance to modern urban passenger cars.
The chassis has a monocoque structure consisting of two main parts joined together by adhesive bonding [
39]. The lower floor is a sandwich structure, realized by exploiting carbon fiber reinforced polymer (CFRP) for the external skins and expanded polypropylene (EPP) for the core. The upper body is made of CFRP and aramidic honeycomb. The external shape aims to maximize the aerodynamic efficiency of the vehicle.
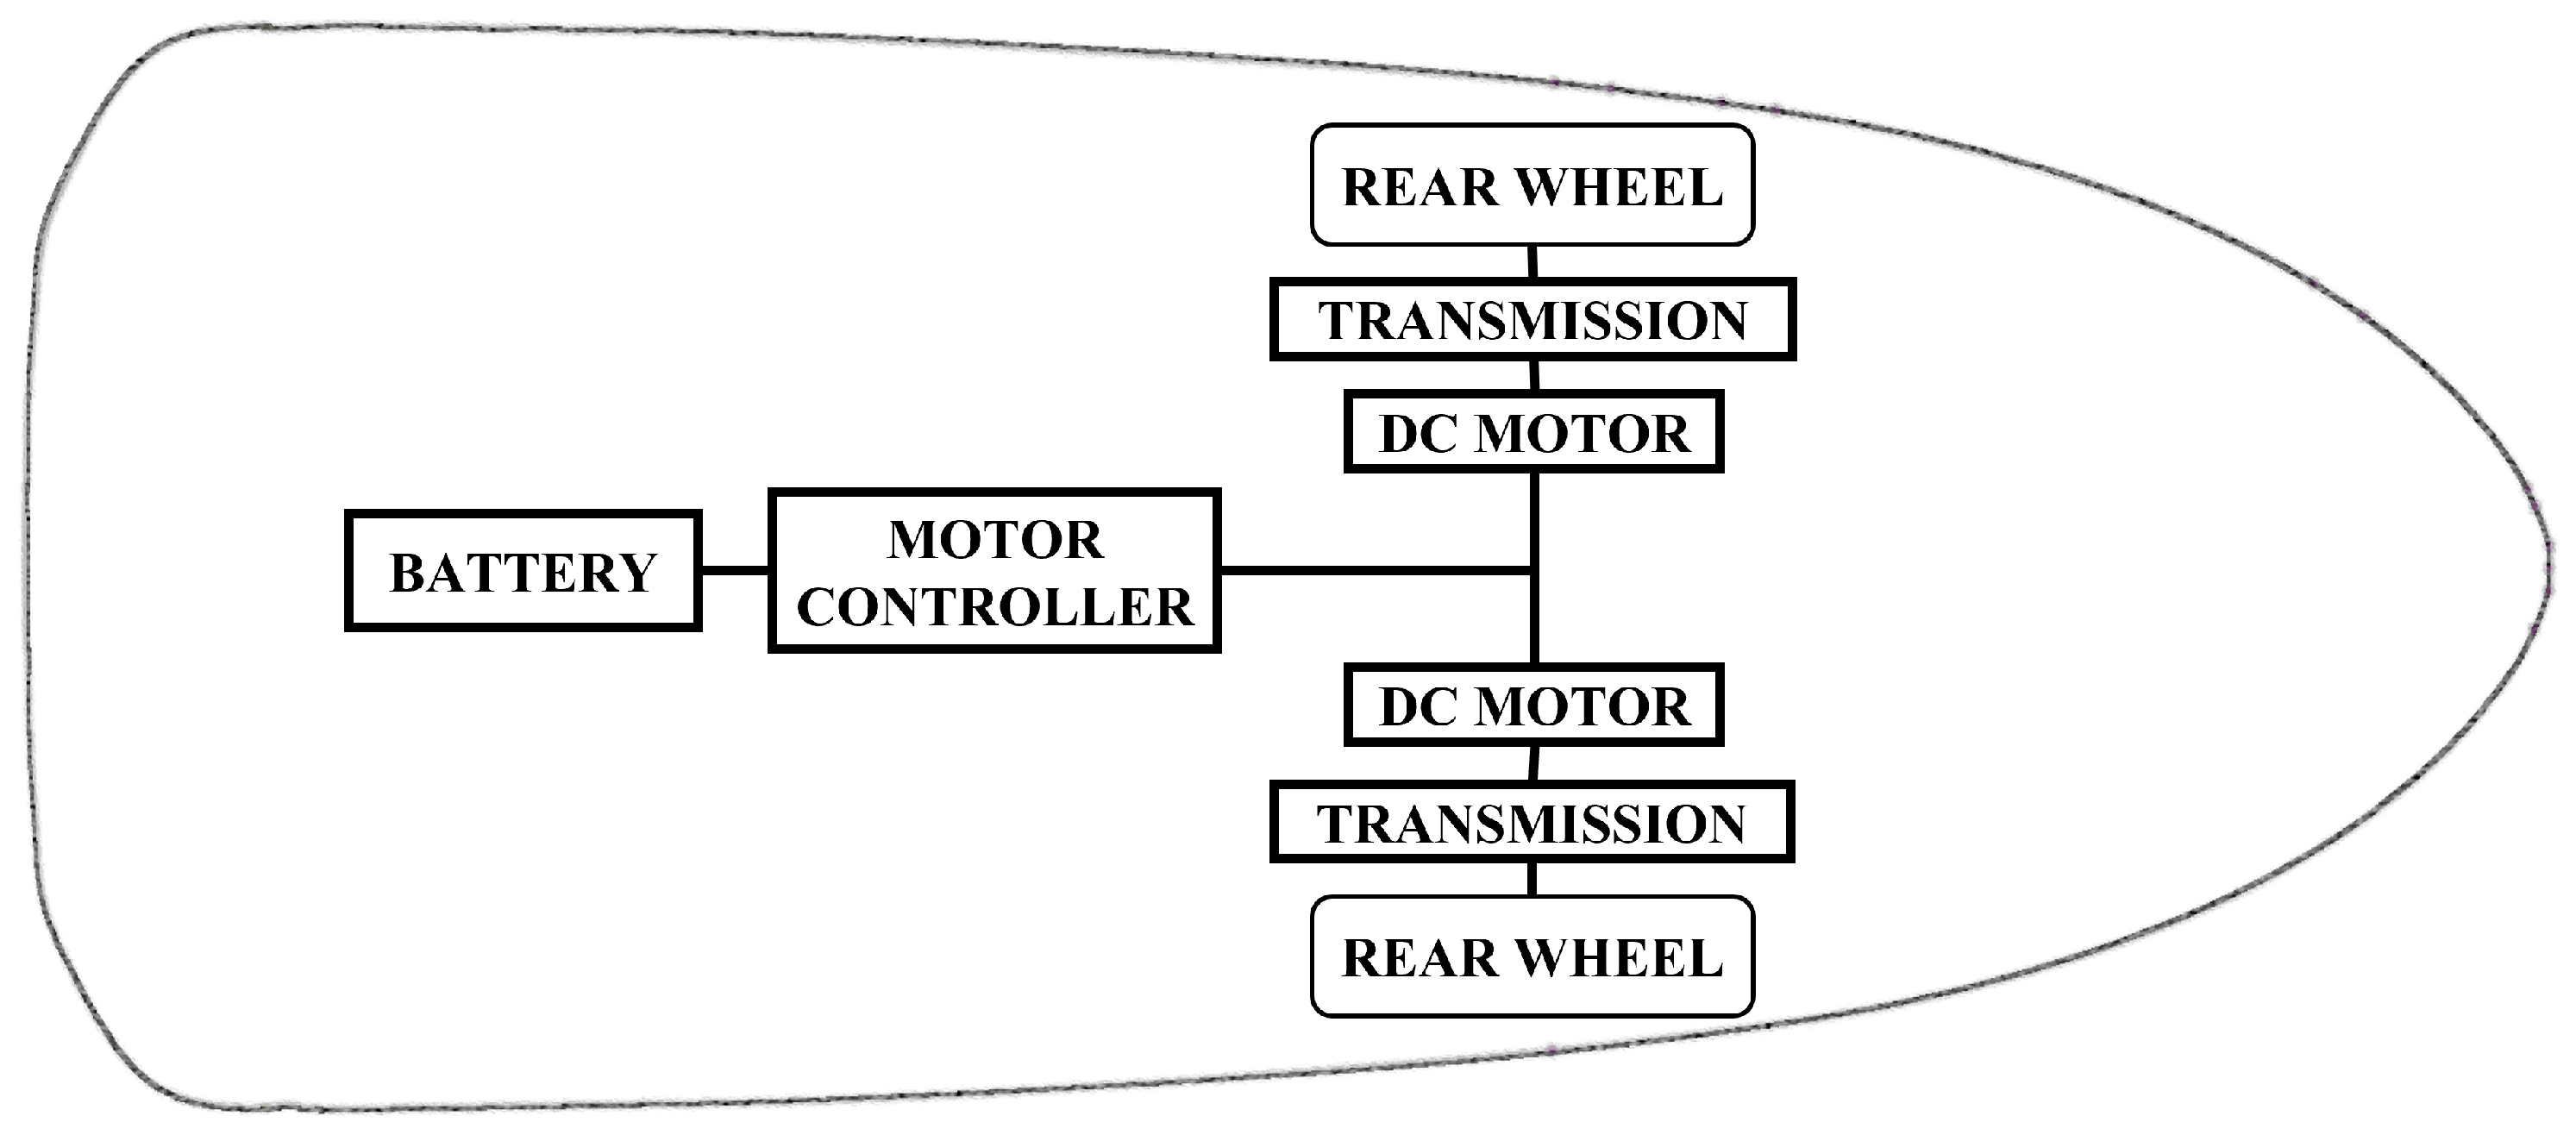
The schematic layout of the powertrain is shown in
Figure 2.
The vehicle is actuated by two DC electric motors; each motor has a nominal power equal to 200 W. Each motor is connected to one of the rear wheels by a single-stage transmission. The transmission is realized by a gear pair, namely, a 13-tooth pinion is mounted on the motor shaft and a 192-tooth crown is connected to the wheel hub. A freewheel installed at each of the rear hubs allows transmission of power only in one direction. The electric drivetrain is powered by a lithium-ion battery pack. Battery cells are connected in a 13S4P configuration, i.e., four modules connected in parallel, with 13 cells per module.
The vehicle speed is controlled through a PWM (Pulse-Width Modulation) signal. The PWM signal controls the switching of two low-side MOSFETs (metal-oxide-semiconductor field-effect transistors) that are used to modulate the voltage across each motor. The PWM signal is generated by the vehicle’s ECU (Electronic Control Unit) and depends on the throttle position. The throttle command is provided by the driver through a control on the steering wheel. A more detailed explanation of the motor controller scheme and control logic is given in [
5].
The vehicle is equipped with a set of 95/80 R16 radial tires, specifically designed for the competition with the aim of minimizing the rolling resistance.
The overall characteristics of the vehicle are summarized in
Table 1. The vehicle’s mass refers to the data measured on the occasion of the SEM 2019 competition, during technical inspections. Data on the geometric features of the vehicle are extracted, leveraging the 3D model of the vehicle built on a commercial CAD (computer-aided design) modeling software. The aerodynamic drag coefficient
is experimentally identified by means of a coast-down test on a proving ground.
Competition rules require vehicles to travel a certain distance (usually corresponding to a given number of laps of a circuit) within a time limit. The energy consumption is measured by a joulemeter mounted on the vehicle. At the end of the race, the classification is drawn up according to the vehicle’s efficiency, expressed as traveled distance per unit of energy (km/kWh).
3. Vehicle and Race Circuit Digital Twins
The first step of the digital twin approach is to create high-fidelity virtual models that reproduce the geometry, properties and behavior of the physical entities. Since the goal of dynamic driving simulators is to accurately emulate the driving experience, two key factors are the creation of the vehicle dynamics model and the design of the surrounding scenario.
3.1. Vehicle and Powertrain Model
The vehicle model is implemented on a co-simulation framework leveraging VI-CarRealTime and Simulink environments.
VI-CarRealTime software [
40] allows to build a simplified model of the vehicle based on 14 DOFs. The vehicle chassis has 6 DOFs (translational and rotational motion around longitudinal, lateral and vertical axes), while 2 DOFs refer to each wheel, describing the vertical motion of the wheel with respect to the body and the wheel rotation.
The suspension characteristics include the effect of the wheels vertical jounce on the front/rear track and on the wheelbase. Suspensions’ elastic elements are modeled by means of their characteristic curve.
The steering system model considers the relationship between steering input and wheels’ steer angle, taking into account the influence of camber, toe, caster angles and wheels’ vertical jounce.
Tire behavior is modeled exploiting the PAC2002 tire model, based on Pacejka’s formulae [
41].
In order to properly model the powertrain and motor controller systems of the vehicle, the VI-CRT model of the vehicle is combined with a simplified model of the powertrain and motor controller built in the Simulink environment. A co-simulation environment is required, since VI-CarRealTime does not directly support the powertrain architecture of the vehicle. Moreover, VI-CRT standard powertrains do not allow an accurate modeling of the motor controller employed. The interaction between CRT and Simulink enables us to overcome these limitations.
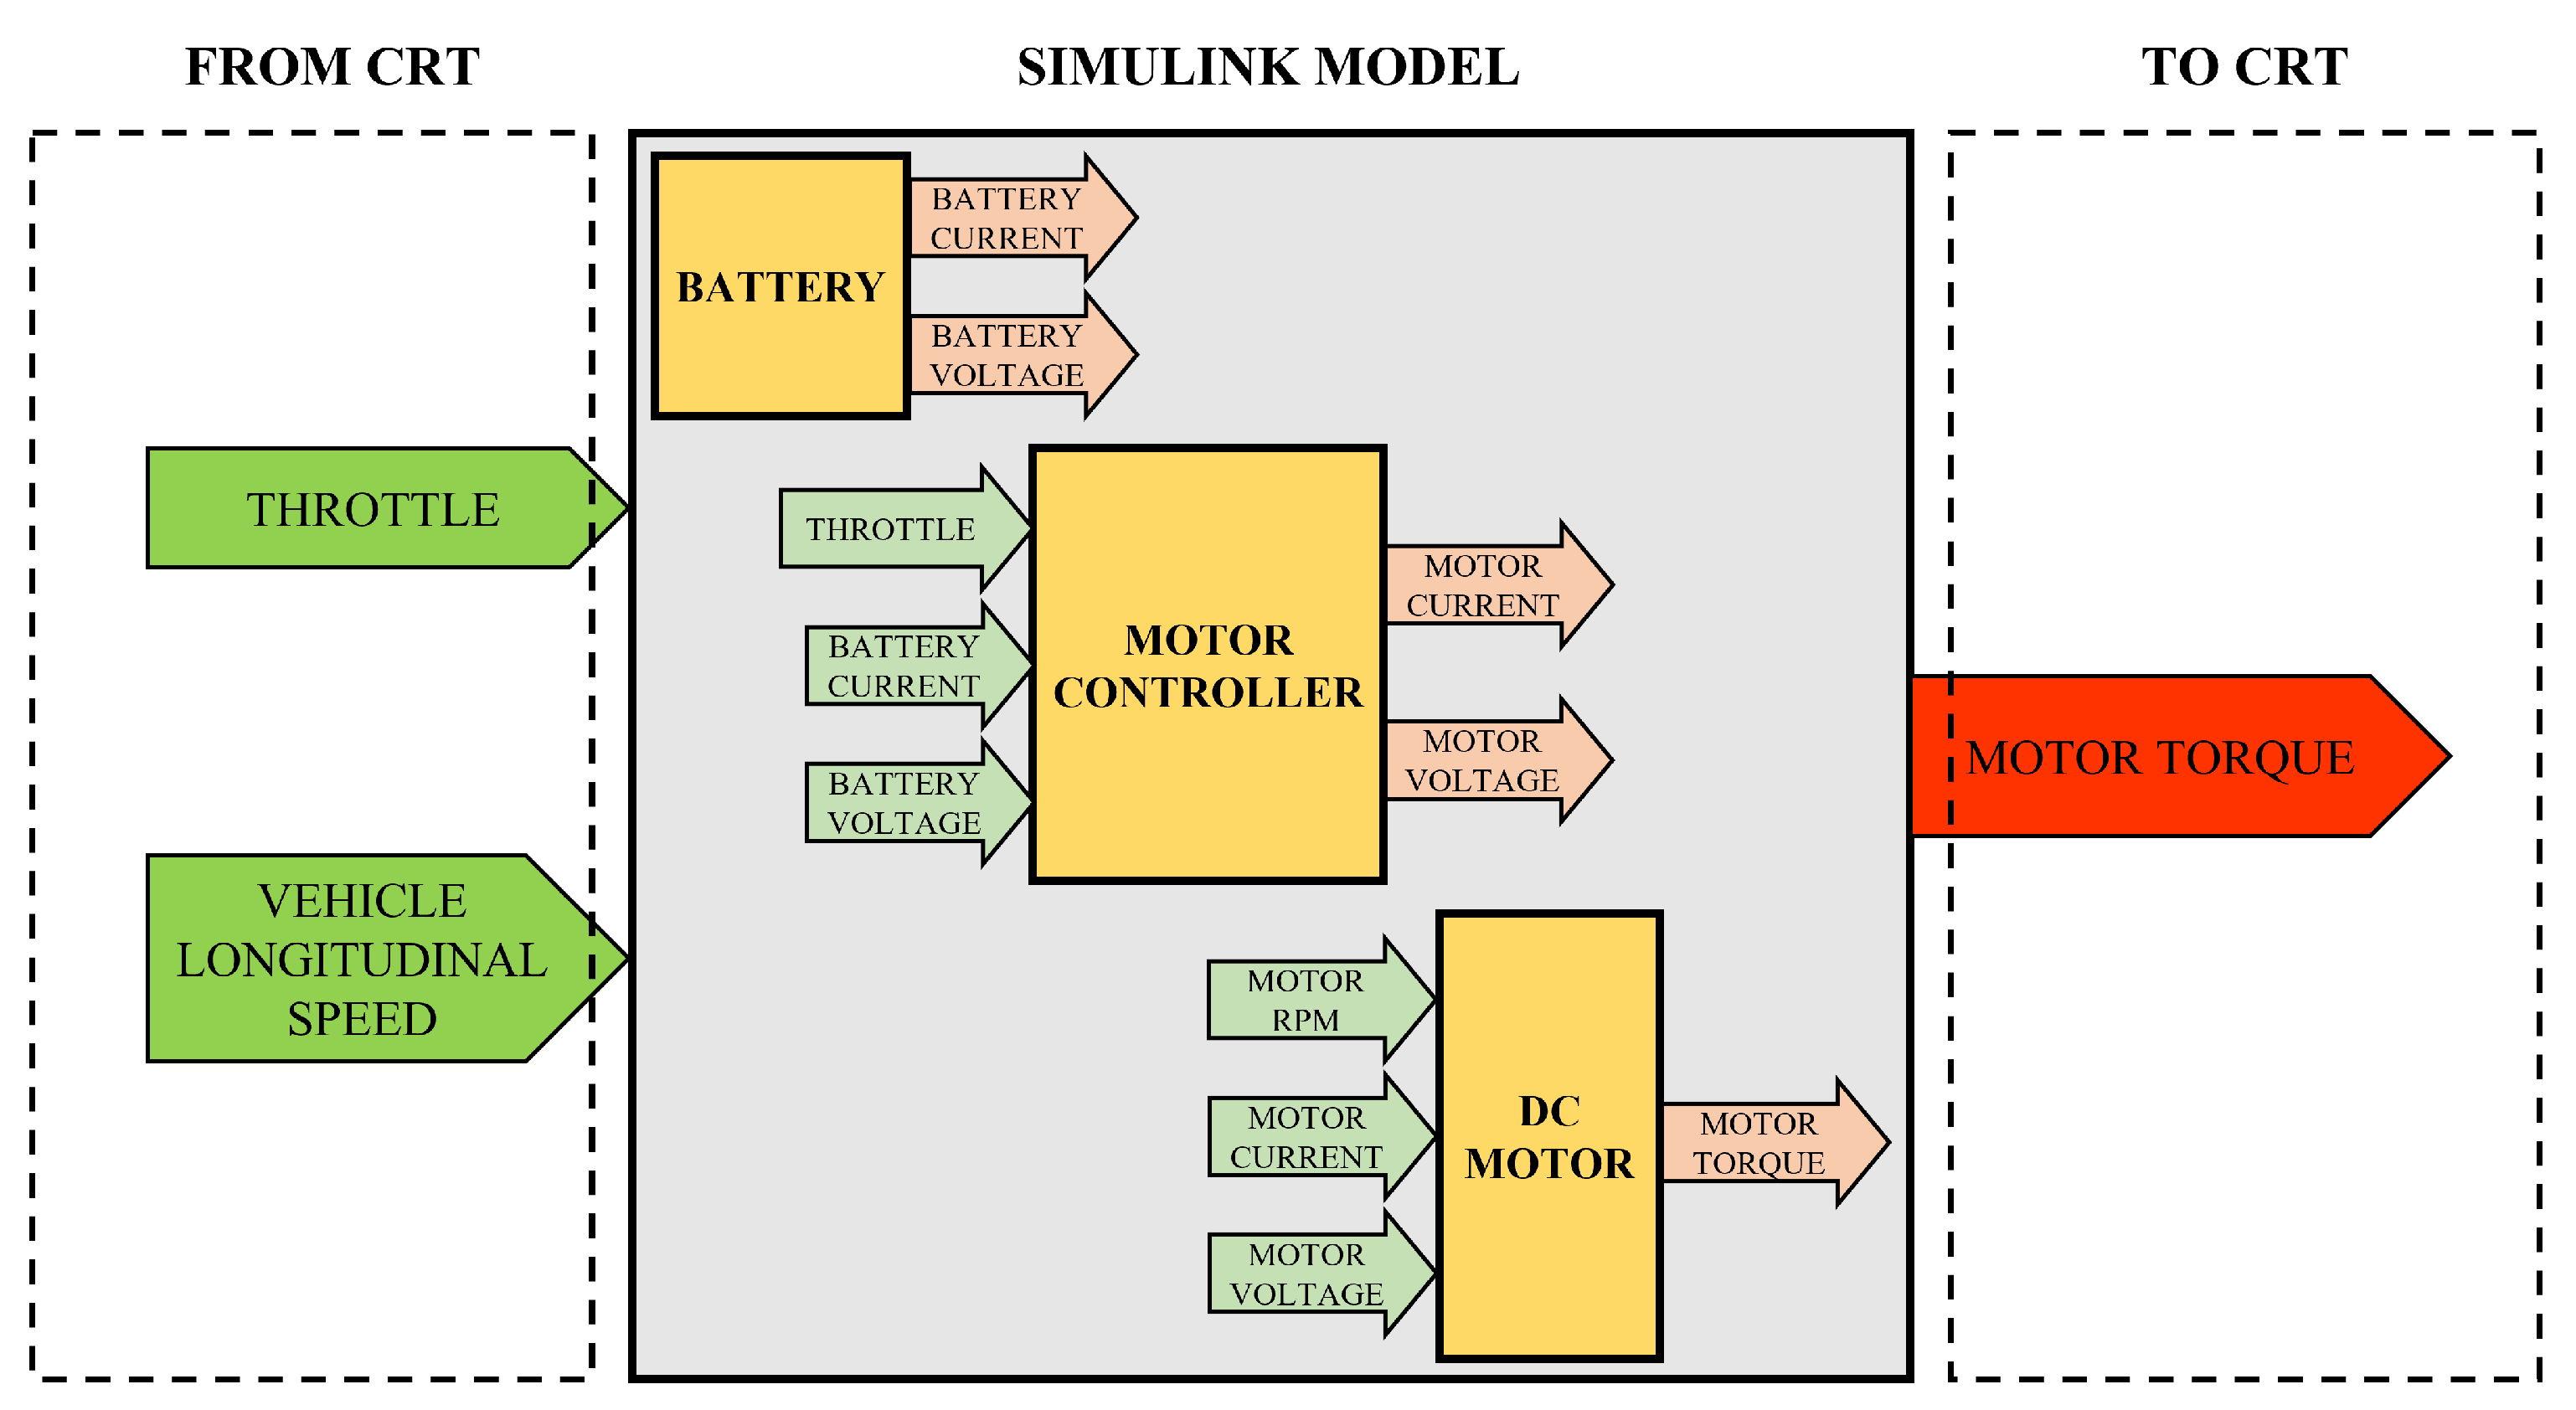
The diagram of the powertrain model is shown in
Figure 3. The electric motors, the motor controller and the battery pack are modeled. The input throttle level (normalized from 0 to 100%) and the vehicle state (i.e., the vehicle longitudinal speed), derived from the CRT model, are given as inputs to the Simulink model. The output is the motor driving torque.
The DC electric motor is modeled by using a look-up table. More in detail, the torque delivered by the motor is computed relying on the actual motor torque–speed curve, expressed by means of a look-up table. The torque–speed characteristic equation is given by
where
is the output torque;
is the stall torque; and
n and
refer to the rotational speed and the no-load speed, respectively. Parameters in Equation (
1) are obtained directly from the DC motor datasheet (see
Table 1). Finally, the torque values are scaled by the throttle.
The freewheel model governs the speed of the wheels and the driving torque, imposing a null value of the transmitted torque when the rotation speed of the wheels exceeds that of the motor pinion.
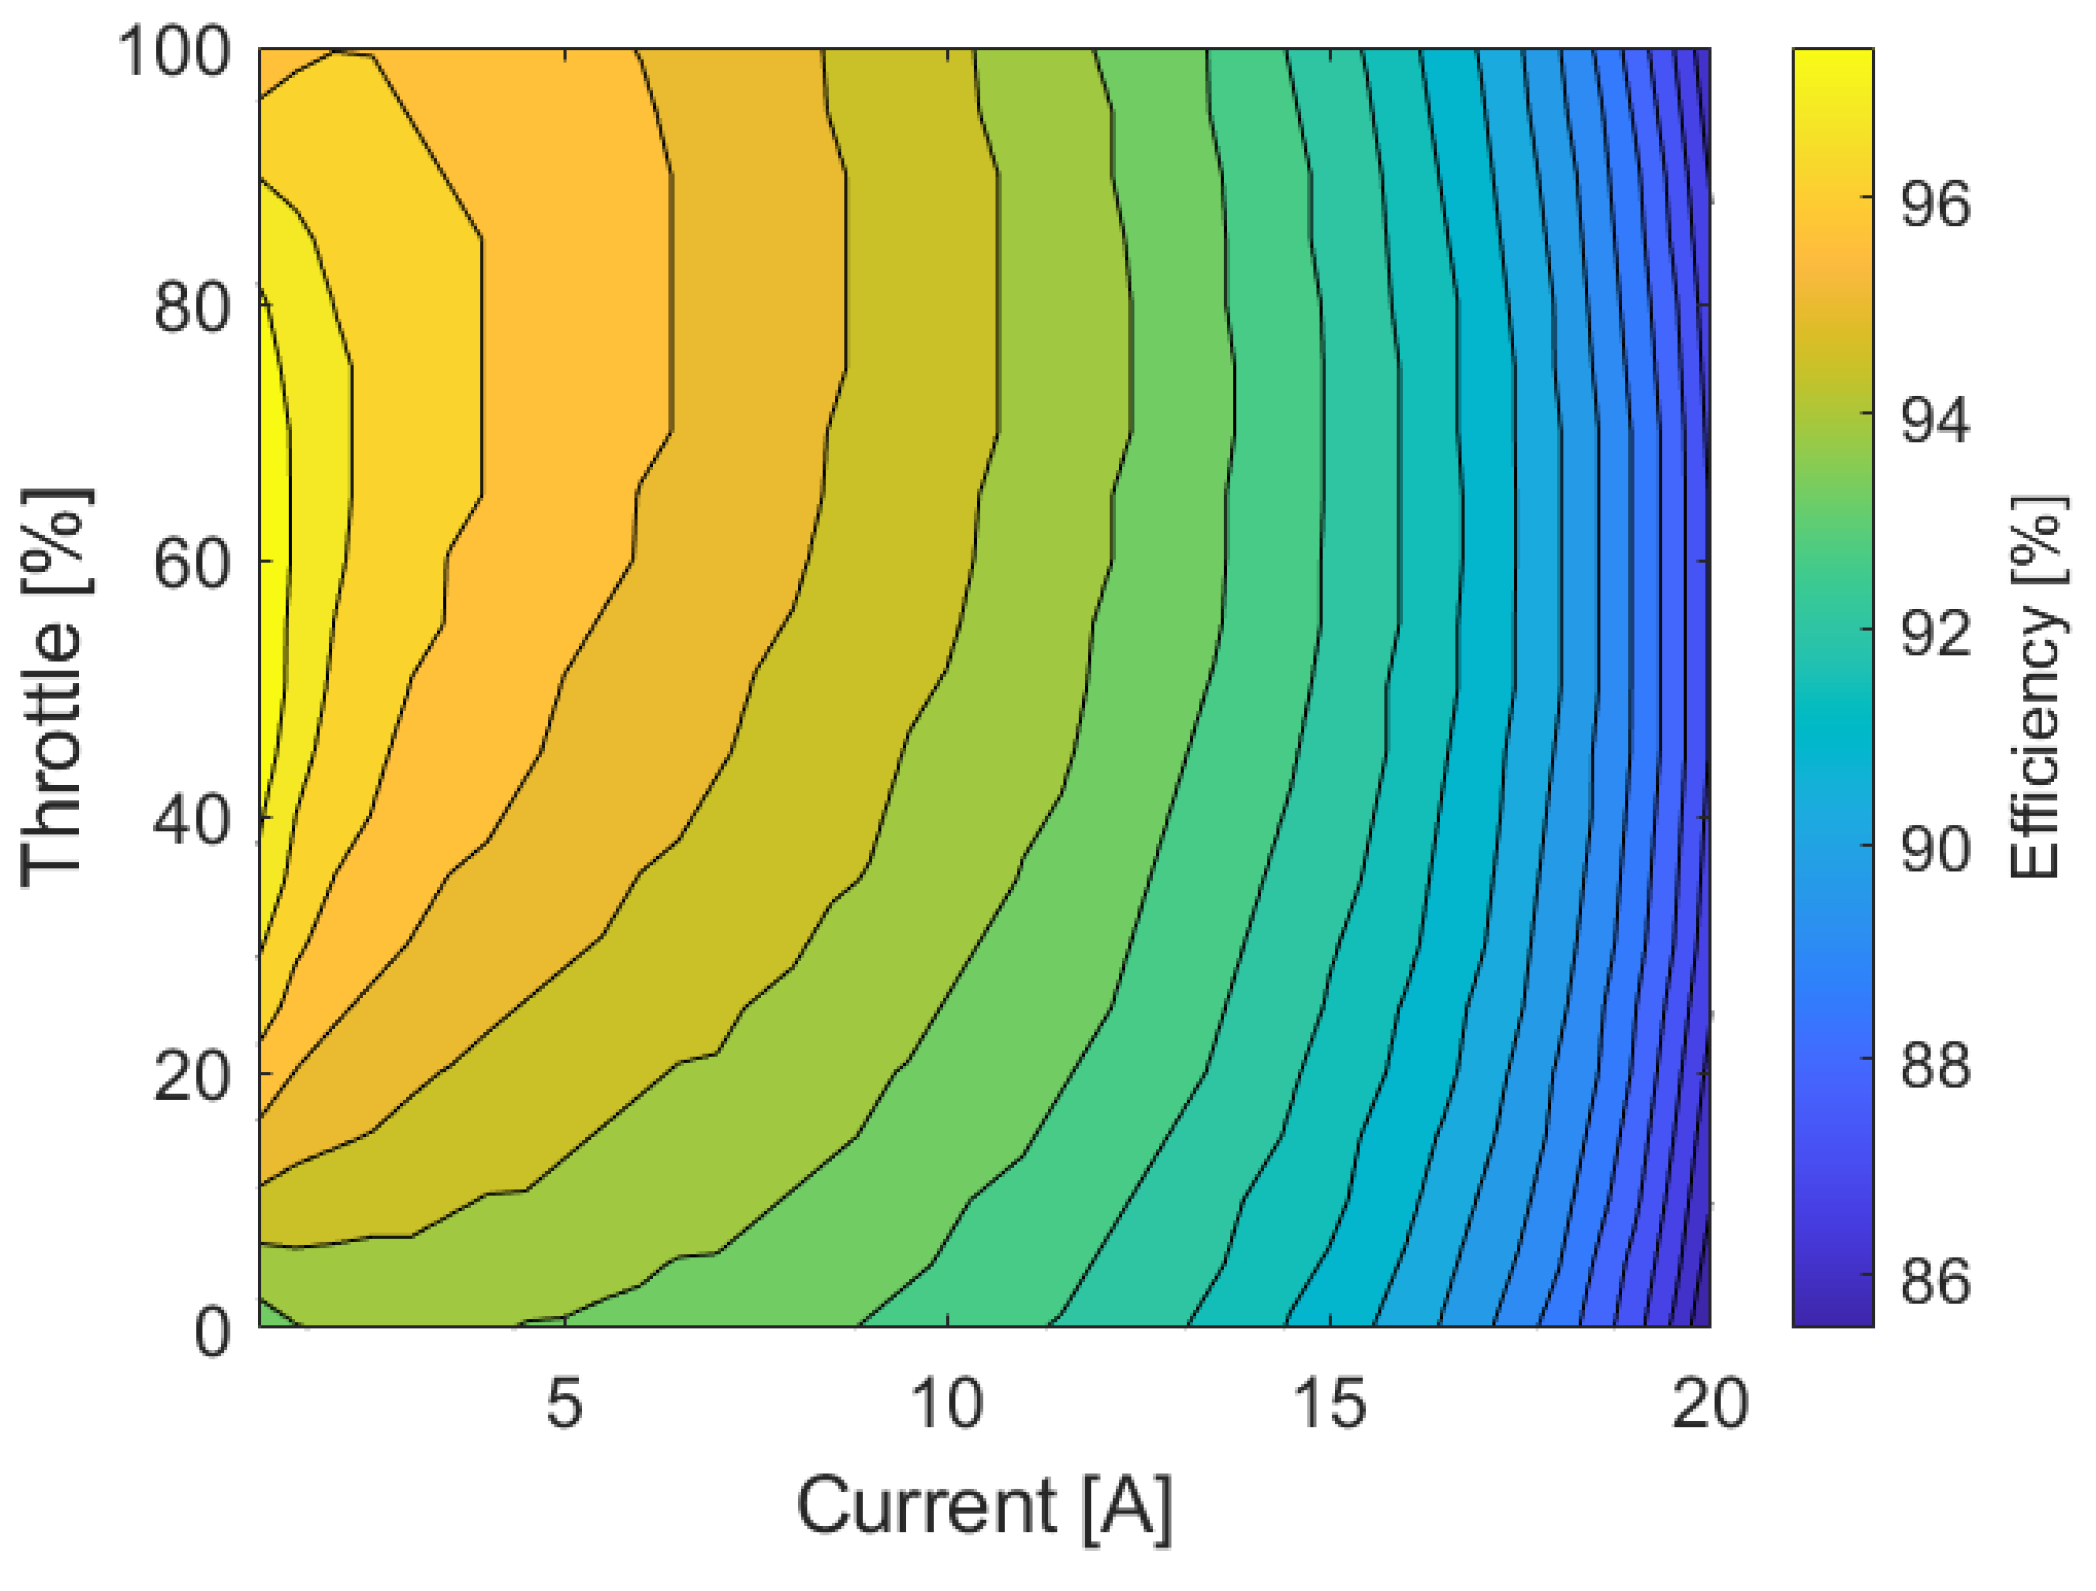
The motor controller is modeled by means of an efficiency map, which depends on both the load current and the throttle level (
Figure 4). The values of the efficiency of the DC–DC converter are based on experimental tests performed on a test bench especially designed for testing the vehicle powertrain [
5].
The numerical model of the battery exploits mathematical equations and a look-up table to compute the effective discharge of the battery pack during the vehicle operating conditions. In particular, the look-up table is built starting from the cell discharge curves and is used to compute the cell output voltage as a function of the current of the cell and the residual SOC (state of charge). The SOC of each cell at time
t is given by
where
is the cell initial state of charge,
is the cell capacity and
is the current (per cell). The cell current is computed as the ratio between the total current flowing into the battery
and the number of modules in parallel
.
The output voltage is then given by multiplying the battery voltage per module
and the number of cells in series
.
3.2. Track Model and Scenario Design
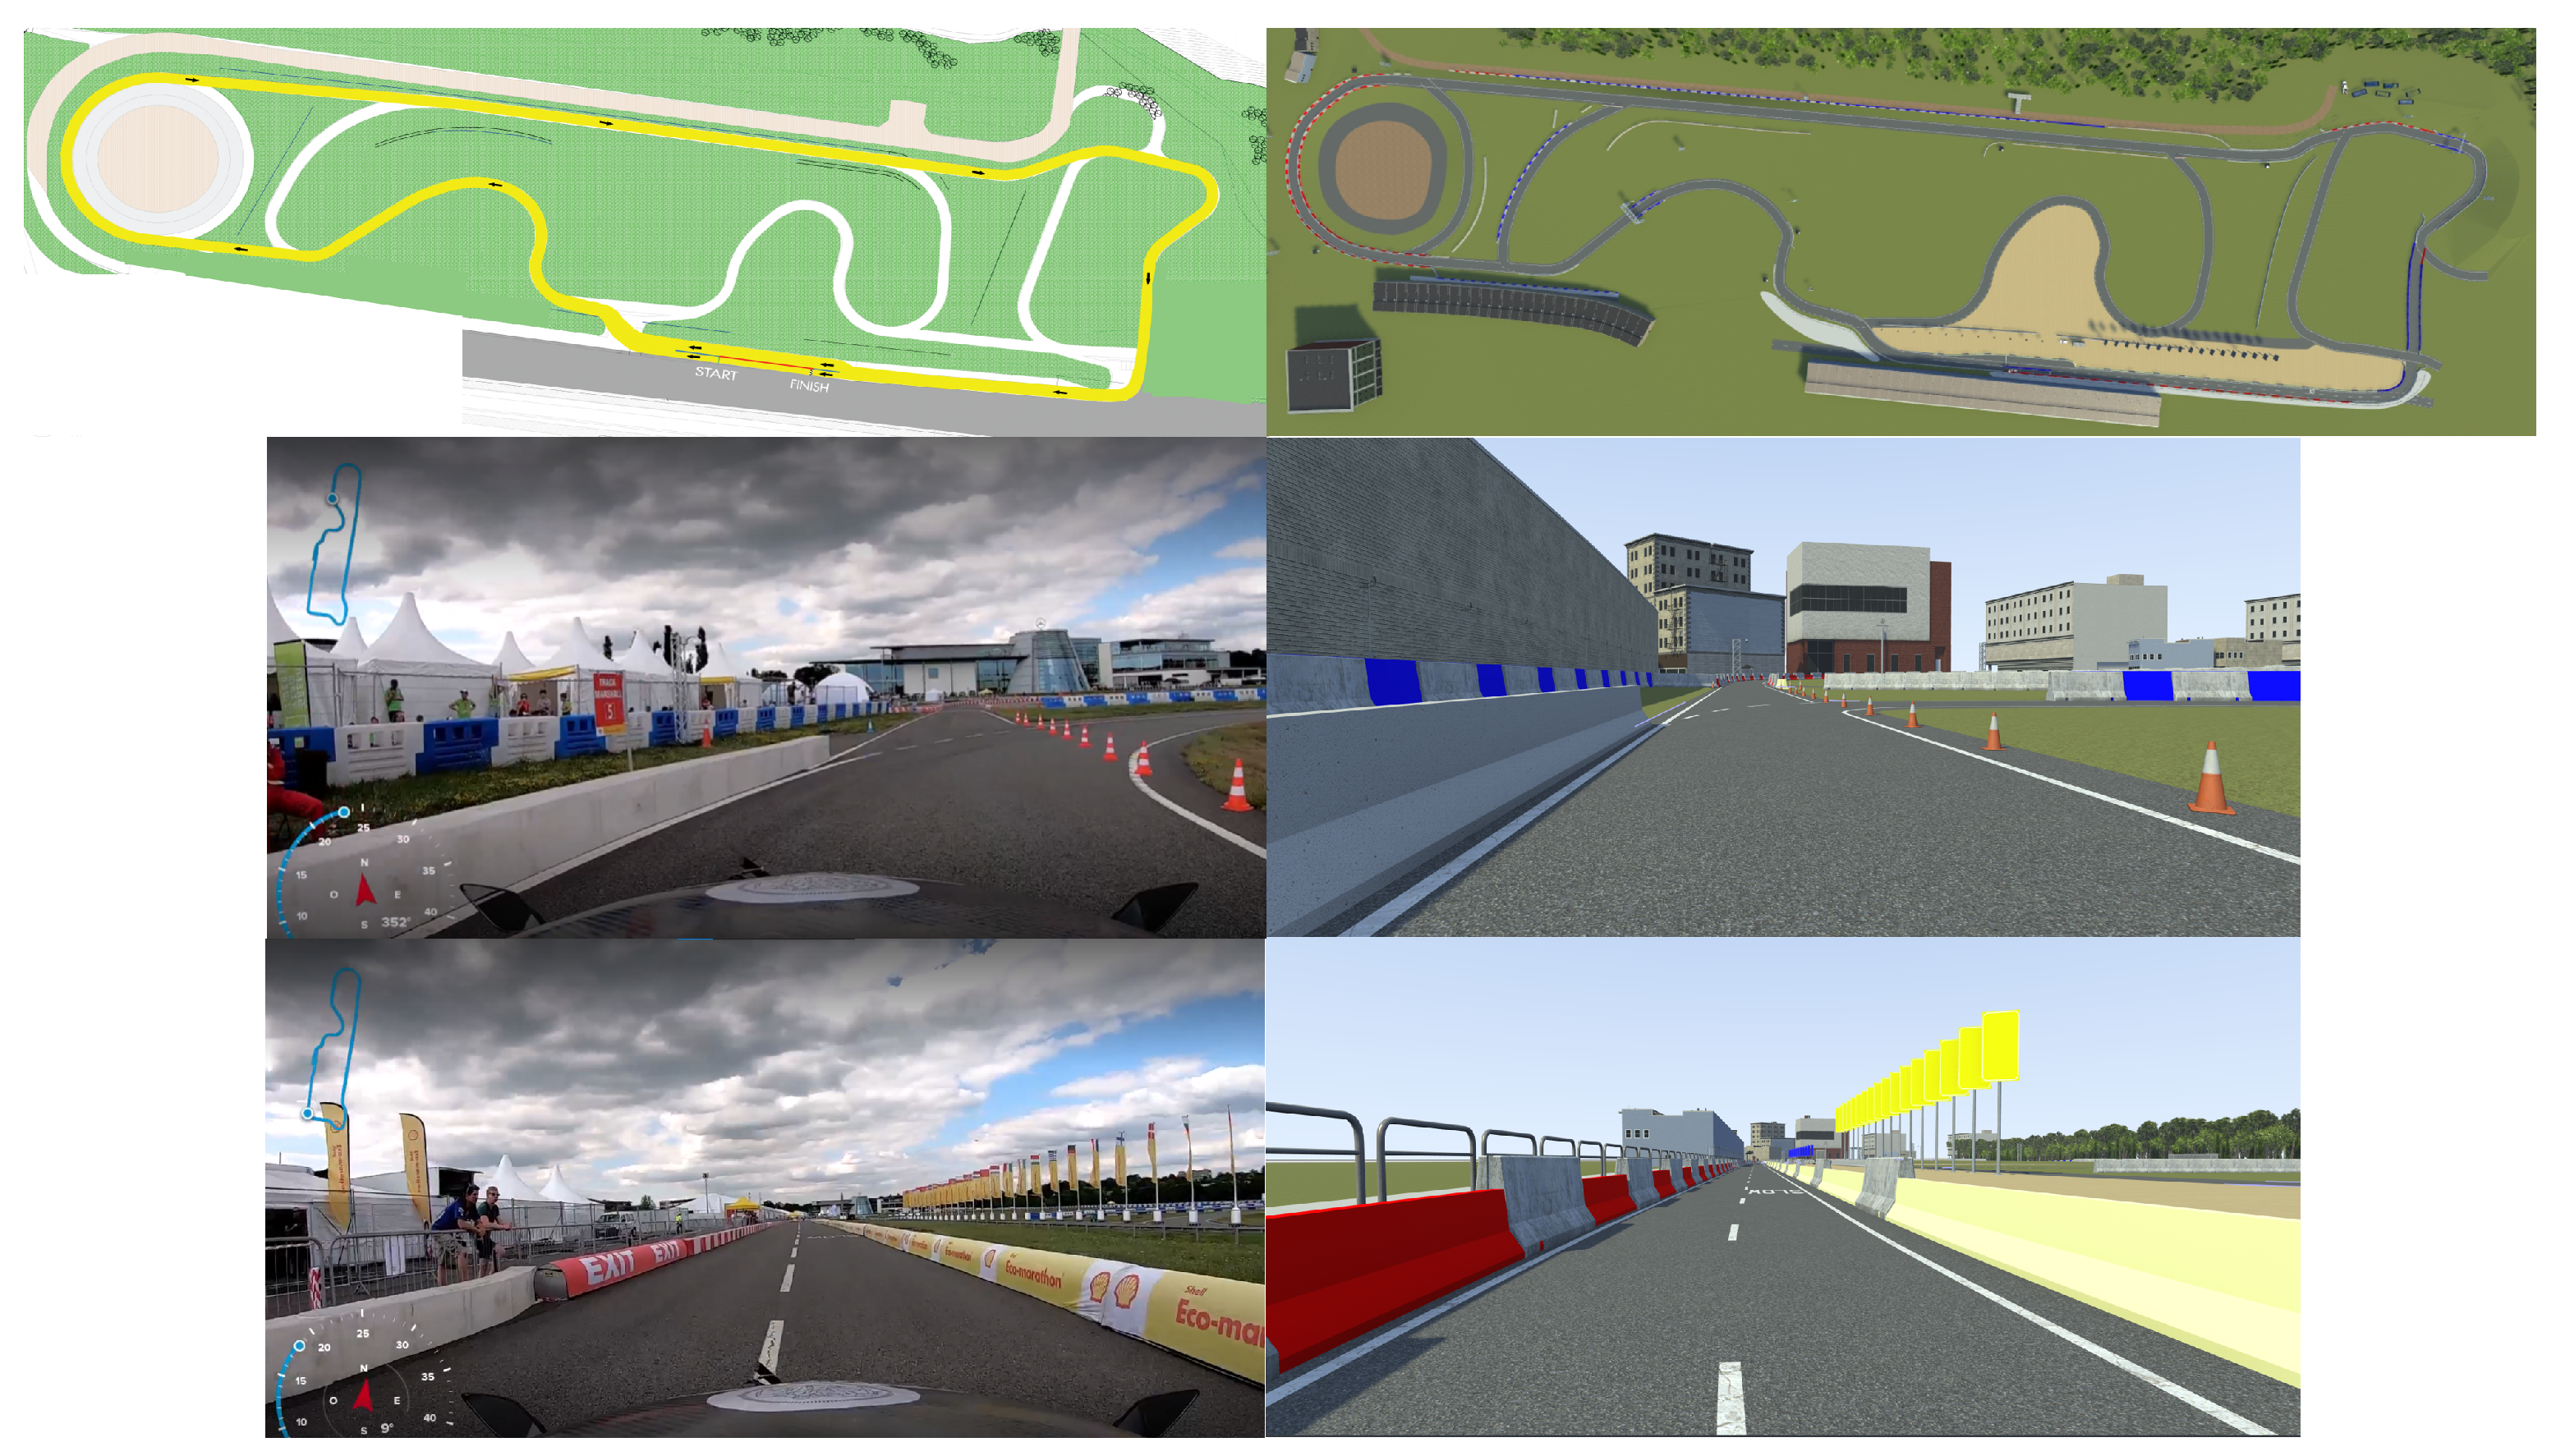
In the driving simulation, a scenario can be described as an event that happens in a virtual environment. The virtual environment is defined as the roads, signs, buildings and other objects surrounding the vehicle driven by the human in the loop. In particular, the simulation is performed considering the Brookands Circuit (UK), which hosted the 2019 Shell Eco-marathon competition. The scenario is created by varying the traffic and the events in that environment.
The model of the track is created leveraging the software RoadRunner [
42]. In order to obtain an accurate modeling of the track layout, data extracted from web mapping platforms, on-board video recordings and provided by the competition organizers are used. The track shape, width and elevation are replicated. External entities, such as buildings, side barriers, marshals’ stations, runoffs and vegetation are also included. Actually, this is crucial since the driver can exploit them as reference points for his driving strategy during the race.
Figure 5 depicts the developed model of the track, comparing real and virtual environments from a planimetric view and from on-board views.
Once the track model is created, the design of the scenario involves the modeling of additional vehicles along the route. Traffic simulation is carried out exploiting the software VI-WorldSim [
43]. Vehicles are modeled as Non-Player Character (NPC) vehicles. These are placed at different points of the track, each one running at its own, constant speed. Emergency events—with a vehicle stopped on the track due to technical issues—are simulated as well, by placing NPC vehicles standing on the track. During the competition, standing vehicles on track are signaled by the marshals with yellow flags. Incoming vehicles must be more careful and not overtake each other.
3.3. Model Validation
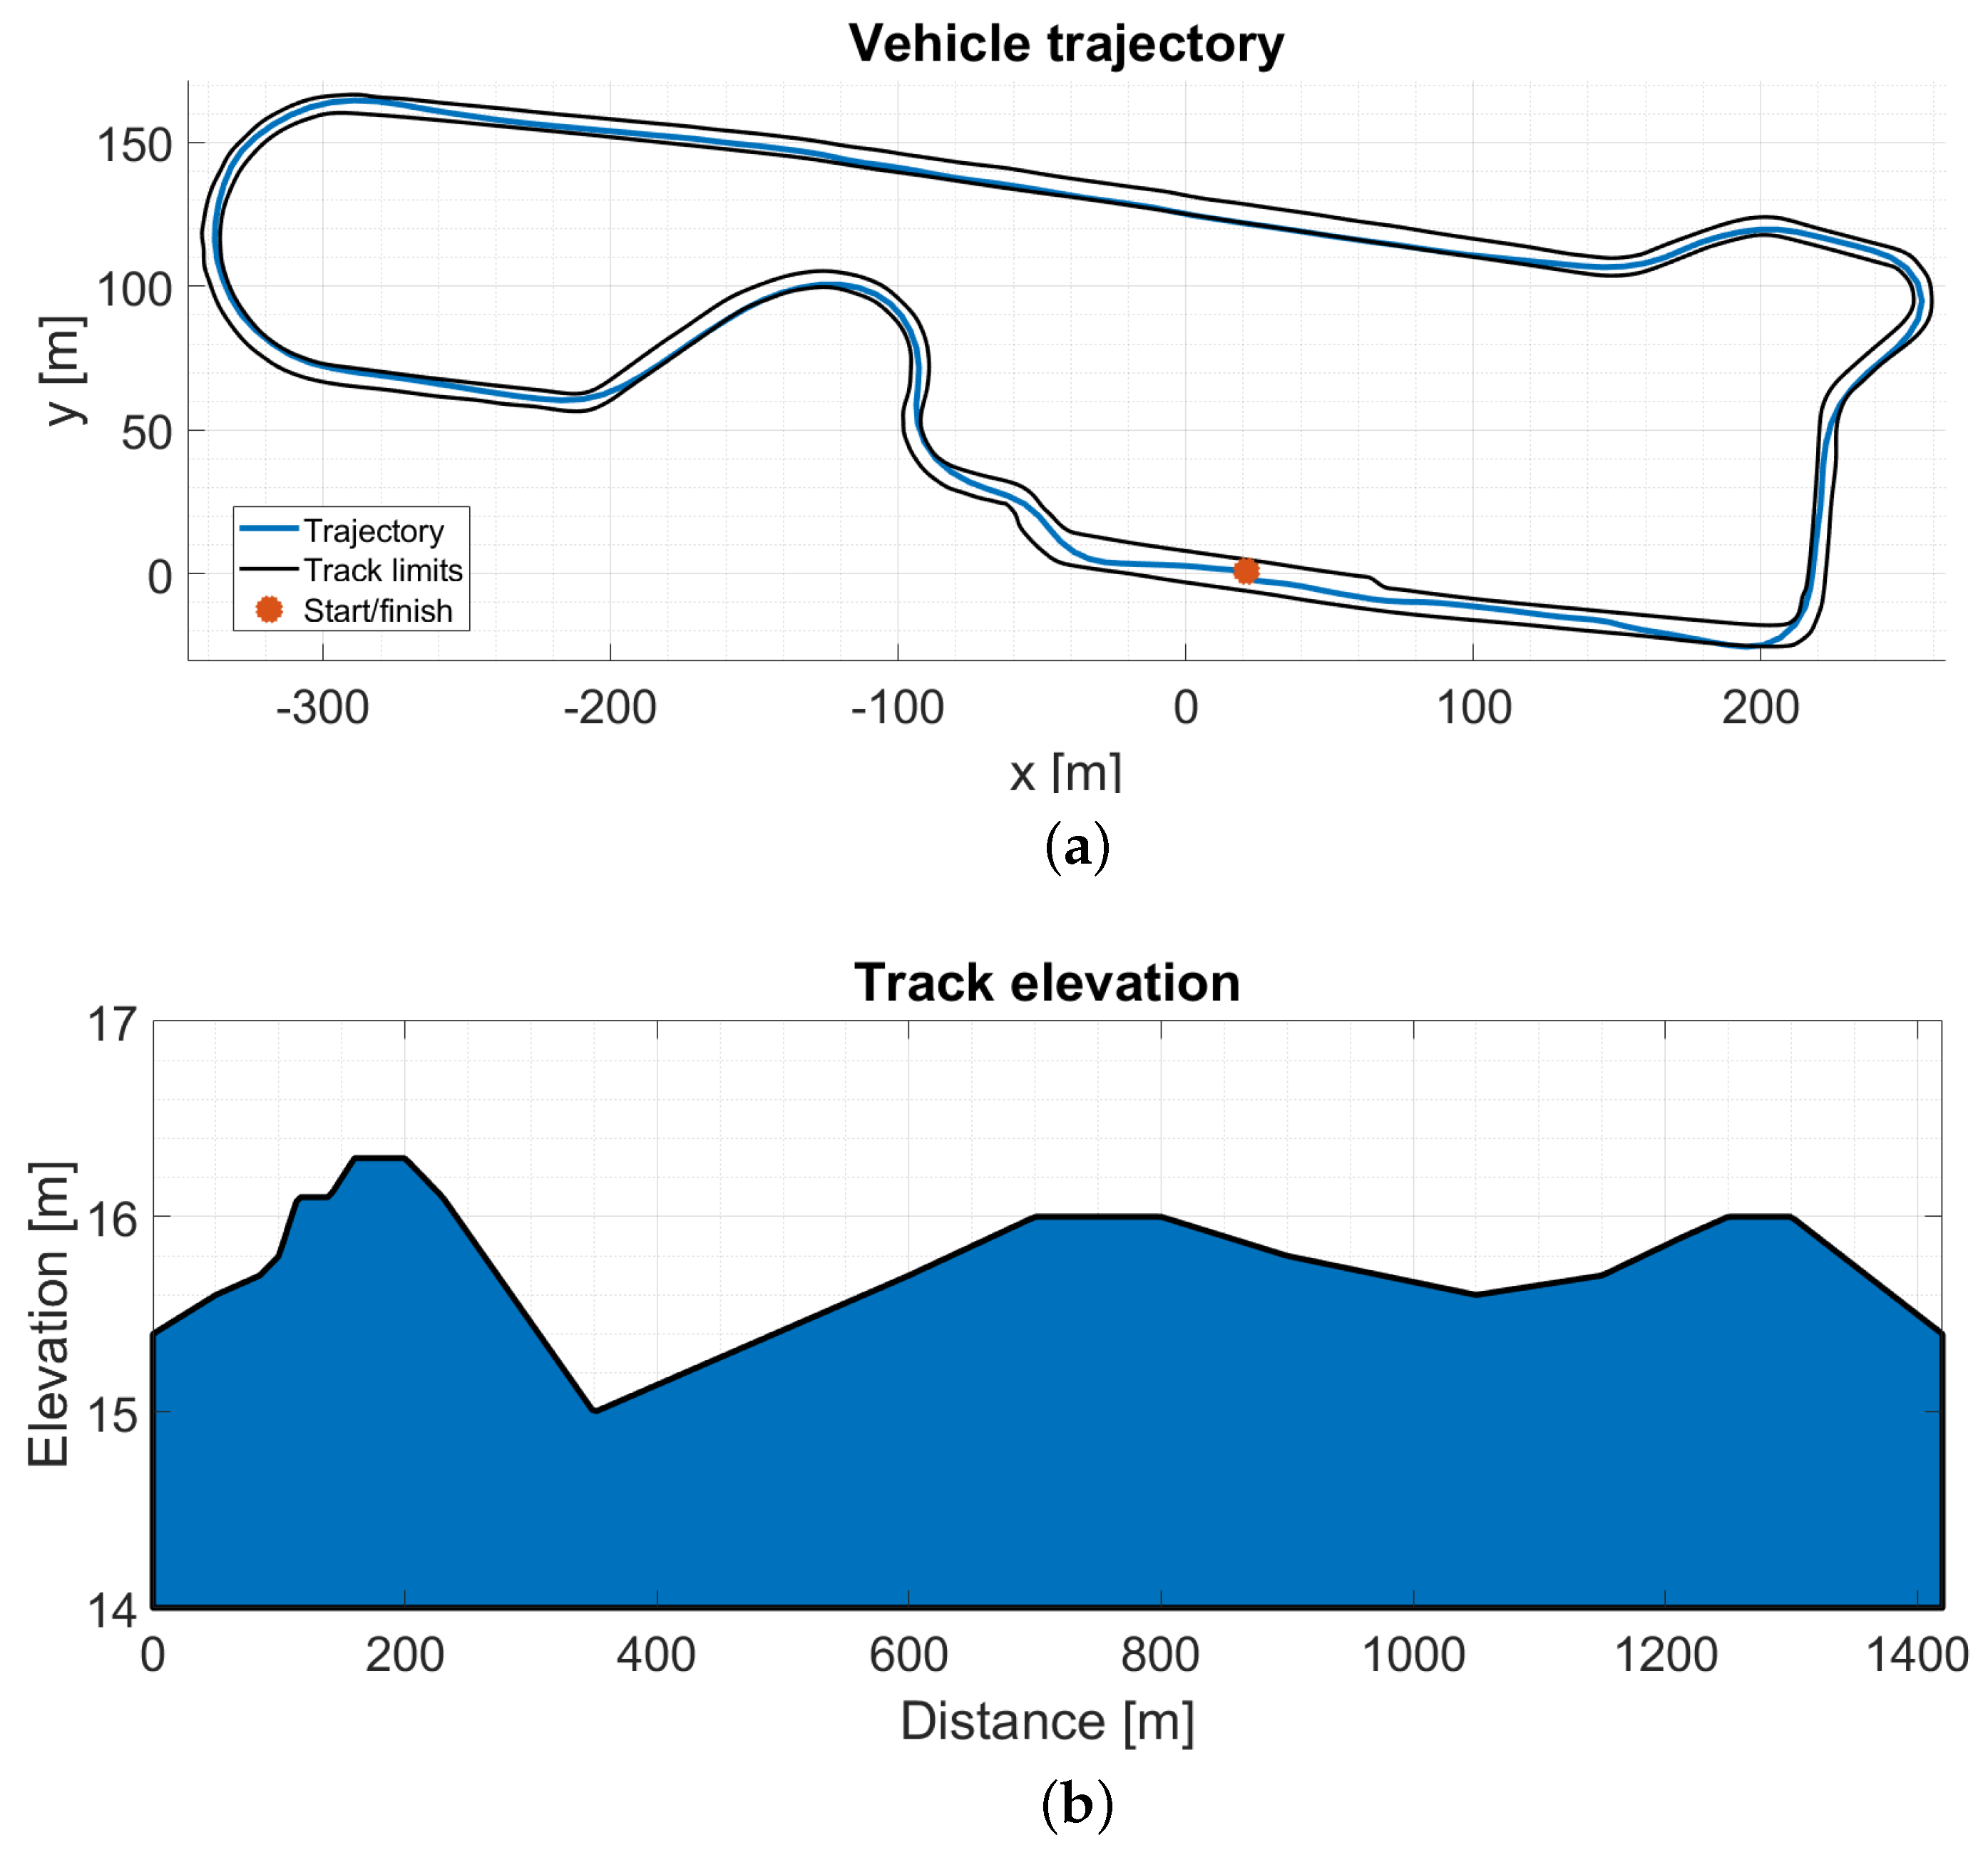
The developed vehicle numerical model is validated by simulating the track route of the 2019 Shell Eco-marathon competition.
Figure 6a shows the track map, along with the ideal vehicle trajectory, while
Figure 6b highlights the track elevation profile.
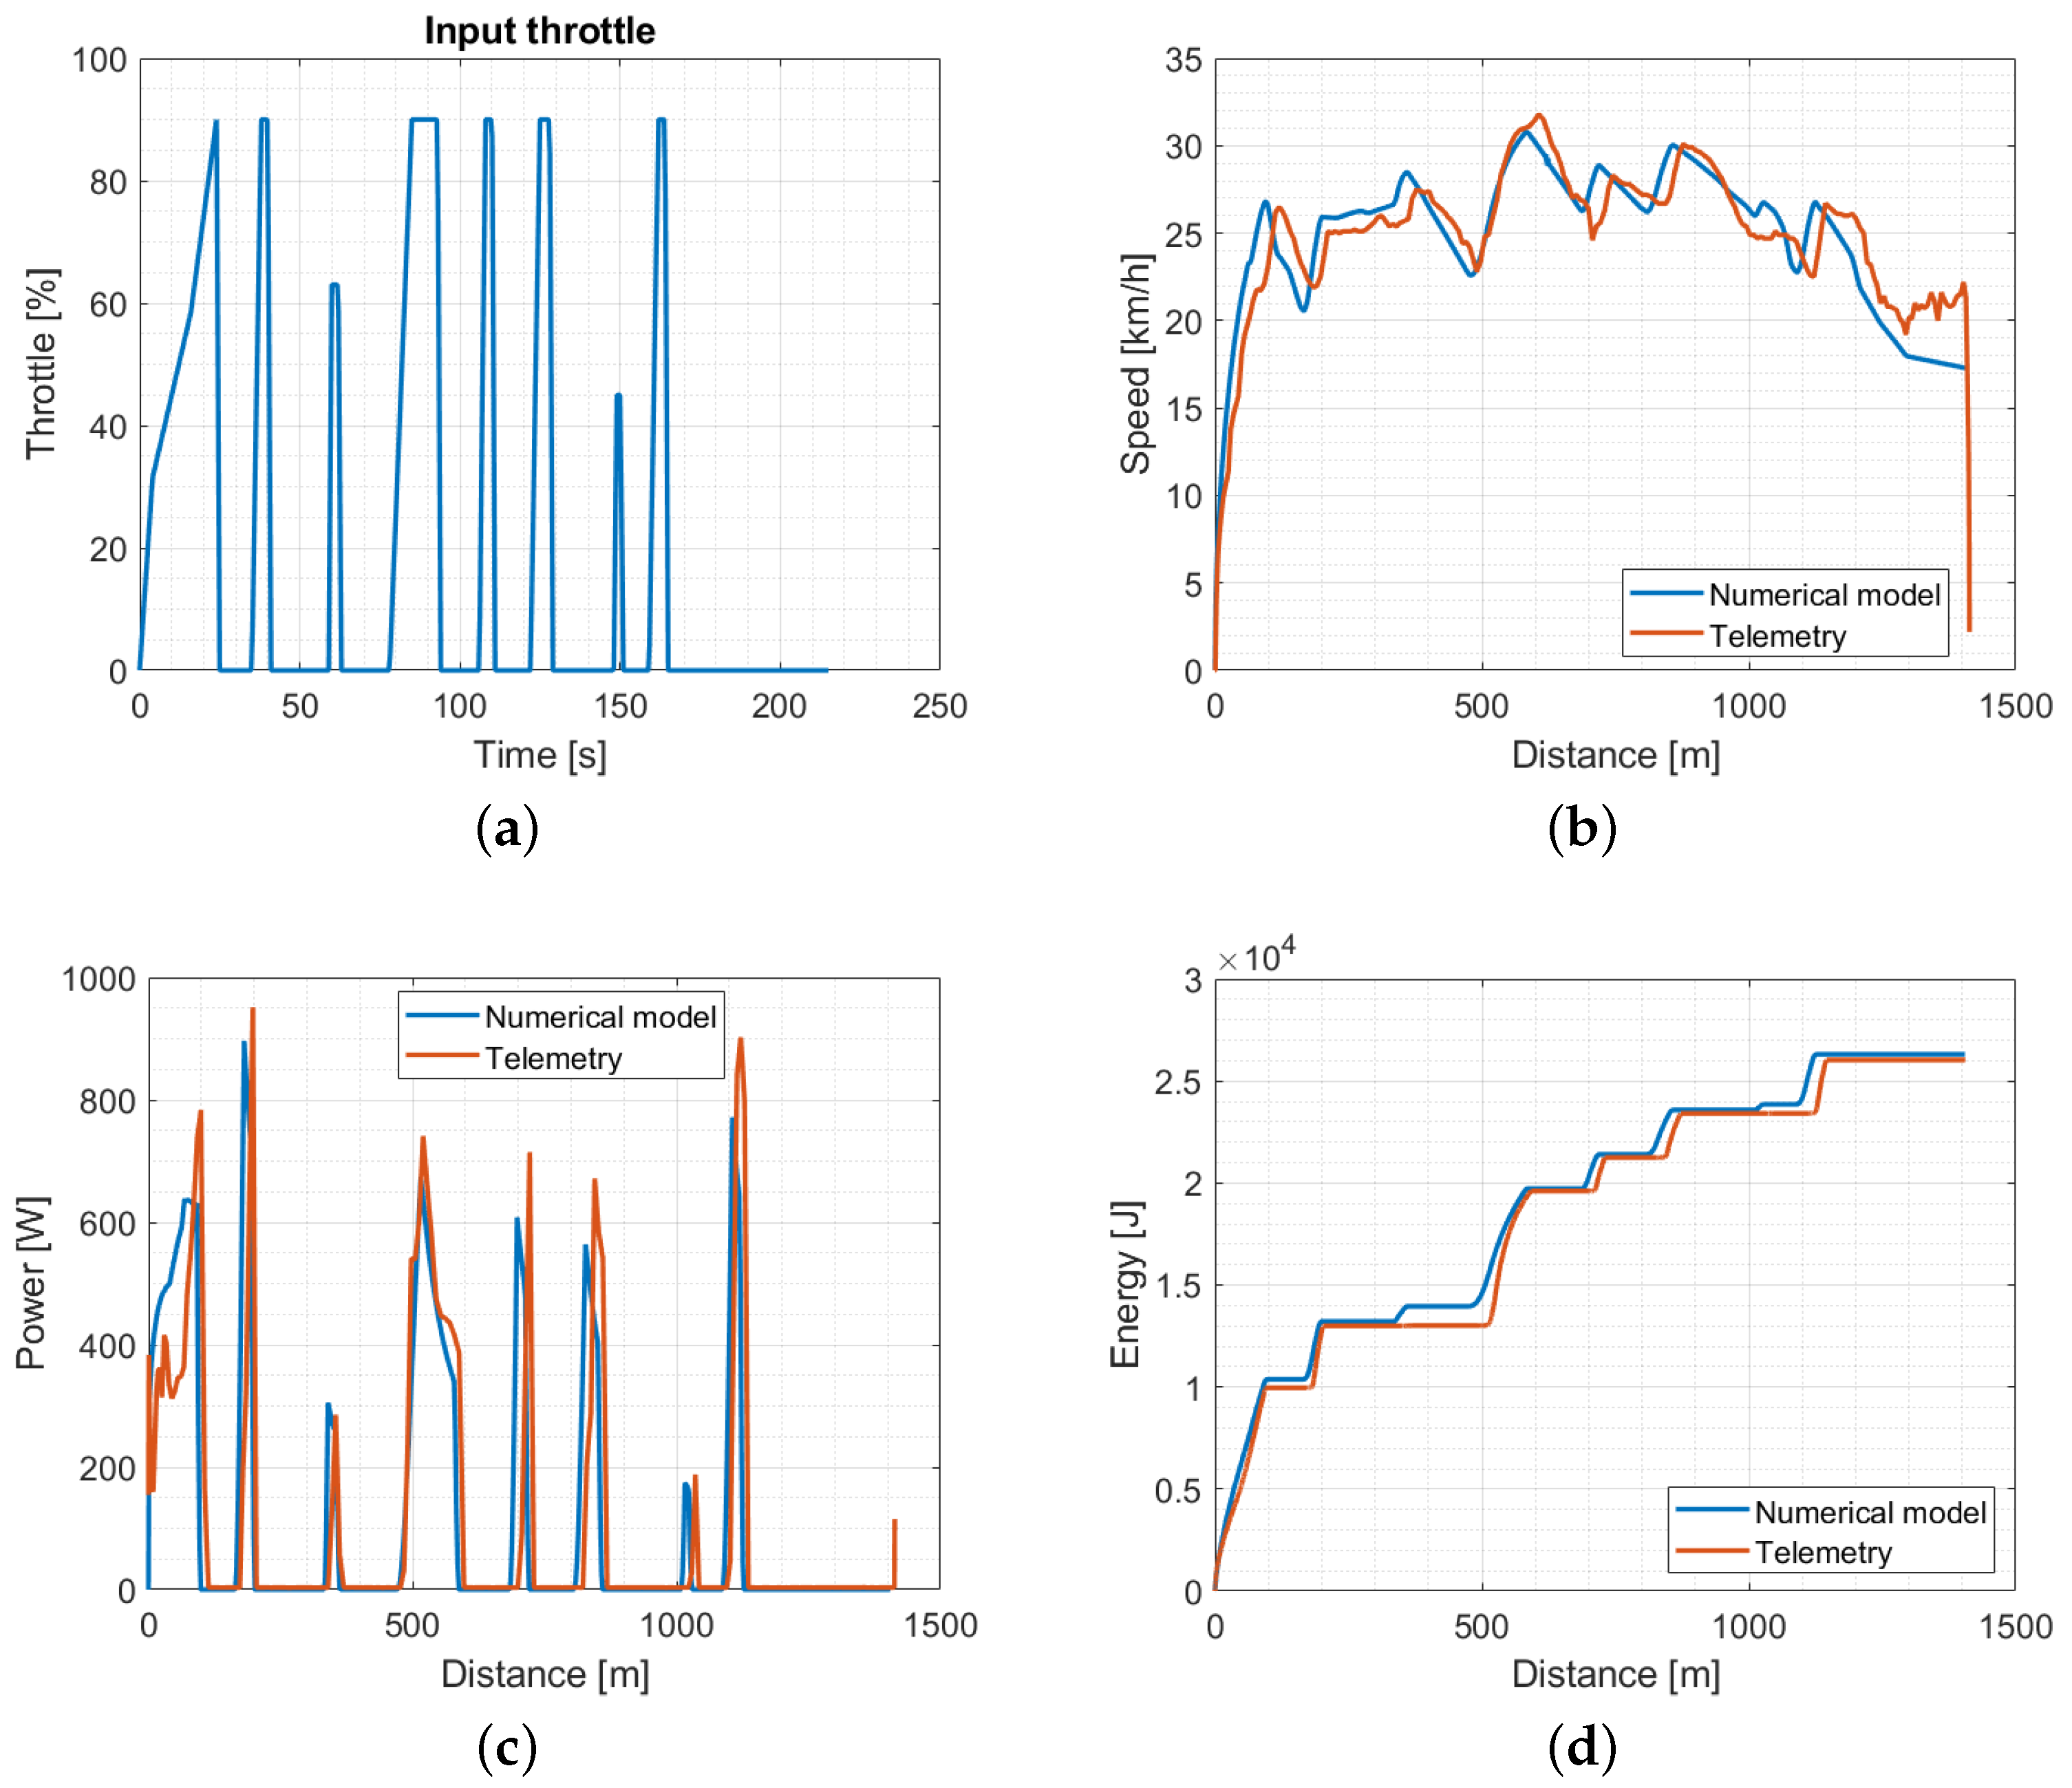
The time history of the throttle command performed during a race lap is given as input to the simulation (
Figure 7a). The throttle profile consists of a sequence of peaks ranging from 0 (closed throttle) to 100% (full throttle). The peaks’ maximum value is reached through linear ramps. It is noteworthy that, during the race, the maximum throttle (which physically corresponds to the PWM signal duty cycle) was limited to 90% for technical reasons.
The simulation results are compared with the data acquired during the race. Race data are obtained by means of a telemetry system mounted on the vehicle, which is able to provide the on-track position, speed and power demand.
Figure 7 shows the comparison between the numerical simulation and the experimental data acquired during a single race lap in terms of vehicle speed, electric power and energy consumption, respectively.
With reference to
Figure 7b, the vehicle adopts a “pulse and glide” driving strategy, which is widely recognized in the literature as an energy-efficient strategy. Starting from a standing position, the vehicle is accelerated up to a certain speed; then, the speed profile shows fluctuations around the average speed to finish the lap within the limit time. In the last sector of the track, the vehicle practices a long phase of coasting down and, in close proximity to the finish line, the driver activates the brakes to execute the mandatory final stop. As the speed is quite low, the stopping phase is assumed to happen within a few meters and is not modeled in the simulation.
From the comparison between simulated and measured speed (blue and red lines in
Figure 7b), a good correlation is outlined, with less than 10% variation.
The electric power supplied by the battery, computed by multiplying the battery current and the battery voltage, is shown in
Figure 7c. Power peaks are well captured by the numerical model, with highest errors noticed for peaks characterized by longer duration and moderate throttle levels (as for the case of the first peak).
Figure 7d shows the comparison of the energy consumption during the whole lap, computed by integrating the power supplied by the battery over time. The difference between the numerical and experimental values of the total energy consumption on the considered lap is less than 1%.
4. Driving Strategy Optimization
An optimization problem is set, aiming to obtain the optimal driving strategy. The task is to find the optimal throttle profile in order to minimize the vehicle energy consumption. A single lap of the Brooklands Circuit is considered for the optimization. The vehicle starts from standing position and the time to complete the lap is fixed. The optimization is run offline and in ideal conditions, i.e., no traffic and fully autonomous vehicle.
The input throttle profile is parametrized as shown in
Figure 8. It involves a number of peaks consisting of linear ramps followed by constant throttle regions.
The design variables set allow to define the interval between the end of a peak and the beginning of the next (see
in
Figure 8), the duration of the linear and constant throttle regions (see
and
in
Figure 8, respectively) and the maximum value reached by each peak (see
in
Figure 8).
The maximum number of input throttle peaks is defined a priori and the optimization algorithm is able to find solutions with a number of peaks less than or equal to this maximum value. Peaks are eliminated when the variable is set to zero or merged in the case of null variable .
The range of variation of the design variables is given in
Table 2.
Design constraints are related to the maximum current that the battery can supply and to the distance traveled. In particular, the battery output current cannot exceeds a specific threshold in order to avoid cells damage. The constraint on the traveled distance ensures that, at the end of the simulation, the vehicle travels at least the distance required from a single lap .
The formulation of the optimization problem reads
where the integral represents the objective function to minimize, namely, the energy supplied by the battery in a complete lap of the circuit. The term within the integral, i.e., the product between the value of the battery voltage
and the current supplied by the battery
, expresses the electrical power supplied by the battery. Finally,
is the vector collecting the design variables and
is the design variables domain.
A Genetic Algorithm (GA) [
44] is employed to solve the optimization problem. Individuals are represented by means of binary strings. The number of bits has been selected to have a resolution equal to one second (
Table 2).
The fitness function is defined as
where
e is the traveled distance per unit of energy computed considering the whole lap and normalized with respect to a reference value. Maximizing
e means minimizing the energy consumption on the whole lap. Constraints are considered by means of linear penalty functions (see terms in brackets in Equation (
6)). The coefficients
and
are scaling factors that determine the activation of the penalty terms in case of constraint violation and adjust the action of the constraints.
A single point cross-over is used. A constant probability of mutation equal to is employed.
A population of 100 individuals (i.e., 100 possible combinations of design variables values) obtained from a low-discrepancy Sobol sequence [
45] is selected to initialize the algorithm.
Simulations are carried out on a workstation with an AMD Ryzen 7 2700X 8-core processor @3.70 GHz, and the solver takes about 60 s to complete a single simulation.
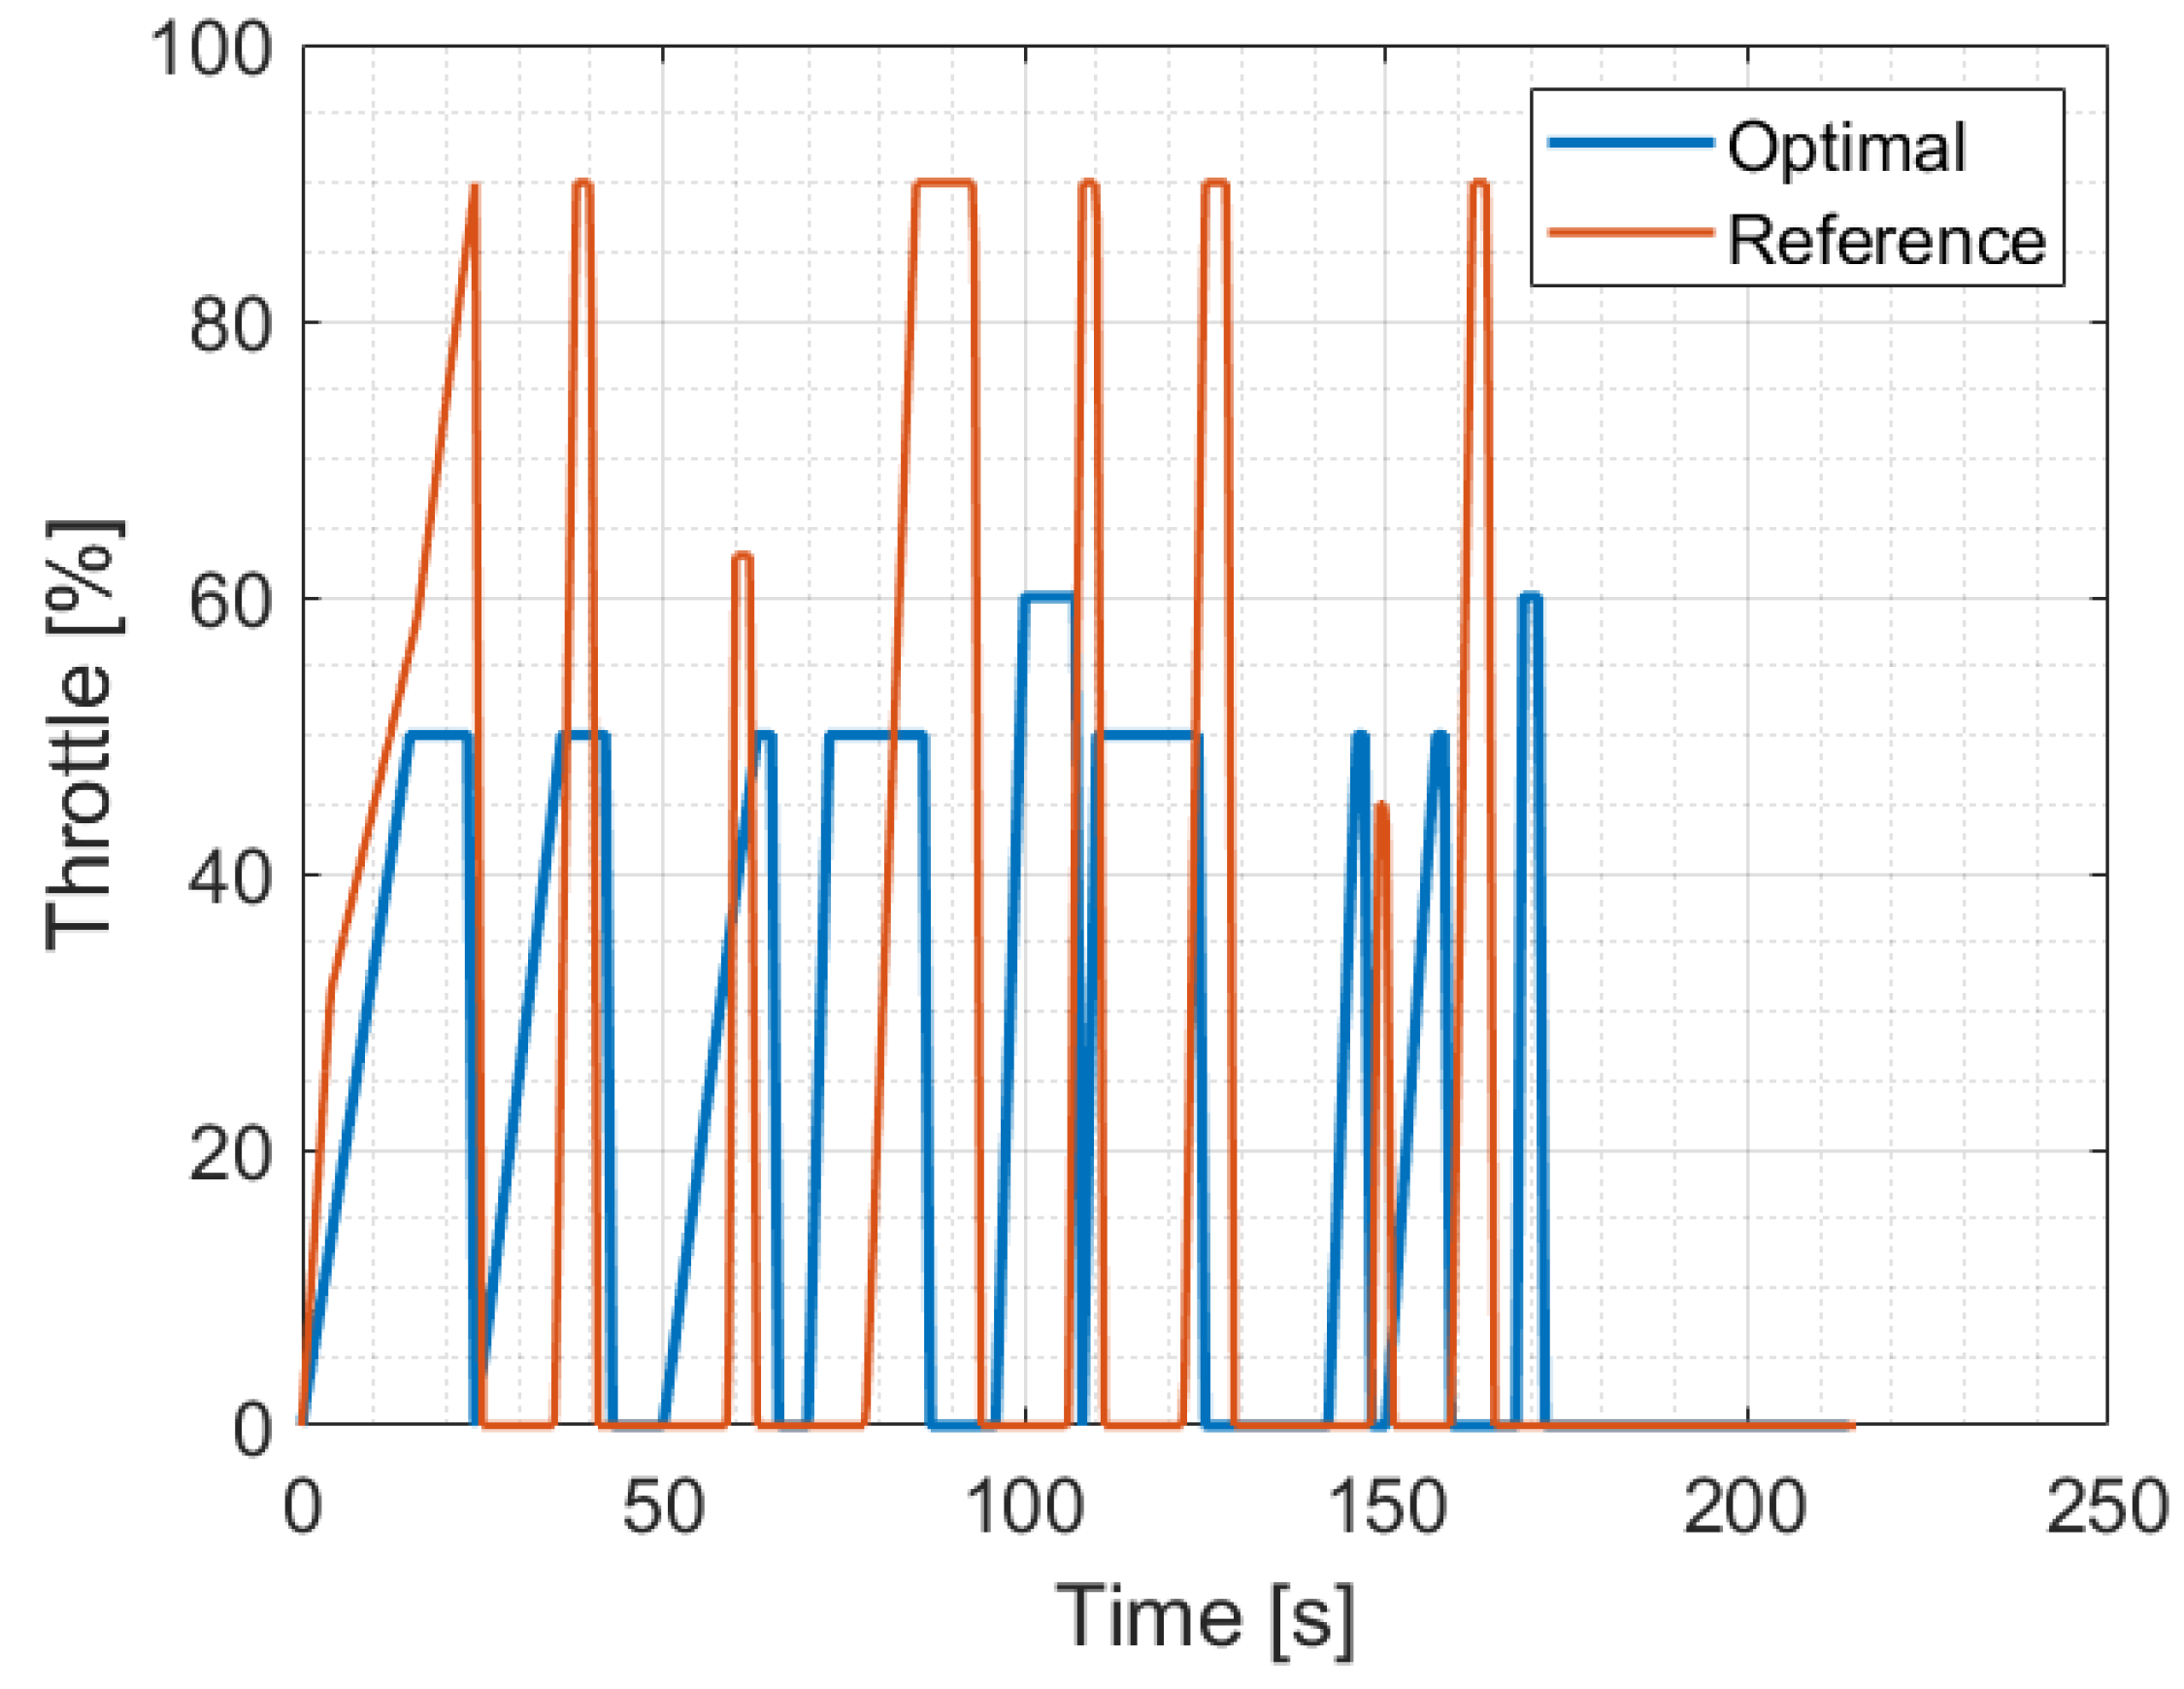
The throttle command obtained as a result of the optimization problem is shown in
Figure 9. The optimal throttle profile features nine throttle peaks; thus, the optimization algorithm reduces the number of peaks. Compared with the throttle command employed for the model validation (red line in
Figure 9), the optimal one tends to reduce the maximum throttle values and to increase their time duration. The optimal driving strategy exhibits an energy consumption of 1.826 × 10
4 J to complete a lap. Compared with the results obtained by simulating the throttle profile analyzed in
Section 3.3, the mileage increases from 192 km/kWh to 280 km/kWh, with an improvement of 45%.
5. Driving Simulator Experimental Campaign
In order to assess the correlation between vehicle energy demand, traffic conditions and human factor, an experimental campaign is carried out leveraging the dynamic driving simulator at Politecnico di Milano (DriSMi).
5.1. Driving Simulator of the Polytechnic University of Milan (DriSMi)
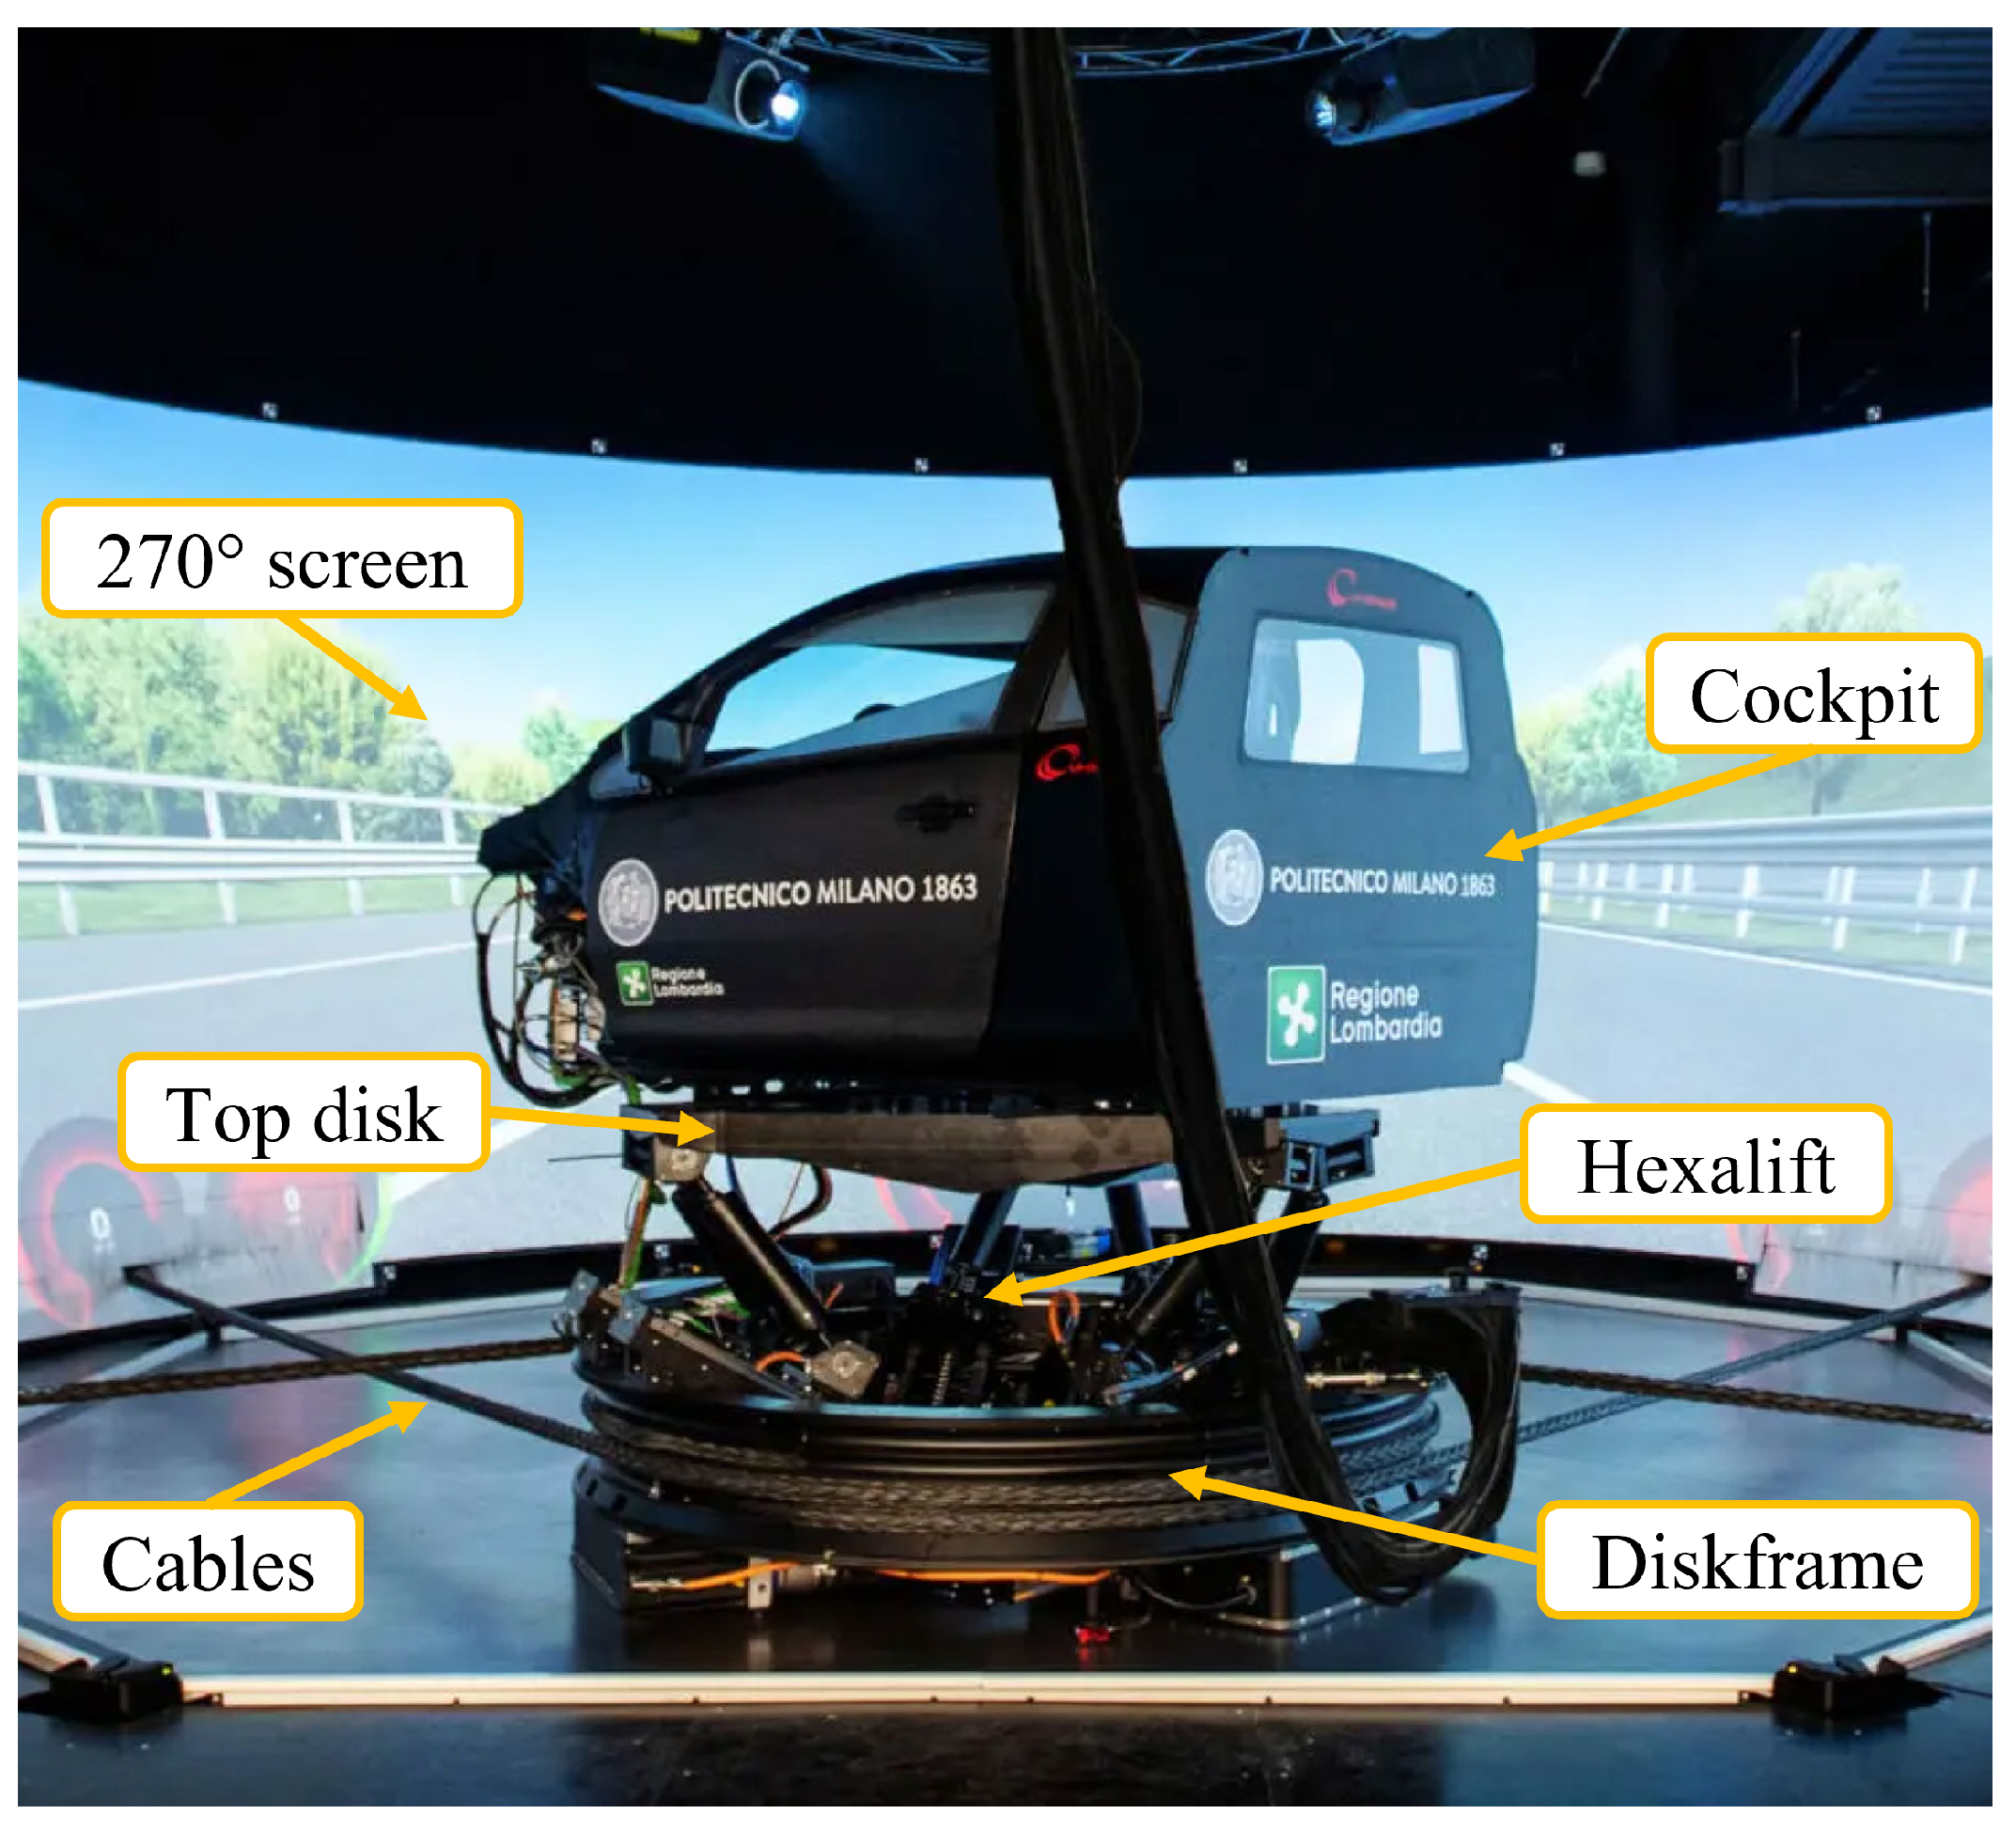
The dynamic driving simulator installed at Politecnico di Milano is shown in
Figure 10. It is a medium-size dynamic simulator characterized by an innovative cable-driven movement.
The motion of the cockpit is obtained by a two-stage actuation system. This system is conceived to decouple the low-frequency motions with respect to the high-frequency motions. The first stage is realized by a diskframe sliding on a steel platform by means of frictionless air cushions. The diskframe realizes low-frequency longitudinal, lateral and yaw motions up to 3 Hz. The second stage is a modified Steward platform, called hexalift, which connects the cockpit to the diskframe and provides six additional degrees of freedom, namely, the three translations and the three rotations of the motion of a rigid body in space. The maximum frequency of the hexalift is above 30 Hz. Additionally, eight shakers are located in correspondence of the suspension connection points and of the engine to simulate high-frequency vibrations up to 200 Hz for NVH (Noise, Vibration and Harshness) analysis for comfort assessment. The specifications of the driving simulator are reported in
Table 3; further details on the driving simulator can be found in [
38,
46].
A 270°-wide screen surrounds the cockpit, improving the driver’s immersion during the test, and five speakers reproduce the sources of noise inside and outside the vehicle while driving.
A high-performance multicore machine is used to perform the computation required to solve the motion equations, run the cueing algorithm, and control graphics and sound. The cueing algorithm is based on a Model Predictive Control (MPC) controller and determines how to move the cockpit so that accelerations and angular speeds perceived are consistent to the ones expected in a given scenario.
The motion of the driven vehicle (ego vehicle) is defined on the basis of a 14 DOFs model of the vehicle. Other vehicles can be part of the scenarios and their motion can be controlled by a traffic-engine or even by an additional human driver.
5.2. Experimental Test Setup
The driving simulator experiment consists of traveling a single track lap from a standing start. Three different tests are carried out, and each test is repeated six times.
Test A: The optimal input throttle profile is imposed to the vehicle. The value of the input throttle is defined based on the position of the vehicle on the track. The driver controls only the steering to drive the vehicle. The ego vehicle runs alone on the track. This test is the closest to the reference (ideal) one; very small deviations are expected among the test repetitions due to the slightly different trajectories imposed by the driver during each lap.
Test B: The optimal input throttle profile is suggested to the driver by means of a signal on the dashboard. In this case, the driver controls the steering and has to follow the suggested (optimal) driving strategy. The test is performed considering two different scenarios:
- B1.
Ego vehicle alone on track;
- B2.
Ego and other NPC vehicles on track.
Test C: No information on the optimal driving strategy is passed to the driver. The driving strategy is defined by the driver itself according to its own experience and after a number of practice laps. The test is repeated considering the following:
- C1.
Ego vehicle alone on track;
- C2.
Ego and other NPC vehicles on track.
Considering the cases where traffic is simulated, the number, the starting position and the imposed average speed of the NPC vehicles are different between tests.
A single individual is chosen to perform all the tests required by the experimental campaign. In particular, the participant has a good driving experience with the vehicle studied in this paper; actually, the official driver of the team for the competition is employed. This removes the effect that would be introduced by non-skilled drivers on the test result. To avoid the so-called “practice effect” (i.e., the participant performs a task better in later conditions since they have had the opportunity to practice) and “fatigue effect” (i.e., the participant performs a task worse in later conditions since they have become tired), the driver performs the tests repetitions in random order.
6. Results
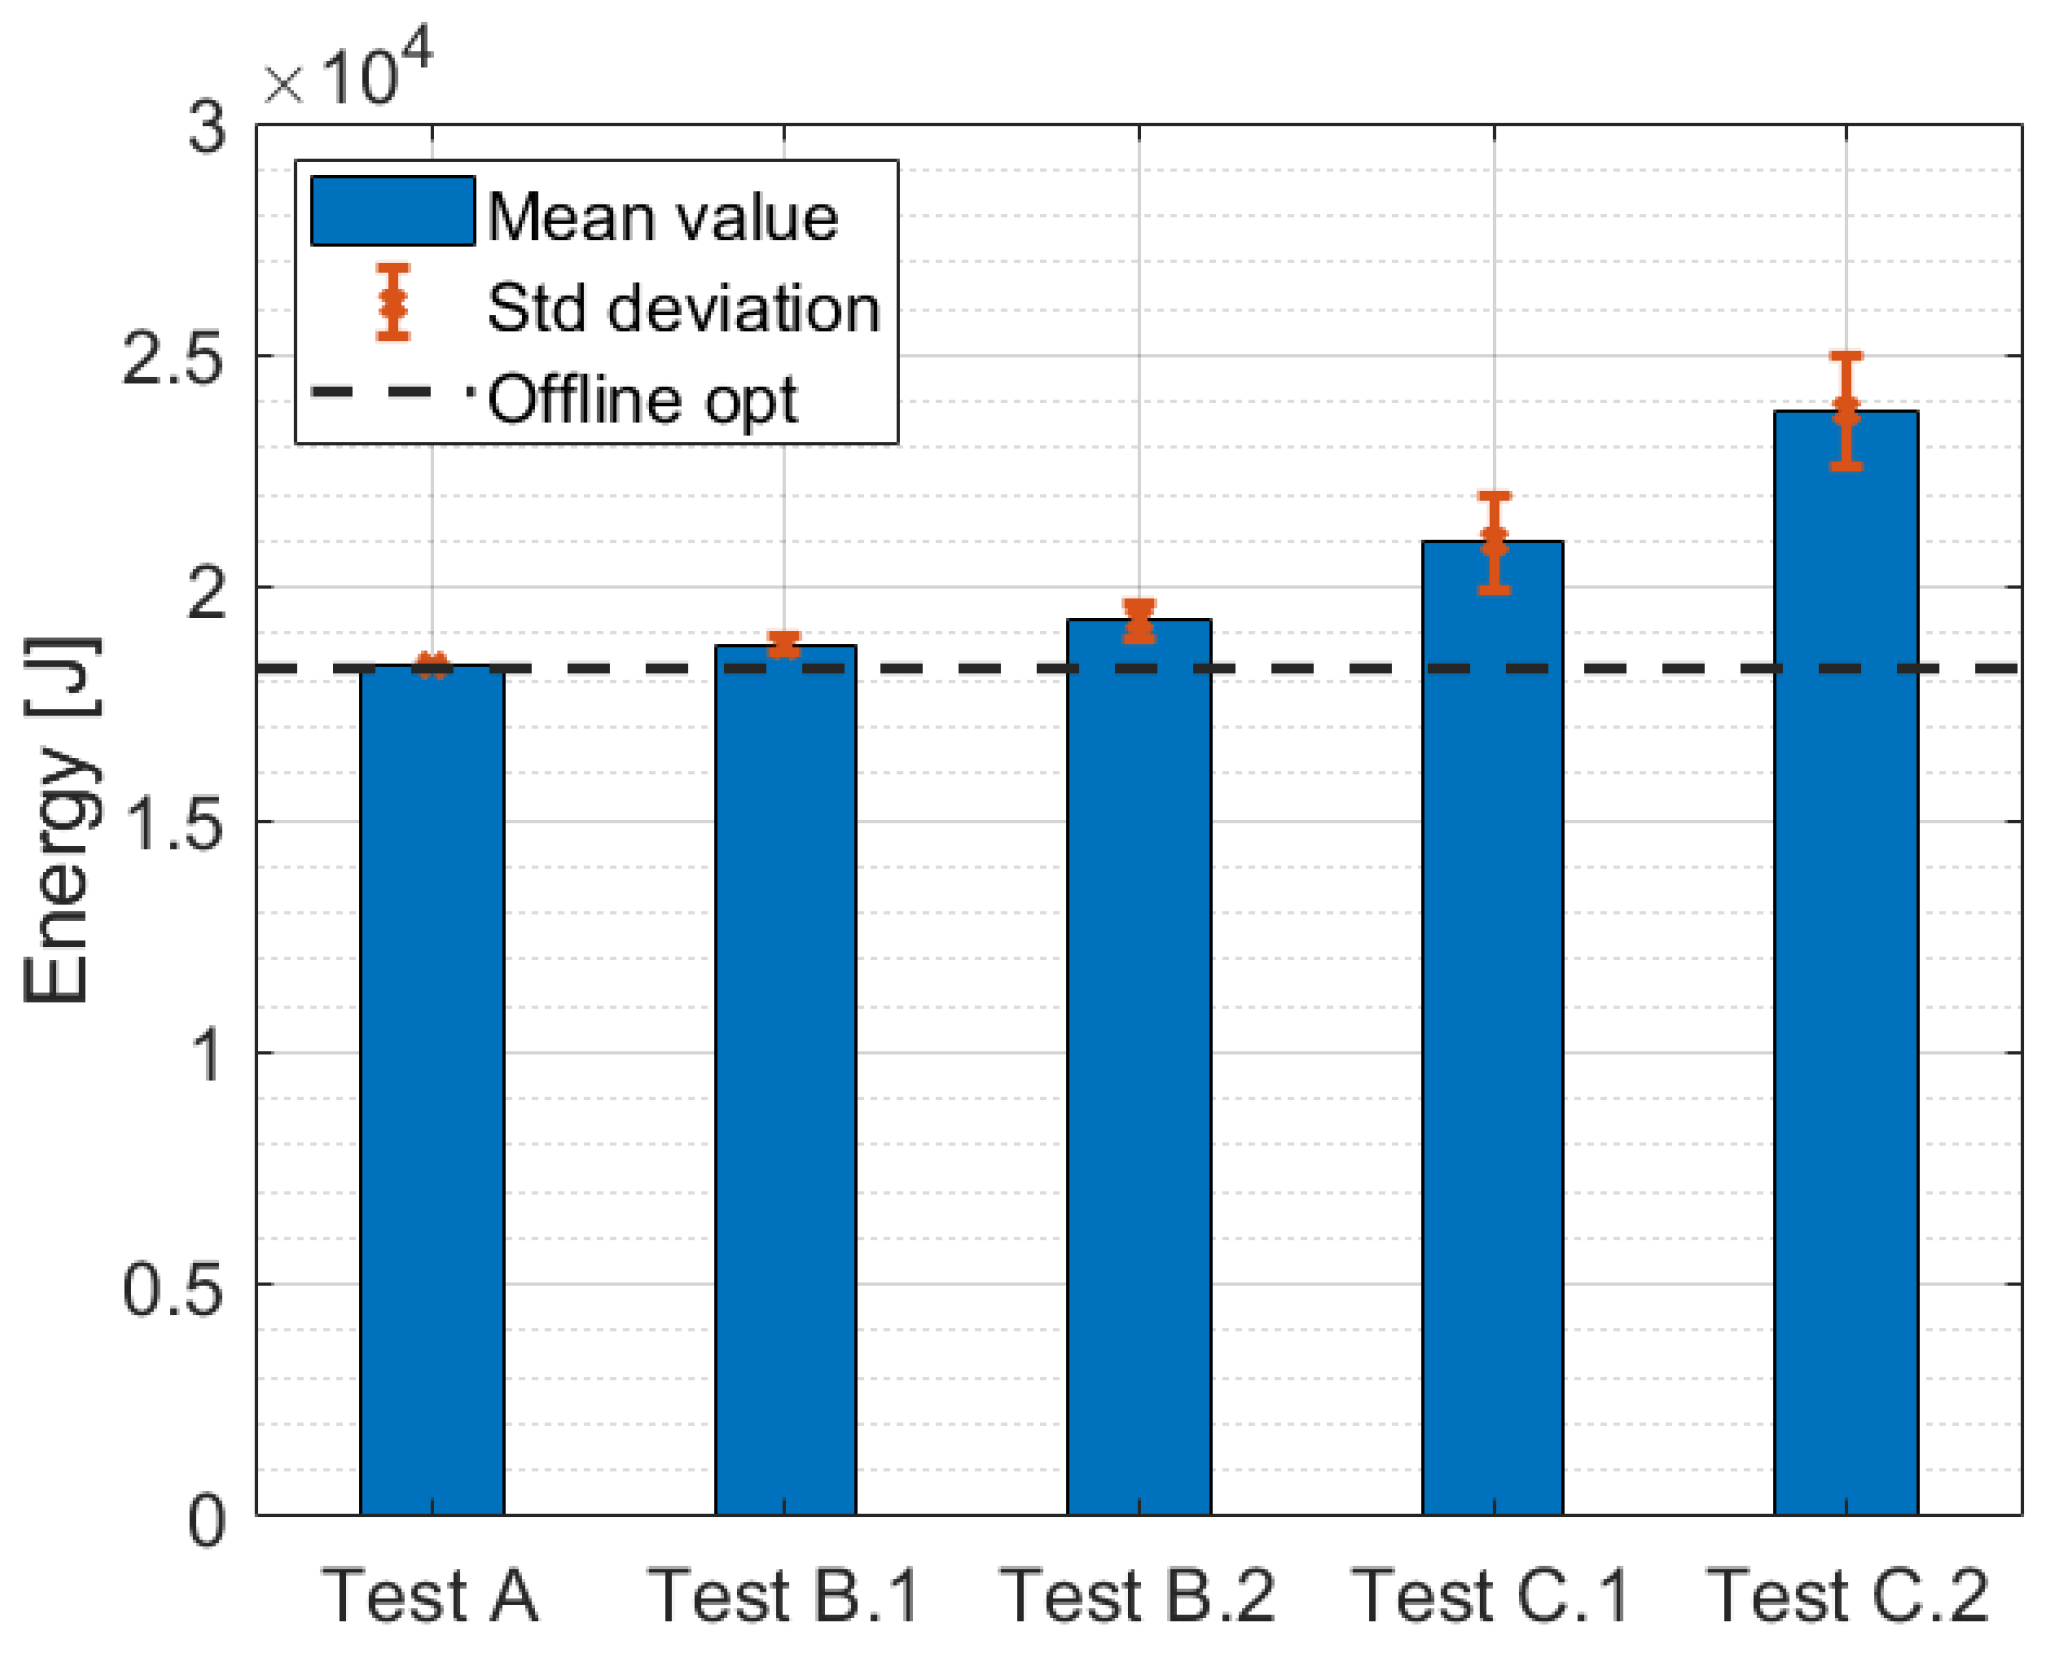
The results of the experimental tests in terms of average energy consumption are shown in
Figure 11. Further details about the results of each test are provided in
Appendix A (see
Table A1). A one-sample
t-test reveals that the average values of energy consumption, obtained from the analysis of the results, are statistically significant (5% significance level is considered).
Direct comparison of the results between the different cases tested is shown in
Table 4. The
p-values, obtained by means of paired
t-tests at 5% significance level, are given in
Table A2 (see
Appendix A), together with the energy consumption mean difference and the standard deviation.
The comparison between Test A and the results of the offline optimization shows that, by imposing the optimal input throttle profile on the vehicle, an energy management approximately equal to the optimal one can be achieved. The slight difference (about 0.3%) is given by the different trajectory chosen by the driver.
The analysis of the results reveals that when moving from an almost ideal scenario (Test A) to a more realistic one (Test C.2), the vehicle energy demand increases by up to approximately 30%.
The impact of the human factor on the vehicle energy consumption is demonstrated by comparing the results of the simulations not involving the presence of the traffic on the track. Passing from the case featuring the optimal throttle automatically imposed to the vehicle to the case where the optimal throttle profile is suggested to the driver, an average increase in energy consumption of 2.5% can be expected. Moreover, when removing eco-driving assistance systems, an increase of 14.4% is recorded.
Results clearly demonstrate that implementing an eco-driving based system, which suggests the driver the optimal throttle profile to follow, leads to an improvement in energy efficiency. Specifically, the energy consumption increases by approximately 11.6% (see comparison between tests C.1 and B.1 in
Table 4).
Considering the scenarios in which traffic is introduced on the track (Test B.2 and Test C.2) and comparing them with corresponding traffic-free scenarios (Test B.1 and Test C.1, respectively), the increase in energy consumption is greater in the case when the driving strategy is completely managed by the driver (+13.6%); if the reference throttle signal is visualized on the dashboard, the increase in energy demand is limited to 2.7%. Compared with Test A, the increase is about 5.3% and 30% for Test B.2 and Test C.2, respectively.
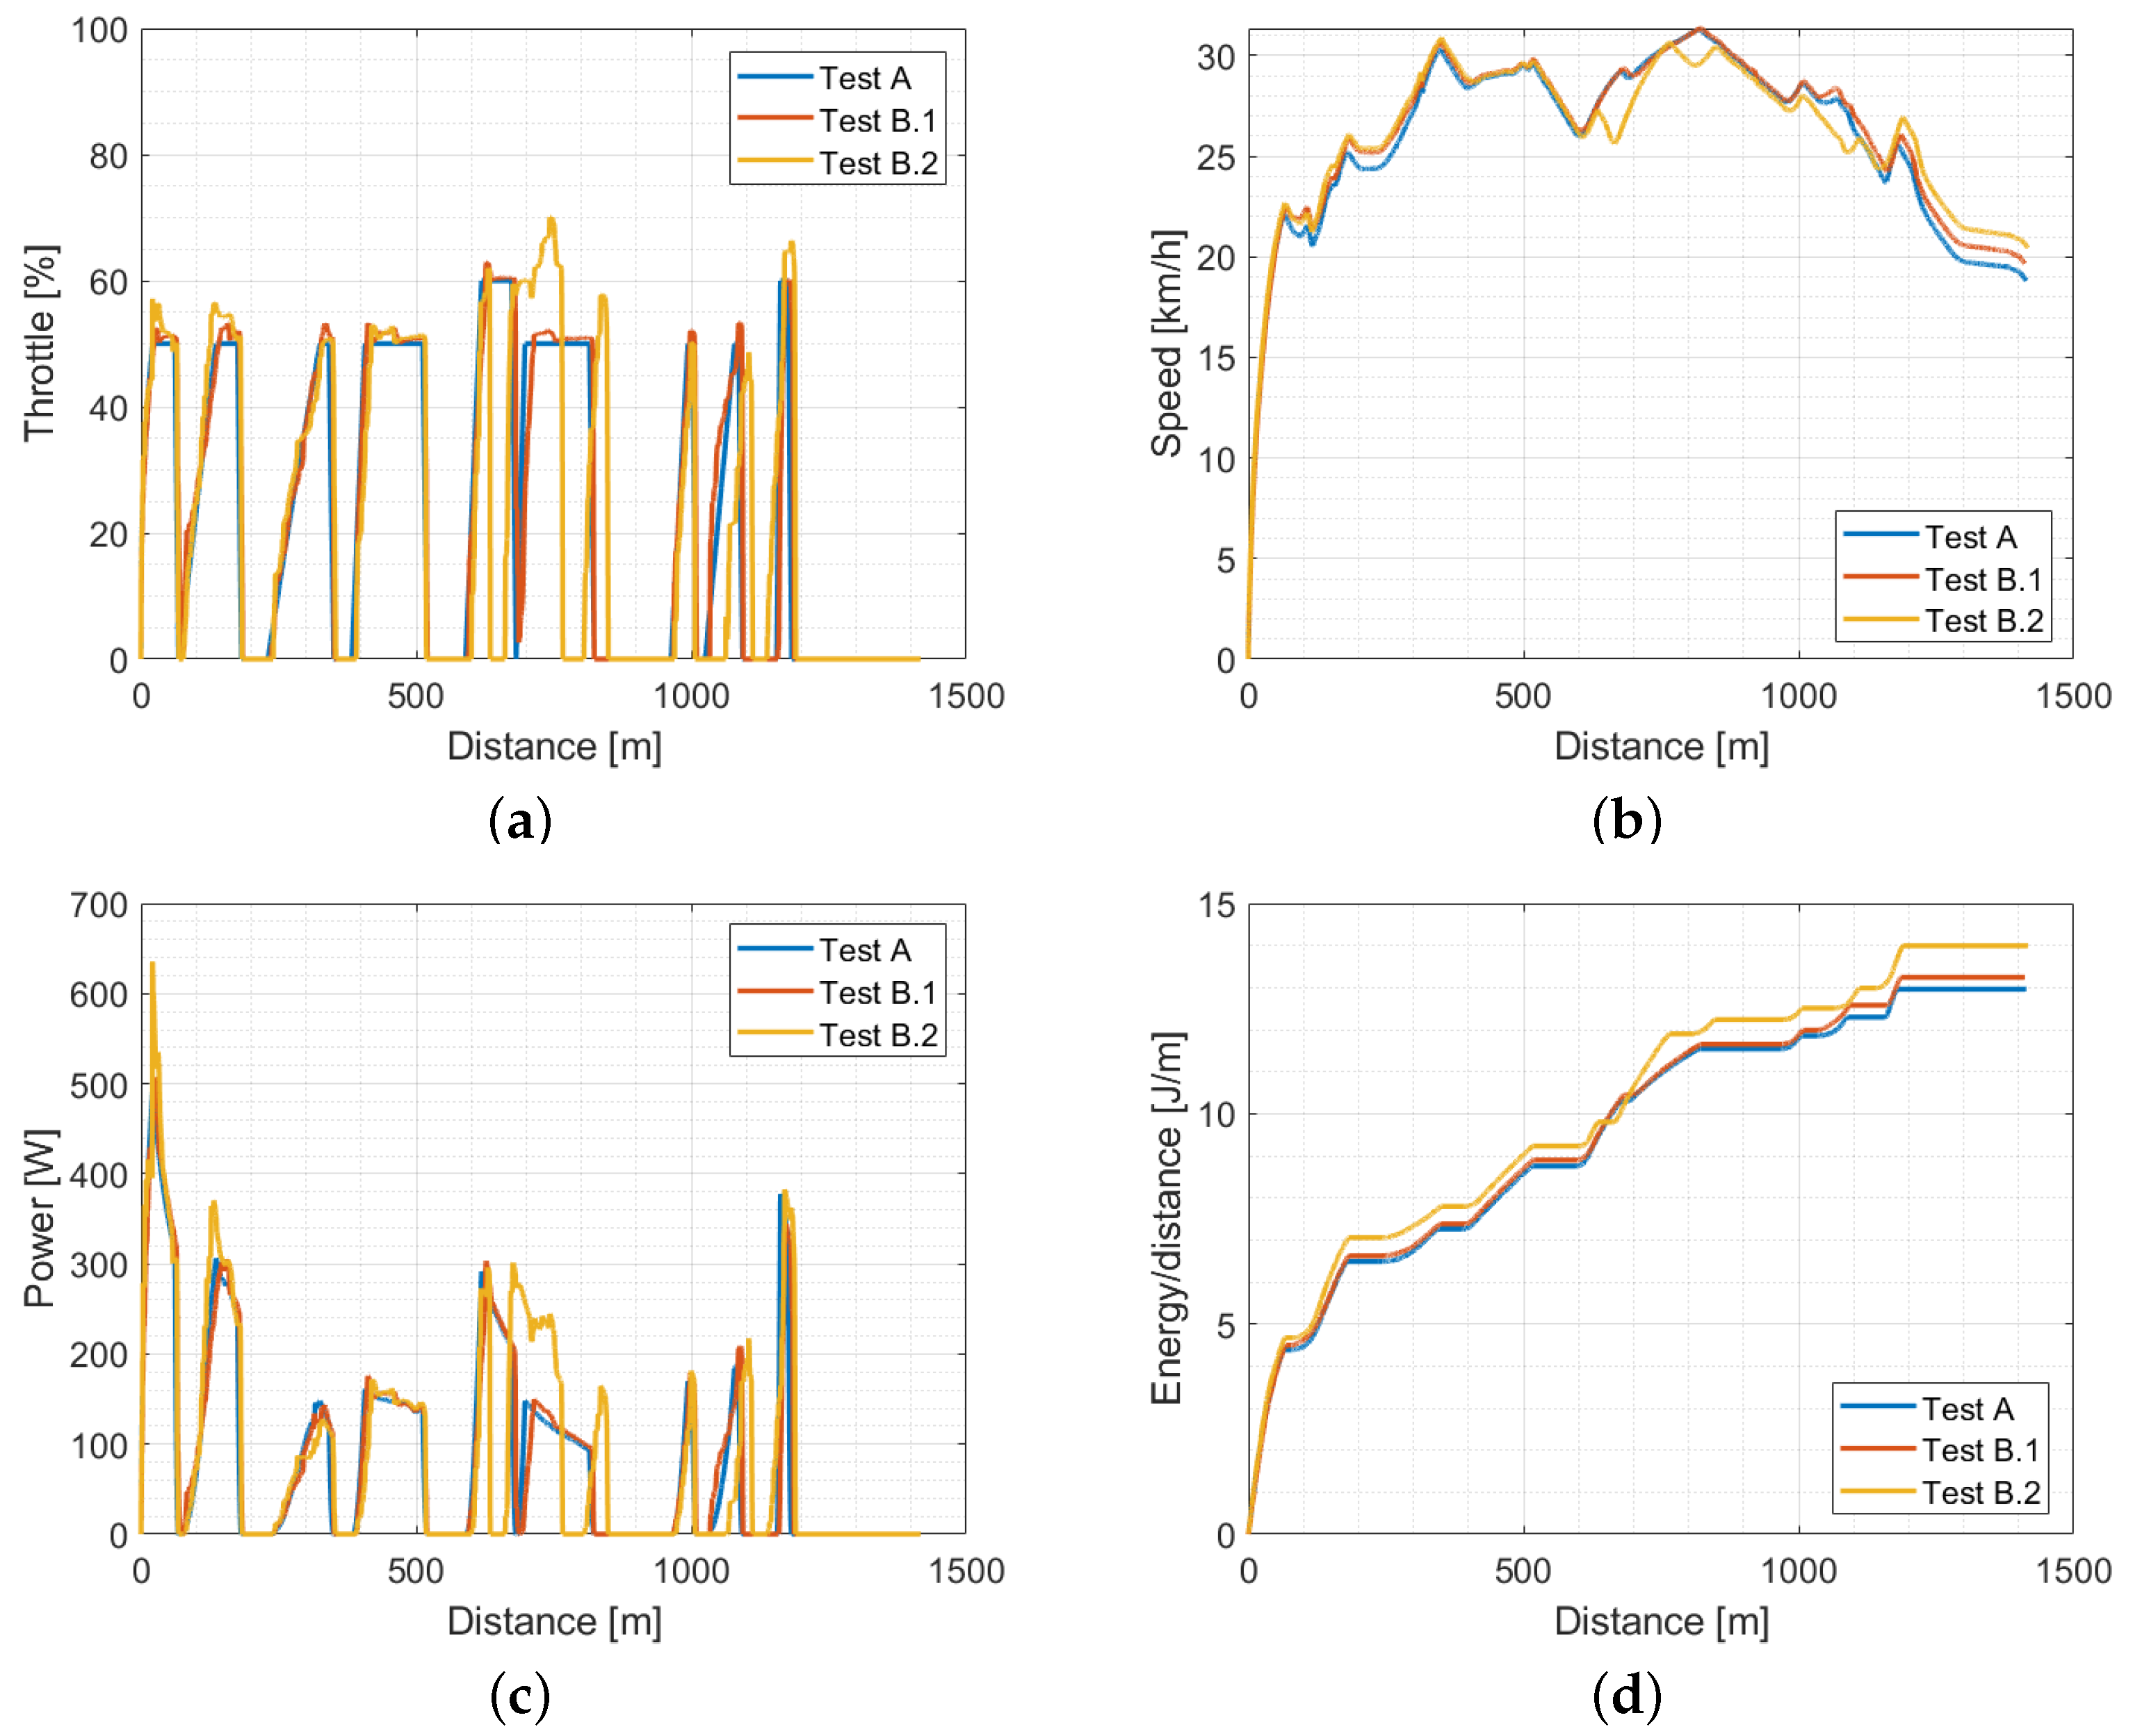
The effect of traffic presence can be detected by referring to
Figure 12. The figure shows the comparison between three single laps extracted from Test A (reference, blue line), Test B.1 (red line) and Test B.2 (yellow line) in terms of input throttle, vehicle speed, electric power absorbed by the battery and energy consumption normalized with respect to the traveled distance.
In absence of traffic, the implemented assistance system allows the driver to replicate the optimal driving strategy with a high level of accuracy (
Figure 12a). The maximum error between the input throttle provided by the driver and the optimal reference throttle is below 5%.
Comparing plots of Test B.1 with those of Test B.2 (where traffic is introduced on the track), until the ego vehicle does not interact with other vehicles (approximately up to 600 m from the start), the driver is able to accurately replicate the suggested optimal throttle profile. From this point on, the driver is disturbed by the presence of other vehicles on the track, being unable to follow the optimal driving strategy. The effect of this perturbation propagates also after the other vehicles have been overtaken, as the driver is forced to adjust the driving strategy to complete the lap on time.
7. Conclusions
In the paper, the problem of eco-driving for energy management of an ultra-efficient electric vehicle for the Shell Eco-marathon competition is addressed. The focus is on the actual implementation of the eco-driving strategy when the physical driver and traffic are included in the simulation loop.
The implemented approach relies on the definition of a digital twin of the vehicle and driving scenario running on a dynamic driving simulator. The vehicle model is created in a co-simulation environment exploiting VI-CarRealTime (VI-CRT) and Simulink. In particular, numerical models of the vehicle body, suspensions, tires, brakes and steering are built by means of VI-CRT. Simulink is employed for accurate modeling of the electric vehicle powertrain.
The vehicle digital twin is validated by comparing numerical results with the data measured during the 2019 Shell Eco-marathon competition. The experimental validation shows a good level of accuracy of the vehicle model.
The problem of optimizing the driving strategy is solved by exploiting the developed model of the vehicle. The optimization is performed offline considering the track route of the Brooklands Circuit, which hosted the 2019 edition of the competition. The optimal input throttle profile that minimizes the energy consumption during a single track lap is obtained. A genetic algorithm is used to solve the optimization problem.
The optimal driving strategy is treated as a benchmark in the subsequent experimental campaign performed by means of a dynamic driving simulator. The aim is to analyze the vehicle energy demand under realistic working conditions, i.e., when the physical driver and road traffic are included in the simulation loop.
The mathematical model of the circuit is created by means of the software RoadRunner. The model represents the external environment surrounding the vehicle and accurately reproduces the track dimensions and shape, as well as buildings and other external entities. Traffic modeling is achieved through VI-WorldSim simulation software.
The experimental campaign is divided into three main parts. Firstly, the optimal throttle signal is imposed to the vehicle and the driver is only actuating the steering. Next, the throttle is also left to the driver, who has to follow a reference signal sent to the vehicle dashboard. Finally, no information about the optimal strategy is passed to the driver, who defines the driving profile according to his own experience and after a number of practice laps. The mentioned tests have been conducted both with and without other vehicles on the road, and the following conclusions can be drawn:
Introducing the physical driver in the simulation loop provides an increase in energy consumption ranging from 2% to 15%, respectively, for the case in which the driver is following a reference throttle signal projected on the dashboard or when no eco-driving strategy is suggested.
Road traffic has a significant influence on the effectiveness of eco-driving strategies (up to 13% more energy used); however, with the support of an assistance system, the driver can limit this increment down to less than 3%.
Overall, eco-driving assistance systems can provide a clear benefit to the energy economy (up to 24% savings) of ultra-efficient lightweight vehicles.
