Review

Review of Bioenergy Potential in Jordan

by
Ra’ed Nahar Myyas
,
Marcos Tostado-Véliz
*,
Manuel Gómez-González
and
Francisco Jurado
Department of Electrical Engineering, University of Jaén, 23700 Jaén, Spain
*
Author to whom correspondence should be addressed.
Energies 2023, 16(3), 1393; https://doi.org/10.3390/en16031393
Submission received: 25 November 2022 / Revised: 23 January 2023 / Accepted: 24 January 2023 / Published: 30 January 2023
(This article belongs to the Special Issue Challenges of Renewable Energy in Developing Countries)

Abstract

:
Despite the enormous efforts put into practice by governmental entities, most of the energy consumption worldwide proceeds from fossil fuels. In this regard, there is a clear need to advance toward the use of cleaner energies. This situation is especially critical in developing countries, where a high population, increased commercial and industrial activities, and rising greenhouse gas (GHG) emissions are major concerns. This paper focuses on reviewing the current energy map in Jordan, one of the developing countries in the Southwest Asia area. Jordan generates 2.7 million tons of municipal solid waste annually, which can cause a variety of environmental problems rather than benefit the energy industry or the country’s economy. Jordan uses biomass energy to provide just 0.1% of its overall energy needs. Presently, produced energy comprises logs, chips, bark, and sawdust is made up of around 44% wood. Jordan has a high potential for producing biomass in the future. About 96% of the biomass is made up of animal manure, followed by olive trees and pomace, with a percentage of 1.8%. This work evaluates the theoretical energy potential of waste in Jordan based on previous studies. Moreover, this article looks at the biomass potential in Jordan, emphasizing how the country may become one of the top producers of bioenergy in terms of waste and identifying procedures to assess the biogas potential for common substrates in Jordanian communities (food and agricultural waste). Finally, some further recommendations are provided for developing the biomass sector in Jordan.

Graphical Abstract

1. Introduction

In 2021, various weather indicators reached top values: greenhouse gas concentrations, sea level rise, ocean warming, and ocean acidification. This is another demonstrable example of how human activity is altering the land, the oceans, and the atmosphere over the whole globe with dramatic and enduring effects. The solution to this problem lies in reducing our dependency on fossil fuels, which are the primary driver of climate change. Global population growth, industrialization, and energy use have all increased significantly. Coal, oil, and natural gas are the major energy sources, but they are finite and prone to depletion. A significant percentage of the world’s power comes from coal. With a total production of 9914 TWh in 2019, 37% of the electricity generated globally came from coal-based sources. Globally, 27,044 TWh of electricity was produced in 2019, utilizing 27% renewable energy sources, mostly because of rising solar and wind energy consumption as well as sizable contributions from biomass and hydropower. In 2019, 14.1% of the primary energy supply came from renewable energy sources such as solar, wind, hydro, biomass, geothermal, etc. This represented an increase of 0.3% from the previous year [1].
Recent studies show that there has been a tremendous improvement in the production of biogas worldwide, both in small-scale domestic digesters in underdeveloped nations and bigger commercial electric biogas facilities. With more than 17,000 commercial biogas plants completed and a total capacity of more than 10 GW, compared to a global electric capacity of 16 GW [2].
Due to the recent invasion of Ukraine, energy markets and policies have altered, and they will continue to do so for decades. Even with the current policy framework, the energy landscape is rapidly changing. A cleaner, more cost-effective, and safer energy system is predicted to be implemented because of global governance initiatives. Demand for coal declines over the following years; natural gas demand stabilizes by the end of the decade, and rising electric vehicle (EC) sales reduce oil demand halfway through the 2030s before slightly declining to the middle of the century [3].
For food security and sustainable development, agriculture, forestry, and other land use (AFOLU) are crucial. When plants grow, they absorb carbon dioxide (CO2) from the air and nitrogen (N) from the soil, redistributing the two substances among various reservoirs, such as above- and below-ground live biomass, dead leftovers, and soil organic matter. In turn, plant respiration, the decomposition of dead plant biomass and soil organic matter, and combustion release CO2 and other non-CO2 greenhouse gases (GHG), mostly methane (CH4) and nitrous oxide (N2O), into the atmosphere. These natural fluxes are subject to changes brought on by anthropogenic land-use activities (such as the management of croplands, forests, grasslands, and wetlands) and changes in land use/cover (such as the conversion of forest lands and grasslands to cropland and grazing, and afforestation) [3].
AFOLU’s primary mitigation options include one or more of three strategies: sequestration, which improves the uptake of carbon in terrestrial reservoirs and thus removes carbon dioxide from the atmosphere; replacement of biological products with fossil fuels or enhanced oil recovery; and reduction or prevention of atmospheric emissions by maintaining soil carbon pools or vegetation that would otherwise be lost, or by reducing methane and nitrous oxide emissions as GHGs. These emissions can be reduced by supply-side mitigation or demand-side options. Although their implantation is challenging, demand-side solutions (such as changing one’s lifestyle, minimizing food losses and wastes, altering one’s diet, or cutting back on one’s use of wood) may also have an impact [4].
Worldwide, around 584 TWh of bioenergy was produced in 2020 [5]; Asia contributed 39% of all bioenergy created globally with 255 TWh of output, followed by Europe at 35%. Europe leads bioenergy production from urban garbage, accounting for 64% of total production, whereas Asia leads the world in the use of industrial waste for power generation, accounting for 71% of total production. Biogas energy dominates in Europe, accounting for 72% of the worldwide market [6]. In the European Union, many by-products of high nutritional value can be produced as animal feed using ethanol from wheat or corn [7]. Furthermore, 94.3 million metric tons of oil equivalent were consumed domestically in 2020, and Germany is the main country consuming most of the energy derived from solid biomass. Its domestic consumption reached 12.7 million metric tons of oil equivalent in 2020 [8] as the biomass energy market in Asia-Pacific grew to 49 GW. It is also anticipated to develop strongly between 2021 and 2026, with a compound annual growth rate of 9% [9]. In the United States, corn ethanol is centrally manufactured, and by-products from dry milling and wet milling processes can be fed to animals, including chickens, pigs, beef, and dairy cows [10].
The 2020 target date for the large-scale commercialization of biomass resources for energy usage in China is emphasized in the 13th five-year plan for the development of renewable energy in China. To completely replace fossil fuels, twelve feedstock-to-final bioenergy conversion paths are presented, and their usage structure is calculated using the China Bioenergy Development Roadmap 2050 [11].
Jordan’s overall population was 10,269,022 in 2021, with a 0.6% yearly population increase [12]. Jordan’s main energy consumption in 2021 was 8166 tons of oil equivalent since it is regarded as one of the energy-consuming nations [13]. The Jordanian energy industry must be resilient because it is susceptible to outside shocks, including price changes, and because it affects the country’s economy. Even humanitarian organizations working in Jordanian refugee camps have faced the costs associated with unreliable electricity sources. As a result, promoting the green energy industry and energy conservation are now the main priorities. In order to meet this challenge, it is necessary to pursue alternatives with a strategic plan whose goals are to, wherever possible, provide stable, affordable, efficient, and clean energy through self-reliance and source diversification [14].
Currently, over 90% of all garbage ends up in unhygienic landfills and dumpsites across the nation as a result of high rates of waste creation and few disposal choices. When waste leachate is not contained, it seeps into the ground and contaminates the water supply. In addition to harboring pests that transmit illness, open landfills are dangerous for the public’s health and general welfare. Waste generation, including hazardous waste and MSW, is anticipated to rise by 3% per year as the population expands [15].
The Ministry of Environment oversees establishing several laws governing this industry, and it should be noted that the Kingdom generates 2.7 million tons of municipal solid waste annually, 2745 tons of medical waste, and 45 tons of hazardous industrial waste. The Hazardous Waste Treatment Center/Swaqa receives the equivalent of 2000 tons of this waste each year, much of it recycled, including used batteries and used mineral oils. The municipal solid waste collection service covers 90% of urban areas and 70% of rural areas, whereas 50% of the overall amount of municipal garbage is made up of organic waste, while 15% is recyclable plastic [16].
Jordan has begun to think about solving this environmental and economic problem, as it is in the process of establishing a biomechanical waste treatment project. The project aims to establish a mechanical-biological facility to treat organic waste with an initial production capacity of 239 tons per day, which will recycle waste and produce energy and fertilizer [17]. Through the yearly combustion of around 19 million cubic meters of biogas, the project will help reduce the emission of 175,000 tons, equivalent to carbon dioxide [18].
In light of the data above, the biomass potential in Jordan is high but currently unexploited. In this regard, this research aims at theoretically quantifying this potential, bringing to light some clear concepts and data that may help establish future developments. In this sense, increasing biomass generation in Jordan would lead to the following benefits:
  • Increase in natural capital.
  • Consistent economic growth.
  • Poverty alleviation and social development.
  • Effective use of resources.
  • Mitigation and adaptation to climate change.
Solid or liquid organic industrial wastes are supposed to be excellent substrates for the anaerobic digestion process that produces biogas. The use of anaerobic digestion technology for industrial waste management would be a significant step in Jordan’s emergence as a hub for renewable energy in the MENA region. Anaerobic digestion of organic industrial waste is quickly gaining popularity throughout the world as one of the best waste management methods.
This research examines, analyzes, and investigates the possibilities of using biomass energy to replace traditional energy in Jordan to assist Jordan in improving its energy status toward a cleaner and more sustainable model. In the rest of this paper, Section 2 provides an overview of the energy sector in Jordan and its sources. Section 3 covers the most common methods of converting biomass into different forms of energy. Section 4 summarizes Jordan’s current biomass and waste regeneration potential to better understand the situation and available resources. The calculations needed to analyze biomass economically are covered in Section 5. Section 6 covers biomass energy balance calculations. Section 7 discusses the most important points that discuss barriers in society, behavior, and education. Section 8 deals with the most important outputs, recommendations, and discussions. Section 9 concludes the paper.

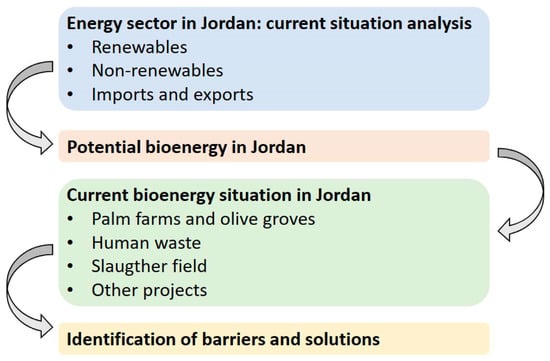
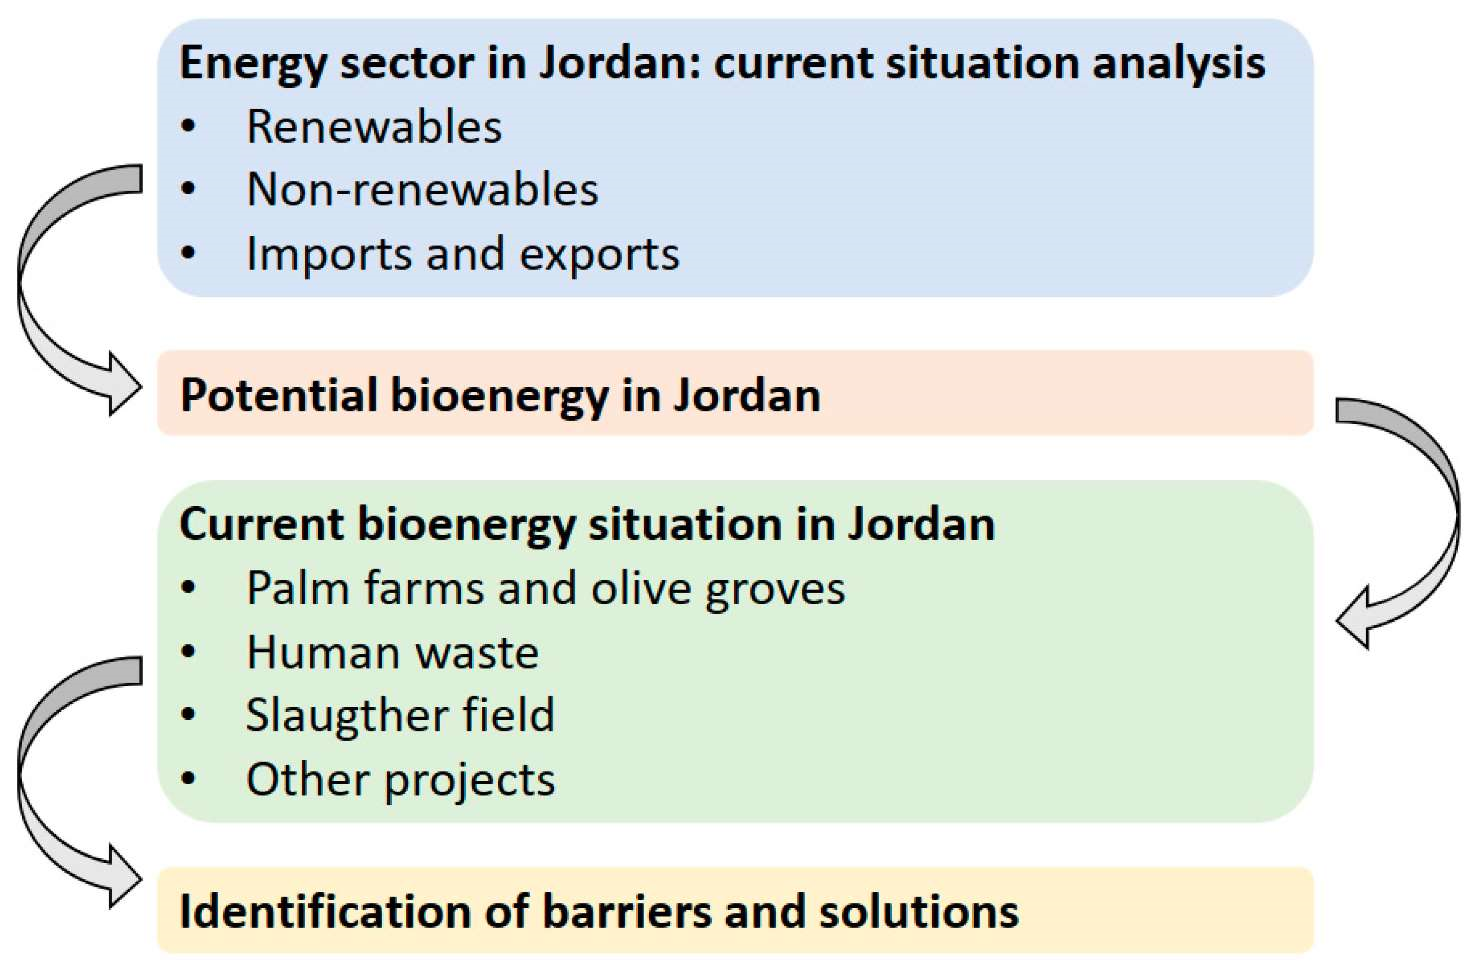
2. The Energy Sector in Jordan: Current Situation

Due to the rapid population growth, increased industrial and commercial activity, the high price of imported energy fuels, and high GHG emissions, the availability of clean and affordable energy resources have become a problem for the Jordanian government. As a result, developing renewable energy projects has elevated to the top of the national agenda in recent years. Projects utilizing waste, biomass, solar, and wind energy must be implemented.
Jordan imported 2.62 billion USD of energy in 2021, while the quantity of primary energy utilized in the same year was 8166 tons of oil equivalent [19]. In Jordan, oil is the country’s main source of energy, accounting for 52% of total consumption, and natural gas for 38%. Per capita consumption is also 0.7 toe/capita, including 1850 kWh of electricity in 2020, as the country’s total consumption of about eight million tons of oil equivalent in the same year decreased by 3.5% since 2017 [20]. Jordan dropped 16 positions to 82 from 66 in the World Economic Forum’s energy transition ranking, scoring 49.5% compared to 53% in the 2019 index. Jordan also received scores of 46% for the efficiency of its energy system (down from 56% the year before) and 53% for pre-default (up from 50% in the index from the prior year). Despite a 0.4% decline in labor force participation [21], Figure 1 shows the total energy supply (TES) by source in Jordan between 1990 and 2021 [22,23].
According to a 2022 report by Economist Intelligence, the world’s energy consumption will only increase by 1.3% in 2023, with the economy sluggish and energy prices rising. Many nations will be forced to turn to fossil fuels because of declining gas supplies and severe weather, which will slow the transition to green energy. Asia will lead the world with an 11% increase in renewable energy consumption, while investment will decline. In fact, even though some governments’ efforts to gradually phase out the use of nuclear energy will be thwarted by the energy crisis. The nuclear power plant project in Jordan was put on hold because the Nuclear Energy Commission was unable to secure parliamentary approval due to public pressure, financial constraints, and technical difficulties [24,25].

2.1. Electricity Generation in Jordan

Families pay 0.100 USD per kWh for household use, and businesses pay 0.123 USD per kWh, and this rate includes all fees associated with using electricity, including taxes, distribution costs, and energy costs [26]. Figure 2 shows the 1990–2021 total electricity generation in Jordan by source.
The per capita consumption of electricity was 1746 kWh. The contribution of natural gas to electricity generation has also decreased over the last year, reaching 73% in comparison to 80% in 2020 [27], whereas local sources contributed 28% of power generation in 2021, up from 22% in 2020. Between the beginning of September 2021 and the end of 2021, 13 million barrels of crude oil were imported (see Figure 3). In comparison, the level of production in the Hamza oil field in 2021 totaled 105 thousand barrels [28]. Bioenergy derived from household waste and other biomass raw materials has the potential to reduce reliance on imported fossil fuels, strengthen the national economy, and reduce harmful GHG emissions.

2.2. Renewables Energy Status in Jordan

The broken global energy mix will be fixed by switching to renewable energy, and the chance that global warming will not exceed 1.5 °C will remain [32]. Before the renewable energy and energy efficiency law was passed regarding climate change requirements requiring stakeholders to report GHG emissions. The most abundant renewable energy sources in Jordan were solar and wind energy, with less potential for bioenergy, hydropower, and geothermal energy [33]. Jordan pledges in its nationally determined contribution (NDC) to cut GHG emissions by 14% by 2030. The NDC’s initiatives include creating and using renewable energy sources and promoting financial investments in this sector [34]. Jordan’s track record demonstrates that decarbonization of the energy mix is possible while still guaranteeing a consistent electricity supply [33]. In 2018, nearly 1.5 million tons of carbon dioxide emissions were saved by electricity produced by solar photovoltaic (PV) and wind. Solar water heaters, up until this point, the only renewable energy source used for heating and cooling, were introduced to the market by the Jordan Renewable Energy and Energy Efficiency Fund [33]. Jordan’s total installed renewable electricity capacity was 2445.7 MW in 2021, of which 1498 MW was the capacity of projects that sold power to electricity companies and 947.6 MW came from non-commercial renewable energy systems owned by individuals and institutions. This represents a 26% increase in the country’s energy production in 2020 [35].
A record from the reference price list is used to determine the upper limit for renewable energy source electricity purchase costs. For electricity based on wind, solar heat, PV, biomass, and biogas, the tariff ceilings for selling electrical energy produced by renewable energy plants are set at 0.12 USD, 0.19 USD, 0.17 USD, 0.13 USD, and 0.08 USD, respectively. These rates will be applied to the successful bidders in direct bids for renewable energy projects. If a facility is established entirely in Jordan, the tariff may increase by 15% [36], This tariff is an encouragement for renewable energy investors to generate electricity and sell it to electricity companies.

3. Potential Bioenergy from Targeted Biomass

Bioenergy needs to be widely used in a sustainable way if future energy scenarios and projected climate change mitigation goals aim to be met. This could lead to a variety of issues, such as the strategic management of land use that does not negatively affect deforestation, GHG emissions, human health, biodiversity loss, or food production. Globally, using by-products of the production of biofuels as animal feed can improve the efficiency of land use and lower GHG emissions associated with the production of biofuels [37,38]. By substituting by-products for grains in the composition of animal feed, land usage can be improved by reducing the area set aside for the production of grains [39,40]. Sugarcane yeasts, bagasse, and molasses can all be fed to cows to help them produce milk and beef [38,41]. Electricity can frequently be produced from bagasse [42]. Additionally, only 7–20% of the total bagasse is utilized in integrated systems as animal feed [43].
A thorough evaluation of the annual amount of organic waste (biomass) produced from a number of sources in Jordan for 2018 was made through research co-conducted by the Royal Scientific Society (RSS) and National Energy Research Center (NERC), in partnership with the Friedrich-Ebert-Stiftung [34] where various types of biomass (Sludge from wastewater treatment plants, animal manure, slaughterhouse wastes, olive oil pomace) were found to produce 627,929.2 tons of carbon dioxide equivalent (toe). For combined thermal and power units in biogas plants, which can generate up to 612,107.4 MWh of thermal energy from olive oil pomace and roughly 10,454.7 MWh/year of electrical energy, the total amount of electricity that can be produced using biogas technology is about 37.02 MW. Due to the high oil content of olive oil pomace, the potential for manufacturing biodiesel was assessed. A total of 28,253,184 L of biodiesel are anticipated to be produced annually from the pomace of olive oil in 2018, having the capacity to build biodiesel production facilities and plants with a 14,715.2 L/h capacity [34]. In order to provide these indicators, the following equations were employed. The yearly energy was calculated using (1), while the biogas power was calculated using (2) [34]:
Annual   Energy = Methane   ( m 3 a )   ×   Heating   value   of   methane   ( KWh m 3 ) × Generator efficiency .
Power   ( KW ) = Total   amount   of   methane   ( m 3 )   ×   Heatning   Valu   KWh m 3 Operating   hours   ( h ) .
This study will investigate three main types of raw materials used as an alternative to fossil fuels from biomass resources in Jordan: solid waste, liquid biofuels, and biogas, as shown in Figure 4.

3.1. Solid Biomass (Wood, Agricultural Residue, and Strong Waste)

Most biomass currently in use is for domestic energy. Biomass energy, which includes tree trunks, chips, bark, and sawdust, is made up of about 44% wood, but any organic material has the potential to produce biomass energy. Examples of agricultural waste that can be used as additional sources of biomass include fruit pits and corn cobs. Wood waste and wood are used to generate electricity. Companies that generate waste use a huge amount of electrical energy, which is produced through a method called cogeneration as opposed to being distributed through utility links. Most of the waste materials produced by paper and sawmills are used to create steam and energy for internal use. However, they must purchase more electricity from utilities due to their high energy consumption [44].
Due to its high nutritional content, waste generated from food processing plants poses a severe risk, including environmental deterioration, water contamination, and land pollution [45]. Trash burning converts rubbish into a valuable type of energy; one ton of garbage contains approximately the same amount of thermal energy as 500 pounds of coal. Garbage is not entirely composed of biomass; perhaps half of its global energy content is derived from plastics, which are derived from petroleum and natural gas [44]. Waste-to-energy plants are power plants that use garbage to generate electricity. These facilities generate electricity in the same way that coal-fired plants do, except that the fuel used to power their boilers is combustible garbage rather than coal [44].
Wood processing generates by-products and waste streams known as “wood processing residues”, which have a notable energy potential. For example, unused sawdust, bark, branches, and leaves/needles are produced during the processing of wood for products or pulp. These residues can subsequently be used to produce biofuels or bioproducts. Because these wastes are already collected at the site of processing, they can be quick and cheap sources of biomass for energy [44].
Agricultural and food waste entering the municipal solid waste stream continues to pollute the environment. The accessibility of sewage sludge with high nutrient levels, including 2.05% N, 0.64% P, 1.39% K, 0.70% calcium (Ca), and 0.23% Mg, combined with a pH level of 6.2 and a low carbon/nitrogen C/N ratio (18:98) [46].

3.2. Biogas Energy (Decay and Rot, By-Products of Animals, and Manure and Human Waste)

Advanced large-scale biogas utilization plants are used in developed nations. Biogas is frequently used to produce electricity, heat, and power. Many industrial applications for using biogas as an alternative to natural gas in biogas plants are also making progress. According to the data analysis, a continuous rise in biogas production as a result of international policies and programs has been seen [47]. As biogas is widely regarded as a traditional off-grid energy source, there are numerous applications for biogas, as it can be used to generate electricity [2], heat generation [48], combined heat and power generation [49], biomethane conversion [50], transportation fuel [51], hydrogen production [52], and fuel cells [47,53].
It is well known that white-rot and brown-rot fungi accelerate wood decay by secreting oxidative enzymes that can accelerate delignification in uncontrolled environments [54]. Enzymatic delignification frequently exhibits significant substrate specificity when operating under favorable conditions and is therefore considered to be an effective, low-energy process [55]. One of the most efficient methods for producing renewable energy is the anaerobic digestion of lignocellulosic biomass. Although rot fungi are widely used in pretreatment for bioethanol production, they have rarely been used to improve biogas production during the anaerobic digestion of lignocellulosic biomass [56]. There are several advantages to producing biogas through anaerobic digestion. Among them, the final solid residue can be used as fertilizer, while the methane produced can be used for a variety of purposes (heat, electricity, and biofuel) [56]. As it stands, the anaerobic digestion of lignocellulosic residues appears to be the most environmentally friendly method of producing biofuels [57].
Food waste can be a crucial input material for anodes in micro fuel cell systems since it is a readily available and easily reducible carbon source [58]. The reported primary composition of the biogas is given in Figure 5 [59].

3.3. Liquid Biofuel Energy (Ethanol and Biodiesel)

Recent research has shown that crops, which are grown for human nourishment, may also be used to make bioethanol, biodiesel, and biogas. Crops are developed by yielding edible oils. However, they present a variety of challenges when it comes to the generation of biofuels. The production of industrial biofuels can utilize a variety of multipurpose oil crops (such as seeds) [60].
The process of chemically converting vegetable oils and animal fats into biodiesel is the most typical method. In many parts of the world, used cooking oil and fat constitute a significant cause of pollution. By utilizing and controlling used cooking oil as a raw material for biodiesel synthesis, these environmental problems may be eliminated. The four main processes for producing biodiesel are pyrolysis, micro-emulsions, direct usage and blending, and transesterification [61].
Due to its complete miscibility, biodiesel can be used either in its pure form or blended with petroleum diesel. Worldwide, Europe leads biodiesel production. Soybean, rapeseed, and palm oils continue to dominate the production of biodiesel globally today. Different alcohols, including methanol, ethanol, propanol, and butanol, can be used in the production of biodiesel [62].
Methanol is the most commonly used alcohol due to the mild reaction conditions required, the quick reaction time, the ease of phase separation, and its low cost and industrial availability [63]. Ethanol from sugar beets produces beet pulp, both of which are excellent sources of nutrition and can be used as animal feed [7]. Ethanol, a fuel alcohol, is created by the fermentation and distillation of sugars and starches in plants. Any organic material that contains cellulose, starch, or sugar can be converted into ethanol. New technology turns the cellulose found in wood fibers from trees, grasses, and crop residues into ethanol. By chemically reacting vegetable oils, animal fats, or greases, such as used restaurant grease, with alcohol, biodiesel is a fuel that is produced [44].
The human production of bioethanol can use a variety of biomasses as raw materials. Based on their chemical makeup, or sources of carbohydrates, they are divided into three groups:
  • Sugar-containing raw materials include sugar beet, sugar cane, molasses, whey, and sweet sorghum.
  • Grains such as corn and wheat are examples of raw materials that contain starch and crops with roots, such as cassava.
  • Lignocellulosic biomass includes straw, crop waste, and wood waste [64].
The use of these first-generation raw materials, which contain sugar and starch, as food or feed, has an impact on their availability. Lignocellulosic biomass (second generation) offers an alternative feedstock for bioethanol production, which is not competitive with food and forage crops due to its low cost, availability, and wide distribution [65,66].
All other organic molecules are produced from ethylene, the simplest olefin (a hydrocarbon with carbon-carbon double bonds), which is widely used in chemistry and society [67].
Although biogas is only sparsely used in a few European regions, bioethanol and biodiesel are the most widely used biofuels for transportation because of their high energy levels, low volatility, and moisture [68,69].

4. Bioenergy Situation in Jordan

Although Jordan is one of the most advanced Arab nations regarding renewable energy generation, its share was estimated at 11% in 2020, and its contribution to biomass energy production to the entire energy mix is unknown, knowing that it has great potential for the production of biofuels from municipal waste, agricultural waste, and agricultural, industrial waste [70]. Jordan’s biomass energy sector is expanding steadily but gradually, as it currently generates 3.5 MWh of electricity from biomass resources, or 0.1% of the nation’s total energy requirements, according to a recent World Bank analysis. Jordan produces large amounts of biomass that can be used as a feedstock for biofuels, including used cooking oil, tallow, agro-industrial waste, industrial effluent, etc. [70].
According to the Minister of Energy and Mineral Resources (2013), the transportation sector alone in Jordan accounts for 51% of all final energy consumption. Hence, policymakers must discover alternative and sustainable transportation fuels such as biodiesel, bioethanol, biogas, algal fuels, etc. However, the formulation of appropriate policies and objectives by the local government goes hand in hand with the allocation, development, and implementation of alternative fuels. Reduced effects of climate change and less dependency on imported fossil fuels are two of the main factors promoting the growth of the biofuel industry in Jordan [71].

4.1. Energy Production from Palm Farms and Olive Groves in Jordan

Oil palm plantations and the processes associated with them frequently produce several tons of biomass waste. These biomasses include palm oil mill effluent, mesocarp fibers, palm kernel shells, and empty fruit bunches. These waste biomasses could endanger the environment’s health if they are not used [72]. A sizable amount of the nutrients from deciduous oil palm debris may be recycled for the establishment of newly planted palm plants on the farm [73,74,75]. The composition of a dried oil palm trunk is shown in Figure 6 [76].
The composition of dried palm oil stem indicated in the above figure shows the average result of a triplicate run on a 100 g dry biomass basis.
Planting olive trees is a common practice throughout the Mediterranean Sea. Olive groves are regarded as the first agricultural produce in Jordan, where agriculture is one of the main economic sectors. Nearly 11 million trees were planted, and olive trees were planted on 570,000 hectares of land, making up about 72% of the area planted with fruit trees and 20% of the entire area under cultivation. Two different types of waste are generated during the olive oil extraction process: one is a solid residue known as olive pomace, or “Jift” as it is known locally, and the other is a liquid waste known as “Zebar.” Each year, Jordan generates roughly 200,000 m3 of Zebar water and 50,000–60,000 tons of olive pomace. The majority of the generated olive pomace is utilized as heating fuel, while Zebar water is transferred to designated landfills without being adequately treated [77].
The study conducted by Al-Addous, et al. in 2017 [78] tested six different samples of olive leaves: green palm leaves, dry palm leaves, and olive pomace from three different olive presses, to assess the potential for gas production to confirm the sample’s ability to produce biogas. As a result, the olive pomace type three produced the most methane, with a value of 103 NLKgFM-1, as indicated in Figure 7 [78].
For the sake of completeness, we show below some useful information and results about the production of olive oil and its by-products:
  • Most of the generated olive pomace was dried and burned directly in homes as heat.
  • 35% of pomace, 17% of oil, and 48% of pomace are all included in one ton of olive pellets [79].
  • In 2018, nearly 200 tons of pomace were generated by each olive oil milling line [80].
  • Most facilities and companies that produce olive oil have several milling lines.

4.2. Human Waste Sources in Jordan

Jordan contains a large amount of biomass in the form of sewage, industrial waste, animal manure, and municipal solid waste, which are managed under the supervision of the Ministries of Local Administration and the Environment, Joint Services Councils. Currently, 19 landfills and other disposal facilities are deployed throughout the country, whose locations are shown in Figure 8.
Municipal solid waste supposes the most prominent source of biomass in terms of amount per capita and components [82]. At most disposal places, nearly 60% of all waste is made up of food waste. Additionally, the Greater Amman area produces more than two million m³ of sewage sludge annually from the treatment of sewage water, which may be a very good source for the production of biogas [82].
According to estimates, sheep, poultry, and cow farms create 1,662,650 tons of wet manure annually [15]. The expense of handling this trash is quite significant, and incorrect disposal may have long-term negative effects on the environment, including unhygienic conditions for adjacent people. In Jordan, biomass energy may be produced from municipal solid waste, agricultural waste, and industrial organic waste [15]. Jordan produces waste in an amount and with a makeup that is comparable to those of most developing nations [15]. The following are the main sources of biomass feedstock in Jordan:
  • Organic waste from grocery stores, motels, and restaurants.
  • Animal waste, primarily from chickens and cows.
  • Agro-industrial organic waste.
  • Industrial organic waste.
  • Garbage accumulated in cities.
  • Septic and sewage sludge.
  • Olive mills.
More than two million tons of municipal trash are produced annually in Jordan, according to estimates [82]. Additionally, after treating 44 million m³ of wastewater, the Greater Amman area generates 1.83 million m³ of sewage and sewage sludge per year. Sewage sludge and garbage can yearly yield 85,000 tons of potential dry matter in Amman [82]. Due to the country’s enormous animal population, which includes cows, sheep, camels, horses, etc., Jordan produces a large amount of animal waste [82].
The yearly quantity of biomass from the target sectors in 2018 demonstrates that most of Jordan’s governorates have significant potential for biomass generation. The largest potential for biomass generation in Jordan may be observed in animal dung, which accounts for around 96% of total biomass. Table 1 reports the percentage of each targeted category of biomass.
The second-largest potential exporter is the olive oil industry, which produces 1.8% of all biomass. As every type of biomass is disposed of via landfilling or dumping in open places, the annual quantities of biomass created have a direct influence on the environment and climate through the production of GHGs.

4.3. Slaughter Field Waste in Jordan

Jordan has 19 slaughterhouses for cows and sheep and 11 for chickens [34]. Blood, internal intestines, and inorganic materials such as wool and feathers are produced during the slaughter of each head. The amount of biological waste produced annually by slaughterhouses was determined using the variables of biowaste production issued by slaughterhouses distributed in all governorates of the Kingdom [34]. Three organizations oversee the slaughterhouses:
  • Agriculture Ministry for slaughterhouses.
  • The Ministry of Local Administration.
  • The slaughterhouse in the Greater Amman Municipality.
The annual organic waste quantity from slaughterhouses in Jordan for poultry, cows, and sheep in 2018 was 15,225 t/a, 1,652 t/a, and 862 t/a, respectively (it is assumed that each cow, sheep, and chicken generate approximately 32 kg, 2.5 kg, and 0.090510 kg of organic waste, as well as 30 L, 4 L, and 0.027512 L of blood, respectively [34]).

4.4. Current Biogas Projects in Jordan

Biogas technology is one approach for converting waste streams into a more valuable renewable source. Anaerobic digestion of organic waste from industrial operations generates energy in the form of biogas, which has the benefit of not emitting odors and containing few germs. Bioreactor design, microbial composition, substrate type and content, temperature, and humidity are only a few of the variables that affect biogas output. However, as seen in Figure 9, biogas can have a range of production parameters (temperature and digestion) based on the substrates utilized. Several substrates, such as plant and animal waste as well as industrial waste, were used to make biogas [83].
In the absence of oxygen, anaerobic digestion is a biological process that breaks down biodegradable organic waste through bacterial decomposition to create biogas. The energy generation potential of biogas derived from various biomass resources P e may be determined using the following equation [85]:
P e = f C H 4 ×   H v C H 4   ×   B i g a s ×   η e 3.6 × 10 6   M J G W h
where η e represents the efficiency of the electricity generation system, %, H v C H 4 represents the heating value of C H 4 (39.0 MJ/m3), and 3.6 × 10⁶ represents the conversion factor from MJ to G W h . B i g a s represents the total amount of biogas generated, m3/year.
Jordan produces biogas energy from the Al-Ghabawi landfill. The only engineered sanitary landfill is Great Amman Municipality’s largest final disposal site (FDS). The remaining 17 FDS are landfills with varying conditions and disposal methods operated by the corresponding JSCs [86], which cover an area of 2 km², and is located in Jordan’s eastern desert, roughly 40 km from the capital, which has 45 biogas wells. The volume of biogas collected from the landfill reached 2669 m3/h by the end of 2021, and electricity generation began in July 2019 [87].

4.4.1. Al-Samra WWTP Biogas

The quantity of solid sludge generated annually in Jordan’s wastewater treatment facilities (WWTPs) was 352,308 (t/a) in 2018 [34]. In the “Zarqa Governorate Description,” the Samra wastewater treatment facility was built to take the place of the outdated and overworked Samra pools. The plant serves 2.2 million people in Greater Amman and Zarqa with a peak flow of 840,000 m³/day and an average flow of 267,000 m³. The factory uses the sludge to fuel a combined heat-and-power (CHP) unit that can produce energy with a total output of 6.5 MW, and the labor, as a consequence, is sent to the landfill [34].

4.4.2. Wadi Shallala WWTP Biogas

Irbid Governorate’s Wadi Al-Shallala treatment facility station opened for business in 2013. The station’s present flow is roughly 7000 m³/day, while the station was built to hold 13,700 m³ of wastewater per day. In addition to two digesters with a combined capacity of 2500 m³, the Wadi Shalala Wastewater Treatment Plant also has a biogas plant for treating sludge. A CHP plant with a total capacity of 0.58 MW uses the biogas generated for energy generation [34].

4.4.3. Al-Russaifah Landfill Biogas

The UNDP-funded Zarqa biogas plant was built at the Rusaifa landfill in 1998 to show how the treatment of organic waste from the central waste can enhance the project. The Rusaifa landfill is located in Zarqa Governorate. In 2018, methane production ceased, and the facility’s electricity production ceased due to the degradation of the organic component in the biowaste. The facility’s 3.5 MW thermal power generation unit was powered by biogas from the plant [34].
Al-Russifah Biogas Landfill produces 850 m³ of gas per hour. Since it began in 2000, the project has produced between 30 and 35 thousand tons of carbon, utilizing around 33 effective gas extraction wells to generate 550 MW/month on a yearly basis [15,88]. A system of twelve landfill gas wells and an anaerobic digestion facility utilizing 60 tons per day of organic waste from Amman’s hotels, restaurants, and slaughterhouses make up the project. Since the biogas plant was installed successfully, it has become a model for the entire area, and numerous large cities are working to adopt it [82].

5. Economic Analysis

In industrialized countries, foreign direct investment (FDI) is subject to stringent environmental regulations. As a result, FDI introduces energy-saving technology to host nations, increasing demand for renewable energy sources such as biomass. Increased demand for renewable energy can lead to the establishment of high-value investment zones. According to the feedback hypothesis, there is a two-way causal link between biomass energy and FDI. This association may be explained by the growth theory. A rise in renewable energy (such as biomass), according to this concept, can encourage foreign direct investment and energy-saving technology [89].
F D I i t = 0 + 1 ×   F D I i 1 + 2 ×   B I O E i t + 3 ×   I N O V i t + 4 ×   N R i t + 5 ×   E C O P i t + 6 ×   P O P D i t + μ 3 , i t
where i and t represent cross-sections and time, respectively. BIOE is a unit of measurement for energy consumption (tons). The ECOP stands for ecological footprint per person. Foreign direct investment (FDI) refers to a net inflow of direct investment equity into an economy, while POPD (population density in km²) stands for the population density. INOV represents total natural resource rents, whereas NR represents natural resources rent. 0 and 1 are panel model slopes, 2     6 are the unknown parameters of equations, and μ represents the regression residual [90].
The process of converting food waste to H2 was studied from a technical and financial perspective. The material consumption index was used to assess the model’s efficacy in producing H2 from food waste. The ratio of food waste to hydrogen can be used to express material consumption in Equation (5).
η FWG   = mfw m hydrogen
where the mass of hydrogen in the product is denoted by m hydrogen and η FWG   denotes   the   quality   of   the   eatenood   waste .
Investments in working and fixed capital, as well as direct and indirect investments, make up the majority of total capital investment (TCI) [91]. The majority of investments in fixed capital are made in large pieces of machinery and infrastructure. Working capital is mostly used to keep the process running on a daily basis [92]. Equation (6) was used to determine investment in equipment for the food waste to H2 process.
I 2 = θ I 1   ( Q 2 Q 1 ) n
where I 1 and Q 1 stand for the research project’s equipment investment and process scale, respectively. I 2 and Q 2 stand for the research project’s process scale and process equipment investment, respectively. On the other hand, n is proportional exponential while θ is a regional factor. The literature was used to acquire information on process size and equipment investments [93]. The equipment investment for the food waste to H2 process was determined using an equation. The TCI value of the food waste to H2 process is determined as follows:
TCI = EI   ( 1 + RF i )
TCI denotes total capital investment, EI denotes equipment investment, where i denotes component investment, and RF denotes component ratio.
The production cost (PC) of the FWG gasification process has been computed using (5). Straight-line technology is expected to last 15 years, with a residual value equivalent to 4% of depreciation cost [94].
P C = C R + C U + C O & M + C D + C P O C + C A C + C D S C

6. Biomass Exergy Balance

The mechanism that turns food waste into H2 is analyzed under pressure using the second law of thermodynamics [95]. Exergy, a commonly employed metric for measuring efficiency, is the portion of exergy that has been most effectively converted into useful work. Equation (9) can be used to express the food waste gasification model’s exergy balance.
E x   F W + E x   a g e n t = E x   s y n g a s + E x   l o s s
where E x   F W ,   E x   a g e n t   and   E x   s y n g a s represents process gas, gasifying, and food waste energy, respectively, and E x   l o s s indicates the exergy loss.
The entire exergy in the gasification process, after accounting for kinetic and potential energy [96], is made up of chemical and physical stress:
E x   T o t a l = E x   p h + E x   c h
where the sum of the physical and chemical energies produced during the gasification process, respectively, are E x   T o t a l , E x   p h   and   E x   c h . The following relationship is satisfied by the physical exergy of mixed gas:
E x p h = i n i e x , p h
where the pure gas is e x , p h . The molar flow of component I is the physical stress related to Equation (12).
e x , p h = ( h h 0 ) T 0 ( s s 0 )
where the values of h 0 and S 0 are, respectively, The reference state’s enthalpy and specific entropy are ( T 0 = 25 °C P 0 = 1 a t m ) [97].
( h h 0 ) = T 0 T C p d T
( s s 0 ) = T 0 T C p T d T R I n   P P 0
where C p is the gas’s specific heat capacity given by [98]
C p = a + b y + c T 2 + d T 3
where the coefficients for various gases are denoted by a, b, c, and d. The following formula is used to calculate an ideal gas’s chemical energy.
E x c h = R T x i l n x i + x i e x c h
where the normal chemical exergy of each component is represented by e x c h . The sole factor considered for most solid fuels is chemical energy. Equation (17) is used to determine food waste’s chemical energy [99].
E ˙ B i o m a s s = 363.439 w ( C ) + 1075.633 w   ( H ) 86.308 w   ( 0 ) + 4.417 w   ( N ) ˙ + 190.78 w   ( S ) 21.1 w   ( A s h )
Food waste has the following mass fractions of C, H, O, N, S, and ash: w(C), w(H), w(O), w(N), w(S), and w (Ash), respectively. The gasification model’s exergy loss consists of both internal and external exergy loss.
E X l o s s = E x l o s s i n + E x l o s s o u t
As shown in Equation (19), heat, mass, physical changes, chemical processes, and entropy are the primary causes of internal exergy loss:
E x l o s s i n = T 0 S g e n
where T 0 is the reference state’s temperature and is the entropy produced by gasification.
Inability to release heat from the gasifier causes exergy loss, as illustrated in Equation (20):
E x l o s s O u t = Q l o s s   ( 1 T 0 T w )
Conducting an energy efficiency assessment for the entire H2 food waste conversion process is crucial. In the study of energy efficiency in the gasification model, the second law of thermodynamics, together with mass and energy balance, served as the theoretical cornerstones for determining the effectiveness of gasification. According to the following equation, the energy efficiency of the aggregate gasification model was defined as the proportion of the product’s energy production to its energy input from its raw materials:
η T o t a l   = E x   o u t E x   i n

7. Barriers in Society, Behavior and Education

The world’s countries currently place a high value on economic and technical growth and development, and it has become a modern trend in how to achieve this aim while not harming the ecological environment in which we live. Traditional energies such as oil, coal, and gas poison the environment. Therefore, the answer was to sustain the rate of economic and technological progress while maintaining the environment while turning to alternative sources of energy that do not pollute the environment, resorting to solar energy, wind energy, water energy, and other renewable energy sources [100].
From the foregoing, it became clear, theoretically and practically, how much bioenergy contributes to achieving sustainable development in various countries, which is the trend adopted by many developed-world nations and international institutions concerned with sustainable development. As a result, it is necessary to emphasize how bioenergy can help achieve the 2030 Sustainable Development Strategy by addressing the axes and goals. The biogas initiatives described in Jordan do not cover all forms of biomass and only employ biogas-generating technologies. That is why, in order to fully utilize the potential of biomass, many sorts of technology are required [34]. The following are the main gaps and challenges facing Jordanian society:
  • The most significant societal hurdles to attaining sustainable renewable energy development are population expansion and unsustainable consumption and production habits.
  • The persistent lack of understanding regarding renewable energy production has stymied progress.
  • There is a scarcity of innovative research in the educational sector.
  • Data are difficult to obtain for consultants, investors, institutions, and researchers, posing a barrier to progress and innovation.
  • There is an insufficient connection between civil society and government.

8. Recommendations and Discussion

The main purpose of the current research is to bridge this research gap that appeared during the review of the literature related to bioenergy in Jordan. To encourage the use of biomass as a major source of electrical energy, we remark below the various possible options that Jordanian organizations may take to bridge the gaps that were presented in the research:
  • The Jordanian government must design and incorporate goals for sustainable development, combating climate change, and green growth within its sectoral policy frameworks. This would encourage the development of greener initiatives and rules that enhance the favorable environment for greener investment and private sector growth.
  • Complementary technical assistance programs must be activated, and support for small and medium-sized enterprises that use recyclable products that are environmentally and climatically sustainable and enhance collaboration across sectors must be provided for the responsible institution to be more successful in obtaining funding for implementation, whether from the general budget or from private investors or donors.
  • Creating training programs to prepare garbage collectors for formal and institutional integration into the recycling value chain by teaching them best practices for recycling in addition to core business and soft skills and issuing necessary regulatory directives in areas where business activity is concentrated companies and enterprises that minimize trash creation or recycle it, as well as organizations that separate the source and carry out waste recycling activities, can all participate in a program of financial and moral grants and incentives.
  • Analyzing current processes and outlining procedures are important to make sure Jordan’s biogas potential is realized. Planning and implementing a standard laboratory; creating, running, and assessing a hybrid biogas pilot plant; as well as designing and executing a biogas inventory for the Jordanian landfills.
  • Jordan’s government should pursue a stronger role for renewables in the future energy mix because of the significant cost reductions in renewable energy technology over the past ten years.

9. Conclusions

This study contributed to a better understanding of the technical, economic, and environmental aspects of the use of bioenergy waste. Coal, oil, and natural gas are the main sources of energy, but they are finite and subject to depletion, reducing our dependence on fossil fuels, which are the main drivers of climate change.
Jordan has a significant potential to produce biofuels from municipal waste, agricultural waste, and industrial waste. Jordan’s biomass energy sector is expanding steadily but gradually. The nation currently generates 3.5 MWh of electricity from biomass resources or 0.1% of the nation’s total energy requirements. The Jordanian government should work to secure energy sources, decrease the nation’s reliance on energy imports, and shift energy supply and demand trends in favor of more sustainable ones. Because investing in biomass energy also has social and economic implications, Jordan must also make substantial efforts to grow this industry as one of the most significant energy choices.
Due to the country’s enormous animal population, which includes cows, sheep, camels, horses, etc., Jordan produces a lot of animal waste. Solid or liquid organic industrial wastes make an excellent substrate for the anaerobic digestion process that produces biogas. The use of anaerobic digestion technology for industrial waste management would be a significant step in Jordan’s emergence as a hub for renewable energy in the MENA region.

Author Contributions

Conceptualization, R.N.M., M.T.-V., M.G.-G. and F.J.; methodology, R.N.M. and M.G.-G.; software, M.T.-V. and F.J.; validation, M.T.-V., M.G.-G. and F.J.; formal analysis, R.N.M., M.T.-V. and F.J.; investigation, R.N.M.; resources, M.T.-V., M.G.-G. and F.J.; data curation, M.T.-V. and M.G.-G.; writing—original draft preparation, R.N.M. and M.G.-G.; writing—review and editing, M.T.-V. and F.J.; visualization, M.T.-V. and F.J.; supervision, M.T.-V. and F.J.; project administration, F.J.; funding acquisition, M.T.-V. and F.J. All authors have read and agreed to the published version of the manuscript.

Funding

This research received no external funding.

Informed Consent Statement

Not applicable.

Data Availability Statement

Not applicable.

Conflicts of Interest

The authors declare no conflict of interest.

Abbreviations

SymbolDescriptionSymbolDescription
GHGGreenhouse GasTESTotal Energy Supply
CO2Carbon DioxideKWhKilowatt-hour
N2ONitrous OxideUSDUnited States Dollar
CH4MethaneNDCNationally Determined Contribution
AFOLU’sAgriculture, Forestry, And Other Land UseToe/CapTon Of Oil/Capacity Market Programs
NNitrogenCaCalcium
TWhTon Watt-hourMgMagnesium
GWGiga WattMEMRMinister of Energy and Mineral Resources
PJPetajouleMENAMiddle East and North Africa.
GWhGiga Watt hourkgKilograms
FDIForeign Direct InvestmentWWTPWastewater Treatment Plant.
TCITotal Capital InvestmentCHPCombined Heat and Power
NLKgfm−1Cumulative biogas formation and methane yield volume produced per kgL methane kgfm−1Cumulative methane yield formation potential.
t/aTon/annumFDSFinal Disposal Site
JSCJoint Service Councils

References

  1. Alhassany, H.D.; Abbas, S.M.; Tostado-Véliz, M.; Vera, D.; Kamel, S.; Jurado, F. Review of Bioenergy Potential from the Agriculture Sector in Iraq. Energies 2022, 15, 2678. [Google Scholar] [CrossRef]
  2. Scarlat, N.; Dallemand, J.-F.; Fahl, F. Biogas: Developments and perspectives in Europe. Renew. Energy 2018, 129, 457–472. [Google Scholar] [CrossRef]
  3. IEA. World Energy Outlook 2022. 2022. Available online: https://www.iea.org/news/world-energy-outlook-2022- (accessed on 25 May 2022).
  4. Smith, P.; Clark, H.; Dong, H.; Elsiddig, E.A.; Haberl, H.; Harper, R.; House, J.; Jafari, M.; Masera, O.; Mbow, C.; et al. Ecosystems Services and Management (ESM). In Climate Change 2014; Cambridge University Press: Cambridge, UK, 2014; Chapter 11. [Google Scholar]
  5. Jaganmohan, M. Production of Bioenergy Worldwide from 2009 to 2020. Available online: https://www.statista.com/statistics/1032907/bioenergy-production-globally/ (accessed on 3 June 2022).
  6. Global Bioenergy Statistics; World Bioenergy Association: Stockholm, Sweden, 2021.
  7. Buchspies, B.; Kaltschmitt, M. The Influence of Co-product Handling Methodology on Greenhouse Gas Savings of Biofuels in the European Context. BioEnergy Res. 2016, 10, 167–182. [Google Scholar] [CrossRef]
  8. Jaganmohan, M. Leading Consumer of Solid Biomass Energy in the European Union (EU) in 2020. Available online: https://www.statista.com/statistics/799370/solid-biomass-energy-production-european-union-eu/ (accessed on 15 June 2022).
  9. Asia Pacific Biomass Energy Market. EMR Expert Market Research, USA & Canada. 2022. Available online: https://www.expertmarketresearch.com/pressrelease/asia-pacific-biomass-energy-market (accessed on 17 July 2022).
  10. Popp, A.; Calvin, K.; Fujimori, S.; Havlik, P.; Humpenöder, F.; Stehfest, E.; Bodirsky, B.L.; Dietrich, J.P.; Doelmann, J.C.; Gusti, M.; et al. Land-use futures in the shared socio-economic pathways. Glob. Environ. Change 2017, 42, 331–345. [Google Scholar] [CrossRef] [Green Version]
  11. Kang, Y.; Yang, Q.; Bartocci, P.; Wei, H.; Liu, S.S.; Wu, Z.; Zhou, H.; Yang, H.; Fantozzi, F.; Chen, H. Bioenergy in China: Evaluation of domestic biomass resources and the associated greenhouse gas mitigation potentials. Renew. Sustain. Energy Rev. 2020, 127, 109842. [Google Scholar] [CrossRef]
  12. World Bank. 2022. Available online: https://www.data.worldbank.org (accessed on 1 July 2022).
  13. Addustour. Disclosure of the cost of Jordan’s import of energy in 2021. Available online: https://www.addustour.com/articles/1289785 (accessed on 4 August 2022).
  14. Glada Lahn, S. Refugees and Energy Resilience in Jordan; Chatham House: London, UK, 2016. [Google Scholar]
  15. Ministry of Environment. Waste Sector—Green Growth National Action Plan 2021–2025; Ministry of Environment: Amman, Jordan, 2020. [Google Scholar]
  16. Ministry to Issue $20m Tender to Handle Medical, Hazardous Waste. Jordan News, 27 October 2022.
  17. Da’aja, K. The Strategic Plan of the Greater Amman Municipality. 2022. Available online: https://amman.jo/ (accessed on 29 October 2022).
  18. Jordan News. Available online: https://www.petra.gov.jo/Include/InnerPage.jsp?ID=105545&lang=ar&name=news (accessed on 30 October 2022).
  19. Ministry of Energy and Mineral Resources Annual Report. 2021. Available online: https://www.memr.gov.jo (accessed on 1 November 2022).
  20. Energy Data Intelligent and Consulting. 2022. Available online: www.enerdata.net (accessed on 2 November 2022).
  21. Myyas, R.N.; Almajali, M.R. Effect of COVID-19 on Energy Sector in Jordan. Int. J. Energy Econ. Policy 2022, 12, 20–29. [Google Scholar] [CrossRef]
  22. International Energy Agency. 2022. Available online: www.iea.org (accessed on 3 November 2022).
  23. International Energy Agency. Natural Gas Information. 2022. Available online: http://wds.iea.org/wds/pdf/gas_documentation.pdf (accessed on 3 November 2022).
  24. Economist Intelligence (EIU). Energy Outlook Surviving the Energy Crisis. 2023. Available online: www.eiu.com (accessed on 4 November 2022).
  25. Abu-Rumman, G.; Khdair, A.I.; Khdair, S.I. Current status and future investment potential in renewable energy in Jordan: An overview. Heliyon 2020, 6, e03346. [Google Scholar] [CrossRef] [PubMed]
  26. Global Petrol Prices. 2022. Available online: https://www.globalpetrolprices.com/ (accessed on 5 November 2022).
  27. Zaidan, R. Natural Gas Accounts for 73% of Electricity Generation; Alghad: Amman, Jordan, 2022. [Google Scholar]
  28. Jordan News. 2022. Available online: https://www.jordannews.jo (accessed on 5 November 2022).
  29. MEMR. Summary of Jordan Energy Strategy 2020–2030.; Ministry of Energy & Mineral Resources: Amman, Jordan, 2020. [Google Scholar]
  30. Khalifeh, A. Jordan Imports JD2.8 Billion Worth of Energy in 2021. Jordan News, 3 July 2022.
  31. Attaqa. Jordan’s Production of Oil and Gas Records 177.3 Thousand Tons in 2021. Available online: https://attaqa.net/ (accessed on 6 November 2022).
  32. Myyas, R.N.; Al-Dabbasa, M.; Tostado-Véliz, M.; Jurado, F. A novel solar panel cleaning mechanism to improve performance and harvesting rainwater. Sol. Energy 2022, 237, 19–28. [Google Scholar] [CrossRef]
  33. IRENA. Renewable Readiness Assessment: The Hashemite Kingdom of Jordan; International Renewable Energy Agency: Abu Dhabi, United Arab Emirates, 2021. [Google Scholar]
  34. Ababneh, S. The Climate Effect of Biomass and a Roadmap for Development of Bioenergy Projects in Jordan_sa-0; Royal Scientific Society: Amman, Jordan, 2019. [Google Scholar]
  35. The Jordan Times. 2022. Available online: https://www.jordantimes.com (accessed on 7 November 2022).
  36. Hosseini, F. Case Study on Policy Reforms to Promote Renewable Energy in Jordan; Economic and Social Commission for Western Asia: Beirut, Lebanon, 2018. [Google Scholar]
  37. Anderson, R.; Keshwani, D.; Guru, A.; Yang, H.; Irmak, S.; Subbiah, J. An integrated modeling framework for crop and biofuel systems using the DSSAT and GREET models. Environ. Model. Softw. 2018, 108, 40–50. [Google Scholar] [CrossRef]
  38. De Souza, N.R.D.; Fracarolli, J.; Junqueira, T.L.; Chagas, M.F.; Cardoso, T.F.; Watanabe, M.D.; Cavalett, O.; Filho, S.V.; Dale, B.E.; Bonomi, A.; et al. Sugarcane ethanol and beef cattle integration in Brazil. Biomass-Bioenergy 2019, 120, 448–457. [Google Scholar] [CrossRef]
  39. Corré, W.; Conijn, J.; Meesters, K.; Bos, H. Accounting for co-products in energy use, greenhouse gas emission savings and land use of biodiesel production from vegetable oils. Ind. Crop. Prod. 2016, 80, 220–227. [Google Scholar] [CrossRef]
  40. Mumm, R.H.; Rausch, K.D.; Stein, H.H. Land usage attributed to corn ethanol production in the United States: Sensitivity to technological advances in corn grain yield, ethanol conversion, and co-product utilization. Biotechnol. Biofuels 2014, 7, 61. [Google Scholar] [CrossRef] [PubMed] [Green Version]
  41. Egeskog, A.; Berndes, G.; Freitas, F.; Gustafsson, S.; Sparovek, G. Integrating bioenergy and food production—A case study of combined ethanol and dairy production in Pontal, Brazil. Energy Sustain. Dev. 2011, 15, 8–16. [Google Scholar] [CrossRef]
  42. De Oliveira Silva, R.; Barioni, L.G.; Hall, J.A.J.; Moretti, A.C.; Fonseca Veloso, R.; Alexander, P.; Crespolini, M.; Moran, D. Sustainable intensification of Brazilian livestock production through optimized pasture restoration. Agric. Syst. 2017, 153, 201–211. [Google Scholar] [CrossRef]
  43. De Souza, N.R.D.; Cavalett, O.; Junqueira, T.L. Techno-economic and environmental assessment of bioenergy and livestock integrated systems in Brazil. Sustain. Prod. Consum. 2022, 32, 580–592. [Google Scholar] [CrossRef]
  44. Biomass at a Glance. National Energy Education Development Project. 2019. Available online: https://www.need.org (accessed on 12 November 2022).
  45. Peter, A.P.; Chew, K.W.; Koyande, A.K.; Munawaroh, H.S.H.; Bhatnagar, A.; Tao, Y.; Sun, C.; Sun, F.; Ma, Z.; Show, P.L. Integrated microalgae culture with food processing waste for wastewater remediation and enhanced biomass productivity. Chin. Chem. Lett. 2023, 34, 107721. [Google Scholar] [CrossRef]
  46. Pulingam, T.; Lakshmanan, M.; Chuah, J.-A.; Surendran, A.; Zainab-L, I.; Foroozandeh, P.; Uke, A.; Kosugi, A.; Sudesh, K. Oil palm trunk waste: Environmental impacts and management strategies. Ind. Crop. Prod. 2022, 189, 115827. [Google Scholar] [CrossRef]
  47. Abanades, H.S.; Ahmadi, A.; Das, B.; Ehyaei, M.A.; Esmaeilion, F.; El Haj Assad, M.; Hajilounezhad, T.; Jamali, D.H.; Hmida, A.; Ozgoli, H.A.; et al. A critical review of biogas production and usage with legislations framework across the globe. Int. J. Environ. Sci. Technol. 2022, 19, 3377–3400. [Google Scholar] [CrossRef]
  48. Herbes, C.; Halbherr, V.; Braun, L. Factors Influencing prices for heat from biogas plants. Appl. Energy 2018, 221, 308–318. [Google Scholar] [CrossRef]
  49. Damyanova, S.; Beschkov, V. Biogas as a Source of Energy and Chemicals. In Biorefinery Concepts; IntechOpen: London, UK, 2020. [Google Scholar]
  50. Kapoor, R.; Ghosh, P.; Kumar, M.; Vijay, V.K. Evaluation of biogas upgrading technologies and future perspectives. Environ. Sci. Pollut. Res. 2019, 26, 11631–11661. [Google Scholar] [CrossRef]
  51. Yang, L.; Ge, X.; Wan, C.; Yu, F.; Li, Y. Progress and perspectives in converting biogas to transportation fuels. Renew. Sustain. Energy 2014, 40, 1133–1152. [Google Scholar] [CrossRef]
  52. Minh, D.P.; Siang, T.J.; Vo, D.V.; Phan, T.S.; Ridart, C.; Nzihou, A.; Grouset, D. Hydrogen Production from Biogas Reforming: An Overview of Steam Reforming, Dry Reforming, Dual Reforming, and Tri-Reforming of Methane. In Hydrogen Supply Chains; Elsevier: Amsterdam, The Netherlands, 2018. [Google Scholar]
  53. Wasajja, H.; Lindeboom, R.E.; van Lier, J.B.; Aravind, P.V. Techno-economic review of biogas cleaning technologies for small scale off-grid solid oxide fuel cell applications. Fuel Process. Technol. 2020, 197, 106215. [Google Scholar] [CrossRef]
  54. Floudas, D.; Binder, M.; Riley, R.; Barry, K.; Blanchette, R.A.; Henrissat, B.; Martínez, A.T.; Otillar, R.; Spatafora, J.W.; Yadav, J.S.; et al. The Paleozoic Origin of Enzymatic Lignin Decomposition Reconstructed from 31 Fungal Genomes. Science 2012, 336, 1715–1719. [Google Scholar] [CrossRef] [PubMed] [Green Version]
  55. Park, G.W.; Gong, G.; Joo, J.C.; Song, J.; Lee, J.; Lee, J.-P.; Kim, H.T.; Ryu, M.H.; Sirohi, R.; Zhuang, X.; et al. Recent progress and challenges in biological degradation and biotechnological valorization of lignin as an emerging source of bioenergy: A state-of-the-art review. Renew. Sustain. Energy Rev. 2022, 157, 112025. [Google Scholar] [CrossRef]
  56. Rouches, E.; Zhou, S.; Steyer, J.; Carrere, H. White-Rot Fungi pretreatment of lignocellulosic biomass for anaerobic digestion: Impact of glucose supplementation. Process. Biochem. 2016, 51, 1784–1792. [Google Scholar] [CrossRef]
  57. Börjesson, P. Biogas as a resource-efficient vehicle fuel. Trends Biotechnol. 2008, 26, 7–13. [Google Scholar] [CrossRef] [PubMed]
  58. Hung, H.; Chen, H.-Y. Renewable coffee waste-derived porous carbons as anode materials for high-performance sustainable microbial fuel cells. ACS Sustain. Chem. Eng. 2019, 7, 16991–16999. [Google Scholar] [CrossRef]
  59. Alrbai, M.; Ahmad, A.D.; Al-Dahidi, S.; Ayadi, O.; Hjouj, D.; Al-Ghussain, L. Optimization of energy production from biogas fuel in a closed landfill using artificial neural networks: A case study of Al Ghabawi Landfill, Jordan. Waste Manag. 2022, 150, 218–226. [Google Scholar] [CrossRef]
  60. Woertz, I.; Feffer, A.; Lundquist, T.; Nelson, Y. Algae Grown on Dairy and Municipal Wastewater for Simultaneous Nutrient Removal and Lipid Production for Biofuel Feedstock. J. Environ. Eng. 2009, 135, 1115–1122. [Google Scholar] [CrossRef] [Green Version]
  61. Jahirul, M.I.; Rasul, M.G.; Chowdhury, A.A.; Ashwath, N. Biofuels Production through Biomass Pyrolysis —A Technological Review. Energies 2012, 5, 4952–5001. [Google Scholar] [CrossRef]
  62. Borges, L.D. Recent developments on heterogeneous catalysts for biodiesel production by oil esterification and transesterification reactions. Renew. Sustain. Energy 2012, 16, 2839–2849. [Google Scholar] [CrossRef]
  63. Ramos, M.; Dias, A.P.S.; Puna, J.F.; Gomes, J.; Bordado, J.C. Biodiesel Production Processes and Sustainable Raw Materials. Energies 2019, 12, 4408. [Google Scholar] [CrossRef] [Green Version]
  64. Mussatto, S.I.; Dragone, G.; Guimarães, P.M.; Silva, J.P.; Carneiro, L.M.; Roberto, I.C.; Vicente, A.; Domingues, L.; Teixeira, J.A. Technological trends, global market, and challenges of bio-ethanol production. Biotechnol. Adv. 2010, 28, 817–830. [Google Scholar] [CrossRef] [PubMed] [Green Version]
  65. Bušić, A.; Marđetko, N.; Kundas, S.; Morzak, G.; Belskaya, H.; Šantek, M.I.; Komes, D.; Novak, S.; Šantek, B. Bioethanol Production from Renewable Raw Materials and its Separation and Purification: A Review. Food Technol. Biotechnol. 2018, 56, 289–311. [Google Scholar] [CrossRef]
  66. He, R.; Men, Y.; Liu, J.; Wang, J.; An, W.; Huang, X.; Song, W.; Liu, J.; Dai, S. Tailoring the Selectivity of Bio-Ethanol Transformation by Tuning the Size of Gold Supported on ZnZr10 Ox Catalysts. Chemcatchem 2018, 10, 3969–3973. [Google Scholar] [CrossRef]
  67. Small, L. Highly active iron and cobalt catalysts for the polymerization of ethylene. J. Am. Chem. Soc. 1988, 120, 4049–4050. [Google Scholar] [CrossRef]
  68. Lu, J.; Zhang, J.; Zhu, Z.; Zhang, Y.; Zhao, Y.; Li, R.; Watson, J.; Li, B.; Liu, Z. Simultaneous production of biocrude oil and recovery of nutrients and metals from human feces via hydrothermal liquefaction. Energy Convers. Manag. 2017, 134, 340–346. [Google Scholar] [CrossRef] [Green Version]
  69. Branduardi, P.; Berterame, N.; Rossi, G.; Porro, D.; Longo, V.; Porro, D. A novel pathway to produce butanol and isobutanol in Saccharomyces cerevisiae. Biotechnol. Biofuels 2013, 6, 68. [Google Scholar] [CrossRef] [Green Version]
  70. Komendantova, N.; Marashdeh, L.; Al-Salaymeh, A.; Al Twassi, S.; AlBeek, R.; Hassouneh, K. On the crossroad—Renewable energy sources or shale oil? Understanding patterns of social attitudes in Jordan. OPEC Energy Rev. 2021, 46, 3–30. [Google Scholar] [CrossRef]
  71. Al-Kurdi, M. Biofuels in Jordan: Perspectives; Echoing Sustainability in MENA: Amman, Jordan, 2021. [Google Scholar]
  72. Ayodele, B.V.; Mustapa, S.I.; Alsaffar, M.A.; Cheng, C.K.; Patinvoh, R.J. Thermochemical Valorization of Oil Palm Biomass to Value-Added Products: A Biorefinery Concept. In Innovations in Thermochemical Technologies for Biofuel Processing; Elsevier: Amsterdam, The Netherlands, 2022; pp. 177–197. [Google Scholar]
  73. Corley, R. Where Do All the Nutrients Go? Planter 2009, 85, 133–174. [Google Scholar]
  74. Khalid, H.; Zakaria, Z.Z.; Anderson, J.M. Nutrient cycling in an oil palm plantation: The effects of residue management practices during replanting on dry matter and nutrient uptake of young palms. J. Oil Palm Res. 2000, 12, 29–37. [Google Scholar]
  75. Kala, D.; Fauziah, C.; Thohirah, L. Composting oil palm wastes and sewage sludge for use in potting media of ornamental plants. Malays. J. Soil Sci. 2009, 13, 77–91. [Google Scholar]
  76. Eom, I.-Y.; Yu, J.-H.; Jung, C.-D.; Hong, K.-S. Efficient ethanol production from dried oil palm trunk treated by hydrothermolysis and subsequent enzymatic hydrolysis. Biotechnol. Biofuels 2015, 8, 83. [Google Scholar] [CrossRef] [PubMed] [Green Version]
  77. Maaita, A.M.; Shdefat, S. The Official Journal of the International Olive Council—International Olive Council. 2022. Available online: https://www.internationaloliveoil.org/ (accessed on 15 November 2022).
  78. Al-Addous, M.; Alnaief, M.; Class, C.; Nsair, A.; Kuchta, K.; Alkasrawi, M. Technical possibilities of biogas production from olive and date waste in Jordan. BioResources 2017, 12, 9383–9395. [Google Scholar] [CrossRef]
  79. Al-Fayez, E. General Syndicate of Contemporaries and Jordanian Olive Producers. 2021. Available online: www.civilsociety-jo.net (accessed on 15 November 2022).
  80. Luc Reuter, B. National Strategy and Action Plan for Sustainable Consumption and Production in Jordan. 2021. Available online: https://www.greengrowthknowledge.org/sites/default/files/downloads/resource/National%20Strategy%20and%20Action%20Plan%20for%20Sustainable%20Consumption%20and%20Production%20in%20Jordan%20%282016-2025%29.pdf (accessed on 16 November 2022).
  81. Raya Taher, S.; Perrin, J.P. The Impacts of Waste Disposal Sites on Communities in Jordan. 2021. Available online: https://oxfamilibrary.openrepository.com/bitstream/handle/10546/621201/rr-not-in-my-backyard-waste-jordan-070721-en.pdf?sequence=1&isAllowed=y (accessed on 16 November 2022).
  82. Zafar, S. EcoMENA Echoing Sustainability in MENA. 2020. Biomass Energy, Middle East, Renewable Energy. Available online: www.ecomena.org (accessed on 17 November 2022).
  83. Suhartini, S.; Nurika, I.; Paul, R.; Melville, L. Estimation of Biogas Production and the Emission Savings from Anaerobic Digestion of Fruit-based Agro-industrial Waste and Agricultural crops residues. BioEnergy Res. 2021, 14, 844–859. [Google Scholar] [CrossRef]
  84. Zabermawi, N.M.; Alsulaimany, F.A.; El-Saadony, M.T.; El-Tarabily, K.A. New eco-friendly trends to produce biofuel and bioenergy from microorganisms: An updated review. Saudi J. Biol. Sci. 2022, in press. [Google Scholar] [CrossRef]
  85. Formentini, D.F.; Marques, C.A.; Fracaro, G.D.P.M.; Constanzi, R.N.; De Souza, S.N.M. Electricity generation from biogas of poultry slaughterhouse biomass in Matelandia Brazil. In Proceedings of the World Renewable Energy Congress, Linköping, Sweden, 8–13 May 2011; pp. 8–13. [Google Scholar]
  86. Saidan, M. Waste Management in Jordan; Jordan Green Building Council. 2016. Available online: https://mena.fes.de/fileadmin/user_upload/pdf (accessed on 6 June 2022).
  87. Laith Al-Junaidi. Arab Countries, Reports, Jordan, Environment and Climate; Anadolu Agency: Amman, Jordan, 2021; Available online: https://www.aa.com.tr/ar (accessed on 18 November 2022).
  88. ALRai. Biogas Production from Rusifa Landfill. Available online: https://alrai.com/article/573789.html (accessed on 19 November 2022).
  89. Zeren, F.G.; Karaca, S.S. Biomass energy consumption and foreign direct investments: Evidence ffrom developed and developing countries. Electron. J. Soc. Sci. 2021, 20, 494–507. [Google Scholar]
  90. Yasmeen, R.; Zhaohui, C.; Shah, W.U.H.; Kamal, M.A.; Khan, A. Exploring the role of biomass energy consumption, ecological footprint through FDI and technological innovation in B&R economies: A simultaneous equation approach. Energy 2022, 244, 122703. [Google Scholar]
  91. Orhan, M.; Dincer, I.; Naterer, G. Cost analysis of a thermochemical Cu–Cl pilot plant for nuclear-based hydrogen production. Int. J. Hydrogen Energy 2008, 33, 6006–6020. [Google Scholar] [CrossRef]
  92. Wang, Y.; Li, G.; Liu, Z.; Cui, P.; Zhu, Z.; Yang, S. Techno-economic analysis of biomass-to-hydrogen process in comparison with coal-to-hydrogen process. Energy 2019, 185, 1063–1075. [Google Scholar] [CrossRef]
  93. Xiang, D.; Liu, X.; Mai, Z. Techno-economic performance of the coal-to-olefins process with CCS. Chem. Eng. J. 2014, 240, 45–54. [Google Scholar] [CrossRef]
  94. Li, G.; Wang, S.; Zhao, J.; Qi, H.; Ma, Z.; Cui, P.; Zhu, Z.; Gao, J.; Wang, Y. Life cycle assessment and techno-economic analysis of biomass-to-hydrogen production with methane tri-reforming. Energy 2020, 199, 117488. [Google Scholar] [CrossRef]
  95. Dewulf, J.; Van Langenhove, H.; Muys, B.; Bruers, S.; Bakshi, B.R.; Grubb, G.F.; Paulus, D.M.; Sciubba, E. Exergy: Its Potential and Limitations in Environmental Science and Technology. Environ. Sci. Technol. 2008, 42, 2221–2232. [Google Scholar] [CrossRef] [PubMed]
  96. Rupesh, S.; Muraleedharan, C.; Arun, P. Energy and exergy analysis of syngas production from different biomasses through air-steam gasification. Front. Energy 2016, 14, 607–619. [Google Scholar] [CrossRef]
  97. Zhang, Y.; Li, B.; Gao, X.; Jiang, B. Energy and exergy characteristics of syngas produced from air gasification of walnut sawdust in an entrained flow reactor. Int. J. Exergy 2017, 23, 244–262. [Google Scholar] [CrossRef]
  98. Cengel, A. Thermodynamics: An Engineering Approach; McGraw-Hill: New York, NY, USA, 2009. [Google Scholar]
  99. Song, G.; Chen, L.; Xiao, J.; Shen, L. Exergy evaluation of biomass steam gasification via interconnected fluidized beds. Int. J. Energy Res. 2013, 37, 1743–1751. [Google Scholar] [CrossRef]
  100. Taha, A.S.; Zaid, I.A.; Alim, A.A.; Fathi, M.E.; Morsi, H. Renewable Energy and Its Role in Achieving Sustainable Development in the Light of International Experiences—A Case Study of “Egypt”; Democratic Arabic Center for Strategic, Political & Economic Studies: Egypt, 2018. [Google Scholar]
Figure 1. Jordan, 1990-2021 TES [22,23].
Energies 16 01393 g001
Figure 2. The 1990-2021 total electricity generation in Jordan [22,27].
Energies 16 01393 g002
Figure 3. Crude oil, oil products, and coal imports from 2016 to 2021 (thousand toe) [29,30,31].
Energies 16 01393 g003
Figure 4. Three types of biomass feedstock, classified based on the energy carrier produced by each type.
Energies 16 01393 g004
Figure 5. Average organic residual content in biogas produced [59].
Energies 16 01393 g005
Figure 6. Composition of a dried oil palm trunk [76].
Energies 16 01393 g006
Figure 7. Characterization of Olive Leaves and Pomace as Potential Substrates for Biogas Formation and Methane Production [78].
Energies 16 01393 g007
Figure 8. Jordan’s current final disposal location [81].
Energies 16 01393 g008
Figure 9. Biogas production parameters (temperature and digestion time) [84].
Energies 16 01393 g009
Table 1. Jordan’s share of each type of biomass feedstock [34].
Biomass FeedstockAmount of Production (%)
Animal Manure96.5
Olive Oil Pomace1.8
Slaughterhouse Waste0.1
Blood0.5
Sludge1.1
Disclaimer/Publisher’s Note: The statements, opinions and data contained in all publications are solely those of the individual author(s) and contributor(s) and not of MDPI and/or the editor(s). MDPI and/or the editor(s) disclaim responsibility for any injury to people or property resulting from any ideas, methods, instructions or products referred to in the content.

