Article

Impact of Electric Vehicle on Residential Power Distribution Considering Energy Management Strategy and Stochastic Monte Carlo Algorithm

by
Abdulgader Alsharif
1,2,*,
Chee Wei Tan
1,*,
Razman Ayop
1,
Ahmed Al Smin
3,
Abdussalam Ali Ahmed
4,
Farag Hamed Kuwil
5,6 and
Mohamed Mohamed Khaleel
7
1
Division of Electric Power Engineering, School of Electrical Engineering, Faculty of Engineering, Universiti Teknologi Malaysia (UTM), Skudai 81310, Johor, Malaysia
2
Communication Engineering Department, Technical College of Civil Aviation and Meteorology, Espiaa G5QC+R3R, Libya
3
Higher Institute of Science and Technology Suk Algumaa, Tripoli, Libya
4
Mechanical Engineering Department, Bani Waleed University, Bani Waleed, Libya
5
Department of Computer Engineering, Tripoli University, Tripoli, Libya
6
Department of Computer Engineering, Karabuk University, Karabuk 78050, Turkey
7
Aeronautical Engineering Department, College of Civil Aviation, Misurata 934M+2PP, Libya
*
Authors to whom correspondence should be addressed.
Energies 2023, 16(3), 1358; https://doi.org/10.3390/en16031358
Submission received: 26 December 2022 / Revised: 18 January 2023 / Accepted: 22 January 2023 / Published: 27 January 2023
(This article belongs to the Special Issue Energy for Sustainable Development and Circular Economy)

Abstract

:
The area of a Microgrid (μG) is a very fast-growing and promising system for overcoming power barriers. This paper examines the impacts of a microgrid system considering Electric Vehicle Grid Integration (EVGI) based on stochastic metaheuristic methods. One of the biggest challenges to slowing down global climate change is the transition to sustainable mobility. Renewable Energy Sources (RESs) integrated with Evs are considered a solution for the power and environmental issues needed to achieve Sustainable Development Goal Seven (SDG7) and Climate Action Goal 13 (CAG13). The aforementioned goals can be achieved by coupling Evs with the utility grid and other RESs using Vehicle-to-Grid (V2G) technology to form a hybrid system. Overloading is a challenge due to the unknown number of loads (unknown number of Evs). Thus, this study helps to establish the system impact of the uncertainties (arrival and departure Evs) by proposing Stochastic Monte Carlo Method (SMCM) to be addressed. The main objective of this research is to size the system configurations using a metaheuristic algorithm and analyze the impact of an uncertain number of Evs on the distribution of residential power in Tripoli-Libya to gain a cost-effective, reliable, and renewable system. The Improved Antlion Optimization (IALO) algorithm is an optimization technique used for determining the optimal number of configurations of the hybrid system considering multiple sources, while the Rule-Based Energy Management Strategy (RB-EMS) controlling algorithm is used to control the flow of power in the electric power system. The sensitivity analysis of the effect parameters has been taken into account to assess the expected impact in the future. The results obtained from the sizing, controlling, and sensitivity analyses are discussed.

1. Introduction

Electrification is considered to improve human lifestyles. Due to the cumulative increases in fossil fuels, most of the results of Research and Development (R&D) studies are considering Renewable Energy Sources (RESs) integration with Electric Vehicles (Evs) [1]. The foregoing integration is utilized to overcome power and environmental limitations [2]. EV is considered an essential e-mobility to reduce Greenhouse Gas (GHG) emissions through the high penetration of RESs [3], where Evs could provide an ancillary service that can be classified into power and energy services [4]. In ref. [5], several ancillary services and optimization methods, along with the EV charging infrastructure, are comprehensively discussed. Various nations including the USA, Japan, Kenya, Algeria, Nigeria, Turkey, Ethiopia, Germany, Spain, Canada, India, Indonesia, China, Malaysia, Brazil, Denmark, Netherlands, Morocco, and the UK are adopting Evs [6]. All the aforementioned countries are exploiting Evs, however, the EV broader market comes from Germany, the UK, China, and the USA (Austin, TX, USA). In spite of the price of Evs is still high due to the high cost of batteries and other EV’ components in comparison with Internal Combustion Engine Vehicles (ICEVs), drivers are still buying Evs [7]. Additionally, the lifetime of the battery and charging infrastructure are remaining a limitation of Evs battery [8]. Microgrids (MG) are considered as connecting multi-sources in either form (grid-connected or grid-isolated) systems with Vehicle-to-Grid (V2G) technology that is also known as Vehicle-Grid-Integration (VGI) [9]. Whereas there is no standard definition for MG among researchers, however, all agree as an interconnection of loads and distribution resources. Furthermore, there is a definition from the USA Department Of Energy (DOE) which is “a group of interconnected loads and distributed energy resources within clearly defined electrical boundaries that acts as a single controllable entity with respect to the grid, which can connect and disconnect from the grid to enable it to operate in both grid-connected or isolated-mode” [10].
Globally, in most developed nations, RESs are integrated with Evs to form V2G as a cutting-edge technology [11]. The co-connected RESs with the charge station help to alleviate congestion on the electric network [9]. Evs have dual functions as load and energy storage, however, it makes an impact on the grid either positive or negative due to the unknown load (uncertain) [12]. The positive impacts that are feasible on the environment, grid, and customers can be estimated using the Stochastic Monte Carlo Method (SMCM), one of the methods that deals with uncertainties [13], while the negative impact can be on load profiles, voltage, and frequency imbalances, which can be addressed by a very well-planned system. The SMCM, also known as the multiple probability simulation and named after a famous gambling city (Monaco), involves large numbers of computer simulations with randomly selected input [14]. It is a stochastic method used when the input data has a random variable, such as charging and discharging different Evs, for long-term or complex data [15]. The reason for utilizing stochastic methods is due to the goal of gaining information out of randomness. Furthermore, due to the popularity of the results provided by stochastic methods in power system analysis. The revolution in the transportation sector is rising among researchers by using different types of energy sources to meet a clean and protected environment [16]. Moving toward sustainable mobility is one of the most significant obstacles to reducing global warming and allows achieving climate change plans, such as Sustainable Development Goal Seven (SDG7) and Climate Action Goal 13 (CAG13) [17]. An EV is used to emulate the pollution and energy crisis [18]. As a result of current discussions among scholars to solve environmental challenges (melting polar ice, increasing sea levels, and GHG emissions), Evs are involved. Furthermore, with the depletion of non-renewable energy sources, they have been looking for alternatives to improve living standards. Due to the aforementioned statement, the oil price has increased globally.
According to the No Free Lunch (NFL) theory, the optimization tools considered in this study are not adequate for handling sizing problems and other concerns [19]. In terms of sizing optimization, algorithms can be classified into metaheuristics and heuristics, as they are used to find the best configuration of the hybrid system [20]; metaheuristic and heuristic terminologies can be used interchangeably [21]. Furthermore, metaheuristics is a fascinating field of study that has made significant advances in the solving of intractable optimization problems [22]. Several metaheuristic algorithms have been reported in the literature to address optimization problems, along with numerous techniques [23]. The Ant Lion Optimization (ALO) Algorithm [24], the Cuckoo Search Algorithm (CSA) [25], and Particle Swarm Optimization (PSO) [26] are considered benchmarks. The Improved Antlion Optimization (IALO) as ALO variants has been used in the literature several times with its variants [27]. Energy Management Strategies are classified into three classifications: Optimization-Based (OB), Rule-Based (RB), and Learning-Based (LB) in order to control and guarantee the smooth spreading of power among the system components [28].
The major contribution of the article is sizing the hybrid system components using IALO and controlling the flow of power in the system using RB-EMS. Furthermore, establishing the impact of Evs on the grid using SMCM while considering power level 2 on various energy sources in the residential area, due to the lower price compared with commercial charging, is significant. A sensitivity analysis of the key affected sources is also considered. The rest of the article is structured as follows: the introduction is replaced in Section 1, the proposed system and description of input modeling data are positioned in Section 2, the EMS is presented in Section 3, and Section 4 is denoted for the SMCM tool to deal with the uncertain number of Evs integrated into the system. The optimization method and the objective function along with the constraints presented in Section 5. Section 6 presents the results and discussions of sizing components and SMCM, followed by the sensitivity analysis that measures the effect of increasing or decreasing the EV. Finally, the article’s summary conclusion is drawn, followed by an acknowledgment and a list of references.

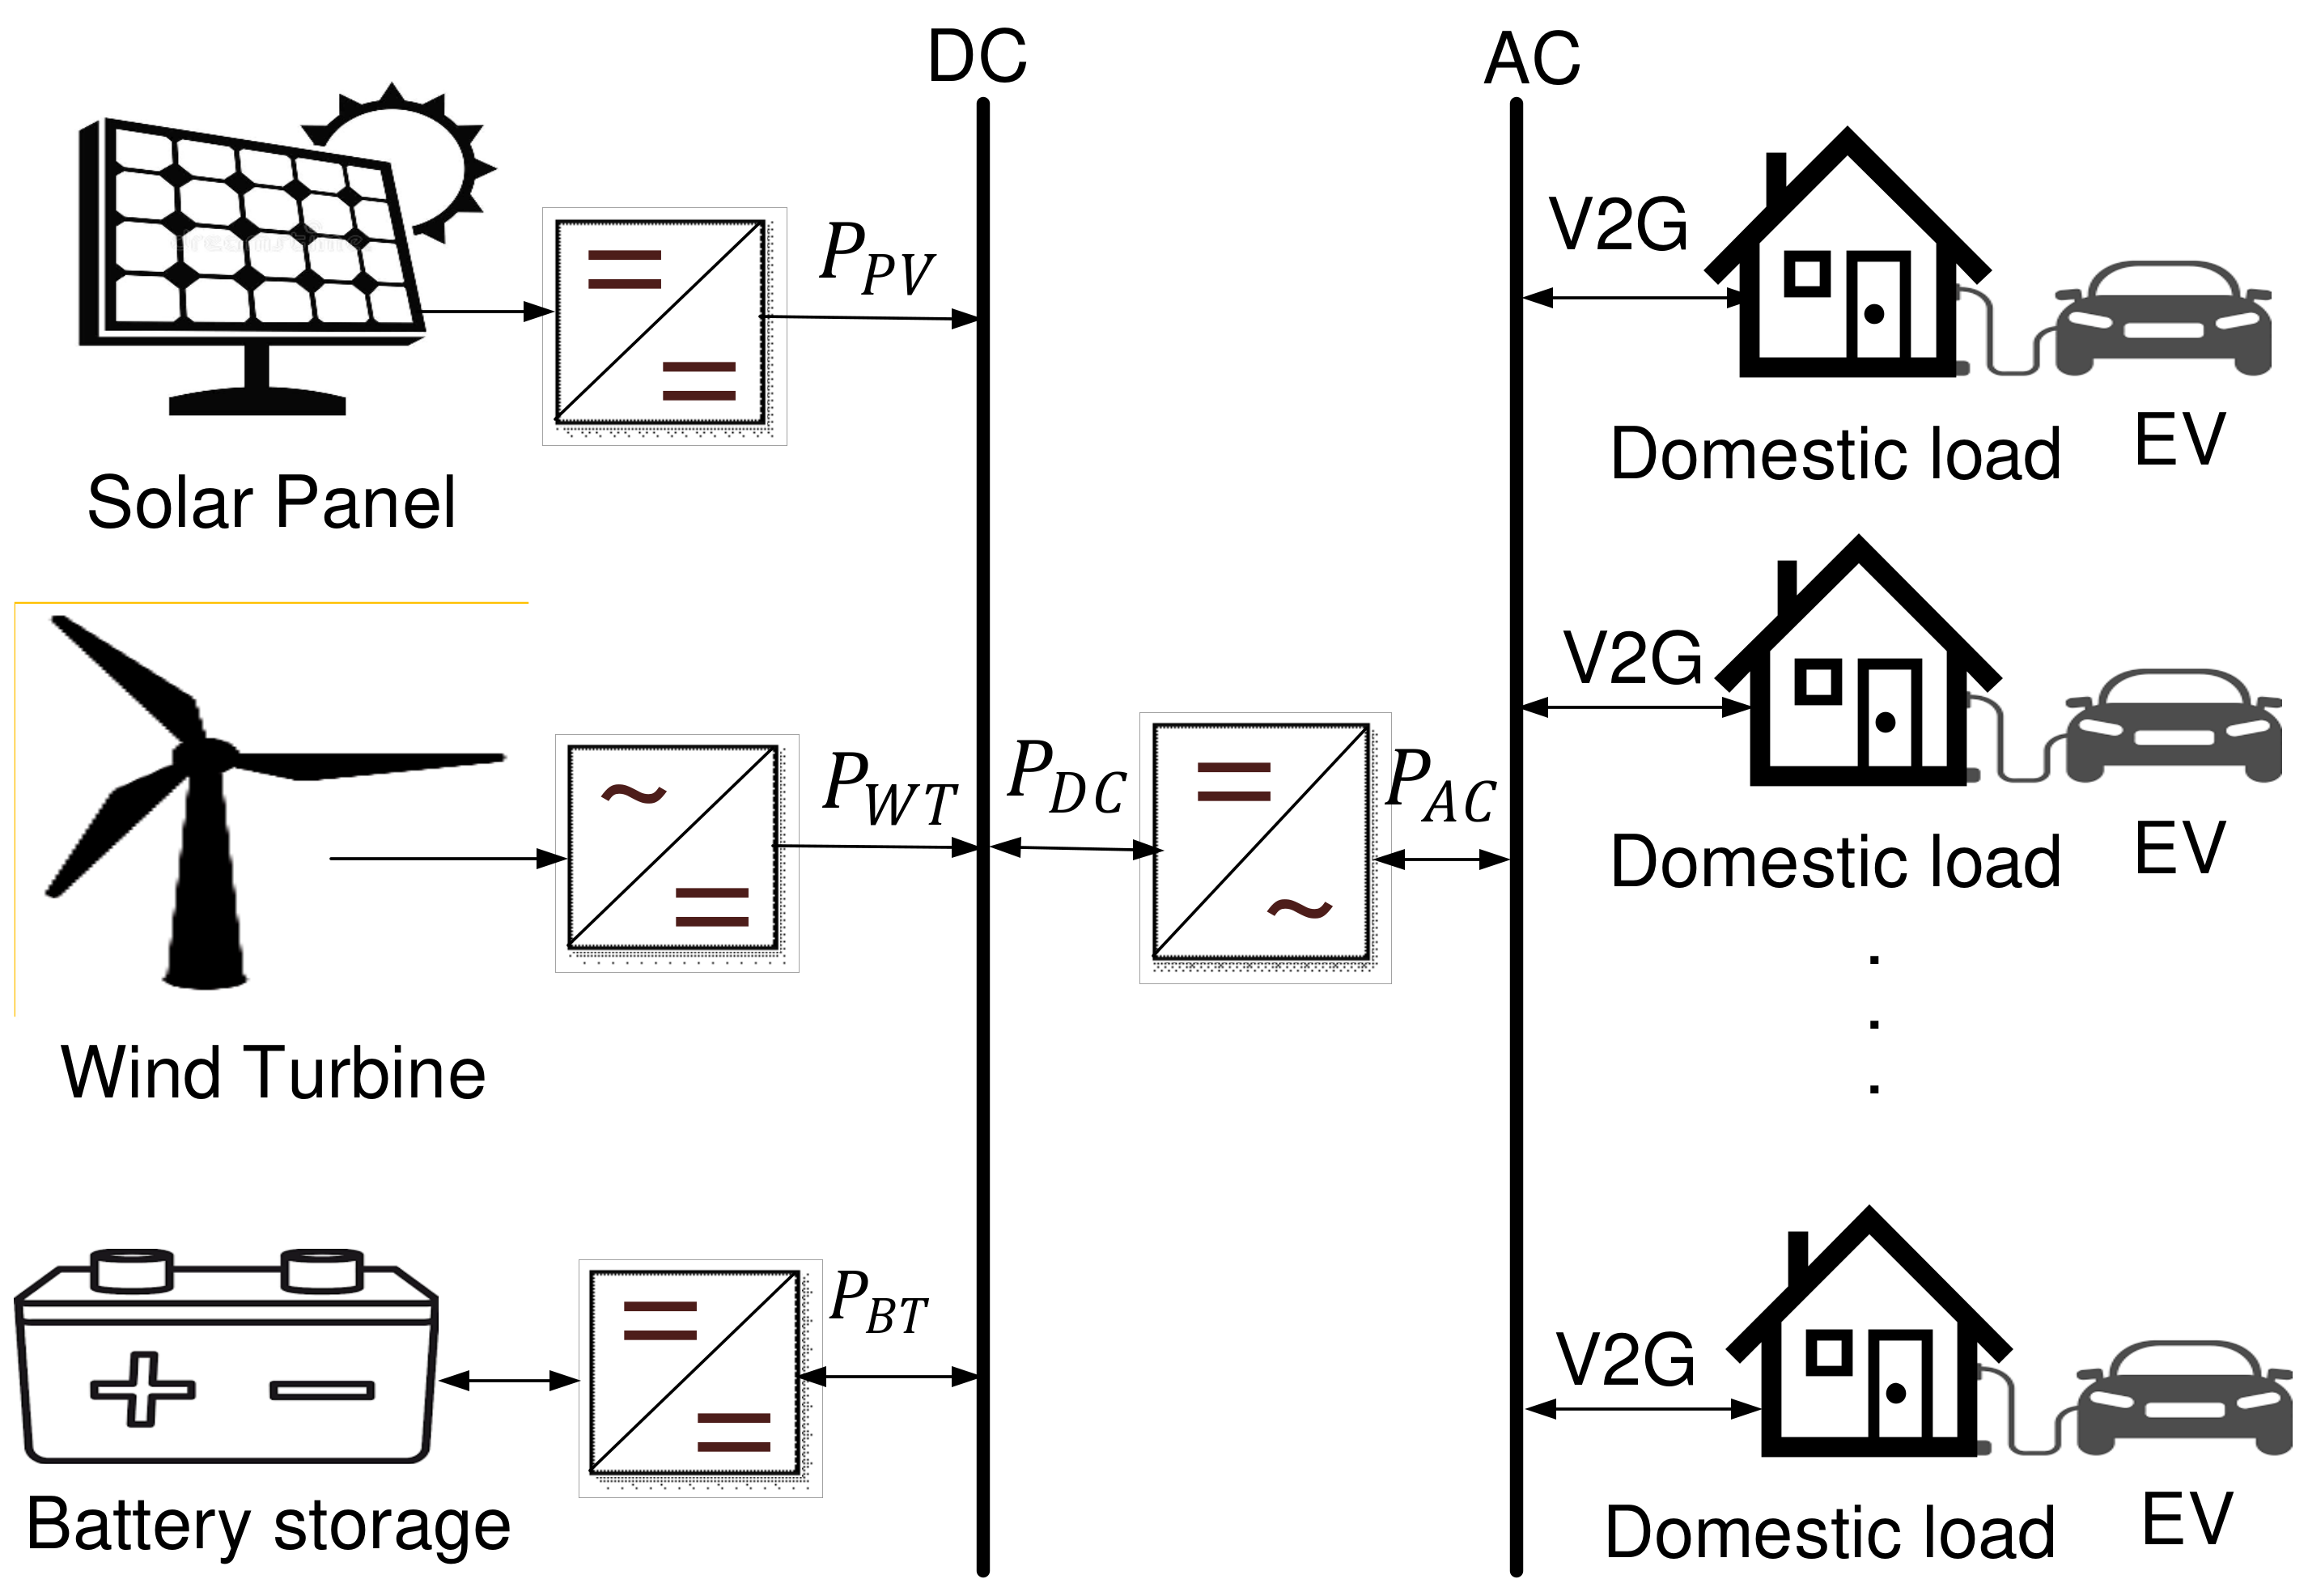
2. The Proposed System and Input Modeling Data

The case study is the capital city of Libya (Tripoli) that’s located in North Africa with 3 million inhabitants and four seasons [29]. The aforementioned city is conducting ICEVs as a mobility system, which causes environmental barriers [30]. Due to the increasing price of fuel and continuous electricity interruptions, Evs are the alternative solution by integrating with RESs and climatology data. The climatology data was obtained from the Global Solar Atlas (GSA) and evaluated using MATLAB, as shown in the next subsection. The utilized climatology data are solar irradiance ( G ), wind speed ( v ), ambient temperature ( T a m b ), and load demand ( P L ) of domestic loads in order to estimate the output power from various sources. While the load demand data is acquired from the General Electric Company of Libya (GECOL) as the only supplying electricity company [31]. Data analysis is needed for a better understanding of consumer load and the requirements of the available RESs. The climatology conditions in the seasons (winter, spring, summer, and autumn) are differing from site to site in the country. Where winter is referring to the cold season without snowing in the case study and the temperature rich up to 7 °C. While the second season of the year is spring, which indicates the warmest season at 25 °C. Summer is the third season, which refers to the hot season with temperatures of almost 45 °C. Lastly, autumn is the introduction to winter, with a temperature range of up to 20 °C. The architecture of the proposed hybrid system considering EV and Energy Storage Battery System (ESBS) with Photovoltaic (PV), Wind Turbine (WT) integrated into the utility grid is demonstrated in Figure 1.

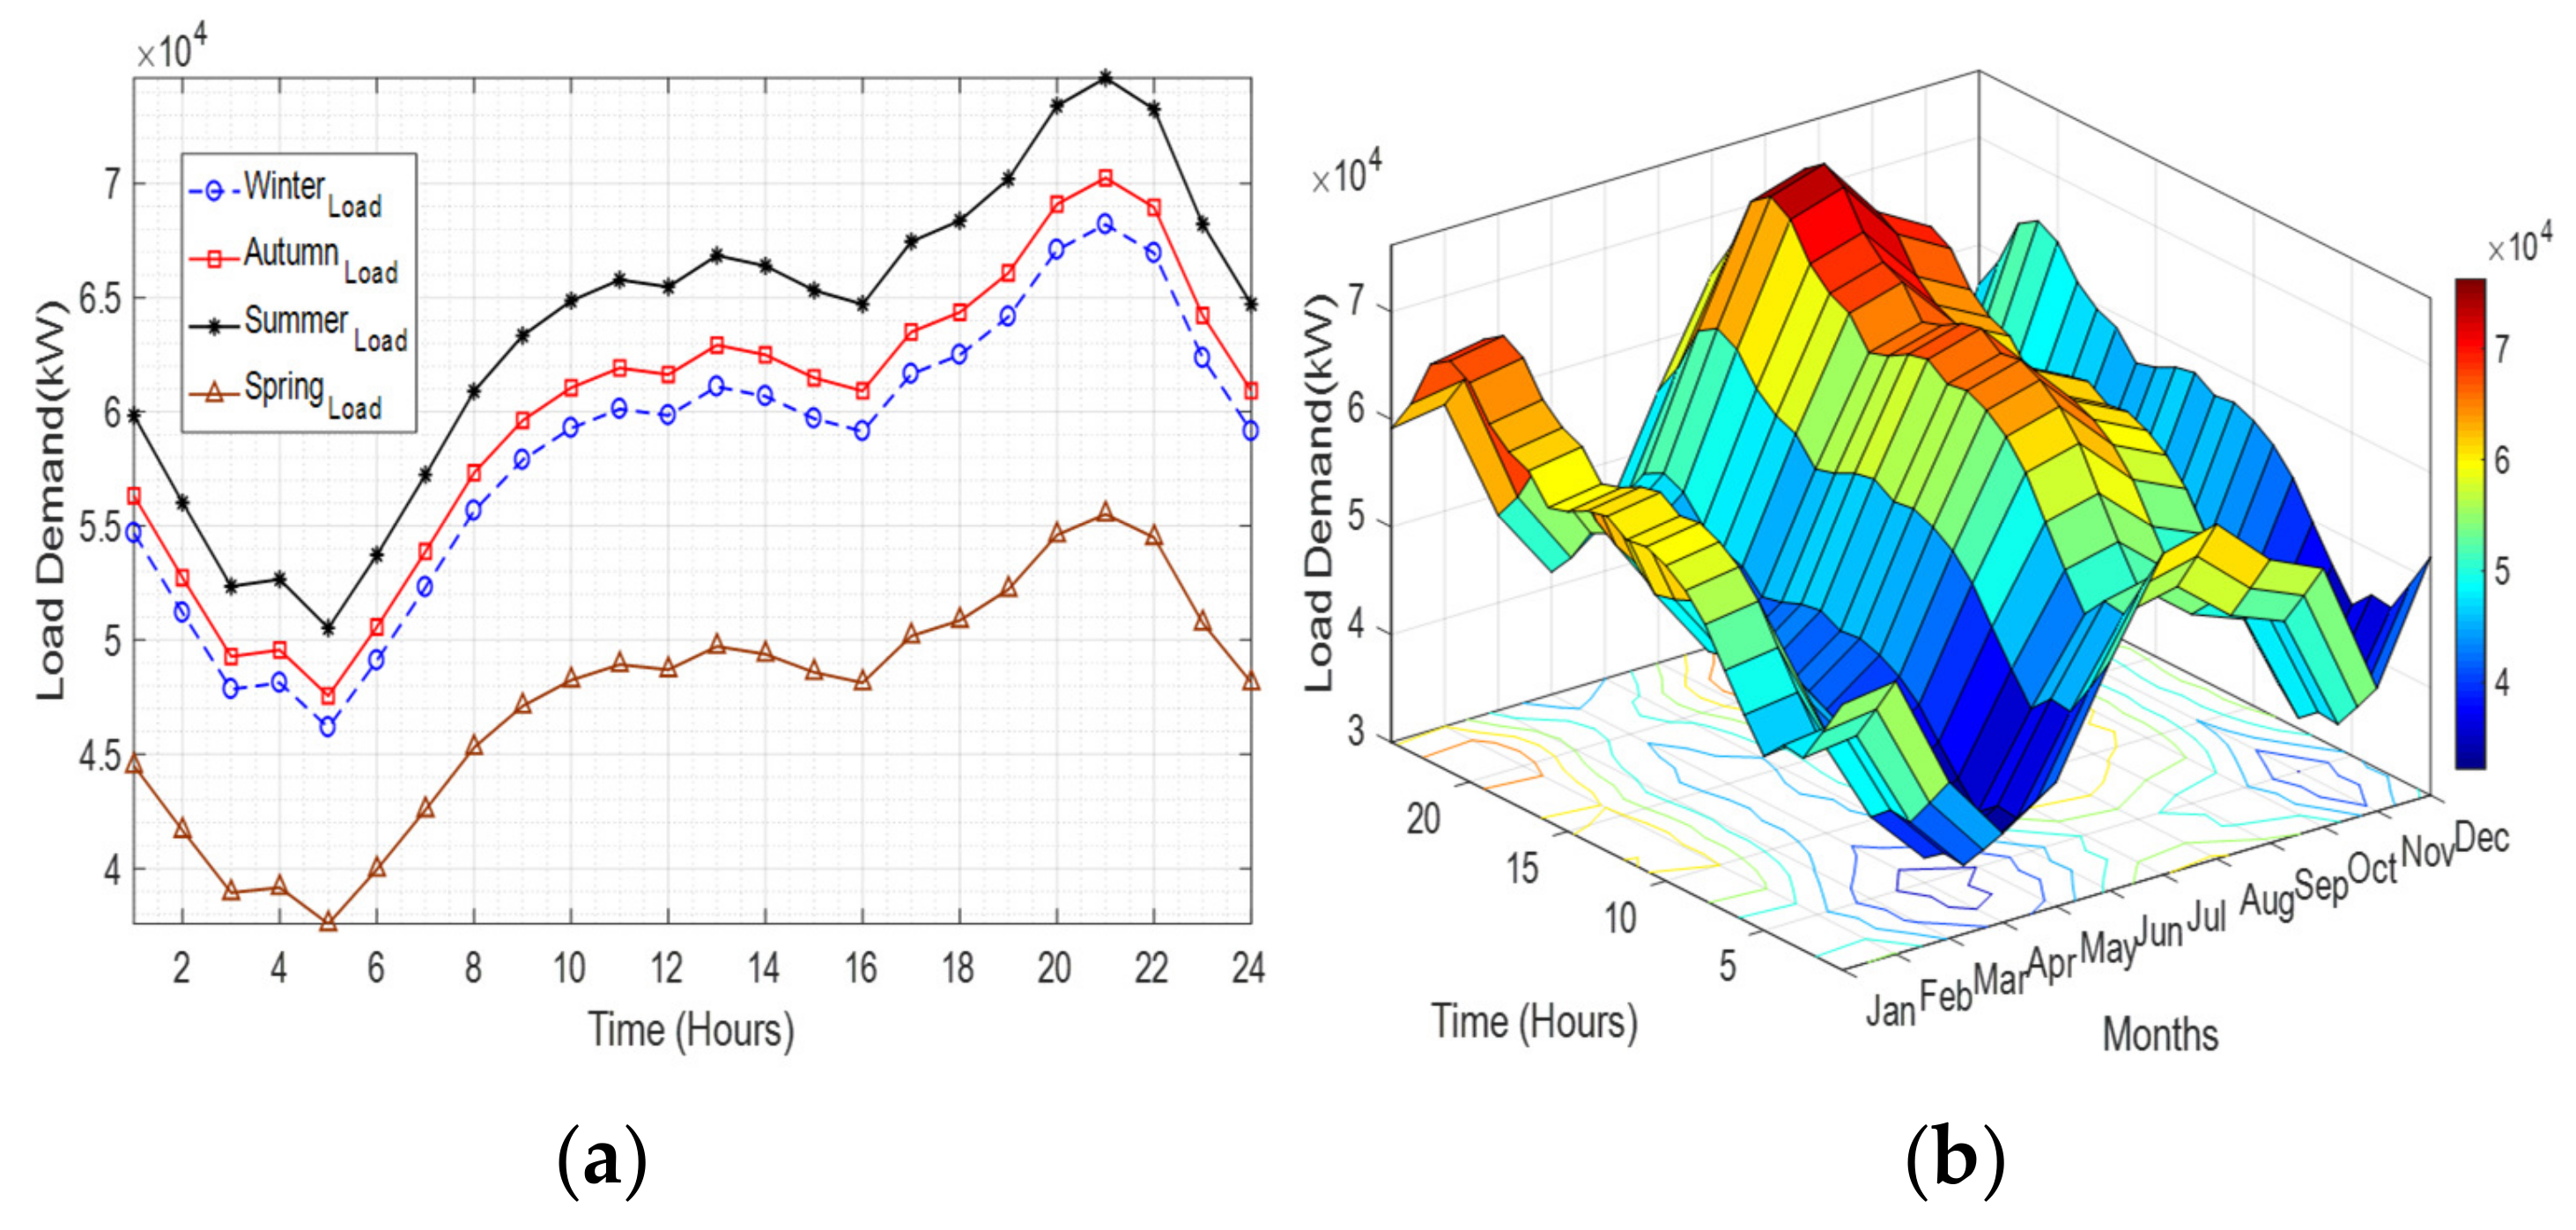
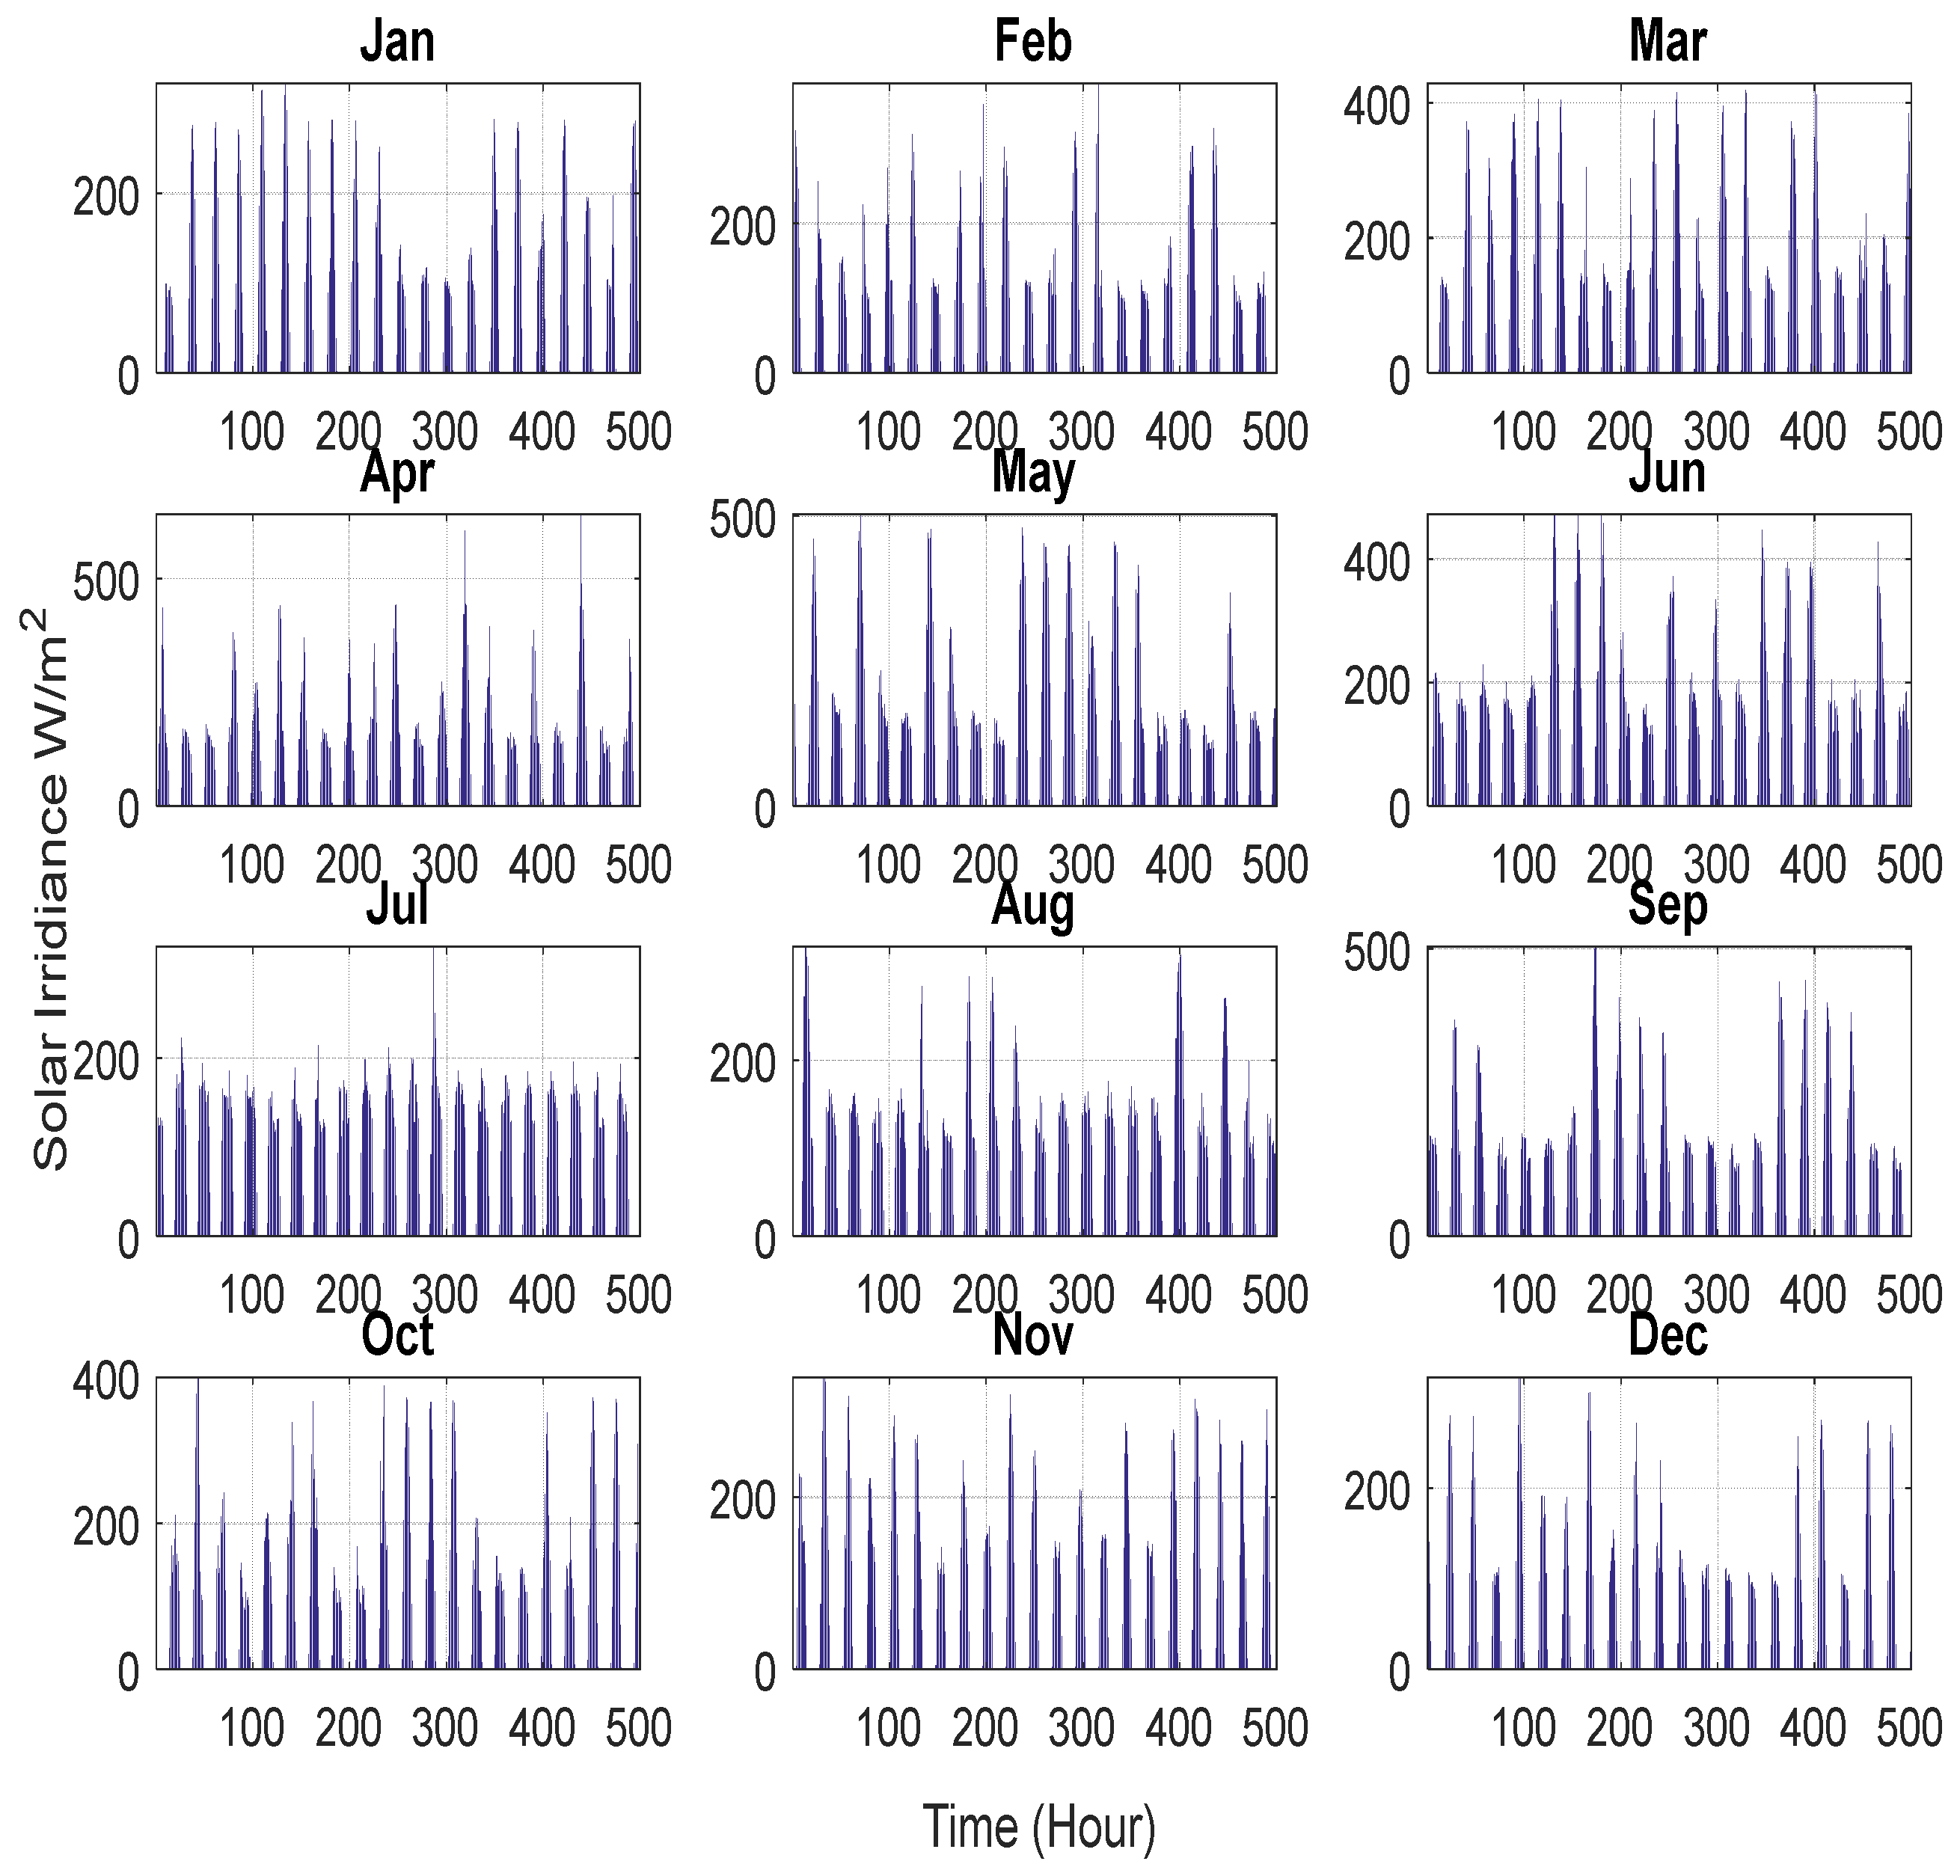
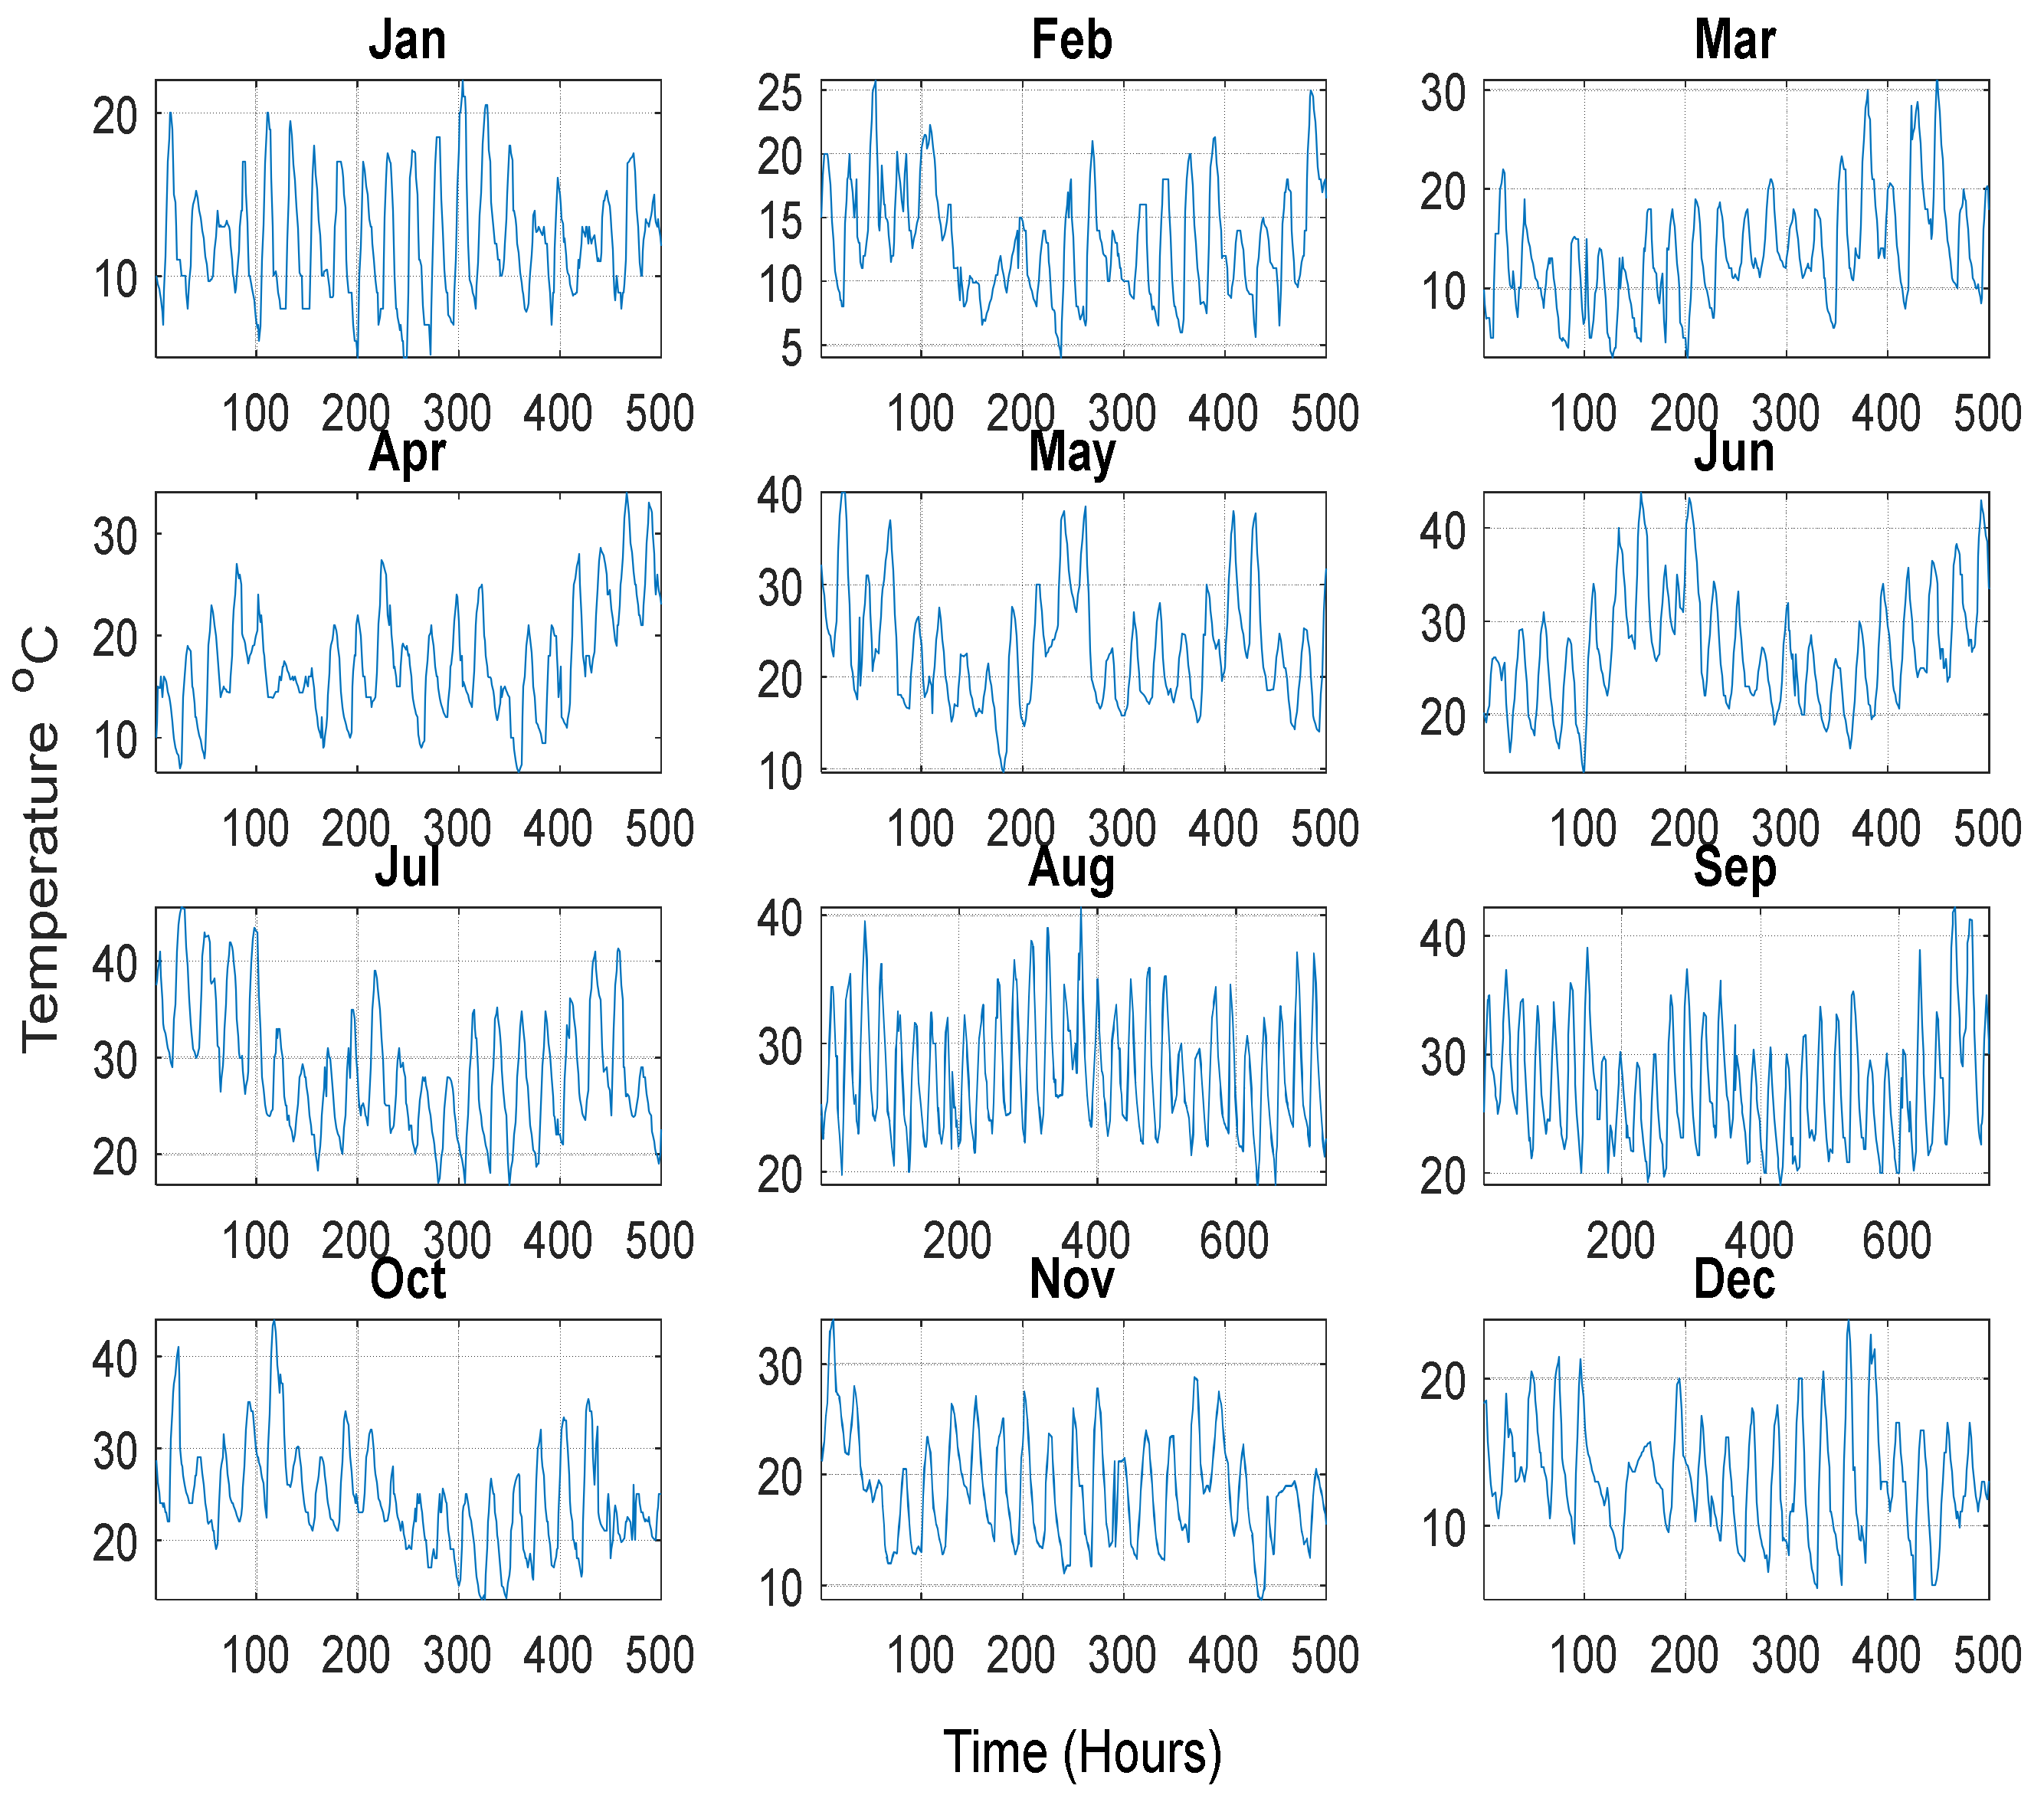
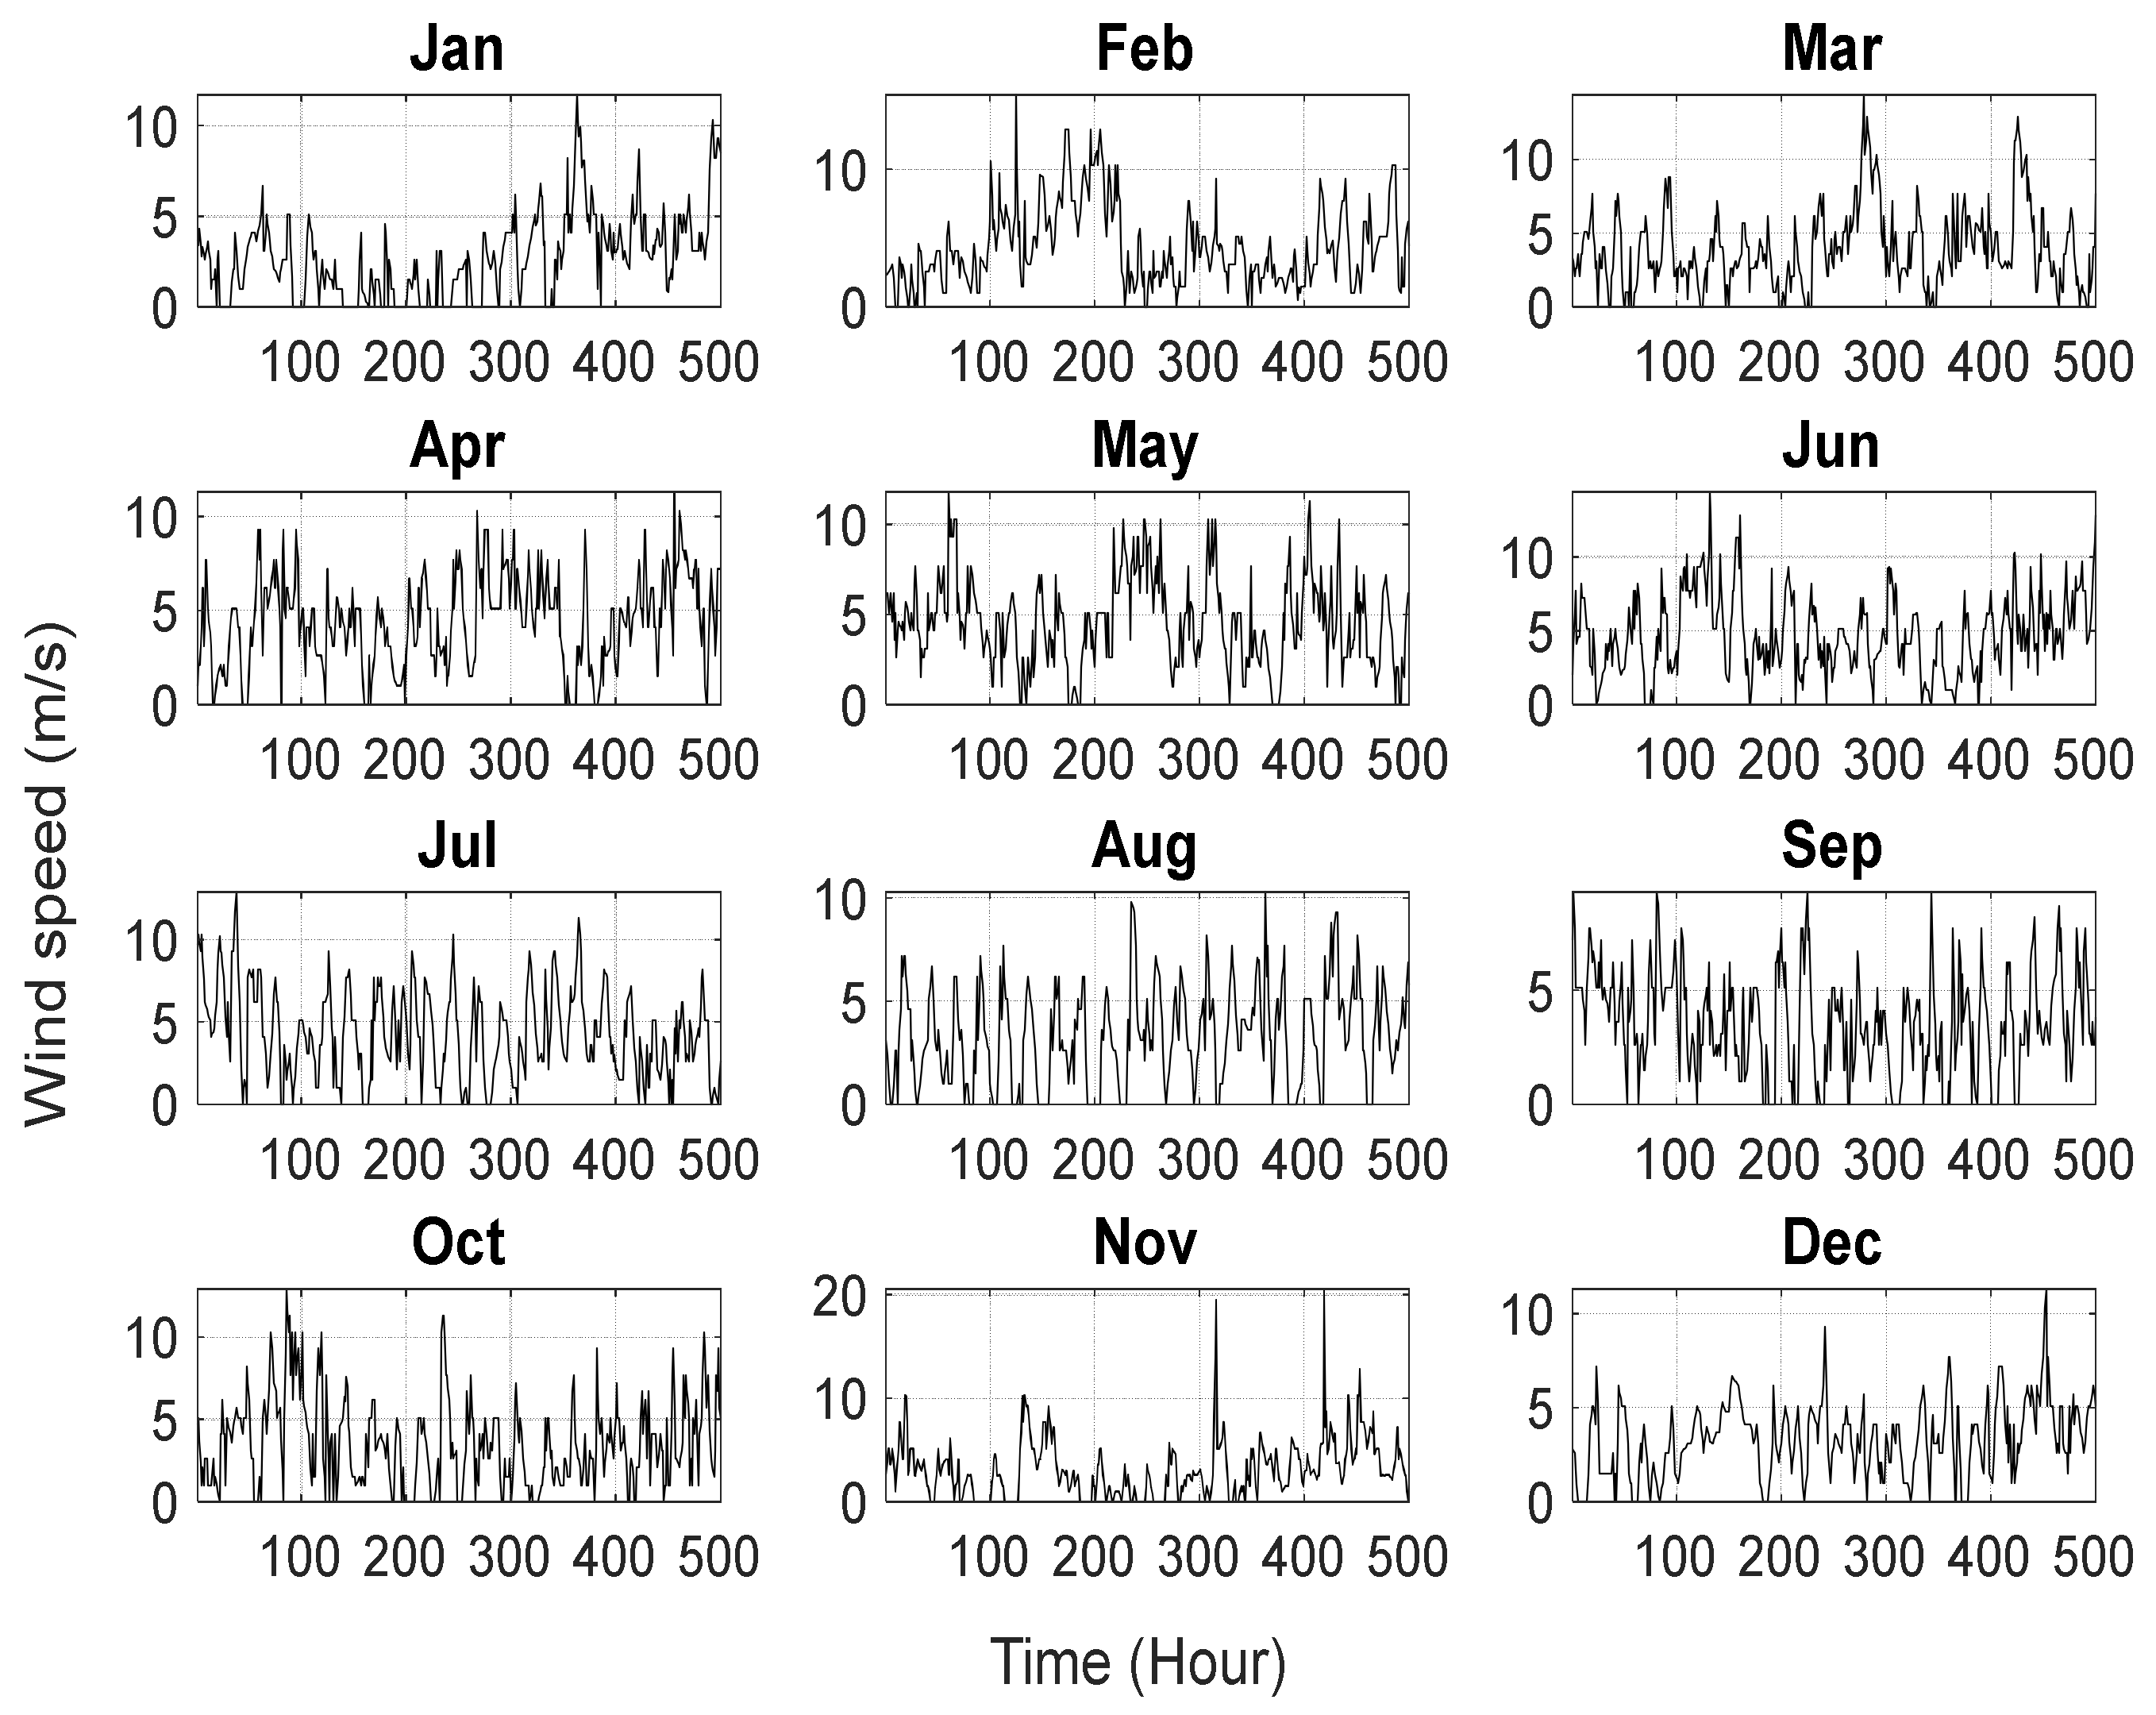
2.1. Climatology Input Data

The daily seasonal and contour plots of the annual load profile in (kW) of the study area are considered according to the seasonal variations shown in Figure 2. The considered seasons are spring (March-April-May), summer (June-July-August), autumn (September-October-November), and winter (December-January-February). The load demand data is exploited in the mathematical equations to estimate the output power from other integrated sources.
The amount of solar-radiated energy incident on the surface per unit area and per unit time is called irradiance, and the case study is rich in terms of solar irradiance over the years, as shown in Figure 3. The average duration of sunlight in Libya is more than 3000 h per year, according to a report by the Libyan Renewable Energy Authority (LREA) [32]. The solar panel considered to obtain the output power in this study is a PV module (STP275S-20/Wem), as per the specification tabulated in Table 1 [33], where the output power obtained from the PV can be calculated by Equation (1).
P P V ( t ) = P ( P V r a t e d ) × G ( t ) 1000 × [ 1 + α t ( T a m b + ( G ( t ) × ( NOCT 20   800 ) T C STC ) ]
where the P P V ( t ) refers to the obtained output power from the PV (Watt) at a time (t), P ( P V r a t e d ) is the PV-rated power in (Watt), G ( t ) represents the solar irradiance through the year (W/m2), 1000 (W/m2) is the rated radiation at the earth’s surface, the irradiance on the cell surface (800 W/m2), α t is the temperature coefficient, which equals (−3.7 × 10 3 ) ,   T a m b refers to the ambient temperature (°C), T C S T C is the cell temparuture at Standard Test Condition (STC) [39]. Additionally, 20 refers to the air temperature in (°C) while the considered value of Nominal Operation Cell Temperature (NOCT) is 45 (°C) in this study (depending on the PV module specified by the manufacturer).
The monthly data set of ambient temperature collected from GSA is demonstrated in Figure 4. It uses to measure the yielded power from the PV along with the solar irradiance as exploited in Equation (1) [40].
The second RESs used in this study is wind energy, where the kinetic energy of the wind is used to obtain the output power from the WT through (Eocycle EO20). The description details of the aforementioned WT are presented in Table 1. The monthly wind speed data collected for the study area is demonstrated in Figure 5, where the output power obtained from the WT can be calculated by Equation (2).
P W T   ( t ) = { 0 P r v ( t ) v c u t i n v r v c u t o u t P r       v ( t )   v c u t i n   o r   v v c u t o u t v c u t i n < v < v r v r < v ( t ) < v c u t o u t
where the P W T   ( t ) denoted as the output power from the WT in (Watt), P r represents the WT-rated power in (kW), v r is the nominal wind speed in (m/s) v c u t o u t is the cut out (m/s), v c u t i n defined as the cut in speed that measures in (m/s) [39].

2.2. Energy Storage Battery

It is a chemical device that transfers chemical energy to electric power and vice versa. The two batteries considered in this study are Lithium-Ion (Li-Ion) and Lithium-ion Phosphate (LiFePO4) with their datasheets reported in ref. [41], where Li-Ion is considered an EV battery while the considered deep-cycle battery is LiFePO4. It is the responsible device for steadying the power balance and absorbing transients within the range of the maximum and minimum State of Charge (SoC) of the battery [42]. It depends on the charge and discharge cycle number of the battery, which computes the lifespan of energy storage. The battery is considered necessary in the system to deal with the intermittent nature of Renewable Sources (RS). Additionally, the EV battery specification is considered to obtain the SoC, charging decision, and energy demand, as shown in Table 1. The charge and discharge amounts of the battery (SoC) can be calculated by Equations (3) and (4), respectively.
SoC ( t ) = SoC ( t 1 ) . ( 1 σ ) + ( ( P P V ( t ) + P W T ( t ) ) P L ( t ) + P EV D e m η i n v ) × η b
SoC ( t ) = SoC ( t 1 ) . ( 1 σ ) + ( P L ( t ) + P EV D e m η i n v ( P P V ( t ) + P W T ( t ) ) ) × η b
The SoC   ( t ) refers to the state of charge of the battery at a time (t), P L denoted as the average load demand, η b is the efficiency of the battery which equals 95%. The P P V and P W T are representing the generated output power from the RESs in kW. The σ is the self-discharge rate of the battery which equals 0.007%/hour [41]. The link between EVs and the grid is the battery that forms V2G technology, which is the core factor of the EVs in terms of energy density in comparison with ICEV batteries [43]. The development of EVs driven by clean energy is the key to solving power and climate challenges.

2.3. Converter

When a system has both AC and DC components, power converters such as DC/AC and AC/DC are necessary; the description of the converter is placed in Table 1. The considered loads in this study are residential (AC), solar PV panels (DC), and batteries that produce DC output. The converter size is determined by combining peak load demand ( P l m ) at a time (t) with inverter efficiency ( η i n v ), while the inverter rating ( P i n v ( t ) ) is determined using Equation (5) [44].
P i n v ( t ) = P l m ( t ) η i n v

2.4. Residential Charge Facility

Certainly, the utilized future transportation is EVs for large fleet vehicles or light-duty vehicles that need to be charged in charging stations in order to move. The conceptual meaning and utilization of a charging station is to deliver and receive electricity from the grid to the EV in a bidirectional way in various forms of charging stations (commercial or residential). The considered type of charging in this study is a residential charger not a commercial due to the differences in tariff, time of charging, and no services fees needed. The utilized power level for charging the vehicles is level 2 with 208–240 VAC, along with the power demand of the EV that can be calculated by Equation (6) [17].
P EV D e m = C bat EV × ( SoC max EV SoC min EV ) T
where the P EV D e m represents the amount of the power demand of EVs in Electric Vehicle Charging Facilities (EVCF) that refers to the home charger, C bat EV is the EV battery capacity in (kWh), SOC max EV and SOC min EV (0.2% and 0.95%) are the maximum and minimum ( SoC min EV SoC EV SoC max EV ). The state-of-charge of EV batteries ranges from [0, 1] using the normal distribution (N), where T refers to the difference between the arrival time and the departure time ( T = T i m e a r r i v e EV T i m e D e p a r t u r e EV ) of EVs (charging time duration). Furthermore, the departure should be greater than the arrival time ( T i m e D e p a r t u r e EV > T i m e a r r i v e EV ) that can be determined by the SoC EV [45].

2.5. Utility Grid

The utility grid is a general supplier using fossil fuels (oil, gas, or coal) for running electric appliances; at the same time, it may cause some interruptions or environmental problems, and BT and RESs can be utilized [45]. While there is an absence of RESs energy and the battery is not charged or sufficient to meet the demand, the grid can supply the system. The system can be supplied from the main grid, which has different prices for buying and selling [34]. The control parameters (design variables) that are set before running the optimization algorithm are tabulated in Table 1 [46,47].
R g r i d = t = 1 8760 r a t e f e e d i n × E g r i d ( s e l l i n g )
C g r i d = C p × t = 1 8760 E g r i d ( p u r c h a s e d )
In Equation (7) the R g r i d represents the revenue of selling energy from the utility grid for 8760 h, r a t e f e e d i n is the rated tariff of the study area [48], E g r i d ( s e l l i n g ) indicates as the sell energy that can be obtained by Equation (9), while in Equation (8) presented the C p which refers to the cost of purchasing 1kW of energy from the grid. The total amount of purchased energy from the grid can be acquired by Equation (10).
P S grid   ( t ) = [ P PV     ( t ) + P WT ( t ) + [ ( SoC BT   ( t ) SoC BT m a x ( t ) ) × η inv   ] ] P EV D e m
P P grid   ( t ) = P EV D e m ( t ) [ P PV     ( t ) + P WT ( t )   + [ ( SoC BT   ( t ) SoC BT m i n ( t ) ) × η inv   ] ]
Continuously, Equation (9) represents the amount of sold energy ( P S grid   ) considering the EV and BT in time (t), while the purchased energy ( P P grid   ) considering the aforementioned components calculated by Equation (10).

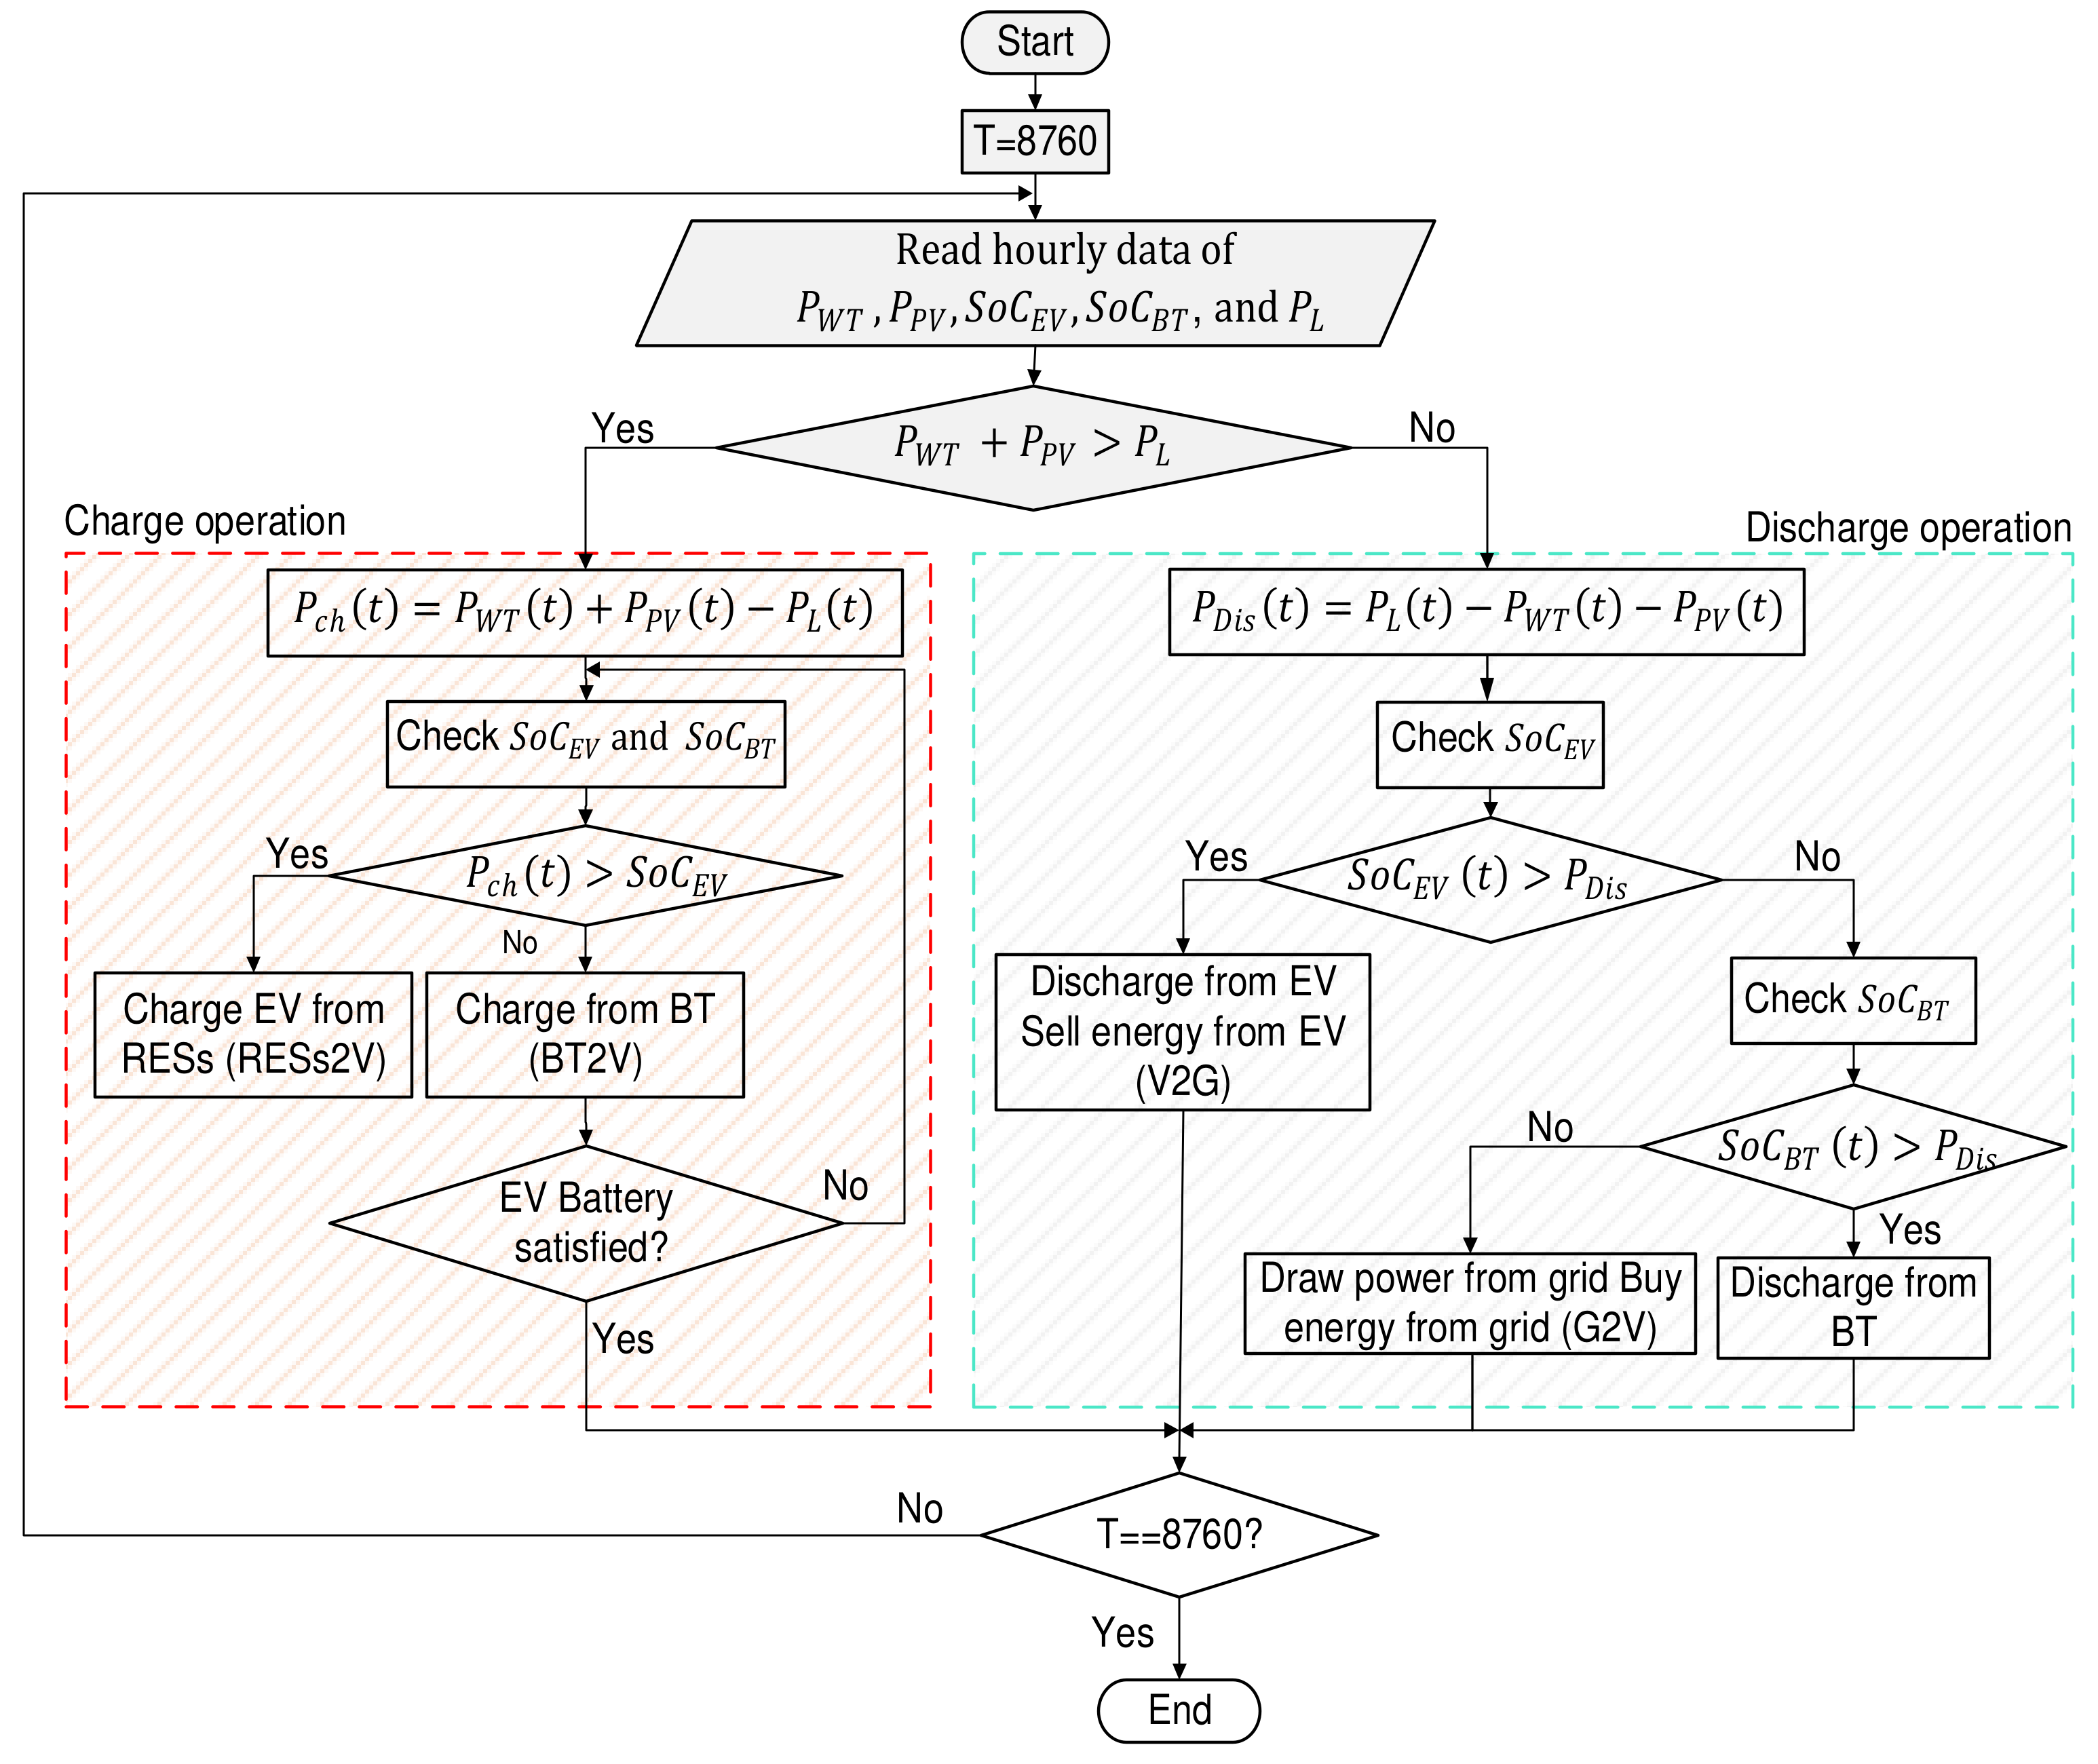
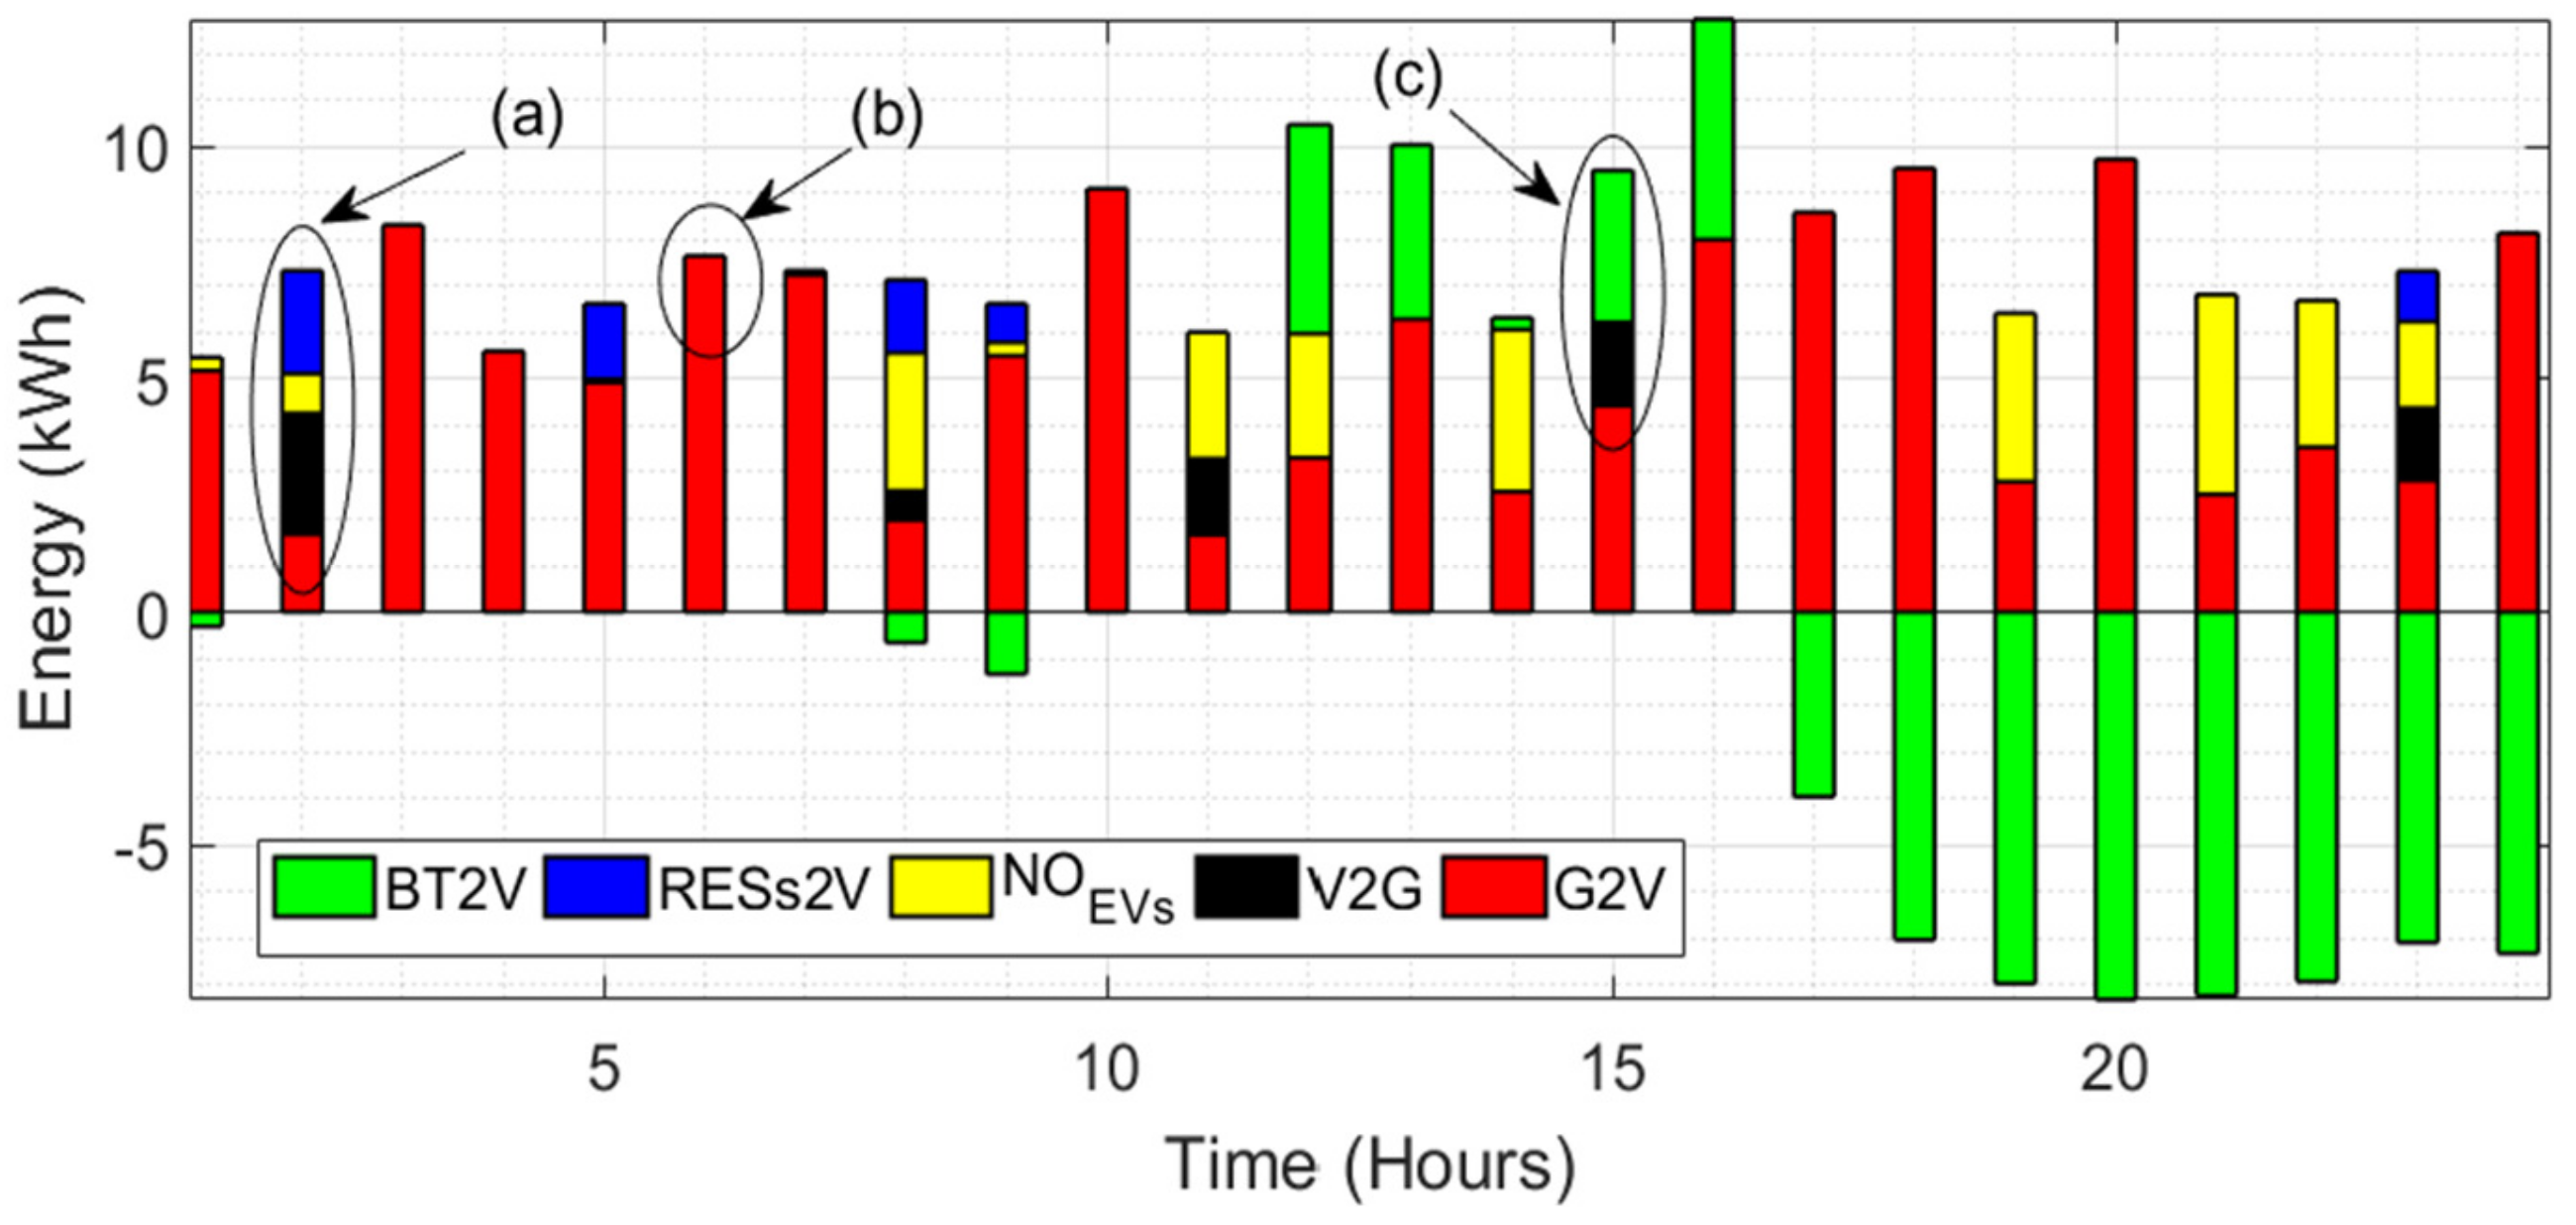
3. Energy Management Strategy

As a result of human-based knowledge, algorithms called Energy Management Strategy (EMS) rely on a system depending on if-then statements and nature-inspired metaheuristic algorithms in combination [49]. EMS is a term for information management integrated into such a system; it offers the functionality required to ensure that energy is supplied by generation, transmission, and distribution at the lowest possible cost. EMS is thought to supply the load requirement through a variety of techniques [50]. Furthermore, it classifies into three groups, which are Rule-Based, Optimization-Based, and Learning-Based, as presented in the literature with their subclassifications [28]. Furthermore, it reduces the system operation cost, balances BT SoC power, and is resource-dependent [51]. While using the integration operation between RESs with the grid, some challenges will be faced, such as overloading [52], to overcome the aforementioned integration limitation by using EMSs to control and monitor the energy systems of RESs. Where the acquired results from controlling strategies are not accurate without considering the design variable as key features by exploiting sizing algorithms [53]. The optimization algorithms are coupled with EMS in order to smoothly flow the power into the proposed system [54]. The implemented RB-EMS in the system considered four operation modes as listed below considering 10 EVs, while the further explanation for the proposed method is placed in Table 2.
  • Mode 1: Exploiting the RESs (PV and WT) to charge the EV and home appliances.
  • Mode 2: Exploiting the BT (LiFePO4) to charge the EV and home appliance.
  • Mode 3: Exploiting the utility grid to form (G2V).
  • Mode 4: Exploiting the EV battery (Li-ion) to form (V2G).

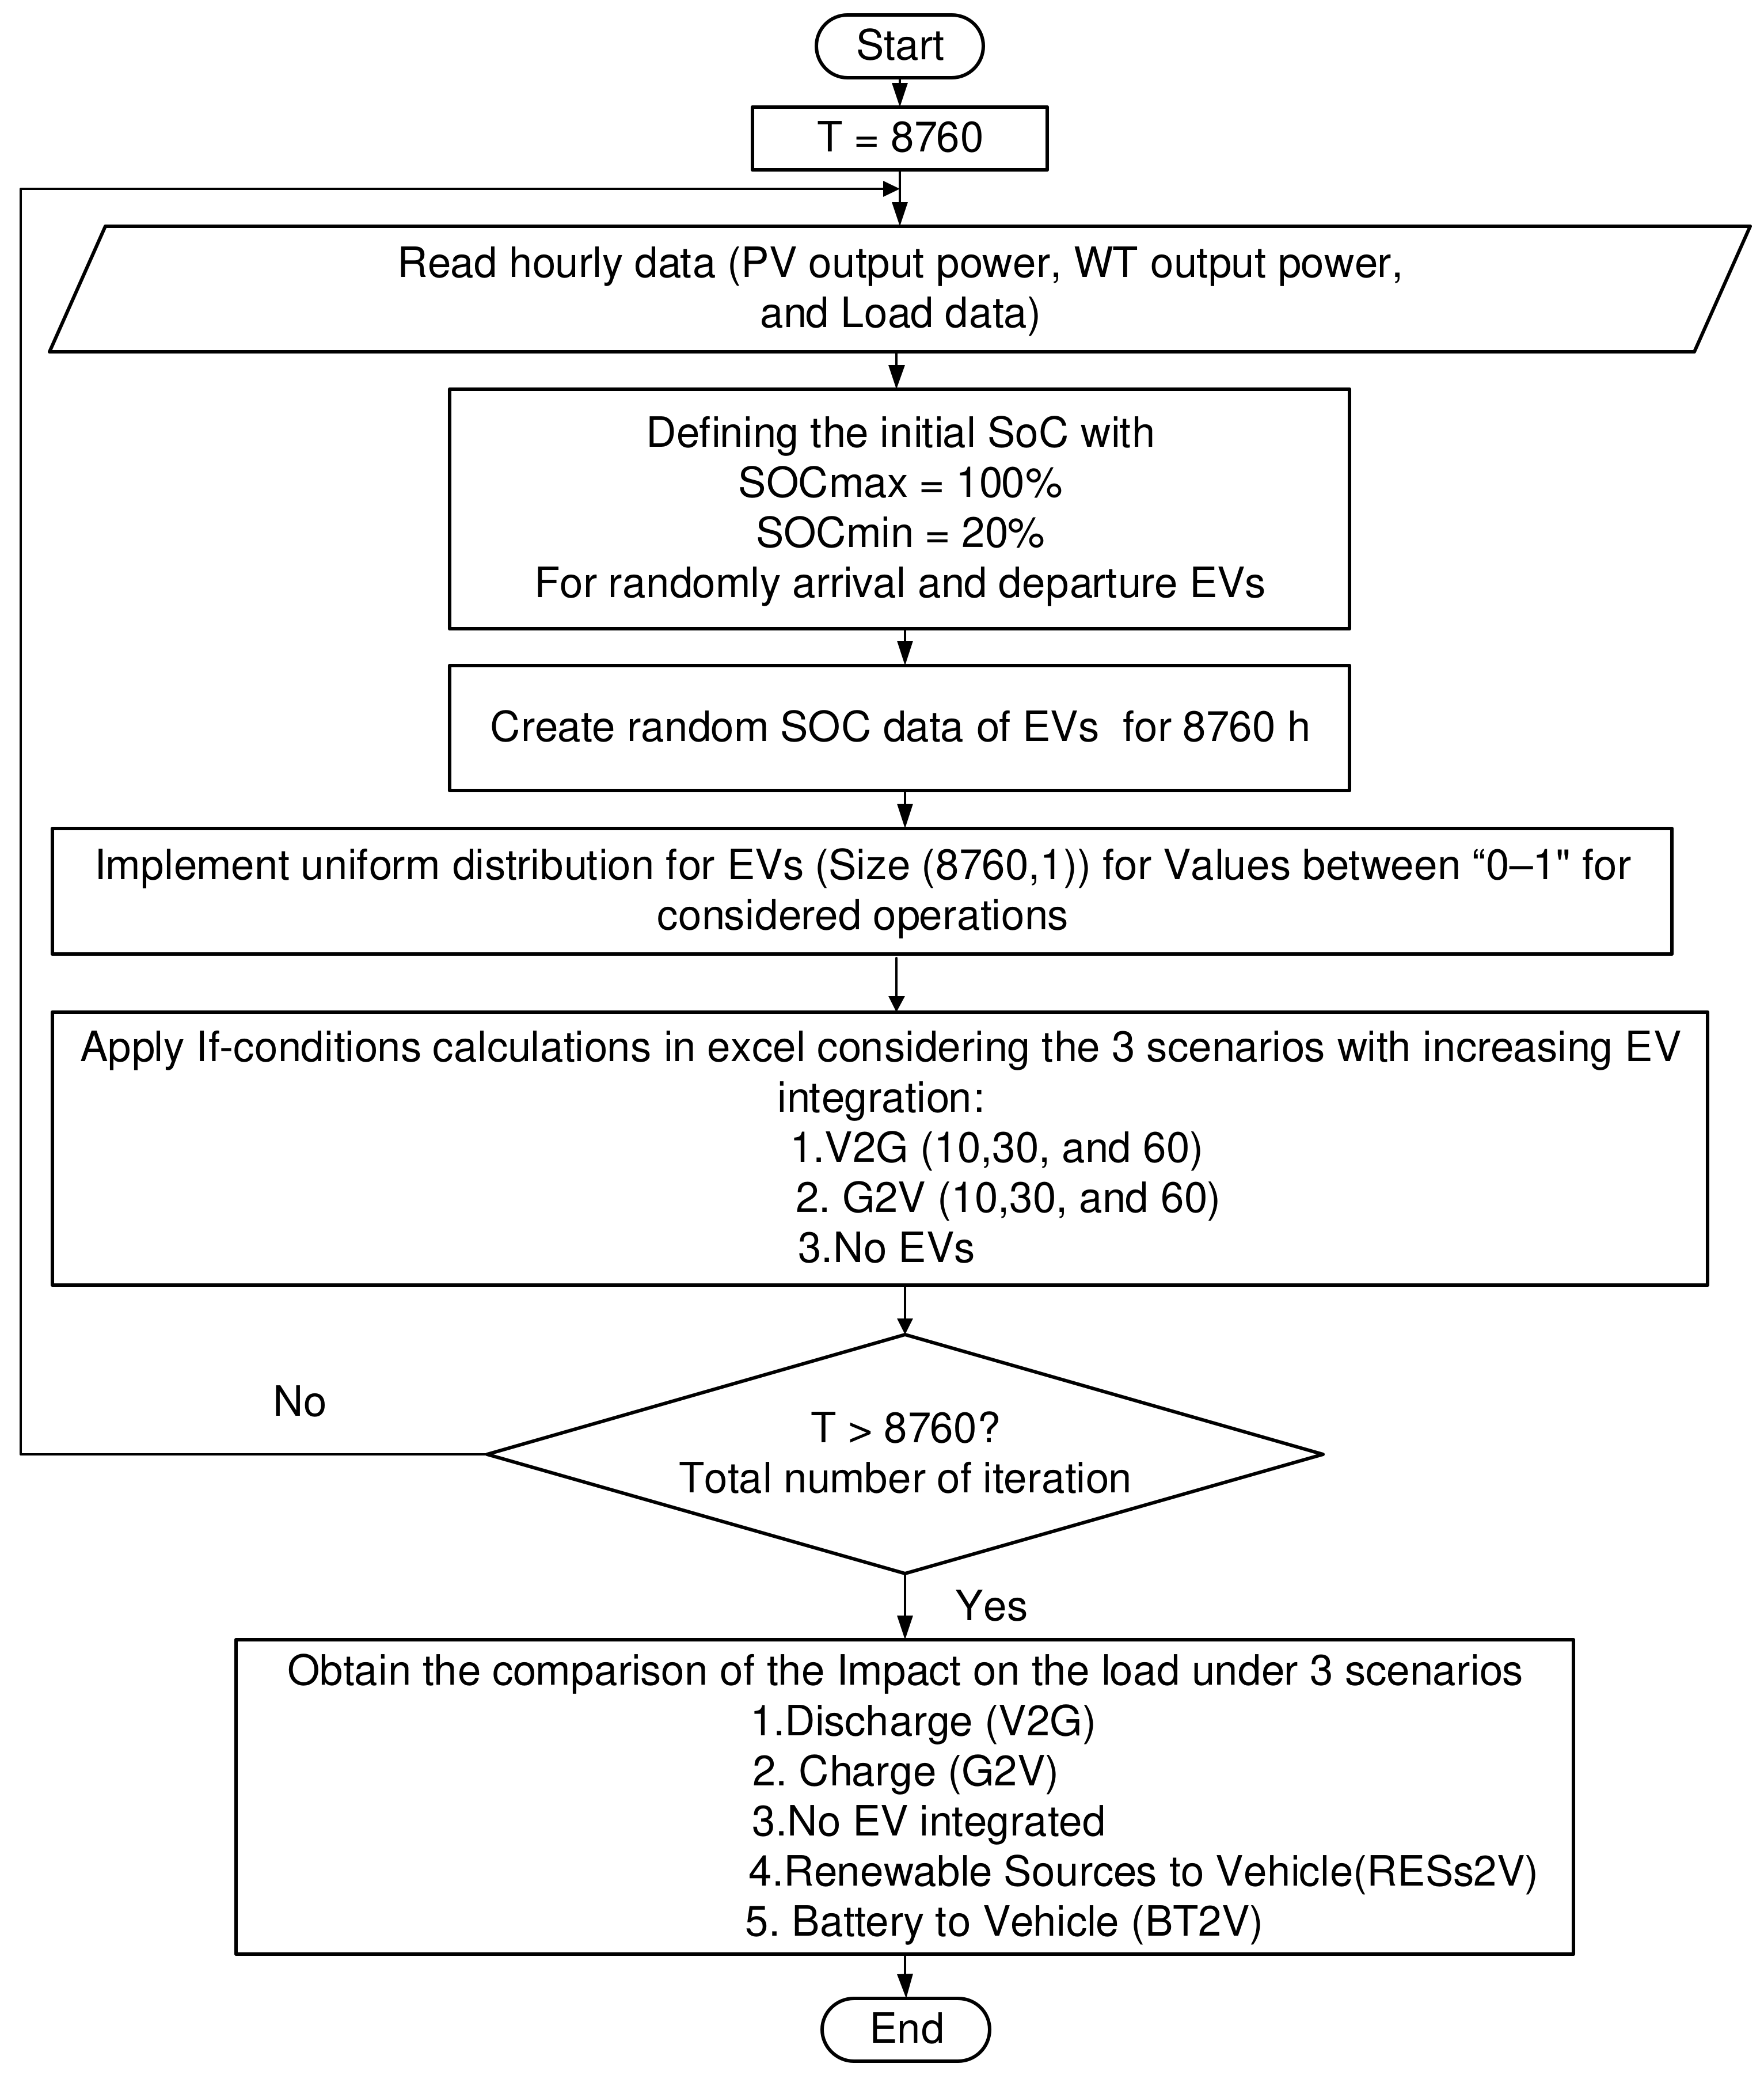
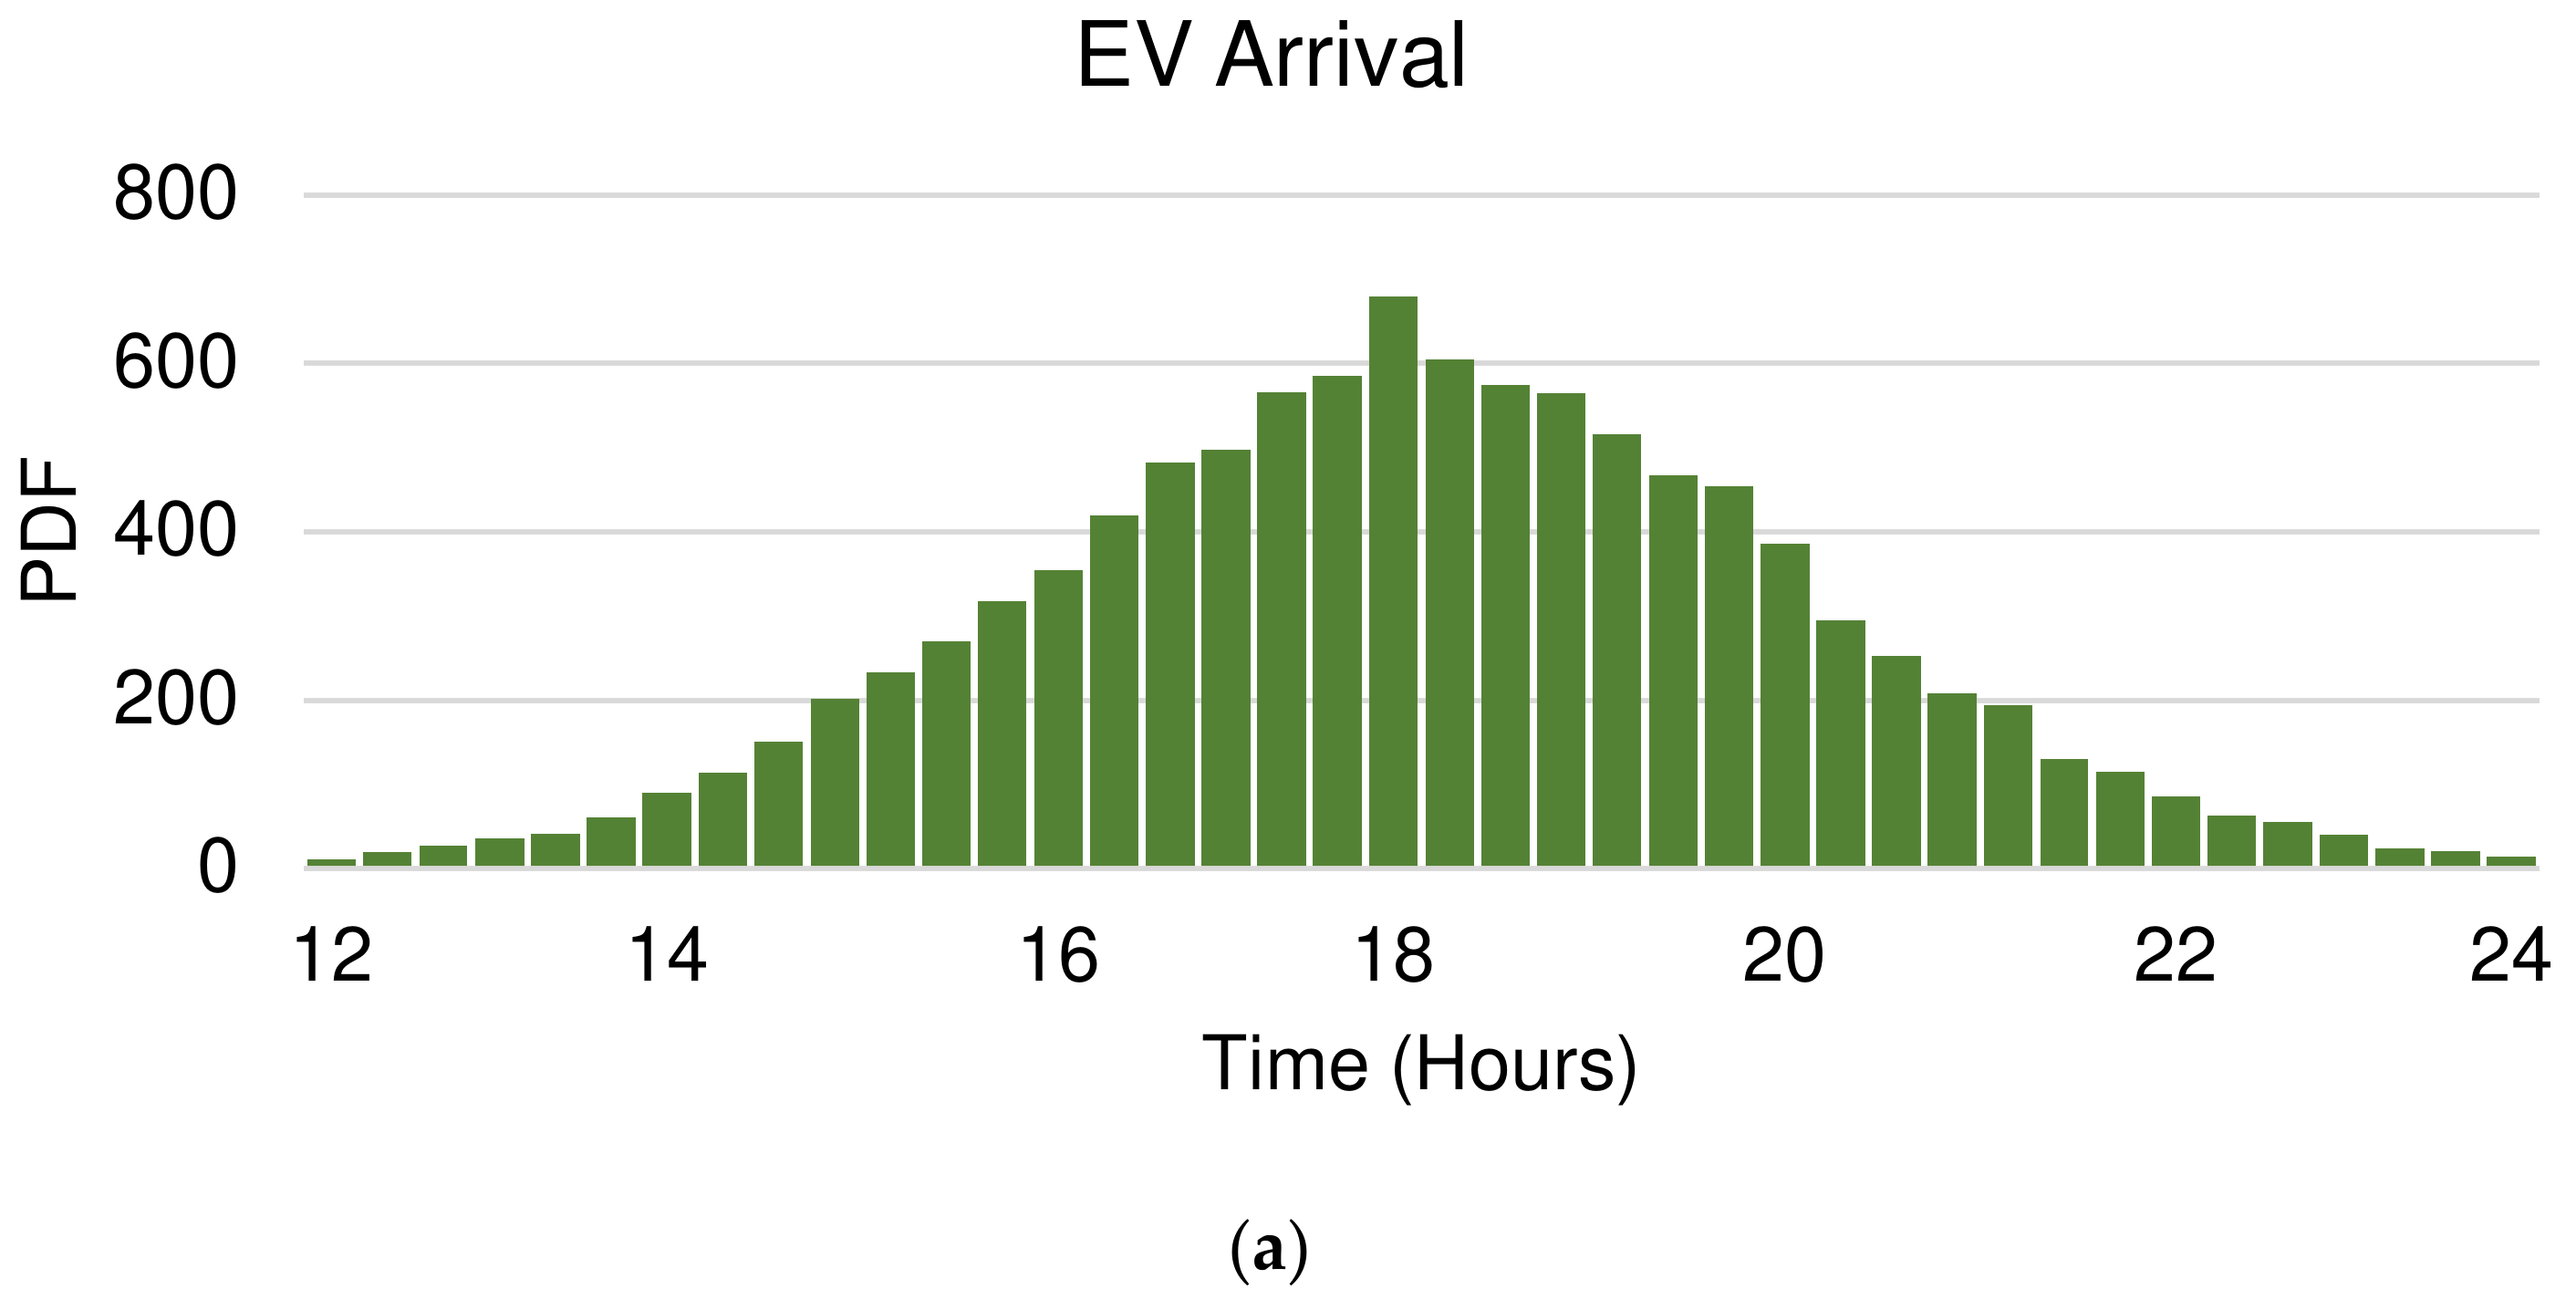
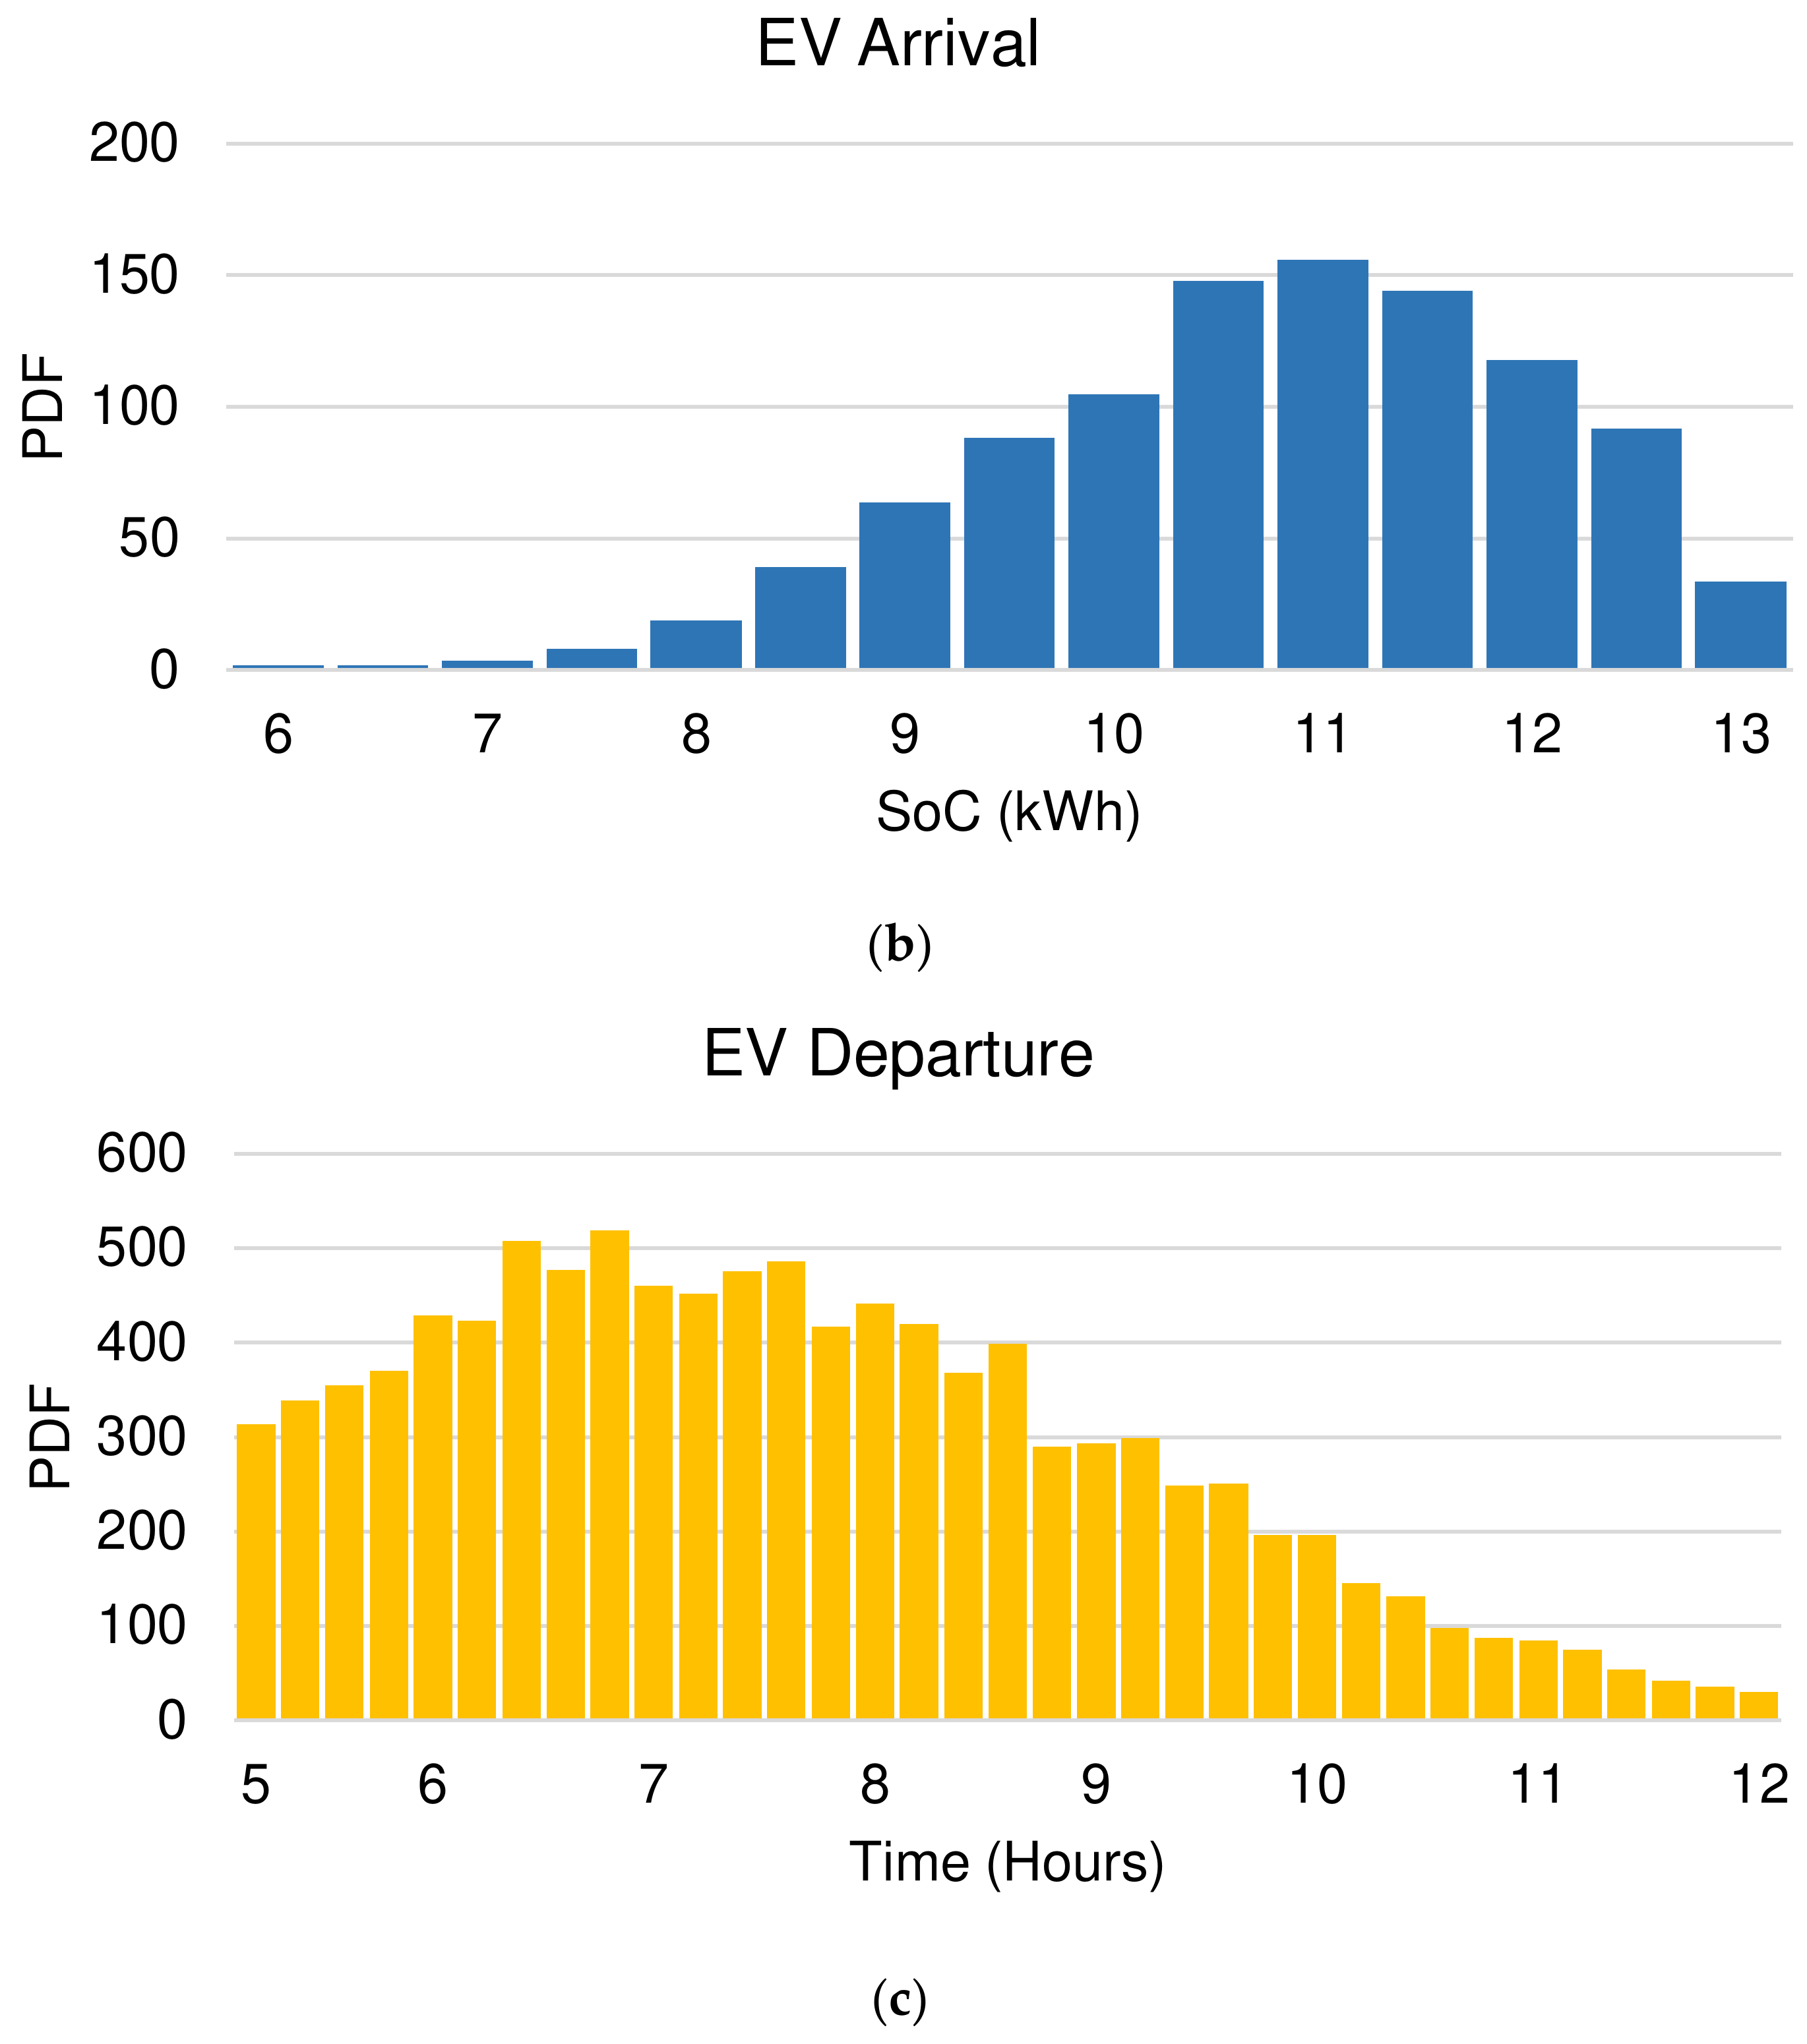
4. Stochastic Monte Carlo Method Analysis

The Stochastic Monte Carlo Method (SMCM) is a stochastic tool developed by Neumann and Ulam and implemented in various fields to estimate the randomness of the utilized components [55]. SMCM got attention among scholars due to its flexibility, runtime, and accuracy in solving a wide range of optimization problems in various fields [56]. It is also applied in project management, the sciences, finance, and artificial intelligence [57]. The SMCM is utilized to estimate the process of power flow and battery state for charging and discharging (SoC) of the EVs for the period of one year when the behavior of Evs is uncertain [14]. SMCM is exploited due to the random variable data in order to gain results in uncertain situations [45]. To simulate the V2G systems data with the utilization of SMCM by creating uniform random (uniform distribution) data between (0,1) sized with (8760.1) using Microsoft Office Excel as a powerful structured tool [58]. The SMCM flowchart of (V2G and G2V, RESs2V, no EV, and BT2V) is demonstrated in Figure 6 to gain the estimation result of various EV integration scenarios when integrating 10 Evs. The operation of if-then conditions for charging and discharging along with the aforementioned scenarios is figured out in Figure 7. The EV operator charger must charge the EV’s battery until the EV is satisfied ( SoC EV ) before the Evs depart from the EVCF [59].

5. Solving Optimization Methods and Objective Functions

Since there are three searching types of optimization methods, namely stochastic, deterministic, and hybrid methods, stochastic is considered in this study [21]. The aforementioned methods differ from each other in terms of providing the best solution to optimization problems in various fields. The first mentioned is utilized in hybrid renewable energy systems as considered by enormous scholars to address the limitation of the deterministic method such as avoiding local optima. While the second is not suitable for optimization problems with various local optima, which is disposed by local optima [21]. The pros of deterministic-based models are low computational cost and reliable results, whereas the cons are highly dependent on the initial solution, which is why it has been exploited in limited studies. Additionally, the last-mentioned method can be used to combine the mentioned algorithms and others. To form a hybrid system in order to gain an accurate result by solving complex optimization problems. The considered algorithm for sizing the system components counted as stochastic based which is enhancement of ALO namely the Improved Antlion Optimization (IALO) Algorithm [27,60]. While the benchmarks are Antlion Optimization (ALO) [24,61], Cuckoo Search Algorithm (CSA) [25], and Particle Swarm Optimization (PSO) [26] as briefly explained below.

5.1. Optimization Methods

The swarm-based algorithms are utilized in this study to size the system components using IALO along with the validation algorithms (ALO, PSO, and CSA).
  • ALO
The ALO is a nature-inspired metaheuristic algorithm that was introduced by Ali Marjalili in 2015 to address optimization problems considering Roulet Wheel Selection (RWS). It mimics the hunting behavior of antlions in nature [24].
  • IALO
The IALO is an improved version of the ALO which replaces the RWS with Levy Flight (LF) in order to address the randomness while also balancing exploration and exploitation [61,62].
  • PSO
It is a very well-known swarm-based algorithm that studies the animal’s behavior, such as fish schooling and bird flocking. It was introduced by Kennedy and Eberhart in 1995 [26].
  • CSA
It is a population-based algorithm that mimics the behavior of cuckoo birds in nature. It was introduced by Xin-She Yang and Suach Deb in 2009 to solve structural optimization tasks [25].

5.2. Objective Functions

The presented objective function in this study aims to gain a cost-effective, reliable, and renewable hybrid system considering the mentioned components.
  • Cost of Electricity
It can be defined as the per capita cost or cost of electricity (COE) and can be mathematically expressed in Equation (11) [63].
COE = ( CRF x NPC x ) + C g r i d R g r i d E s e r v e d   + E g r i d s e l l i n g
where the COE is the cost of electricity, which is measured in $/kWh, and the (NPC) refers to the Net Present Cost in ($) includes the costs (O&M, replacement cost, and capital cost) for x of years [64]. The CRF refers to the Capital Recovery Factor calculated in Equation (12) with the help of the interest rate ( i ) of the case study for the lifetime of the project ( n ). Furthermore, E s e r v e d presents the average load demand of the study area, and E g r i d s e l l i n g is the primary load served in (kWh/year) [65].
CRF = i ( 1 + i ) n ( 1 + i ) n 1
  • Losses Power Supply Probability
It refers to the reliability and ranges between 0 and 1, where 1 refers to unsatisfied demand and 0 is satisfied as mathematically expressed in Equation (13) [15].
LPSP = i = 1 N   [ P L ( t ) ( P W T ( t ) + P P V ( t ) + SoC B T ( t ) + SoC EV ( t ) ) ]   i = 1 N P L ( t )
where LPSP refers to loss power supply probability that measures the reliability of the power system in (%), SoC B T is the state of charge of the deep cycle battery at a time (t), S o C E V refers to the state of charge of the EV battery at a time (t).

5.3. Renewable Energy Fraction

Due to the intermittency of the climatology conditions, the yielded power from the RESs sources is not stable. The technique of measuring the output power from renewable sources is known as Renewable Energy Fraction (REF). The aforementioned technique refers to the transferred power from RESs to load as presented in Equation (14) [34].
REF = 1 8760 ( P P V + P W T ) Δ t 1 8760 ( P P V + P W T + P g r i d p u r c h a s e d ) Δ t
The P g r i d p u r c h a s e d , P W T , and P P V are the purchasing power from the grid, output power from the wind followed by the output power yielded from the utilized PV, respectively.

6. Results and Discussion
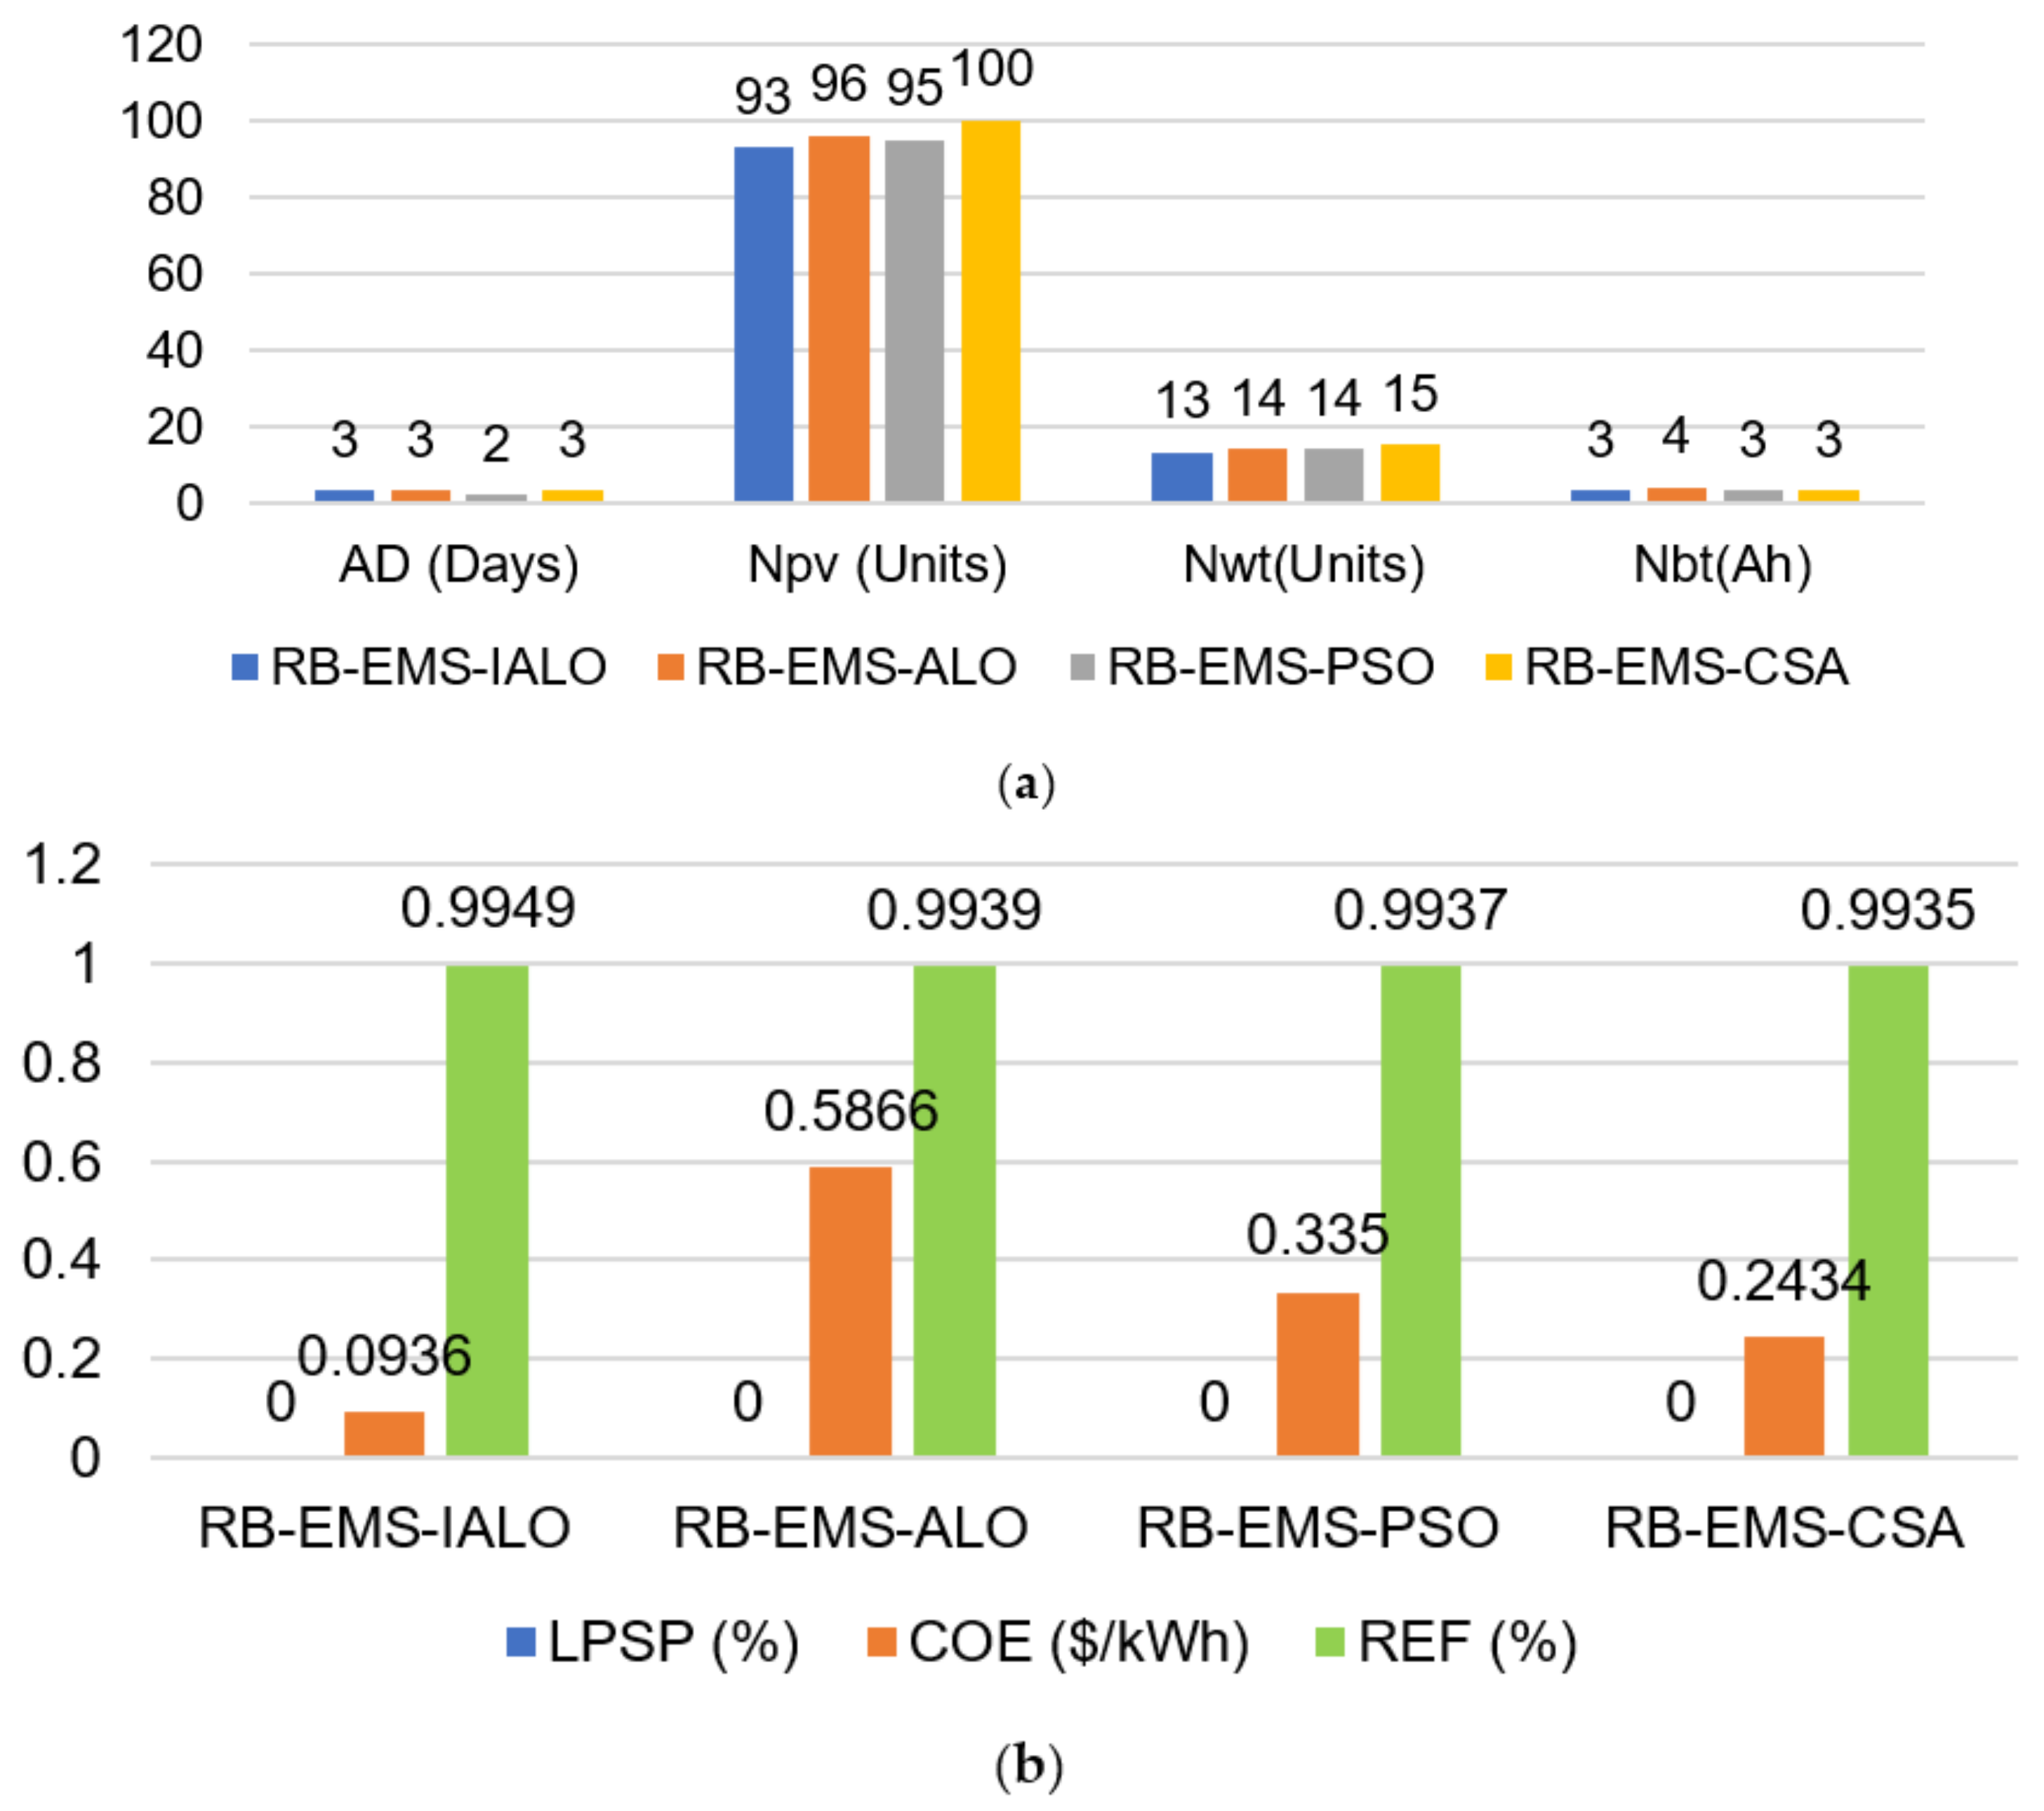
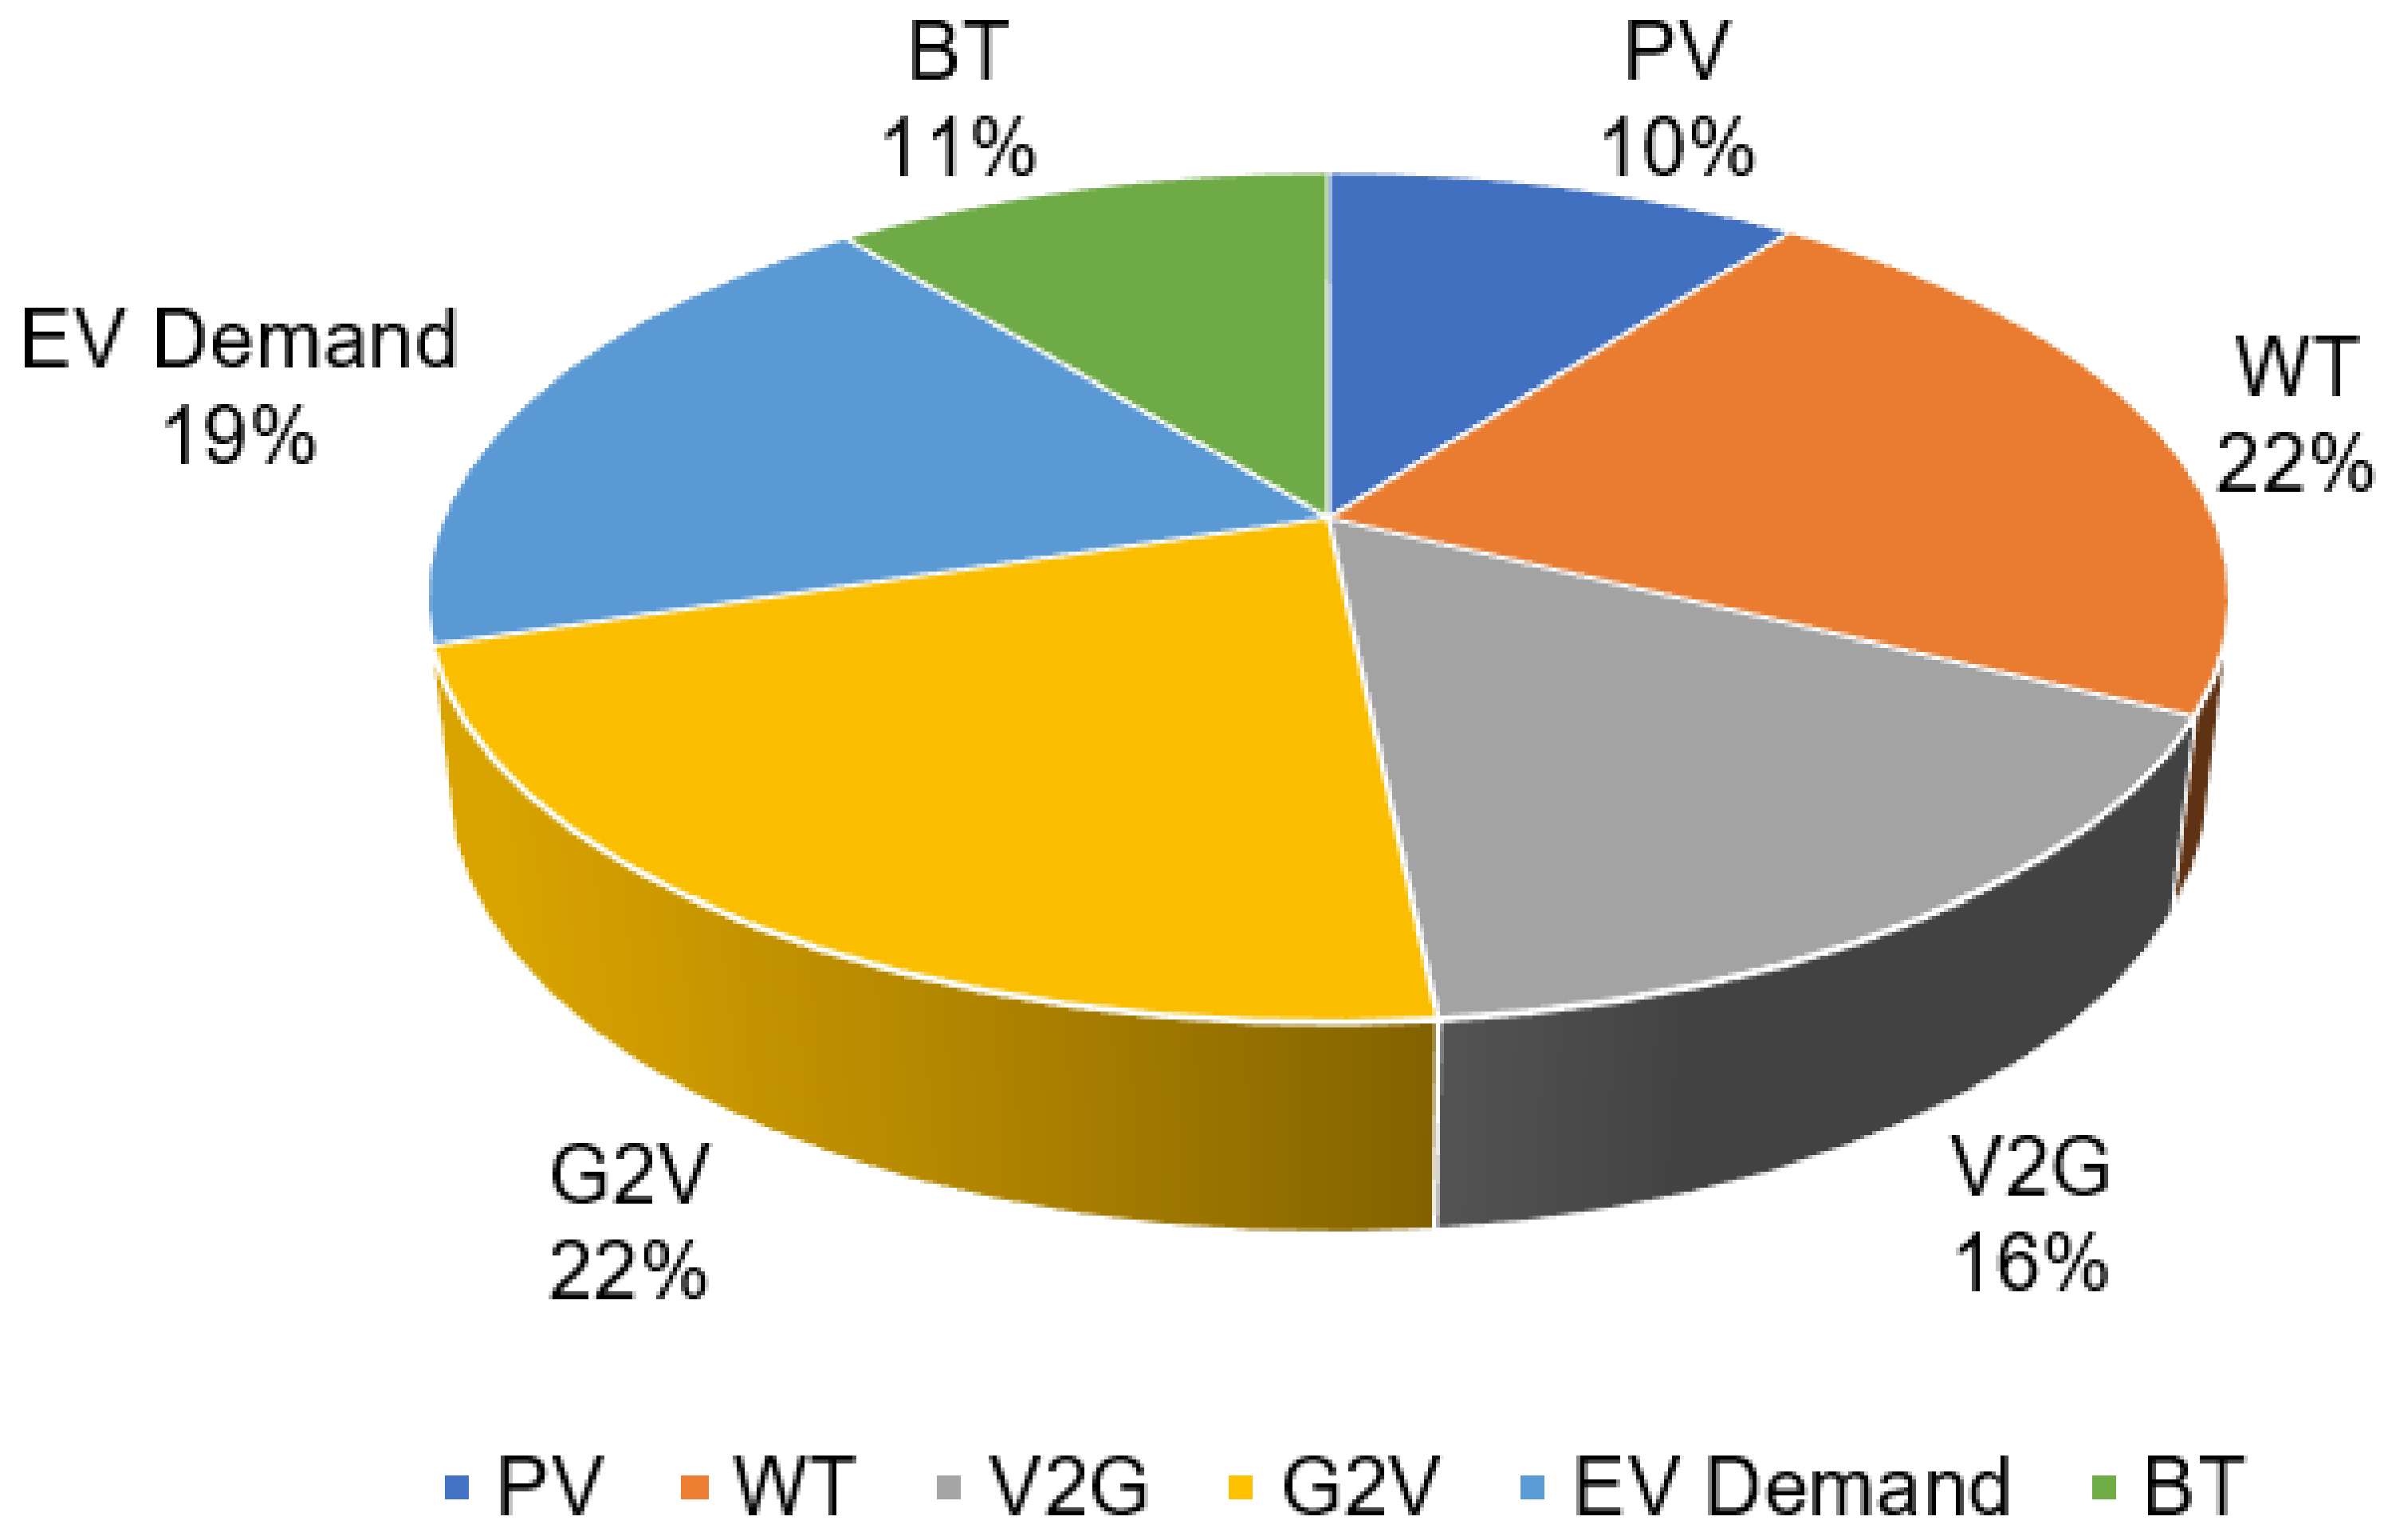
MATLAB R2016b (Natick, Massachusetts, USA) and Microsoft Office Excel (Las Vegas, Nevada, USA) are running on an Intel I Core I i5-8250U CPU @1.60 GHz to implement the obtained results for the proposed algorithm and its counterparts along with the analysis. The action of load shifting when integrating Evs and without EV integration, as shown in Figure 8, is useful to gain increased energy efficiency, sustainability, and energy savings [50]. As presented in Figure 8, it can be seen that the EV integrations are making some extra loads, as presented in red, while the domestic load without the EV consideration is presented in blue. The number of vehicles in the EVCF can be increased or decreased, which depends on the randomness of arrival and departure Evs. Based on the proposed hybrid system in Figure 2, the acquired sizing result for the considered configuration is presented in Figure 9 and will be further discussed. The SoC EV for Evs in the arrival case and departure during the proposed hours are presented in Figure 10. The output power from the utilized sources is placed in Figure 11. While the effect of V2G operation using SMCM analysis under charging and discharging operation in terms of load demand is simulated in Figure 12. The contribution of energy sources has been taken place in Figure 13. Eventually, the sensitivity analysis result is considered in Figure 14.
The output generated power from the utilized sources for the proposed hybrid system is presented in Figure 11. Various samples can be taken as (a) refers to the status at 9 a.m., (b) represent the outpower at 11 a.m., sample (c) refers to 16 p.m., and at 17 p.m. for sample (d).

6.1. Sizing Result

The proposed algorithm (IALO) for sizing performs better in terms of system sizing configuration, as illustrated in Figure 9a. While the proposed objective functions (COE, LPSP, REF) consider RB-EMS coupled with the proposed (IALO) and counterpart algorithms (ALO, PSO, CSA), as shown in Figure 9b, show lower cost due to the provided advantages of IALO. The REF is almost similar or closed due to the high renewability in the considered area of the case study. The third objective was LPSP and resulted in 0%, which means the load was satisfied because of the multiple integrated sources.

6.2. Stochastic Monte Carlo Method Analysis Result

The time prediction of arrival and departure EVs along with the SoC of the EV’s battery are acquired by Equations (15)–(18) based on SMCM as a valuable method for providing an accurate result, as shown in Figure 10a–c [45]. A Microsoft Office Excel tool is used to deliver the results in this study.
T i m e a r r i v e EV ~ N ( μ E V a ,   σ E V a )
T i m e D e p a r t u r e EV ~ N ( μ E V a ,   σ E V a )
SoC a r r i v e EV ~ N ( μ E V a ,   σ E V a )
SoC D e p a r t u r e EV 0.2 × C a p EV
where N refers to the normal distribution, SoC D e p a r t u r e EV and SoC a r r i v e EV are the SoC of the EV’s battery for departure and arrival time, μ and σ are the mean and standard deviation of the arrival and departure EV and the T i m e a r r i v e EV and T i m e D e p a r t u r e EV refers to the estimated arrival and departure times of the EVs that were modeled by the Probability Density Function (PDF). Furthermore, the C a p EV is the EV battery capacity [15].
The charging power level for the charging home area is 11.5 kW, which refers to Level 2, and its efficiency is 86.5% [7]. The impacts of EVs on the grid considering the stochastic method are resulting in a reduction in the LPSP [66]. Based on the arrival and departure times of the EV users, the daily utilized distance should be taken into consideration to prevent driver anxiety and count the EV charging duration [67]. The yielded energy in (kWh) from the utilized various sources (energy consumed from the grid (G2V), RESs energy (RESs2V), energy exported from EV (V2G), and energy consumed by the BT (BT2V)) in the hybrid system. The amount of exchanged power among the utilized sources is presented in Figure 11, which reduces the energy consumption for the long term from 18,700.3 kWh/Year –13,794.4 kWh/Year. The energy consumed by chargers shows an increase due to the high demand considering EVs and other appliances, followed by the RESs, energy from the grid, then the exported energy from the EVs, respectively. The presented output power from the components in Figure 11 are P P V (green), P W T (red), P L (Brown), P B T (blue).
The SMCM was utilized in the grid-connected system to provide a better understanding of impacts on the load and examine the performance of the integration system under various scenarios taken into consideration. The randomness of the SMCM is conserved to analyze the uncertain SoC of the number of EVs integrated with RESs under a residential load [56]. Furthermore, the assessments on load, charging, and discharging, the amount of integrated energy from the RESs and grid, and amount of exchanged energy from and to the EV (V2G and G2V), RESs2V, and BT2V are investigated and presented in Figure 12. The presented results refer to V2G (black), G2V (red), No EV (yellow), RESs2V (blue), and BT2V (green).
As presented in the previous figure for the first 24 h of the year (in winter), sample (a) at 2 am that presents Mode 1 (RESs2V) for supplying the demand with (7 kWh) at the same time, there is some energy produced from the EV battery (6 kWh) but it is not sufficient to meet the demand. Mode 3 (G2V) in sample (b) meets at 6 am by supplying the demand from the utility grid with (7 kWh). Eventually, at 3 pm sample (c) is presented by activating Mode 2 (BT2V) with (9 kWh). Although Mode 4 has not been met during the first 24 h of the year, depending on the SoC EV , it has been met during the year.
Based on the collected climatology data and the presented mathematical models for the components considered, Figure 13 demonstrates the energy contribution from each source. Furthermore, from the presented pie with various percentages of the system components, the grid contributes (22%) in the first 24 h due to its availability in considered hours that form the G2V technology. Additionally, BT contributes (11%), which forms B2V, EV demand (19%), and V2G (16%) at the considered hours. Furthermore, the considered RESs (PV and WT) contributed to charging the EV and the BT for the first 24 h with (10%) for PV and (22%) from the WT, respectively.

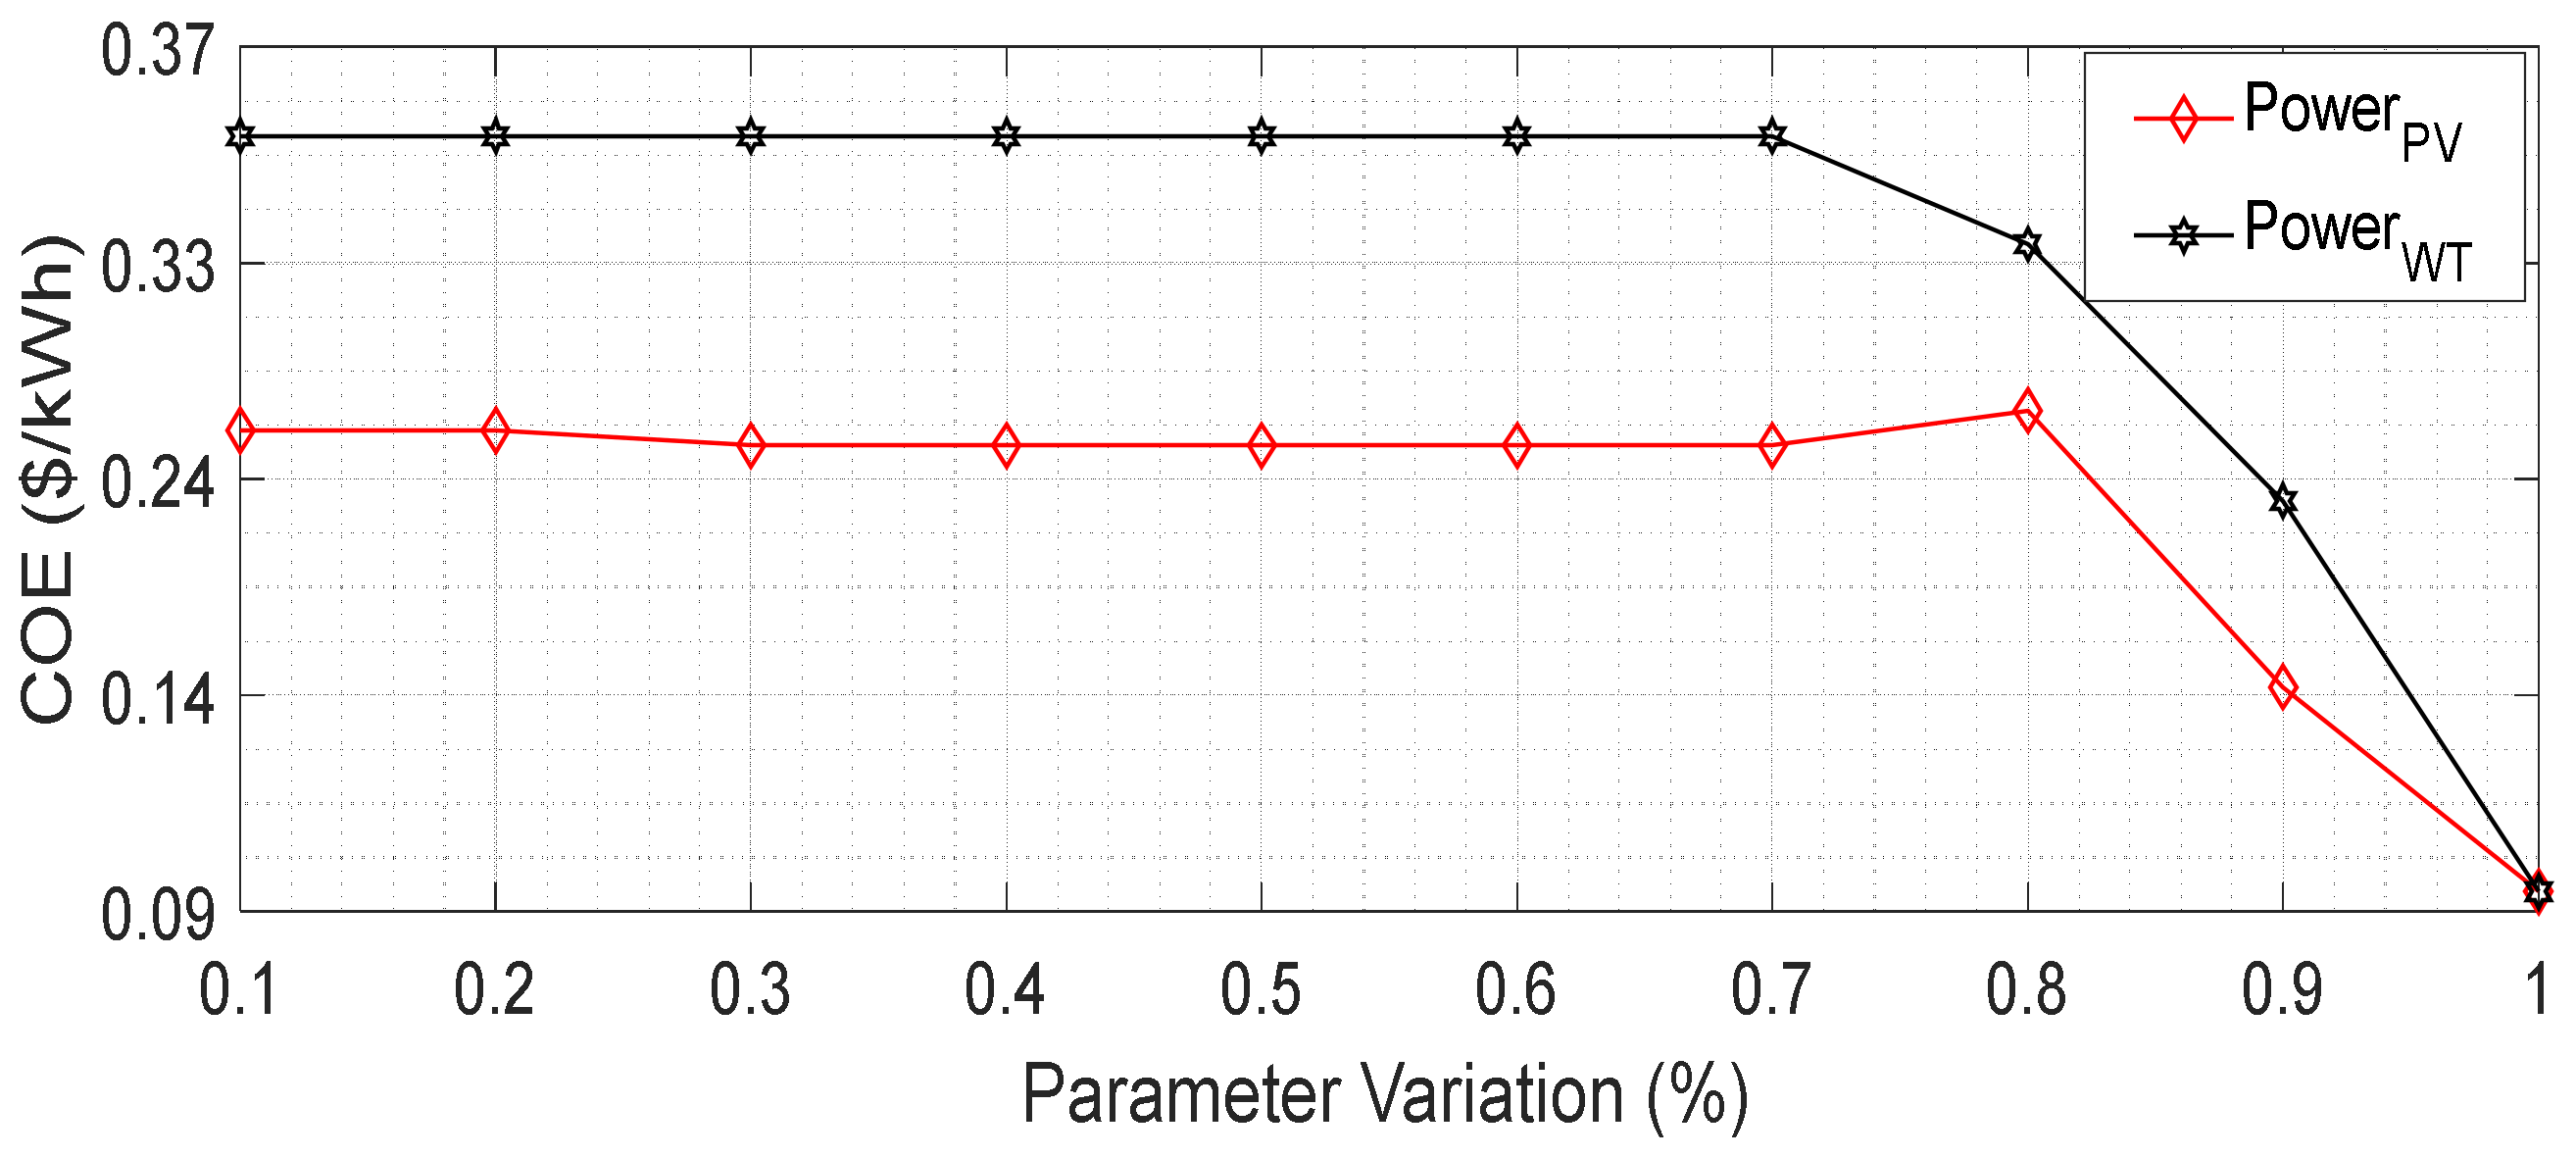
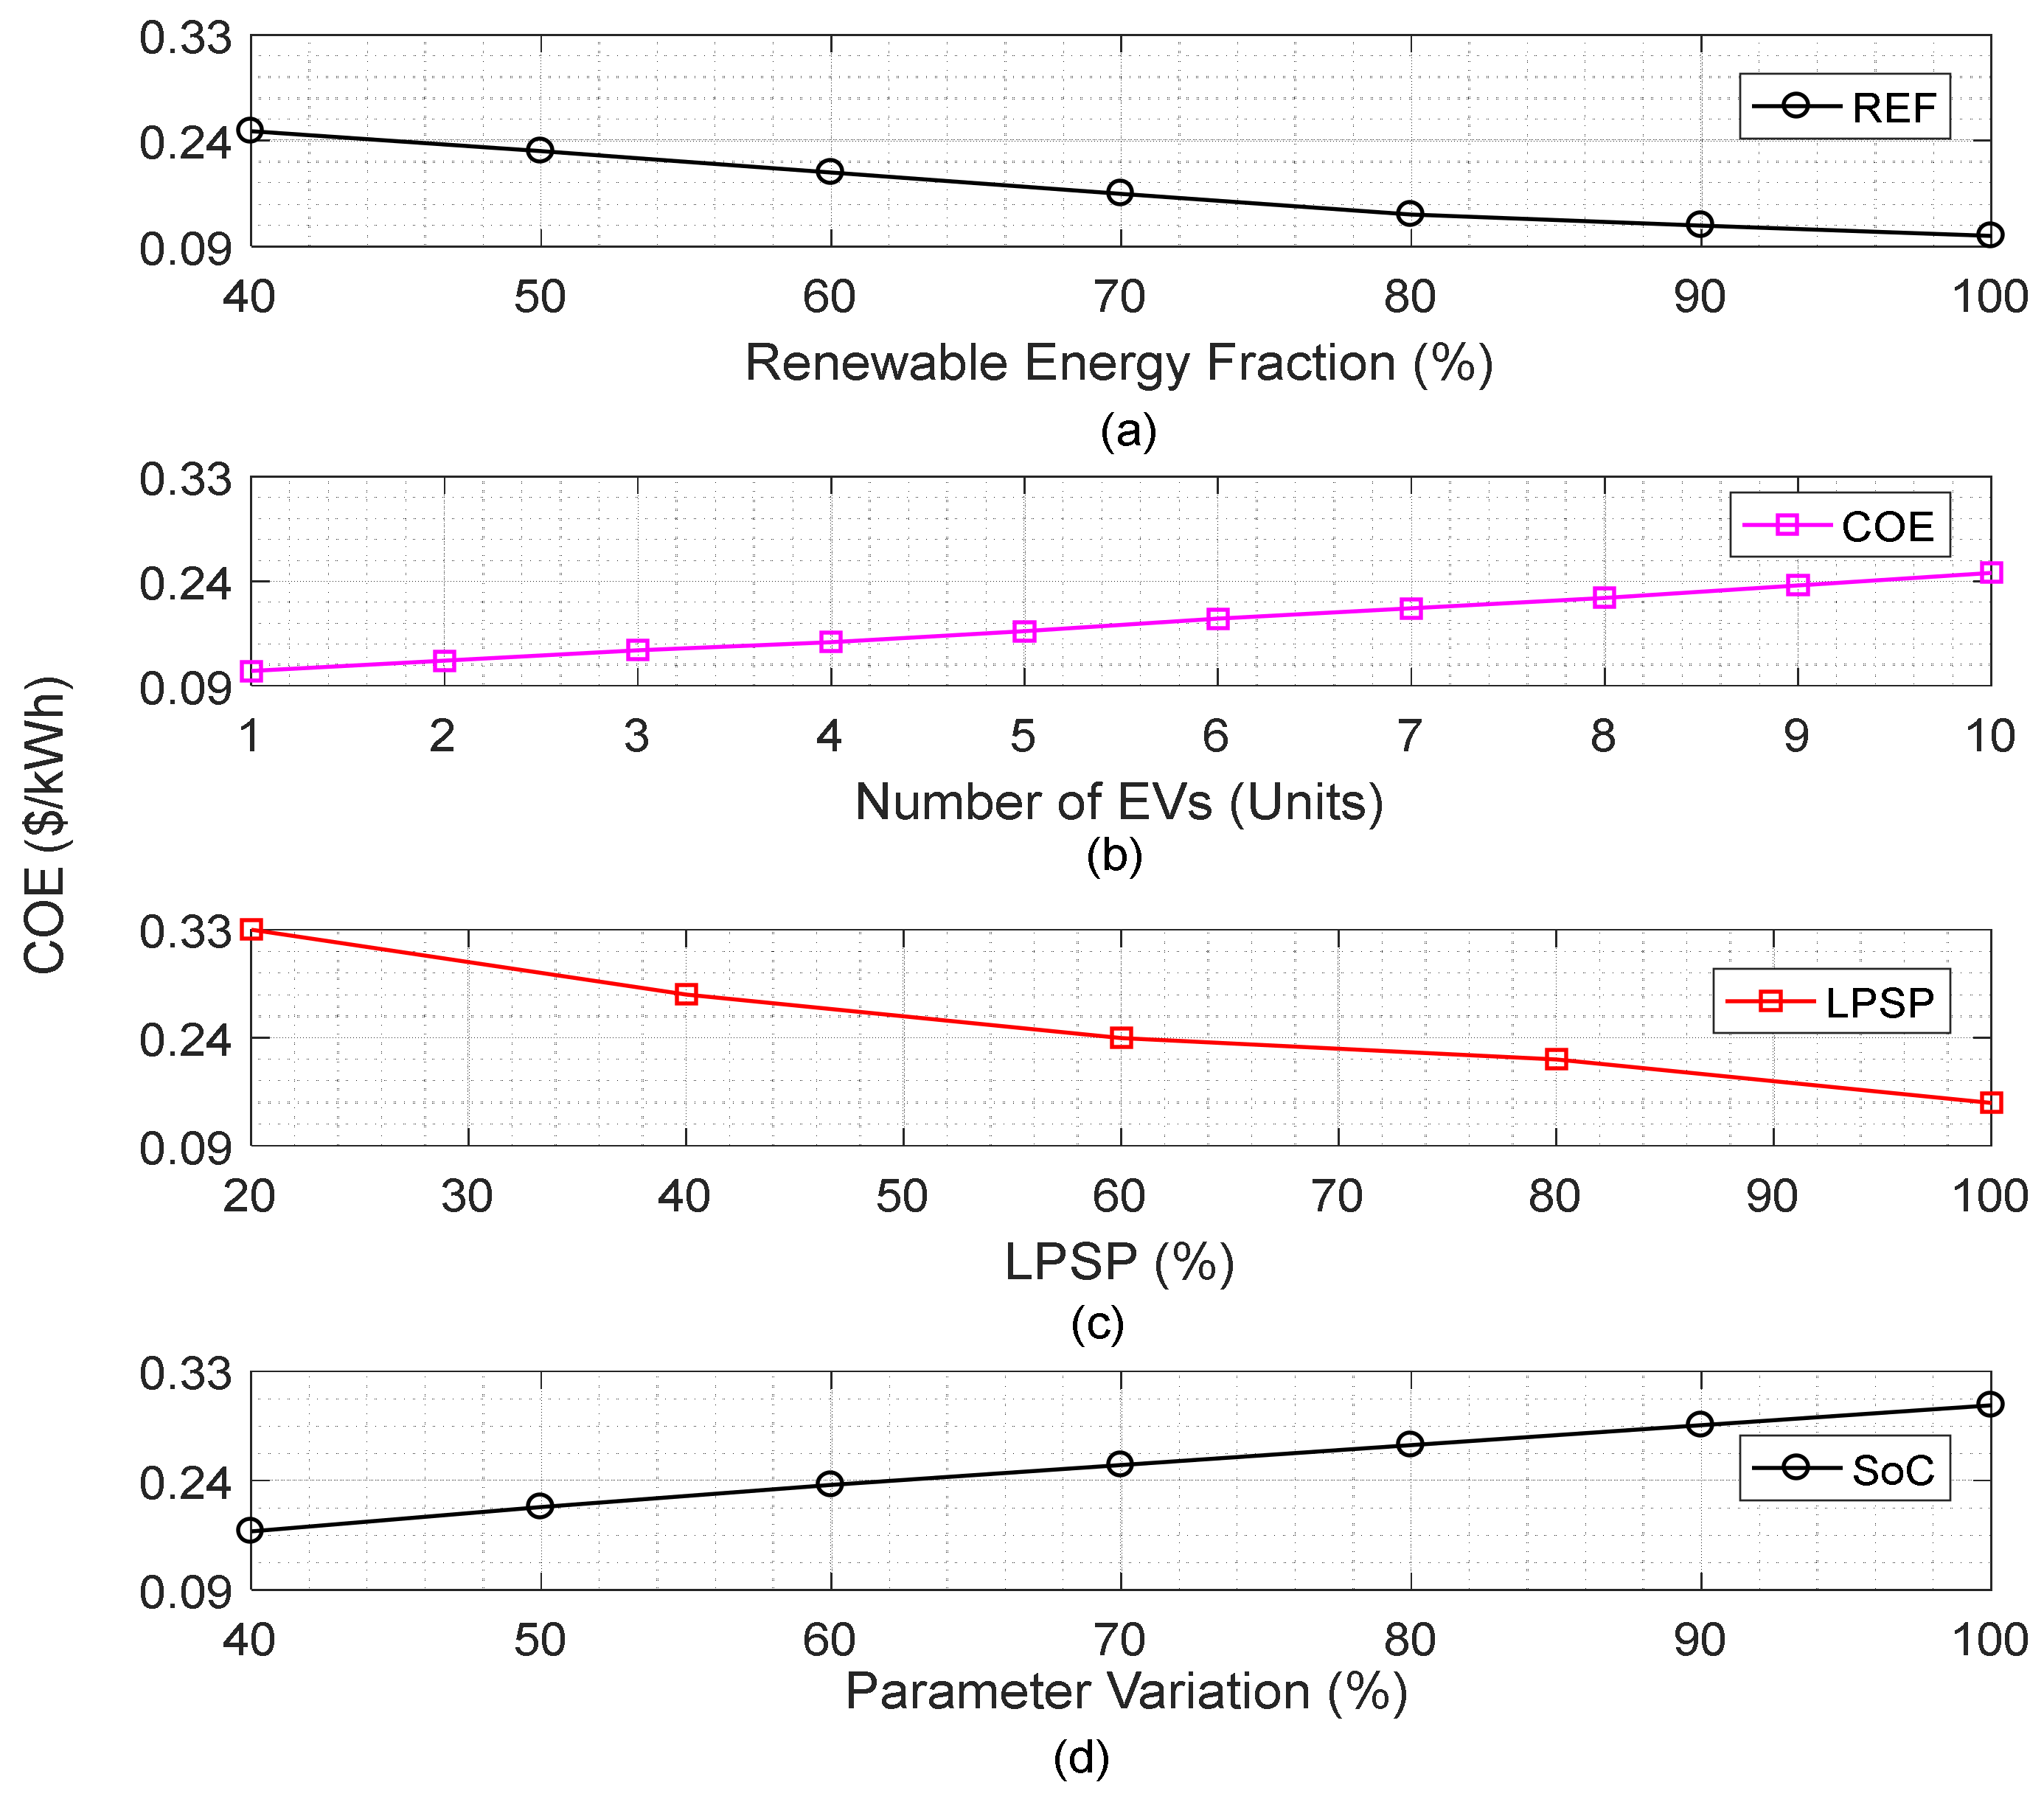
6.3. Sensitivity Analysis

The sensitivity analysis is presented for a hybrid grid-connected system and employed to provide a better understanding of impacts on the load and examine the performance of the integration system. Furthermore, it is utilized to evaluate the influence of various configurations on system operation by conducting two parts as will be presented in the subsection for the key affected components of the system result. The first one is the impact of uncertainty on the output power from the RESs ( P P V and P W T ) due to climatology changes (wind speed, solar irradiance, and temperature). The second one is related to the comparison of COE with REF and LPSP in the case of insufficient power provided by the RESs along with the EV integration.

6.3.1. Impact of Changes in Climatology Condition

The impact of changes in climatology conditions on energy production has been investigated and analyzed in this section. The selected configurations have been chosen due to the listed reasons.
  • The climatology changes are considered to overcome the worse days (unsunny or unwind days) scenario.
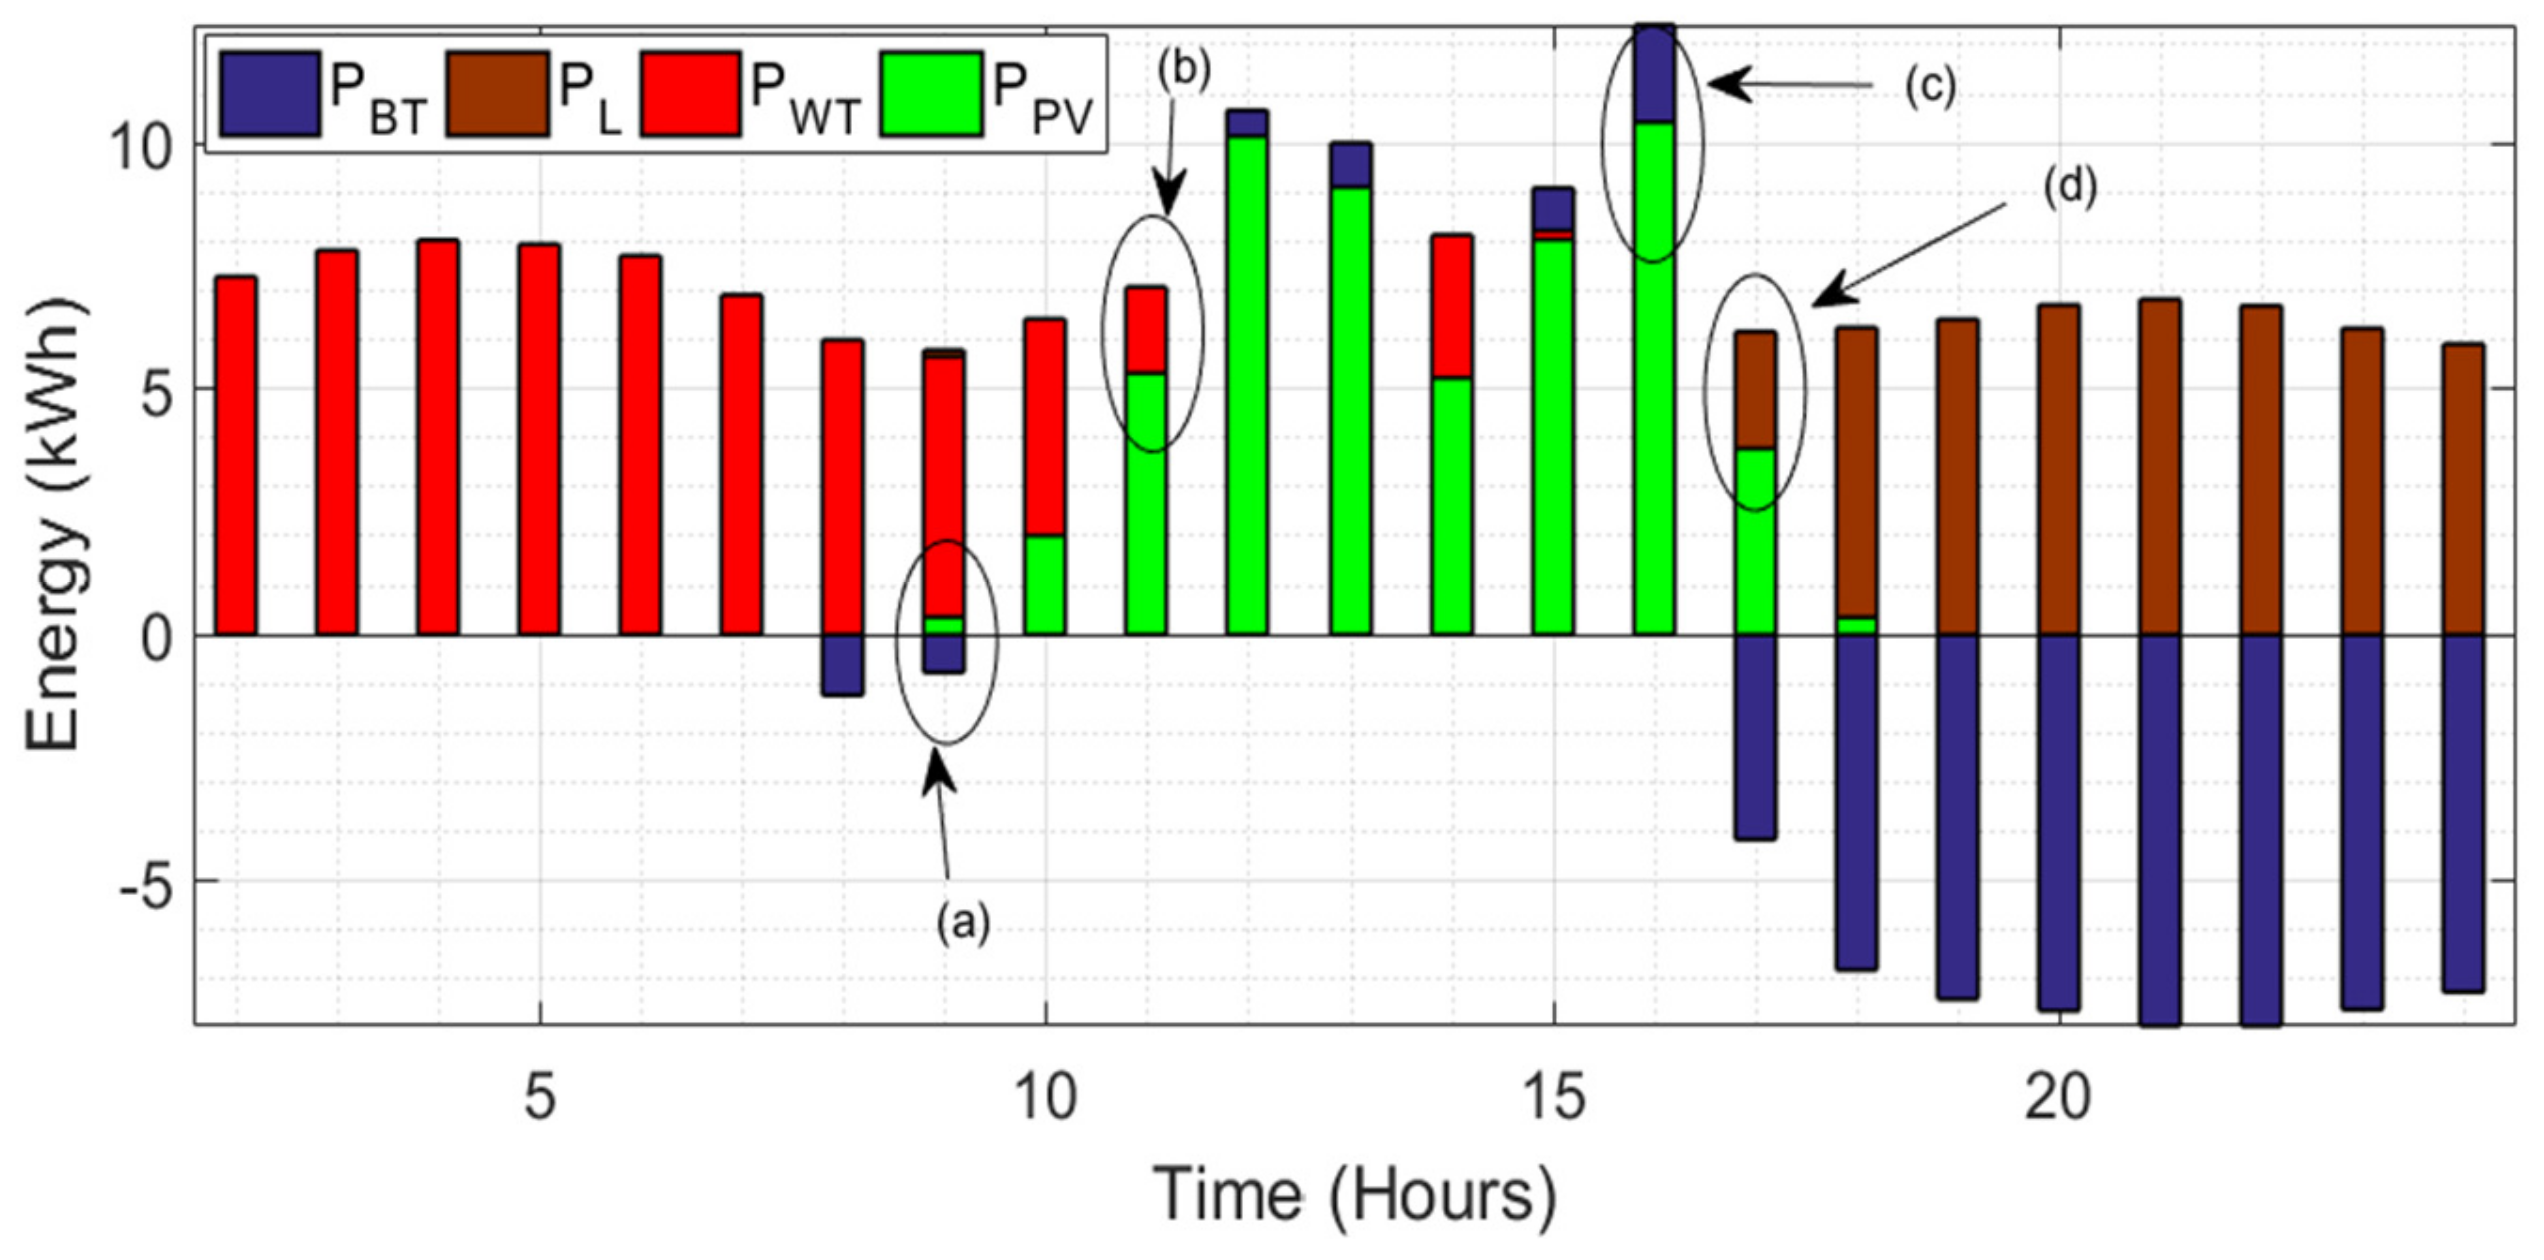
  • The energy storage battery is the less lifespan component carried out for sensitivity analysis due to the backup in the case of insufficient RESs power.
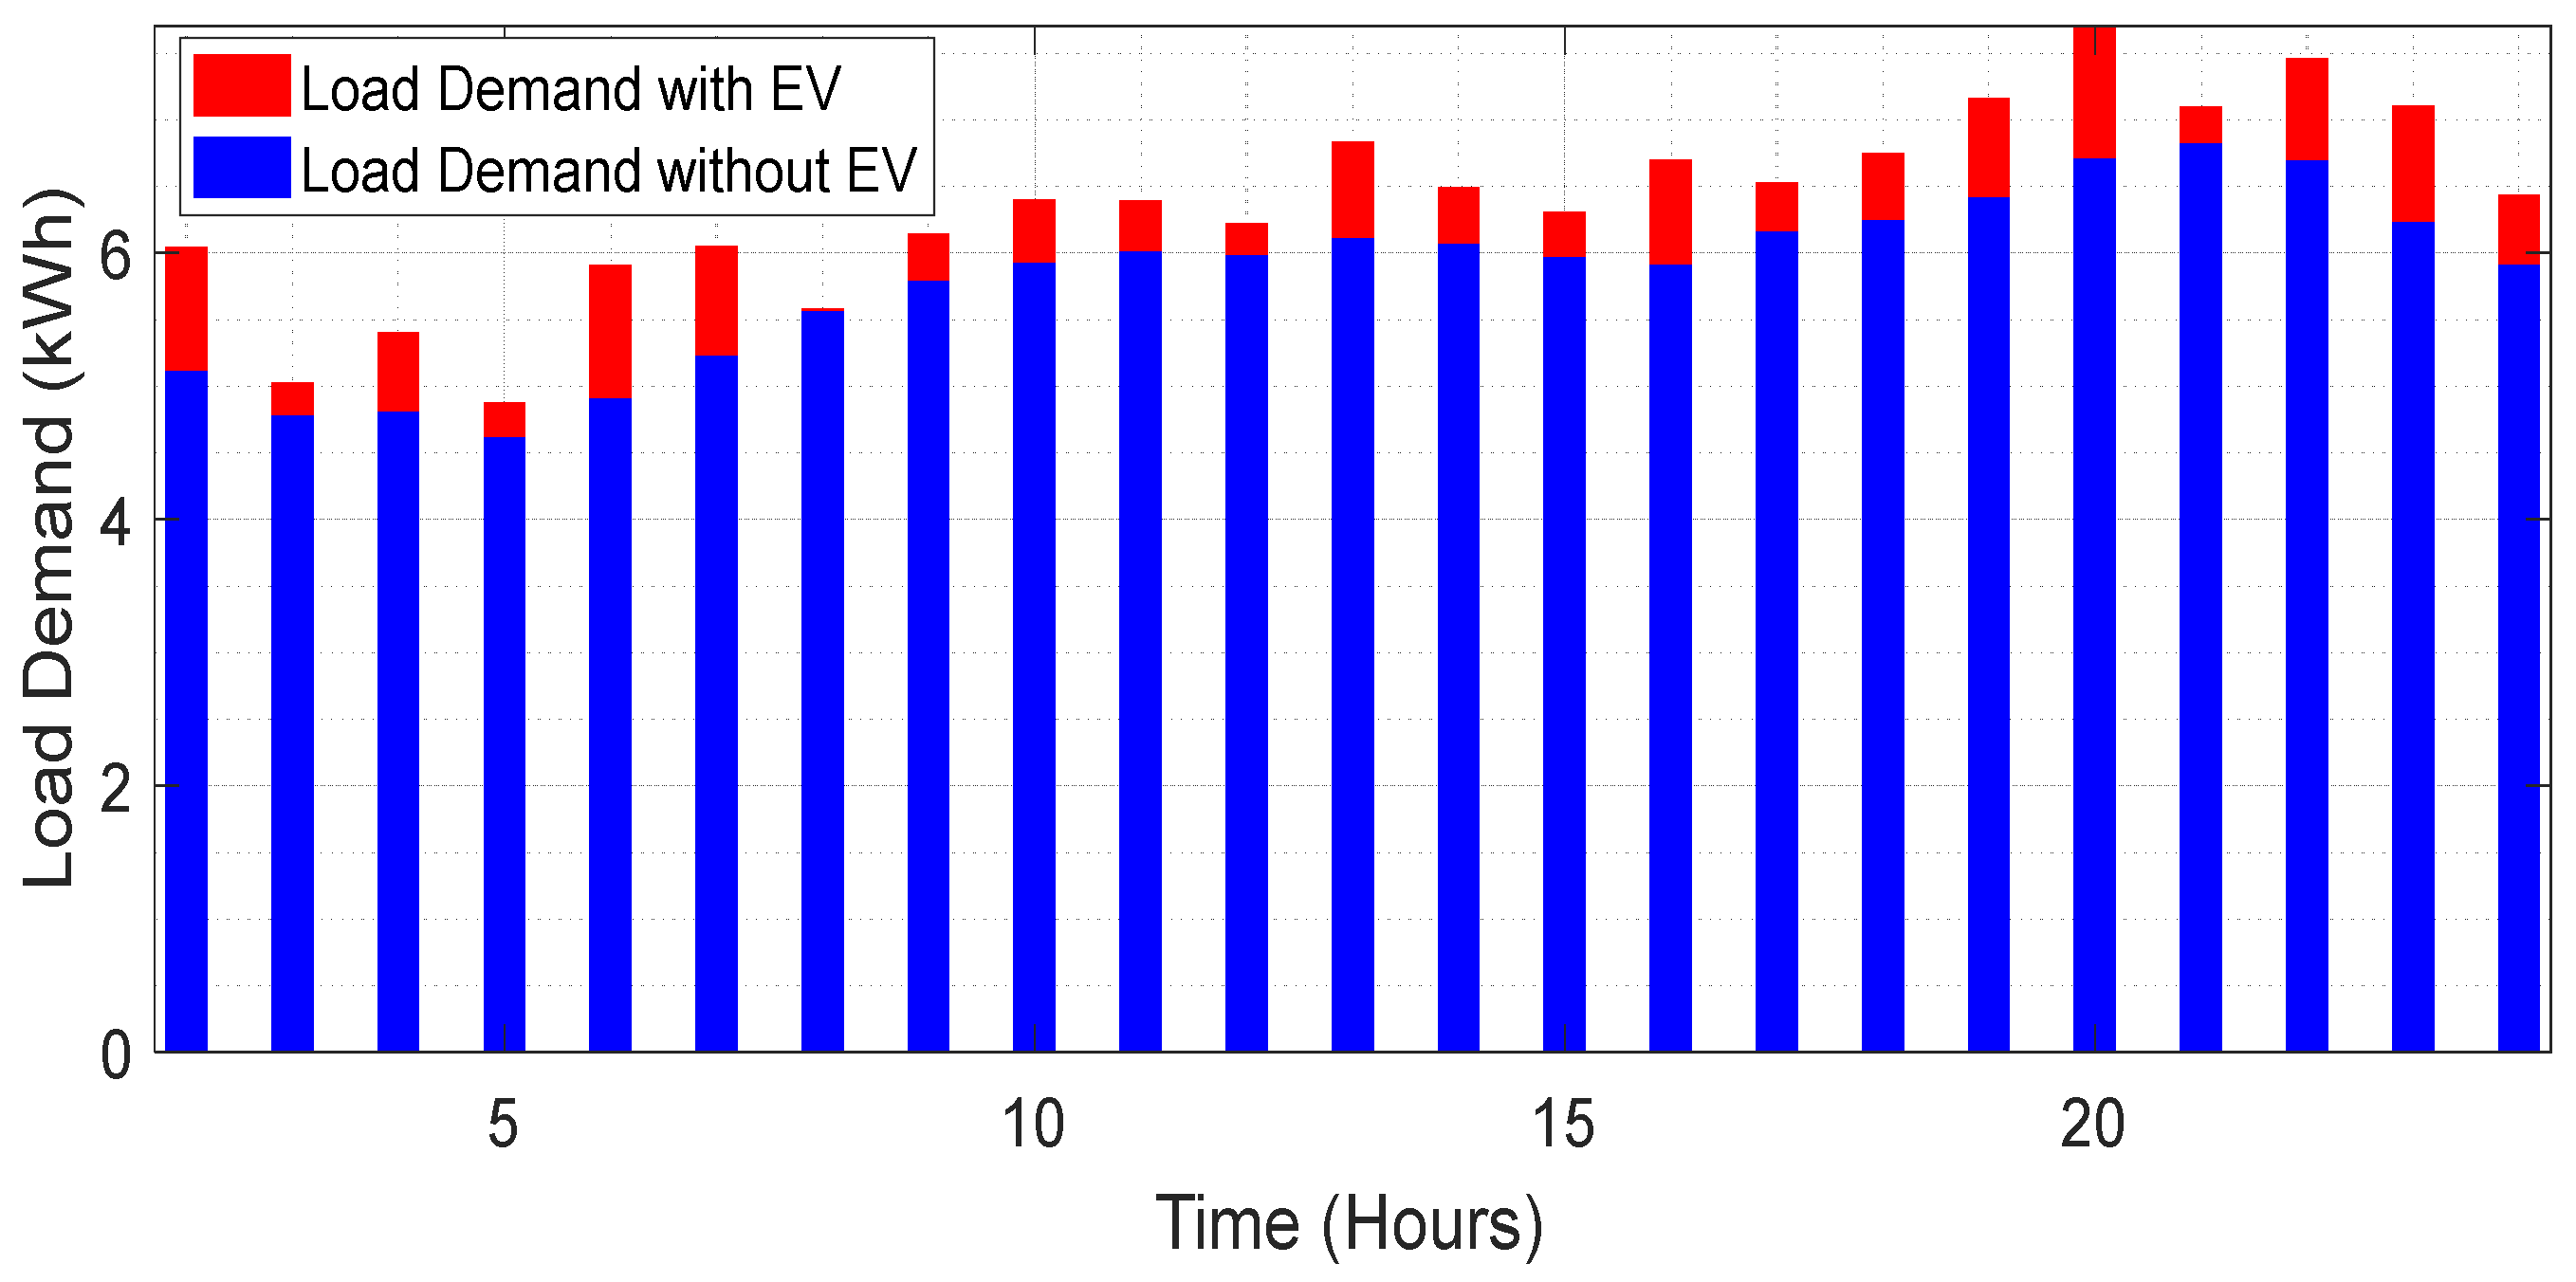
  • The integration of EVs potentially affects the output power result (when charging and discharging).
Based on the acquired result from RB-EMS-IALO for the microgrid (refers to the IALO sizing result presented in Figure 9a). Due to the uncertain changes in RESs (PV and WT) from the proposed algorithm, the components have been investigated. It can be seen that the presented changes from 1 (100%) to 0.1 (10%) refer to the generation changes from the RESs, the cost is increasing. Moreover, 1 refers to the base case (a point where no increase or decrease occurred), as has been taken from the IALO sizing results. The most affected microgrid sources in the system are PV and WT due to the climatology changes, and the relationship between the PV output power and wind turbine. The curve of sensitivity is considering the P P V and P W T in contradiction with the COE as demonstrated in Figure 14 with the consideration of 10% changes.

6.3.2. Impact of Deep Cycle Battery and EVs Integration on the Grid

It can be seen from Figure 15a that the increase in REF could potentially affect the COE result. As the high renewability is demonstrated in the case study, the increase in the REF reduces the cost. Based on the COE calculated by RB-EMS-IALO, increasing the number of EVs increases the COE, as shown in Figure 15b. Integrating the various number of EVs influences the load. Ultimately, due to the fact that the COE and LPSP are trade-offs, the COE against the LPSP is demonstrated in Figure 14c. Furthermore, in this study the considered increase in LPSP is taken as 10%, whenever the LPSP is increasing the COE is increasing and vice versa. Additionally, when the SoC of BT (parameter variation) increased by 10% as proposed, the COE increased, as presented in Figure 15d.

7. Conclusions

In this paper, the mode of V2G that can adjust grid load is studied based on sizing the uncertain number of EVs using the SMCM and the effect on the grid load. Electric vehicles (EVs) can be used as loads to absorb excess output or as distributed energy resources to send some of their stored energy back to the grid, according to the Vehicle-to-Grid (V2G) concept. The contributed result was acquired from the use of advanced computer software, which is MATLAB and Microsoft Office Excel, for a hybrid system consisting of EV, RESs (PV and WT), BT, and grid. Additionally, this paper outlines the usage of Photovoltaics (PV) and WT as Renewable Energy Sources (RESs) to address fossil fuel challenges by integrating EVs. Where fossil fuels have begun to decline, causing a slew of power and environmental challenges can be addressed with alternative energy sources. Integration of RESs with other sources solves the limitations faced in power and environmental systems. In order to deal with the complexity of PV-wind hybrid systems, nature-inspired metaheuristic optimization approaches (IALO) were exploited and coupled with RB-EMS to meet the objective functions, and hybrid optimization techniques will be vital. Sensitivity analysis for the most affected sources in the system in terms of power generation (PV and WT) due to the climatology changes and load fluctuation is conducted. Since the scope limitation of this work is considering by implementing the proposed system on residential load using IALO to size the system components coupled with RB-EMS to meet the objective functions. Future suggestions may consider other nature-inspired algorithms to size the system components, such as the Grasshopper Optimization Algorithm (GOA) and Lion Optimization Algorithm (LOA). Estimating the behavior of an EV takes into account other randomness methods, such as the Markov Decision Process (MDP), as well as the integration of another type of storage rather than a single storage, such as the Fuel Cell (FC).

Author Contributions

Conceptualization, A.A. and A.A.S.; methodology, C.W.T.; software, R.A. and F.H.K.; validation, A.A. and M.M.K.; formal analysis, A.A.A.; investigation, A.A.; resources, M.M.K.; data curation, F.H.K.; writing—original draft preparation, A.A.; writing—review and editing, A.A.; visualization, C.W.T.; supervision, C.W.T. and R.A.; project administration, A.A.; funding acquisition, C.W.T. All authors have read and agreed to the published version of the manuscript.

Funding

This research received no external funding.

Institutional Review Board Statement

Not applicable.

Informed Consent Statement

Not applicable.

Data Availability Statement

Not applicable.

Acknowledgments

The first author thanks the Libyan government for supporting this research with a scholarship provided by the Ministry of Higher Education and Scientific Research. The authors appreciate the library facilities given by Universiti Teknologi Malaysia (UTM). Thank you so much to the editors and anonymous reviewers for their valuable input during the peer review. Finally, I’d want to express my gratitude to the colleagues who have contributed to the complexity of this paper in some way, either directly or indirectly.

Conflicts of Interest

The authors declare that they have no known competing financial interests or personal relationships that could have appeared to influence the work reported in this paper.

References

  1. Banerji, A.; Sharma, K.; Singh, R.R. Integrating Renewable Energy and Electric Vehicle Systems into Power Grid: Benefits and Challenges. In Proceedings of the 2021 Innovations in Power and Advanced Computing Technologies (i-PACT), Kuala Lumpur, Malaysia, 27–29 November 2021; pp. 1–6. [Google Scholar] [CrossRef]
  2. Alsharif, A.; Tan, C.W.; Ayop, R.; Ali Ahmed, A.; Mohamed Khaleel, M.; Abobaker, A.K. Power Management and Sizing Optimization for Hybrid Grid-Dependent System Considering Photovoltaic Wind Battery Electric Vehicle. In Proceedings of the 2022 IEEE 2nd International Maghreb Meeting of the Conference on Sciences and Techniques of Automatic Control and Computer Engineering (MI-STA), Sabratha, Libya, 23–25 May 2022; pp. 645–649. [Google Scholar] [CrossRef]
  3. Solanke, T.U.; Ramachandaramurthy, V.K.; Yong, J.Y.; Pasupuleti, J.; Kasinathan, P.; Rajagopalan, A. A review of strategic charging-discharging control of grid-connected electric vehicles. J. Energy Storage 2020, 28, 101193. [Google Scholar] [CrossRef]
  4. Tan, K.M.; Ramachandaramurthy, V.K.; Yong, J.Y. Integration of electric vehicles in smart grid: A review on vehicle to grid technologies and optimization techniques. Renew. Sustain. Energy Rev. 2016, 53, 720–732. [Google Scholar] [CrossRef]
  5. Solanke, T.U.; Khatua, P.K.; Ramachandaramurthy, V.K.; Yong, J.Y.; Tan, K.M. Control and management of a multilevel electric vehicles infrastructure integrated with distributed resources: A comprehensive review. Renew. Sustain. Energy Rev. 2021, 144, 111020. [Google Scholar] [CrossRef]
  6. Goel, S.; Sharma, R.; Rathore, A.K. A review on barrier and challenges of electric vehicle in India and vehicle to grid optimisation. Transp. Eng. 2021, 4, 100057. [Google Scholar] [CrossRef]
  7. Santoso, B.; Wahyu Purwanto, W. Analysis on Business Development and Pricing for Electric Vehicle Charging in Indonesia. In Proceedings of the 2021 3rd International Conference on E-Business and E-commerce Engineering, Sanya, China, 17–19 December 2021; ACM: New York, NY, USA, 2021; pp. 102–107. [Google Scholar] [CrossRef]
  8. Ouramdane, O.; Elbouchikhi, E.; Amirat, Y.; Le Gall, F.; Sedgh Gooya, E. Home Energy Management Considering Renewable Resources, Energy Storage, and an Electric Vehicle as a Backup. Energies 2022, 15, 2830. [Google Scholar] [CrossRef]
  9. Ouramdane, O.; Elbouchikhi, E.; Amirat, Y.; Sedgh Gooya, E. Optimal Sizing and Energy Management of Microgrids with Vehicle-to-Grid Technology: A Critical Review and Future Trends. Energies 2021, 14, 4166. [Google Scholar] [CrossRef]
  10. Mohseni, S.; Brent, A.C.; Burmester, D. A comparison of metaheuristics for the optimal capacity planning of an isolated, battery-less, hydrogen-based micro-grid. Appl. Energy 2020, 259, 114224. [Google Scholar] [CrossRef]
  11. Li, Z.; Khajepour, A.; Song, J. A comprehensive review of the key technologies for pure electric vehicles. Energy 2019, 182, 824–839. [Google Scholar] [CrossRef]
  12. Das, H.S.; Rahman, M.M.; Li, S.; Tan, C.W. Electric vehicles standards, charging infrastructure, and impact on grid integration: A technological review. Renew. Sustain. Energy Rev. 2020, 120, 109618. [Google Scholar] [CrossRef]
  13. Ravi, S.S.; Aziz, M. Utilization of Electric Vehicles for Vehicle-to-Grid Services: Progress and Perspectives. Energies 2022, 15, 589. [Google Scholar] [CrossRef]
  14. Moghaddas-Tafreshi, S.M.; Mohseni, S.; Karami, M.E.; Kelly, S. Optimal energy management of a grid-connected multiple energy carrier micro-grid. Appl. Therm. Eng. 2019, 152, 796–806. [Google Scholar] [CrossRef]
  15. Sadeghi, D.; Hesami Naghshbandy, A.; Bahramara, S. Optimal sizing of hybrid renewable energy systems in presence of electric vehicles using multi-objective particle swarm optimization. Energy 2020, 209, 118471. [Google Scholar] [CrossRef]
  16. Al-Shetwi, A.Q.; Hannan, M.A.; Jern, K.P.; Mansur, M.; Mahlia, T.M.I. Grid-connected renewable energy sources: Review of the recent integration requirements and control methods. J. Clean. Prod. 2020, 253, 119831. [Google Scholar] [CrossRef]
  17. González, L.G.; Siavichay, E.; Espinoza, J.L. Impact of EV fast charging stations on the power distribution network of a Latin American intermediate city. Renew. Sustain. Energy Rev. 2019, 107, 309–318. [Google Scholar] [CrossRef] [Green Version]
  18. Ahmed, A.A.; Alsharif, A.; Triwiyanto, T.; Khaleel, M.; Tan, C.W.; Ayop, R. Using of Neural Network-Based Controller to Obtain the Effect of Hub Motors Weight on Electric Vehicle Ride Comfort. In Proceedings of the 2022 IEEE 2nd International Maghreb Meeting of the Conference on Sciences and Techniques of Automatic Control and Computer Engineering (MI-STA), Sabratha, Libya, 23–25 May 2022; pp. 189–192. [Google Scholar] [CrossRef]
  19. Adam, S.P.; Alexandropoulos, S.-A.N.; Pardalos, P.M.; Vrahatis, M.N. No Free Lunch Theorem: A Review. In Springer Optimization and Its Applications; Springer: Berlin/Heidelberg, Germany, 2019; Volume 145, pp. 57–82. [Google Scholar]
  20. Hussain, K.; Mohd Salleh, M.N.; Cheng, S.; Shi, Y. Metaheuristic research: A comprehensive survey. Artif. Intell. Rev. 2019, 52, 2191–2233. [Google Scholar] [CrossRef] [Green Version]
  21. Yang, X.-S. Nature-Inspired Optimization Algorithms; Elsevier: Amsterdam, The Netherlands, 2014; Volume 118. [Google Scholar]
  22. Dokeroglu, T.; Sevinc, E.; Kucukyilmaz, T.; Cosar, A. A survey on new generation metaheuristic algorithms. Comput. Ind. Eng. 2019, 137, 106040. [Google Scholar] [CrossRef]
  23. Memon, S.A.; Patel, R.N. An overview of optimization techniques used for sizing of hybrid renewable energy systems. Renew. Energy Focus 2021, 39, 1–26. [Google Scholar] [CrossRef]
  24. Mirjalili, S. The Ant Lion Optimizer. Adv. Eng. Softw. 2015, 83, 80–98. [Google Scholar] [CrossRef]
  25. Gandomi, A.H.; Yang, X.-S.; Alavi, A.H. Cuckoo search algorithm: A metaheuristic approach to solve structural optimization problems. Eng. Comput. 2013, 29, 17–35. [Google Scholar] [CrossRef]
  26. Wang, D.; Tan, D.; Liu, L. Particle swarm optimization algorithm: An overview. Soft Comput. 2018, 22, 387–408. [Google Scholar] [CrossRef]
  27. Kılıç, H.; Yüzgeç, U. Improved antlion optimization algorithm via tournament selection and its application to parallel machine scheduling. Comput. Ind. Eng. 2019, 132, 166–186. [Google Scholar] [CrossRef]
  28. Tran, D.D.; Vafaeipour, M.; El Baghdadi, M.; Barrero, R.; Van Mierlo, J.; Hegazy, O. Thorough state-of-the-art analysis of electric and hybrid vehicle powertrains: Topologies and integrated energy management strategies. Renew. Sustain. Energy Rev. 2020, 119, 109596. [Google Scholar] [CrossRef]
  29. Mohamed, O.A.; Masood, S.H. A brief overview of solar and wind energy in Libya: Current trends and the future development. IOP Conf. Ser. Mater. Sci. Eng. 2018, 377, 12136. [Google Scholar] [CrossRef]
  30. Kassem, Y.; Çamur, H.; Aateg, R.A.F. Exploring Solar and Wind Energy as a Power Generation Source for Solving the Electricity Crisis in Libya. Energies 2020, 13, 3708. [Google Scholar] [CrossRef]
  31. Alsuessi, W. General Electric Company of Libya (GECOL). Eur. Int. J. Sci. Technol. 2015, 4, 61–69. [Google Scholar]
  32. Guwaeder, A.; Ramakumar, R. A Study of Grid-connected Photovoltaics in the Libyan Power System. Energy Power 2017, 7, 41–49. [Google Scholar] [CrossRef]
  33. Suntech, Direct Industry. 2014. Available online: https://www.solarproof.com.au/products/STP275S-20Wem/ (accessed on 22 December 2022).
  34. Barakat, S.; Ibrahim, H.; Elbaset, A.A. Multi-objective optimization of grid-connected PV-wind hybrid system considering reliability, cost, and environmental aspects. Sustain. Cities Soc. 2020, 60, 102178. [Google Scholar] [CrossRef]
  35. Iclodean, C.; Varga, B.; Burnete, N.; Cimerdean, D.; Jurchiş, B. Comparison of Different Battery Types for Electric Vehicles. IOP Conf. Ser. Mater. Sci. Eng. 2017, 252, 012058. [Google Scholar] [CrossRef] [Green Version]
  36. Bandopadhyay, J.; Roy, P.K. Application of hybrid multi-objective moth flame optimization technique for optimal performance of hybrid micro-grid system. Appl. Soft Comput. 2020, 95, 106487. [Google Scholar] [CrossRef]
  37. Khan, S.; Mehmood, K.; Haider, Z.; Bukhari, S.; Lee, S.-J.; Rafique, M.; Kim, C.-H. Energy Management Scheme for an EV Smart Charger V2G/G2V Application with an EV Power Allocation Technique and Voltage Regulation. Appl. Sci. 2018, 8, 648. [Google Scholar] [CrossRef] [Green Version]
  38. Hannan, M.A.; Hoque, M.M.; Hussain, A.; Yusof, Y.; Ker, P.J. State-of-the-Art and Energy Management System of Lithium-Ion Batteries in Electric Vehicle Applications: Issues and Recommendations. IEEE Access 2018, 6, 19362–19378. [Google Scholar] [CrossRef]
  39. Alsharif, A.; Tan, C.W.; Ayop, R.; Lau, K.Y.; Dobi, A.M. A rule-based power management strategy for Vehicle-to-Grid system using antlion sizing optimization. J. Energy Storage 2021, 41, 102913. [Google Scholar] [CrossRef]
  40. Alsharif, A.; Wei, T.C.; Ayop, R. Ant Lion Optimization of On-Grid Supported by PV/Wind Considering Libyan Energy. Sci. Proc. Ser. 2021, 3, 9–15. [Google Scholar] [CrossRef]
  41. Hannan, M.A.; Lipu, M.S.H.; Hussain, A.; Mohamed, A. A review of lithium-ion battery state of charge estimation and management system in electric vehicle applications: Challenges and recommendations. Renew. Sustain. Energy Rev. 2017, 78, 834–854. [Google Scholar] [CrossRef]
  42. İnci, M.; Savrun, M.M.; Çelik, Ö. Integrating electric vehicles as virtual power plants: A comprehensive review on vehicle-to-grid (V2G) concepts, interface topologies, marketing and future prospects. J. Energy Storage 2022, 55, 105579. [Google Scholar] [CrossRef]
  43. Bhatti, A.R.; Salam, Z.; Bin Abdul Aziz, M.J.; Yee, K.P. A Comprehensive Overview of Electric Vehicle Charging using Renewable Energy. Int. J. Power Electron. Drive Syst. 2016, 7, 114. [Google Scholar] [CrossRef]
  44. Singh, S.; Singh, M.; Kaushik, S.C. Feasibility study of an islanded microgrid in rural area consisting of PV, wind, biomass and battery energy storage system. Energy Convers. Manag. 2016, 128, 178–190. [Google Scholar] [CrossRef]
  45. Bilal, M.; Alsaidan, I.; Alaraj, M.; Almasoudi, F.M.; Rizwan, M. Techno-Economic and Environmental Analysis of Grid-Connected Electric Vehicle Charging Station Using AI-Based Algorithm. Mathematics 2022, 10, 924. [Google Scholar] [CrossRef]
  46. Sorlei, I.-S.; Bizon, N.; Thounthong, P.; Varlam, M.; Carcadea, E.; Culcer, M.; Iliescu, M.; Raceanu, M. Fuel Cell Electric Vehicles—A Brief Review of Current Topologies and Energy Management Strategies. Energies 2021, 14, 252. [Google Scholar] [CrossRef]
  47. Nunna, H.S.V.S.K.; Battula, S.; Doolla, S.; Srinivasan, D. Energy Management in Smart Distribution Systems with Vehicle-to-Grid Integrated Microgrids. IEEE Trans. Smart Grid 2018, 9, 4004–4016. [Google Scholar] [CrossRef]
  48. Elbaz, A.; Guneser, M.T. Multi-Objective Optimization Method for Proper Configuration of Grid-Connected PV-Wind Hybrid System in Terms of Ecological Effects, Outlay, and Reliability. J. Electr. Eng. Technol. 2021, 16, 771–782. [Google Scholar] [CrossRef]
  49. Duman, A.C.; Erden, H.S.; Gönül, Ö.; Güler, Ö. A home energy management system with an integrated smart thermostat for demand response in smart grids. Sustain. Cities Soc. 2021, 65, 102639. [Google Scholar] [CrossRef]
  50. Alsharif, A.; Tan, C.W.; Ayop, R.; Dobi, A.; Lau, K.Y. A comprehensive review of energy management strategy in Vehicle-to-Grid technology integrated with renewable energy sources. Sustain. Energy Technol. Assess. 2021, 47, 101439. [Google Scholar] [CrossRef]
  51. Wu, X.; Hu, X.; Moura, S.; Yin, X.; Pickert, V. Stochastic control of smart home energy management with plug-in electric vehicle battery energy storage and photovoltaic array. J. Power Sources 2016, 333, 203–212. [Google Scholar] [CrossRef] [Green Version]
  52. Hussain, M.T.; Bin Sulaiman, N.; Hussain, M.S.; Jabir, M. Optimal Management strategies to solve issues of grid having Electric Vehicles (EV): A review. J. Energy Storage 2021, 33, 102114. [Google Scholar] [CrossRef]
  53. Lorestani, A.; Gharehpetian, G.B.; Nazari, M.H. Optimal sizing and techno-economic analysis of energy- and cost-efficient standalone multi-carrier microgrid. Energy 2019, 178, 751–764. [Google Scholar] [CrossRef]
  54. Bouchekara, H.R.E.-H.; Javaid, M.S.; Shaaban, Y.A.; Shahriar, M.S.; Ramli, M.A.M.; Latreche, Y. Decomposition based multiobjective evolutionary algorithm for PV/Wind/Diesel Hybrid Microgrid System design considering load uncertainty. Energy Rep. 2021, 7, 52–69. [Google Scholar] [CrossRef]
  55. Zheng, X.; Yao, Y. Multi-objective capacity allocation optimization method of photovoltaic EV charging station considering V2G. J. Cent. South Univ. 2021, 28, 481–493. [Google Scholar] [CrossRef]
  56. Naghibi, B.; Masoum, M.A.S.; Deilami, S. Effects of V2H Integration on Optimal Sizing of Renewable Resources in Smart Home Based on Monte Carlo Simulations. IEEE Power Energy Technol. Syst. J. 2018, 5, 73–84. [Google Scholar] [CrossRef]
  57. Bibak, B.; Tekiner-Mogulkoc, H. Influences of vehicle to grid (V2G) on power grid: An analysis by considering associated stochastic parameters explicitly. Sustain. Energy Grids Netw. 2021, 26, 100429. [Google Scholar] [CrossRef]
  58. Mortaz, E.; Valenzuela, J. Optimizing the size of a V2G parking deck in a microgrid. Int. J. Electr. Power Energy Syst. 2018, 97, 28–39. [Google Scholar] [CrossRef]
  59. Hunter, B.; Lacey, G.; Dawood, H. Optimisation of locally connected renewables for high power EV charging station. In Proceedings of the 2021 56th International Universities Power Engineering Conference (UPEC), Middlesbrough, UK, 31 August–3 September 2021; pp. 1–6. [Google Scholar] [CrossRef]
  60. Jing, R.; Wang, M.; Zhang, Z.; Liu, J.; Liang, H.; Meng, C.; Shah, N.; Li, N.; Zhao, Y. Comparative study of posteriori decision-making methods when designing building integrated energy systems with multi-objectives. Energy Build. 2019, 194, 123–139. [Google Scholar] [CrossRef]
  61. Emary, E.; Zawbaa, H.M. Feature selection via Lèvy Antlion optimization. Pattern Anal. Appl. 2019, 22, 857–876. [Google Scholar] [CrossRef]
  62. Alsharif, A.; Tan, C.W.; Ayop, R.; Hussin, M.N.; Bukar, A.L. Sizing Optimization Algorithm for Vehicle-to-Grid System Considering Cost and Reliability Based on Rule-based Scheme. ELEKTRIKA 2022, 21, 6–12. [Google Scholar] [CrossRef]
  63. Mathew, M.; Hossain, M.S.; Saha, S.; Mondal, S.; Haque, M.E. Sizing approaches for solar photovoltaic-based microgrids: A comprehensive review. IET Energy Syst. Integr. 2022, 4, 1–27. [Google Scholar] [CrossRef]
  64. Rahman, M.M.; Al-Ammar, E.A.; Das, H.S.; Ko, W. Optimal Design of Grid Connected PV Battery System for Probabilistic EVCS Load. In Proceedings of the 2020 Advances in Science and Engineering Technology International Conferences (ASET), Dubai, United Arab Emirates, 4 February–9 April 2020; pp. 1–6. [Google Scholar] [CrossRef]
  65. Arfeen, Z.A.; Abdullah, M.P.; Sheikh, U.U.; Hamza Sule, A.; Alqaraghuli, H.T.; Kolawole Soremekun, R. Rule-Based Enhanced Energy Management Scheme for Electric Vehicles Fast-Charging Workplace Using Battery Stacks and Solar Power. In Proceedings of the 2020 IEEE International Conference on Power and Energy (PECon), Penang, Malaysia, 7–8 December 2020; pp. 113–118. [Google Scholar] [CrossRef]
  66. Dubarry, M.; Devie, A.; McKenzie, K. Durability and reliability of electric vehicle batteries under electric utility grid operations: Bidirectional charging impact analysis. J. Power Sources 2017, 358, 39–49. [Google Scholar] [CrossRef]
  67. Temiz, A.; Guven, A.N. Assessment of impacts of Electric Vehicles on LV distribution networks in Turkey. In Proceedings of the 2016 IEEE International Energy Conference (ENERGYCON), Leuven, Belgium, 4–8 April 2016; pp. 1–6. [Google Scholar] [CrossRef]
Figure 1. The architecture of the proposed hybrid system.
Energies 16 01358 g001
Figure 2. Load demand of the case study: (a) Seasonal and (b) Annual Counterplot.
Energies 16 01358 g002
Figure 3. Monthly solar irradiance data for the case study.
Energies 16 01358 g003
Figure 4. Monthly ambient temperature data for the case study.
Energies 16 01358 g004
Figure 5. Monthly wind speed data of the case study.
Energies 16 01358 g005
Figure 6. Flowchart of the Vehicle-to-Grid operation using SMCM.
Energies 16 01358 g006
Figure 7. IF-Then conditions operations for SMCM.
Energies 16 01358 g007
Figure 8. Load changes with EV and without EV integration.
Energies 16 01358 g008
Figure 9. System configuration results: (a) Sizing and; (b) objective function COE and REF.
Energies 16 01358 g009
Figure 10. Normal distribution of EV: (a) of arrival; (b) EV arrival time, and; (c) EV departure time.
Energies 16 01358 g010aEnergies 16 01358 g010b
Figure 11. Daily output power from PV, WT, BT, and PL.
Energies 16 01358 g011
Figure 12. SMCM analysis result for the scenarios (RESs2V, No EV, G2V, V2G, BT2V).
Energies 16 01358 g012
Figure 13. Configuration energy contributes.
Energies 16 01358 g013
Figure 14. Sensitivity Analysis: Comparison between P P V and P W T against COE.
Energies 16 01358 g014
Figure 15. Sensitivity Analysis: (a) Comparison of COE and REF of the microgrid system; (b) COE against EV increase; (c) COE against LPSP, and; (d) SoC against the COE.
Energies 16 01358 g015
Table 1. Input components and economic parameters data.
ParametersSpecificationValueUnits
Photovoltaic
[33]
Initial power at STC275W
Initial Cost2.15$/WP
Lifetime25Years
Maintenance cost20$/year
Nominal operating cell temperature45°C
Temperature coefficient−3.7 × 10⁻³¹/°C
Module efficiency16.9%
Replacement cost0$/year
Battery
[34]
Lifetime2Year
Hourly self-discharge rate0.007%/hour
Initial cost280$/kWh
O&M Cost1$/%
Rated capacity45.2kWh
Maximum DOD70%
Max SoC100%
Min SoC30%
Replacement cost280$/year
Maintenance cost5$/year
Converter
[35]
Lifetime15Years
Efficiency92%
Initial cost2500$
Economic parameters details [35]Project lifetime25Years
Inflation rate5%
Interest rate3%
Wind Turbine
[36]
Cut-in wind speed3m/s
Cut-out wind speed25m/s
Rated power of wind turbine7.5kW
Rated wind speed13m/s
Replacement cost0$/unit
Electric Vehicle
[37,38]
Maximum SoC0.95%
Minimum SoC0.2%
Lithium-ion battery250Wh/kg
Electric GridPower importing price (sell)0.05$/kWh
Power exporting price (purchase)0.04$/kWh
Table 2. The proposed Rule-Based-Energy Management Strategy operation modes.
OperationsIfThen
Mode 1
(RESs2V)
P P V ( t ) + P W T ( t ) > P l ( t ) P P V ( t ) + P W T ( t )   t o   P l ( t )   a n d   EV ( t )
Mode 2
(BT2V)
P B T ( t ) > [ P W T ( t ) + P P V ( t )                                                             P l ( t ) ] η i n v P B T ( t ) > [ P W T ( t ) + P P V ( t ) P l ( t ) ] η i n v   t o   P l ( t )   a n d   EV ( t )
Mode 3
(G2V)
E g r i d < EV d e m E g r i d < EV d e m   t o   EV   ( G 2 V )
Mode 4
(V2G)
E g r i d > EV d e m E g r i d > EV d e m   t o   g r i d   ( V 2 G )
Disclaimer/Publisher’s Note: The statements, opinions and data contained in all publications are solely those of the individual author(s) and contributor(s) and not of MDPI and/or the editor(s). MDPI and/or the editor(s) disclaim responsibility for any injury to people or property resulting from any ideas, methods, instructions or products referred to in the content.

