Article

The Relationship between the Low-Carbon Industrial Model and Human Well-Being: A Case Study of the Electric Power Industry

1
State Key Laboratory of Earth Surface Processes and Resource Ecology, Faculty of Geographical Science, Beijing Normal University, Beijing 100875, China
2
Faculty of Geographical Science, Beijing Normal University, Beijing 100875, China
3
College of Resources Science and Technology, Beijing Normal University, Beijing 100875, China
4
Water-Saving Agriculture in Southern Hill Area Key Laboratory of Sichuan Province, Chengdu 610066, China
*
Author to whom correspondence should be addressed.
Energies 2023, 16(3), 1357; https://doi.org/10.3390/en16031357
Submission received: 8 January 2023 / Revised: 18 January 2023 / Accepted: 25 January 2023 / Published: 27 January 2023

Abstract

:
The electric power industry is one of the major industries in terms of carbon dioxide (CO2) emissions, and it is necessary to explore low-carbon green power generation models. In recent years, more research has focused on the difference in carbon emissions in fossil energy versus renewable energy but ignored the impact of energy on human well-being. The life cycle assessment (LCA) method is a better method for assessing the impact of the low-carbon model on human well-being. In this paper, the carbon footprints of coal power plants and photovoltaic power (PV) plants generating 1 Kilowatt hour (kWh) of electricity are compared to analyze the degree of carbon emissions at different stages of the two models, and the environmental impact potential of the two models is analyzed using the LCA method. The differences between the two models in terms of human well-being were analyzed through questionnaires and quantified using the hierarchical analysis method. The impact of the different models on human well-being was compared using LCA method. The results of the study were as follows: the total CO2 emissions from coal-fired power generation at the 1 kWh standard were 973.38 g, while the total CO2 emissions from PV power generation were 91.95 g, and the carbon emission intensity of coal-fired power plants was higher than that of PV power plants. The global warming potential and eutrophication potential of coal-fired power plants were higher than those of PV power plants, and the rest of the indicators were lower than those of PV power plants. The composite human well-being index of PV power plants was 0.613 higher than that of coal-fired power plants at 0.561. The per capita income–global warming potential of PV power plants was higher than that of coal-fired power plants, indicating that PV power plants were a low carbon-emission and high well-being model. In conclusion, the PV power plant model is a low-carbon and high human well-being industrial model that is worthy of application in the Qilian Mountains region. The low-carbon industrial model proposed in this study can have a positive effect on regional ecological environmental protection and human well-being enhancement.

1. Introduction

Energy is the basic condition for a country’s sustainable development and the production of people’s lives. Energy is the most important issue facing all countries in the world. They attach great importance to the development and utilization of energy, especially after the outbreak of the “energy crisis”, putting energy and national security at the same level of importance [1,2]. Although China is rich in resources, due to its large population, its per capita energy holdings are less than the world average. With the per capita holdings of coal resources being 67% of the world average, the per capita holdings of natural gas and oil are only approximately 1/15 of the world average [3]. Nonrenewable resources such as coal, oil and natural gas have been used in large quantities in recent decades, but the resources are limited and cannot be recovered in the short term; therefore, new renewable resources need to be studied to gradually replace fossil energy. In addition to the limited reserves of fossil energy, the combustion and use of fossil energy releases large amounts of greenhouse gases that cause serious environmental impacts [4,5]. The latest IPCC report states that climate change due to increased greenhouse gases is causing many environmental problems, such as retreating glaciers, rising sea levels, reduced biodiversity and increased extreme weather events [6]. Renewable energy is a clean energy source, and people use solar, wind, tidal, biomass and water energy to convert into electricity as a low carbon-emission method of energy utilization [1,7]. Therefore, the vigorous development of renewable energy is very beneficial for low-carbon development. The northwestern region of China is rich in solar radiation and wind energy resources, and the establishment of a large number of wind farms and photovoltaic plants is important for mitigating CO2 emissions in China [8]. The Chinese government has set the goal of reaching a carbon peak by 2030 and carbon neutrality by 2060 [9]. However, China’s electricity is mainly provided by coal power, which has become the main source of carbon emissions. The development of clean energy is important to reduce carbon emissions from China’s power industry.
In recent years, the evaluation of carbon emissions from the electricity industries has gradually become a hot issue in the low-carbon energy industry. There are several methods that can be used to evaluate the carbon emissions of power systems, e.g., the carbon footprint method, the material flow method, the emergy method, and life cycle assessment [10,11,12,13]. The carbon footprint is further divided into two methods: the input–output method and whole life cycle assessment. LCA has the advantage of evaluating the whole life cycle of a product from its “cradle” to its “disposal”, which is a more comprehensive way to assess the environmental impact potential of a product from upstream to downstream industries. This approach is more comprehensive in assessing the environmental impact potential of products from upstream to downstream industries. There are many studies that have used LCA to evaluate coal power plants and PV systems at home and abroad [11,14,15,16,17,18,19,20,21,22]. Examples include carbon emission calculations for stationary PV modules [1] and environmental impact evaluations of PV plant materials [19,22]. Now, more research has evaluated the difference in carbon emissions and environmental impact between fossil energy and renewable energy. However, these studies always ignored the effects of the different energies on the different levels of human well-being. The life cycle assessment (LCA) method is able to assess the carbon footprint and environmental impact of each stage of a power plant, but there are fewer studies using the LCA method to assess human well-being relative to low-carbon models. This study is the first to use LCA to study the relationship between the low-carbon industrial model and human well-being.
Research on the relationship between human well-being and carbon emissions is in its infancy. At present, research on human well-being focuses on health and environmental well-being [23], and the impact of the low-carbon agricultural model on human well-being has been positive [24]. However, few studies focus on the impact of energy on human well-being [25,26]. This study not only focused on human well-being, but also focused on the impact of different energies on human well-being. The impact of the low-carbon energy model on human well-being has important research and practical significance for sustainable development and the improvement of human well-being. Our research area is located in the Qilian Mountains. Located between the Qinghai Tibet Plateau, the Inner Mongolia Plateau and the Loess Plateau, the Qilian Mountains are the core area of the “Belt and Road Initiative” and an important ecological barrier in Northwest China [27,28]. The northern and southern sides of the Qilian Mountains are the Hexi Corridor in Gansu Province and northern Qinghai Province, respectively. Here, solar radiation is strong, as is the passage of the prevailing westerly wind belt, so there are rich solar thermal and wind energy resources [8]. To accelerate the realization of the goal of “carbon peak” and “carbon neutralization”, vigorously developing wind energy and photovoltaic power on both sides of the Qilian Mountains can effectively reduce carbon emissions and promote low-carbon green development. The research objective of this paper is to evaluate which kind of power plant is lower in carbon and whether and how the low-carbon model affects human well-being. Life cycle assessment is used to quantitatively analyze the impact of low-carbon models on well-being and provide effective and reasonable policy recommendations for local low-carbon and high-quality development.

2. Methodology

2.1. Research Methods

In this paper, the carbon footprint method was used to calculate the carbon emissions of coal power plants and photovoltaic power plants, and the life cycle assessment method was used to assess the carbon dioxide and environmental impact of coal power plants and photovoltaic power plants when they generate 1 kWh of electricity.
  • Establish the flow chart of the life cycle assessment
First, it is necessary to list all materials, processes and activities required in the power generation process. The processes related to carbon emissions during the whole life cycle of coal-fired power plants are raw coal mining and processing, coal transportation, boiler burning, tail gas desulfurization, solid waste transportation and solid waste treatment. The processes related to carbon emissions during the whole life cycle of photovoltaic power generation are the solar panel production process and photovoltaic power generation system waste disposal.
2.
Establish the system boundary diagram
The system boundary diagram of the coal power plant is shown in Figure 1, which includes the direct emissions of carbon dioxide during the coal burning process, the emissions of the tail gas desulfurization process and the indirect emissions during the transportation phase. Figure 2 shows the production process flow related to the photovoltaic power generation process and carbon emissions, including industrial silicon production—silicon wafer production—battery chip production—battery module production—balance module production—photovoltaic system power generation—system waste disposal.
3.
Data collection and calculation
The data to be collected by the coal power plant include all substances and activities covered by the product life cycle and relevant carbon emission factors. The emissions are calculated quantitatively by the emission coefficient method and the mass balance method. The production equipment, plant construction, factory workers, transport vehicles, etc., involved in the production process were not included in the study.
The composition of photovoltaic power generation application systems is very complex, including DC combiner boxes and other equipment. This equipment is rarely studied, and inventory data are difficult to collect; they are not the main body, and their contribution to the overall carbon emissions is small, so they do not need to be included in the accounting boundary. Furthermore, the operation and maintenance of photovoltaic power plants consume almost no resources, and there is no emission of pollutants, so there is no need for accounting.
The list of collected data from coal-fired power plants and photovoltaic systems was imported into Gabi9.2 software, an LCA assessment model was established, and the carbon emissions and environmental impact potential of the two models were calculated.

2.2. Data Sources

The data in this paper were obtained from the actual production survey data of the Huaneng Lanzhou Thermal Power Co., Ltd., located in Yuzhong County, Lanzhou city, Gansu Province. The photovoltaic power plant data were obtained from the survey data and literature data of the 50 MW power plant of the Gulang County Zhenye Desert Photovoltaic Power Generation Co., Ltd., Gansu Province. Some production and energy consumption data were provided by the process flow database in Gabi 9.2 software. The raw coal of the coal power plant comes from the Xinjiang Zhundong Coal Plant, with a transportation distance of 1897 km. The main type of transportation means is by train. Table 1 shows the input and output of materials and energy required by coal-fired power plants to generate 1 kwh. The material inputs include standard coal, reclaimed water, electric energy and limestone.
The data of PV panel manufacturing came from He Jinjin’s production data of polysilicon PV panels [1], and the data of inverter, transportation and waste recycling came from [26] (Table 2). Other process flow and energy consumption data were obtained from the Gabi 9.2 database. The main parameters of the polysilicon battery panel are shown in Table 3.

3. Results and Analysis

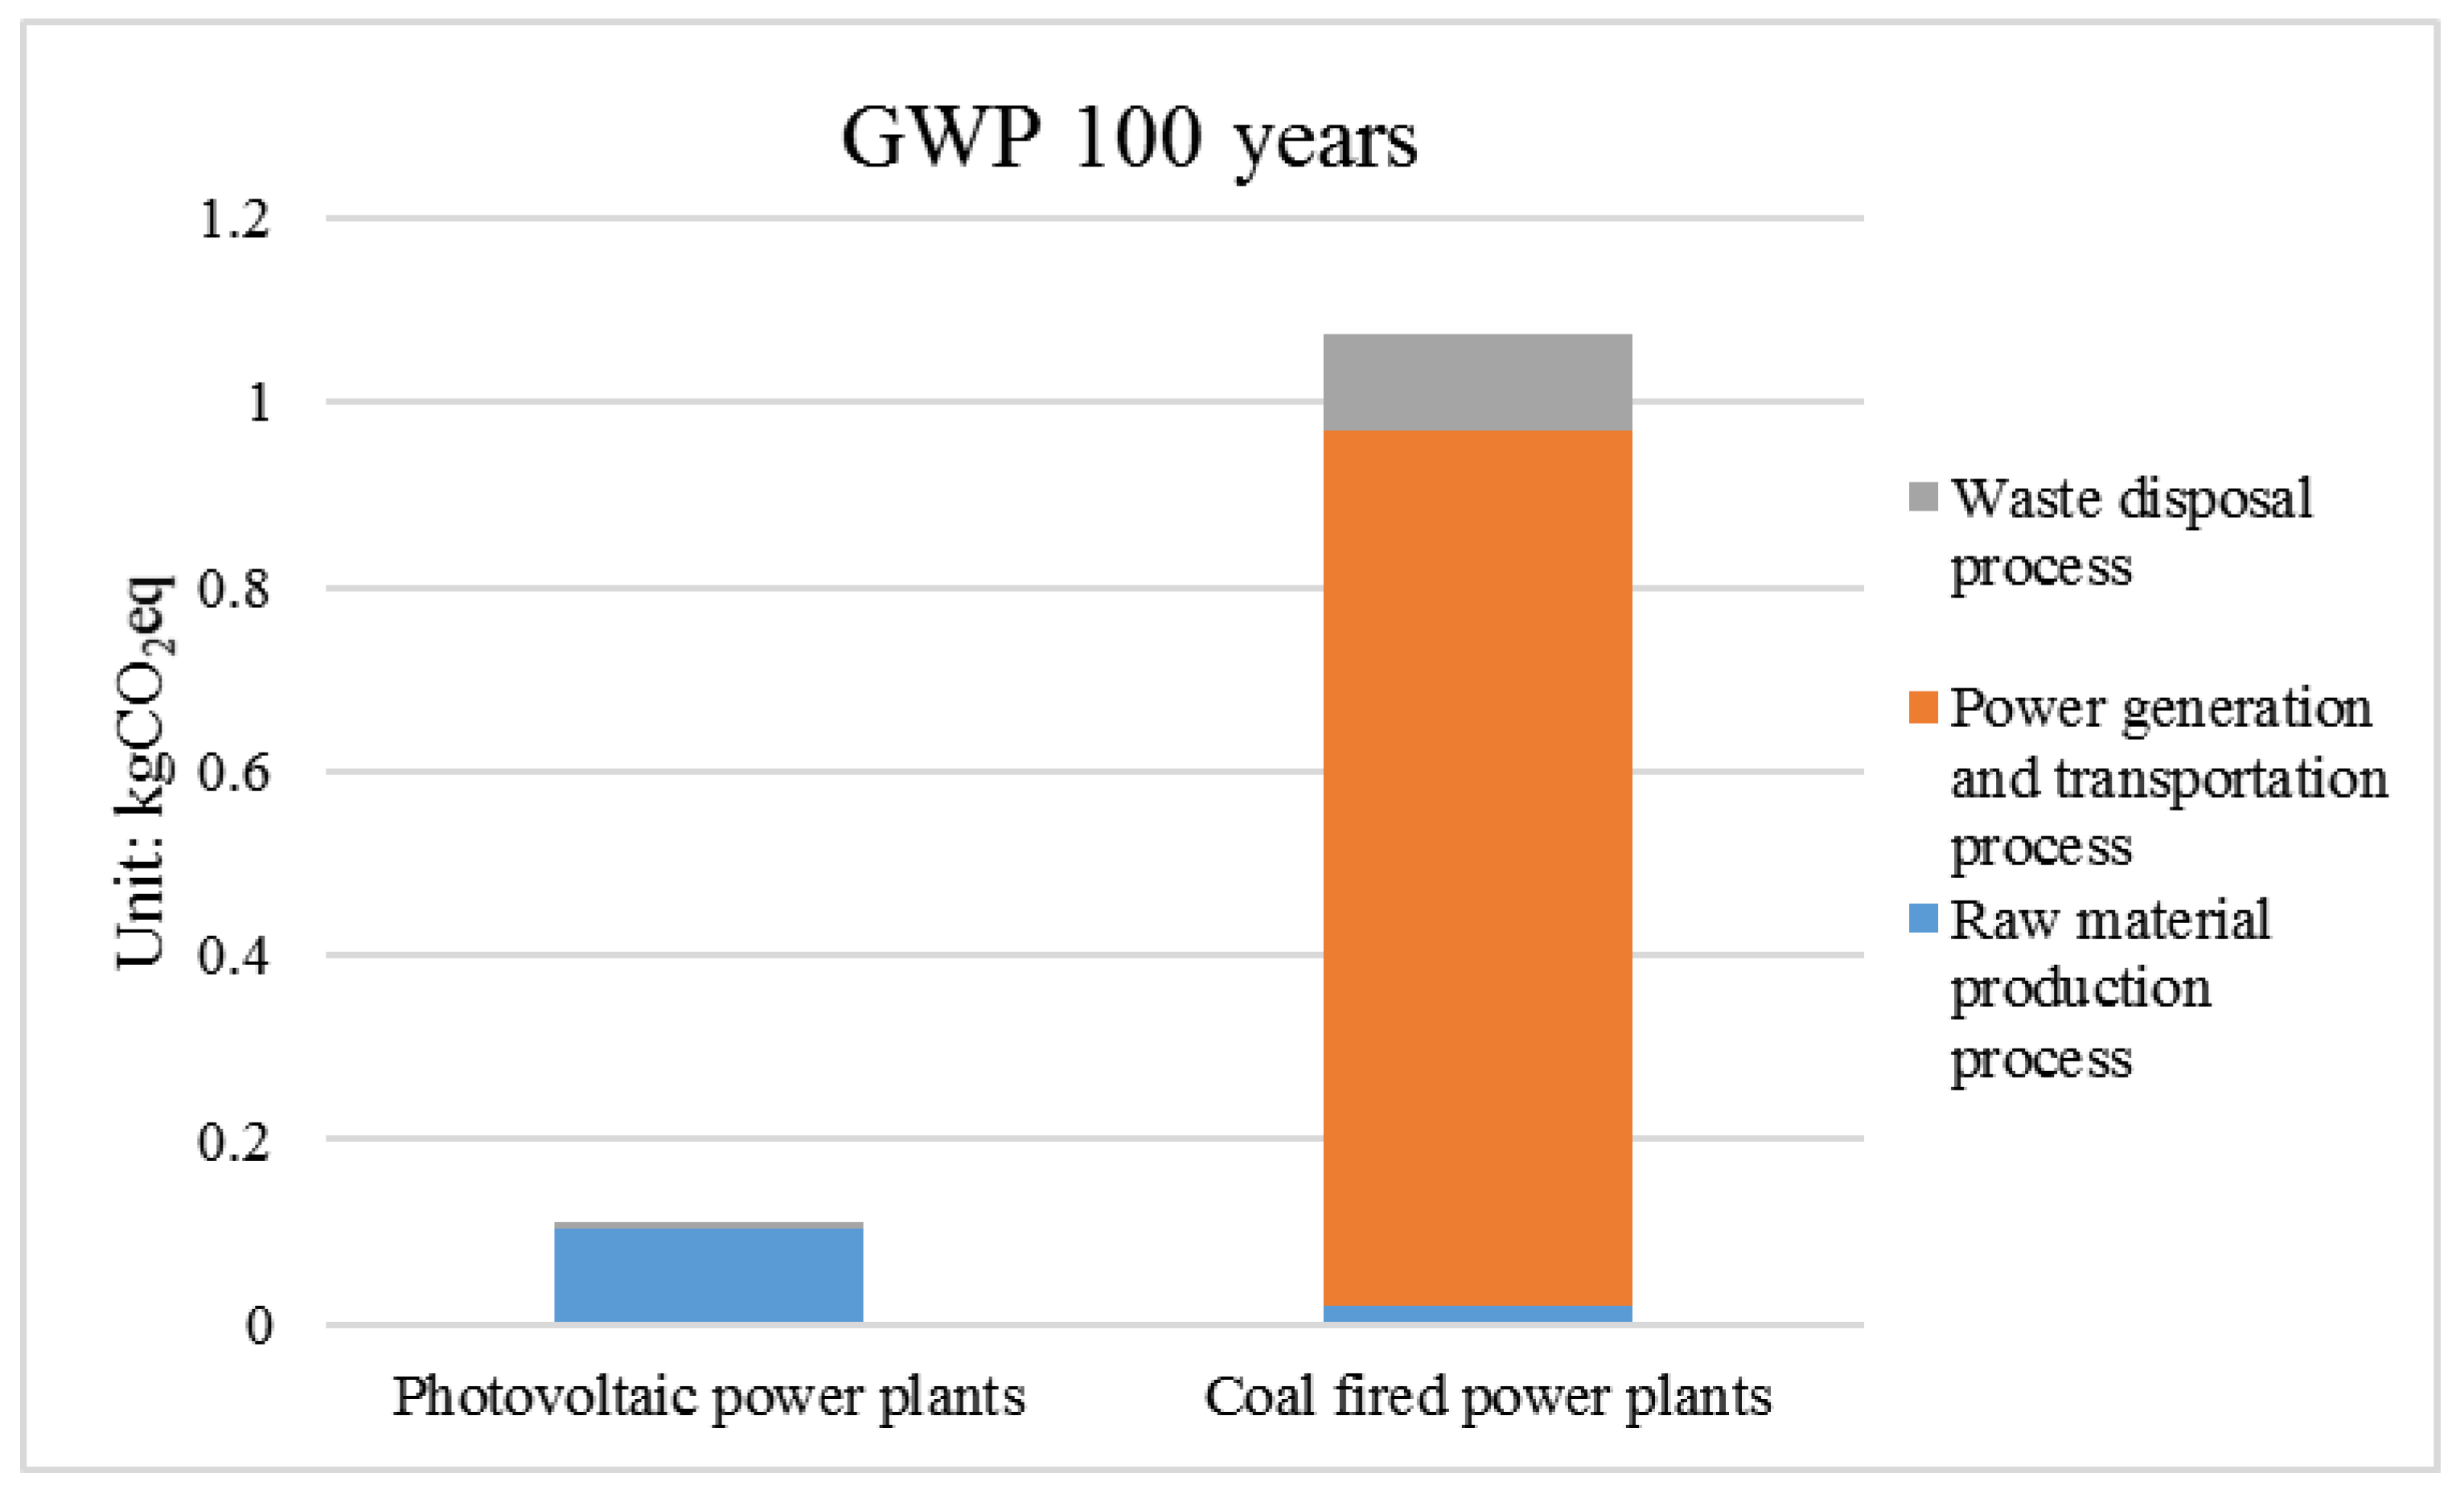
3.1. Comparison of Carbon Emission Results

The power generation process of coal-fired power plants can be divided into three stages: raw coal production process, coal-fired power generation and waste disposal. The photovoltaic power generation process is also considered from the perspective of the whole life cycle, which can be divided into three stages: the photovoltaic panel production process, the photovoltaic power generation and transportation process and photovoltaic component waste disposal. Gabi9.2 software was used to calculate carbon dioxide emissions in three different stages under two power generation modes, and the results are shown in Figure 3.
The results showed that coal-fired power generation had more CO2 emissions than photovoltaic power generation, of which the total CO2 emissions of coal-fired power generation were 973.38 g, while the total CO2 emissions of photovoltaic power generation were 91.95 g, approximately 10 times the total emissions of photovoltaic power generation. In the process of power generation and transportation, the CO2 emission of photovoltaic power generation was 1.26 kg. The CO2 emission of coal-fired power plants in the process of power generation and transportation was 947.4 g, approximately 752 times that of photovoltaic power plants. The CO2 emissions of coal-fired power plants in the process of abandonment were 6.71 g higher than those of photovoltaic power plants. The CO2 emissions of photovoltaic power plants in the raw material production stage were 89.01 g higher than those of coal-fired power plants, by 19.27 g. This was because photovoltaic panel production is a high energy-consuming industry, and its energy consumption is higher than that of coal-fired power plants in the raw material production stage. In addition, the research results show that the carbon footprint of coal-fired power generation is higher than that of photovoltaic and wind power generation in the power generation stage. The carbon footprint of coal-fired power generation is 83.3 g/kWh, while that of photovoltaic power generation is almost zero, and that of wind power generation is 0.019 g/kWh [17].

3.2. LCA Results Analysis

3.2.1. Eigenvalue Analysis

According to the basic data of coal-fired power plants and photovoltaic power plants, this paper calculated three categories and eleven kinds of environmental effects under two power generation modes based on CML 2001, in which Sb is the abbreviation for antimony, R11 is the abbreviation for chlorofluoromethane, Phosphate is used for phosphate, and DCB is the abbreviation for dichlorobenzene. The LCA results are shown in Table 4 and Figure 4. Table 4 shows that the environmental impact potentials of different production links of coal-fired power plants are different, in which the global warming potential (GWP), photochemical ozone generation potential (POCP) and fossil fuel consumption potential (ADP fossil) in the power generation and transportation stages were greater than those in the other two processes. The acidification potential (AP), ozone depletion potential (ODP), nonbiological consumption elements (ADP elements), land and marine ecological toxicity potential (TETP, MAETP) and human potential toxicity (HTP) in the raw material production stage were significantly higher than those in the power generation and transportation stage and waste disposal stage. The eutrophication potential (EP) and freshwater ecotoxicity potential (FAETP) in the waste stage were significantly higher than those in the other two stages, and their acidification potential, ozone depletion potential, human toxicity potential and marine ecotoxicity had negative values. The global warming potential in the power generation and transportation phase was 0.948 kg CO2eq., higher than 0.0206 in the raw material production phase and 0.107 kg CO2eq. In the waste phase, which indicated that the power generation and transportation phase of coal-fired power plants was the main link to greenhouse gas emissions, mainly from the CO2 released by coal combustion.
The LCA result analysis of photovoltaic power plants is shown in Table 5. Among them, GWP was the highest in the raw material production stage, followed by the power generation and transportation stage, and the lowest was in the waste stage. The EP, AP, POCP, ADP fossil, and ADP elements in the raw material production stage and the HTP, MAETP, TAETP, and FAETP were higher than those in the other two processes. The ODP in the waste stage was significantly higher than those in the raw material production process and the power generation and transportation process. In general, the environmental impact of the raw material production process was much higher than that of the other two processes. The main reason is that, compared with the nearly zero emissions of photovoltaic power generation and the emissions and environmental impact of transportation, the production process of industrial silicon and polycrystalline silicon consumes more energy and pollutes more.
Figure 5 shows the contribution rate of the environmental impact potential in each process of the photovoltaic power plant. Figure 5 shows that the contribution rate of the raw material production stage to the environmental impact is relatively high. Other than the ODP, other indicators are higher than those in the waste disposal process and power generation and transportation process. Among them, the contribution rates of the GWP, AD, POCP, ADP elements, ADP fossil and FAETP exceeded 90%. In terms of the TETP, HTP and MAETP, the contribution rate of the raw material production stage was close to 80%, that of the waste stage was less than 20%, and that of the power generation and transportation stage was less than 3%.
Global warming potential (GWP) expresses the potential impact of greenhouse gas emissions on the environment. Through a comparative analysis of the GWP of photovoltaic power plants and coal-fired power plants, it was found that the overall GWP value of coal-fired power plants was 1.17 kg CO2eq, which was higher than the GWP value of photovoltaic power plants of 0.112 kg CO2eq, with a difference of 0.96 kg CO2eq (Figure 6). However, from the perspective of each production stage, the GWP value of photovoltaic power plants in the raw material production stage was higher than that of coal-fired power plants, with a difference of 0.083 kg CO2eq. The GWP of coal-fired power plants in the power generation transportation and waste disposal stage was significantly higher than that of photovoltaic power plant stage, with differences of 0.963 kg CO2eq and 0.09 kg CO2eq, respectively. In the raw material production stage, the GWP of photovoltaic power plants was higher than that of coal-fired power plants, which was consistent with the performance of carbon dioxide emissions (Figure 6). The main reason is that the production energy consumption of photovoltaic components is higher than that of coal-fired power plants in the raw coal production process. In general, the GWP of coal-fired power plants is much higher than that of photovoltaic power plants, mainly due to the large amount of carbon dioxide released during coal combustion.

3.2.2. Standardized Value Analysis

The standardized LCA results of coal-fired power plants and photovoltaic power plants are shown in Table 6. In the raw material production stage, all indicators of photovoltaic power plants were higher than those of coal-fired power plants. The global warming potential of photovoltaic power plants was 2.22 × 10⁻¹⁴ kg CO2eq, while that of coal-fired power plants was 4.43 × 10⁻¹⁵ kg CO2eq, with a difference of 1.78 × 10⁻¹⁴ kg CO2eq. In the power generation and transportation stage, some indicators of coal-fired power plants were higher than those of photovoltaic power plants, mainly including the GWP, AP, EP, ODP, POCP and ADP elements. The global warming potential of coal-fired power plants was 2.09 × 10⁻¹³ kgCO2eq, while that of photovoltaic power plants was 3.01 × 10⁻¹⁶ kg CO2eq, 693 times the latter, with a difference of 2.08 × 10⁻¹³ kgCO2eq. Other indicators such as fossil fuel consumption potential, land, sea and water ecological toxicity potential and human toxicity potential were higher in photovoltaic power plants than in coal-fired power plants. In the waste treatment stage, the AP, ODP, HTP and MAETP of coal-fired power plants were negative, indicating that the waste treatment of coal-fired power plants in this stage has a weak impact on some of the environment. In addition, many indicators of coal-fired power plants were higher than those of photovoltaic power plants in the abandonment stage, mainly including GWP, EP, POCP, FAETP and TETP. In general, the GWP and EP of coal-fired power plants were higher than those of photovoltaic power plants, and other indicators were lower than those of photovoltaic power plants.

3.3. Comparison of Employee Well-Being in Coal-Fired Power Plants and Photovoltaic Power Plants

3.3.1. Basic Characteristics of Employee Well-Being in Coal-Fired Power Plants and Photovoltaic Power Plants

In this paper, the multi-index comprehensive evaluation method [29] was used to evaluate the well-being of employees in coal-fired power plants and photovoltaic power plants. Thirty and seventeen questionnaires were randomly distributed to employees of coal-fired power plants and photovoltaic power plants, respectively, and thirty and seventeen questionnaires were actually received. The average values of employee well-being indicators of coal-fired power plants and photovoltaic power plants were calculated (Table 7). Table 7 shows that there are differences in the well-being of employees in coal-fired power plants and photovoltaic power plants, mainly reflected by the basic living conditions required to maintain a high-quality life, safety and good social relations. From the perspective of economic living standards, the per capita monthly income of photovoltaic power plant employees is 4019 yuan, which is higher than the per capita monthly income of coal-fired power plant employees, which is 2819 yuan. In terms of energy consumption, employees of coal-fired power plants mainly consume natural gas, while employees of photovoltaic power plants mainly consume coal. The power consumption per capita of photovoltaic power plant employees is 592.6 kWh, which is higher than the 460.5 kWh value for coal-fired power plant employees, but the heating cost per capita of coal-fired power plant employees is higher than that of photovoltaic power plants. From the perspective of housing conditions, the per capita housing area of PV power plant employees is 36.7 m2, which is higher than the 33.3 m2 of coal-fired power plants. From the perspective of the distance between the residence and the company, the employees of photovoltaic power plants have a much greater distance than that of employees of coal-fired power plants. The proportion of employees participating in “five insurances and one fund” in photovoltaic power plants was slightly higher than that in coal-fired power plants. In terms of health, the indicators of coal-fired power plants and photovoltaic power plants were basically the same. From the perspective of safety, the residential safety satisfaction of employees in coal-fired power plants was relatively satisfactory, higher than that in photovoltaic power plants. There were differences in good social relations between the employees of the two enterprises. The proportion of employees above senior high school level in coal-fired power plants was slightly higher than that in photovoltaic power plants, but in terms of the number of family dependents, photovoltaic power plants had more than coal-fired power plants.
The basic socioeconomic characteristics of employees in coal-fired power plants and photovoltaic power plants are shown in Table 8. From the perspective of gender, the proportion of male employees in coal-fired power plants was 80%, slightly higher than that in photovoltaic power plants. From the perspective of age, the employees of coal-fired power plants were mainly young employees aged 18–30, accounting for 50%. The employees of photovoltaic power plants were also young employees aged 18–30, accounting for 41.2%. From the ethnic perspective, there were more than 80% Han employees in coal-fired power plants and photovoltaic power plants, and 20% were Hui. From the perspective of annual income, 60% of employees in coal-fired power plants had an income of 30,000 to 50,000 yuan; 36.7% had an income of 10,000 to 30,000 yuan; and only 3.3% had an income of 50,000 to 100,000 yuan. This is compared to photovoltaic power plants, where 47% of employees earned 50,000 yuan to 100,000 yuan; 41.2% earned 10,000 yuan to 30,000 yuan; and 11.8% earned 30,000 yuan to 50,000 yuan. From the purchase of “five insurances and one fund”, more than 80% of the employees of the two power generation enterprises had “five insurances and one fund”. There was a significant difference in the number of employee families in coal-fired power plants and photovoltaic power plants. The number of employee families in coal-fired power plants was mainly three and four, accounting for 46.7%, while the number of employees in photovoltaic power plants was more than five, accounting for 58.8%. From the perspective of education level, the highest proportion of employees in coal-fired power plants was 46.7% (Bachelor or college), and the highest proportion of employees in photovoltaic power plants was 70.6% (junior college).

3.3.2. Study of the Relationship between Low-Carbon Industrial Models and Human Well-Being

To better compare the relationship between the environmental impact potential and per capita income (income) of different models, the per capita income–environmental benefits were used to analyze the dual role of human well-being and the environment in different models, so the per capita income under different scenarios was divided by the corresponding LCA indicators to obtain the per capita income–environmental benefit values under both models (Table 9). The environmental impacts of per capita income on atmospheric and water resources were explained by income–acidification potential (IAP), income–global warming potential (IGWP), income–photochemical ozone production potential (IPOCP), income–ozone-depletion potential (IODP) and income–eutrophication potential (IEP). Higher IGWP values in this model indicated lower carbon emissions and higher well-being. Additionally, we used income–freshwater aquatic ecotoxicity (IFAETP), income–human toxicity potential (IHTP), income–marine aquatic ecotoxicity potential (IMAETP) and income–terrestrial ecotoxicity potential (ITETP) to explain the effect of income on toxicity indicators. The results of the study showed that the IGWP values of PV plants were higher than those of coal-fired plants, indicating that PV plants were a low-carbon emissions and high welfare model. The IEP values of PV plants were higher than those of coal-fired plants. Other indicators, such as IAP, IPOCP, IODP, IFAETP, IHTP, IMAETP and ITETP, were higher for coal-fired plants than for PV plants.

3.3.3. Comparison of Comprehensive Human Well-Being Index

The analytic hierarchy process (AHP) was used to determine the weight of each index in the comprehensive evaluation index system of employee well-being. The subjective satisfaction index was calculated according to the subjective evaluation of employees, and the range standardization method was used to standardize the specific data of each index [29,30,31].
Table 10 shows the comparative results of the comprehensive human well-being index of employees in coal-fired power plants and photovoltaic power plants. From the perspective of the basic living conditions required to maintain a high-quality life, the overall well-being of employees of the two enterprises was the same, but the economic living standard score of employees of photovoltaic power plants was 0.082, higher than that of coal-fired power plants by 0.07. The network communication of employees of photovoltaic power plants was also higher than that of coal-fired power plants, while the housing conditions and energy consumption of employees of coal-fired power plants were higher than those of photovoltaic power plants. In terms of health, the overall health and well-being was 0.281 higher than the value of 0.187 at coal-fired power plants, and each indicator of photovoltaic power plant employees was higher than that at coal-fired power plants. From the perspective of safety and welfare, the overall value of coal-fired power plants was 0.118, which was higher than that of photovoltaic power plants at 0.095. From the perspective of good social relations, the welfare of employees in coal-fired power plants was 0.081 higher than that in photovoltaic power plants (0.061), mainly because the social relations, family burden and family status satisfaction of employees in coal-fired power plants were higher than those in photovoltaic power plants. The final comprehensive human well-being index of photovoltaic power plants was 0.613, which was higher than the value of 0.561 for coal-fired power plants.

4. Discussion

4.1. Discussion on The Low-Carbon Industrial Model

Many studies have shown that the carbon emissions of power generation using clean energy such as solar energy and wind power are much lower than those of traditional thermal power generation [1,17,20,32]. However, from the perspective of production and construction, the carbon footprint of photovoltaic and wind power generation is higher than that of coal-fired power generation [17]. This study also draws a similar conclusion; that is, in the raw material production stage, the carbon emissions of photovoltaic power plants are higher than those of coal-fired power plants, but the amount of carbon dioxide released by coal-fired power plants is much higher than that of photovoltaic power plants. The photovoltaic power station studied in this paper is located at the southwest edge of the Tengger Desert in Gulang County. The development of the desert photovoltaic industry not only has significant economic benefits but also has the ecological function of sand prevention and control [33]. The desert area and the Gobi in the Hexi Corridor on the north side of the Qilian Mountains is vast, and desert photovoltaics are expected to become a new way to control desertification.
The global warming potential of coal-fired power plants is also significantly higher than that of photovoltaic power generation and wind power generation [12,17]. Research shows that the global warming and eutrophication potential of coal-fired thermal power plants is higher than that of photovoltaic power plants when generating 1 kWh of electricity [12]. Similar results were obtained in this study, indicating that the environmental impact of coal-fired power plants is not always higher than that of photovoltaic power plants, mainly because photovoltaic panels are high in energy consuming and high polluting in the production process.

4.2. Relationship between the Low-Carbon Industrial Model and Human Well-Being

Our industrial model is in urgent need of transformation. With the proposal of a low-carbon economy, a low-carbon industry has become the direction of industrial development [34]. The low-carbon industrial model in this study focuses on clean energy power generation and studies the impact of photovoltaic power plants on employee well-being. Compared with the per capita income of employees in coal-fired photovoltaic power plants, the global warming potential benefits were higher, indicating that photovoltaic power plants provide higher economic well-being for employees with lower carbon emissions, making it a low-carbon and high well-being model. In addition to the low-carbon industrial model, enterprises focusing on low-carbon circular agriculture and animal husbandry can effectively improve the local level of well-being [24].
An American study shows that energy trade unions have responded to the sudden closure of fossil fuel plants, quickly organizing teams to provide transitional services for workers who have lost their jobs, as well as establishing strong state alliances. They are addressing climate change issues according to the terms of the Green New Deal, linking decarburization, job creation and the reduction of social inequality [35]. Energy workers must participate in policy formulation because they are familiar with energy technology, understand the energy industry, and understand the opportunities and risks faced by workers involved in the low-carbon energy transition [36]. A study on the dynamic evolution of global natural and social systems shows that the use of fossil fuels and biomass cannot promote the sustainable development of billions of people on a planet with limited natural resources. In addition to reducing the global demand for energy, the widespread use of renewable energy alone can pave the way for a sustainable future for a developed global society. Therefore, expanding the current framework through the use of renewable energy is a priority for the development of future models [37]. The development and utilization of renewable energy can not only solve the energy crisis but also increase employment opportunities and encourage people to form a green and low-carbon lifestyle, which is generally conducive to the improvement of human well-being. In the face of the transformation of traditional industries, governments or trade unions should play a transitional role in providing more choices and help with the reemployment of energy workers.
The disadvantage of this study is that it does not consider the relationship between low-carbon models and human well-being at the regional and national scales. The relationship between the low-carbon model and human well-being on the macroeconomic scale is also the focus and is difficult to research. In addition to the subjective part of human well-being, the response of objective well-being to the low-carbon model is a main direction of future research.

5. Conclusions

This paper calculated the carbon emissions and environmental impacts of coal-fired power plants and photovoltaic power plants through the carbon footprint method and the LCA method and conducted a comparative analysis of human well-being in the two power generation models. The following conclusions were drawn.
(1) The overall carbon emission intensity of coal-fired power plants was higher than that of photovoltaic power plants. The carbon emissions of coal-fired power plants in the power generation process were much higher than those of photovoltaic power plants, but the carbon emissions of photovoltaic power plants in the raw material stage were higher than those of coal-fired power plants. The main reason is that photovoltaic power plants have high energy consumption and high carbon emissions in the raw material production stage. The LCA results showed that the GWP value of coal-fired power plants was 1.17 kg CO2eq, which was higher than that of photovoltaic power plants. The global warming potential and eutrophication potential of coal-fired power plants were higher than those of photovoltaic power plants, while other indicators were lower than those of photovoltaic power plants.
(2) There were differences in employee well-being between coal-fired power plants and photovoltaic power plants. The comprehensive human well-being index and per capita income global warming potential of photovoltaic power plants were higher than those of coal-fired power plants. In summary, photovoltaic power generation enterprises not only promote carbon dioxide emission reduction but also have higher employee well-being than coal-fired power generation enterprises, indicating that photovoltaic power generation enterprises are an industrial model of low carbon and high well-being. It is recommended to vigorously promote the photovoltaic low-carbon industrial model on both sides of the Qilian Mountains.
(3) In the face of “dual carbon” strategic demand, coal-fired power plants need to efficiently use coal, reduce production energy consumption, and develop carbon capture technology. The photovoltaic power generation industry needs to reduce energy consumption, carbon emissions, and pollution in the production phase of photovoltaic panels and increase the recycling rate of panels. It is suggested that the coal power industry accelerate the improvement of coal combustion efficiency, optimize desulfurization and denitrification technologies and implement energy conservation and emission reduction plans from management, operation, technology and safety aspects. At present, this study only considered the impact of the low-carbon industrial model on per capita income. The future research will focus on the relationship and driving force analysis between the low-carbon model and human well-being.

Author Contributions

Y.Z. (Ying Zhang): conceptualization, methodology, software, formal analysis, writing original draft. X.D.: conceptualization, supervision, funding acquisition, project administration, writing-review and editing. X.W.: methodology, writing-review and editing. P.Z. and M.L.: formal analysis, writing-review and editing. Y.Z. (Yufang Zhang), R.X.: investigation, data curation. All authors have read and agreed to the published version of the manuscript.

Funding

This work was funded by the Second Tibetan Plateau Scientific Expedition and Research Program (STEP) (2019QZKK0608), the National Natural Science Foundation of China (42171275) and the China Science & Technology Supporting Program (2017YFE0100400).

Data Availability Statement

Not applicable.

Conflicts of Interest

The authors declare no conflict of interest.

References

  1. He, J. Study on Carbon Emission of Photovoltaic Power Generation Based on Life Cycle Assessment. Master’s Thesis, Nanjing University of Aeronautics and Astronautics, Nanjing, China, 2017. [Google Scholar]
  2. Brosemer, K.; Schelly, C.; Gagnon, V.; Arola, K.L.; Pearce, J.M.; Bessette, D.; Olabisi, L.S. The energy crises revealed by COVID: Intersections of Indigeneity, inequity, and health. Energy Res. Soc. Sci. 2020, 68, 101661. [Google Scholar] [CrossRef] [PubMed]
  3. Information Office of the State Council, China. China’s Energy Policy; People’s Publishing House: Beijing, China, 2012; pp. 4–8.
  4. Destek, M.A.; Sinha, A. Renewable, non-renewable energy consumption, economic growth, trade openness and ecological footprint: Evidence from organisation for economic Co-operation and development countries. J. Clean Prod. 2020, 242, 118537. [Google Scholar] [CrossRef]
  5. Didenko, I.; Volik, K.; Vasylieva, T.; Lyeonov, S.; Antoniuk, N. Migration, environment, and country safety: Analysis of touchpoints. E3S Web Conf. 2020, 202, 03028. [Google Scholar] [CrossRef]
  6. IPCC. Climate Change 2021: The Physical Science Basis.Contribution of Working Group I to the Sixth Assessment Report of the Intergovernmental Panel on Climate Change; Cambridge University Press: Cambridge, UK, 2021. [Google Scholar]
  7. Zhao, X.; Luo, D. Driving force of rising renewable energy in China: Environment, regulation and employment. Renew. Sust. Energ. Rev. 2017, 68, 48–56. [Google Scholar] [CrossRef]
  8. Wang, Z.; Shen YZhang, Y.; Ding, Q. Annual Outlook of China’s Wind and Solar Energy Resources in 2021. 2022. Available online: http://www.cma.gov.cn/zfxxgk/gknr/qxbg/202204/t20220429_4798342.html (accessed on 28 April 2022).
  9. Cheng, J.; Tong, D.; Zhang, Q.; Liu, Y.; Lei, Y.; Yan, G.; Yan, L.; Yu, S.; Cui, R.Y.; Clarke, L.; et al. Pathways of China’s PM2.5 air quality 2015–2060 in the context of carbon neutrality. Natl. Sci. Rev. 2021, 8, nwab078. [Google Scholar] [CrossRef]
  10. Guo, X.; Lin, K.; Huang, H.; Li, Y. Carbon footprint of the photovoltaic power supply chain in China. J. Clean Prod. 2019, 233, 626–633. [Google Scholar] [CrossRef]
  11. Liu, Y.; Shi, H.; Zeng, X. A Life-Cycle Carbon Footprint Assessment of Electric Power Companies. Resour. Sci. 2011, 33, 653–658. [Google Scholar]
  12. Yi, Y. Comparison of Material Flow and Energy Flow between PV Power Generation and Thermal Power Generation; Shan Dong University: Jinan, China, 2018. [Google Scholar]
  13. Alizadeh, S.; Avami, A. Development of a framework for the sustainability evaluation of renewable and fossil fuel power plants using integrated LCA-emergy analysis: A case study in Iran. Renew. Energ. 2021, 179, 1548–1564. [Google Scholar] [CrossRef]
  14. Zak, P.; Hrdina, D.; Kudlacek, I. Comparison of Technical and Environmental Performance of Photovoltaic Panels. In Proceedings of the 13th International Scientific Conference on Electric Power Engineering (EPE), Brno, Czech Republic, 23–25 May 2012. [Google Scholar]
  15. Liu, S.; Mao, X.; Xing, Y. Estimation and Comparison of Greenhouse Gas Mitigation Potential of New Energy by Life Cycle Assessment in China. Adv. Clim. Chang. Res. 2012, 8, 48–53. [Google Scholar] [CrossRef]
  16. Xie, Z.; Ma, X.; Huang, Z.; Liao, Y. Life cycle assessment of photovoltaic electricity generation. Environ. Pollut. Control 2013, 35, 106–110. [Google Scholar]
  17. Jia, Y.; Wang, J.; Han, Z.; Pang, Y.; An, P. Analysis on Environmental Load of Wind, PV and Coal-fired Power Generation Based on Life Cycle Assessment. J. Chin. Soc. Power Eng. 2016, 36, 1000–1009. [Google Scholar]
  18. Wang, N.; Ren, Y.; Zhu, T.; Meng, F.; Wen, Z.; Liu, G. Life cycle carbon emission modelling of coal-fired power: Chinese case. Energy 2018, 162, 841–852. [Google Scholar] [CrossRef]
  19. Piasecka, I.; Bałdowska-Witos, P.; Piotrowska, K.; Tomporowski, A. Tomporowski Eco-Energetical Life Cycle Assessment of Materials and Components of Photovoltaic Power Plant. Energies 2020, 13, 1385. [Google Scholar] [CrossRef] [Green Version]
  20. Zhang, J.; Zhu, G. Comparative Study on Life Cycle Assessment of Photovoltaic Power Generation and Coal fired Power Generation. Environ. Sci. Manag. 2014, 39, 86–90. [Google Scholar]
  21. Song, J.; Lin, P.; Zhang, Z.; Huang, R.; Zhang, J.; Gao, P. Life Cycle Assessment and Environmental Collaborative Development of New Energy Power Generation—A Case Study of New Energy Power Generation in Gansu Province. Resour. Util. China 2020, 38, 170–175. [Google Scholar]
  22. Yan, H.; Feng, L. Comprehensive Benefit Analysis of Photovoltaic Sand Control Based on EROI. Ecol. Econ. 2020, 36, 170–175. [Google Scholar]
  23. Liu, M.; Wei, H.; Dong, X.; Wang, X.-C.; Zhao, B.; Zhang, Y. Integrating Land Use, EcosystemService, and Human Well-Being: A Systematic Review. Sustainability 2022, 14, 6926. [Google Scholar] [CrossRef]
  24. Zhang, Y.; Dong, X.; Wang, X.C.; Liu, M.; Zhang, P.; Liu, R.; Huang, J.; Dong, S. Study on the Relationship between Low-Carbon Circular Farming and Animal Husbandry Models and Human Well-Being: A Case Study of Yongchang County, Gansu Province. Sustainability 2022, 14, 8230. [Google Scholar] [CrossRef]
  25. Can, B.; Ahmed, Z.; Ahmad, M.; Can, M. Do renewable energy consumption and green trade openness matter for human well-being? Empirical evidence from European Union countries. Soc. Indic. Res. 2022, 164, 1043–1059. [Google Scholar]
  26. Li, Q.; Chen, H. The Relationship between Human Well-Being and Carbon Emissions. Sustainability 2021, 13, 547. [Google Scholar] [CrossRef]
  27. Wang, T.; Gao, F.; Wang, B.; Wang, P.; Wang, Q.; Song, H.; Yin, C. Status and suggestions on ecological protection and restoration of Qilian Mountains. J. Glaciol. Geocryol. 2017, 39, 229–234. [Google Scholar]
  28. Zhang, C.N.; Zhang, Y. Evaluation of ecosystem service value of qilian mountain national park in qinghai province. Environ. Prot. 2019, 47, 41–47. [Google Scholar]
  29. Yu, X.; Fu, D. Summary of Comprehensive Evaluation Methods of Multiple Indexes. Stat. Decis. 2004, 11, 119–121. [Google Scholar]
  30. Cai, G.Y.; Yin, X.J.; Zhao, J.R. Recognition and comprehensive evaluation of human well-being in Qinghai Lake basin. J. Glaciol. Geocryol. 2014, 36, 469–478. [Google Scholar]
  31. Hall, J.; Giovannini, E.; Morrone, A.; Ranuzzi, G. A Framework to Measure the Progress of Societies; Statistics Directorate Working Paper No.34; OECD Publishing: Paris, France, 2010. [Google Scholar]
  32. Li, J.; Li, S.; Wu, F. Research on carbon emission reduction benefit of wind power project based on life cycle assessment theory. Renew. Energ. 2020, 155, 456–468. [Google Scholar] [CrossRef]
  33. Chang, Z.; Liu, S.; Wang, Q.; Wang, F.; Sun, T.; Liu, S.; Wang, F. The ecological function of desert and Gobi photovoltaic industry in sand control and sand management—Gansu Hexi Corridor as an example. Ecol. Econ. 2018, 34, 199–202+208. [Google Scholar]
  34. Zhou, N. Connotation and evaluation of low-carbon industry. Poyang Lake Acad. J. 2012, 01, 24–30. [Google Scholar]
  35. Cha, J.M.; Price, V.; Stevis, D.; Vachon, T.E.; Brescia-Weiler, M. Workers and Communities in Transition: Report of the Just Transition Listening Project; Labor Network for Sustainability: Takoma Park, MD, USA, 2021. [Google Scholar]
  36. Sicotte, D.M.; Joyce, K.A.; Hesse, A. Necessary, welcome or dreaded? Insights on low-carbon transitions from unionized energy workers in the United States. Energy Res. Soc. Sci. 2022, 88, 102511. [Google Scholar]
  37. Nitzbon, J.; Heitzig, J.; Parlitz, U. Sustainability, collapse and oscillations in a simple World-Earth model. Environ. Res. Lett. 2017, 12, 074020. [Google Scholar] [CrossRef] [Green Version]
Figure 1. System boundary diagram of a coal-fired power plant.
Energies 16 01357 g001
Figure 2. Boundary diagram of the photovoltaic power generation system.
Energies 16 01357 g002
Figure 3. Comparison of CO2 emissions from coal-fired power generation and photovoltaic power generation.
Energies 16 01357 g003
Figure 4. Contribution rate of the environmental impact potential in each process of coal-fired power plants.
Energies 16 01357 g004
Figure 5. Contribution rate of the environmental impact potential of photovoltaic power plants at each stage.
Energies 16 01357 g005
Figure 6. Comparison of global warming potential in coal-fired power plants and photovoltaic power plants.
Energies 16 01357 g006
Table 1. Input and output of materials and energy required for coal-fired power plants to generate 1 kwh.
Material and Energy InputQuantityMaterial and Energy OutputQuantity
Power generation stage of coal-fired power plantStandard coal /kg0.353CO2/kg0.947
recycled water /kg0.325Fly ash /kg0.133
electric energy /MJ0.150slag /kg0.028
limestone /kg9.76 × 10−3SO2/kg4.93 × 10−5
NOX/kg1.17 × 10−4
smoke /kg3.59 × 10−6
Power generation/MJ3.60
Heating capacity/MJ4.35
Note: The density of recycled water is 1.0 × 10³ kg/m³.
Table 2. Data list of the 1 kWp solar panel.
Materials and Energy Consumption at Each StageMaterial InputMaterial Output
Industrial silicon productionmaterialvaluematerialvalue
silica /(kg*kg−1)27.85CO2/kg48.15
charcoal /(kg*kg−1)4.27NOx/kg2
petroleum coke /(kg*kg−1)7.2SiO2/kg2.82
graphite electrode /(kg*kg−1)0.69solid waste/kg7.24
wood chips /(kg*kg−1)4.08SO2/kg7.34
bituminous coal /(kg*kg−1)1.68industrial silicon/kg10.2
circulating water /(kg*kg−1)1836.2
electricity consumption /(kW*h*kg−1)119.28
Polysiliconindustrial silicon /(kg*kg−1)10.2solid waste/kg1.75
hydrogen /(kg*kg−1)0.68Hydrogen chloride/kg0.91
chlorine /(kg*kg−1)9.13COD/g 35.08
NaOH/(kg*kg−1)448.99SS/g39.42
electricity consumption /(kW*h*kg−1)875.15sludge/g142.08
cooling water /(kg*kg−1)1642.24chloride/g11.02
polysilicon/kg7.61
Silicon waferpolysilicon /(kg*kg−1)7.61silicon wafer/kg240.72
silicon carbide /(kg*kg−1)15.38waste cutting fluid/kg3.71
quartz crucible /(kg*kg−1)2.28solid waste/kg0.067
steel wire /(kg*kg−1)8.71COD/kg2.85
argon /(kg*kg−1)1.75chloride/kg0.067
polyethylene glycol /(kg*kg−1)15.85
HCl/(kg*kg−1)0.016
NaOH/(kg*kg−1)0.058
electricity consumption/(kW*h*kg−1)175.73
Battery chip productionpolysilicon chip /(kg*kg−1)240.72battery chip /kWp1.02
fresh water /(kg*kg−1)1261.72Cl2/kg0.083
silver /(kg*kg−1)0.063NOx/kg0.031
aluminum/(kg*kg−1)0.388solid waste/kg0.289
nitrogen /(kg*kg−1)10.92VOC/kg1.19
oxygen /(kg*kg−1)0.115COD/kg0.129
NaOH/(kg*kg−1)0.201chloride/kg0.016
HCl/(kg*kg−1)0.204fluoride/kg0.02
electricity consumption /(kW*h*kg−1)126.48HCl/kg0.004
SiH4/(kg*kg−1)0.015
NH3/(kg*kg−1)0.051
POCl3/(kg*kg−1)0.007
HF/(kg*kg−1)1
HNO3/(kg*kg−1)0.112
Battery panel productionbattery chip/(kWp * pcs −1)1.02 solar cells/kWp1
aluminum frame/(kg* pcs−1)13.12TVOC/g3.24
toughened glass/(kg* pcs −1)62.22welding fume/g1.04
EVA/(kg* pcs −1)7.06solid waste/g132
TPA Backplane/(kg* pcs −1)3.64
organic silica gel/(kg* pcs −1)40
copper/(kg* pcs −1)0.49
water/(kg* pcs −1)348,610
electricity consumption/(kW*h* pcs −1)58.5
Inverter and bracket systemaluminum/(kg /m2)2.8
steel/(kg /m2)1.5
other/(kg /m2)0.1
inverter W/pcs2 × 500
Energy consumption during transportationtransportation energy consumption/(kWh/kWp)47
installation energy consumption/(kWh/kWp)0.08
Energy consumption in waste treatment stagetransportation energy consumption/(kWh/kWp)12
energy consumption of silicon wafer recovery/(kWh/kWp)364
crushing energy consumption/(kWh/kWp)0.02
Note: COD is the abbreviation for chemical oxygen demand. SS is the suspended solids concentration. VOC is the abbreviation for the volatile organic compounds. TVOC is the abbreviation for the total volatile organic compounds. The density of circulating water is 1.0 × 10³ kg/m³.
Table 3. Parameters of the polysilicon battery panel.
Parameter TypeValue
Dimension and structure (mm)1638*982*40
Maximum power245 Wp
Component life25 years
Conversion efficiency15.23%
Table 4. LCA eigenvalue analysis results of coal-fired power plants based on the CML2001—Jan. 2016 method.
TypeRaw Material Production
Process
Power Generation and Transportation ProcessWaste Disposal ProcessUnit
GWP100 years2.06 × 10−29.48 × 10−11.07 × 10−1kg CO2eq.
AP1.01 × 10−45.99 × 10⁻⁵−3.99 × 10⁻⁶kg SO2eq.
EP1.82 × 10−51.56 × 10−51.12 × 10−4kg Phosphate eq.
ODP, steady state3.59 × 10−171.02 × 10⁻¹⁷−8.20 × 10⁻¹⁸kg R11 eq.
POCP−1.90 × 10−53.39 × 10−12.51 × 10⁻⁵kg Ethene eq.
ADP elements6.32 × 10−103.98 × 10−91.06 × 10−9kg Sb eq.
ADP fossil1.23 × 10−15.38 × 10−32.03 × 10−2MJ
FAETP1.12 × 10−42.22 × 10−61.35 × 10−5kg DCB eq.
HTP3.70 × 10−31.69 × 10⁻⁴−2.86 × 10⁻³kg DCB eq.
MAETP1.94 × 106.40 × 10−2−9.58 × 10⁻¹kg DCB eq.
TETP8.35 × 10−51.10 × 10−61.56 × 10−4kg DCB eq.
Table 5. LCA eigenvalue analysis results of photovoltaic power plants based on the CML2001 — Jan. 2016 method.
TypeRaw Material Production ProcessPower Generation and Transportation ProcessWaste Disposal ProcessUnit
GWP100 years1.04 × 10−11.36 × 10−37.04 × 10−3kg CO2eq.
AP4.41 × 10−45.71 × 10−68.95 × 10−6kg SO2eq.
EP4.86 × 10−54.15 × 10−76.26 × 10−6kg Phosphate eq.
ODP, steady state4.76 × 10−144.85 × 10−189.46 × 10⁻¹⁴kg R11 eq.
POCP4.63 × 10−55.42 × 10−71.79 × 10−6kg Ethene eq.
ADP elements7.03 × 10−77.81 × 10−119.60 × 10⁻¹⁰kg Sb eq.
ADP fossil1.23 × 1011.37 × 10−21.67 × 10⁻²MJ
FAETP5.25 × 10−41.32 × 10−55.94 × 10−6kg DCB eq.
HTP1.87 × 10−24.80 × 10−44.31 × 10−3kg DCB eq.
MAETP1.53 × 1012.59 × 10−13.61 × 10kg DCB eq.
TETP6.05 × 10−41.13 × 10−51.09 × 10−4kg DCB eq.
Table 6. LCA standardization values of coal-fired power plants and photovoltaic power plants.
Different Power ModelsTypeRaw Material Production
Process
Power Generation and Transportation ProcessWaste Disposal ProcessTotalUnit
Coal fired power plantGWP100 years4.43 × 10−152.09 × 10−132.04 × 10−142.34 × 10⁻¹³kg CO2eq.
AP2.57 × 10−151.53 × 10⁻¹⁵−1.02 × 10−164.00 × 10⁻¹⁵kg SO2eq.
EP7.62 × 10−166.51 × 10−164.70 × 10−156.11 × 10⁻¹⁵kg Phosphate eq.
ODP, steady state9.81 × 10−252.79 × 10⁻²⁵−2.24 × 10−251.04 × 10⁻²⁴kg R11 eq.
POCP−3.36 × 10−155.99 × 10−164.44 × 10−151.68 × 10⁻¹⁵kg Ethene eq.
ADP elements1.14 × 10−177.06 × 10−171.88 × 10−171.01 × 10⁻¹⁶kg Sb eq.
ADP fossil2.27 × 10−159.91 × 10−173.74 × 10−162.74 × 10⁻¹⁵MJ
FAETP3.22 × 10−166.40 × 10−183.89 × 10−173.67 × 10⁻¹⁶kg DCB eq.
HTP1.02 × 10−144.64 × 10⁻¹⁶−7.86 × 10−152.79 × 10⁻¹⁵kg DCB eq.
MAETP6.77 × 10−142.23 × 10⁻¹⁵−3.34 × 10−143.65 × 10⁻¹⁴kg DCB eq.
TETP5.21 × 10−166.84 × 10−189.72 × 10−161.50 × 10⁻¹⁵kg DCB eq.
photovoltaic power plantGWP100 years2.22 × 10−143.01 × 10−161.38 × 10−152.39 × 10⁻¹⁴kg CO2eq
AP1.09 × 10−141.46 × 10−162.28 × 10−161.13 × 10⁻¹⁴kg SO2eq.
EP2.03 × 10−151.73 × 10−172.61 × 10−162.31 × 10⁻¹⁵kg Phosphate eq.
ODP, steady state1.30 × 10−211.32 × 10−252.58 × 10−213.88 × 10⁻²¹kg R11 eq.
POCP8.80 × 10−159.57 × 10−173.16 × 10−169.21 × 10⁻¹⁵kg Ethene eq.
ADP elements1.25 × 10−141.41 × 10−181.70 × 10−171.25 × 10⁻¹⁴kg Sb eq.
ADP fossil2.12 × 10−142.52 × 10−163.08 × 10−162.18 × 10⁻¹⁴MJ
FAETP1.51 × 10−153.80 × 10−171.71 × 10−171.57 × 10⁻¹⁵kg DCB eq.
HTP5.16 × 10−141.32 × 10−151.19 × 10−146.48 × 10⁻¹⁴kg DCB eq.
MAETP5.33 × 10−139.02 × 10−151.26 × 10−136.68 × 10⁻¹³kg DCB eq.
TETP3.78 × 10−157.02 × 10−176.80 × 10−164.53 × 10⁻¹⁵kg DCB eq.
Table 7. Comparison of employee well-being indicators in coal-fired power plants and photovoltaic power plants.
Target LayerStandard LayerIndex LayerCoal-Fired Power Plant EmployeesPhotovoltaic Power Plant Employees
The basic conditions
needed to maintain a
high-quality life
Economic living standardPer capita monthly net income (yuan)28194019
Income satisfactionQuite satisfiedQuite satisfied
Energy consumptionEnergy consumption per capita (Structure)Coal (kg)0395
Natural gas (m3)457.45.15
Electricity (kwh)460.5592.6
Heating cost (yuan)494.8414.6
Housing conditionsPer capita housing area (m2)33.336.7
Network communication coverageSatisfaction of network communicationNot really satisfiedGeneral
HealthVegetable and meat satisfactionVegetable and meat satisfactionGeneralGeneral
Physical health satisfactionPhysical health satisfactionQuite satisfiedQuite satisfied
Satisfaction of water qualitySatisfaction of water qualityGeneralGeneral
Satisfaction with medical conditions and facilitiesSatisfaction with medical conditions and facilitiesGeneralGeneral
Proportion of purchase of “five insurances and one fund” or insuranceProportion of people participating in five insurances and one fund to the total80%94.1%
SecuritySatisfaction with ecological securitySatisfaction with ecological securityGeneralGeneral
Satisfaction with living safetyHousing satisfactionQuite satisfiedGeneral
Work safetyNumber of work-related injuries00
Good social relationsEducational levelPercentage of people with high school degree or above in total93.3%82.2%
Social relationsSatisfaction with social relationsQuite satisfiedQuite satisfied
Family burdenTotal number of family dependents23
Family StatusFamily relationship satisfactionQuite satisfiedQuite satisfied
Table 8. Basic social and economic characteristics of employees in coal-fired power plants and photovoltaic power plants.
FeatureCategoryFrequencyPercentage/% FeatureCategoryFrequencyPercentage/%
Socio economic characteristics of employees in coal-fired power plantsGenderMale2480Socio economic characteristics of photovoltaic power plant employeesGenderMan1270.6
Female620female529.4
Age18–30 years old1550Age18–30 years old741.2
30–40 years old31030–40 years old635.3
40–50 years old62040–50 years old211.8
50–70 years old62050–70 years old211.8
Over 70 years old00Over 70 years old00
NationalityHan nationality2480NationalityHan nationality17100
Hui nationality620Hui nationality00
other00other00
Annual income (yuan)<10,00000Annual income (yuan)<10,00000
10,000 to 30,0001136.710,000 to 30,000741.2
30,000 to 50,000 (inclusive)186030,000 to 50,000 (inclusive)211.8
50,000–100,000 yuan (inclusive)13.350,000–100,000 yuan (inclusive)847
100,000 to 200,00000100,000 to 200,00000
Is there a “five social insurance and
one housing fund”
yes2480Is there a “five social insurance and
one housing fund”
yes17100
no620no00
How many people in the family≤213.3How many people in the family≤200
31446.7315.8
41446.74211.8
513.35423.5
>500>51058.8
Education levelJunior high school and below26.7Education levelJunior high school and below211.8
High school or technical secondary school620High school or technical secondary school211.8
Junior college826.7Junior college1270.6
Bachelor or college1446.7Bachelor or college15.9
Postgraduate00Postgraduate00
Table 9. Per capita income environmental benefits under two scenarios.
Per Capita Income–Environmental BenefitsCoal-Fired PlantsPV PlantsUnits
IAP7.04 × 10173.57 × 1017CNY/kg SO2-Equiv.
IGWP1.21 × 10161.68 × 1017CNY/kg CO2-Equiv.
IPOCP1.68 × 10184.37 × 1017CNY/kg R11-Equiv.
IODP2.72 × 10271.04 × 1024CNY/kg Ethene-Equiv.
IEP4.61 × 10171.74 × 1018CNY/kg R11-Equiv.
IFAETP7.67 × 10182.56 × 1018CNY/kg P-Equiv.
IHTP1.01 × 10186.20 × 1016CNY/kg DCB-Equiv.
IMAETP7.71 × 10166.02 × 1015CNY/kg DCB-Equiv.
ITETP1.88 × 10188.88 × 1017CNY/kg DCB-Equiv.
Table 10. Comparison of the comprehensive human well-being index of employees in coal-fired power plants and photovoltaic power plants.
Employee Well-Being in Coal-Fired Power PlantEmployee Well-Being in Photovoltaic Power Plant
Target layerStandard LayerStandardized valueWeightSingle scoreTotal scoreStandardized valueWeightSingle scoreTotal score
Socio economic characteristics of employees in coal-fired power plantsEconomic living standard0.3330.2090.0700.1750.5290.1550.0820.175
Energy consumption0.4840.0740.036 0.3280.0650.021
Network communication0.4330.0660.028 0.6670.0610.041
Housing conditions0.6650.0620.041 0.3880.0790.031
HealthVegetable and meat satisfaction0.5330.0520.0280.1870.5880.0520.0310.281
Satisfaction with medical facilities0.6330.0490.031 0.6270.0760.048
Satisfaction of water quality0.5000.0410.020 0.6470.0680.044
Satisfaction with physical health0.6890.0990.068 0.6760.1240.084
Proportion of purchasing “five insurances and one fund”0.8000.0490.039 0.9410.0800.075
SecuritySatisfaction with ecological security0.5670.0530.0300.1180.4310.0560.0240.095
Satisfaction with living safety0.5780.0680.039 0.5290.0500.026
Work safety1.0000.0490.049 1.0000.0450.045
Good social relationshipsEducation Level0.9330.0250.0230.0810.8820.0260.0230.061
Social Relations0.5890.0430.025 0.4410.0240.011
Level of family burden0.6780.0300.020 0.3920.0350.014
Family status satisfaction0.3830.0330.012 0.5590.0240.014
Comprehensive human well-being index 0.561 0.613
Disclaimer/Publisher’s Note: The statements, opinions and data contained in all publications are solely those of the individual author(s) and contributor(s) and not of MDPI and/or the editor(s). MDPI and/or the editor(s) disclaim responsibility for any injury to people or property resulting from any ideas, methods, instructions or products referred to in the content.

