Abstract
The aim of this study is to investigate the influence of biomass particle size on the torrefaction characteristics under different torrefaction temperatures and times. Paulownia wood with particle sizes ranging from 12 to <0.3 mm was selected. It was torrefied at 260 and 290 °C in a fixed-bed reactor for 30–90 min. The results showed that biomass particle size did affect the product’s evolution during biomass torrefaction. With the decrease in particle size from 12 to <0.3 mm, the yield of the solid product decreased by 5.41 and 3.54 wt.%, the yield of the liquid product increased by 5.87 and 3.25 wt.%, and the yield of the gas product changed insignificantly, at 260 and 290 °C, respectively. Comparatively, torrefaction temperature had a more significant effect on the composition of gas products than particle size and torrefaction time. At lower temperatures, decarboxylation reactions dominated in the torrefaction process with more CO2 produced. However, at higher temperatures, decarbonylation reactions were significantly strengthened with more CO generated. The contents of CO2 and CO could account for more than 98 vol% of the product gas. The influence of particle size on the chemical composition of the solid product was much smaller than that of torrefaction temperature and time, but the energy yield of the solid product decreased with the decrease in particle size. The increase in torrefaction temperature and time could significantly increase the C content in the solid product while reducing its O content. It is recommended to use a relatively higher temperature (e.g., 290 °C) for the torrefaction of large particle biomass, as it could significantly reduce the impact of particle size on the torrefaction process and reduce the torrefaction time.
1. Introduction
Biomass is the only renewable carbon resource in the nature with the advantages of being available in abundant amounts and carbon neutral; it is expected to be an ideal source of green energy and chemicals [1,2]. The high-efficiency conversion and high-value utilization of biomass have thereby become of increasing concerns nowadays [3,4]. However, the quality of raw biomass is normally quite low due to its high moisture content, high O content, low bulk density and volumetric energy density, poor grindability, etc., which largely affects its transportation, storage, size reduction, conversion, and the corresponding product quality [5]. Appropriate pretreatment is thus required to improve its quality.
Torrefaction is one of the promising biomass pretreatment methods; it is a kind of mild thermal decomposition of low-quality biomass at around 200–300 °C, which can significantly improve the quality of the biomass with better grindability and hydrophobicity and reduced oxygen content [6,7,8,9]. Sukiran et al. [10] found that torrefaction temperature had the largest impact on the yield and properties of solid product, followed by residence time during oil palm waste torrefaction. Niu et al. [11] reported that torrefaction could improve the energy density of rapeseed cake and reduce its atomic ratio of C/H. Chen et al. [12] studied the torrefaction and pyrolysis characteristics of sweet sorghum and they found that torrefaction changed the physical and chemical properties of biomass, increased the fixed carbon content, and improved the quality of the bio-oil. During the torrefaction process, biomass mainly undergoes mild dehydration, decarboxylation, decarbonylation reactions, etc., which can effectively destroy its fibrous structure, significantly reduce the energy consumption needed for crushing and grinding, decrease the oxygen content in biomass, improve its hydrophobicity, heating value, and energy density, thus significantly upgrading its storage and transportation performance and subsequent thermal conversion (e.g., pyrolysis) [13].
At present, the torrefaction characteristics of biomass have already been extensively studied, but most of the studies used fine particle or powder biomasses [5,14]. For instance, Chen et al. [12] used sweet sorghum with a particle size of less than 0.3 mm as a biomass feedstock during the torrefaction process. Dyjakon et al. [15] investigated the torrefaction characteristics of mandarin peel, lemon peel, grapefruit peel, and butternut-squash peel; all the biomasses were dried and crushed into a particle size of less than 1 mm before undergoing torrefaction. There is still a lack of research on the torrefaction characteristics of biomass with different particle sizes, especially large particles [16]. The “as harvest” biomass normally is big in dimension; its grinding or crushing can be very time consuming and energy intensive, the cost of which might be more than 50% of the total cost of the whole conversion process, including grinding pretreatment and subsequent thermal conversion. Considering the significant impact of torrefaction on the grindability of raw biomass materials and the significant difference in heat and mass transfer characteristics of biomass with different particle sizes, it will be more instructive to study the torrefaction characteristics of biomass with different particle sizes, especially the direct torrefaction characteristics of biomass with large particles.
Therefore, in this study, Paulownia wood biomass with different particle sizes ranging from 12 to <0.3 mm was selected, and the effect of biomass particle size on the torrefaction characteristics under different torrefaction temperatures and times was studied in a fixed-bed reactor. The results obtained in the study provide a scientific data support for the torrefaction of “as harvest” biomass and promote the practical application of torrefaction technology.
2. Experimental
2.1. Materials
Paulownia wood from Heze, Shandong Province, China, was selected as the biomass sample during the experiment. Its chemical composition was 49.38 wt.% of C, 5.38 wt.% of H, 0.08 wt.% of N, 44.96 wt.% of O, and 0.20 wt.% of ash, in a dry basis; the higher heating value (HHV) was 19.41 MJ/kg. To ensure sample consistency, the same batch of 12 mm square strip wood with a 2 m length was chosen. It was cut into 12, 6, and 3 mm cubes using a utility knife. Part of the wood was crushed and screened through a small crusher into other particle size ranges of 0.8–1, 0.3–0.6, and less than 0.3 mm. All the samples were dried in an oven at 105 °C for 3 h before the experiment.
2.2. Torrefaction Experimental Setup and Procedure
The torrefaction experiment was conducted in a fixed-bed reactor, as shown in Figure 1. It was mainly composed of a carrier gas N2 supply system, a quartz tube fixed-bed reactor heated by an electric furnace, a condensation system, and a gas bag for product gas collection. The condensation system was made of an acetone washing bottle immersed in an ice-bath. For each experiment, the furnace was heated to reaction temperature and kept constant in advance. The whole experimental system was connected as per Figure 1. Around 0.5 g of Paulownia wood sample was accurately weighed (12 mm of wood was a single particle), and it was put into a ceramic boat and placed in the low temperature zone of the reactor tube inlet. N2 gas was opened to purge the system for 30 min at a flow rate of 20 mL/min to remove all the air in the system. The boat was then promptly pushed into the middle of the reactor with a pushing rod, and the experiment started. A 3 L gas bag made from aluminum foil was connected to collect the product gas.
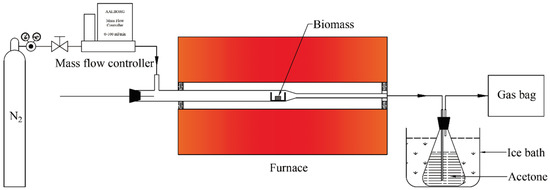
Figure 1.
Schematic diagram of a fixed-bed biomass torrefaction experimental system.
The torrefaction temperature was chosen as 260 and 290 °C. The torrefaction time was 30, 45, 60, and 90 min. After the experiment finished, the gas bag was immediately closed, the condensation system was quickly disconnected from the reactor, and the reactor was directly taken out of the furnace for rapid quenching in an N2 atmosphere. After the reactor was cooled, the solid residue (torrefied wood) was taken out, weighed, collected, and stored in a desiccator for further analysis. The reactor outlet and connecting pipe were cleaned with analytical pure acetone. The resulting liquid was then mixed with the liquid in the washing bottle to obtain the final liquid product sample from torrefaction. To ensure the reproducibility of the experiment results, each condition was repeated at least twice, and an average result was presented in the study. The torrefaction products were numbered as “Torrefaction temperature-time-particle size”; for instance, 260-60-12 referred to 12 mm of Paulownia wood torrefied at 260 °C for 60 min.
2.3. Torrefaction Products Analyses
The mass yield of the torrefaction solid product (torrefied wood) was obtained by taking the weight of the solid before and after torrefaction. Its chemical composition (CHNS) was analyzed with a Vario EL Ⅲ elemental analyzer (Elementar Co. Ltd., Langenselbold, Germany). The ash yield of the torrefied wood was measured with a Maffle furnace via calcination at 550 °C for 2 h according to the Chinese standard GB/T36057-2018. The O content was calculated from the difference. The HHV of torrefied wood was calculated based on its elemental composition according to the formula summarized by Vassilev et al. [17]:
where C, H, and N were the mass percentages in torrefied wood.
HHV = 5.22C2 − 319C − 1647H + 38.6C × H + 133N + 21028 kJ/kg
The composition of torrefied product gas was analyzed using a gas chromatographer equipped with TCD and FID detectors (GC-9790II, Zhejiang Fuli Analytical Instrument Co., Ltd., Hangzhou, China); it mainly contained CO, CO2, and N2 (from carrier gas), as well as small amounts of H2, CH4, and C2+ (C2H4, C2H6, C3H6, C3H8). The detailed procedure can be found elsewhere [18,19,20]. The volumetric gas yield was calculated from the N2 balance, as the N2 volume was known (e.g., 20 mL/min × 30 min = 600 mL) and the N2 concentration could be obtained via GC analysis. The mass yield of torrefied gas was thus obtained.
The mass yield of liquid product was calculated from the difference. The liquid was mainly composed of water and small molecular acids and ketones as can be found in other studies [21], which will not be discussed in this study.
3. Results and Discussion
3.1. Effect of Biomass Particle Size on the Torrefaction Products Evolving Characteristics under Different Torrefaction Temperatures
3.1.1. Mass Yields of Torrefaction Products
Figure 2 shows the mass yield distribution of torrefied products from the torrefaction of Paulownia wood with six different particle sizes at 260 and 290 °C for 60 min. From the figure, it can be seen that torrefaction temperature and particle size both affected the product distribution, and, comparatively, the impact of temperature was more significant in the current tested range of particle sizes. At the same torrefaction temperature, with the decrease in biomass particle size, the yield of the solid torrefied wood decreased gradually, the yield of the liquid product increased, and the yield of the gas product changed insignificantly. Taking Paulownia wood torrefied at 260 °C for 60 min as an example, when the particle size decreased from 12 mm to <0.3 mm, the yield of the solid torrefied wood decreased from 79.28 wt.% to 73.87 wt.%, and the yield of the liquid product increased from 16.94 wt.% to 22.81 wt.%. Biomass particle size could affect its heating characteristics in the torrefaction process. Smaller particle size could gain a higher heating rate with a more uniform temperature distribution of the particle. On the other hand, large particle size could form a big temperature gradient between its surface and interior; the surface of the particle could be heated up rapidly, while the heat transfer from the surface to the interior would take some time. The larger the particle size was, the slower the interior temperature rose, and the temperature gradient or nonuniformity of the particle would be more significant. As fine particle biomass could achieve a relatively higher heating rate during the torrefaction process, it thus resulted in a higher yield of the liquid product and lower yield of the solid torrefied wood, which was consistent with the findings of the influence of heating rate on the yield distribution of biomass pyrolysis products [22]. In addition, smaller particle size could reduce the diffusion resistance of volatiles from the interior to the surface of the particle. As volatiles could be more easily released, the secondary reactions of volatiles would be largely decreased, thus the yield of the liquid product promoted [18,23]. However, for large particle biomass, some heavy tar components might be captured inside the particles during torrefaction, which might make the yield of solid torrefied wood relatively high and the yield of the liquid product relatively low [24,25,26].
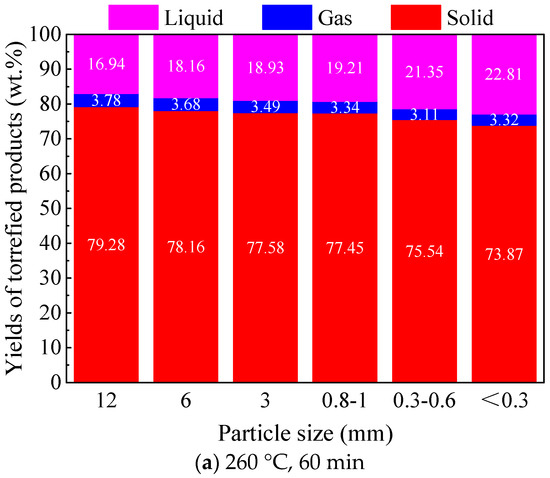
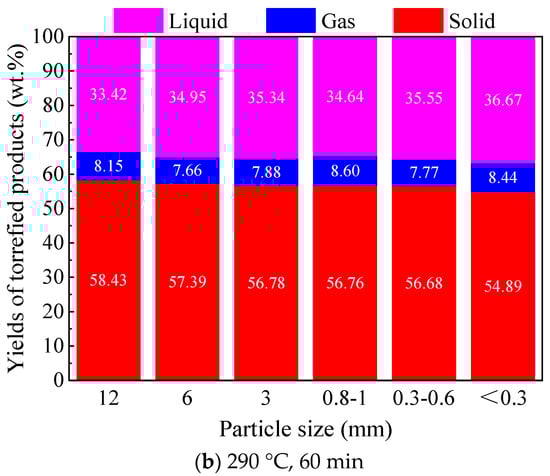
Figure 2.
Effect of particle size on the product distribution of Paulownia wood torrefaction under different temperatures.
With respect to torrefaction temperature, the increase in torrefaction temperature greatly decreased the yield of solid torrefied wood, while it increased the yields of the liquid and gas products significantly. The same trends were found for different particle size biomasses. With the same torrefaction time, the increase in temperature obviously increased the torrefaction degree of the biomass samples. This is mainly due to the enhanced thermal decomposition reactions at higher temperatures. Comparatively, a higher torrefaction temperature would reduce the influence of particle size on the yields of torrefied products. For instance, when torrefied at 260 °C for 60 min, with a decrease in particle size from 12 to <0.3 mm, the yield of the solid torrefied wood decreased by 5.41 wt.%, and the yield of the liquid product increased by 5.87 wt.%; moreover, when torrefied at 290 °C for 60 min, with the decrease in particle size from 12 to <0.3 mm, the yield of solid the torrefied wood decreased by 3.55 wt.%, and the yield of the liquid product increased by 3.25 wt.%.
3.1.2. Product Gas Composition from Torrefaction
Figure 3 shows the product gas composition from the torrefaction of Paulownia wood with six different particle sizes at 260 and 290 °C for 60 min. It can be observed that CO2 and CO were the main gases generated from the torrefaction of Paulownia wood; these two occupied more than 98 vol.% of the product gas. Since the torrefied liquid products were mainly water and small molecular carboxylic acid and ketones [27,28], this further verified the deoxygenation effect of torrefaction on biomass samples as being quite significant, and the main reactions included dehydration, decarboxylation, decarbonylation reactions, etc. [29], which removed the oxygen in biomass in the forms of CO, CO2, H2O and carboxylic acid. From the perspective of changes in the product gas composition, it can be seen from Figure 3 that the effect of particle size on the torrefied gas composition was insignificant, which was consistent with the result in Figure 2 that no obvious change was found in its mass yield. When torrefied at 260 °C for 60 min, the CO2 content in the product gas (more than 60 vol.%) was higher than that of CO, which indicated that the decarboxylation reaction (generating CO2) was more than the decarbonylation reaction (generating CO) when Paulownia wood was torrefied at a relatively low temperature. With the decrease in particle size, the CO2 content increased slightly, the CO content decreased slightly, the H2 content also decreased slightly, while the contents of CH4 and C2+ (generated from the cleavage of branch chains C-C/C-O) were always very low. When torrefaction temperature rose to 290 °C, the composition of the product gas, especially the contents of CO and CO2, changed greatly compared with those torrefied at 260 °C; the contents of CO and CO2 were both close to 50 vol.%, and the CO2 content was slightly higher generally. The effect of particle size on gas composition at 290 °C showed similar trend with that at 260 °C, as stated before. Considering that the yield of the product gas from torrefaction at 290 °C was much higher than that from torrefaction at 260 °C, the yield of each gas component increased, and, comparatively, the increase in CO yield was higher than that of the CO2 yield, indicating that the decarbonylation reaction was strengthened more at higher temperatures.
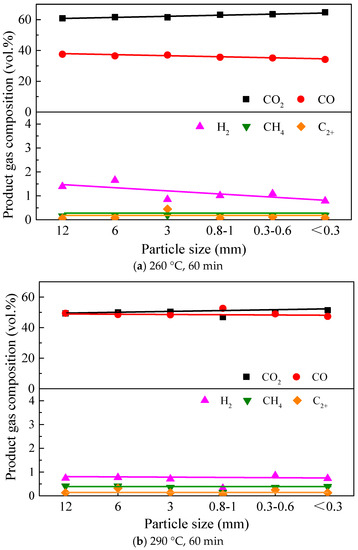
Figure 3.
Effect of particle size on the product gas composition of Paulownia wood torrefaction under different temperatures.
3.1.3. Composition, Heating Value and Energy Yield of Torrefied Wood
Table 1 shows the chemical composition, HHV, and energy yield of solid torrefied wood with four different particle sizes from Paulownia wood torrefaction at 260 and 290 °C for 60 min. Compared with the composition of raw Paulownia wood, the contents of C and H of torrefied wood increased, while the O content decreased. Torrefaction did have a significant deoxygenation effect on the biomass samples [21,30], which was consistent with the aforementioned results; the HHV of torrefied wood was also thus increased. However, the effect of particle size on the chemical composition of solid torrefied wood was insignificant. With particle size decreasing from 12 to <0.3 mm, although the yield of the solid torrefied wood decreased gradually (Figure 2), the contents of C, H, and O only changed within a small range. For the torrefied woods obtained at 290 °C for 60 min in particular, the contents of C and O fluctuated, which might be due to the differences in their composition and structure along the length (growth) direction of the square wood strip, as all the samples were obtained from the same one resulting in certain errors. While comparing the composition of solid torrefied wood at different torrefaction temperatures, it can be found that the increase in torrefaction temperature could significantly increase the C content of solid torrefied wood, while reducing the O content; its HHV also increased obviously [31]. With respect to the energy yield of solid torrefied wood (based on a raw sample), with the decrease in particle size from 12 to <0.3 mm, the energy yield of the solid torrefied wood decreased from 87.20% to 83.50% when torrefied at 260 °C for 60 min, while it decreased from 77.06% to 70.25% when torrefied at 290 °C for 60 min. Smaller particle sizes would gain a more thorough thermal decomposition during torrefaction, and the increase in temperature was conducive for torrefaction reactions.

Table 1.
Effect of particle size on the chemical composition, HHV, and energy yield of the solid product from Paulownia wood torrefaction under different temperatures.
3.2. Effect of Biomass Particle Size on the Torrefaction Products Evolving Characteristics under Different Torrefaction Times
3.2.1. Mass Yields of Torrefaction Products
Figure 4 shows the yield distribution of torrefied products from 12 and 6 mm Paulownia wood torrefaction at 260 and 290 °C under different torrefaction times. It can be seen from the figure that, with the extension of torrefaction time, the thermal decomposition degree of biomass increased significantly, leading to a continuous decrease in the yield of solid torrefied wood and gradual increase in the yields of the gas and liquid products. Similar trends were also found for different particle size woods and different torrefaction temperatures. For instance, for 12 mm Paulownia wood torrefaction at 260 °C, with the torrefaction time increasing from 30 to 90 min, the yield of solid torrefied wood decreased from 85.00 wt.% to 74.34 wt.%, the yield of the liquid product increased from 14.23 wt.% to 19.41 wt.%, and the yield of the gas product increased from 0.77 wt.% to 6.25 wt.%. Comparing the effect of particle size on the yields of torrefied products at the same torrefaction temperature, it can be found that smaller particle size wood had a higher degree of thermal decomposition within the same torrefaction time, and the corresponding yield of solid torrefied wood was lower, which might be attributed to the relatively higher heating rate for smaller particles. The increase in torrefaction temperature could significantly promote the thermal decomposition of biomass in the torrefaction process, thus reducing the yield of solid torrefied wood. The same trends were also found for torrefaction with other particle size woods. Moreover, the increase in torrefaction temperature could largely reduce the time required for torrefaction. For instance, with regard to 12 mm Paulownia wood torrefaction, the yield of torrefied wood at 260 °C for 90 min was 74.34 wt.%, while the yield of torrefied wood at 290 °C for 30 min was 69.04 wt.%.
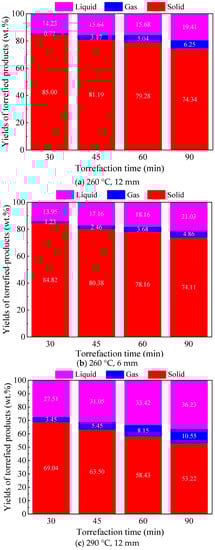
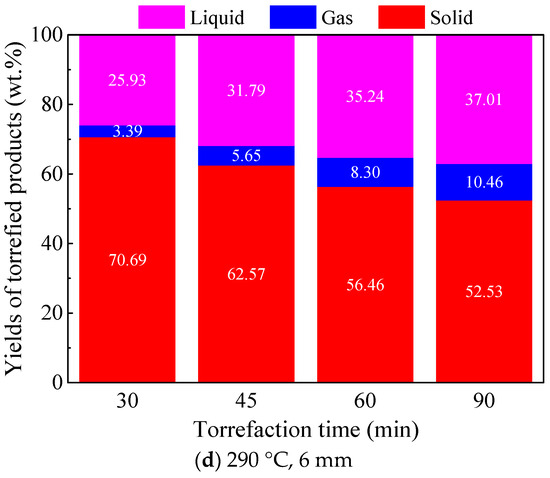
Figure 4.
Product distribution of Paulownia wood torrefaction at 260 and 290 °C under different torrefaction times.
3.2.2. Product Gas Composition from Torrefaction
Figure 5 shows the product gas composition from 12 and 6 mm Paulownia wood torrefaction at 260 and 290 °C under different torrefaction times. It can be seen from the figure that under different torrefaction times, the gas products from Paulownia wood torrefaction were still mainly CO2 and CO, both of which accounted for close to or more than 98 vol.%, whereas the contents of CH4 and C2+ were very small and were therefore not analyzed afterwards. When torrefied at 260 °C, with the extension of torrefaction time, CO2 content in the product gas increased slightly, while the CO and H2 content decreased slightly, and the CO2 content was higher than that of CO. The same trend was found for the two particle size woods. It indicated that the decarboxylation reaction of Paulownia wood was more than the decarbonylation reaction when torrefied at a lower temperature, and such a trend was strengthened with the extension of the torrefaction time. When torrefied at 290 °C, the contents of CO2 and CO were quite close although the CO2 content was still slightly higher in the product gas. With the increase in torrefaction time, the CO2 content decreased slightly, whereas the CO content increased slightly; a similar trend was observed for the two tested particle size woods. It implies that the decarbonylation reaction of Paulownia wood was strengthened when torrefied at a higher temperature, and the amount of CO generated/released was higher than that of CO2 with the extension of the torrefaction time.


Figure 5.
Product gas composition of Paulownia wood torrefaction at 260 and 290 °C under different torrefaction times.
3.2.3. Composition, Heating Value, and Energy Yield of Torrefied Wood
Table 2 shows the chemical composition, HHV, and energy yield of solid torrefied wood with three different particle sizes from Paulownia wood torrefaction at 260 and 290 °C under different torrefaction times. It can be seen from the table that, compared with the composition of raw Paulownia wood, the contents of C and H increased, while the O content decreased, the ash yield slightly increased, and the HHV also increased. In general, with the extension of torrefaction time, the C content in solid torrefied wood increased, the H content changed insignificantly, the O content kept decreasing, and the HHV increased gradually. This is mainly due to the increasing torrefaction degree of Paulownia wood, which resulted in O releasing in the form of H2O, CO2, CO, and small molecular carboxylic acid. As more volatiles were released with the extension of the torrefaction time, the energy yield of the solid torrefied wood decreased as well. In contrast, the influence of torrefaction time on the contents of C and O in the torrefied wood was more significant at a higher torrefaction temperature (290 °C). For instance, when 12 mm Paulownia wood was torrefied at 260 °C, with the torrefaction time increasing from 30 to 90 min, the C content increased from 52.12 wt.% to 54.50 wt.%, and the O content decreased from 41.77 wt.% to 39.38 wt.%. When it was torrefied at 290 °C, with the torrefaction time increasing from 30 to 90 min, the C content increased from 55.77 wt.% to 64.45 wt.%, and the O content decreased from 39.38 wt.% to 29.61 wt.%. When comparing the influence of particle sizes, the influence on the chemical composition of torrefied wood was much smaller than that of torrefaction temperature and time; the contents of C and O in the torrefied woods for different particle sizes fluctuated to some extent. From the perspective of energy yield, the energy yields of smaller particles were relatively lower under the same torrefaction temperature and time, which was consistent with the previous result that their mass yields were relatively lower as well (Figure 4).
Table 2.
Effect of particle size on the chemical composition, higher heating value, and energy yield of the solid product of Paulownia wood torrefaction under different torrefaction times.
4. Conclusions
In this study, the effect of particle size of Paulownia wood biomass on the characteristics of torrefied products under different torrefaction temperatures and times in a fixed-bed reactor was discussed. The results showed that:
(1) Particle size did have an impact on the generation characteristics of the torrefied products of Paulownia wood. The reduction in particle size from 12 to <0.3 mm decreased the yield of solid torrefied wood by 5.41 and 3.54 wt.%, increased the yield of the liquid product by 5.87 and 3.25 wt.%, and caused no obvious change in the yield of the gas product, at 260 and 290 °C, respectively. A relatively high temperature is recommended for the torrefaction of large particle biomass, which could significantly diminish the influence of particle size on the generation characteristics of torrefied products and reduce the time required for torrefaction as well.
(2) Particle size and torrefaction time had little effect on the composition of torrefied gas products, whereas torrefaction temperature significantly affected the composition of torrefied gas products. At lower torrefaction temperatures, the decarboxylation reactions dominated during the torrefaction process with a higher CO2 content in the product gas. When torrefaction temperature rose, the decarbonylation reactions were significantly strengthened, the content of CO was quite close to that of CO2, and these two in total exceeded 98 vol.%.
(3) The influence of particle size on the chemical composition of torrefied solid wood was much smaller than that of torrefaction temperature and time. With the decrease in particle size, the energy yield of torrefied solid wood decreased. The increase in torrefaction temperature and time could significantly increase the C content and reduce the O content in the solid torrefied wood.
Author Contributions
Conceptualization, D.L., X.X. and B.L.; Methodology, D.L., X.X. and B.L.; Formal analysis, Y.H. and B.L.; Investigation, Y.H. and X.X.; Data curation, Y.H.; Writing—original draft, Y.H. and B.L.; Writing—review and editing, X.X. and B.L.; Supervision, S.Z. and X.X.; Project administration, S.Z.; Funding acquisition, B.L. All authors have read and agreed to the published version of the manuscript.
Funding
National Natural Science Foundation of China: 51876225; National Natural Science Foundation of China: 52276196; Six Talent Peaks Project in Jiangsu Province: XNY-070; Changzhou Basic Research Program: CJ20220183; Foundation of State Key Laboratory of Coal Combustion: FSKLCCA2101.
Data Availability Statement
The data can be shared up on request.
Acknowledgments
The authors would like to express their sincere thanks for the financial support from all the funders.
Conflicts of Interest
The authors declare no conflict of interest.
References
- Li, B.; Xie, X.; Zhang, L.; Lin, D.; Wang, S.; Wang, S.; Xu, H.; Wang, J.; Huang, Y.; Zhang, S.; et al. Coke formation during rapid quenching of volatile vapors from fast pyrolysis of cellulose. Fuel 2021, 306, 121658. [Google Scholar] [CrossRef]
- Li, B.; Tang, J.; Huang, H.; Xie, X.; Lin, D.; Zhang, S.; Huang, Y.; Liu, D.; Xu, Z.; Chen, D. Biocoke production from heat treatment of bio-oil: Effect of temperature. J. Anal. Appl. Pyrolysis 2022, 161, 105401. [Google Scholar] [CrossRef]
- Li, B.; Tang, J.; Xie, X.; Wei, J.; Xu, D.; Shi, L.; Ding, K.; Zhang, S.; Hu, X.; Zhang, S.; et al. Char structure evolution during molten salt pyrolysis of biomass: Effect of temperature. Fuel 2023, 331, 125747. [Google Scholar] [CrossRef]
- Sobczak, A.; Chomać-Pierzecka, E.; Kokiel, A.; Różycka, M.; Stasiak, J.; Soboń, D. Economic Conditions of Using Biodegradable Waste for Biogas Production, Using the Example of Poland and Germany. Energies 2022, 15, 5239. [Google Scholar] [CrossRef]
- Chen, W.H.; Lin, B.J.; Lin, Y.Y.; Chu, Y.S.; Ubando, A.T.; Show, P.L.; Ong, H.C.; Chang, J.S.; Ho, S.H.; Culaba, A.B.; et al. Progress in biomass torrefaction: Principles, applications and challenges. Prog. Energy Combust. Sci. 2021, 82, 100887. [Google Scholar] [CrossRef]
- Thengane, S.K.; Kung, K.S.; Gomez-Barea, A.; Ghoniem, A.F. Advances in biomass torrefaction: Parameters, models, reactors, applications, deployment, and market. Prog. Energy Combust. Sci. 2022, 93, 101040. [Google Scholar] [CrossRef]
- Wei, F.; Kudo, S.; Asano, S.; Hayashi, J.-i. Torrefaction of woody biomass and in-situ pyrolytic reforming of volatile matter: Analyses of products and process heat demand. J. Anal. Appl. Pyrolysis 2022, 167, 105658. [Google Scholar] [CrossRef]
- Kota, K.B.; Shenbagaraj, S.; Sharma, P.K.; Sharma, A.K.; Ghodke, P.K.; Chen, W.-H. Biomass torrefaction: An overview of process and technology assessment based on global readiness level. Fuel 2022, 324, 124663. [Google Scholar] [CrossRef]
- Kong, G.; Wang, K.; Zhang, X.; Li, J.; Han, L.; Zhang, X. Torrefaction/carbonization-enhanced gasification-steam reforming of biomass for promoting hydrogen-enriched syngas production and tar elimination over gasification biochars. Bioresour. Technol. 2022, 363, 127960. [Google Scholar] [CrossRef]
- Sukiran, M.A.; Abnisa, F.; Daud, W.M.A.W.; Abu Bakar, N.; Loh, S.K. A review of torrefaction of oil palm solid wastes for biofuel production. Energy Convers. Manag. 2017, 149, 101–120. [Google Scholar] [CrossRef]
- Niu, X.; Xu, Y.; Shen, L. Effect of torrefaction on the evolution of carbon and nitrogen during chemical looping gasification of rapeseed cake. Chem. Eng. J. 2022, 450, 138134. [Google Scholar] [CrossRef]
- Chen, D.; Li, J.; Zhang, T.; Li, S.; Wang, J.; Niu, W.; Liu, Y.; Zheng, A.; Zhao, Z. Advancing biomass pyrolysis by torrefaction pretreatment: Linking the productions of bio-oil and oxygenated chemicals to torrefaction severity. Fuel 2022, 330, 125514. [Google Scholar] [CrossRef]
- Huang, Y.; Li, B.; Liu, D.; Xie, X.; Zhang, H.; Sun, H.; Hu, X.; Zhang, S. Fundamental Advances in Biomass Autothermal/Oxidative Pyrolysis: A Review. ACS Sustain. Chem. Eng. 2020, 8, 11888–11905. [Google Scholar] [CrossRef]
- Ho, S.-H.; Zhang, C.; Chen, W.-H.; Shen, Y.; Chang, J.-S. Characterization of biomass waste torrefaction under conventional and microwave heating. Bioresour. Technol. 2018, 264, 7–16. [Google Scholar] [CrossRef]
- Dyjakon, A.; Noszczyk, T.; Sobol, Ł.; Misiakiewicz, D. Influence of Torrefaction Temperature and Climatic Chamber Operation Time on Hydrophobic Properties of Agri-Food Biomass Investigated Using the EMC Method. Energies 2021, 14, 5299. [Google Scholar] [CrossRef]
- Niu, Q.; Ronsse, F.; Qi, Z.Y.; Zhang, D.D. Fast torrefaction of large biomass particles by superheated steam: Enhanced solid products for multipurpose production. Renew. Energy 2022, 185, 552–563. [Google Scholar] [CrossRef]
- Vassilev, S.V.; Baxter, D.; Andersen, L.K.; Vassileva, C.G. An overview of the composition and application of biomass ash. Part 1. Phase-mineral and chemical composition and classification. Fuel 2013, 105, 40–76. [Google Scholar] [CrossRef]
- Li, B.; Zhao, L.; Xie, X.; Lin, D.; Xu, H.; Wang, S.; Xu, Z.; Wang, J.; Huang, Y.; Zhang, S.; et al. Volatile-char interactions during biomass pyrolysis: Effect of char preparation temperature. Energy 2021, 215, 119189. [Google Scholar] [CrossRef]
- Magoua Mbeugang, C.F.; Li, B.; Lin, D.; Xie, X.; Wang, S.; Wang, S.; Zhang, S.; Huang, Y.; Liu, D.; Wang, Q. Hydrogen rich syngas production from sorption enhanced gasification of cellulose in the presence of calcium oxide. Energy 2021, 228, 120659. [Google Scholar] [CrossRef]
- Li, B.; Magoua Mbeugang, C.F.; Xie, X.; Wei, J.; Zhang, S.; Zhang, L.; El Samahy, A.A.; Xu, D.; Wang, Q.; Zhang, S.; et al. Catalysis/CO2 sorption enhanced pyrolysis-gasification of biomass for H2-rich gas production: Effects of activated carbon, NiO active component and calcined dolomite. Fuel 2023, 334, 126842. [Google Scholar] [CrossRef]
- Chen, D.Y.; Gao, A.J.; Cen, K.H.; Zhang, J.; Cao, X.B.; Ma, Z.Q. Investigation of biomass torrefaction based on three major components: Hemicellulose, cellulose, and lignin. Energy Convers. Manag. 2018, 169, 228–237. [Google Scholar] [CrossRef]
- Kan, T.; Strezov, V.; Evans, T.J. Lignocellulosic biomass pyrolysis: A review of product properties and effects of pyrolysis parameters. Renew. Sustain. Energy Rev. 2016, 57, 1126–1140. [Google Scholar] [CrossRef]
- Li, B.; Liu, D.; Lin, D.; Xie, X.; Wang, S.; Xu, H.; Wang, J.; Huang, Y.; Zhang, S.; Hu, X. Changes in Biochar Functional Groups and Its Reactivity after Volatile–Char Interactions during Biomass Pyrolysis. Energy Fuels 2020, 34, 14291–14299. [Google Scholar] [CrossRef]
- Shen, J.; Wang, X.-S.; Garcia-Perez, M.; Mourant, D.; Rhodes, M.J.; Li, C.-Z. Effects of particle size on the fast pyrolysis of oil mallee woody biomass. Fuel 2009, 88, 1810–1817. [Google Scholar] [CrossRef]
- Haas, T.J.; Nimlos, M.R.; Donohoe, B.S. Real-Time and Post-reaction Microscopic Structural Analysis of Biomass Undergoing Pyrolysis. Energy Fuels 2009, 23, 3810–3817. [Google Scholar] [CrossRef]
- Zhou, S.; Garcia-Perez, M.; Pecha, B.; McDonald, A.G.; Westerhof, R.J.M. Effect of particle size on the composition of lignin derived oligomers obtained by fast pyrolysis of beech wood. Fuel 2014, 125, 15–19. [Google Scholar] [CrossRef]
- Cahyanti, M.N.; Doddapaneni, T.R.K.C.; Kikas, T. Biomass torrefaction: An overview on process parameters, economic and environmental aspects and recent advancements. Bioresour. Technol. 2020, 301, 122737. [Google Scholar] [CrossRef]
- Niu, Y.; Lv, Y.; Lei, Y.; Liu, S.; Liang, Y.; Wang, D.; Hui, S.e. Biomass torrefaction: Properties, applications, challenges, and economy. Renew. Sustain. Energy Rev. 2019, 115, 109395. [Google Scholar] [CrossRef]
- Wei, X.; Huang, S.; Wu, Y.; Wu, S.; Yang, J. A comprehensive study on torrefaction of penicillin mycelial residues: Analysis of product characteristics and conversion mechanisms of N. Fuel 2022, 330, 125703. [Google Scholar] [CrossRef]
- Chen, D.; Mei, J.; Li, H.; Li, Y.; Lu, M.; Ma, T.; Ma, Z. Combined pretreatment with torrefaction and washing using torrefaction liquid products to yield upgraded biomass and pyrolysis products. Bioresour. Technol. 2017, 228, 62–68. [Google Scholar] [CrossRef]
- Wang, L.; Riva, L.; Skreiberg, O.; Khalil, R.; Bartocci, P.; Yang, Q.; Yang, H.P.; Wang, X.B.; Chen, D.Y.; Rudolfsson, M.; et al. Effect of Torrefaction on Properties of Pellets Produced from Woody Biomass. Energy Fuels 2020, 34, 15343–15354. [Google Scholar] [CrossRef]
Disclaimer/Publisher’s Note: The statements, opinions and data contained in all publications are solely those of the individual author(s) and contributor(s) and not of MDPI and/or the editor(s). MDPI and/or the editor(s) disclaim responsibility for any injury to people or property resulting from any ideas, methods, instructions or products referred to in the content. |
© 2023 by the authors. Licensee MDPI, Basel, Switzerland. This article is an open access article distributed under the terms and conditions of the Creative Commons Attribution (CC BY) license (https://creativecommons.org/licenses/by/4.0/).