Article

Online Multiphase Flow Measurement of Crude Oil Properties Using Nuclear (Proton) Magnetic Resonance Automated Measurement Complex for Energy Safety at Smart Oil Deposits

1
Department of Instrumentation and Mechatronics, Kazan State Power Engineering University, 420066 Kazan, Russia
2
Department of Photonics and Communication Lines, The Bonch-Bruevich Saint Petersburg State University of Telecommunication, 193232 St. Petersburg, Russia
*
Author to whom correspondence should be addressed.
Energies 2023, 16(3), 1080; https://doi.org/10.3390/en16031080
Submission received: 17 December 2022 / Revised: 10 January 2023 / Accepted: 16 January 2023 / Published: 18 January 2023
(This article belongs to the Special Issue Nuclear and New Energy Technology)

Abstract

:
The necessity of a flow express control of oil dispersed system (ODS) properties, such as crude oil, oil products, water–oil emulsions, and polluted waters, is substantiated. This control is necessary for the production and preparation of oil for transportation through the pipeline and oil refining, oil products, and wastewater treatment systems. A developed automatic measuring complex (AMC) is used to implement the concept of digital oil deposits. The primary measuring device is a relaxometer developed by us based on nuclear (proton) magnetic resonance (PMR). The design and operation algorithm of the AMC and the relaxometer are described. Equations have been developed to determine the ODS characteristics using the measured PMR parameters. This makes it possible to determine the flow rates of crude oil, the concentration of water in the oil, the concentration of asphaltene, resins, and paraffins in the oil, as well as the density, viscosity, and molecular weight of the oil. Additionally, it is possible to determine the dispersed distribution of water droplets in emulsions in oil production and treatment units. Data on this distribution will improve the management of separation processes. It has been established that the implemented control of multiphase ODS using PMR parameters (relaxation times, populations of proton phases, and amplitudes of spin-echo signals) makes it possible, using AMC, to assess the consumption of electricity in technological processes at the digital oil deposits, as well as during the transportation of oil and oil products through pipelines. AMC makes it possible to reduce electrical energy consumption in technological installations and reduce pollution emissions into wastewater. The advantages of using the developed AMC are shown in examples of its application. Such as an assessment of the influence of the gas factor on electricity consumption during oil transportation through pipelines or compensation for the additional moment of resistance on the shaft of the submersible motor, which is caused by surface tension forces at the interface of water droplets in the emulsion.

1. Introduction

One of the critical factors in oil production and refining is cost reduction [1,2,3,4,5,6]. Another important area in the oil and gas sector is to reduce the negative impact on the environment at various stages of oil production, processing, and transportation [7,8,9,10,11]. Implementing projects based on the formation of digital smart fields (DSFs) fits into managing oil production, preparation, and pumping through pipelines [12,13,14]. The main elements of DSFs in the oil and gas complex are automatic measuring complexes (AMC). Their use on various DSFs increases production by up to 10–25% and reduces electrical energy consumption by up to 8% [15,16]. The latter is extremely important, especially when using autonomous power stations [17,18,19]. Digital automation of old oil and gas fields provides an opportunity to convert them into new stages of exploitation [20,21]. It is necessary since the last cycles of field operation are characterized by an increase in high-viscosity, high-water (up to >95%) oil with high concentrations of asphaltene, resins, and paraffins. In this situation, it is necessary to constantly monitor the state of the media and control technological processes and the operation of various installations. For example, in the Romashkinskoye field of the Republic of Tatarstan (Russian Federation), there are only 15,000 wells in the final stages, producing oil with an average water content of 87%. Electric energy consumption for the maintenance of these wells has increased by 48% over the past three years. In addition, there is an increase in the concentration of asphaltene–resins–paraffins (ARP) deposits in the oil produced at these fields. This increases the viscosity of the pumped mixture and ARP deposits on the tubing of wells and pipelines, leading to equipment decommissioning. These problems arise not only in heavy oil fields in the Russian Federation, but they are also present in oil production on the artic shelf, on offshore drilling platforms in the northern part of the globe, as well as in the northern regions of the United States (Alaska) and the Channels [22,23,24,25,26] and in the operation of oil wells in the southern part of Patagonia (Argentina).
To solve these problems, it is necessary to introduce new methods and instruments to control the properties of ODS and their flow rates in pipelines under changed difficult conditions. An analysis of various studies and authors’ work experience has shown that for a comprehensive solution to the problems noted, it is necessary to control the following parameters in ODS in real time. These are the concentrations of water and ARP, the viscosity and molecular weight of oil, the pour point, and the dispersed distribution of water droplets in emulsions, crude oil, and salt-contaminated waters. In addition, when extracting heavy oil grades, it is necessary to use centrifugal pumps. When changing the composition in the ODS, a problem arises associated with measuring the moment of resistance MC on the shaft of the submersible pump motor, caused by the need to overcome surface tension forces at the interface between water drops and oil in a water–oil emulsion; the presence of water W and gas factor G, increased viscosity η and density ρ. This leads to a change in flow rates during well operation to an increase in electrical energy consumption. The availability of data on the ODS parameters and the G value allows for optimizing the production process and removing the unnecessary load from the equipment.
Many technologies and devices have been developed to measure these parameters, which have advantages and disadvantages [27,28,29,30,31,32,33,34,35,36,37]. Combining them into a single system up to a certain point allows you to successfully solve the problems noted until the quality of the ODS deteriorates significantly. This increases the measurement error in these devices and the wear of the measuring sensors. Therefore, in the world, preference for measurements under these conditions is given to non-contact devices [38,39,40,41,42,43,44,45,46,47]. There are many of these devices to ensure the measurement of all the noted parameters, which creates difficulties with their integration into a single system at the drilling rig, as well as the economic feasibility of use (cost, the need for maintenance by various companies). Therefore, it is most expedient to use methods and devices based on them, which would be less affected by these factors.
The non-contact, non-destructive, and express nuclear (proton) magnetic resonance method has such possibilities. This method is actively used in various systems for express control of condensed matter [48,49,50,51,52]. Despite a large number of developments and studies, its possibilities have not yet been fully disclosed, especially in the field of advanced petroleum engineering technologies [53,54,55]. The wide possibilities of a variety of PMR relaxometry (PMRR) in the control of ODS were demonstrated in [56,57,58], and it was found that PMRR is unique for the express control of oil emulsions [59]. The unique properties of the PMRR approach are associated with the possibility of quantum mechanical analysis of the chemical and physical properties of substances at different structural levels as a single complex. Based on several fundamental PMR parameters, the dynamics of molecules, phase compositions, and diffusion processes in oil and oil aggregates can be studied [55].
To control the three-component ODS of liquids in a flow, the authors of [60] studied the influence of a flowing liquid on PMR signals, determined the possibilities for measuring the distribution of flow velocities, and developed a method and instrument for studying them.
A feature of the PMRR method is that it allows for information to be obtained about the relaxation parameters of protons in their three phases i = A, B, C in ODS (in particular, in emulsions): spin-lattice T1i and spin-spin T2i relaxation times characterizing the proton groups with different molecular mobility in two fractions of oil; the populations of the proton phases P1i and P2i corresponding to these times; and interproton distances Rij. The method practically does not require sample preparation and reagents, and multiple accumulations of signals minimize error values during measurements and when using calibration curves built using standard samples with high correlation coefficients R2 and with minimal deviations [56,57,58,59,61,62,63,64,65,66,67].
In their work, the authors of the proposed AMC tried to realize all the advantages of this method, as well as consider the advantages of several studies by scientists in the development of laboratory relaxometers and analyzers for multiphase flow measurements [60,61,62]. Particular attention was paid to the methodology for determining the ODS flow in a pipeline in real time, considering previous studies [64,68,69,70,71,72,73]. Electromagnetic and Coriolis flowmeters [74,75,76,77,78] currently used to determine the ODS flow cannot provide factory measurement accuracy with deterioration in oil quality. In addition, it is planned to implement the function of ecological monitoring of flowing liquids in the developed AMC [79,80,81,82,83].

2. Methodology and Apparatus for Monitoring of the Oil Disperse Systems

Currently, monitoring the quality of ODS in real time is difficult due to high pressures, temperatures, distributions of different flows, and phase separations in pipelines. In this case, it is necessary to use non-contact methods of control. This possibility is provided by a method based on the phenomenon of nuclear (proton) magnetic resonance [10,48,59,60,71,72,78].
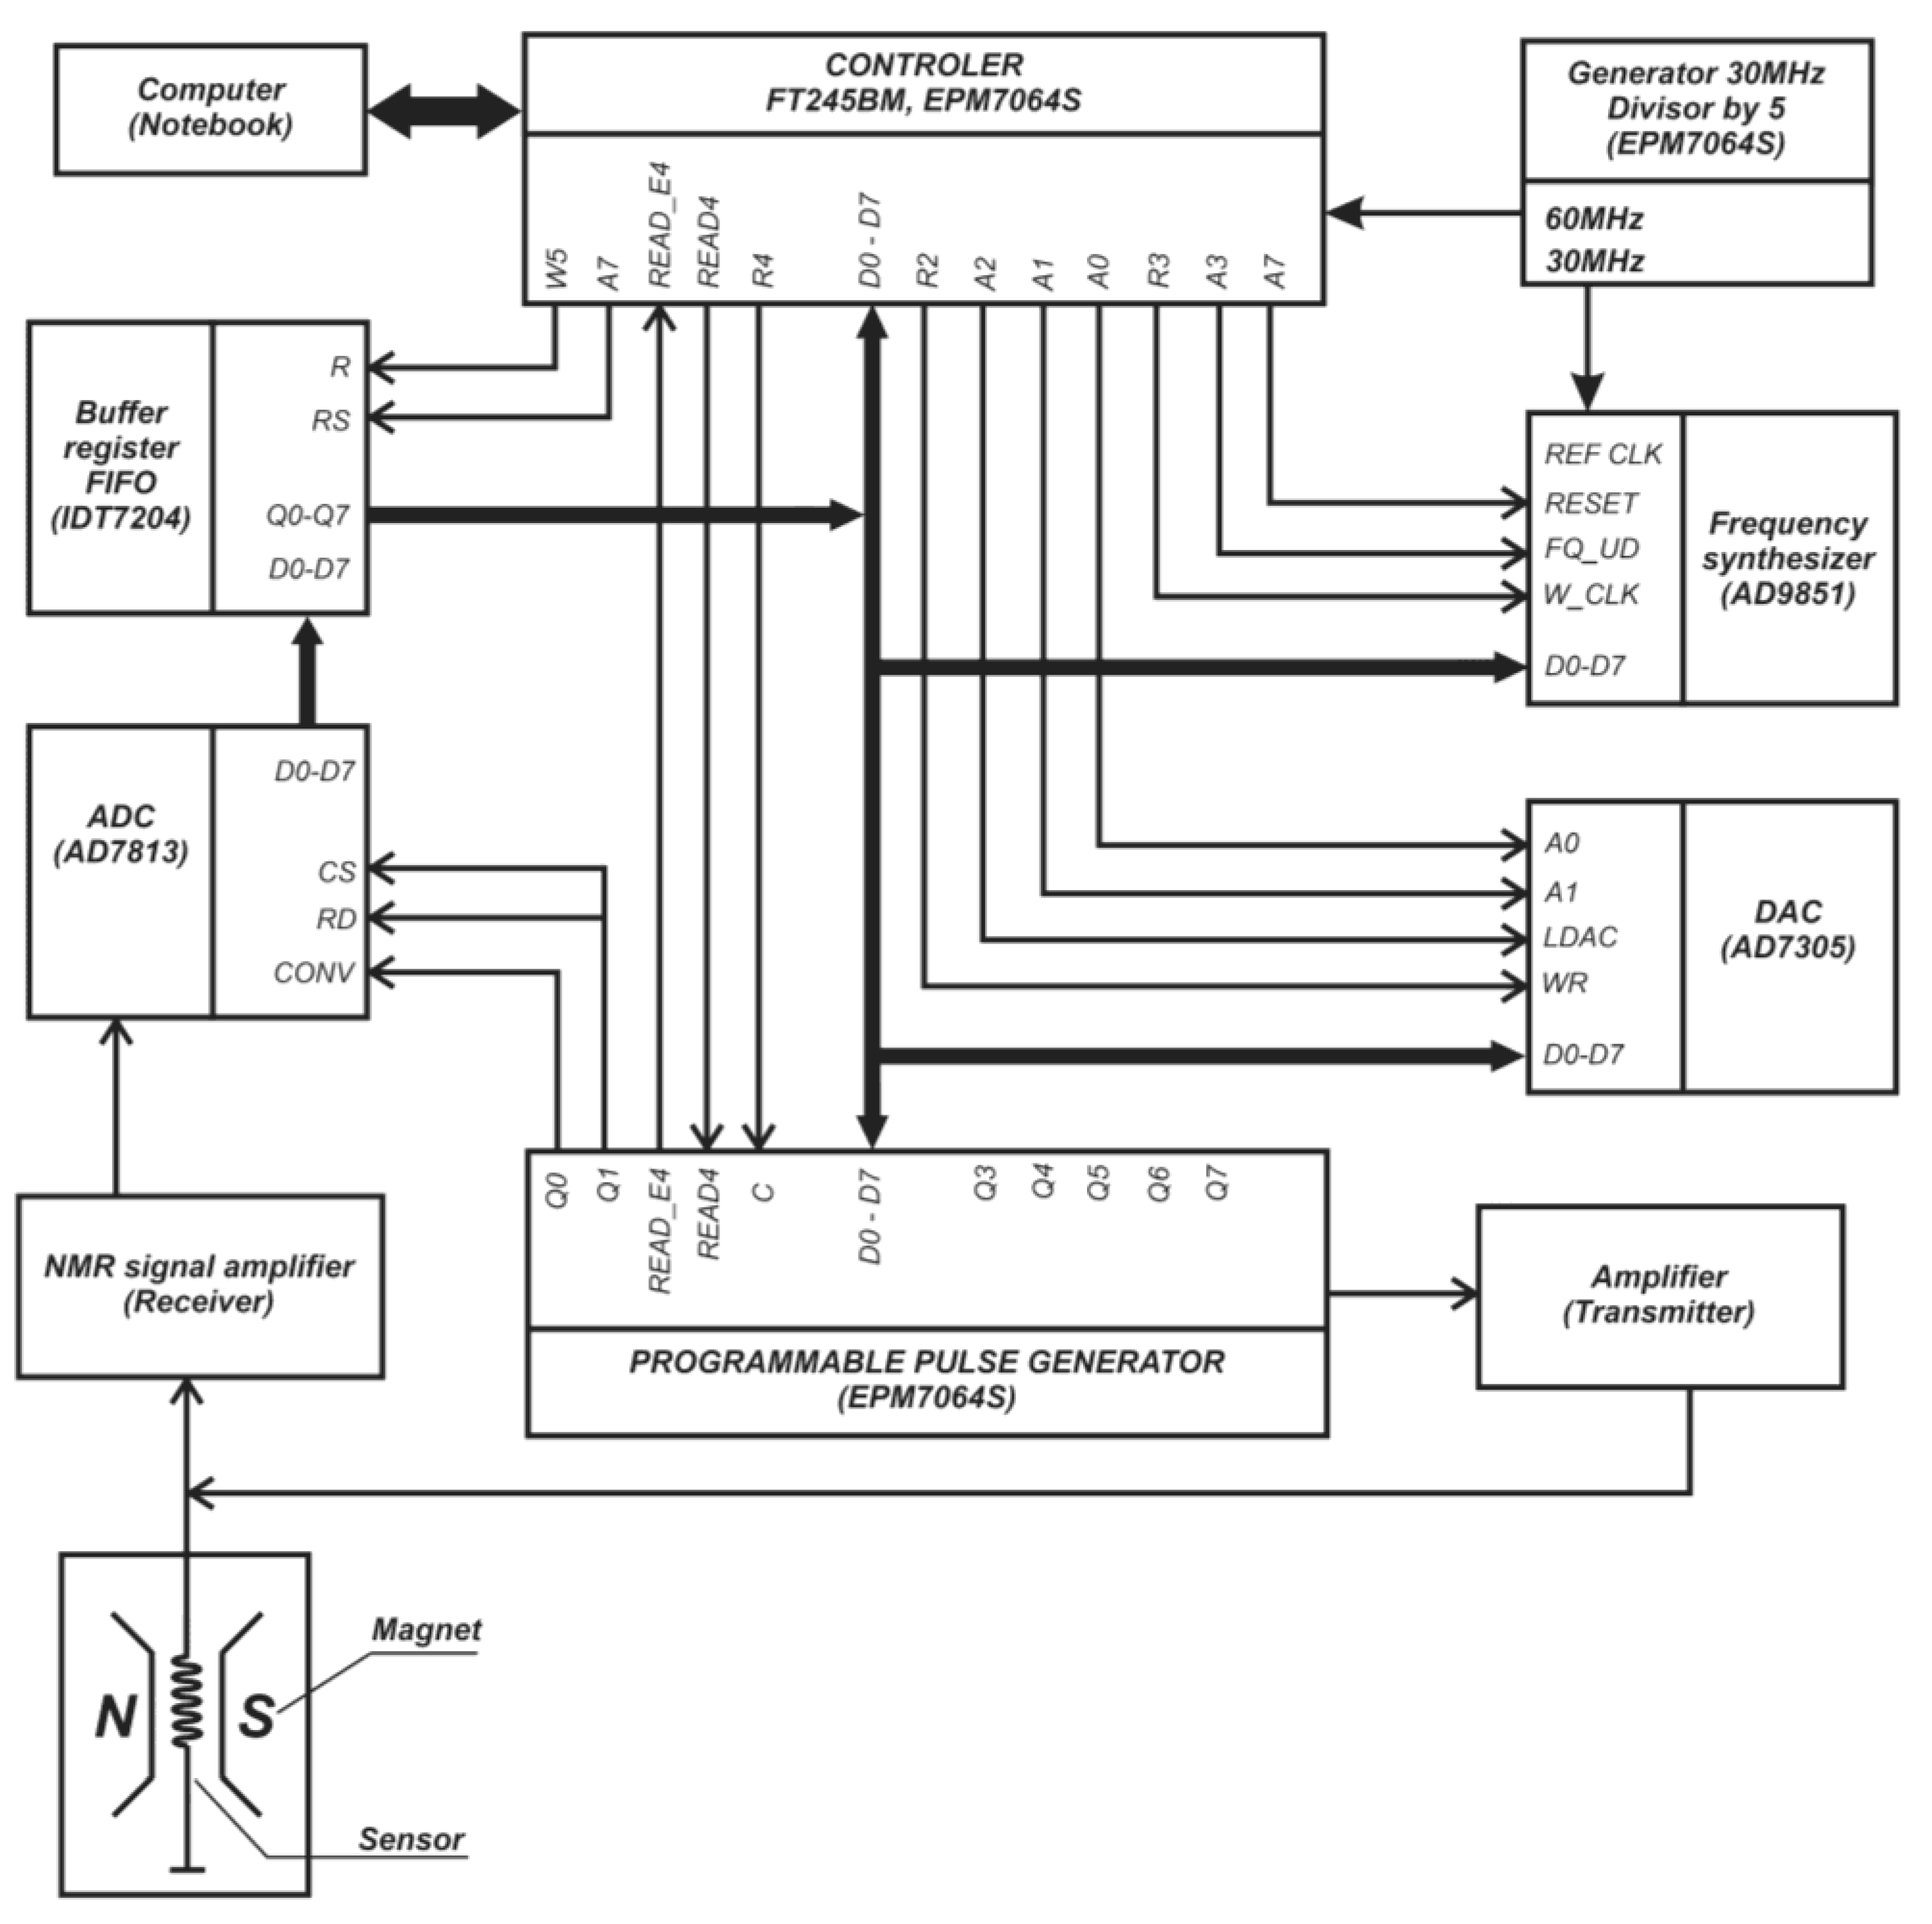
To implement the technology of the method, an AMC was developed for automatic flow measurement of ODS properties using PMRR. Figure 1 shows a block diagram of the test bench of the complex.
In the AMC, the NMR NP relaxometer [58,59,84] (which has no analogs) is the main module for determining the ODS properties. The relaxometer can be powered by a 12 V battery or the mains. The measurement time is less than 2 min. Its sensitivity is K = ν2D3 = 2700–4150 MHz2cm3. Using a laptop program, the envelopes of the spin-echo (SE) signals are decomposed into three exponential components to determine the PMR parameters, by which the ODS characteristics are calculated.
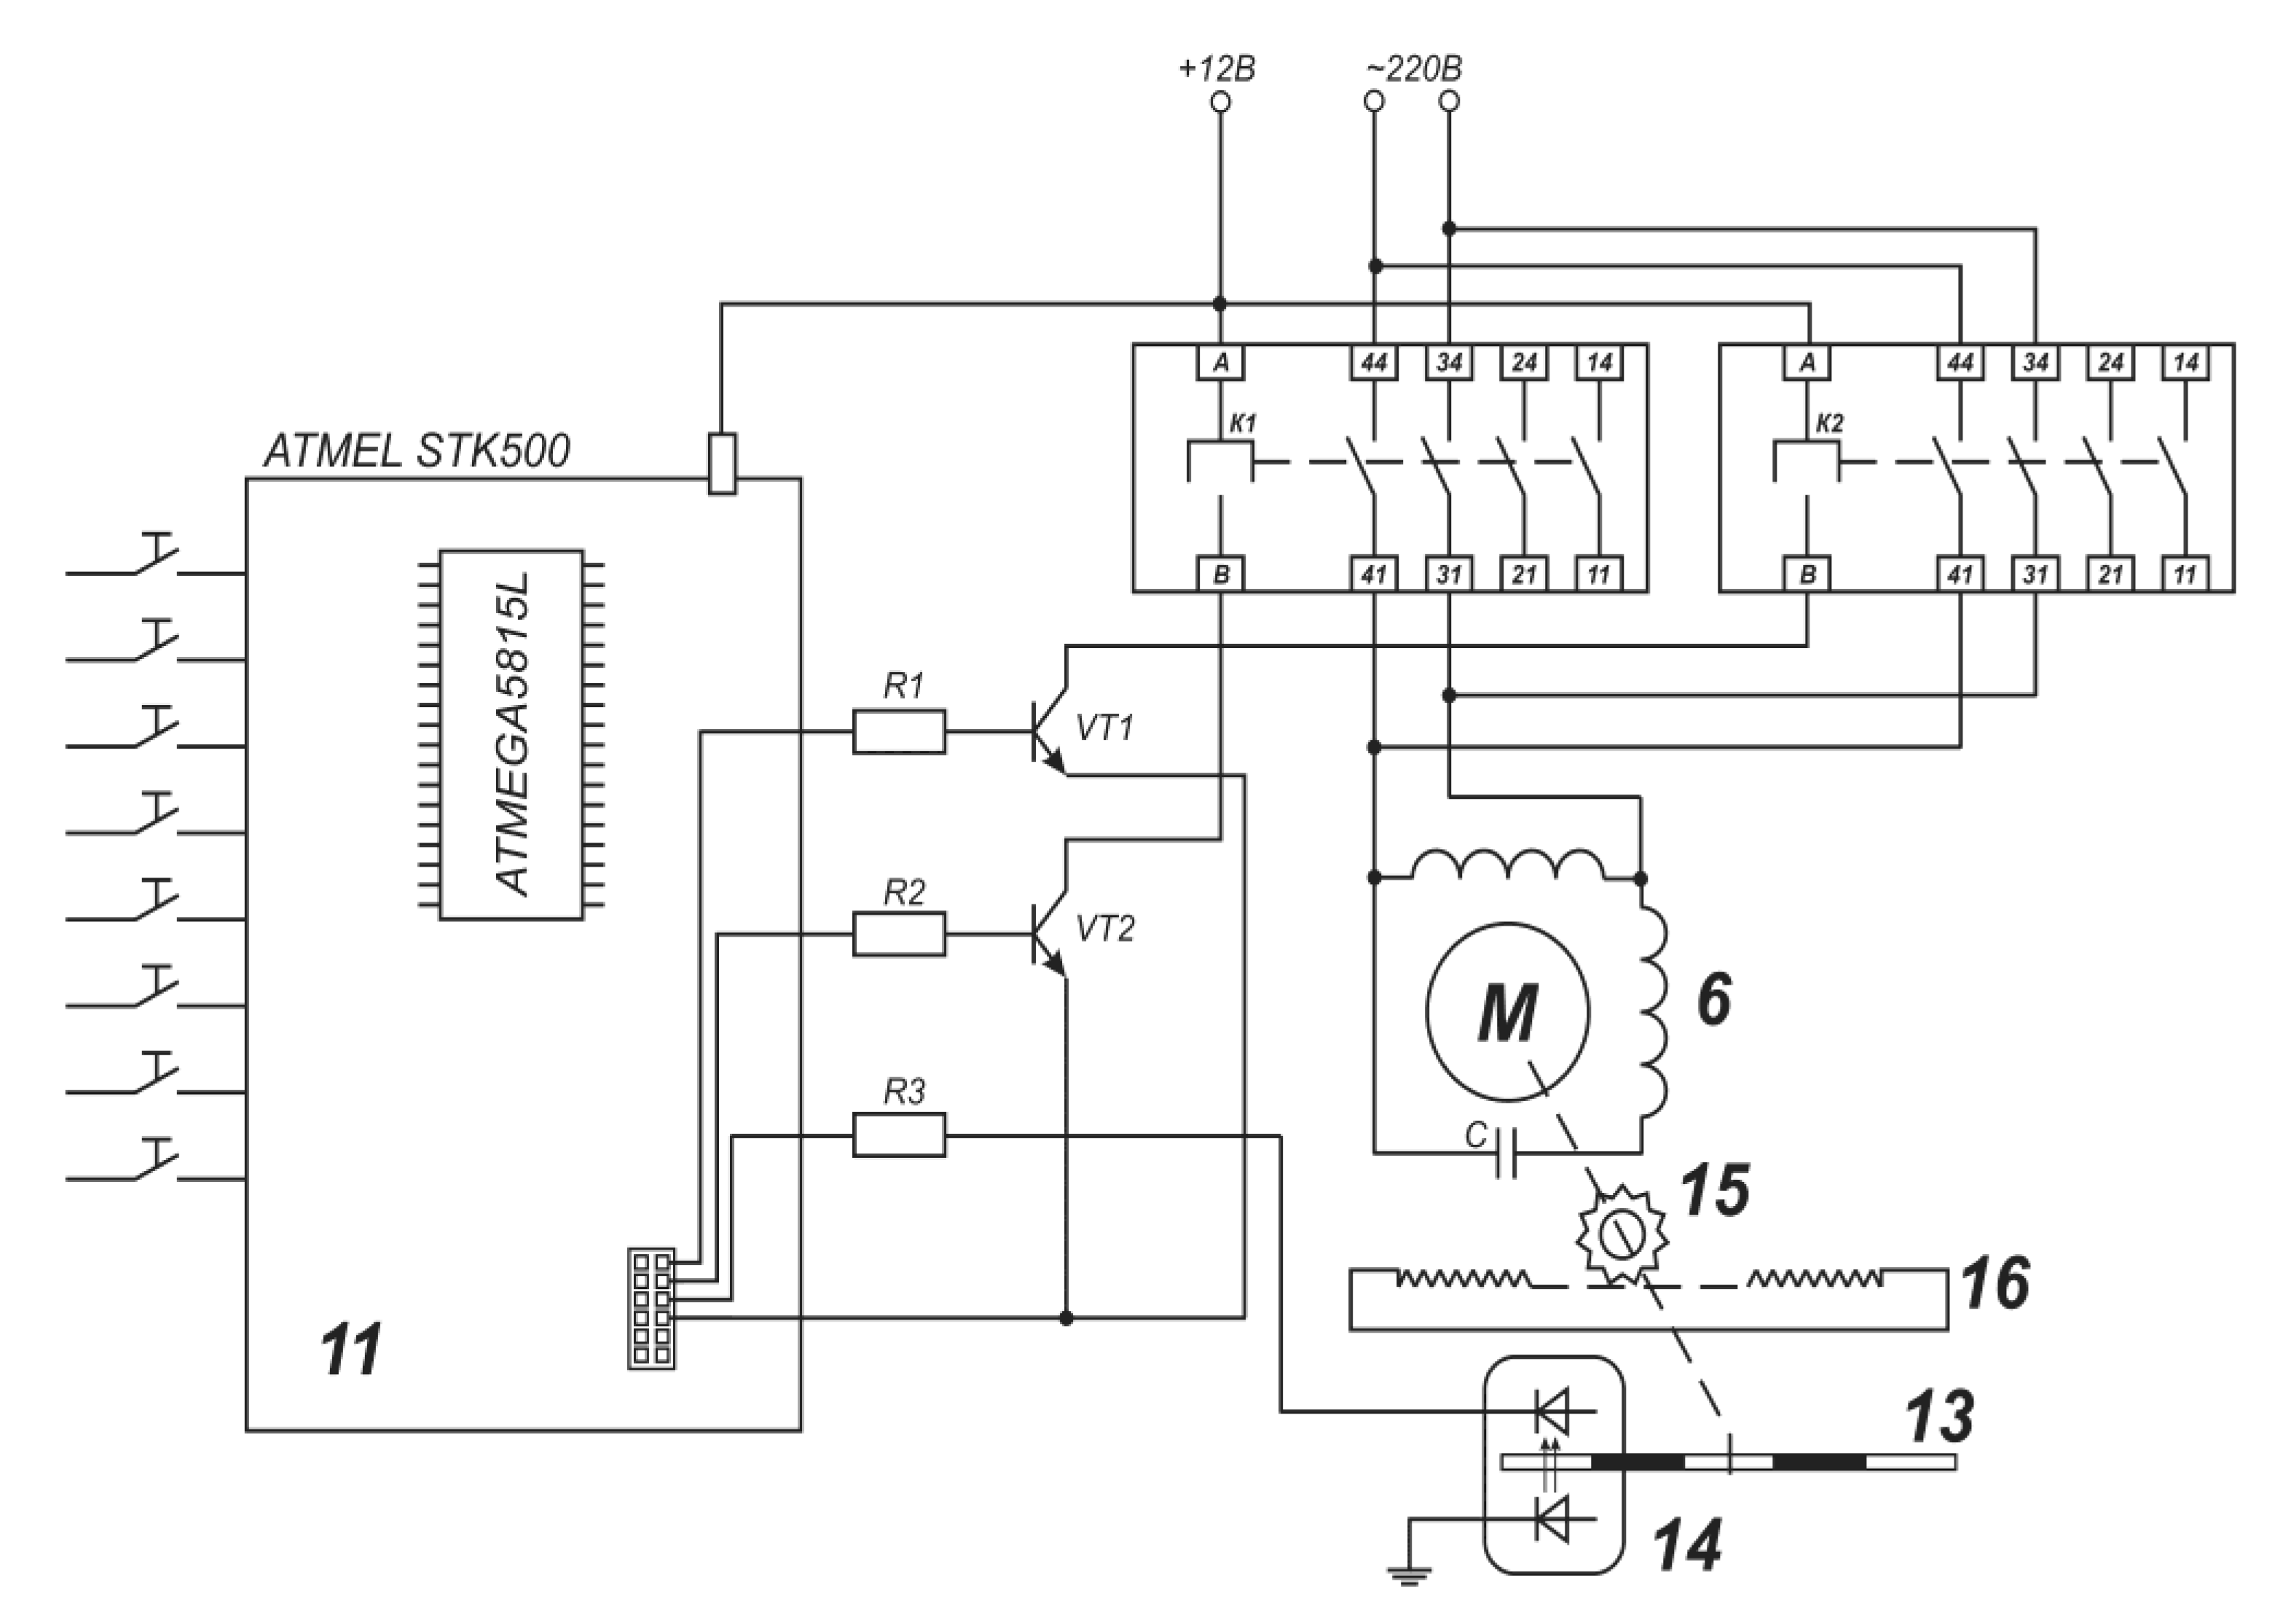
Figure 2 shows the electric principle diagram of the sampling system for controlling the sampling from a stream.
The principle of sample sampling is based on the Bernoulli equation, according to which, with a continuous flow, the change in pressure Pi in different sections S of the measuring tank 1 for flow velocity υi is described by the equation:
Pi/ρg + υi2/2g = const,
If flow rate Qi = SiυI is constant, then the pressures P1 and P2 in different sections S1 and S2 of the pipe will be connected by the equation:
PI/ρ + const/SI2 = P2/ρ + const/S22,
The ATMEGA 8515L microcontroller with the STK500 kit for Atmel AVR flash controllers on the SCKT3000D3 panel automatically controls the sampling systems of the AMC. A sampling of emulsions (a complex multi-component ODS) is carried out in small portions according to the ISO 3171 Code of Practice. The fluid flow entering tank 1 reduces the velocity υ at an increased pressure P (pressure and temperature are controlled by sensors 12 and 13) in proportion to the square root √S of the cross section according to Equation (2). Under the action of the pressure difference (PPPB) between the pipeline (on the bench—between tanks 8 and 1), the pressure PP in the position of the nozzle 2* and P2 in any position 2 in tank 1, all three components (water, oil, and gas) are intensely turbulent are mixed and homogenized in tank 1, and then the sample is delivered through the pre-polarizing Halbach magnets 3 with magnetic induction Bo = 0.48 Tl to the measuring radio frequency (RF) coil 4, located between the pole pieces of magnet 5 made of an alloy based on the rare earth element NdFeB-37 with magnetic induction Bo = 0.336 Tl (resonant frequency on protons νo = 14.32 × 10⁶ Hz) and field inhomogeneity δBo = 10−3 in 1 cm3.
Due to the coiled sensor coil, the RF field B1 inhomogeneity is less than 2% in 75% of the sample volume. To measure flow rates, the nozzle is located in position 2, for which the dependence of the spin-spin relaxation times T2* in the flow at the maximum steepness of the dependence is pre-calibrated and entered into the laptop database. For measurements of emulsion properties, the nozzle is placed in position 2*, at which the pressure difference (PPP2) = 0, and thus the liquid in coil 4 is stationary. This eliminates the need for explosion-proof valves. In addition, the branch pipe can be moved with the help of an electric drive 6 controlled by ATMEGA 8515L 11 to any section of tank 1 at a distance from 1 to 150 mm with a step of 5 mm and, accordingly, sampling can be done from any section; it is possible to average over all sections. The movement of the branch pipe connected to the band 16 is controlled by the obturator 13 on the axis with the rotor of the electric drive 6, the rack-wheel 15, the number of rotations of which is counted by photodiodes 14 according to the rotations of the obturator 13 (see Figure 2). In coil 4 of sensor magnet 5, the sample is irradiated with the known Carr–Purcell–Meiboom–Gill (CPMG) sequence 90° − τo − (180° − 2τo)NT, where N is the number of 80°-pulses, T = 9 s—series start period, the time between pulses τo = 200 μs. Between 180°-pulses, spin-echo (SE) signals with amplitudes Ai are formed and transmitted via cable to the receiver amplifier of the relaxometer 10 (Figure 3).
PMR parameters are generated from measurements with a relaxometer, the electrical circuit shown in Figure 4. The measured liquid is squeezed out of coil 4 by the next portion from tank 1 and poured into a separate container to confirm the analysis result with a PMR laboratory relaxometer or alternative methods. The remaining liquid not selected for analysis is pumped into tank 8.
The process of measurements in the deposit is organized according to explosives and fire safety requirements. The cable length must be l = λo/4 or 3λo/4 = 5.5 or 16 m (antinode of the standing wave), long enough for fire safety, where λo = co is the resonant wavelength, c—light velocity. Then, analog signal data are transferred to an analog-to-digital converter (ADC) 11 and notebook 12, using the program for SE exponential envelope decomposition by equation A =Ai exp(−t/T2i), and equations, correlating PMR-parameters with the oil characteristics, oil properties are obtained. Relaxation times T2i and proton phase concentrations are attributed to i = A, B, C phases in water, light (benzene), and heavy (oil residues) oil fractions.
To measure the values of magnetic induction, the developed sensor on the AD22151YZX chip that implements the Hall effect was used. A special program of the Arduino Uno/Nano microcontroller calculates the field value using a 10-bit ADC with a frequency of 10 kB/s. The data are calculated and displayed via the Arduino USB port on the laptop monitor. With a 5 V supply and an output ratio of 0.4 mV/G, the maximum measurement range is Bo = 1.25 Tl.
The developed AMC has the following advantages:
  • Versatility and ease of installation in production lines, and control of opaque, aggressive liquids in real time.
  • A wide range of measured ODS characteristics in the entire range of their changes: velocities υi of the fluid component flows; concentrations of water W and oil O, gas factor G, density ρ, viscosity η, and concentrations of ARP; and molecular weight and pour points. Multi-component analysis by a single complex, and selection of homogenized samples from pipes of any diameter in the bypass mode.
  • Lack of contact with the measured liquid and, therefore, the absence of its destruction and destructive effect on the equipment. No moving parts for measurements.

3. Results and Discussion

The possibilities of online flow measurements using PMR relaxation are determined by the following: the liquid flowing into the RF coil of the sensor in the gap of the magnet of the PMR relaxometer has the magnetization MIN, and the fluid flowing out of the coil has the magnetization MOUT, then the magnetization M of the liquid flowing in the coil through its volume V at an average flow rate Q will change at a rate of:
dM/dt = (MINMOUT)Q/V,
The equation describes the rate of magnetization M change due to relaxation processes:
dM/ dt = (M0M)/T2,
If the conditions MIN = M0 and MOUT = M are true, then the change in the M rate will be:
dM/dt = (M0M)(1/T2 + 1/T2/) = (M0M)/T2*,
where T2/—is the time of liquid being in the RF-coil, at which the 1/e part of depolarized protons is substituted by the polarized. If the probe head liquid is fully mixed, then T2/ = V/Q. However, it is true only for one-phase liquid.
For two-phase oil–water emulsions, the correctness of Equation (5) is confirmed by us experimentally. For 100% water, 90%, 75%, and 25% emulsions were received dependences of effective spin-spin relaxation rates (T2eff)−1 from the flow velocity υ in the range υ = 0 ÷ 0.7 m/s, presented in Figure 5.
For used emulsions, the dependences are two-component, and with correlation coefficients, R2 = 0.93–0.99 and mean quadratic error S = 0.01–0.08 for υ > 0.2 m/s are described by the equation [56,57,58,59,63,70,79]:
υ (m/s) = k1 exp(−k2·T2),
where k1 (m/s) = 6.2; 6.1 and 24; k2 (s−1) = 3.2; 3.7 and 13.8 for 90%, 75%, and 25% emulsions. For υ < 0.2 m/s for the same emulsions, the equation is:
υ (m/s) = k3/T2 − k4,
where k3 (m) = 0.45; 0.76 and 1.77; k4 (m/s) = 0; 0; 1.355.
Coefficients k1, k2, and k3 depend on water concentration W in emulsions [56,57,58,59,63,70,79]:
k1 = 40.2 exp(−0.022W),
k2 = 24.1 exp(−0.023W),
k3 = 3 exp(−0.02W),
Equations (8)–(10) are necessary for the choice by the computer program of grade curves for flowrates υPMR from T2eff−1 measurements. In addition, as the spin-echo amplitude envelope can be decomposed on the several (usually three) components with proper relaxation times and proton phases concentrations, an opportunity appeared for the determination of flow viscosities υi and yields of emulsions components Qi using the equation [56,57,58,59,63,70,79]:
Qi = υi·S = Q·Aoi/∑Aoi,
where S—pipeline cross section, and Aoi/∑Aoi—protons concentration of the i-th component in emulsion (water or oil fractions), determined from the spin-echo amplitude envelope.
For the trustworthy proper appreciation of Equation (5) and precision of the curves in Figure 5, relaxation times T2oW and T2oO in the immobile water and oil are compared, estimated from the curves with the relaxation times, and calculated from Equation (5). From curve 1 in Figure 5 for immobile water a relaxation rate (T2oW)−1 = 0.43 s−1 is received, which corresponds to T2oW = 2.32 s and differs from T2W = 2.26 s received from a direct measurement in immobile water on 0.06 s. From curve 3, the most complicated for measurements, emulsion (due to phase inversion at W ~ 75%) was received (T2o75)−1 = 0.654 s−1. Considering the different contributions of the components in this 75% emulsion, a value of (T2o75)−1 is calculated considering the percentage of 75% and 25% of the phases by the equation [56,57,58,59,63,70,79]:
(T2o75)−1 = 0.75(T2oW)−1 + 0.25(T2oO)−1 =1.375,
where (T2oO)−1 = 1.37. The result from Equation (12) calculation corresponds to T2oO = 0.727 s, which differs from T2O= 0.7 s of direct measurement on 0.027 s. These trustworthy appreciations confirm the accuracy of the measurements in the range of error limits.
For 90% and 25% emulsions, the dependences can be described with correlation coefficient R2 = 0.95 by equations [56,57,58,59,63,70,79]:
υ (m/s) = 1.77/T2*(c) − 1.35,
υ (m/s) = 6·exp(−3.7·T2*(c)),
and the dependences are a monocomponent.
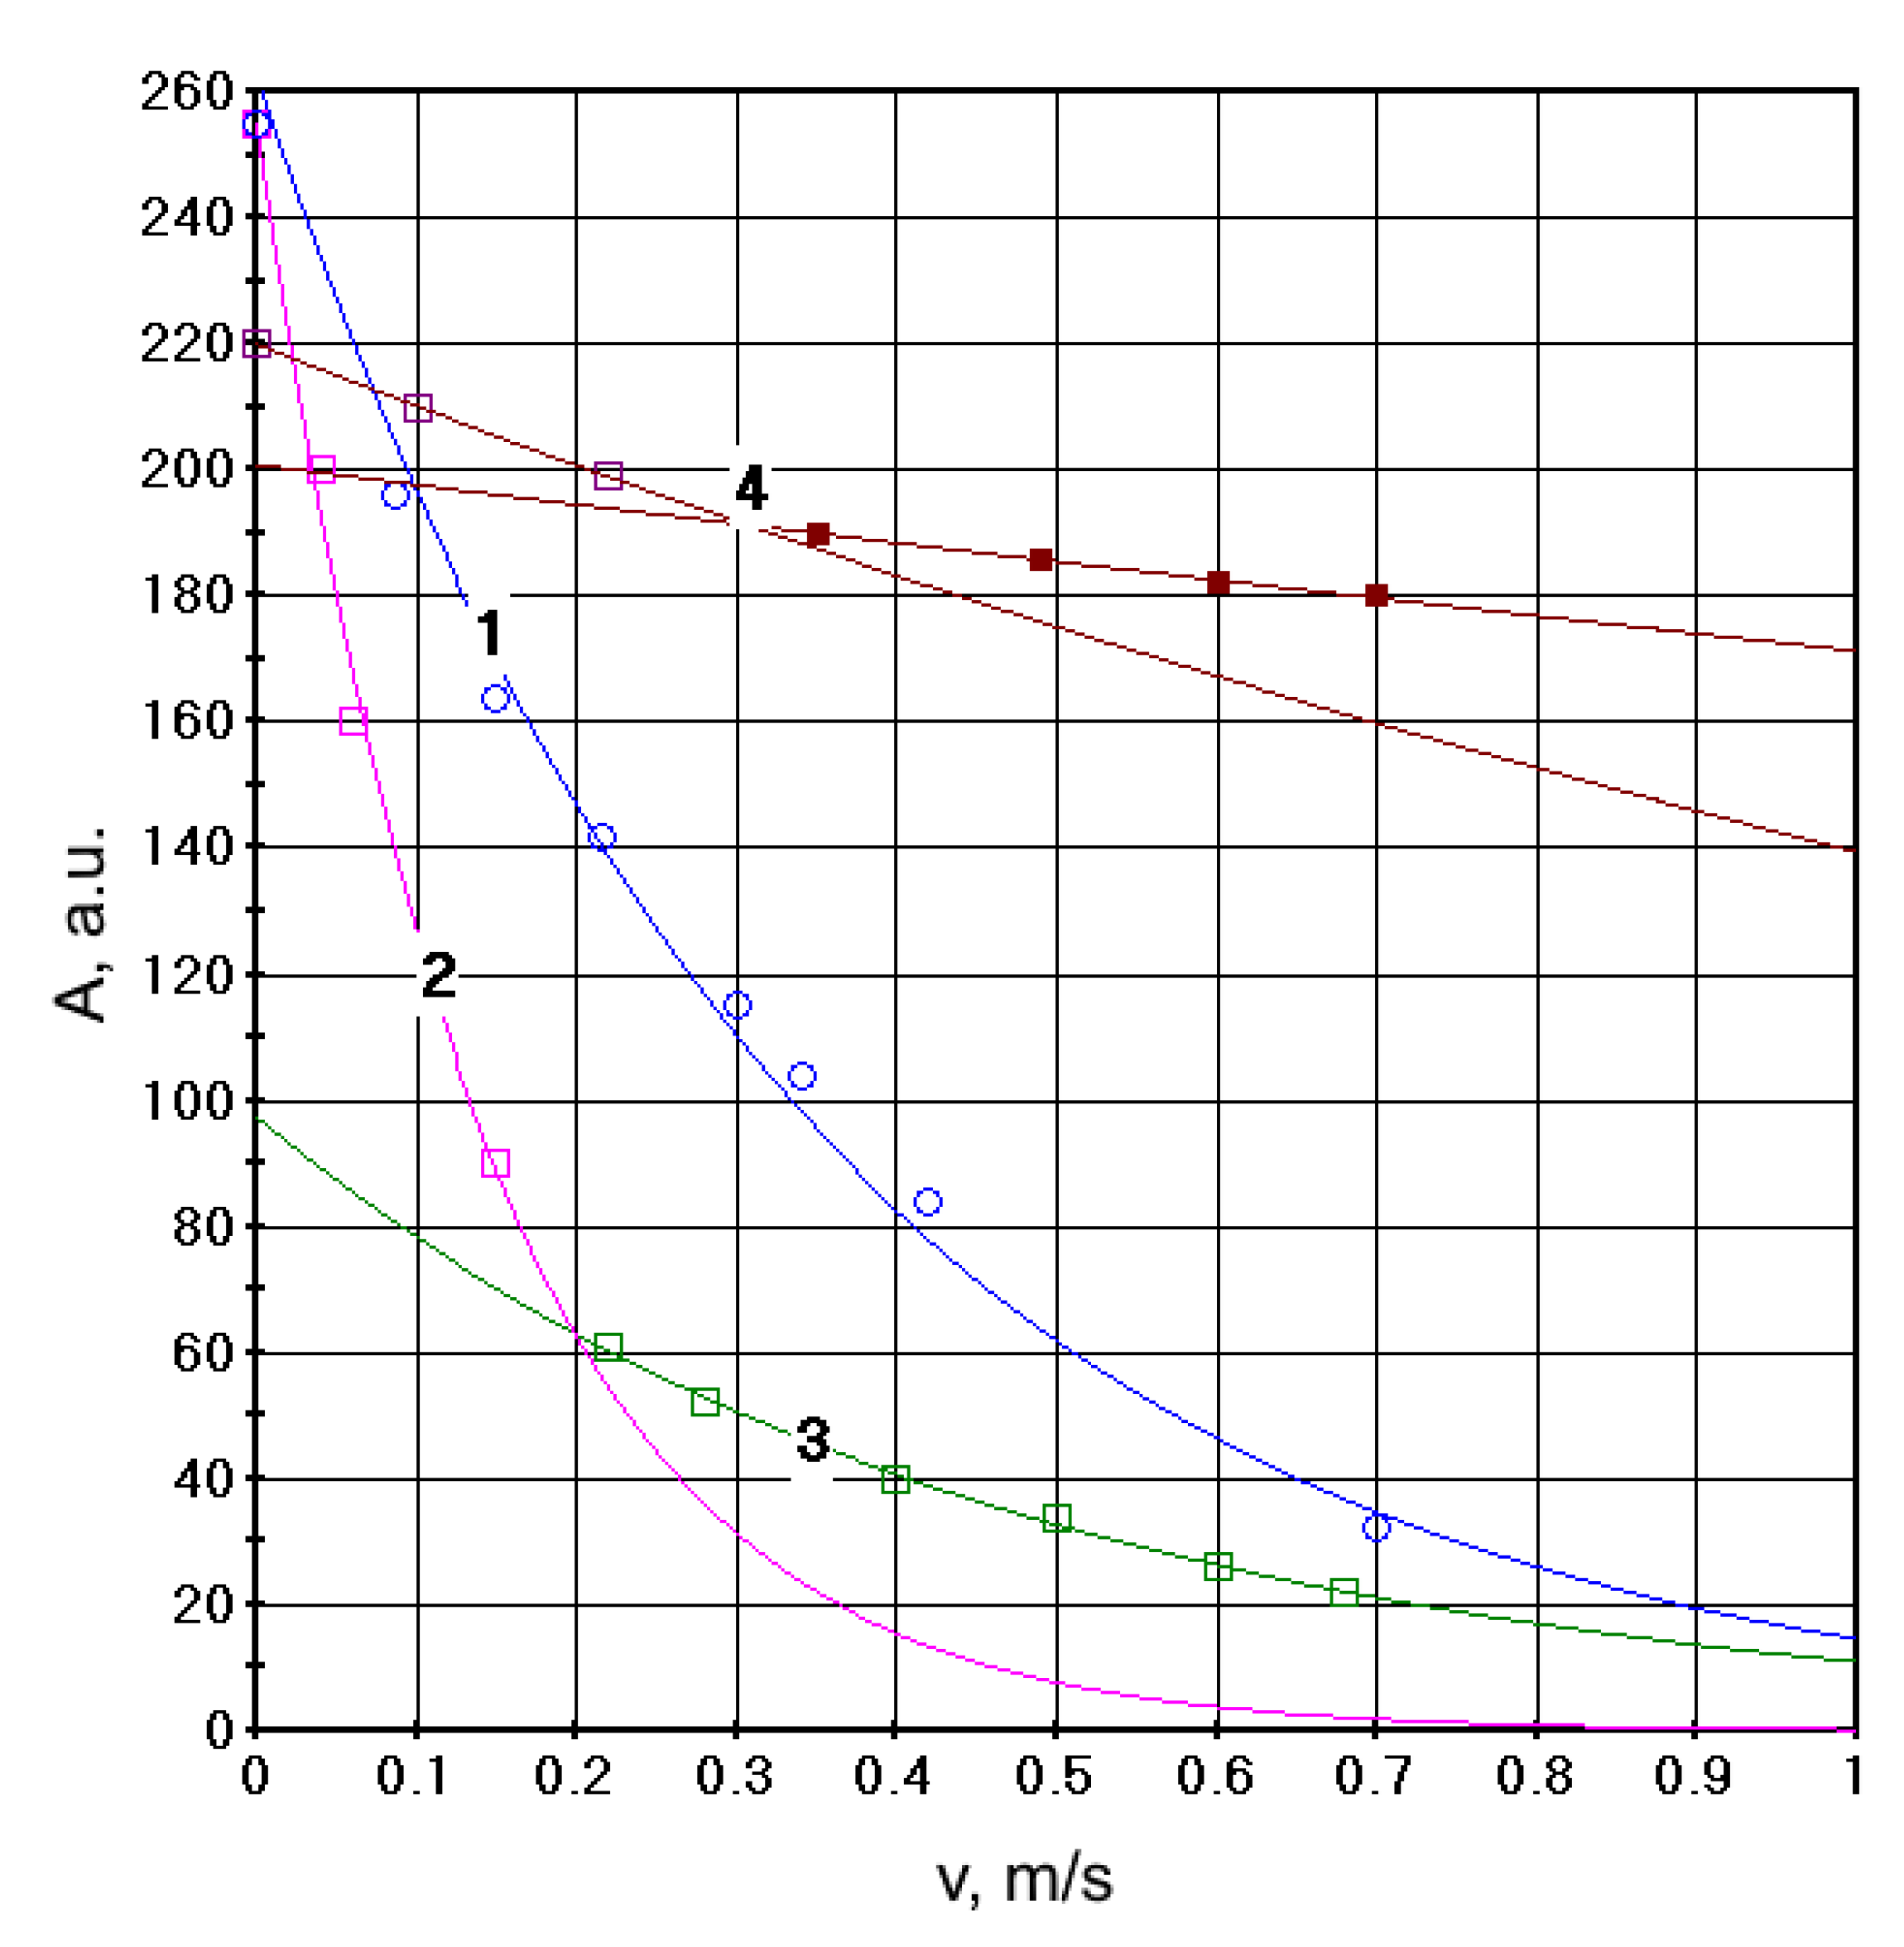
The dependences of SE amplitudes A (a.u.) from flow velocity υ (m/s) for the same water and emulsions were also established. They are presented in Figure 6.
So, the flow rate can alternatively be determined from relaxation rates and echo amplitudes with error δ < ±2.3%.
Elaborated methods for the express control of crude oil properties have the following algorithm:
-
Measurement of the spin-spin relaxation times and SE amplitudes Ai in immobile water T2W and oil/oil product T2O in the time range t = 2Nτ, where N—number of RF-pulses in the CPMG-sequence 90° − TτoT[180° − 2τo]NT;
-
Online measurement of the effective spin-spin relaxation times T2* in flow emulsion and using them for:
  • Determination of water concentration in emulsion by the relation [56,57,58,59,63,70,79]:
WПMP= T2W (T2* − T2O)100%/T2* (T2WT2O),
The accuracy of single measurement in the range 0.5 ÷ 100% δ ≈ ±1% in the immobile sample and δ ≈ ±3% in flowing liquid, which is better than for the nearest analog MERA-MIG with δ ≈ ±10% in the range 70–95%. The measurement time is three times shorter.
2.
Determination of gas saturation of the oil-well liquid GPMR in the range GPMR = 0–250 with error δ ≈ ±3.8% using the equation [56,57,58,59,63,70,79]:
GPMR = KG(A0 − AG)/A0,
where A0 and AG—initial SE amplitudes in the filled by liquid probe head and filled oil-well liquid, containing gas, KG—correction coefficient. It should be mentioned that PMR parameter GPMR allows for the control of specific energy consumption (SEC) at pipeline transportation because for SEC and GPMR, the following equation is valid:
SEC = 155.3 − 0.796GPMR,
3.
Measurement of oil density ρo in the expanded range 700–1200 kg/m3 with main reduced error ∆ρ/ρmax~±1%:
ρo = κ1κ2 (T2A) − κ3 (T2A)2 for ρo = 700–900 kg/m3,
ρ0 = κ4 exp[−κ5 (T2A)] for ρ0 = 900–1100 kg/m3,
That is more precise than the inflow densitometer PLOT-3B-1P with a main reduced error = 1.3%. The measurement time is six times shorter.
4.
Measurement of viscosity with a main reduced error of about ±1.5%, by [56,57,58,59,63,70,79]:
ν = η/ρ = (1.12/ρ)·(T/298·T2A)1.25,
which is more precise than the inflow viscometer Viscosite with δ = ±2%.
5.
Measurement of integral characteristics of disperse size distribution of water droplets in emulsions by spin-lattice relaxation times T1W using equations from [56,57,58,59,63,70,79]:
DCA (μm) = 0.164 exp(2.84·T1A (s)),
Dmax = 0.32·exp(1.37·T1A),
r3/2 = D3/2/2 = 2.40·(T1A)4,27,
6.
Measurement of oil mean molecular mass with the error δ ≈ 2.1% in the expanded range MM = 50–1000 a.u.m. using the equation:
MM (a.u.m.) = 3011 + 3871.3 exp(−5.585T2O),
7.
Measurement of temperatures of freezing in high paraffinic oils in the range TFR = −16 ÷ +56 °C using the equation [56,57,58,59,63,70,79]:
TFR (°C) = 275 − 0.62T2A + 2.8 × 10⁻⁴ (T2A)2,
8.
Measurement of salts concentrations C in water using the equation:
C (M) = 24.35T1W−1 − 5.8,
9.
Measurement of asphaltene–resin (AR) concentrations in the whole range with error δ ≈ ±1% using equations [56,57,58,59,63,70,79]:
AR(%) = −3.76 ln(T1A) + 25.8,
AR(%) = −2.76 ln(T2A) + 14.6,
Instrumental methods for AR determination are not found.
The component of the strength moment MC of the pump electric drive, considering the formation of stresses at water drops/oil boarders, is determined by the resistance of the oil-well liquid in which the pump works. It originates additional resistance to the pump’s electric drive shaft, caused by the necessity to overcome the forces of the surface tension between the droplets of water and oil border. Resistance depends on gas factor and water W content because the density and viscosity depend on these characteristics.
MC= HQ/ωηH+ MC0(1 − G) (1 + ρH/ρ),
where H—is the pressure head, ω—is the rotatory rate of the electric drive shaft, and ηh—the coefficient of efficiency (CE). Introducing in Equation (29) the dependences of oil-well properties (Q, G, W, ρO) from PMR-parameters Equations (11), (15)–(18), (20), and MC is received at mean oil-well liquid temperature T = 50 °C [56,57,58,59,63,70,79]:
MC = HKCS[(T2*)−1 + (τ)−1]/ωηH + MC0[1 − (A0AG)/A0][1 + (896.7 − 18.557(T1O) − 130.8(T1O)2)]/[65ln[T2W(T2* − T2O)100%/T2*(T2WT2O)] + 830],
where KC—pipeline reduction coefficient, S—pipeline section, τ—time of liquid presence in the coil.
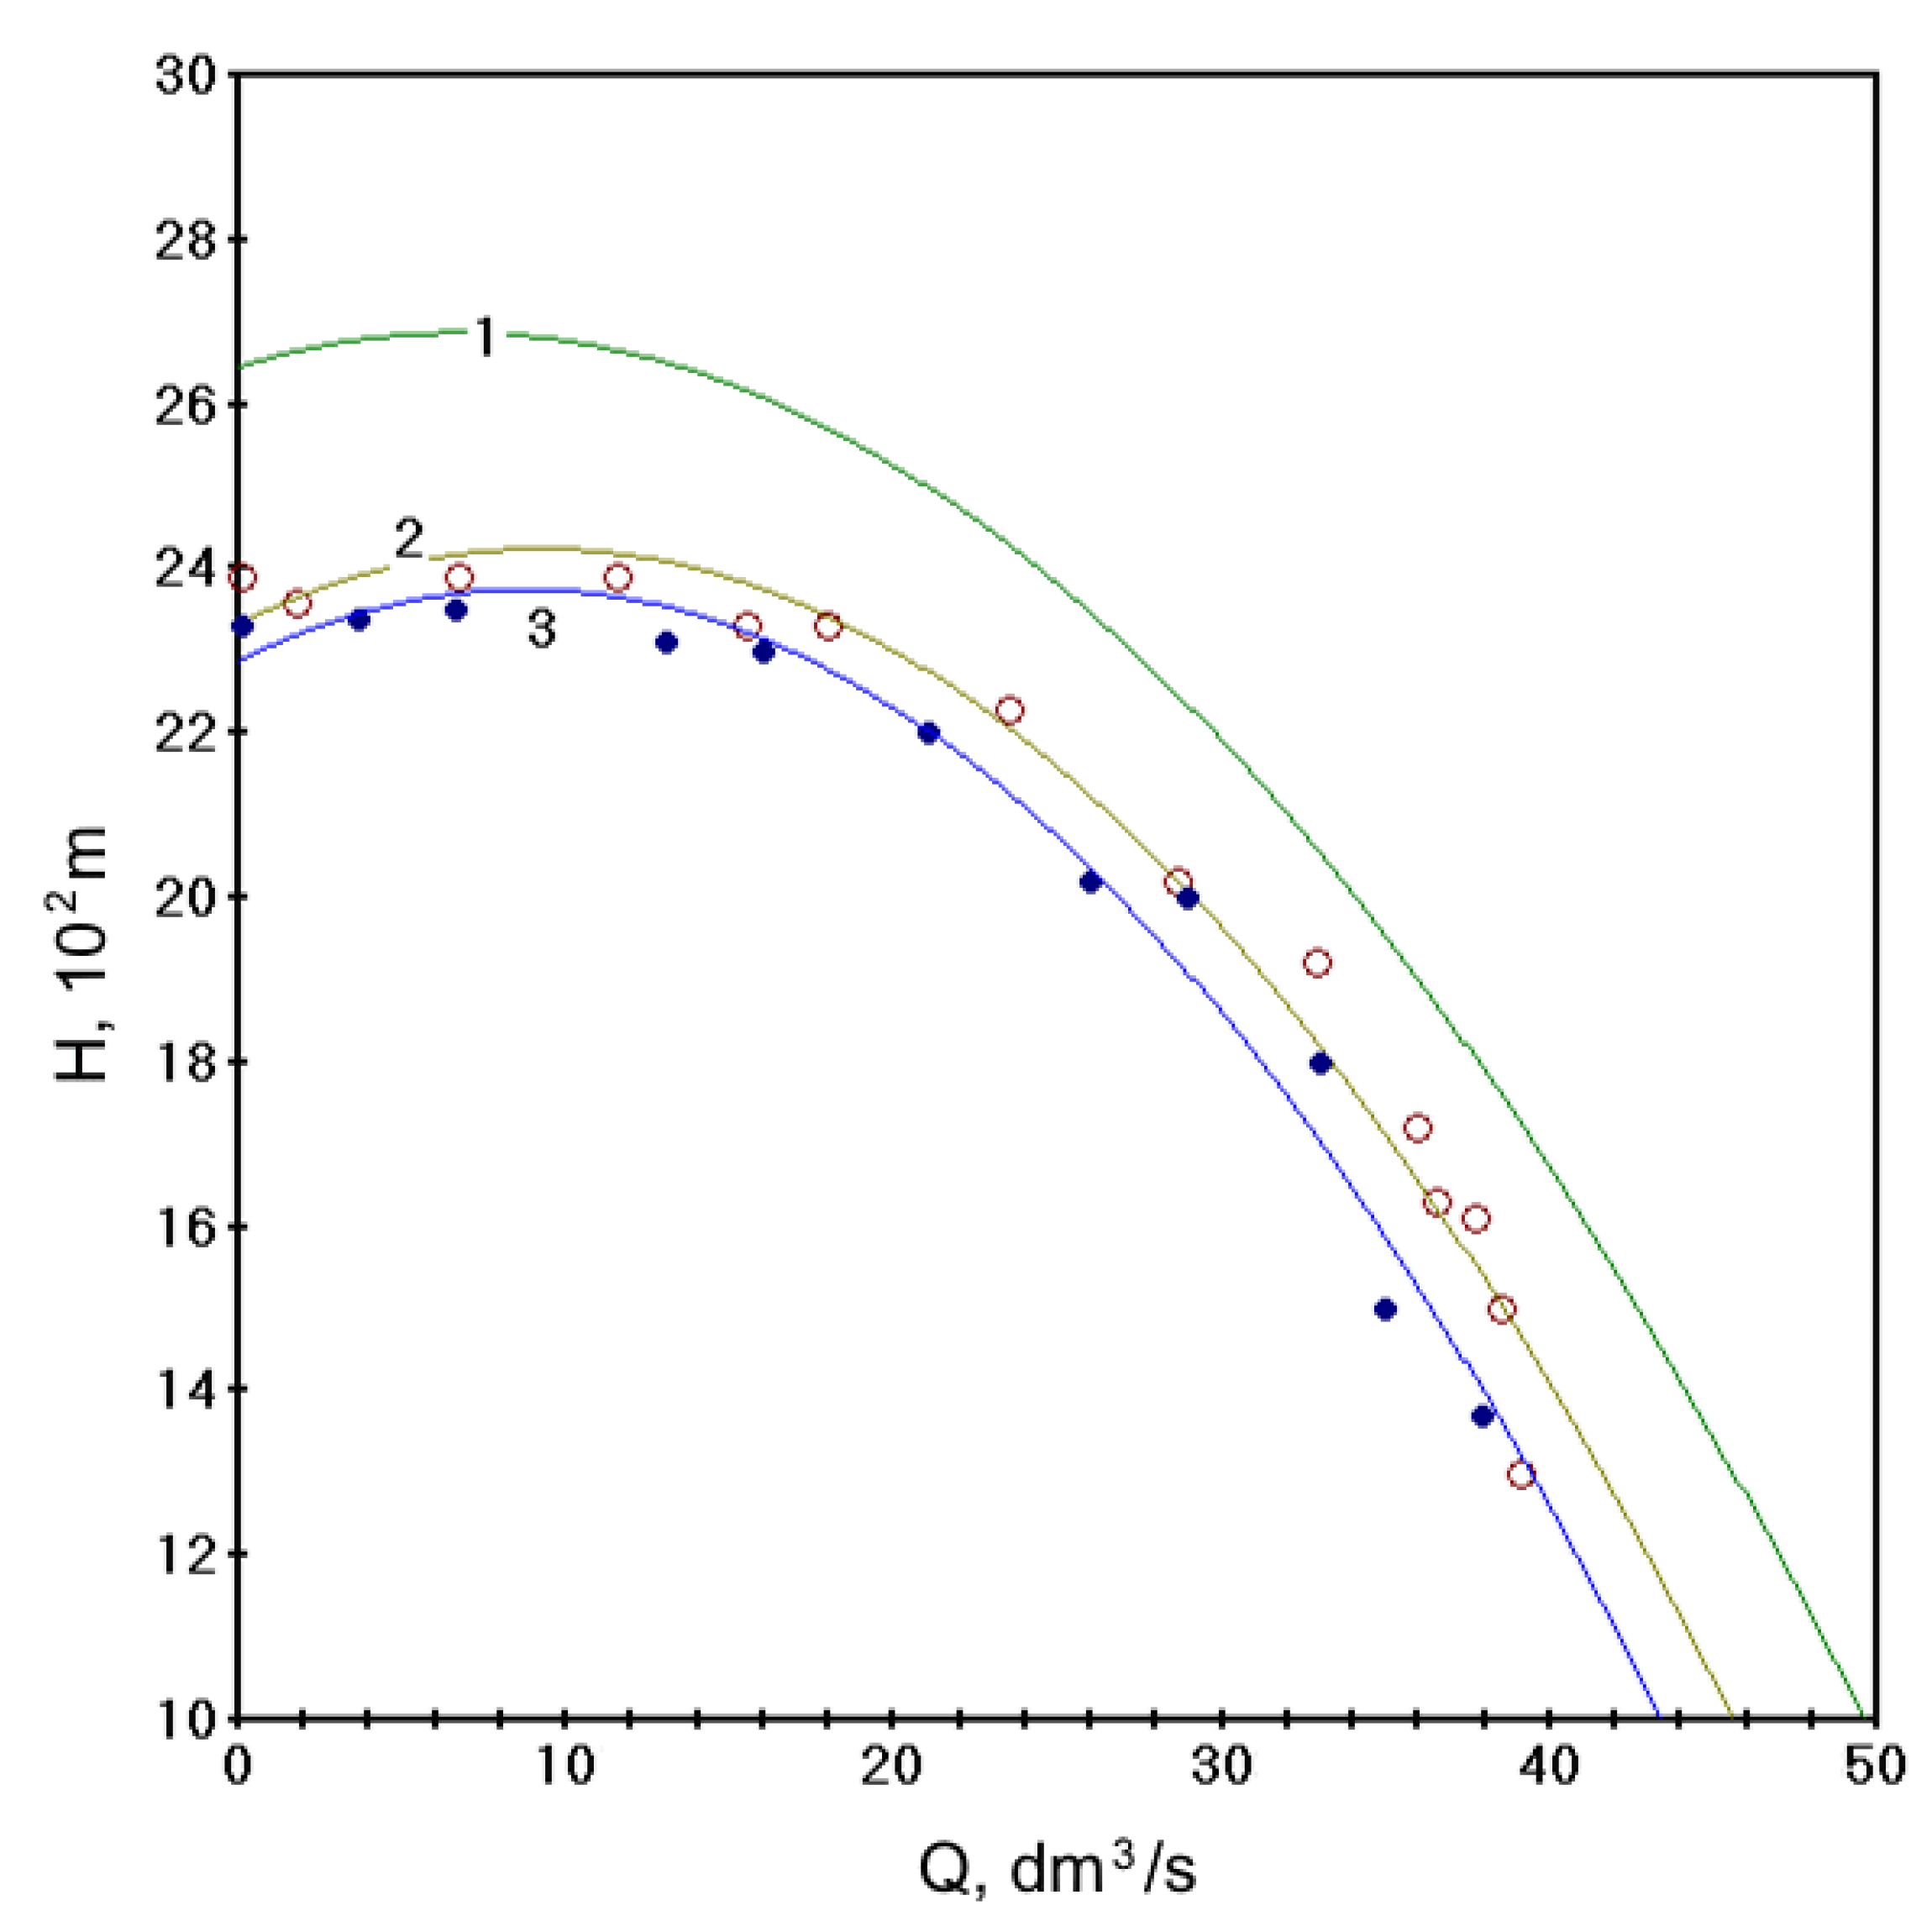
Figure 7 presented the dependencies H = f(Q) for oils with ρ = 882 kg/m3 (curve 2) and ρ = 888 kg/m3 (curve 3). Curve 1—for water.
From Figure 7, the experimental parameters of the borehole are the following: Ho = 2340 m; H = 1800 m; and Q = 30 l/s = 0.03 m3/s. So, C = (H0H)/Q2 = 6000. At the pump rotation rate ω = 1450 r/min = 151.8 rad/s A = H0H2 = 0.001 m·c2/rad. If ηH = 0.51, then using equation ηH = HQ/Pmec, we can calculate the mechanical power Pmec = HQ/ηH = 1.06 kW, and the value of the additional resistance moment M/C for the flow rates in the range 33–36 l/s will be M/C = ΔΔQ/ωηH = 1.7·3/151.84·0.5 = 0.68 N·m. To overcome this M/C and convert the oil mining productivity curve H(Q) for oil with density ρo = 888 kg/m3 to a productivity curve for more light oil, the pump power consumption must be increased on ΔP = ΔΔQH = 10.2 kW, which can be done by increasing of rotary rate of electric drive on Δω = ΔPM = 15 Hz by frequency inverter. Flow rate control, instead of the usually used turbine flowmeters, having a great error on multiphase liquids, can be performed by AMC using the PMR-relaxometry method and Equations (1) and (2) for determination of the different phases flow velocities υi in the sections Si of pipes of any diameters and by calculating Qi = υi·Si.
For estimation of electric energy consumption Wp.c at pipelines oil transport proposed to use the equation [56,57,58,59,63,70,79]:
Wp.c = 0.496ρ1.22(Sυ/L)2.75·ν0.28L/ρ1.25d4.75ηpp + 2.726·104·ρ(ΔzSυ/Lηpp)(ηped),
where V—the volume of the transported oil, m3 (flowrate is V/t); t—measurement time, ν—kinematic viscosity of oil, m2/c; L—longitude of the pipeline, m; d—equivalent diameter of the pipe, m; ηpp—efficiency factor for the part of a pipeline; Δz—static head; and ηed and ηp—efficiency factors of electric drive and pump. An equation must be considered that [56,57,58,59,63,70,79]:
ν (mm2/s) = 10−6ν (m2/s)10−3η(Pa·s)/ρ (kg/m3),
and density and viscosity depend on relaxation time T2A via Equations (18) and (20). Inserting them into Equation (31), the equation for energy consumption Wp.c from PMR-parameters is constructed [56,57,58,59,63,70,79]:
Wp.c = 7.6V2.75L−1.5d4.75ηnp·exp(7T2A)/(T2A − 0.017)1.25 + 2.873·107zSυ/Lηnp)(ηnased),
So, using AMC for permanent control of oil PMR-parameters, the energy consumption for oil transport by pipelines can be estimated.

4. Conclusions

The research results showed that using PMR as part of the AMC makes it possible to control most of the ODS properties in real time more efficiently than previously developed multifunctional complexes consisting of devices of different types. It provides more efficient process control in digital smart fields. In addition, the safety of oil production, treatment, and transportation facilities is increased, and the negative impact on the environment is reduced.
Preliminary assessments based on the results of the studies showed that the use of the methodology for monitoring the quality of ODS and wastewater could increase the lifecycle of oil production and treatment facilities by 2–3 times and reduce the number of accidents at the final stages of field operation. It should also be noted that the developed AMC makes it possible to control and manage oil purification processes from such impurities as salts, sulfur, asphaltene, resins, and paraffins. This prevents ARP deposits in the pipes.
It is essential to note the possibility of estimating ODS flowing through the pipes using the developed AMC in real time. It allows automatic control of the pump operating modes, reducing electrical energy consumption. In the standard mode, the work is based on the maximum amount of gas in ODS with the maximum electrical energy consumption. Evaluation of the additional moment of resistance on the shaft of a submersible electric motor of a centrifugal oil pump makes it possible to avoid the overload mode and increase the service life of the equipment.
The authors plan to continue research to adapt the AMC to severe operating conditions in automatic flow mode in cooperation with PJSC Tatneft for ODS with different properties and temperatures.

Author Contributions

Conceptualization, R.K. and O.K.; methodology, V.K.; software, N.D.A.; validation, R.K., V.D., N.D.A. and O.K.; formal analysis, V.K. and O.K.; investigation, R.K.; resources, R.K. and O.K.; data curation, V.K.; writing—original draft preparation, R.K.; writing—review and editing, R.K. and V.D.; visualization, N.D.A. and V.D.; supervision, R.K.; project administration, O.K.; funding acquisition, O.K. All authors have read and agreed to the published version of the manuscript.

Funding

The research is partially funded by the Ministry of Science and Higher Education of the Russian Federation under the strategic academic leadership program ‘Priority 2030’.

Data Availability Statement

Not applicable.

Conflicts of Interest

The authors declare no conflict of interest.

Nomenclature

ODSoil dispersed system
AMCautomatic measuring complex
PMRnuclear (proton) magnetic resonance
DSFdigital smart field
ARasphaltene–resins
ARPasphaltene–resins–paraffins
PMRRPMR relaxometry
RFradio frequency
SEspin-echo
ADCanalog-to-digital converter
SECspecific energy consumption

References

  1. Liu, Q.; Zhao, Z.; Liu, Y.; He, Y. Natural resources commodity prices volatility, economic performance and environment: Evaluating the role of oil rents. Resour. Policy 2022, 76, 102548. [Google Scholar] [CrossRef]
  2. Cengiz, E.; Babagiray, M.; Emre Aysal, F.; Aksoy, F. Kinematic viscosity estimation of fuel oil with comparison of machine learning methods. Fuel 2022, 316, 123422. [Google Scholar] [CrossRef]
  3. Xu, Y.; Lun, Z.; Pan, Z.; Wang, H.; Zhou, X.; Zhao, C.; Zhang, D. Occurrence space and state of shale oil: A review. J. Pet. Sci. Eng. 2022, 211, 110183. [Google Scholar] [CrossRef]
  4. Chen, Z.; Wang, L.; Wei, Z.; Wang, Y.; Deng, J. Effect of components on the emulsification characteristic of glucose solution emulsified heavy fuel oil. Energy 2022, 244, 123147. [Google Scholar] [CrossRef]
  5. Gizatullin, B.; Gafurov, M.; Murzakhanov, F.; Vakhin, A.; Mattea, C.; Stapf, S. Molecular Dynamics and Proton Hyperpolarization via Synthetic and Crude Oil Porphyrin Complexes in Solid and Solution States. Langmuir 2021, 37, 6783–6791. [Google Scholar] [CrossRef]
  6. De Robbio, R.; Cameretti, M.C.; Mancaruso, E. Investigation by modelling of a plug-in hybrid electric commercial vehicle with diesel engine on WLTC. Fuel 2022, 317, 123519. [Google Scholar] [CrossRef]
  7. Luján, J.M.; García, A.; Monsalve-Serrano, J.; Martínez-Boggio, S. Effectiveness of hybrid powertrains to reduce the fuel consumption and NOx emissions of a Euro 6d-temp diesel engine under real-life driving conditions. Energy Convers. Manag. 2019, 199, 111987. [Google Scholar] [CrossRef]
  8. Davydov, R.; Dudkin, V. The Nuclear Magnetic Flowmeter for Monitoring the Consumption and Composition of Oil and Its Complex Mixtures in Real-Time. Energies 2022, 15, 3259. [Google Scholar] [CrossRef]
  9. Nascimento da Silva, G.; Rochedo, P.R.R.; Szklo, A. Renewable hydrogen production to deal with wind power surpluses and mitigate carbon dioxide emissions from oil refineries. Appl. Energy 2022, 311, 118631. [Google Scholar] [CrossRef]
  10. Davydov, V.V.; Myazin, N.S.; Davydov, R.V. Multiphase NMR Flowmeter-Relaxometer for Controlling the State and Rapidly Changing Flow Rates of Oil Mixtures. Meas. Tech. 2022, 65, 444–452. [Google Scholar] [CrossRef]
  11. Davydov, V.V.; Myazin, N.S.; Grebenikova, N.M. Determination of the Composition and Concentrations of the Components of Mixtures of Hydrocarbon Media in the Course of its Express Analysis. Meas. Tech. 2020, 62, 1090–1098. [Google Scholar] [CrossRef]
  12. Nourelfath, M.; Lababidi, H.M.S.; Aldowaisan, T. Socio-economic impacts of strategic oil and gas megaprojects: A case study in Kuwait. Int. J. Prod. Econ. 2022, 246, 108416. [Google Scholar] [CrossRef]
  13. Faksness, L.-G.; Leirvik, F.; Taban, I.C.; Engen, F.; Vensen, H.V.; Holbu, J.W.; Dolva, H.; Bråtveit, M. Offshore field experiments with in-situ burning of oil: Emissions and burn efficiency. Environ. Res. 2022, 205, 112419. [Google Scholar] [CrossRef] [PubMed]
  14. Chen, Y.; Zhang, Y.; Wang, J.; Lu, Z. Optimal Operation for Integrated Electricity–Heat System with Improved Heat Pump and Storage Model to Enhance Local Energy Utilization. Energies 2020, 13, 6729. [Google Scholar] [CrossRef]
  15. Rosendahl, T.; Hepso, V. Integrated Operations in the Oil and Gas Industry: Sustanability and Capabability Development; IGI Global: Hershey, PA, USA, 2013. [Google Scholar]
  16. Tihomirnov, L.I. Digitalization: Key factors of success. Oil Gas 2019, 1–2, 142–143. [Google Scholar]
  17. Marchenko, I. Features of geotechnical surveys and leg penetration analysis for drilling platforms in the Arctic seas. IOP Conf. Ser. Mater. Sci. Eng. 2019, 700, 012047. [Google Scholar] [CrossRef]
  18. Tarasenko, M.Y.; Lenets, V.A.; Akulich, N.V.; Yalunina, T.R. Features of use direct and external modulation in fiber optical simulators of a false target for testing radar station. In Lecture Notes in Computer Science; Springer: Cham, Switzerland, 2017; Volume 10531, pp. 227–232. [Google Scholar]
  19. Petrov, A.A. Digital Frequency Synthesizer for 133Cs-Vapor Atomic Clock. J. Commun. Technol. Electron. 2017, 62, 289–293. [Google Scholar] [CrossRef]
  20. Zhang, S.; Lei, Q.; Wu, L.; Wang, Y.; Zheng, L.; Chen, X. Supply chain design and integration for the Co-Processing of bio-oil and vacuum gas oil in a refinery. Energy 2022, 241, 122912. [Google Scholar] [CrossRef]
  21. Ocampo Batlle, E.A.; Escobar Palacio, J.C.; Silva Lora, E.E.; Bortoni, E.D.C.; Horta Nogueira, L.A.; Carrillo Caballero, G.E.; Vitoriano Julio, A.A.; Escorcia, Y.C. Energy, economic, and environmental assessment of the integrated production of palm oil biodiesel and sugarcane ethanol. J. Clean. Prod. 2021, 311, 127638. [Google Scholar] [CrossRef]
  22. Alekseeva, M.N.; Svarovskaya, L.I.; Yashchenko, I.G. Risks of pollution of Arctic territories by oil and oil products. AIP Conf. Proc. 2019, 2167, 02000. [Google Scholar] [CrossRef]
  23. Oliveira-Pinto, S.; Rosa-Santos, P.; Taveira-Pinto, F. Electricity supply to offshore oil and gas platforms from renewable ocean wave energy: Overview and case study analysis. Energy Convers. Manag. 2019, 186, 556–569. [Google Scholar] [CrossRef]
  24. Pye, M. The discovery and development of the Brae Area Fields, U.K. South Viking Graben. AAPG Mem. 2018, 115, 155–161. [Google Scholar] [CrossRef]
  25. Jones, D.W.; Van Bergen, P. Reservoir geology of the upper jurassic brae sandstone member, kingfisher field, South Viking Graben, U.K. North Sea. AAPG Mem. 2018, 115, 283–305. [Google Scholar] [CrossRef]
  26. Krueger, S.; Sharpe, R.; Attridge, W.; Ruszka, J. Introduction of new drilling technology provides continuous high build rate capability in complex corkscrew well trajectory, accessing unswept reserves in the north sea. In Proceedings of the SPE/IADC Drilling Conference and Exhibition, Hague, The Netherlands, 14–16 March 2017. [Google Scholar] [CrossRef]
  27. Feng, Q.; Xu, L.; Liu, C.; Hao, Y.; Yang, Z.; Zhang, T.; Liu, Y.; Su, H. Enhancing the anode performance of microbial fuel cells in the treatment of oil-based drill sludge by adjusting the stirring rate and supplementing oil-based drill cuttings. Sustain. Energy Fuels 2021, 5, 5773–5788. [Google Scholar] [CrossRef]
  28. Coto, B.; Suárez, I.; Tenorio, M.J.; Huerga, I. Extraction of aromatic and polyaromatic compounds with NMP: Experimental and model description. Fluid Phase Equilibria 2022, 554, 113293. [Google Scholar] [CrossRef]
  29. Li, Y.; Wang, D.; Xu, G.; Li, Q.; Yong, L.; Hongyu, G.; Lei, S.; Dongwei, L.; Meng, G.; Guoran, L.; et al. ZIF-8/PI Nanofibrous Membranes with High-Temperature Resistance for Highly Efficient PM0.3 Air Filtration and Oil-Water Separation. Front. Chem. 2021, 9, 810861. [Google Scholar] [CrossRef] [PubMed]
  30. Zhao, L.; Zeng, X.; Zhao, W.; Zhu, F.; Hou, M.; Fan, G. Structural optimization for an axial oil-water separator with multi-stage separation. Heat Mass Transf. 2021, 57, 1949–1963. [Google Scholar] [CrossRef]
  31. Jafarinejad, S.; Esfahani, M.R. A review on the nanofiltration process for treating wastewaters from the petroleum industry. Separations 2021, 8, 206. [Google Scholar] [CrossRef]
  32. Li, Z.; Zhu, Y.; Xi, J.; Ye, D.; Hu, W.; Song, L.; Hu, Y.; Cai, W.; Gui, Z. Scalable production of hydrophobic and photo-thermal conversion bio-based 3D scaffold: Towards oil-water separation and continuous oil collection. J. Clean. Prod. 2021, 319, 128567. [Google Scholar] [CrossRef]
  33. Erith, M.; Alfonso, Z.; Erik, L. A Multi-Sensor Approach to Separate Palm Oil Plantations from Forest Cover Using NDFI and a Modified Pauli Decomposition Technique. In Proceedings of the International Geoscience and Remote Sensing Symposium (IGARSS 2020), Waikoloa, HI, USA, 26 September-–2 October 2020. [Google Scholar] [CrossRef]
  34. Shafi, H.; Velswamy, K.; Ibrahim, F.; Huang, B. A hierarchical constrained reinforcement learning for optimization of bitumen recovery rate in a primary separation vessel. Comput. Chem. Eng. 2020, 140, 106939. [Google Scholar] [CrossRef]
  35. Acharya, T.; Casimiro, L. Evaluation of flow characteristics in an onshore horizontal separator using computational fluid dynamics. J. Ocean Eng. Sci. 2020, 5, 261–268. [Google Scholar] [CrossRef]
  36. Liu, M.; Zhu, Z.; Zhang, Z.; Chu, Y.; Yuan, B.; Wei, Z. Development of highly porous mullite whisker ceramic membranes for oil-in-water separation and resource utilization of coal gangue. Sep. Purif. Technol. 2020, 237, 116483. [Google Scholar] [CrossRef]
  37. Mahmoud, M.; Tariq, Z.; Kamal, M.S.; Al-Naser, M. Intelligent prediction of optimum separation parameters in the multistage crude oil production facilities. J. Pet. Explor. Prod. Technol. 2019, 9, 2979–2995. [Google Scholar] [CrossRef] [Green Version]
  38. Patrone, P.N.; Cooksey, G.; Kearsley, A. Dynamic Measurement of Nanoflows: Analysis and Theory of an Optofluidic Flowmeter. Phys. Rev. Appl. 2019, 11, 034025. [Google Scholar] [CrossRef] [Green Version]
  39. Gu, Y.; Zhao, Y.; Lv, R.; Yang, Y. Theory and structure of a modified optical fiber turbine flowmeter. Flow Meas. Instrum. 2016, 50, 178–184. [Google Scholar] [CrossRef] [Green Version]
  40. Shaaban, S. Design and optimization of a novel flowmeter for liquid hydrogen. Int. J. Hydrogen Energy 2017, 42, 14621–14632. [Google Scholar] [CrossRef]
  41. Klingensmith, W.C.; Mays, D.C. Information Content of Wastewater Flowmeter Data before and during a Surcharge. J. Environ. Eng. 2018, 144, 05018004. [Google Scholar] [CrossRef]
  42. Yang, Y.; Ha, W.; Zhang, C.; Liu, M.; Zhang, X.; Wang, D. Measurement of high-water-content oil-water two-phase flow by electromagnetic flowmeter and differential pressure based on phase-isolation. Flow Meas. Instrum. 2022, 84, 102142. [Google Scholar] [CrossRef]
  43. Jin, N.; Yu, C.; Han, Y.; Yang, Q.; Ren, Y.; Zhai, L. The Performance Characteristics of Electromagnetic Flowmeter in Vertical Low-Velocity Oil-Water Two-Phase Flow. IEEE Sens. J. 2021, 21, 464–475. [Google Scholar] [CrossRef]
  44. Wang, Y.; Li, H.; Liu, X.; Chen, L.; Xie, R.; Han, L. A Novel Method for Measuring the Flow Rate of High Viscous Fluid in Polymer Injection Well by Nonuniform Magnetic Field Electromagnetic Flowmeter. In Proceedings of the 8th Annual IEEE International Conference on Cyber Technology in Automation, Control and Intelligent Systems, Tianjin, China, 19–23 July 2018. [Google Scholar] [CrossRef]
  45. Davydov, V.V. Control of the longitudinal relaxation time T1 of a flowing liquid in NMR flowmeters. Russ. Phys. J. 1999, 42, 822–825. [Google Scholar] [CrossRef]
  46. Han, Y.; Jin, N.; He, Y.; Ren, Y. Flow Measurement of Oil-in-Water Emulsions Using Arc-Type Conductivity Probes and Electromagnetic Flowmeter. IEEE Trans. Instrum. Meas. 2018, 67, 667–677. [Google Scholar] [CrossRef]
  47. Wang, Y.; Li, H.; Liu, X.; Zhang, Y.; Xie, R.; Huang, C.; Hu, J.; Deng, G. Novel downhole electromagnetic flowmeter for oil-water two-phase flow in high-water-cut oil-producingwells. Sensors 2016, 16, 1703. [Google Scholar] [CrossRef] [PubMed]
  48. Davydov, V.V.; Myazin, N.S.; Makeev, S.S. Method for Monitoring the Longitudinal Relaxation Time of 1Flowing Liquids Over the Entire Range of Flow Rate. Meas. Tech. 2020, 63, 368–374. [Google Scholar] [CrossRef]
  49. Myazin, N.S.; Yushkova, V.V.; Davydova, T.I. New nondestructive method for determining the composition of components in biological objects in express mode. J. Phys. Conf. Ser. 2017, 917, 042017. [Google Scholar] [CrossRef]
  50. Davydov, V.V.; Grebenikova, N.M. On the Possibility of Express Recording of Nuclear Magnetic Resonance Spectra of Liquid Media in Weak Fields. Tech. Phys. 2018, 63, 1845–1850. [Google Scholar] [CrossRef]
  51. Myazin, N.S. Peculiarities of magnetic resonance signals processing during the express control of the liquid media state. J. Phys. Conf. Ser. 2019, 1236, 012026. [Google Scholar] [CrossRef] [Green Version]
  52. Davydov, V.V.; Dudkin, V.I.; Karseev, A.Y. Feasibility of Using Nuclear Magnetic Spectroscopy for Rapid Monitoring of Liquid Media. J. Appl. Spectrosc. 2015, 82, 794–800. [Google Scholar] [CrossRef]
  53. Shikhof, I.; Arns, C.H. Temperature-Dependent Oxygen Effect on NMR D-T2 Relaxation-Diffusion Correlation of n-Alkanes. Appl. Magn. Res. 2016, 47, 1391. [Google Scholar] [CrossRef]
  54. Zalesskiy, S.S.; Danieli, E.; Blumich, B.; Ananikov, V.P. Miniaturization of nmr systems: Desktop spectrometers, microcoil spectroscopy, and “nmr on a chip” for chemistry, biochemistry, and industry. Chem. Rev. 2014, 114, 5641–5677. [Google Scholar] [CrossRef]
  55. Haratt, W.N.; Lee, V.E.; Priestley, R.D.; Cabral, J.T. Precision polymer particles by flash nanomicrofluidic droplet extraction. ACS Appl. Polym. Mater. 2021, 3, 4746–4768. [Google Scholar]
  56. Kashaev, R.S.; Kozelkov, O.V. On-line express-analyzer and method of water monitoring on the base of proton magnetic resonance. IOP Conf.Ser. Earth Environ. Sci. 2019, 288, 012035. [Google Scholar] [CrossRef]
  57. Kashaev, R.S.H. Oil Disperse Systems Study Using Nuclear Magnetic Resonance Relaxometry (NMRR). In Advances in Energy Research; Nova Science Publishers: Hauppauge, NY, USA, 2013; Volume 16. [Google Scholar]
  58. Kashaev, R.; Faskchiev, N. Nuclear (proton) magnetic resonance relaxometry study of the effect of rotating magnetic field on the emulsion structure. Appl. Magn. Reson. 2011, 41, 31–43. [Google Scholar] [CrossRef]
  59. Kashaev, R.S.; Kien, N.C.; Tung, T.V.; Kozelkov, O.V. Fast Proton Magnetic Resonance Relaxometry Methods for Determining Viscosity and Concentration of Asphaltenes in Crude Oils. J. Appl.Spectrosc. 2019, 86, 890–895. [Google Scholar] [CrossRef]
  60. Callaghan, P.T. Principles Reo-NMR: Nuclear Magnetic Resonance and the Rheology of Complex Fluids. Rep. Prog. Phys. 1999, 62, 599–668. [Google Scholar] [CrossRef]
  61. Davydov, V.V.; Dudkin, V.I.; Karseev, A.Y. Formation of the nutation line in NMR measuring system with flowing samples. Tech. Phys. Lett. 2015, 41, 355–358. [Google Scholar] [CrossRef]
  62. Khasanova, N.; Sakharov, B.; Volkov, V.; Nurgaliev, D. Low field method for analysis of heavy oils without extraction. In Proceedings of the 17th International Multidisciplinary Scientific Geoconference SGEM2017, Viena, Austria, 27–29 November 2017; pp. 297–304. [Google Scholar]
  63. Kashaev, R.S.; Masiab, A.N. Study of phase transitions in some phase changing organic matters by use of NMR relaxometry. Chem. Mater. Eng. 2013, 1, 78–84. [Google Scholar] [CrossRef]
  64. Davydov, V.V.; Dudkin, V.I.; Karseev, A.Y. A Compact Nuclear Magnetic Relaxometer for the Express Monitoring of the State of Liquid and Viscous Media. Meas. Tech. 2014, 57, 912–918. [Google Scholar] [CrossRef]
  65. Aleksandrov, A.S.; Ivanov, A.A.; Archipov, R.V.; Gafurov, M.R. TagirovMS Pulsed NMR spectrometer with dynamic nuclear polarization for weak magnetic fields. Magn. Reson. Solids 2019, 21, 19203. [Google Scholar]
  66. Davydov, V.V.; Dudkin, V.I.; Velichko, E.N. Method for Measuring the Sensitivity of Nuclear-Resonance Magnetometers with Flowing Liquid. Meas. Tech. 2016, 59, 176–182. [Google Scholar] [CrossRef]
  67. Hogendoorn, J.; Boer, A.; Appel, M.; de Jong, H.; de Leeuw, R. Magnetic Resonance Technology. A New Concept for Multiphase Flow Measurement. In Proceedings of the 31th International North Sea Flow Measurement Workshop, Tonsberg, Norway, 22–25 October 2013. [Google Scholar]
  68. Deng, F.; Xiao, L.; Wanget, M.; Tao, Y.; Kong, L.; Zhang, X.; Liu, X.; Geng, D. Online NMR Flowing Fluid Measurements. Appl. Magn. Reson. 2016, 47, 1239–1253. [Google Scholar] [CrossRef]
  69. Davydov, V.V. Some specific features of the NMR study of fluid flows. Opt. Spectrosc. 2016, 121, 18–24. [Google Scholar] [CrossRef]
  70. Safieva, R.Z.; Mishin, V.D. Systems Analysis of the Evolutiom of Views on Oil Systems: From Petroleum Chemistry to Petroinformatics. Pet. Chem. 2021, 61, 539–554. [Google Scholar] [CrossRef]
  71. Davydov, V.V.; Dudkin, V.I.; Karseev, A.Y. A Compact Marked Nuclear-Magnetic Flowmeter for Measurement of Rapidly Varying Flow Rates of Liquid. Meas. Tech. 2015, 58, 317–322. [Google Scholar] [CrossRef]
  72. Davydov, V.V.; Dudkin, V.I.; Myazin, N.S. Nutation line shape for the nonstationary regime of magnetic resonance flowmeter–relaxometerю. J. Commun. Technol. Electron. 2016, 61, 1159–1165. [Google Scholar] [CrossRef]
  73. Uskova, E.I.; Doroginitski, M.M.; Skirda, V.D.; Fatkhutdinov, I.H. New Approach to Analyze 2D Map T1-T2. Appl. Magn. Res. 2020, 51, 183–193. [Google Scholar] [CrossRef]
  74. Mills, C. Process effects on coriolis flowmeter calibration. Hydrocarb. Process. 2020, 99, 8. [Google Scholar]
  75. Prakhova, M.Y.; Krasnov, A.N. Coriolis flowmeter for commercial accounting of crude oil. J. Phys. Conf. Ser. 2020, 1582, 012071. [Google Scholar] [CrossRef]
  76. Rondon, J.; Barrufet, M.A.; Falcone, G. A novel downhole sensor to determine fluid viscosity. Flow Meas. Instrum. 2012, 23, 9–18. [Google Scholar] [CrossRef]
  77. Falcone, G.; Hewitt, G.F.; Alimonti, C.; Harrison, B. Multiphase Flow Metering: Current Trends and Future Developments. J. Pet Technol. 2002, 54, 77–84. [Google Scholar] [CrossRef]
  78. Davydov, V.V.; Myazin, N.S.; Kiryukhin, A.V. Nuclear-Magnetic Flowmeter-Relaxometers for Monitoring Coolant and Feed water Flow and Status in Npp. Atom. Energy 2020, 127, 274–279. [Google Scholar] [CrossRef]
  79. Kashaev, R.S.; Kozelkov, O.V.; Temnikov, A.N.; Van Tung, T.; Kein, N.T. Relaxometer of proton magnetic resonance. Instrum. Exp. Tech. 2019, 2, 145–148. [Google Scholar]
  80. Davydov, V.V.; Dudkin, V.I.; Karseev, A.Y.; Vologdin, V.A. Special Features in Application of Nuclear Magnetic Spectroscopy to Study Flows of Liquid Media. J. Appl. Spectrosc. 2016, 82, 1013–1019. [Google Scholar] [CrossRef]
  81. Davydov, V.V.; Myazin, N.S.; Dudkin, V.I.; Davydov, R.V. Determination of the Longitudinal Relaxation Time of a Flowing Liquid Using a Differential Nuclear Magnetic Spectrometer. Tech. Phys. Lett. 2020, 46, 1147–1151. [Google Scholar] [CrossRef]
  82. Khan, N.S.; Kumam, P.; Thounthong, P. Computational Approach to Dynamic Systems through Similarity Measure and Homotopy Analysis Method for Renewable Energy. Crystals 2020, 10, 1086. [Google Scholar] [CrossRef]
  83. Khan, N.S.; Gul, T.; Kumam, P.; Shah, Z.; Islam, S.; Khan, W.; Zuhra, S.; Sohail, A. Influence of Inclined Magnetic Field on Carreau Nanoliquid Thin Film Flow and Heat Transfer with Graphene Nanoparticles. Energies 2019, 12, 1459. [Google Scholar] [CrossRef]
  84. Kashaev, R.S.; Idiyatullin, Z.S.; Temnikov, A.N.; Dautov, I.R. Design for Measurement of Composition and Flow Rate by NMR-Method. RF Patent № 74710, 24 April 2008. [Google Scholar]
Figure 1. Structural diagram of the testing ground of automated measurement complex.
Energies 16 01080 g001
Figure 2. Electric principle diagram of the sampling system.
Energies 16 01080 g002
Figure 3. Principle electric scheme of the spin-echo signals transitions to/from RF coil.
Energies 16 01080 g003
Figure 4. Principle electric scheme of Relaxometer PMR-NP.
Energies 16 01080 g004
Figure 5. Relaxation rate (T2eff)−1 from oil-well liquid flow velocity υ for 1 is water, 2 is 90% water emulsion, 3 is 85% water, 4 is 25% water, and 5 is 20% water emulsion flow.
Energies 16 01080 g005
Figure 6. PMR-signal SE amplitudes A (a.u.) from flow rateυ (m/s). Curves: 1—100% water, 2—90% water in emulsion (υ < 0.2 m/s), 3—90% water in emulsion (υ > 0.2 m/s), 4—25% water in emulsion (υ < 0.3 m/s), and 5—oil (υ > 0.3 m/s).
Energies 16 01080 g006
Figure 7. Curves H = f(Q) for water (curve 1) and oils with ρ = 882 kg/m3 (curve 2) and ρ = 888 kg/m3 (curve 3).
Energies 16 01080 g007
Disclaimer/Publisher’s Note: The statements, opinions and data contained in all publications are solely those of the individual author(s) and contributor(s) and not of MDPI and/or the editor(s). MDPI and/or the editor(s) disclaim responsibility for any injury to people or property resulting from any ideas, methods, instructions or products referred to in the content.