Article

A New Methodology for Early Detection of Failures in Lithium-Ion Batteries

by
Mario Eduardo Carbonó dela Rosa
1,
Graciela Velasco Herrera
2,*,
Rocío Nava
1,
Enrique Quiroga González
3,
Rodolfo Sosa Echeverría
4,
Pablo Sánchez Álvarez
4,
Jaime Gandarilla Ibarra
5 and
Víctor Manuel Velasco Herrera
6
1
Instituto de Energías Renovables, Universidad Nacional Autónoma de México, Temixco 3462580, Mexico
2
Instituto de Ciencias Aplicadas y Tecnología, Universidad Nacional Autónoma de México, Ciudad Universitaria, Coyoacán, Mexico City 04510, Mexico
3
Instituto de Física, Benemérita Universidad Autónoma de Puebla (BUAP), Puebla 72570, Mexico
4
Instituto de Ciencias de la Atmósfera y Cambio Climático, Universidad Nacional Autónoma de México, Circuito Exterior, C.U., Coyoacán, Mexico City 04510, Mexico
5
Facultad de Ingeniería, Universidad Nacional Autónoma de México, Circuito Exterior, C.U., Coyoacán, Mexico City 04510, Mexico
6
Instituto de Geofísica, Universidad Nacional Autónoma de México, Circuito Exterior, C.U., Coyoacán, Mexico City 04510, Mexico
*
Author to whom correspondence should be addressed.
Energies 2023, 16(3), 1073; https://doi.org/10.3390/en16031073
Submission received: 8 December 2022 / Revised: 9 January 2023 / Accepted: 10 January 2023 / Published: 18 January 2023
(This article belongs to the Special Issue Advanced Technologies of Lithium Batteries)

Abstract

:
The early fault detection and reliable operation of lithium-ion batteries are two of the main challenges the technology faces. Here, we report a new methodology for early failure detection in lithium-ion batteries. This new methodology is based on wavelet spectral analysis to detect overcharge failure in batteries that is performed for voltage data obtained in cycling tests, subjected to a standard charge/discharge protocol. The main frequencies of the voltage temporal signal, the harmonic components in the regular cycling test, and a low frequency pattern were identified. For the first time, battery failure can be anticipated by wavelet spectral analysis. These results could be the key to the new early detection of battery failures in order to reduce out-of-control explosions and fire risks.

1. Introduction

Since the launch of the commercialization Lithium-ion batteries (LIBs) in 1991, they became the preferred choice for mobile devices. The surge of new anode materials for lithium-ion batteries with large power and specific energy has been key in the race of a reliable electric vehicle technology. However, the growing demand for greater storage capacity, charging rate, and life cycles of lithium-ion batteries increase safety risks for users, with substantial economic costs for manufacturers, such as the fire incident in the Boeing 787 and in some electric vehicles [1,2]. The source of battery failures depends on external and internal factors, such as short circuits, overcharge, overdischarge, contact lost between neighboring cells, etc., which could produce overheating, thermal runaway, or even the explosion of a battery [3,4,5].
There are detection and diagnostic methods to avoid or minimize the impact of failures in battery systems [6]. For such purpose, multiple nonlinear models of different faults have been applied to the diagnostic Li-ion battery. To mention some examples, the extended Kalman filter allows engineers to estimate the terminal voltage [7] or to model current and voltage for fault isolation and diagnosis [8]. Random forest-based classification algorithms have also been employed to recognize a failure caused by electrolyte leak [9]. Other approach based on a quantitative analysis of probability of battery failures was applied as well, where a big data platform for electric vehicles were used [10]. A method of fault detection in the serial battery connection based on the application on the voltage signal of the mean square error method and modified z-score was recently proposed [11]. However, most of these methods are based mainly on the periodic cycling test and operating temperature changes, which cannot be applied to model real operating conditions and constraints such as electrical perturbations or battery aging [12]. Moreover, most of these methods detect a battery failure event but do not forecast it. In other words, the previous and current methods are merely diagnostic based tools, rather than tools with predictive capability of battery failures.
LIBs are a reliable energy storage technology, used in terrestrial, civil, and military communications, smart devices, and aerospace, land, and sea transportation vehicles. To ensure operational capability, information, and communication, algorithms for measuring the state of LIBs must be developed. To ensure their success in the market, improvements must be made to their charge speed, power, and charge/discharge cycles. These requirements generate high heat production and non-uniform current distribution, leading to security issues, decreased performance, and reduced quality and durability of the LIBs [13]. Mechanisms to diagnose and pre-warn of errors and failures in the LIBs in a timely manner must be developed to reduce the risk of explosion or fire [14]. Estimation of the state of the LIBs is essential, as well as timely identification of the core parameters for a good estimation of the battery state. The Kalman filter is used to provide real-time state estimates in [15]. Various sensors are used to monitor the parameters of the LIBs. The challenge is to analyze the battery parameters and the coupled effect of vibration and temperature dynamics on the model variables during the estimation of the state of the LIBs.
Furthermore, the study of battery aging is of great practical value because the degradation of battery characteristics determines to a great extent the performance and environmental impacts of electric vehicles, particularly the all-electric vehicles.
A first model is obtained by using two differential equations and seven parameters, allowing the simulation of the capacity change of lithium ion cells in electric vehicles [16]. However, detecting failures in LIBs presents a practical challenge due to the ideal conditions that are not met in real electric vehicle activities and the lack of voltage signal based methods. Therefore, in order to have a method that can be implemented in fault diagnosis of batteries on the voltage signal, the following methodology has been proposed: (a) variational mode decomposition in the signal analysis part to separate the inconsistency of the cell states, (b) extraction of the critical characteristics of the signal by using a generalized dimension indicator construction formula, and (c) detection of standardized anomalies through scatter-based clustering [17].
As a result of various factors, such as population growth, increased urbanization, and global economic growth, there has been a significant increase in vehicular emissions, which has contributed substantially to air pollution [18]. Combustion vehicles emit different pollutants, such as particulate matter (PM), lead (Pb), hydrocarbons (HC), nitrogen dioxide (NO 2 ), carbon monoxide (CO), and sulfur dioxide (SO 2 ) that have severe effects on air quality, climate change, and human health [19].
To reduce air pollutants, the control of emissions and stricter environmental standards have been implemented for internal combustion vehicles over the last few years and decades. Since the 1990s, the Mexican government has taken several initiatives to improve the air quality in the Mexico City Metropolitan Area (MCMA) by introducing comprehensive air quality programs. In 1994, the Mexican government adopted an emission monitoring inventory that included four categories [20]: point sources (industry), area sources (services and residential), mobile sources (transport), and natural sources (vegetation and soil) [20], as shown in Figure 1.
Taking as a reference the value of PM 10 for the last year of available information (2018), this corresponds to 13,763 ton/year for mobile sources, and if the use of electric vehicles was aligned with the corresponding reduction in emissions of 25, 50 and 75%, the results would be 10,322, 6881, and 3441 ton/year, respectively.
Figure 2 displays the temporal series of emissions for PM 10 , PM 2.5 , SO 2 , CO, NO x between 2000 and 2018, which were obtained from the official MCMA emissions inventory [21].
In addition to this, the first air quality standards for O 3 , CO, NO 2 and other gases have been established in order to protect public health. Despite the improvements achieved in the last three decades, the air quality in Mexico City remains at unhealthy levels for many days of the year. According to estimations of the Secretariat of Environment (SEDEMA), the contribution of motor vehicles to the total emissions of Volatile Organic Compounds (VOCs) in Mexico City was 17 percent in 2016. This percentage is even higher in areas with high traffic, as well as for more reactive and/or toxic compounds. For example, an estimation suggests that motor vehicles contribute 23 percent for toluene and 33 percent for benzene, a carcinogenic compound. In a VOC-limited environment, changes in motor vehicle VOC can directly affect ambient ozone levels, as well as ambient PM2.5 and toxics [22,23].
Currently, several countries have set goals and policies to promote the use of Electric Vehicles (EVs) and limit the sale of vehicles that use fossil fuels. For instance, Germany has committed to having one million EVs on the roads by 2020, Denmark is aiming for an independence from fossil fuels in the transportation sector by 2050, and France wants to achieve this by 2030 [24]. These initiatives are designed to reduce pollutants emissions and improve air quality, especially in urban areas where the population is more exposed to air pollution and traffic is one of the main sources of emissions [25]. Nonetheless, the current use of EVs is still low due to several limitations such as the lack of adequate charging infrastructure [26], the slow charging time [27], and the battery system safety [28]. EVs require safe and reliable batteries that provide better performance and cost-effectiveness. Lithium-ion (Li-ion) batteries have become the dominant choice in the market due to their energy efficiency, longer life span and faster rate of charging when compared to other batteries. However, as improvements have been made in increasing energy density and decreasing charging times, safety issues have become more frequent; this has led to regulators enforcing stricter safety standards. For this last reason, regulatory bodies seek to enforce stricter safety standards on EV manufacturers. For instance, China has implemented mandatory standards that require all EVs to inhibit any fire or explosion for at least 5 minutes after a thermal leakage incident of the battery occurs [29,30].

2. Data and Spectral Analysis

In order to identify the spectral frequencies that precede a failure, we applied a hybrid spectral analysis using Fourier and wavelet transforms to the voltage data of battery cycling tests. This method is used in various fields to analyze one or more time series in the frequency domain and identify trends, periodicities and phase changes [31]. This analysis was carried out with LIBs and half-cells tested by four research groups: the Physics Institute of the University of Puebla (IF-BUAP), the Center for Advanced Life Cycle Engineering of the University of Maryland (CALCE), the NASA Prognostics Center of Excellence (NASA-PCE) and University College London (UCL). The results of this evaluation allowed us to identify frequencies related to degradation or that preceded an overload failure. Based on this empirical analysis, a model for the early detection of failures in LIBs is proposed. Now, the spectral analysis used in this work will be described in detail.
The primary goal of a spectral analysis is to determine trends, periodicities, and changes in the signal, which cannot be easily seen/noted in the time domain, using Fourier and wavelet transforms. The Fourier Transform (FT) is extensively used due to its high resolution in the frequency domain [32,33]. It is given by
F ( ω ) = f ( t ) e i w t d t
where f ( t ) is a signal function. On the other hand, the Fast Fourier Transform (FFT) is an efficient algorithm used to compute the Discrete Fourier Transform (DFT) of a series of data samples, which facilitates signal analysis, such as power spectrum analysis [34]. Generally, for a periodic signal x [ n ] , the FFT is calculated using the following equation:
X ( ω ) = n = x [ n ] e i w n
The power of a signal x(t) in the time domain can be obtained through the Parseval theorem, also known as energy or the Rayleigh energy theorem. It states that the energy of x ( t ) is equal to the energy of its Fourier transform X ( ω ) in the frequency domain [35], given by
E = x ( t ) 2 d t = 1 2 π X ( ω ) 2 d t
Consequently, the average signal power x ( t ) is equal to the sum of the square of the magnitudes of the signal during the time interval ( t 2 , t 1 ), that is
P = 1 t 2 t 1 t 1 t 2 x ( t ) 2 d t
The signal x ( t ) is said to have finite power and satisfy the relation that it is a power signal over a large interval:
0 < 1 T t 1 t 2 x ( t ) 2 d t <
Moreover, the Continuous Wavelet Transform (CWT) is defined as the integral of the signal function multiplied by the mother function Φ ( t ) , that is
C ( a , b ) = f ( t ) Φ ( a , b , t ) d t
where C ( a , b ) is the wavelet coefficients, with a being the scaling factor (representing elongation or compression), and b the time displacement (delay or advance) of the mother wavelet. The original signal f ( t ) can be reconstructed when each coefficient C ( a , b ) is multiplied by the appropriate scaled factor and the displaced coefficient of the mother wavelet, which is the inverse wavelet transform. The mother wavelet functions Φ ( t ) L 2 ( R ) must have limited duration and an average value equal to zero [36]:
R Φ = 0
Generally speaking, the CWT is used to analyze in detail the time-frequency spectral content for data that have a changing period over time (non-stationary time series). Thus, the CWT not only provides the frequencies present, but also gives their occurrence times in the time series [37]. Wavelet analysis can be used as a tool to localize variations of power in a time series. By decomposing the time series into the time-frequency space [38], it is possible to identify irregular events such as breakpoints, discontinuities in the higher-order derivatives or temporary peaks, which would otherwise be difficult to identify in the time domain.
The computational algorithms of wavelet transform are applied to process the signal data at different scales or resolutions to identify the variations of the signal. The process is carried out by means of a “window", which is adjusted automatically depending on the required resolution. The general procedure of analysis using wavelets starts by selecting a given mother wavelet. Temporal analysis is performed by dilations and translations of the mother wavelet. Therefore, the choice of the mother wavelet and depends on the type of functions or data to be analyzed. A suitable choice or the elimination of coefficients smaller than a given threshold makes wavelets an excellent tool for non-linear data compression. Therefore, wavelet analysis is a useful tool to analyze signals with small variations, transitory events, or discontinuities. Wavelet functions have been used in several areas, such as fault detection, dominant harmonic estimation, damping identification and vibration-based damage detection, etc. [39,40,41,42,43,44].
According to the limitations of model-based methods and the limited availability of traditional methods of fault diagnosis based on voltage signal, our work proposes a contribution to the early detection of battery failures because it is based on data processing by spectral analysis of voltage cycles of different LIBs. This method allows the identification of low frequency components of the voltage signal that are related to failures due to overcharge, overdischarge, or degradation of the battery. According to state of the art, this is the first time that a spectral power pattern associated with failures or irregular cycling voltage of LIBs is identified by wavelet transform. Based on the spectral analysis, we proposed a model for early fault detection in batteries. This model could be extended to any kind of battery, as it does not depend on the electrochemistry nor on the battery configuration, but strictly depends on the spectral analysis of the electrical signals.

3. Battery Test Methodology

We analyzed databases from the cycling tests of LIBs performed by the four research groups. Each group tested different lithium-ion battery types (see Table 1) under a standard charge/discharge protocol to protect them from overcharging [45], but with specific charge-discharge parameters. Cell cycling started by charging at Constant Current (CC) until the cut-off voltage was reached; then, charging continued at Constant Voltage (CV) until the loading current decreased to 10%. During the cell discharge, a constant current CC was applied until the cut-off voltage was reached to complete one charge/discharge cycle, and this was repeated for multiple cycles. The specific test conditions performed by each research group are summarized in Table 2.
Half Cells (HC) tested by IF-BUAP had a working electrode made of silicon wires and a counter electrode of lithium metal. Three half cells were preconditioned at Current Constant (CC) of 0.17 mA (C/10 rate) in the first three cycles to withstand a current of 0.86 mA (C/2 rate) during the following cycles, with a cut-off voltage of 0.11 V for lithiation and 0.7 V for delithiation. Battery tests were performed at room temperature (25 ° C). Once the cells reached the cut-off voltage, the cycling test was changed to a potentiostatic mode, and programed to stop when the cell current decreased 10% or reached the maximal theoretical capacity (4200 mAh/g). It was observed that when these cells were charged just to 75% (3150 mAh/g), capacity fade was less than 0.1% after 100 cycles [46]. The first cell ( H C 1 ) of the cycling test, shown in Figure S1a of the Supplementary Information, had a reduction of 21.5% of the maximum voltage (0.55 V instead of 0.7 V) at the end of the cycling test, but without any irregular event. The charge/discharge voltage of the second cell ( H C 2 ), shown in Figure S2a, has a uniform trend, but the cycling period rises in the last 10 cycles, associated with the increase in the cell impedance. On the other hand, Figure 3a shows a graph of the cycling voltage vs. time of the third cell ( H C 3 ) analyzed (there is a pause of 10 min between cycles). The charge voltage decreased after around 600 h, then it returned to the original value, and exhibits an overcharge in the last cycles. The fourth cell ( H C 4 ) was cycled at 1.33 mA without preconditioning. As a consequence, the voltage cycling period and shape were irregular (see Figure S3a), and the cycling test was shorter than in the previous cells.
CALCE evaluated a prismatic cell (PC) made of a graphite anode and a lithium cobalt oxide (LiCoO 2 ) cathode at various temperatures. The cell was charged to full capacity under the constant-current/constant-voltage mode (CC/CV). The nominal capacity of this battery is 1350 mAh. The cell was charged at a constant current rate of 0.5 C until the voltage reached 4.2 V; then, this voltage was maintained until the charging current dropped below 0.05 A. The cell was discharged at a constant current of 1 C to a cutoff voltage of 2.7 V. The starting ambient temperature was 25 ° C, and after every 10 charge/discharge cycles, it was increased by 10 ° C up to 55 ° C [47,48]. In Table 2, this prismatic cell was labeled as PC, with an extension to identify the cell temperature test, that is, PC-25C, PC-35C, etc.
The charge/discharge voltage of the cell tested at different temperature showed, in general, few irregular events or non-catastrophic failures during most of the cycling test, but in the test at 25   ° C, there is evidently an overcharge failure. The graphs corresponding to the cell tested at 35   ° C (PC-35C) and 45   ° C (PC-45C) are shown in Figures S4a and S5a in the Supplementary Information, respectively. In these two cases, weak irregular events can be observed. However, in the battery cycled at room temperature (PC-25C), shown in Figure 4a, the voltage doubled the operating limits after 14 h, probably as result of a reversible internal failure. Likewise, in the test at 55   ° C (PC-55C) there is clearly identified an interruption of the cycling test between 10 and 25 h, and then the cycling test was resumed (see Figure S6a in the Supplementary Information).
The NASA-PCE reports cycling tests of Commercial Lithium-ion Cells (C-LIC), model 18650, with a nominal capacity of 2000 mAh [49]. These batteries have a lithiated carbon anode (LiC) and a lithium cobalt oxide cathode (LiCoO 2 ). We analyzed four of their Li-ion batteries databases; three of those batteries (C-LIC 1 to C-LIC 3 ) were tested at room temperature ( 24   ° C) and one at 4   ° C (C-LIC4). The charging protocol was the same in the four batteries, but different discharge mode (see Table 2).
The charging process for the battery was conducted in CC mode at 1500 mA until the voltage reached 4.2 V. The charge was then continued in CV mode until the current dropped to 20 mA. Battery C-LIC1 was discharged at a constant current of 2000 mA until the voltage dropped to 2.5 V. The experiment was terminated when the battery reached the end-of-life criteria, with a fade of 30%. In battery C-LIC2, discharging was performed using a 0.05 Hz square wave of 4000 mA amplitude and 50% duty cycle until the voltage fell to 2.0 V.
For battery C-LIC3, discharge was conducted at 2000 mA until voltage fell to 2.7 V. The experiment was conducted until the battery capacity drops to 1600 mAh (20% fade). The fourth battery (C-LIC4) was discharged at multiple fixed discharge current levels (4000 mA and 1000 mA) and stopped at 2.2 V. The experiment was carried out until battery capacity was reduced to 1400 mAh (30% capacity fade).
The voltage vs. time graphs of these group of cells show irregularities in the cut-off voltage limits (see Figures S7a–S9a in the Supplementary Information). As the voltage limits were fixed according to the test protocol, these irregular signals can be associated with overcharges and overdischarges of the battery during cycling. As can be observed in the C-LIC3, these are more severe after 100 h of cycling (see Figure 5a).
UCL has reported the electrochemical cycling data of a commercial cylindrical lithium-ion battery model INR18650, which is made of a nickel-rich NMC811 cathode (LiNiCoAlO 2 ) and a graphite-silicon anode, and has a storage capacity of 3500 mAh (CC-3500) [50]. The battery was charged at a constant current of 1.5 A until the cell voltage reached 4.2 V; then, that voltage was maintained until the current reached 100 mA. The battery was discharged at 4000 mA to 2.5 V. This cycling protocol was followed for 400 cycles in an environmental chamber at 24   ° C.
The database of the cylindrical cell test was divided by number of cycles to simplify the analysis: cycle 1 to 84 (CC3500-1), cycle 110 to 202 (CC3500-2), cycle 203 to 285 (CC3500-3), and cycle 286 to 400 (CC3500-4). It is important to mention that, even when cycling test was performed in one battery, each cycle’s range begins at zero hour, according to the original database (file EIL-MJ1-015), and the full test protocol was followed for 400 cycles [51]. However, the range of cycles was discontinuous, probably due to some breaks during the test. The battery voltage as a function of time for the cycle set CC3500-2 is shown in Figure 6a; the graphs of the further cycle sets are shown in Figures S10a–S12a of the Supplementary Information.

4. Results and Discussion

Battery voltage data of the cycling tests performed by the four research groups were analyzed both by FFT and CWT. Data analyses were carried out in MATLAB by using FFT and WT functions, wavelet toolbox, and the signal analyzer application libraries. The Sampling Frequency (SF) for the FFT was established according to the Nyquist–Shannon sampling theorem [52], such that the SF double at least the natural frequency of the signal, in this case, the highest frequency of voltage cycle.

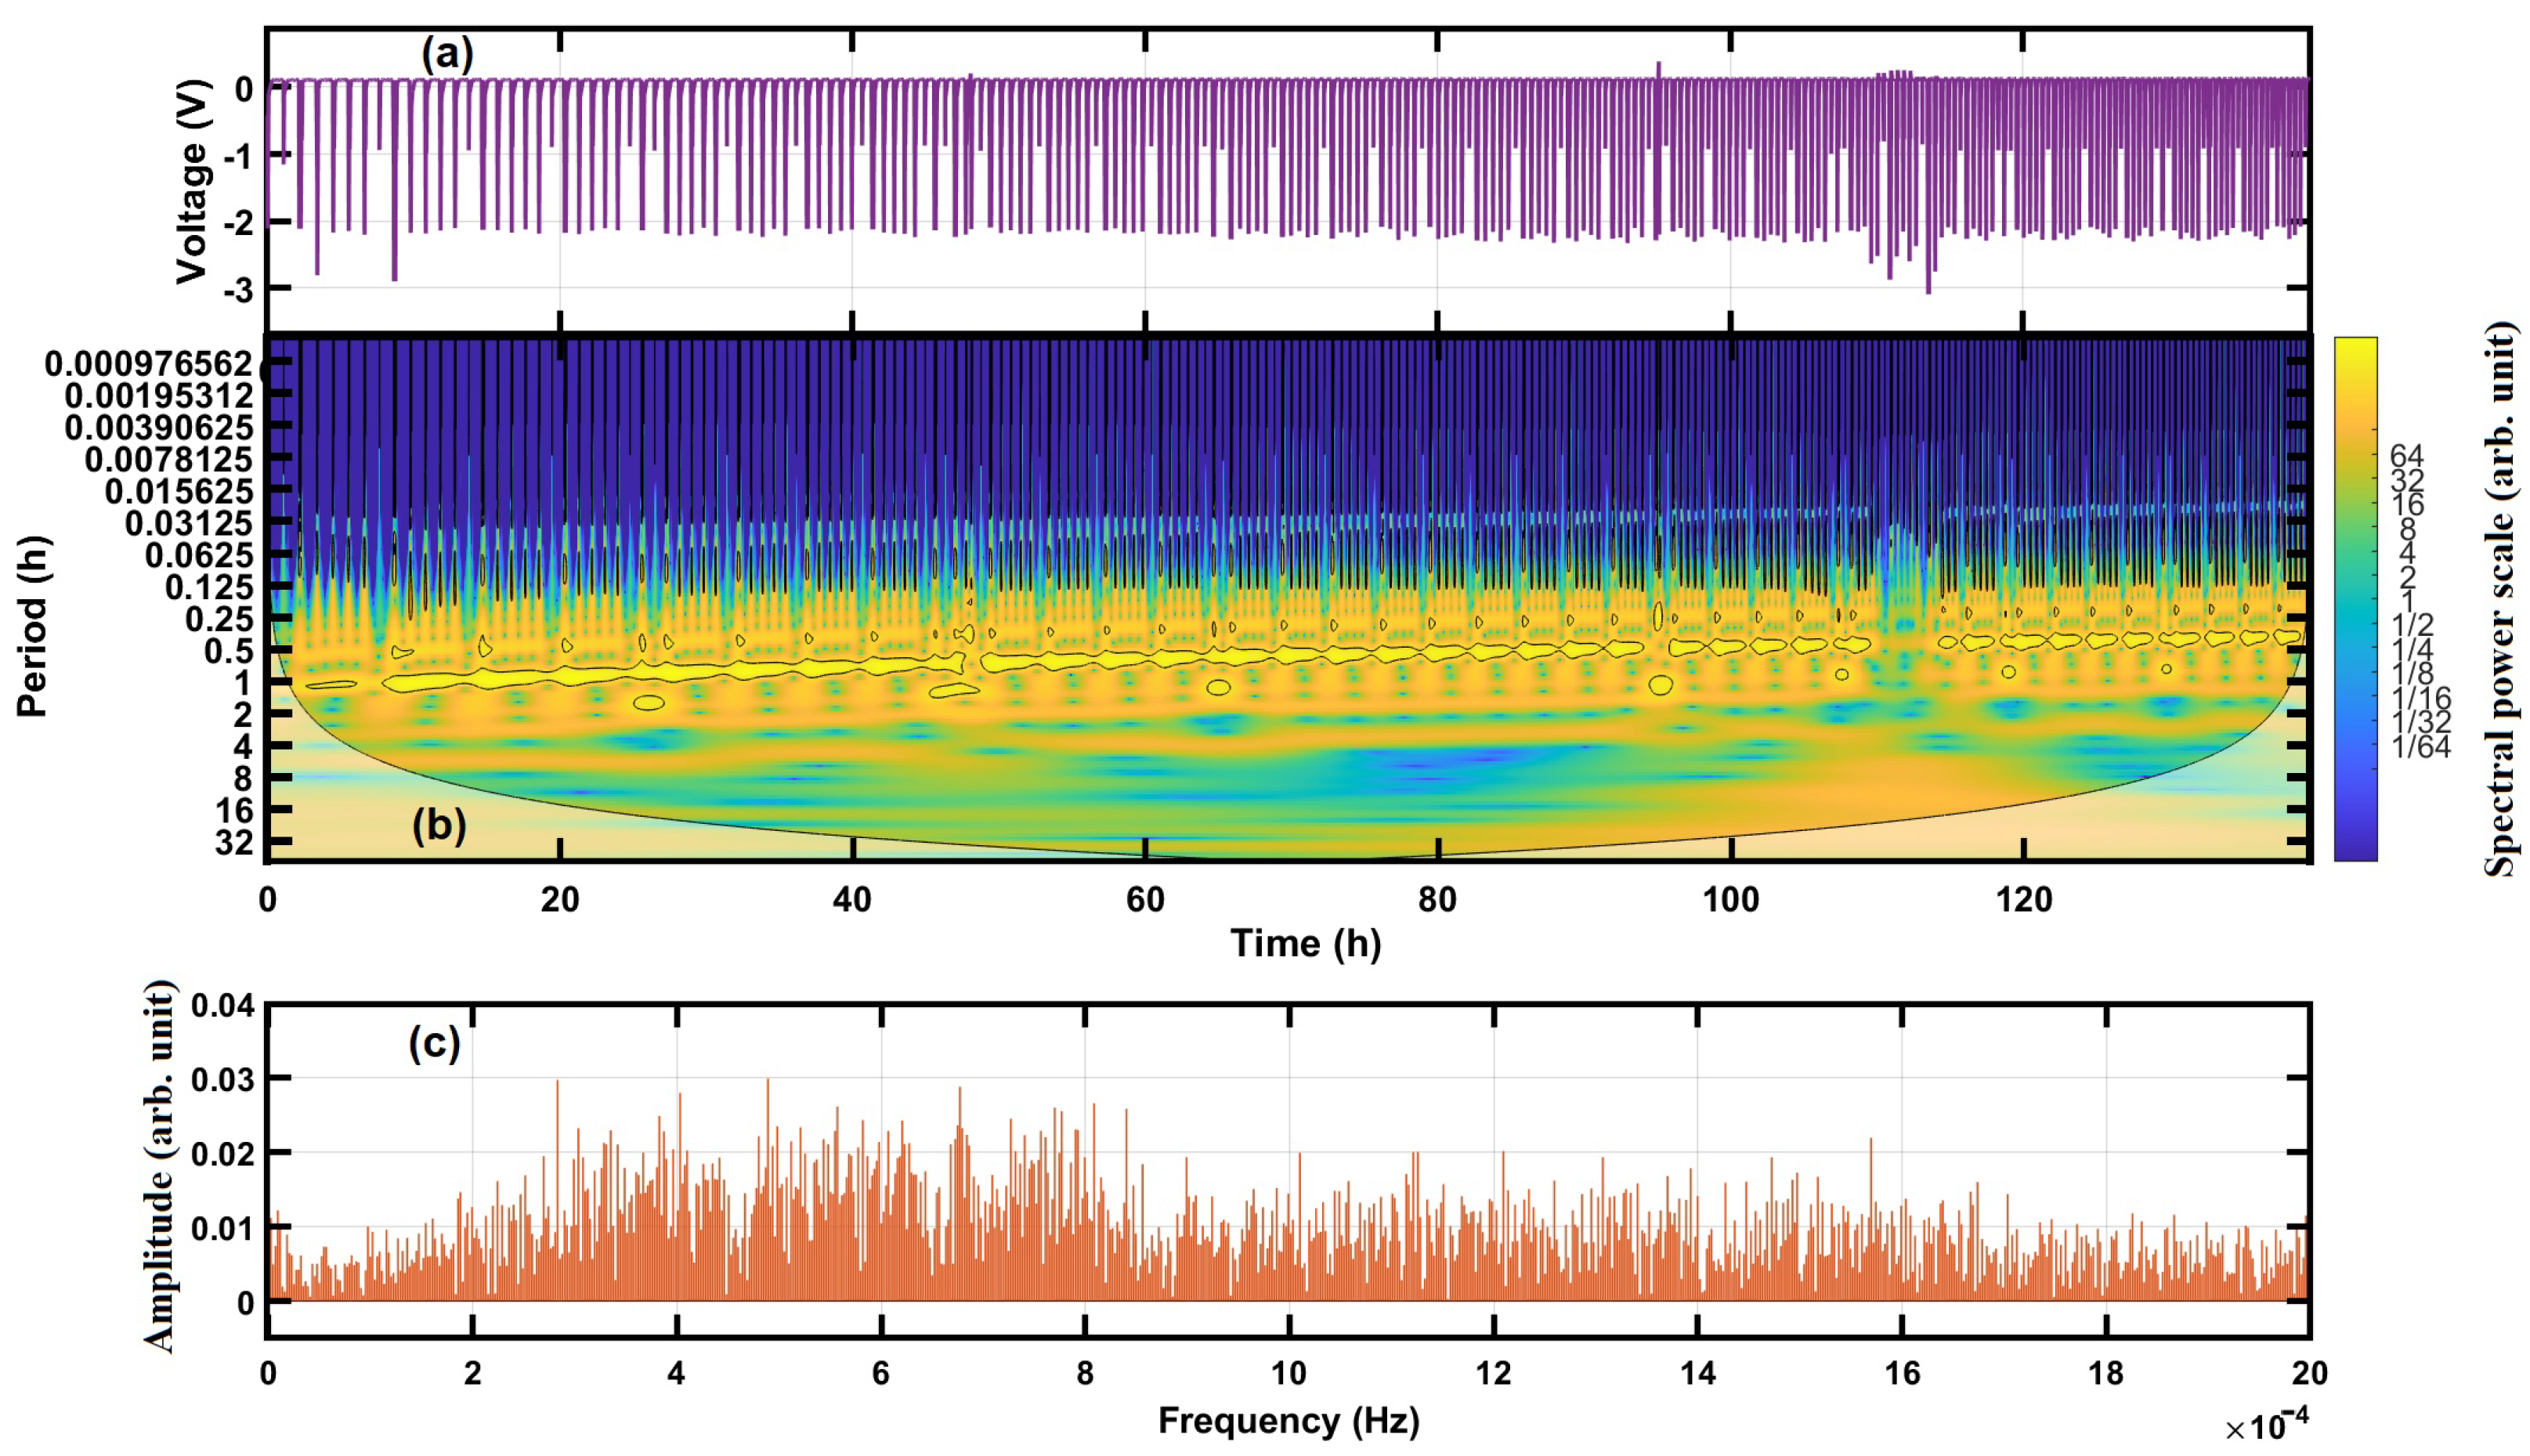
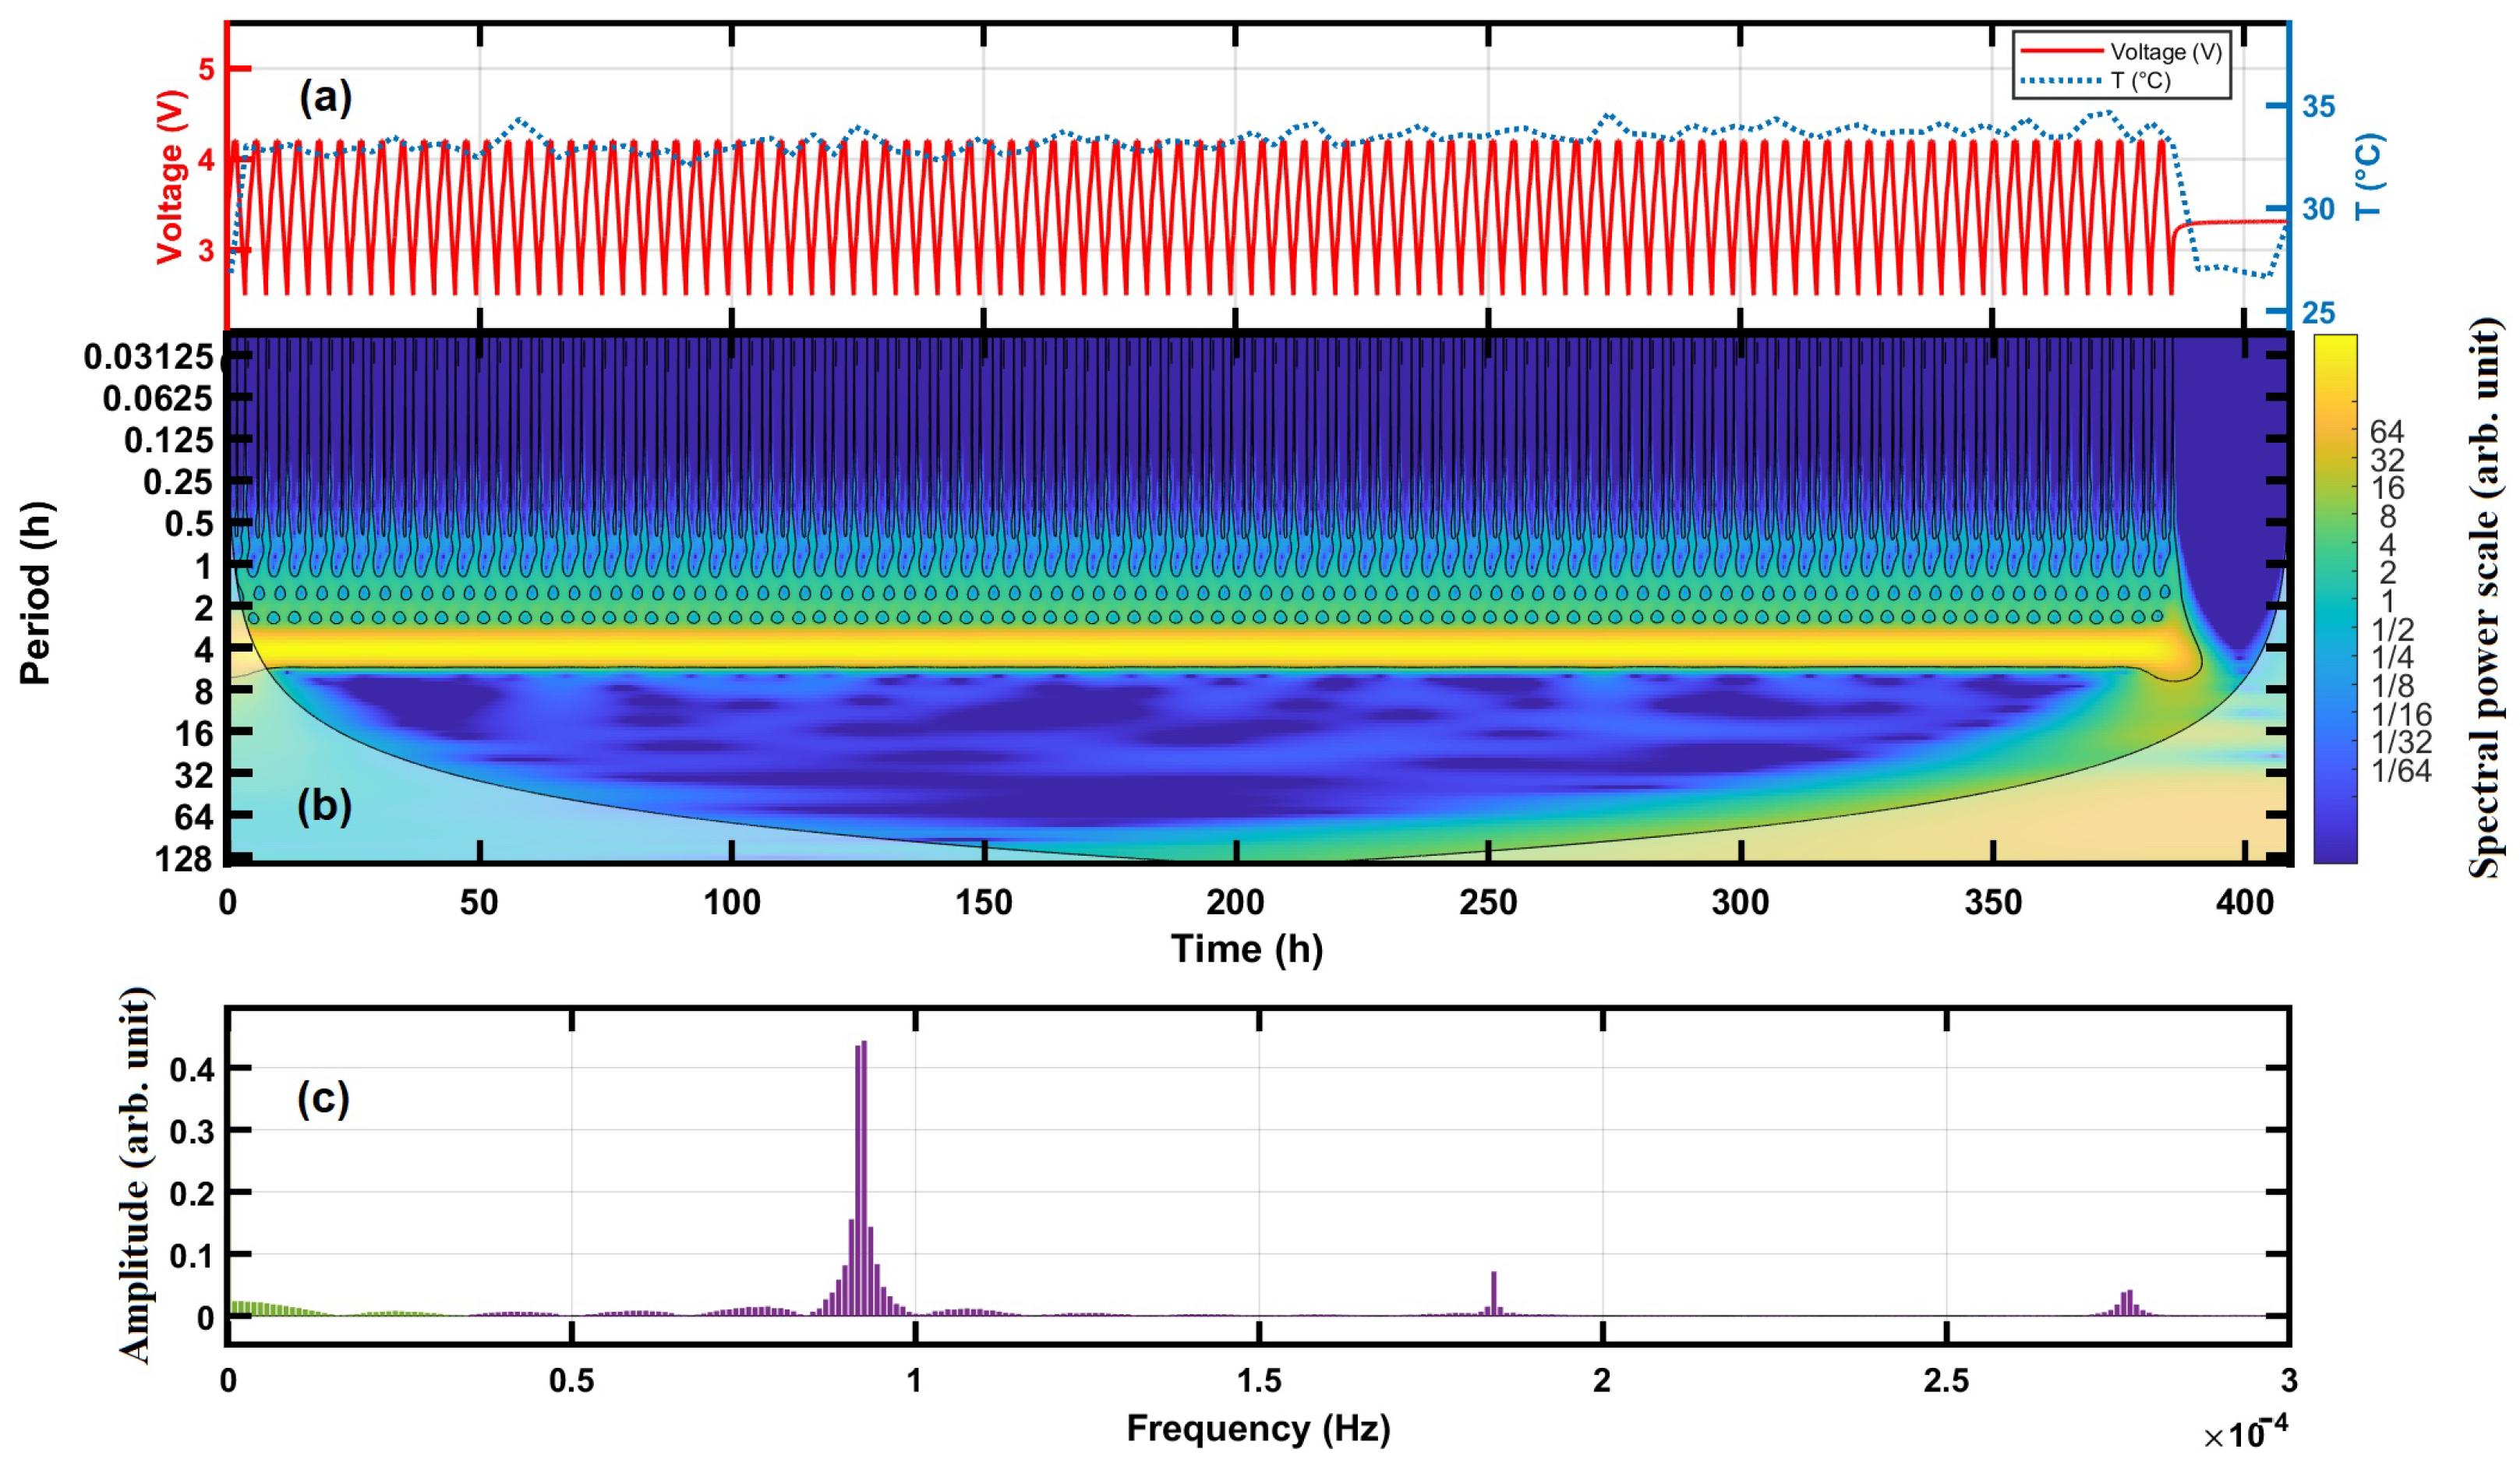
4.1. Frequency Spectra of Cycling Voltage

We applied FFT to the 16 databases; for simplicity, the corresponding graphs show only the range that contains the main frequency components associated with any irregularity or failure event in the batteries. The Fourier spectrum for the voltage signal of the HC3 battery tested by IF-BUAP is shown in Figure 3a. The spectra for HC1, HC2 and HC4 cells are shown in Figures S1c–S3c of the Supplementary Information. In this case, the frequencies range shown is from 3.02 × 10 7 to 10 × 10 5 Hz, where the main frequencies are at 1.09 × 10 5 Hz and 4.44 × 10 5 Hz (with periods of 25.48 h and 6.25 h), corresponding to the precondition cycles (first four cycles) and the regular cycling, respectively. As can be expected for the complex signal (V vs. t), the strongest intensity is at 3.99 × 10 5 Hz, rather than at the main frequencies; those frequencies can hardly be identified in the voltage vs. time graph of Figure 3a. However, below 0.574 × 10 5 Hz, a regular spectrum (green area) is observed that cannot be clearly related to any evidential or potential failure of the cell voltage.
Figure 4c shows the Fourier spectrum of the cell PC-25C cycled at 25   ° C by CALCE. This cell test shows an evident overcharge failure after 14 h of cycling (see Figure 4a). The same cell was tested at 35   ° C, 45   ° C and 55   ° C, but it apparently did not show any severe failure, as can be seen in the corresponding Fourier spectra of Figures S4c–S6c in the Supplementary Information. As the charge/discharge voltage period (C rate) is constant during the cycling tests at different temperature, the main frequency is the same, that is, 5.37 × 10 3 Hz (with a period of 0.051 h), and the Fourier spectra are similar in the four cases. However, only the test at 25   ° C presents an evident failure after 14 h of cycling, and the Fourier spectrum is well-shaped below 4.37 × 10 3 Hz (under the green area), like that shown in Figure 3c, but in a wider frequency range.
The Fourier spectrum of the cell C-LIC3 evaluated by NASA-PCE shown in Figure 5c exhibits multiple frequencies of high amplitude due to the irregularity of the cycles. This cell was charged at 0.75 C and discharged at 2 C over the whole cycling test, but was observed that the voltage period decreased over the time (see Figure 5a). The Fourier spectrum does not exhibit a regular pattern in the low frequency range, as in the case of HC3 and PC-25C cells shown in Figure 3a and Figure 4c, respectively, although the C-LIC3 cell has cycles of overdischarge between hours 109 and 114 of the test. The Fourier spectra for C-LIC1, C-LIC2 and C-LIC4 show similar trends (see Figures S7c–S9c in the Supplementary Information).
The cell of UCL was evaluated during 400 cycles, separated in four databases, the Fourier spectrum of the test from 110 to 202 cycle (CC3500-2) is shown in Figure 6c. As result of the almost uniform cycling over the whole test, the Fourier spectrum is well-shaped, with the two main frequencies and their harmonics clearly identified. In Figure 6a, it can be seen that, apparently, there is not a cell fault, but the cycle period slightly increased with the time. As result, the Fourier spectrum shows two main frequencies instead of one, almost overlapped, one at 9.16 × 10 5 and 9.25 × 10 5 Hz. At the end of the test, there was a kind interruption in the cycling. The database of this cell test has also temperature information, and it is included in Figure 6a. As can be seen, the cell temperature oscillated and slightly rose over the cycling test; this was probably the reason for the increment in the period of charge/discharge cycle. The Fourier spectrum also shows a well-shaped pattern in the low frequency range, in green, which cannot be associated with a failure in the battery, rather to the interruption in the cycling at the end of the test. The Fourier spectra for the remainder cycling intervals are shown in Figures S10c–S12c of the Supplementary Information.

4.2. Time-Frequency Analysis by the Continuous Wavelet Transform

The analysis of the time-dependent voltage of LIBs during the cycling test was extended to the time-frequency domain using the CWT. For the purpose of analyzing local power variations within a single non-stationary time series with multiple periodicities (battery voltage), the Morlet wavelet was selected as the mother wavelet to study local variations of spectral power at multiple periodicities and for feature extraction [53]. The Morlet wavelet mother provides high resolution on the period (frequency) scale and is a complex function, allowing the series to be filtered in bandwidths [54]. The color bar shown on the right side of Figure 3b–Figure 6b indicates the wavelet spectral power scale in arbitrary units, with deep yellow representing the highest spectral power and light blue representing the lowest.
Figure 3b shows the wavelet spectrum of cycling voltage of the HC3 evaluated by the IF-BUAP. As can be observed, in the middle of the wavelet spectrum, the period of the cycling test is clearly identified within the two bands in deep yellow, corresponding to the preconditioning period of 25.5 h (from the beginning to approximately 100 hours), and the regular cycling with a period 6.25 h. Moreover, after approximately 450 h just before the overcharge event, a third period of 3.5 h of lower spectral power is observed. This period reduction is due to the electrochemical response of the battery. Close to the end of the test, the wavelet spectral power has a diffuse area in deep yellow that extended over a wide range of periods, corresponding to an overcharge in the battery, see also Figure 3a. Notice that, after approximately 350 h of the test, a light-yellow area emerges in a long period region; its spectral power increases and widens up to overlap with the failure zone.
Clearly, the voltage goes beyond the upper voltage limit during discharge after 700 h of cycling (see Figure 3a). In regular conditions, a voltage rise can occur during charging, but not beyond the limits; the battery charger is programmed to automatically stop when reaching the cut-off voltage. However, during discharge, there is no upper voltage limit because it regularly decreases; there is just a lower voltage limit. This failure could be due to an electronic conductive path created by lithium dendrites growing between battery electrodes, the delithiation of the Si electrode, and the Li plating of the Li anode. It is observed in wavelet Spectrum as a step the main frequency, at around 650 h of cycling, with an increase in the period cycling. The period range of this light-yellow area in the wavelet spectral power corresponds to the frequencies within the green area observed in the Fourier spectra (see Figure 3c). Similar trends are observed in the wavelet spectral power of Figures S1b–S3b of the Supplementary Information, but there is not a crucial electrical failure in those cells.
An unusual overcharge failure in the cycling test is observed (see Figure 4a). Battery analyzers must be programed with a cut-off voltage for a give battery type, but in this case, after 690 h of cycling, the battery voltage twice surpassed the offset of 4V, and the charging current continued. Overcharges is one of the most severe batteries failures in safety terms, it is frequently due to misfunction of the charger. Probably, in this case, the cycling process was intentionally allowed to continue despite the overcharge to test the battery in extreme conditions. After the overcharge, the cycling period increases, and the battery capacity drops. Moreover, the wavelet spectrum shows tends anticipating the failure. The wavelet spectrum of the cycling voltage (PC-25C) of the cell evaluated by CALCE is shown in Figure 4b. As can be observed, in the middle of the spectrum there is a deep yellow band with the main periodicity (0.051 h). This band is deformed when the period of cycling changes irregularly, see also Figure 4a. For example, after approximately 2 h, the maximum charging voltage lasted twice, obviously this cycle has different periods that originates from an irregularity in the main band of the wavelet spectrum. Moreover, just below the main band surge several cone-like regions of lower spectral intensity (in light yellow) that extend to the high period range. Some of these cone-like regions can be clearly distinguished as irregularities in the cycling test, see Figure 4a, but other can hardly be distinguished. However, all of them are completely resolved by the wavelet transform. A closer re-examination of the database indicates that during this event, the cell capacity dropped, that confirms the cone-like regions correspond to transitory failures of the battery. After approximately 14.3 h, the wavelet spectral power shows in deep yellow with a remarkable range of periods longer than the main, that corresponds clearly to the overcharge failure, and that event lasted approximately 45 min. Again, notice that around 6 h, in the highest period range, an intense spectral area, that widens over the time up to overlap with the failure zone, appears. The range of high periods corresponds to the low frequencies of Fourier spectrum marked in green in Figure 4c. A closer re-examination of the database indicates that after the overcharge failure, the cell capacity drops and as result the main period decreases. In Figures S4b–S6b of the Supplementary Information, the wavelet spectra of the cell voltage tested at 35   ° C, 45   ° C and 55   ° C, without any critical failure detected, are shown.
The wavelet spectral power of the four cells tested by NASA-PCE have a wide discontinuous central band (from approximately 0.1 to 5 h) with some short gaps. The wide range of periods of this band arise from the irregular response of the battery to the extreme cycling parameter imposed by the test protocols, see Table 2. The main period in all the cells is around 1 h. Figure 5b shows the wavelet spectrum of the voltage of the C-LIC3 cell, where the main period is indicated by deep yellow, approximately in the center of this band. The signal is discontinuous and decreases over the time due to the reduction in the cell capacity reported in the data base. The central yellow band has a discontinuity after 110 h of cycling due to a series of overcharge presented during these cycles. This is probably due to the accelerated discharging of the battery (4000 mA), that is twice than during charging (1500 mA), in a battery of 2000 mAh. The series of failures detected (small overcharges and overdischarges) may be the result of the continue degradation of the battery due to the extreme test condition. A detailed analysis of the battery component after the cycling (postmortem) could provide insights of the failure mechanism, not available in NASA-PCE data base. In Figures S7b–S9b of the Supplementary Information, the wavelet spectral power for cells C-LIC1, C-LIC2 and C-LIC4 are shown, respectively.
The wavelet power spectrum of the cell tested by UCL during 110–202 cycles is shown in Figure 6b; it has a uniform central band, in deep yellow, due to the steady response of the battery. No irregular events are detected during the cycles, just the cycling interruption at the end of the test. However, there is a capacity loss during the last 10 cycles, which is seen as an increase in the period range in the wavelet spectral power.
In CC3500-2 (cycles 110–202), there is not a real battery failure. After cycling, during the pause, the voltage was stabilized to 3.3 V (at about 400 h). The spectral analysis recognized this event as a failure since battery was not cycling, but it could detect unexpectedly interruptions. Similar trends are shown for the remaining cycles (see Figures S10b–S12b in the Supplementary Information).

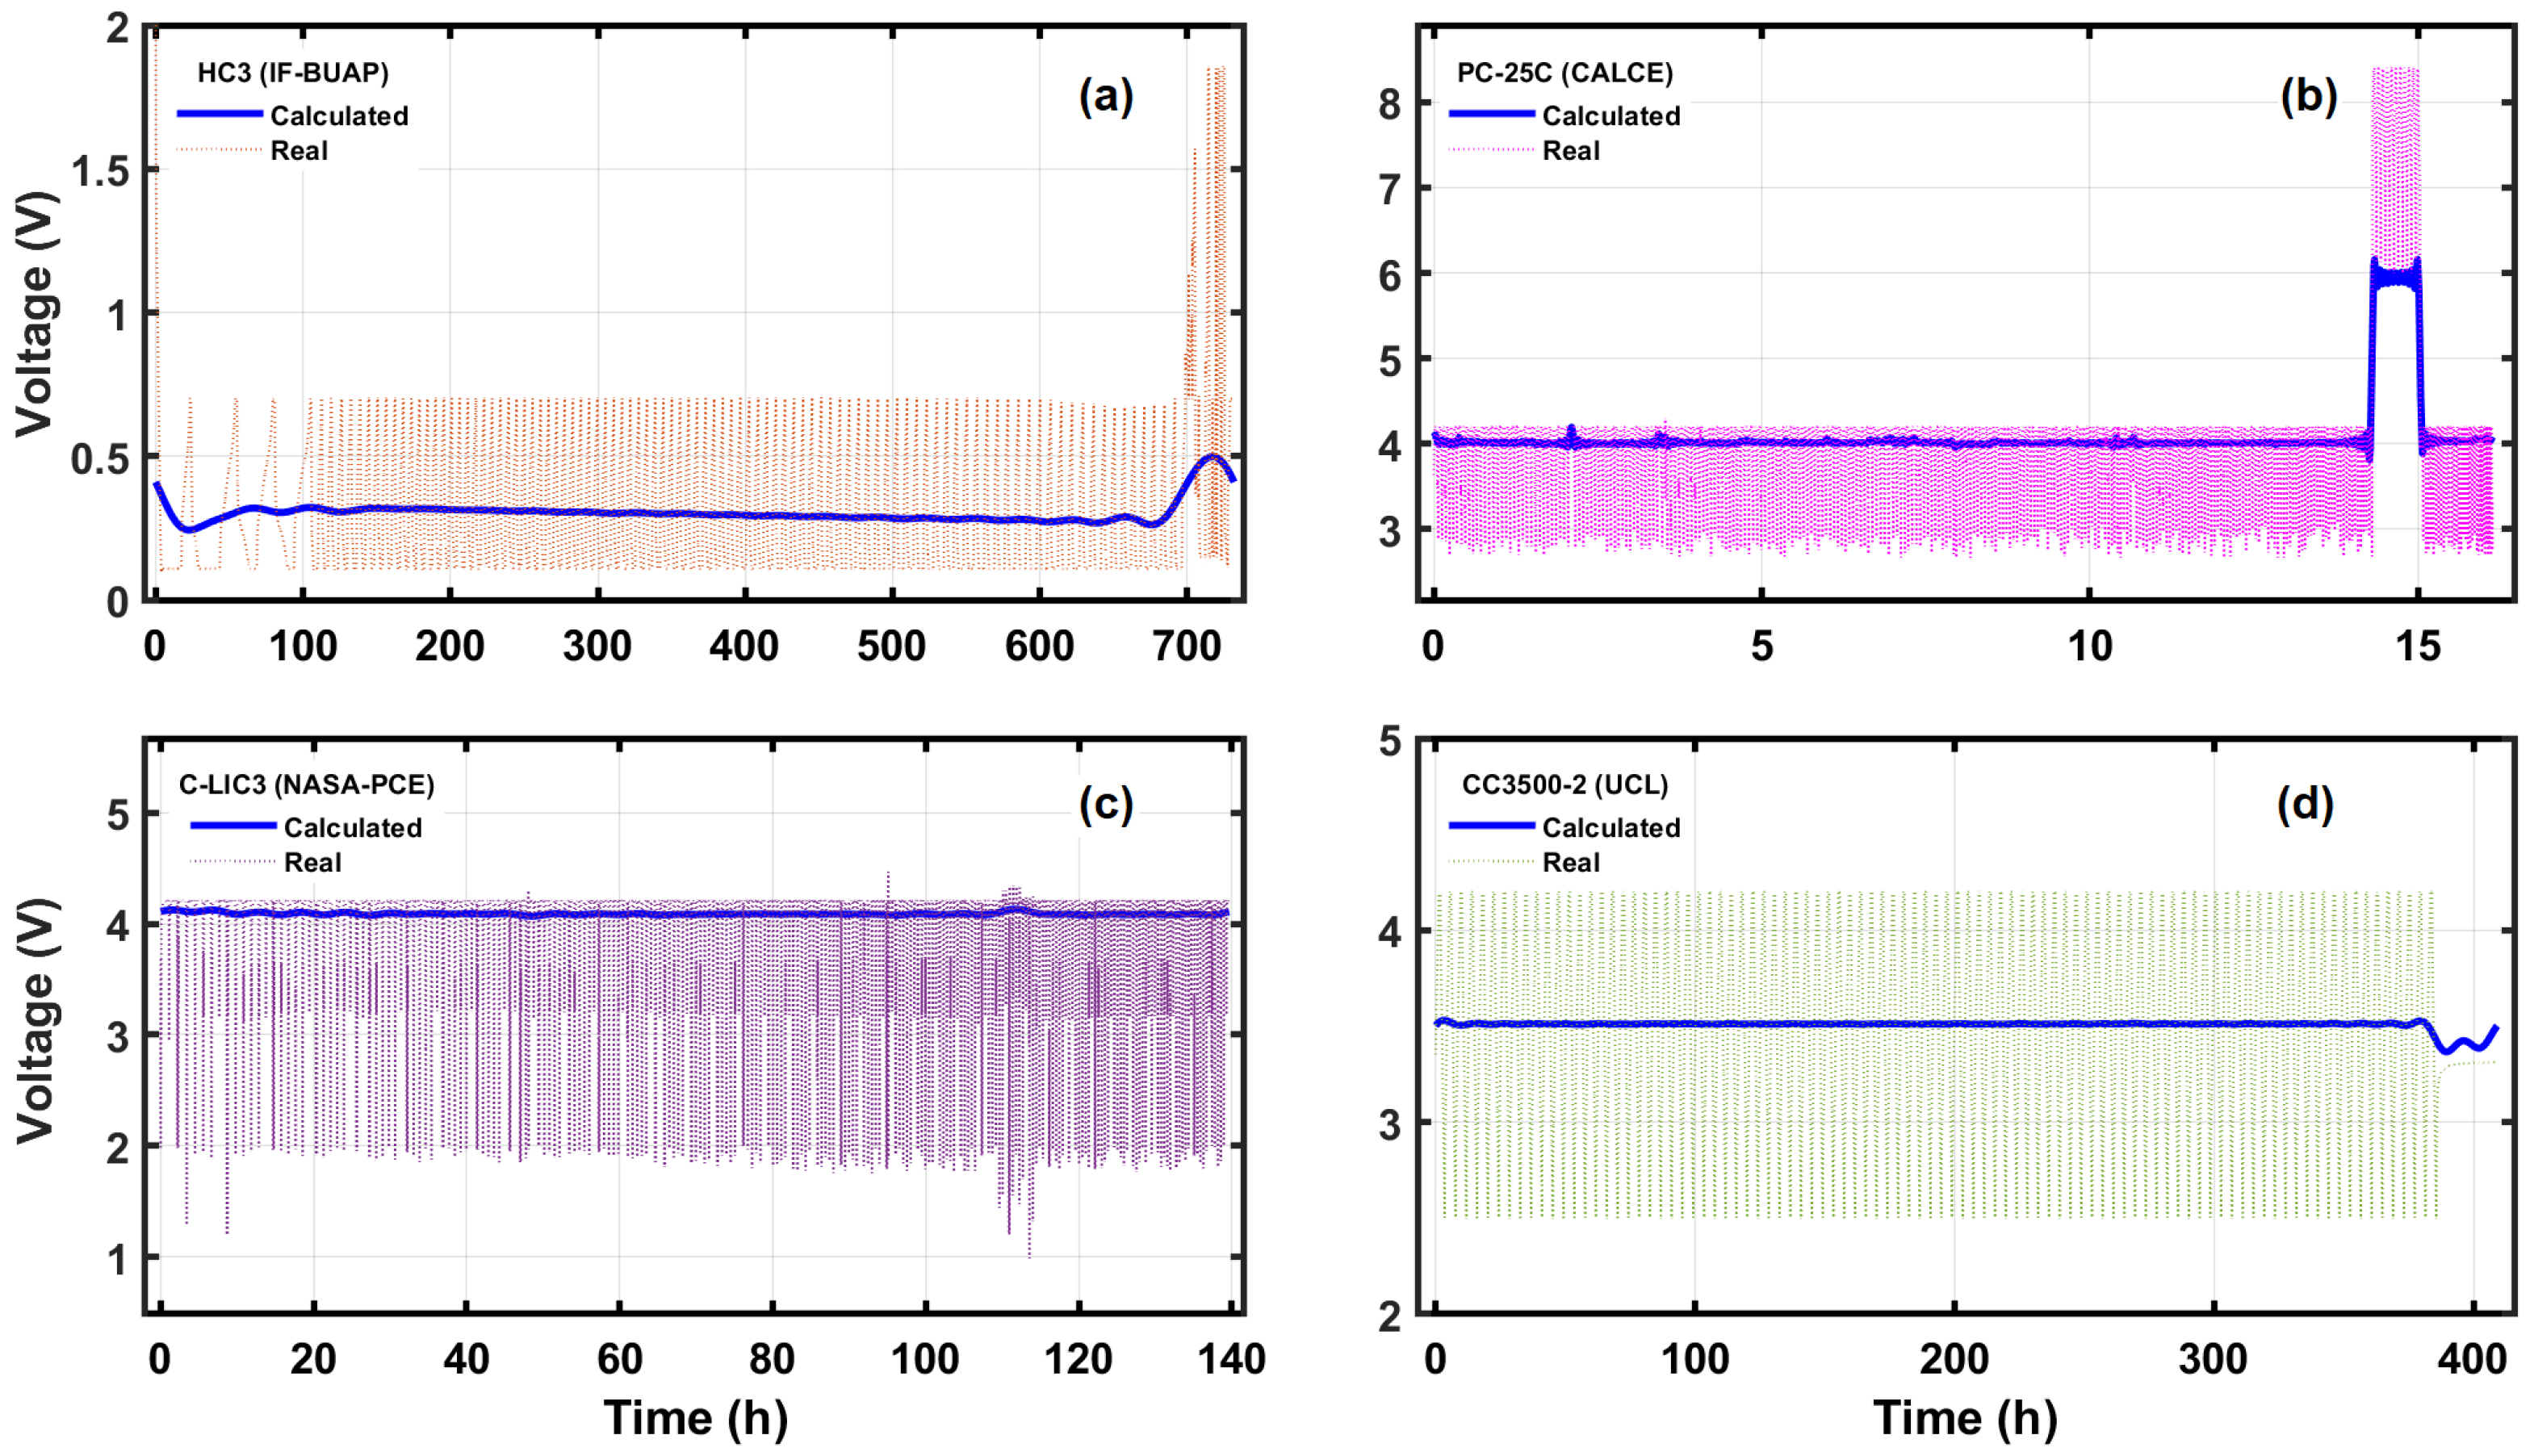
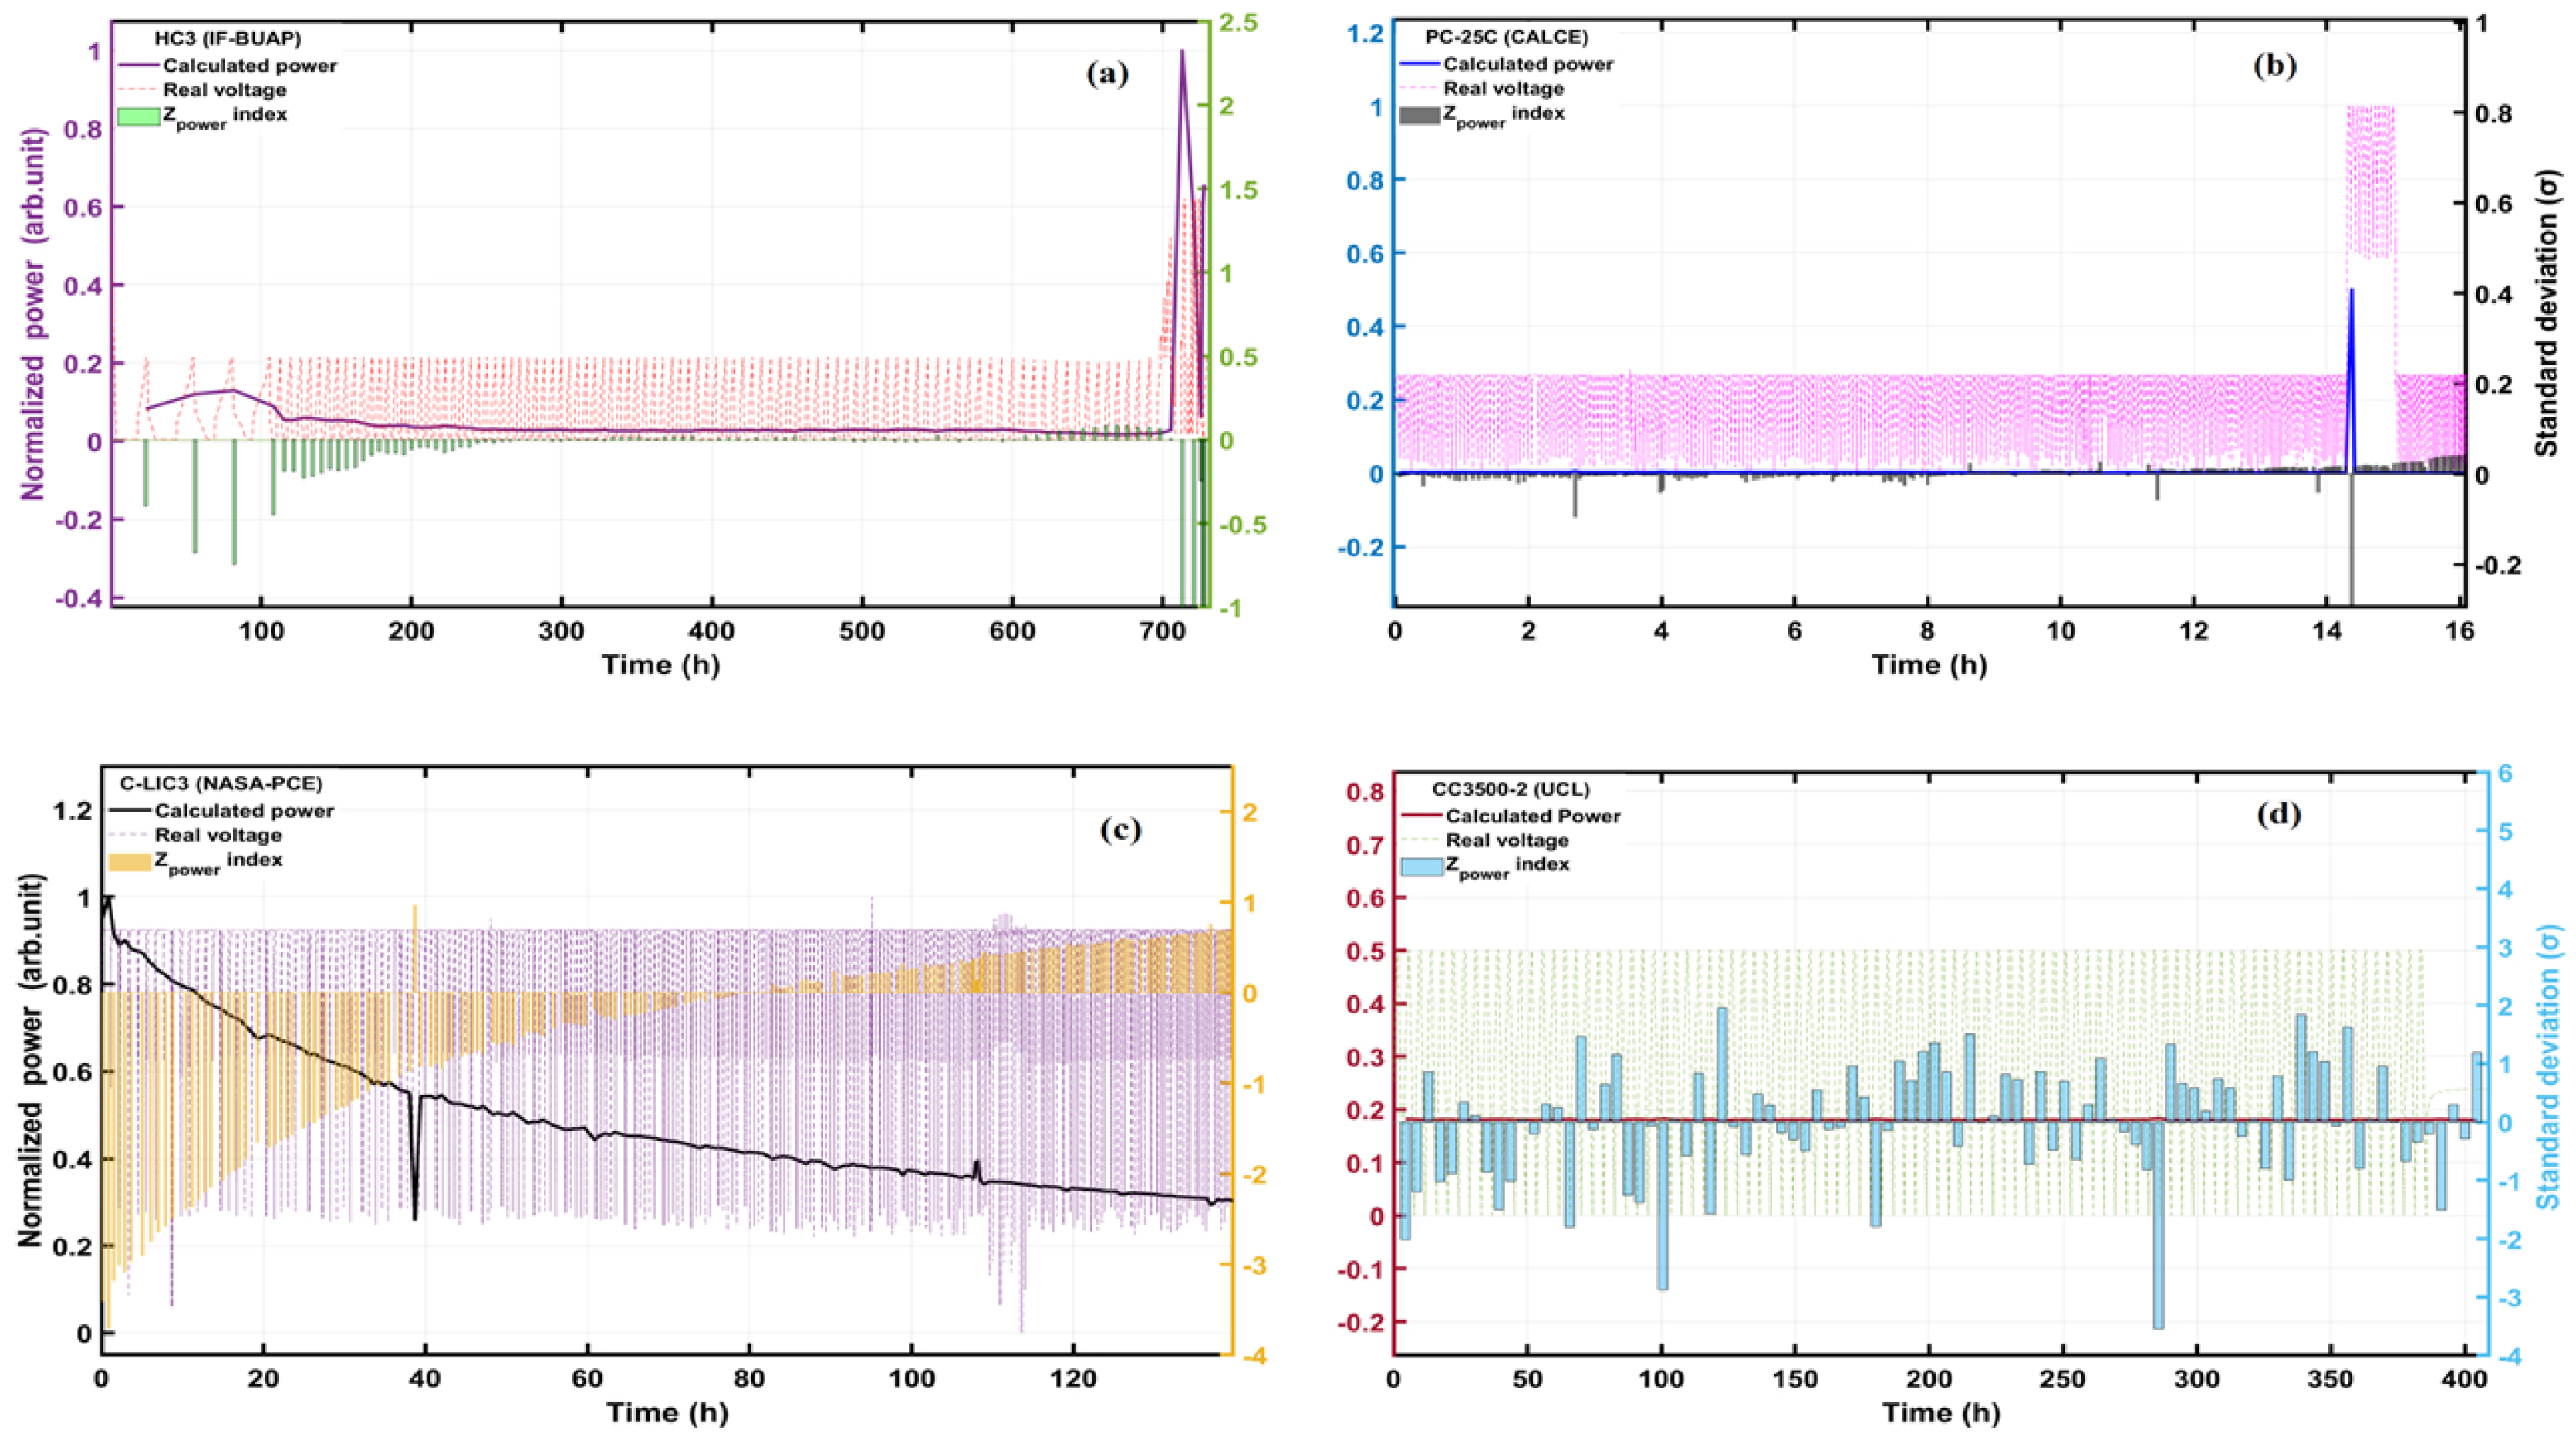
5. A Model for Early Battery Failure Detection

The spectral analysis by wavelet transforms of the battery voltage showed that, long before a critical failure, a pattern in the high period region emerges. The period of this pattern decreases with the time and widens up close to the failure region. Notice also that the spectral power increases close to the failure region, the corresponding frequency range is identified by FFT. The wavelet transform also shows similar patterns preceding any irregular event during the voltage cycling, but narrower and with lower spectral power than in the case of a critical failure. Similar spectral patterns have been found in diverse phenomena that experiences abrupt changes of state due to any disturbance that are apparently stochastic, but the spectral analysis showed some periodicity. For example, spectral analysis has been used to study the variations in free surface during the passage of a hurricane, to locate hidden tunnels in archeological subsurface strata of pyramids, to analyze water levels and detect solar particles in the ground, and to understand the periodicity of these events [55,56,57,58]. The pattern of the wavelet spectral power in the prolonged period range that appears before a critical event can be used to model the battery failure function. This function was calculated by applying the inverse Fourier transform to the frequency spectra range (highlighted in green in Figure 3c, Figure 4c and Figure 6c) related to the failure, identify by the wavelet spectral power. Figure 7 shows the graphs of the real battery voltage and the calculated voltage for one cell of each research group. As can be seen, the calculations give the average voltage signal and the exact time when a failure or irregularities occurs, without the peak oscillation of the real cycling voltage.
Our battery failure model, which is based on the band/range of periods with high spectral power identified through wavelet transforms, can be validated by applying the Parseval’s theorem in the calculation of the power of signals. Figure 8 shows the normalized power as a function of time for the four cells, one from each research group. In the same plot, the normalized real voltage, calculated power index P N and standardized power index of the battery voltage signal ( Z P o w e r ) emerges. The Z P o w e r index was calculated with the following expression:
Z P o w e r = P N < P > σ
where P N is the normalized power calculated for each cycle, < P > is the mean value of the calculated overall power index and σ is the standard deviation [59].
The Z P o w e r function can be used to standardize the calculated power values for each charge/ discharge cycle. The sigh of this function changes from negative to positive values at the beginning of a battery failure, from this stage, it oscillates between negative and positive values. However, once the Z P o w e r value remains positive, the battery capacity drop is imminent. In addition, the Z P o w e r function gives information of the degree of dispersion of the power data, and it is related to calculated standard deviation. This variable could be used as an input in a control system to generate an early warning of the battery failure.
Figure 8 shows the calculated power index, the normalized battery voltage, and the standardized power in each cycle as a function of time of the batteries analyzed. As can be seen for all four cases, the power index P N and standardized power index Z P o w e r allow us to identify the C rate in each cycle of the battery voltage, at the same time these changes are identified in the main frequency in the previous continuous wavelet transform analysis, see Figure 3b–Figure 6b. Furthermore, when the power of a cycle is lower than the average value, we see a change of direction in Z P o w e r (the standard deviation is positive). When this trend is maintained in the following cycles, a continuous degradation process is observed. This pattern/behavior has also been observed to occur in the wavelet analysis before an overcharge failure of the battery. We can thus conclude that the Z P o w e r function could be used for early failure detection in the battery.

6. Conclusions

We performed a spectral analysis of the cycle voltage of charge/discharge test in lithium-ion batteries, with different configurations and subjected to varied cycling parameters. The traditional Fourier transform allowed the identification of the main frequencies of voltage cycling, harmonic components in regular cycling test and, in some cases, a well-defined pattern in the low frequency. The amplitude of the patterns decreases as the frequency increases, but it is difficult to associate it with a given event in the battery. A complementary analysis with the CWT revealed interesting patterns of the battery cycling test; first, before an irregular event or critical failure of the battery from an overcharge, the loss of electrical contact or an interruption in the cycling of the battery, the voltage is composed of a band/range of periods with high spectral power; then, the range of this underlying pattern of period expands and spectral power increases with the time until it merges with the failure event. In addition, this period range of the wavelet spectral power corresponds to the frequencies with a well-defined shape and trend found by the Fourier spectra. Finally, a change of direction in ( Z P o w e r ) (the standard deviation is positive) and when this trend is maintained in the following charge cycles, a continuous degradation process until a total failure occurs. The methodology developed here could be improved by simultaneously performing the spectral analysis of at least two electric parameters of the battery cycling, such as voltage together with the current, impedance, or temperature, to identify the kind of battery failure. Further study based on the simultaneous spectral analysis is in progress to try to establish a practical early detection time of risky battery failure. Importantly, this identified pattern could be used to establish risk levels associated with signs of battery overcharge failure, when a high or low standard deviation is detected. This is the first time that battery failures have been anticipated by spectral analysis. These new results could be the key for the early detection of battery failure for reducing or minimizing the risks in LIBs.

Supplementary Materials

The following supporting information can be downloaded at: https://www.mdpi.com/article/10.3390/en16031073/s1.

Author Contributions

Conceptualization, M.E.C.d.R., R.N., E.Q.G. and G.V.H.; Methodology, V.M.V.H.; Software, M.E.C.d.R., G.V.H. and V.M.V.H.; Validation, M.E.C.d.R., G.V.H. and V.M.V.H.; Formal Analysis, M.E.C.d.R., G.V.H., R.N., E.Q.G. and V.M.V.H.; Investigation, M.E.C.d.R., G.V.H., R.S.E., P.S.Á., R.N., E.Q.G. and V.M.V.H.; Resources, G.V.H., R.S.E., R.N. and P.S.Á.; Data Curation, M.E.C.d.R., G.V.H., R.S.E., P.S.Á. and J.G.I.; Writing—original draft preparation, M.E.C.d.R., R.N. and G.V.H.; Writing—review and editing, M.E.C.d.R., G.V.H. and V.M.V.H.; Visualization, G.V.H. and V.M.V.H.; Supervision, G.V.H. and R.N.; Project Administration, V.M.V.H., R.N. and G.V.H.; Funding Acquisition, G.V.H. and R.N. All authors have read and agreed to the published version of the manuscript.

Funding

CONACyT project 21077 of frontiers of science of the call 2019, and VIEP-BUAP through the project: 100523072-VIEP2021.

Institutional Review Board Statement

Not applicable.

Informed Consent Statement

Not applicable.

Data Availability Statement

Not applicable.

Acknowledgments

The authors are grateful for all supports from: Instituto de Geofísica, Universidad Nacional Autónoma de México, Instituto de Ciencias Aplicadas y Tecnología, Universidad Nacional Autónoma de México. The authors acknowledge to NASA-PCE, CALCE and UCL for providing the battery cycling data bases. Also, to CONACyT for the doctoral scholarship granted, to DGAPA-UNAM under grant PAPIIT-IN109122, to CONACyT project 21077 of frontiers of science of the call 2019, and to VIEP-BUAP through the project 100523072-VIEP2021 for the financial support. V.M. Velasco Herrera acknowledges the support from PAPIIT-IT102420 grant. G. Velasco Herrera acknowledges the support from “Marcos Mazari Menzer”-grant. Specific Collaboration Agreement UNAM Registration No. 57149-329-11-20-1, and PAPIIT IG100222: “Modificaciones estimadas del parque vehicular en la Ciudad de México hacia las décadas 30’s y 40’s, así como su impacto en las emisiones de contaminantes atmosféricos criterio y gases de efecto invernadero” Rogelio González Oropeza of “Facultad de Ingeniería de la UNAM” and William Vicente Rodríguez of “Instituto de Ingeniería de la UNAM”.

Conflicts of Interest

The authors declare no conflict of interest.

Abbreviations

The following abbreviations are used in this manuscript:
MCMAMexico City Metropolitan Area
SEDEMASecretariat of Environment
VOCsVolatile Organic Compounds
EVsElectric Vehicles
Li-ionlithium-ion
IF-BUAPInstitute of Physics of the University of Puebla
CALCECenter for Advanced Life Cycle Engineering of University of Maryland
NASA-PCENASA’s Prognostics Center of Excellence
UCLUniversity College London
FTFourier Transform
FFTFast Fourier Transform
DFTDiscrete Fourier Transform
CWTContinuous Wavelet Transform
CCConstant Current
CVConstant Voltage
HCHalf Cells
PCPrismatic Cell
C-LICCommercial Lithium-ion Cells

References

  1. Pan, Y.; Feng, X.; Zhang, M.; Han, X.; Lu, L.; Ouyang, M. Internal short circuit detection for lithium-ion battery pack with parallel-series hybrid connections. J. Clean. Prod. 2020, 255, 120277. [Google Scholar] [CrossRef]
  2. Williard, N.; He, W.; Hendricks, C.; Pecht, M. Lessons learned from the 787 dreamliner issue on lithium-ion battery reliability. Energies 2013, 6, 4682–4695. [Google Scholar] [CrossRef] [Green Version]
  3. Xue, Q.; Li, G.; Zhang, Y.; Shen, S.; Chen, Z.; Liu, Y. Fault diagnosis and abnormality detection of lithium-ion battery packs based on statistical distribution. J. Power Sources 2021, 482, 228964. [Google Scholar] [CrossRef]
  4. Wang, Q.; Ping, P.; Zhao, X.; Chu, G.; Sun, J.; Chen, C. Thermal runaway caused fire and explosion of lithium-ion battery. J. Power Sources 2012, 208, 210–224. [Google Scholar] [CrossRef]
  5. Xu, J.; Lan, C.; Qiao, Y.; Ma, Y. Prevent thermal runaway of lithium-ion batteries with minichannel cooling. Appl. Therm. Eng. 2017, 110, 883–890. [Google Scholar] [CrossRef] [Green Version]
  6. Ma, G.; Xu, S.; Cheng, C. Fault detection of lithium-ion battery packs with a graph-based method. J. Energy Storage 2021, 43, 103209. [Google Scholar] [CrossRef]
  7. Sidhu, A.; Izadian, A.; Anwar, S. Adaptive nonlinear model-based fault diagnosis of li-ion batteries. IEEE Trans. Ind. Electron. 2015, 62, 1002–1011. [Google Scholar] [CrossRef] [Green Version]
  8. Liu, Z.; He, H. Sensor fault detection and isolation for a lithium-ion battery pack in electric vehicles using adaptive extended Kalman filter. Appl. Energy 2017, 185, 2033–2044. [Google Scholar] [CrossRef]
  9. Yang, R.; Xiong, R.; He, H.; Chen, Z. A fractional-order model-based battery external short circuit fault diagnosis approach for all-climate electric vehicles application. J. Clean. Prod. 2018, 187, 950–959. [Google Scholar] [CrossRef]
  10. Zhao, Y.; Liu, P.; Wang, Z.; Zhang, L.; Hong, J. Fault and defect diagnosis of battery for electric vehicles based on big data analysis methods. Appl. Energy 2017, 207, 354–362. [Google Scholar] [CrossRef]
  11. Ma, M.; Wang, Y.; Duan, Q.; Wu, T.; Sun, J.; Wang, Q. Fault detection of the connection of lithium-ion power batteries in series for electric vehicles based on statistical analysis. Energy 2018, 164, 745–756. [Google Scholar] [CrossRef]
  12. Kang, Y.; Yang, X.; Zhou, Z.; Duan, B.; Liu, Q.; Shang, Y.; Zhang, C. A comparative study of fault diagnostic methods for lithium-ion batteries based on a standardized fault feature comparison method. J. Clean. Prod. 2021, 278, 123424. [Google Scholar] [CrossRef]
  13. Spitthoff, L.; Shearing, P. Temperature, Ageing and Thermal Management of Lithium-Ion Batteries. Energies 2021, 14, 1248. [Google Scholar] [CrossRef]
  14. Gao, Z.; Cecati, C.; Ding, S.X. A Survey of Fault Diagnosis and Fault-Tolerant Techniques–Part I: Fault Diagnosis With Model-Based and Signal-Based Approaches. IEEE Trans. Ind. Electron. 2015, 62, 3757–3767. [Google Scholar] [CrossRef] [Green Version]
  15. Bosire Omariba, Z.; Zhang, L.; Kang, H.; Sun, D. Parameter Identification and State Estimation of Lithium-Ion Batteries for Electric Vehicles with Vibration and Temperature Dynamics. World Electr. Veh. J. 2020, 11, 50. [Google Scholar] [CrossRef]
  16. Redondo-Iglesias, E.; Venet, P.; Pelissier, S. Modelling Lithium-Ion Battery Ageing in Electric Vehicle Applications–Calendar and Cycling Ageing Combination Effects. Batteries 2020, 6, 14. [Google Scholar] [CrossRef] [Green Version]
  17. Cong, X.; Zhang, C.; Jiang, J.; Zhang, W.; Jiang, Y.; Zhang, L. A Comprehensive Signal-Based Fault Diagnosis Method for Lithium-Ion Batteries in Electric Vehicles. Energies 2021, 14, 1221. [Google Scholar] [CrossRef]
  18. Karagulian, F.; Belis, C.A.; Dora, C.F.; PrÃŒss-UstÃŒn, A.M.; Bonjour, S.; Adair-Rohani, H.; Amann, M. Contributions to cities’ ambient particulate matter (PM): A systematic review of local source contributions at global level. Atmos. Environ. 2015, 120, 475–483. [Google Scholar] [CrossRef]
  19. Knibbs, L.D.; Cole-Hunter, T.; Morawska, L. A review of commuter exposure to ultrafine particles and its health effects. Atmos. Environ. 2011, 45, 2611–2622. [Google Scholar] [CrossRef] [Green Version]
  20. DOF (Diario Oficial de la Federación). Criterio para Evaluar la Calidad del aire Ambiente con Respecto al Bióxido de Nitrógeno (NO2). Valor Normado para la Concentración de bióxido de Nitrógeno (NO2) en el aire Ambiente como Medida de Protección a la Salud de la Población. Norma Oficial Mexicana NOM-023-SSA1-1993. 1994. Available online: http://www.aire.cdmx.gob.mx/descargas/monitoreo/normatividad/NOM-023-SSA1-1993.pdf (accessed on 13 September 2022).
  21. Inventario de Emisiones de la CDMX, 2016; SEDEMA (Secretarà a del Medio Ambiente del Gobierno de la Ciudad de México): Ciudad de México, Mexico, 2018. Available online: http://www.aire.cdmx.gob.mx/default.php?opc=Z6BhnmI=&dc=Zg== (accessed on 20 October 2022).
  22. Molina, L.T.; Velasco, E.; Retama, A.; Zavala, M. Experience from Integrated Air Quality Management in the Mexico City Metropolitan Area and Singapore. Atmosphere 2019, 10, 512. [Google Scholar] [CrossRef]
  23. Koupal, J.; Palacios, C. Impact of new fuel specifications on vehicle emissions in Mexico. Atmos. Environ. 2019, 201, 41–49. [Google Scholar] [CrossRef]
  24. Schmidt, M.; Staudt, P.; Weinhardt, C. Evaluating the importance and impact of user behavior on public destination charging of electric vehicles. Appl. Energy 2020, 258, 114061. [Google Scholar] [CrossRef]
  25. Ferrero, E.; Alessandrini, E.; Balanzino, A. Impact of the electric vehicles on the air pollution from a highway. Appl. Energy 2016, 169, 450–459. [Google Scholar] [CrossRef]
  26. Franke, T.; Neumann, I.; BÃŒhler, F.; Cocron, P.; Krems, J.F. Experiencing range in an electric vehicle: Understanding psychological barriers. Appl. Psychol 2012, 61, 368–391. [Google Scholar] [CrossRef]
  27. Flores, R.J.; Shaffer, B.P.; Brouwer, J. Electricity costs for an electric vehicle fueling station with Level 3 charging. Appl. Energy 2016, 169, 813–830. [Google Scholar] [CrossRef] [Green Version]
  28. Aaldering, L.J.; Song, C.H. Tracing the technological development trajectory in post-lithium-ion battery technologies: A patent-based approach. J. Clean. Prod. 2019, 241, 118343. [Google Scholar] [CrossRef]
  29. Loganathan, M.K.; Mishra, B.; Tan, C.M.; Kongsvik, T.; Rai, R.N. Multi-criteria decision making (MCDM) for the selection of Li-ion batteries used in electric vehicles (EVs). Mater. Today Proc. 2021, 41, 1073–1077. [Google Scholar] [CrossRef]
  30. Li, Y.; Wang, W.; Yang, X.; Zuo, F.; Liu, S.; Lin, C. A smart Li-ion battery with self-sensing capabilities for enhanced life and safety. J. Power Sources 2022, 546, 231705. [Google Scholar] [CrossRef]
  31. Hu, Z.; Prado, R. Fast bayesian inference on spectral analysis of multivariate stationary time series. Comput. Stat. Data Anal. 2023, 178, 107596. [Google Scholar] [CrossRef]
  32. Bracewell, R.N. The Fourier Transform and Its Applications, 3rd ed.; McGraw-hill Inc.: New York, NY, USA, 2000; pp. 5–18. ISBN 0-07-303938-1. [Google Scholar]
  33. Daubechies, I. The wavelet transform, time-frequency localization and signal analysis. IEEE Trans. Inf. Theory 1990, 36, 961–1005. [Google Scholar] [CrossRef]
  34. Cochran, W.T.; Cooley, J.W.; Favin, D.L.; Helms, H.D.; Kaenel, R.A.; Lang, W.W.; Maling, G.C.; Nelson, D.E.; Rader, C.M.; Welch, P.D. What is the fast Fourier transform? Proc. IEEE 1967, 55, 1664–1674. [Google Scholar] [CrossRef]
  35. Mahafza, B.R. Radar Systems Analysis and Processing Using Matlab, 3rd ed.; CRC Press/Taylor & Francis Group: Huntsville, AL, USA, 2013; pp. 93–101. ISBN 978-1-4398-8496-6. [Google Scholar]
  36. Farge, M. Wavelet transforms and their applications to turbulence. Annu. Rev. Fluid Mech. 1992, 24, 395–458. [Google Scholar] [CrossRef]
  37. Fouladi, R.F.; Ermiş, O.; Anarim, E. A novel approach for distributed denial of service defense using continuous wavelet transform and convolutional neural network for software-Defined network. Comput. Secur. 2022, 112, 102524. [Google Scholar] [CrossRef]
  38. Torrence, C.; Compo, G.P. A practical guide to wavelet analysis. Bull. Am. Meteorol. Soc. 1998, 79, 61–78. [Google Scholar] [CrossRef]
  39. Yang, W.R. Discrete wavelet transform and radial basis neural network for semiconductor wet-etching fabrication flow-rate analysis. IEEE Trans. Instrum. Meas. 2012, 61, 865–875. [Google Scholar] [CrossRef]
  40. Jain, S.K.; Singh, S.N. Low-order dominant harmonic estimation using adaptive wavelet neural network. IEEE Trans. Ind. Electron. 2014, 61, 428–435. [Google Scholar] [CrossRef]
  41. Slavič, J.; Simonovski, I.; Boltežar, M. Damping identification using a continuous wavelet transform: Application to real data. J. Sound Vib. 2003, 262, 291–307. [Google Scholar] [CrossRef]
  42. Costa, F.B. Fault-induced transient detection based on real-time analysis of the wavelet coefficient energy. IEEE Trans. Power Deliv. 2014, 29, 140–153. [Google Scholar] [CrossRef]
  43. Ghaffari, A.; Golbayani, H.; Ghasemi, M. A new mathematical based qrs detector using continuous wavelet transform. Comput. Electr. Eng. 2008, 34, 81–91. [Google Scholar] [CrossRef]
  44. Rucka, M.; Wilde, K. Application of continuous wavelet transform in vibration based damage detection method for beams and plates. J. Sound Vib. 2006, 297, 536–550. [Google Scholar] [CrossRef]
  45. Park, C.K.; Zhang, Z.; Xu, Z.; Kakirde, A.; Kang, K.; Chai, C.; Au, G.; Cristo, L. Variables study for the fast charging lithium ion batteries. J. Power Sources 2017, 165, 892–896. [Google Scholar] [CrossRef]
  46. Quiroga, E.; Carstensen, J.; Föll, H. Good cycling performance of high-density arrays of si microwires as anodes for li ion batteries. Electrochim. Acta 2013, 101, 93–98. [Google Scholar] [CrossRef]
  47. Center for Advanced Life Cycle Engineering, Data and Test Description CX2. Available online: https://web.calce.umd.edu/batteries/data.htm (accessed on 2 November 2021).
  48. Xing, Y.; Ma, E.W.; Tsui, K.L.; Pecht, M. An ensemble model for predicting the remaining useful performance of lithium-ion batteries. Microelectron. Reliab. 2013, 53, 811–820. [Google Scholar] [CrossRef]
  49. NASA Ames Prognostics Data Repository, Battery Dataset. Available online: http://ti.arc.nasa.gov/project/prognostic-data-repository (accessed on 3 November 2021).
  50. Heenan, T.M.; Jnawali, A.; Kok, M.; Tranter, T.G.; Tan, C.; Dimitrijevic, A.; Jervis, R.; Brett, D.J.; Shearing, P.R. Data for an advanced microstructural and electrochemical datasheet on 18650 Li-ion batteries with nickel-rich NMC811 cathodes and graphite-silicon anodes. Data Brief 2020, 32, 106033. [Google Scholar] [CrossRef] [PubMed]
  51. Heenan, T.M.; Jnawali, A.; Kok, M.; Tranter, T.G.; Tan, C.; Dimitrijevic, A.; Jervis, R.; Brett, D.J.; Shearing, P.R. Lithium-Ion Battery INR18650 MJ1 Data: 400 Electrochemical Cycles (EIL-015); University College London UCL: London, UK, 2020. [Google Scholar] [CrossRef]
  52. Lathi, B.P.; Green, R.A. Essentials of Digital Signal Processing, 1st ed.; Cambridge University Press: New York, NY, USA, 2014; pp. 155–200. ISBN 978-110-705-932-0. [Google Scholar]
  53. Grinsted, A.; Moore, J.C.; Jevrejera, S. Application of the cross wavelet transform and wavelet coherence to geophysical time series. Nonlinear Process. Geophys. 2004, 11, 561–566. [Google Scholar] [CrossRef]
  54. Soon, W.; Dutta, K.; Legates, D.R.; Velasco, V.; Zhang, W. Variation in surface air temperature of China during the 20th century. J. Atmos. Sol.-Terr. Phys. 2011, 73, 2331–2344. [Google Scholar] [CrossRef]
  55. Mendoza, E.; Velasco, M.; Velasco, G.; Martell, R.; Silva, R.; Escudero, M.; Ocampo, F.J.; Mariño-Tapiaf, I. Spectral analysis of sea surface elevations produced by big storms: The case of hurricane wilma. Reg. Stud. Mar. Sci. 2022, 39, 101390. [Google Scholar] [CrossRef]
  56. López, F.; Velasco, V.M.; Álvarez, R.; Gómez, S.; Gazzola, J. Analysis of ground penetrating radar data from the tunnel beneath the temple of the feathered serpent in teotihuacan, Mexico, using new multi-cross algorithms. Adv. Space Res. 2016, 58, 2164–2179. [Google Scholar] [CrossRef] [Green Version]
  57. Cheng, V.Y.; Saber, A.; Arnillas, C.A.; Javed, A.; Richards, A.; Arhonditsis, G.B. Effects of hydrological forcing on short- and long-term water level fluctuations in lake huron-michigan: A continuous wavelet analysis. J. Hydrol. 2021, 603, 127164. [Google Scholar] [CrossRef]
  58. Velasco, V.M.; Perez-Peraza, J.; Soon, W.; Marquez-Adame, J.C. The quasi-biennial oscillation of 1.7 years in ground level enhancement events. New Astron. 2018, 60, 7–13. [Google Scholar] [CrossRef]
  59. Velasco, V.M.; Mendoza, B.; Velasco, G. Reconstruction and prediction of the total solar irradiance: From the medieval warm period to the 21st century. New Astron. 2015, 34, 221–233. [Google Scholar] [CrossRef]
Figure 1. Annual emissions (2000–2018) (tons per year) of the MCMA.
Energies 16 01073 g001
Figure 2. Time series of the emissions of (a) CO, (b) NO x , (c) PM 2.5 , (d) PM 10 , and (e) SO 2 from 2000 to 2018, obtained from the official MCMA emissions inventory.
Energies 16 01073 g002
Figure 3. (a) Voltage, (b) wavelet spectral power (b), and (c) Fourier spectrum of the cycling test performed to HC3 cell by IF-BUAP. The frequencies in green indicate the frequencies preceding the failure, while those in purple indicate the frequencies late to the failure.
Energies 16 01073 g003
Figure 4. (a) Voltage, (b) wavelet spectral power, and (c) Fourier spectrum of the cycling test performed by CALCE to the prismatic cell tested a 25 ° C (PC-25C). The frequencies in green indicate the frequencies preceding the failure, while those in orange indicate the frequencies late to the failure.
Energies 16 01073 g004
Figure 5. (a) Voltage, (b) wavelet spectral power, and (c) Fourier spectrum of the cycling test performed by NASA-PCE to commercial lithium-ion cells (C-LIC3). It was not possible to differentiate the frequencies before and after the failure.
Energies 16 01073 g005
Figure 6. (a) Voltage and cell temperature, (b) wavelet spectral power, and (c) Fourier spectrum of the cycling test performed by UCL to one commercial cylindrical battery from the 110 to 202 cycles (CC3500-2).
Energies 16 01073 g006
Figure 7. Real vs. calculated voltage by applying the inverse Fourier transform to the high periods found by wavelet to (a) HC3 half-cell IF-BUAP, (b) PC-25C cell–CALCE, (c) C-LIC3 cell–NASA-PCE and (d) CC3500 – 2 cell–UCL.
Energies 16 01073 g007
Figure 8. Calculated power index, ( Z P o w e r ) function and normalized voltage for (a) HC3, (b) PC-25C, (c) C-LIC3 and (d) CC3500-2 cells.
Energies 16 01073 g008
Table 1. Lithium-ion cell evaluated by the fourth research groups.
Research GroupCell TypeCathodeAnodeCapacity (mAh)
IF-BUAPHalf SwagelokSiLi4200/g
CALCEPrismaticLiCoO 2 Graphite1350
NASA-PCE18,650LiCoO 2 Li-C2000
UCL18,650LiNiCoAlO 2 (NCA)Graphite- Si3500
Table 2. Charge-discharge protocol applied to cycle lithium-ion batteries by IF-BUAP, CALCE, NASA-PCE and UCL.
CellChargeDischargeCyclesT ( ° C)
CC (mA)Cut-Off
Voltage (V)
Cut-Off
Current (mA)
CC (mA)Cut-Off
Voltage (V)
IF-BUAP
HC10.860.70.180.860.1110425
HC20.860.70.180.860.117225
HC30.860.70.180.860.1110925
HC41.330.70.131.330.112825
CALCE
PC-25C6754.25013502.725625
PC-35C6754.25013502.731535
PC-45C6754.25013502.730445
PC-55C6754.25013502.730355
NASA-PCE
C-LIC115004.22020002.516224
C-LIC215004.22040002.04124
C-LIC315004.22040002.024424
C-LIC415004.220(2000, 4000,2.21344
1000)
UCL
CC3500-115004.210040002.51–8424
CC3500-215004.210040002.5110–20224
CC3500-315004.210040002.5203–28524
CC3500-415004.210040002.5286–40024
Disclaimer/Publisher’s Note: The statements, opinions and data contained in all publications are solely those of the individual author(s) and contributor(s) and not of MDPI and/or the editor(s). MDPI and/or the editor(s) disclaim responsibility for any injury to people or property resulting from any ideas, methods, instructions or products referred to in the content.

