Article

Smart Decentralized Electric Vehicle Aggregators for Optimal Dispatch Technologies

by
Ali M. Eltamaly
1,2
1
Sustainable Energy Technologies Center, King Saud University, Riyadh 11421, Saudi Arabia
2
Saudi Electricity Company Research Chair in Power System Reliability and Security, Electric Engineering Department, College of Engineering, King Saud University, Riyadh 11421, Saudi Arabia
Energies 2023, 16(24), 8112; https://doi.org/10.3390/en16248112
Submission received: 22 November 2023 / Revised: 7 December 2023 / Accepted: 13 December 2023 / Published: 17 December 2023
(This article belongs to the Section E: Electric Vehicles)

Abstract

:
The number of electric vehicles (EVs) is growing exponentially, which presents the power grid with new challenges to turn their reliance to renewable energy sources (RESs). Coordination between the available generations from RESs and the charging time should be managed to optimally utilize the available generation from RESs. The dispatch scheduling of EVs can significantly reduce the impact of these challenges on power systems. Three different technologies can be used to manage the dispatch of EV batteries which are unregulated charging (UC), unidirectional grid-to-vehicle (G2V), and bidirectional vehicle-to-grid (V2G) technologies. This study aims to address the primary reason for EV owners’ disbelief in the accuracy of battery wear models, which is impeding their involvement in V2G technology. This paper introduces a novel accurate EV battery wear model considering the instantaneous change in the operation of the EV battery. Moreover, an effective musical chairs algorithm (MCA) is used to reduce everyday expenses and increase revenue for V2G technologies in a short convergence time with accurate determination of optimal power dispatch scheduling. The results obtained from these three strategies are compared and discussed. The salient result from this comparison is that V2G technology increases wear and reduces the battery lifespan in comparison with the UC and G2V. The yearly expenses of G2V are reduced by 33% compared to the one associated with the UC. Moreover, the use of V2G technology provides each EV owner with USD 3244.4 net yearly profit after covering the charging and wear costs. The superior results extracted from the proposed model showed the supremacy of V2G usage, which is advantageous for both EV owners and the power grid.

1. Introduction

For decades, global energy consumption has been continuously growing, and future years are predicted to see this tendency continue. This is because of several variables, including the fact that the global population is anticipated to reach 9.7 billion by 2050, meaning there will be 9.7 billion people on the planet, up from the current 7.8 billion [1]. Moreover, with rising living standards and emerging nations’ populations becoming more rich, countries want more energy-intensive goods and services. As a result, these countries’ energy consumption is skyrocketing. According to projections by the International Energy Agency (IEA), there will be a 15% rise in worldwide energy consumption between 2021 and 2050 [2].
This increase in energy use is an urgent concern for several reasons. First of all, it may lead to price rises and energy shortages. Second, it could put more strain on ecology because the majority of our energy needs are met by fossil fuels. Fossil fuel consumption has a major impact on the emissions of greenhouse gases (GHGs), which are responsible for several environmental challenges. The clean energy economy should be seriously considered in order to sustainably fulfill the rising energy demand. It also entails increasing energy efficiency and making investments in renewable energy sources (RESs). Several RESs, such as wind energy and solar energy systems, can be used to improve the environmental impact of electricity generation and reduce GHG emissions. The intermittency of these sources needs further consideration, especially with electric vehicles (EVs) where the unregulated charging of EVs can hinder the expansion of these sources; meanwhile, the use of smart charging/discharging management coordination can allow the expansion of RESs due to the coordination between them, as will be discussed in this paper.
The transportation sector consumes about 25% to 35% of the total world demand for energy, which highly contributes to the increase in environmental pollution and increases in GHG emissions and global warming phenomena [3]. To fulfill the Paris Climate Agreement, a substantial part of the transportation sector should avoid the use of fossil fuels [3]. Shifting this considerable consumption from using fossil fuels to RESs will substantially remedy the impacts of the transportation sector on the world environment and economy if it is well managed. The current exponential increase in EVs will switch 60% of the total contribution of personal cars to become greener by 2050, which will substantially enhance the environment and lessen dependency on fossil fuels [4]. The market sales of EVs are increasing exponentially. In 2022, the sales of EVs were 10 million units, representing 14% of personal cars worldwide; meanwhile, they were just 4% in 2020 and are expected to become 65% of sales by 2030 [5].
To obtain the highest benefits from the use of EVs, a considerable part of electricity generation should come from RESs. If EV charging is not well coordinated, these resources’ unpredictable generating levels and volatile nature might pose additional challenges to the power grid. For this reason, the regulation or scheduling of the charging of the EVs in relation to the time of the high generation of the RESs will improve the power system performance and lessen the EVs’ detrimental effects on the power grid. Grid-to-vehicle (G2V) charging technology is the coordination of charging during periods of high generation from RESs. By employing EV batteries as an auxiliary service to feed the power system during abnormal operating situations, vehicle-to-grid (V2G) technology, which is the most intelligent approach, may turn the negative effects of EVs on the power system into positive ones. The use of EV batteries as an ancillary service will contribute to peak shaving, peak shifting, reactive power support, frequency regulation, energy arbitrage, valley filling, and active power regulation, among others [6]. Most stochastic studies predict that the cars used for about 5% and 95% are parked in parking lots [7,8]. During this period, the EV aggregator (EVA) can manage the charging/discharging schedules to improve the benefits for the owners of the EVs by participating in V2G or G2V technologies. The primary obstacle facing this technology is the mistrust that EV owners have in relation to utilizing their batteries in V2G technology with guaranteed profit, which is the main motivation of this study [9]. This warranted fear from EV owners should be avoided by using an accurate wear and economic model of EV batteries, as introduced in this study.

1.1. Background

There are many options to switch the reliance on fossil fuels by replacing the internal combustion engines (ICEs) with EVs. With the use of EVs instead of ICE cars, two birds can be killed with the same stone; compared to ICE cars, EVs have zero tailpipe emissions, which contributes to better air quality and lower GHG emissions. EV owners may also save a significant amount of money on gasoline, reducing maintenance costs, and EVs have better performance in terms of acceleration and torque, as well as quiet operation. As a result of all of these factors, the transition to EVs is accelerating rapidly. In 2022, global EV sales increased by 108% compared to the previous year. As more individuals transition to EVs, this trend is anticipated to continue in upcoming years. Despite several benefits of EVs, some drawbacks can be created in the power system if they are not handled well, such as an increased load demand especially at peak charging hours in the evening time, changes in load profile by introducing new peaks and valleys in demand and voltage, and frequency regulation challenges. Because EVs can cause sudden changes in demand, they can also inject harmonic currents into the grid, and this impacts on distribution grids which need size upgrades of different components to accommodate the excessive use of EVs, especially at peak periods. Moreover, it is expected that EV charging will have a substantial influence on distribution devices [10,11]. Depending on the conditions around the high-charging EV adoption, battery chargers may eventually overload local distribution infrastructure [12,13]. This will necessitate more spending on greater overhead power lines and transformer-rated power [14]. The pricing may have a significant impact on the reliability, security, efficiency, and profitability of recently constructed smart grids because of the possibility of transformer life deterioration [6,15]. The high degradation that occurs in the distribution network devices can be substantially reduced with smart coordination between the EVA and the power network using G2V or V2G technologies [16,17]. Power systems should confront these actions by using smart charging strategies such as bidirectional V2G or at least unidirectional G2V to avoid investing in new generation and transmission capacity to avoid the drawbacks of EVs on electric utility. In order to optimize EVA performance, smart charging involves adjusting the timing and magnitude of the charging current. This is often achieved by lowering the network’s peak demand [4,18]. Several measures should be used to encourage EV owners to take part in V2G and G2V initiatives, such as the creation of smart grid technology, giving the system operator real-time grid monitoring and control, introducing time-of-use (TOU) pricing, encouraging off-peak EV charging by offering lower electricity rates, and offering rewards to EV owners to encourage their involvement in V2G initiatives and get them to invest in energy storage. Some authorities force EV manufacturers to install smart EVAs in their production of new EVs; for example, the UK decided to include EVAs in new cars by 2019 [19].
Based on the J1772 standard which was issued by the Society of Automotive Engineers (SAE), three main levels of EV charging have been issued [20]. The least quick charging option is level 1. Level 2 charging is faster than level 1 charging, which uses a 240-volt AC outlet and takes 4–8 h to fully charge an EV battery. Level 3 charging is the fastest type of charging, taking 20–30 min to fully charge an EV battery. It uses a standard 120–volt AC outlet in which the charging process can take 12–24 h. The EV batteries’ degradation is inversely correlated with the amount of charging time and directly correlated with the current level, which means that level 3 causes higher EV battery wear than level 2 and level 1 [21].
Unidirectional G2V technology is the most common type of EVA in which the flow of electric power is from the electric utility to the EV’s battery. This technology needs dynamic tariffs to help EV owners choose available hours with the lowest tariff to charge their EVs. This technology can participate in reducing the charging cost for EV owners, derate the peak power of the grid and elevate the valley period which flattens the load curve, and can add support to the power system compared to unregulated charging (dumb charging).
Bidirectional charging is a newer type of EV charging that allows the EV to return energy to the grid as required. V2G charging has all the benefits included in G2V and it reduces the charging cost or may add revenue to EV owners, improves grid support for features like voltage regulation and frequency regulation, and increases resilience to disruptions of the grid. Despite being in its infancy, the bidirectional EVA has the potential to completely transform how energy is produced, distributed, and used [6].

1.2. Literature Survey

The EVA is one of the most important devices that should be carefully analyzed because it can further increase society’s interest in using EVs or it can hinder advancement in this technology. The power system and EV owners can both profit from the way the EVA manages the dispatch of electricity. Three types of EVAs have been used with EVs: The first type is the unregulated charging (UC) EVA, sometimes called the dumb charger, in which the EV is charged once it is plugged in without any management between the condition of the EV battery or with the grid. The second one is the unidirectional G2V EVA, which can manage the charging time at the lowest possible tariff. This technology has good approbation from EV owners and power system operators because it can reduce the EV charging bill and it can avoid charging at high peaks which can impact the grid reliability and may cause other problems such as transformers and cables overloading [22] or unacceptable voltage reduction [23]. The last technology is V2G technology in which the EVA selects the charging time according to the lowest possible tariff and the discharging period based on the highest possible tariff without affecting EV owners’ comfort. V2G can be used as an energy arbitrage or as a frequency regulator for the grid where the grid can use the EV battery-stored energy as an energy support and EV owners can obtain benefits from selling the EV battery energy at a higher tariff [24]. This technology is still emerging and still needs more effort and challenges faced in order to be implemented in real life. Ref. [25] covers how charging technologies affect the load power curve.
Some studies support unidirectional G2V technology because it is not complex to convince EV owners to participate due to the clear benefits to them without going into detail about the wear cost due to discharging and the comparison between the battery wear expenses and the profit from selling the stored energy in the EV battery. The benefits of the EVA to EV owners are discussed in [24], and for the charging fleet owner they are discussed in [26]; meanwhile, the benefits of the power system are discussed in [27].
The difference between the low and high tariffs plays a crucial part in promoting V2G applications, where the difference should cover the energy losses and the EV battery wear cost due to round trips in charging and discharging. Some studies have proposed a limitation in the tariff difference in order for it to be viable for EV owners to participate in this V2G technology in UK, German, and Swedish markets [28,29,30].
Despite the majority of studies supporting V2G technology, there are a few studies that recommend not using it from economical and technical perspectives [31,32]. Some other studies have recommended not using V2G technology because it can fasten the wear of EVs which will not be compensated for by the difference between high and low tariffs [6,33]. This paper is introduced to judge this debate and provide an accurate model for EV battery wear performance under different operating conditions.
Some studies recommend a charging scheduling for minimizing battery wear when using the smart EVA [34]. Several studies have introduced EV battery wear models considering several approximations, such as the use of yearly average wear cost [33] or average daily cost model [34], and most of these strategies need further analysis to extract an accurate wear model to provide EV owners with the confidence to take part in initiatives for smart charging.
As has been discussed before, the main support for V2G application is to provide EV owners with an accurate degradation cost model to be sure that they will make sufficient profit out of this participation. Several studies have provided a degradation cost analysis for EV batteries [35,36,37,38,39]. One of these studies introduced degradation coefficients for the capacity and power degradation as a reference to the Ah, determined the cost for these two coefficients, and selected the highest one to represent the actual cost of degradation [34]. This study did not consider the effect of variation in the state of charge (SoC) and temperature in determining the degradation cost, making it inaccurate. Another study [38] introduced an aging model for two different EV chemistries in which they used real testing data for calendar and cycling tests for different temperatures, SoC, depth of discharge (DoD), and current rate (Crate) [38]. This study used data from these tests to model the wear that occurred in the EV batteries and drive a model to determine the benefits of the grid for connecting 100 EVs with different chemistries. The study’s findings demonstrated that the ultimate choice about participation in V2G regulatory services can only be somewhat influenced by ambient temperature, with limited effects on the calendar aging contribution [38].
The impacts of SoC restrictions on V2G economics and dependability have been modeled in different research studies, which have also put forth a unique control model for the EV battery SoC. By carefully controlling the energy flows and charging process, the additional degradation rate may be reduced.
Another study proposed a novel battery SoC control model and simulated the effects of SoC limitations on V2G economics and reliability [40]. Minimizing the extra deterioration rate can be achieved by intelligent control and optimization of energy flows and charging times [41]. Research on batteries to extend battery life is ongoing [42]. The investment cost per amount of stored energy will decrease as battery technology advances and the number of cycles increases [6].
In another piece of research, three case studies were used to examine the potential for EV batteries to have their lifecycles extended in a secondary, stationary use. Installing old battery packs in building microgrids will maximize the utilization of batteries. According to the findings, employed in stationary applications, used EV batteries have considerable financial worth [43]
Regarding the optimal scheduling of the charging/discharging schedule, many studies introduced a stochastic strategy based on different aspects, like cloud modeling to construct a charging schedule [44], a technique for deep learning that uses a modular recurrent neural network, and combining several EV driving scenarios to forecast the amount of electricity needed by EVs [45]. A thorough investigation is presented in [46] to forecast an EV’s charging schedule under various operating circumstances. This study also discussed the impact of charging technologies on electric utility [46]. Another study used agent-based modeling to estimate the dispatch schedule of the EV considering the different behaviors of the EV drivers and the social effect on the daily driving trip to estimate the daily charging power [47]. In a different research study, the best charging approach was determined using a two-stage approximation dynamic programming framework that combined long-term projections from historical data with short-term information that was projected into the future [48].
Another interesting study was introduced to remedy the anxiety of EV owners in participating in V2G and G2V using predicted operating environmental conditions to set the SoC to be adequate for a driving trip [49].
The EVA uses tariff performance to schedule charging/discharging power in G2V or V2G technologies. Many studies rely on real-time use to determine optimal charging values and some other strategies use day-ahead tariff programs to schedule the optimum daily charging/discharging power for the minimum charging cost in G2V [39] and maximum profit in V2G technology [9,50,51,52,53,54].

1.3. Motivation

Increased EVs introduce many challenges to the power system such as an increase in peak power, high voltage deviation, overloading to power system devices such as generators, transformers, and power lines, contingency, and reduction in reliability. Because of this, choosing the charging time as efficiently as possible is crucial for preventing overcharging during busy times. Moreover, it is better to turn these challenges into benefits by using EV batteries’ stored energy to guarantee the normal operation of an energy supply during a shortage in the generation or any abnormal operating condition using V2G. V2G can provide EV owners with a lot of benefits by charging their EV batteries at low tariffs and selling this energy back to the grid at a high tariff time. The distrust of EV owners in the EV battery degradation model and the economic model of V2G hinders the progress of this technology. The essential motive of this study was to add an accurate EV battery wear model and an accurate economic model of V2G technology to advise EV owners to take part or not in V2G technology. Moreover, optimal scheduling for charging/discharging periods is introduced to give EV owners confidence about the EVA that works in a smart way to increase their profit, reduce the EV battery wear cost, and prolong the lifetime of the EV batteries. These motivations stimulated the author of this paper to accurately model an EV battery wear cost model of V2G technology.

1.4. Innovation and Contribution

This research is introduced to optimally schedule the dispatch power of EVs according to the operating conditions in unidirectional G2V and bidirectional V2G technologies. The goal of the ideal scheduling is to maximize V2G technology’s profit while minimizing G2V technology’s charging costs. Each hourly amount of power represents an optimization variable which is counted as a high number of variables that need an effective optimization algorithm to handle this complex optimization problem. Because of this, the best time and dispatch power values were determined using a new and efficient optimization technique called the musical chairs algorithm (MCA), which maximizes profits for EV owners. The outcomes obtained from G2V or V2G were accurately compared to the unregulated or dumb charging strategy to assess the importance of these technologies. One of the main challenges facing an increase in the progress of the adoption of V2G is to introduce an accurate EV battery wear cost model and an accurate economical model to convince EV owners to take part in V2G technology, which has been introduced in detail in this study. A detailed and accurate comparison between the operation and economical model is presented in this study to show the superiority of V2G compared to unidirectional G2V and dumb charging technologies. The innovation and contribution introduced in this study are summarized as follows:
  • A novel and accurate battery wear model is introduced to provide confidence to EV owners to take part in V2G and G2V technologies.
  • An accurate economic model is introduced to determine the cost, income, and profits for EV owners.
  • A modified MCA is introduced to optimally schedule the charging/discharging power to achieve fast and accurate performance.
  • A detailed comparison between different dispatch strategies such as UV, G2V, and V2G technologies is introduced to help EV owners choose the best programs according to their needs.

1.5. Paper Outline

The rest of this paper introduces a detailed description of a novel EV battery wear model using different dispatch strategies, outlined in Section 2. The technical and economic strategies used to model the proposed methodology for different dispatch strategies are introduced in Section 3. A modified MCA used to optimally dispatch the power between the EVA and the EV battery is introduced in Section 4. In Section 5, the simulation work is displayed for various dispatch techniques and operational circumstances. In Section 6, the study’s results and suggestions are presented.

2. Novel EV Battery Wear Model

An incremental aging model of EV batteries is the main contribution offered in this study. Several studies have tried to evaluate this value using a wear model with unknown parameters which can be determined by minimizing the root mean square error between the calculated and measured wear [55]. This strategy is very accurate but, unfortunately, it is not easy to implement because EV battery manufacturers do not provide these details and it should be modeled in a lab which can take several months or years and great efforts. Most EV manufacturers provide a relation between the achievable cycle count (ACC) and the DoD, as shown in Figure 1 [35,56]. These data do not help in determining the hourly wear of the EV but they can be used in different modeling analyses to estimate its value, as has been introduced in [35,57,58,59]. These strategies used certain approximations for the SoC and DoD and overlooked the exact situation of the working conditions. In this section, an accurate aging model is introduced to evaluate the exact instant wear of an EV battery based on ACC-DoD characteristics.
The relationship between the ACC-DoD characteristics can be modeled from the characteristic curve shown in Figure 1, as shown in Equation (1). Note that the ACC counts the number of cycles the battery can run through before losing 80% of its rated capacity [36,60].
A C C = a D b
where D is the DoD which can be obtained from Equation (2) and a and b are the parameters that can be determined from the ACC-DoD characteristics.
D = 1 E B E B R = 1 S o C
where  E B  and  E B R  are the current and rated energy of the EV battery.
The state of health (SoH) can be determined from Equation (3)
S o H = E B max E B R
where  E B max  is the maximum capacity of the battery at any time during the operation. So, the total energy throughput ET through the whole life of the battery can be determined from the following equation by considering that the loss in the capacity decreases linearly with the proportion between the total number of cycles and the remaining cycles (ACC):
E T = 2 · η B 2 · A C C · D · E B R · ( 1 + θ 2 )
where ηB is the EV battery efficiency and θ is the ratio of the capacity that should replace the EV battery when it reaches it (80% in most studies [36,60]).
The following formula may be used to calculate the wear due to unit energy, which is represented by the wear density function (WDF):
W D F = 1 E T = 1 η B 2 · A C C · D · E B R · ( 1 + θ )
By substituting Equation (1) into Equation (5), the WDF can be determined from Equations (6) and (7):
W D F = 1 η B 2 · a · E B R · ( 1 + θ ) · D b 1 = 1 η B 2 · a · E B R · ( 1 + θ ) · ( 1 S ) b 1
W D F = K W · D b 1 = K W · ( 1 S ) b 1
where  K W = 1 η B 2 · a · E B R · ( 1 + θ ) .
If each ramp contains a constant charging/discharging power through the Δt period, then the total wear through this ramp can be determined from the following equation [35]:
W = t 1 t 1 + Δ t E B R · W D F ( S ) d S ( t ) d t d t
where WDF(S) can be obtained from Equation (8) and the time change in the SoC ( d S ( t ) d t ) may be calculated using the equation that follows:
d S ( t ) d t = P B E B R
Then, the wear of the EV battery with constant power from t1 to t1 + Δt can be determined from the following equation:
W ( P , S ) = K W · P B 2 b · E B R [ ( 1 S int + P B · Δ t E B R ) b ( 1 S int ) b ]
For this study, a conversion of 0.18 [61] kWh/mile was chosen, which is similar to the measured fuel economy of a Nissan Leaf, in order to translate the distance traveled into an energy expenditure to anticipate the energy consumption of the EV [4,62].
An interesting study was introduced to determine the revenue gained by EV owners when using V2G technology by adding the cost of charging the EVs and the battery’s typical wear [38]. The main shortcoming of this strategy is that the wear cost is evaluated yearly by simply dividing the battery’s total cost by its estimated number of years of life without considering all stress factors such as DoD, SoC, Crate, temperature, etc. There is one important issue in this study which is whether the use of the same lifetime of the battery is the same in the case of the use of V2G or not, which is not correct, as will be shown in detail in this proposed study. These inaccurate economic studies hindered the progress of the use of V2G due to distrust of EV owners in this inaccurate model, which is the main scope of this proposed study.

3. Charging Technologies

More than 80% of passengers’ daily journeys are thought to be between 60 and 70 km, according to a European survey [63], while EVs are plugged into an electric utility for about 90% of day hours [37,64]. Peak power demand was observed to rise by around 60% when high power charging or unregulated charging was used [65]. By giving charging and discharging users access to nonlinear power pricing in real time, grid operators may increase their return on investment [66]. Moreover, this study discussed the benefits to the community of reducing emission costs due to the use of unregulated charging.
A log-normal distribution function, as illustrated in Equation (11) [67], may be used to calculate an EV’s daily driving distance. The curve in Figure 2 displays the daily distance distribution function.
f d e s ( L E V ) = 1 L E V σ E V 2 π e [ ( ln μ E V ) 2 2 σ E V 2 ]
where LEV is the daily trip distance, σEV is the average daily distance of EV, and μEV is the variance in the daily distance of EV.
It was assumed in this study that the fuel consumption was constant during the whole trip. The total consumed energy during the trip was calculated by multiplying the trip distance by the specific power consumption (βEV), as shown in Equation (12).
E E V n = L E V n · β E V
It was assumed in this study that the EV was derived with constant speed uav; then, the trip time could be determined by dividing the trip distance by the average wind speed. The arrival time  T r n  during day n could be determined by adding the trip time to the departure time  T d n , as shown in Equation (13).
T r n = T d n + L E V n / u a v
As was assumed above, the fuel consumption rate was constant during the whole trip, and then the power consumed during the trip  P E V t  equaled the total energy during the trip divided by the trip period, as shown in Equation (14).
P E V t = E E V D n / ( T d n T r n ) ( T d n t T r n )
It is helpful to add a flag x for different operating conditions of the EV battery. It has been suggested in this study that the flag for the driving period is xt = 0; meanwhile, xt = 1 during the plug-in periods, as shown in Equation (15) and Figure 3.
X n = [ x 1 n , x 2 n , x 3 n , , x 24 n ]
where  x t = { 0 T d t t T r t 1 O t h e r w i s e .
The hourly SoH can be determined by subtracting the hourly wear value which can be determined from Equation (10) from the current SoH, as shown in Equation (16).
S o H t + 1 = S o H t W t
The general constraints for different technologies are shown in the following conditions:
S o C min S o C t S o C max
0.8 S o H t 1.0
The Net Present Value (NPV) is used to assess the present value of money used in the investment of the EV battery [3]. The NPV equals the Present Value of Throughput (PVT) minus the net present cost of the battery which includes any maintenance and discount rate. Ref. [68] describes the PVT, as shown in Equation (19) [3].
P V T = i = 1 n ( 1 + m ) i 0.5 ( 1 + r ) i 0.5 · Y E i
where i = year order, n = battery lifespan in years, YEi = annual battery energy throughput in kWh, r is the discount rate, and m is the yearly percentage reduction in the capacity of the battery. The value of m is used as 2.5% in some studies [3,68], which is very far from the real battery degradation that occurs, which mainly varies with the real usage of the battery.

3.1. Unregulated Charging

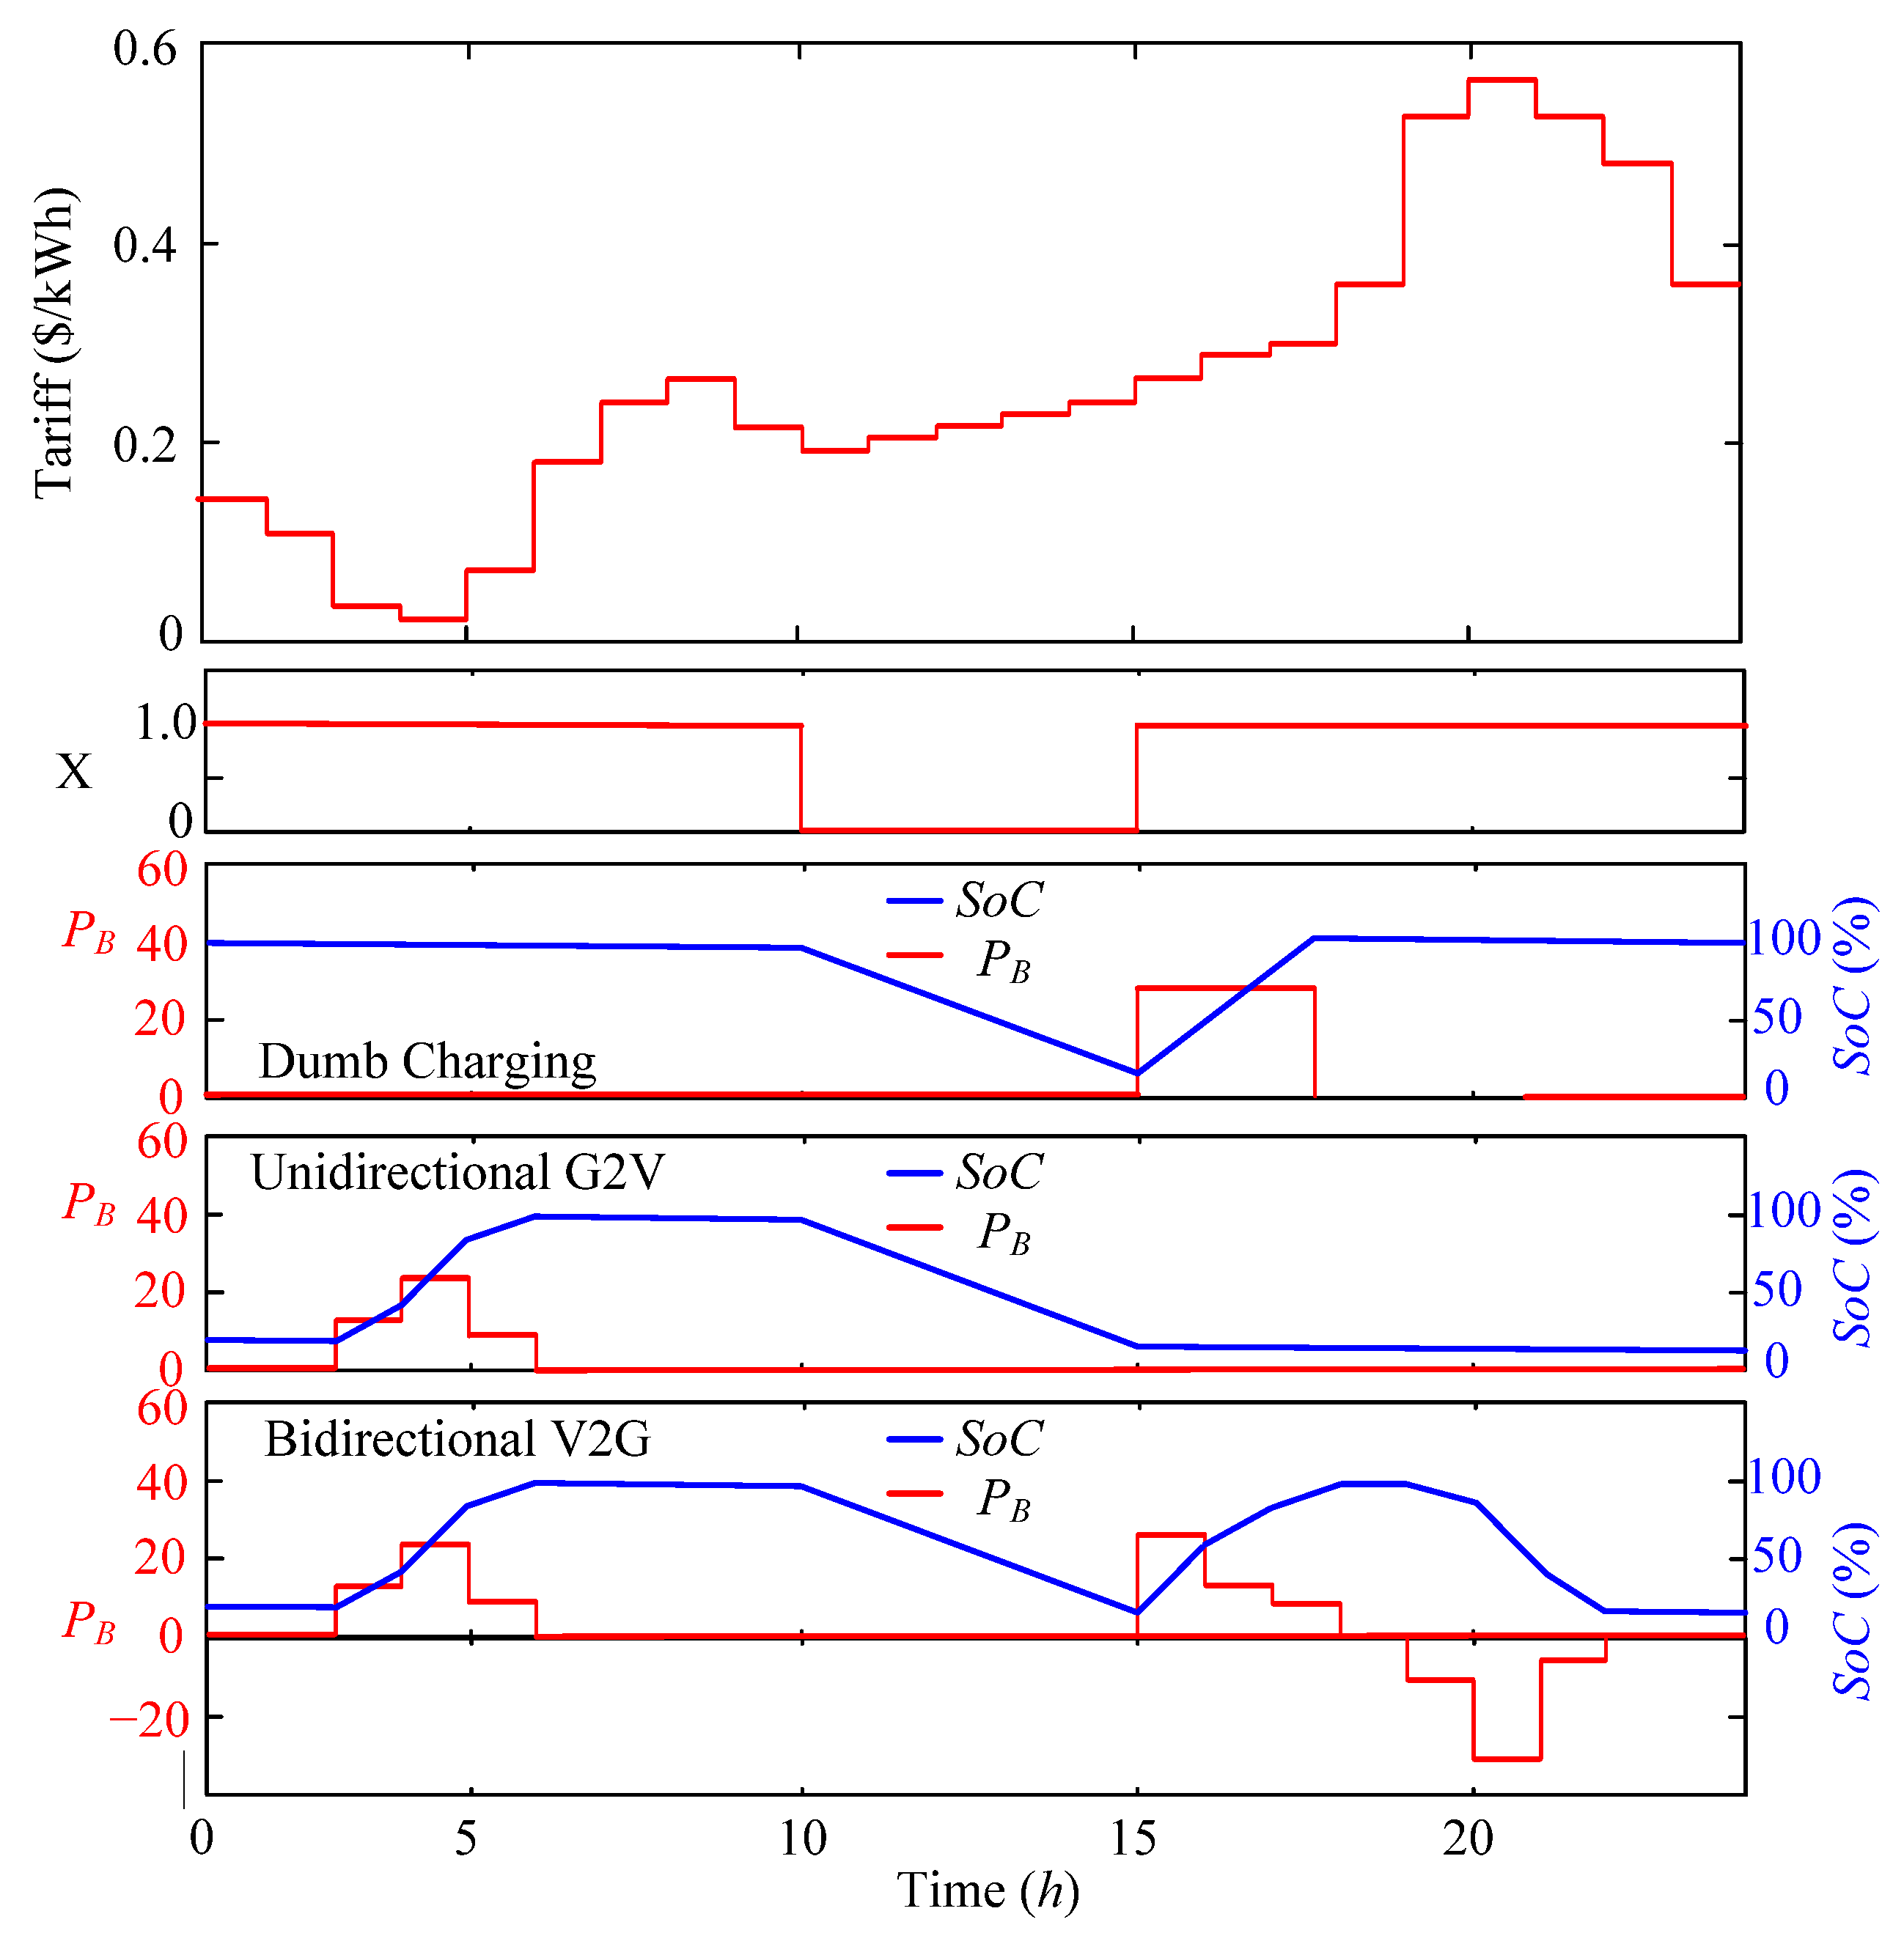
Unregulated charging (UC), sometimes called dumb charging, is defined as the strategy used to charge the EV battery once it is plugged into the electric utility. This strategy is used for comparison with V2G and G2V charging technologies. The UC charges the battery using EVA. This state-of-the-art technology does not consider the stress parameters that can affect battery wear, like SoC, DoD, the electricity tariff, and temperature. The EVA used with EV chargers used in this technology charges the battery using constant current (CC) when the terminal voltage is less than the cut-off voltage and, after that, the battery will charge with constant voltage (CV) until the battery reaches the cut-off current. The main charging period is from the CC, especially if the maximum SoC setting is less than 100%. For this reason, the calculation of the degradation is built based on the CC charging strategy. UC charging is shown in Figure 4 compared to the charging/discharging for G2V and V2G technologies, respectively.
The charging cost of the UC technology is equal to the summation of charging power during the charging period multiplied by the hourly tariff, as shown in Equation (20).
C C E V n = t = 1 24 x t · p t · P B t where   P B t > 0
where xt is the flag for the operation of the EV battery, as has been illustrated in Figure 3 and Equation (15), pt is the hourly tariff, and  P B t  is the hourly charging power.
The total of the hourly wear times multiplied by the difference in cost between the new and second-use batteries and divided by 0.2 yields the daily battery wear cost. The division by 0.2 is due to the EV battery being used up to 80% SoH [36,60], as shown in the following equation:
C w n = ( t = 1 24 W t ) · ( C b C 2 n d ) / 0.2
where Cb is the price of the new battery, C2nd is the price of the second-life battery, and the wear value can be determined from Equation (10).
The total daily cost of the EV is the summation of the charging cost and EV battery cost, as shown in Equation (22):
T C E V n = C C E V n + C W n
The hourly SoC can be determined from Equation (23), where the first term represents the reduction in the SoC due to the self-discharge, the second term represents the reduction due to the charging time, and the third term is the reduction due to the driving period.
S t + 1 = S t ( 1 σ 24 ) x · P B t · η B E B r ( 1 x ) · P B t η B · E B r
The SoH is determined from the previous value of the SoH minus the wear value as shown in Equation (16), where W is the EV battery wear value which can be determined from Equation (10).
The private constraint for the UC technology is that the charging power should be between zero and the maximum allowable charging power, as shown in the following condition:
0 P B t P B max

3.2. Unidirectional G2V Charging Technology

Unidirectional G2V technology is based on selecting the lowest possible tariff time to charge the EV battery, as illustrated in Figure 4. This technology provides the EV owner with the power system benefits, where charging at a low tariff period will reduce the charging cost and avoid charging the battery during the peak periods, which flattens the load curve and avoids many reliability issues.
The charging cost of G2V technology is equal to the summation of charging power during the charging period multiplied by the hourly tariff, as shown in Equation (25).
C C E V n = t = 1 24 x t · p t · P B t where   P B t > 0
The daily wear cost of the battery can be determined as shown in Equation (21). The total daily cost of the EV is the summation of the charging cost and EV battery cost, as shown in Equation (22). The hourly SoC can be determined from Equation (23).
The private constraint for G2V technology is that the charging power should be between zero and the maximum allowable charging power, as shown in the following condition:
0 P B t P B max
The objective function of G2V technology is to minimize the charging cost, which is obtained from Equation (22).

3.3. Bidirectional V2G Charging Technology

With the use of V2G, the EV battery will charge at the lowest tariff and discharge this stored energy back to the grid at the highest possible tariff using the smart EVA, as illustrated in Figure 4. The charging cost of the EV battery in the UC and the unidirectional G2V technologies can be determined from Equation (25). Meanwhile, with bidirectional V2G technology, the cost of charging the EV battery may be calculated using Equation (27).
C C E V n = t = 1 24 x t · p t · P B t where   P B t > 0
The total trip energy per day can be determined by multiplying the daily driving distance by βEV, as shown in Equation (28).
E D E V n = L E V n · β E V = t = 1 24 ( 1 x t ) · | P B t |
The charging energy used to provide the driving energy can be calculated as follows:
E D C E V n = L E V n · β E V η B 2
This amount of energy can be compensated as a constant charging power during the charging period by dividing this energy by the total number of charging periods (TCC), as indicated in the following equation:
P D C E V n = E D C E V n T C C n · L E V n · β E V T C C n · η B 2
where TCC is the total time during the charging period,  T C C n = t = 1 24 t , P B t > 0 .
The cost of energy used for the driving period is as follows:
C D R E V n = t T C C 24 p t · P D C E V n
The total charging cost of the EV battery can be determined from Equation (32).
C C E V n = t T C C 24 p t · P B t
where pt is the tariff at time t and  P B t  is the charging power of the EV battery.
The total battery charging cost to compensate for the discharge energy to the grid in V2G technology can be calculated as follows:
C C V 2 G n = C C E V n C D R E V n
In the above equation, we added the self-discharging cost to the charging cost of the V2G period, which was not fair because this cost is inherent to the battery whether it has been used with V2G or not. So, the actual cost of charging energy due to V2G is modified, as shown in the following equation:
C C V 2 G n = C C E V n C D R E V n C s e l f
where Cself is the cost of energy due to self-discharge per day and it can be calculated as follows:
C s e l f = p a v · σ · E B r
The charging cost due to the discharge in V2G per day can also be determined as follows:
C C V 2 G n = 1 T C C · η B 2 · t T C C 24 p t ( t = 1 , P B t < 0 24 | P B t | )
The SoC is reduced during charging, discharging, and driving, as well as in idle conditions. The value of the SoC of the battery can be obtained from Equation (37). The first term of this equation compensates for the EV battery self-discharge and the second term is the SoC change due to the dispatch period. The power charging sign is +ve during charging time and -ve during discharge time. The increase in SoC during charging power should be multiplied by the EV battery efficiency  η B  to compensate for the reduction in the SoC due to the losses in power due to charging. Meanwhile, during discharging, they should be divided by the EV battery efficiency to compensate for the losses due to discharging. For this reason, the  η B  is raised to power  s i g n ( P B t ) · 1  to become 1 during charging and −1 during the discharging time. The third term compensates for the loss of SoC during the trip (x = 0), where the power during this period is negative and can be determined from Equation (37).
S t + 1 = S t ( 1 σ 24 ) + x · P B t · ( η B ) s i g n ( P B t ) · 1 E B r t + ( 1 x ) · P B t η B
where σ is the self-discharge rate of the EV battery and x is the flag of the operation which is equal to 1 during charging/discharging, idle, and equal to 0 during the driving trip period.
The daily wear cost due to the use of V2G can be determined from Equation (38), where the wear resulting from charging and discharging is adjusted for by multiplying the wear value by two.
C w V 2 G n = 2 · ( t = V 2 G W t ) · ( C b C 2 n d ) / 0.2
The total daily battery cost is equal to the daily charge cost plus the daily wear cost which can be determined from Equation (39)
T C E V n = C C E V n + C w n
The total cost of using V2G is the summation of the charging cost and the battery degradation cost due to the use of V2G, which can be determined from Equations (36) and (38), respectively.
T C V 2 G n = C C V 2 G n + C w V 2 G n
The total daily income due to the use of V2G can be determined from Equation (41):
I V 2 G n = t = 1 , P B t < 0 24 p t · | P B t |
The daily revenue due to the use of V2G compared to G2V can be determined from Equation (42):
R V 2 G n = I V 2 G n T C V 2 G n
The total revenue of V2G compared to dumb charging can be evaluated by comparing the UC cost minus the total cost minus the revenue of V2G, as shown in Equation (43).
R V 2 G D u m b n = T C U C n ( T C E V n R V 2 G n )
The private constraint for V2G technology is that the charging power should be between the maximum allowable charging/discharging power, as shown in the following condition:
P B max P B t P B max
The optimization algorithm used for this technology is to maximize the revenue obtained from V2G, which is shown in Equation (43).

4. Musical Chairs Algorithm

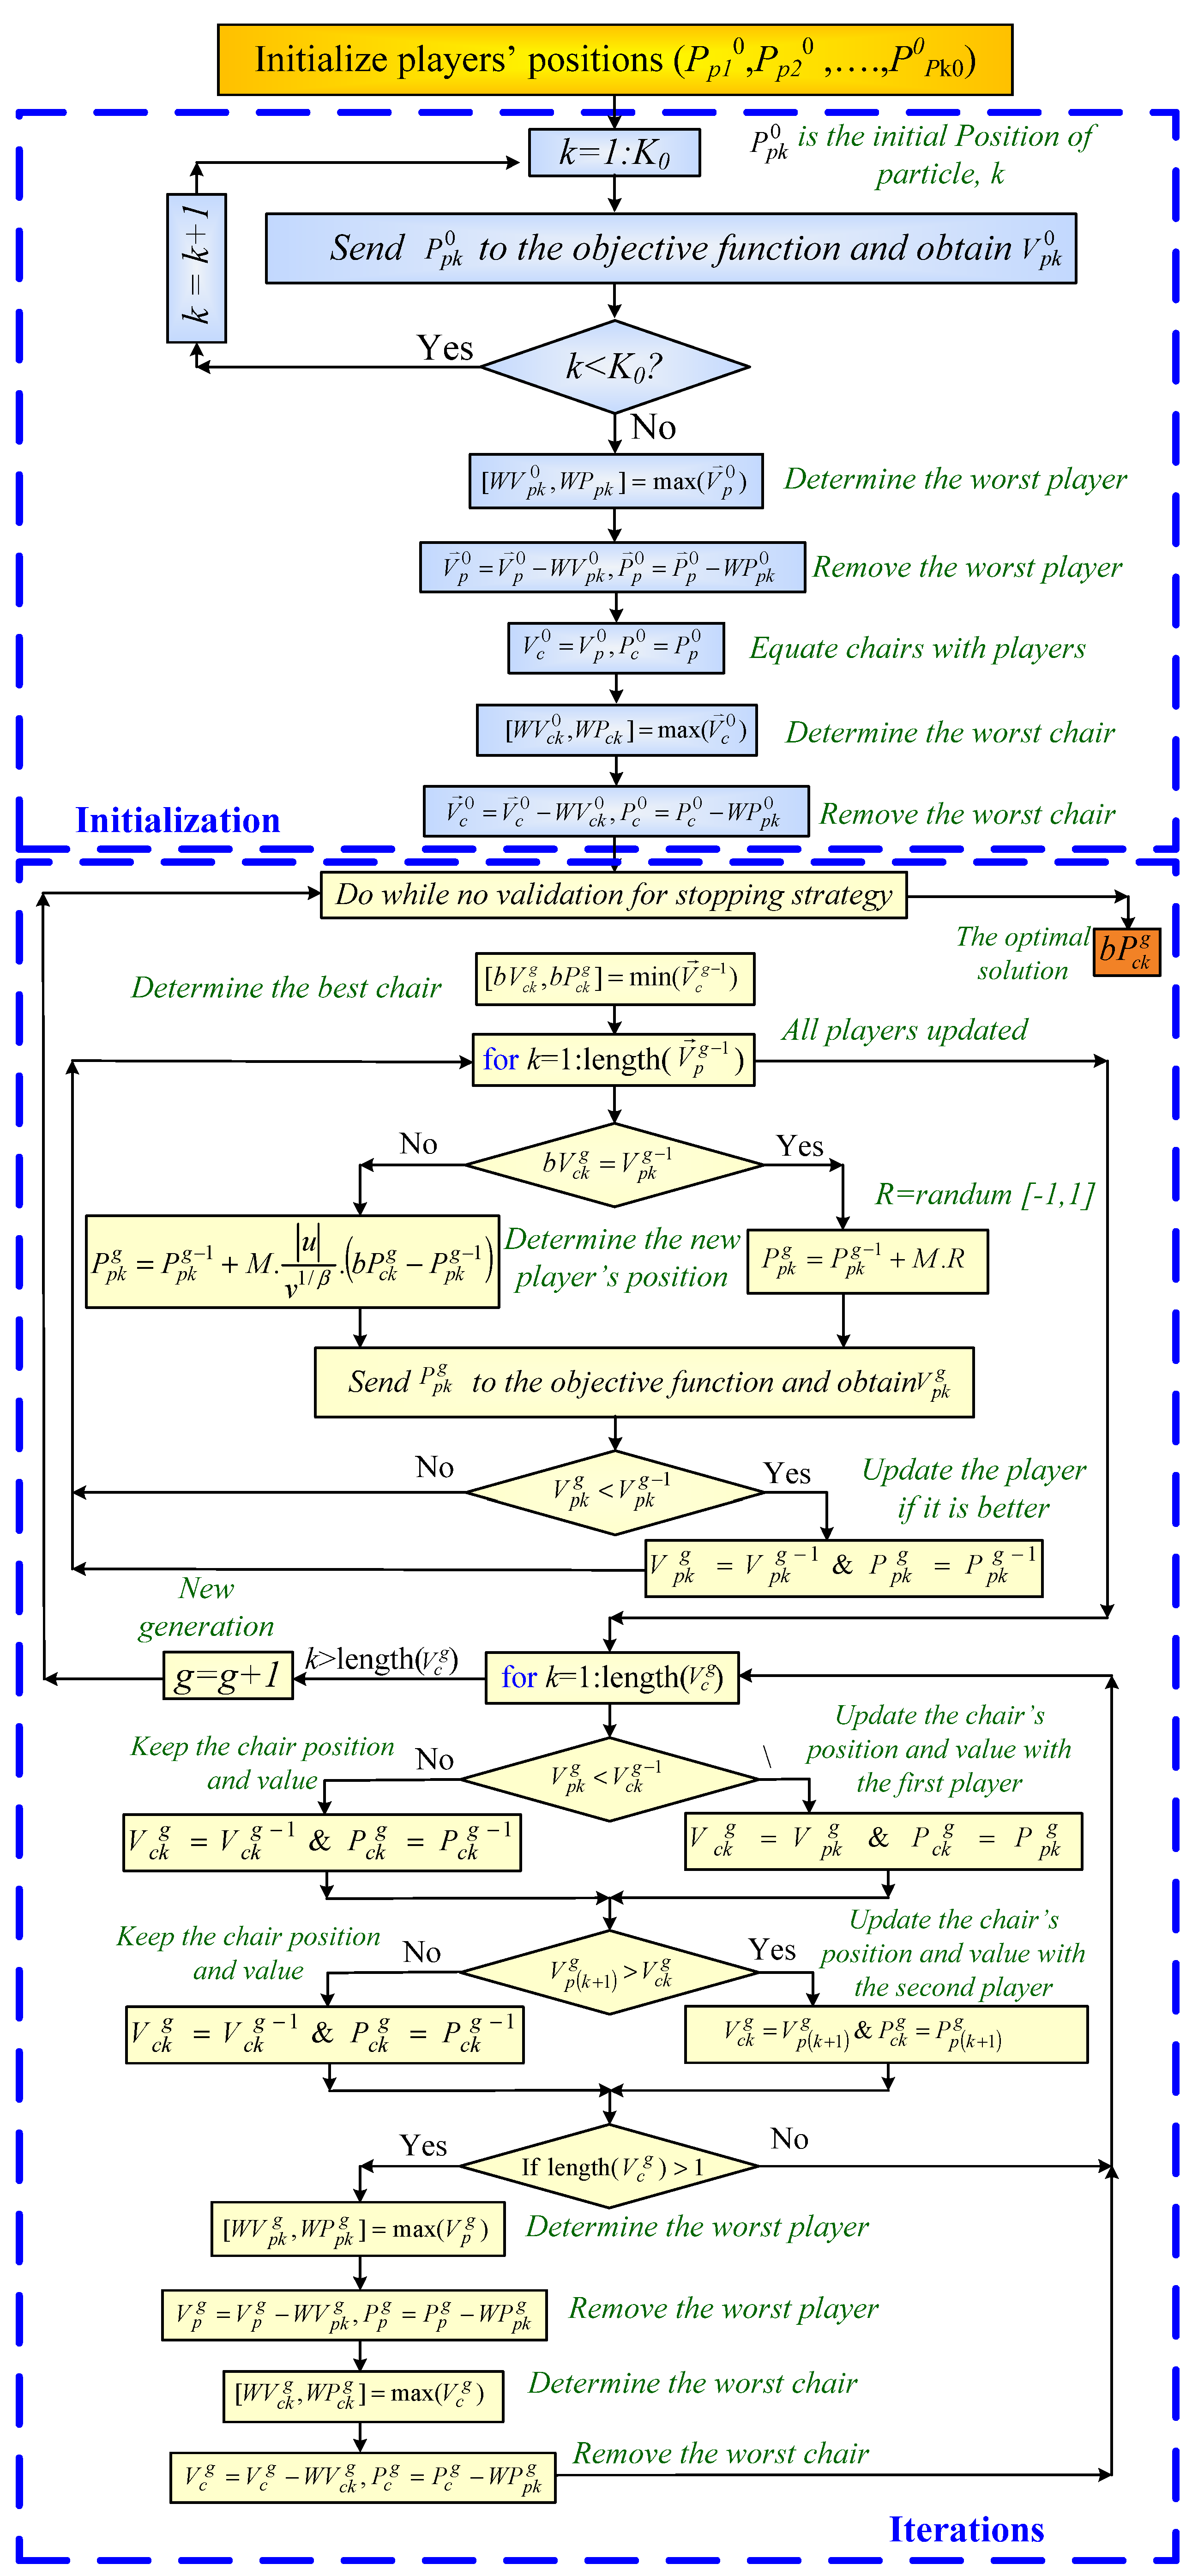
The optimal charging/discharging scheduling in unidirectional G2V or bidirectional V2G technologies used the hourly dispatch powers of the day as optimization variables. So, with a one-hour increment, there are 24 variables, and in the case of 30 min increments, the number of variables should be 48 variables. With this high number of variables, the optimization problem becomes very complex and it needs careful consideration to avoid the long convergence time and premature convergence. Even with the complicated issue presented in this study, a modern optimization technique known as the MCA is used to shorten the convergence time without sacrificing accuracy. This optimization algorithm was introduced in 2021 [69] and it has been used for PV system maximum power point trackers. This method has been used in other applications such as the determination of PV cell parameters [70] and other applications. When compared to other optimization techniques, the MCA performed better, had the shortest convergence time, and produced more precise results [69,70]. For this reason, it has been used in this paper to shorten the time of convergence and to achieve the most accurate optimization results. The idea of this optimization algorithm comes from the musical chairs game where the number of players surrounding chairs lowers by 1, as shown in Figure 5. Players should circle the chairs as soon as the music begins, and they should grab the chairs that are closest to them when the music ends. During this round, there will be one player without a chair who is called the loser, and one chair should be removed from the next round. The game will start again with a new number of players and chairs and continue like the previous round. Two players and one chair will remain after the game; the winner is the player who has the chair when the music stops, and the other players who have the chair will be the losers, as seen in Figure 5 [69,70].
The effectiveness of all optimization approaches is strongly influenced by the quantity of search agents. Unfortunately, a high number of search agents will lengthen the time it takes for convergence to occur and vice versa. On the other hand, a high number of search agents improves the optimization algorithm’s exploration performance, which is necessary early on to prevent becoming stuck in a local optima (premature convergence). So, to improve exploration without increasing the convergence time, it is critical to start optimization with a large search agent number and reduce it iteratively as optimization progresses. This idea best fits with the idea of the musical chairs game in which each search agent is represented by one player and every chair is a representation of the closest player’s fondest memories. The MCA is used to mimic the idea of the musical chairs game which starts with N chairs and N + 1 players to represent search agents. Each player will have 24 variables, with each one representing the hourly charging/discharging power in G2V and V2G technologies. The initial values of the search agents should be fed to the EV battery model to obtain its corresponding fitness value. The optimal player should be chosen based on their greatest fitness value when maximizing or lowest fitness value when minimizing, while the worst player should be chosen based on their lowest fitness value when maximizing or highest fitness value when minimizing. The value and locations of the remaining players should be relocated to the seats, and the poorest player should be eliminated from the group of new players. It is also necessary to remove the poorest chair from the group of chairs. The flowchart explaining the logic used in the MCA to optimally schedule the dispatch power of the EV is illustrated in Figure 6. The new positions of the players can be obtained from Equation (45).
d p k i = d p k i 1 + M · | u | v 1 / β · ( d b e s t d p k i )
where i is the iteration number (i = 1, 2, …, it), k is the searching agent order (k = 1, 2, …, n + 1), n is the number of chairs, Μ is the step size of the MCA, β is the L’évy flight step value which is taken as 1.5 [71,72], and u and v are matrices with uniform distributions and their values can be obtained as shown in (46) [72].
u N ( 0 , σ u 2 ) a n d v N ( 0 , σ v 2 )
where the variance in u and v can be calculated from Equation (47) [72].
σ u = ( Γ ( 1 + β ) · sin ( π · β / 2 ) Γ ( 1 + β 2 ) · β · 2 ( β 1 2 ) ) a n d σ v = 1
The players’ new positions should be checked to be within the constraints suggested for each technology. To obtain the appropriate fitness values for each participant, their locations ought to be fed into the EV battery model.
Every player’s fitness value ought to be contrasted with every player’s fitness value from the preceding cycle. This player’s position and previous fitness value ought to be maintained if they are better than the new ones. If not, the new one should be discarded.
Each chair’s fitness rating should be compared to the two players who are closest to it. Should the chair’s fitness value be above that of the two closest players, its position and value should be retained; if not, the best player should take its place.
If there are more chairs than there are players in the new groupings, then the poorest player and worst chair should be removed from these groups; if not, no players or chairs should be removed.
The stopping criterion should be examined to see whether it is valid. If not, one should move on to determining the new player positions using Equation (45) and use the location and fitness value of the best chair as an ideal solution.

5. Simulation Work

Several optimization studies have been performed in this study. The first study was used to determine the cost of charging the unregulated charging technology. The optimal charging schedule of the unidirectional G2V technology was determined in the second study. The optimal charging schedule of the bidirectional V2G technology was determined in the third study. The last study was performed to determine the sensitivity analysis for the technologies under study.

5.1. Simulation Program

The logic introduced above was modeled in Matlab Software Version R2023a, and the block diagram showing this logic is shown in Figure 7. In the beginning, the deriving distance and departure time were determined based on the stochastic methodology shown in Section 3. Based on these values, the EV model was used to evaluate the arrival time and the energy consumption during the trip. The suggested hourly power generated from the optimization algorithm with the hourly driving power fed to the EV battery wear model uses the ACC-DoD characteristics shown in Figure 1 to determine the hourly and daily wear due to this operating condition. Then, the economic model uses these results to show the charging, wear costs, and the profit gained from these operating conditions. Based on the benefits obtained from the cost estimation model, the optimization algorithm suggests the modified values of charging/discharging power and continues doing this until the stopping strategy is validated. A comprehensive explanation of the simulation program depicted in Figure 7 is provided in the next sections.

5.2. Input Data

The battery used in this study has 55 kWh capacity and ACC-DoD characteristics, as illustrated in Figure 1. The new battery price is USD 140 and the retired battery with 80% SoH price is 60 USD/kWh [36,60]. The efficiency of charging/discharging the battery is 0.95. The maintenance and operating cost is 0.1 USD/kWh/year. The self-discharge rate is 0.01% per day.
The MCA optimization algorithm used 50 players initially and 200 iterations. The value of the other parameters of the MCA was extracted from [69,70].
The dynamic tariff used in this study is just an example of a pricing program that can be modified depending on the power system’s needs. This tariff program has been introduced before in [61]. The tariff is designed based on day-ahead pricing in which the system operator distributes the pricing program daily for the next 24 h to help EVA manage the daily charging/discharging power. Figure 4 shows a sample for a day tariff along with the charging/discharging hours for UC, G2V, and V2G technologies, respectively.
It is worth noting that the battery prices and the electricity tariffs are different from place to place and, for this reason, the sensitivity analysis section is introduced at the end of the simulation section to predict the variation in the results with the variation in these input data.

5.3. Simulation Results

5.3.1. Unregulated Charging Simulation Results

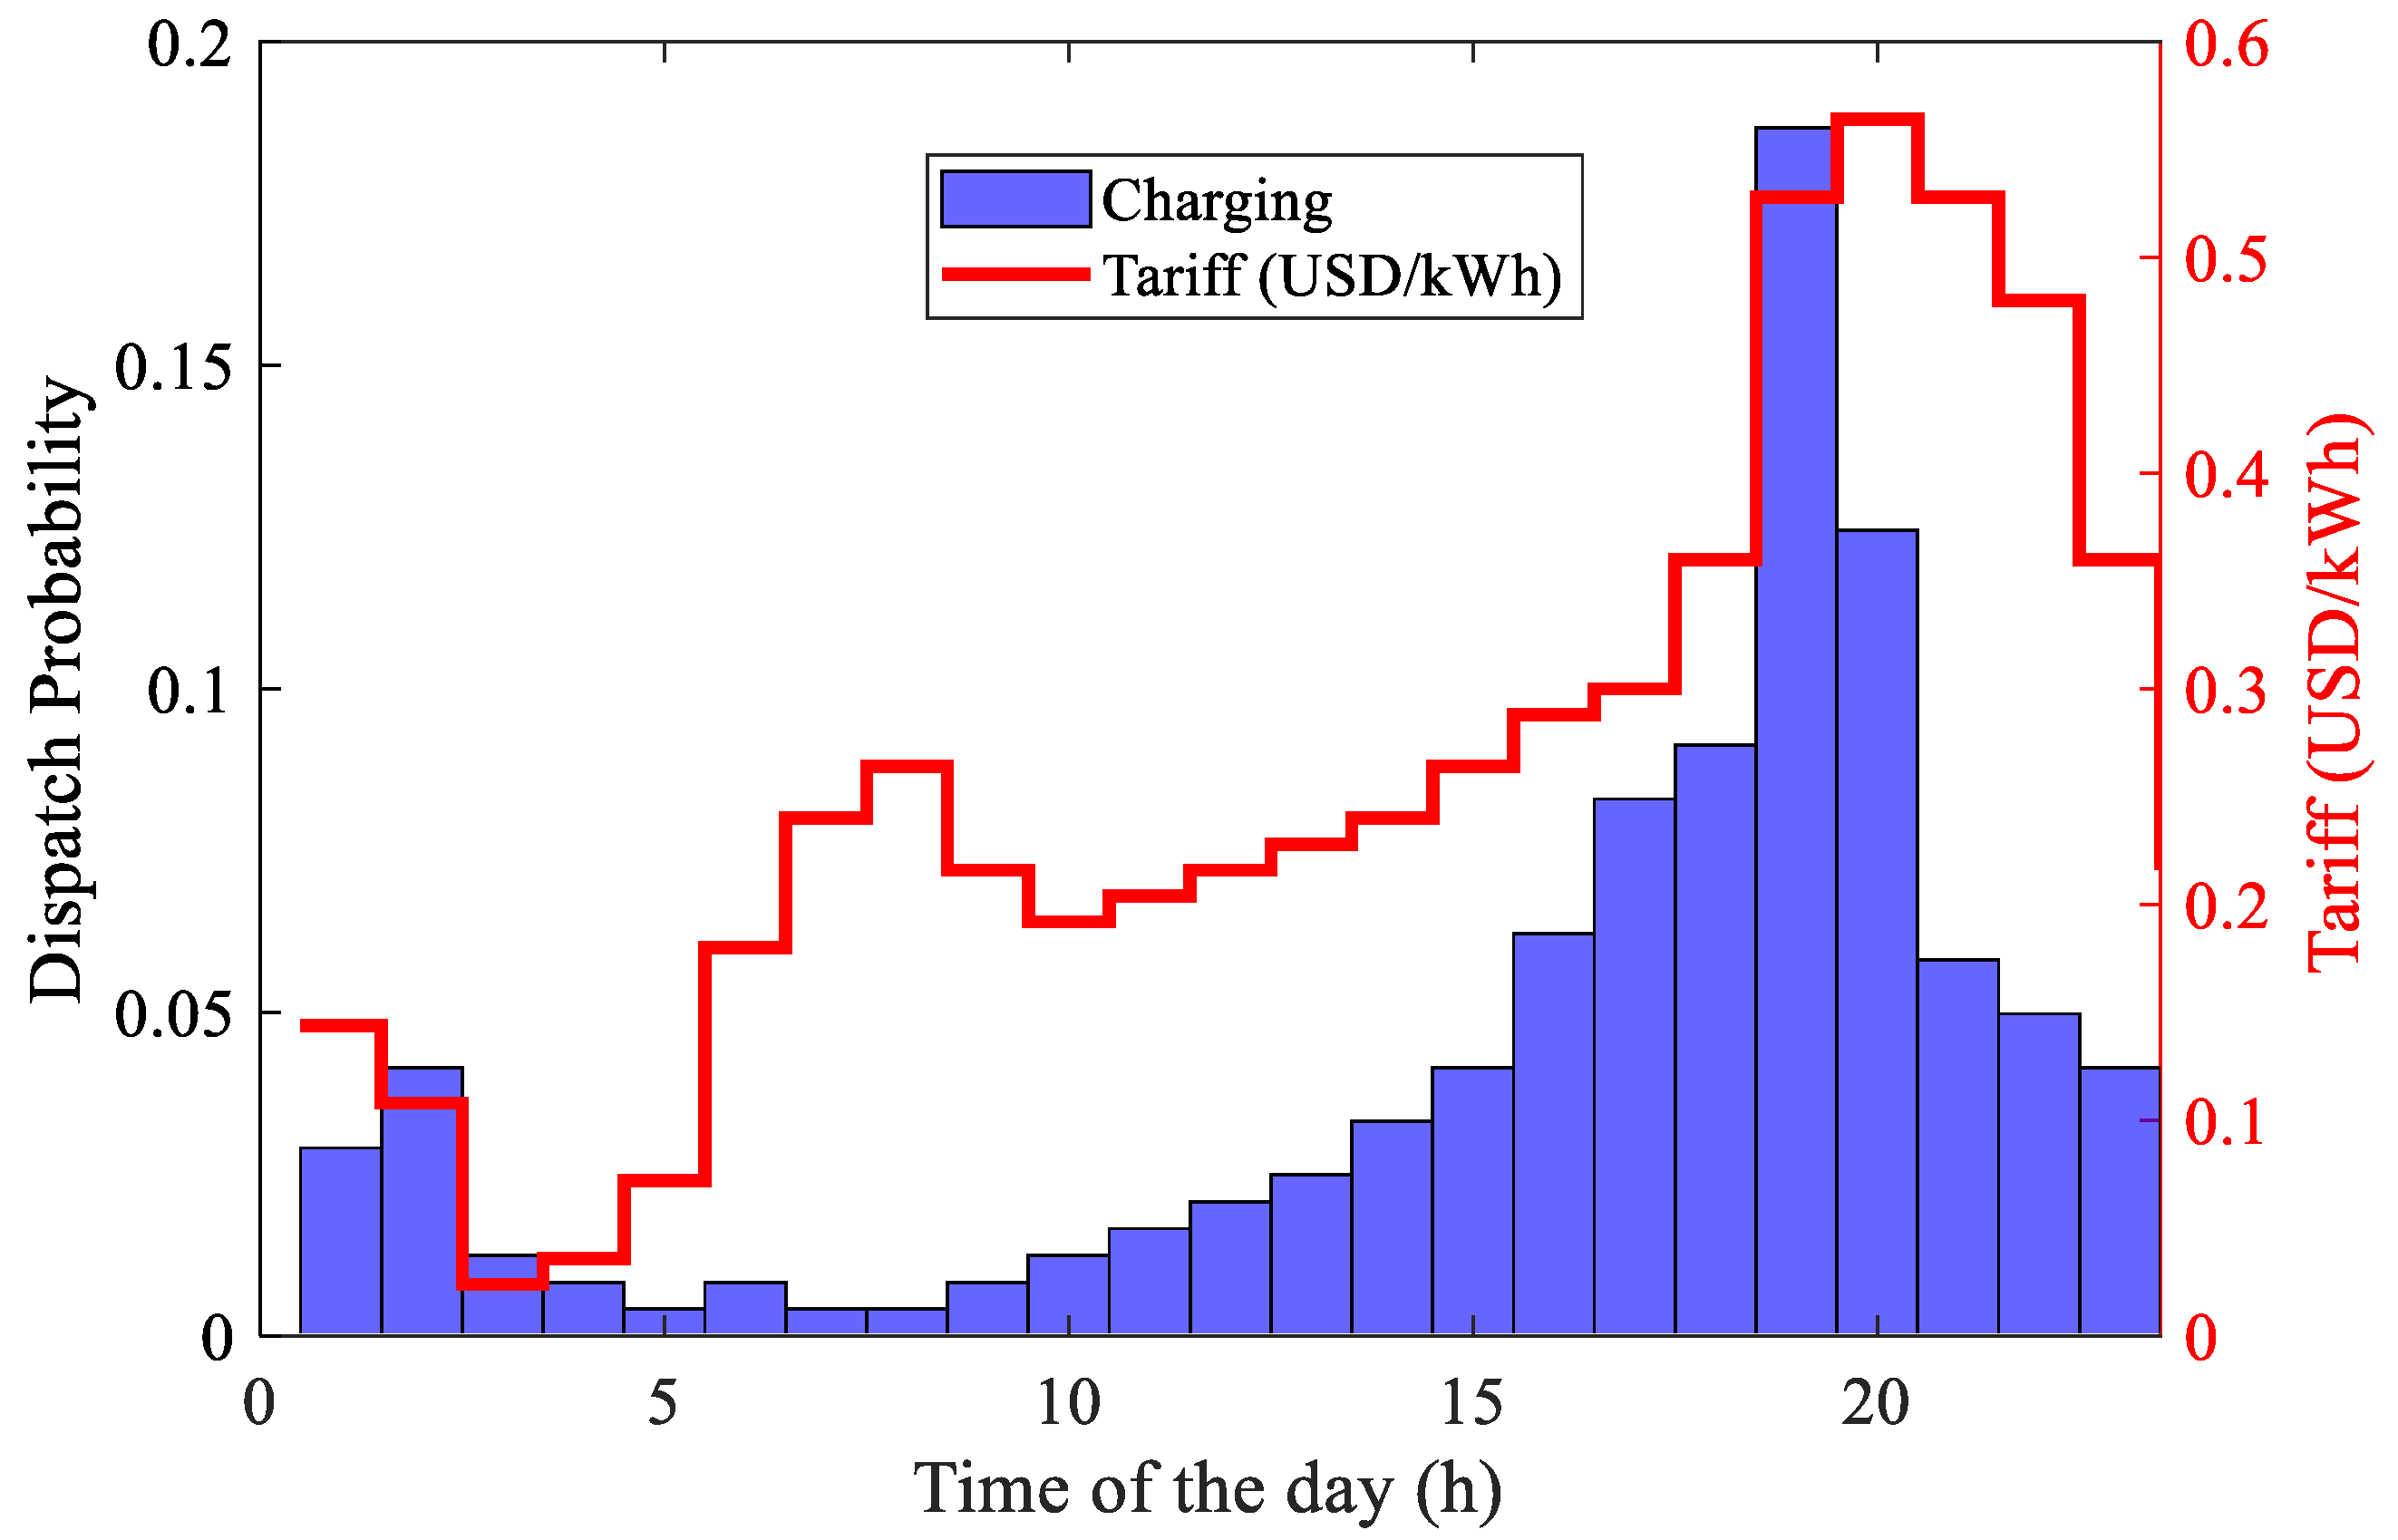
Unregulated charging involves charging the battery with its maximal charging power once it is attached to the supply means. This technology does not schedule the charging as shown in Figure 8. The simulation of this technology is carried out here for comparison. The charging cost of the EV under study with this technology is USD 917.8. As illustrated in Figure 8, the charging time occurs at any time, regardless of the tariff. The yearly battery wear or the percentage loss in the SoH is 2.55%, which means that the battery lifespan is 7.8431 years. This wear costs EV owners USD 587.5 yearly. The total battery yearly cost including the charging and wear costs is USD 1505.3. This value will definitely be significantly reduced in G2V technology due to the reduction in charging cost because the system selects the lowest tariff periods for charging the battery, as will be shown in the next section. The simulation results from UC compared to G2V and V2G technologies are shown in Table 1. Most of the results shown in this table are correlated with the similar EVAs introduced in the literature [73].

5.3.2. G2V Charging Simulation Results

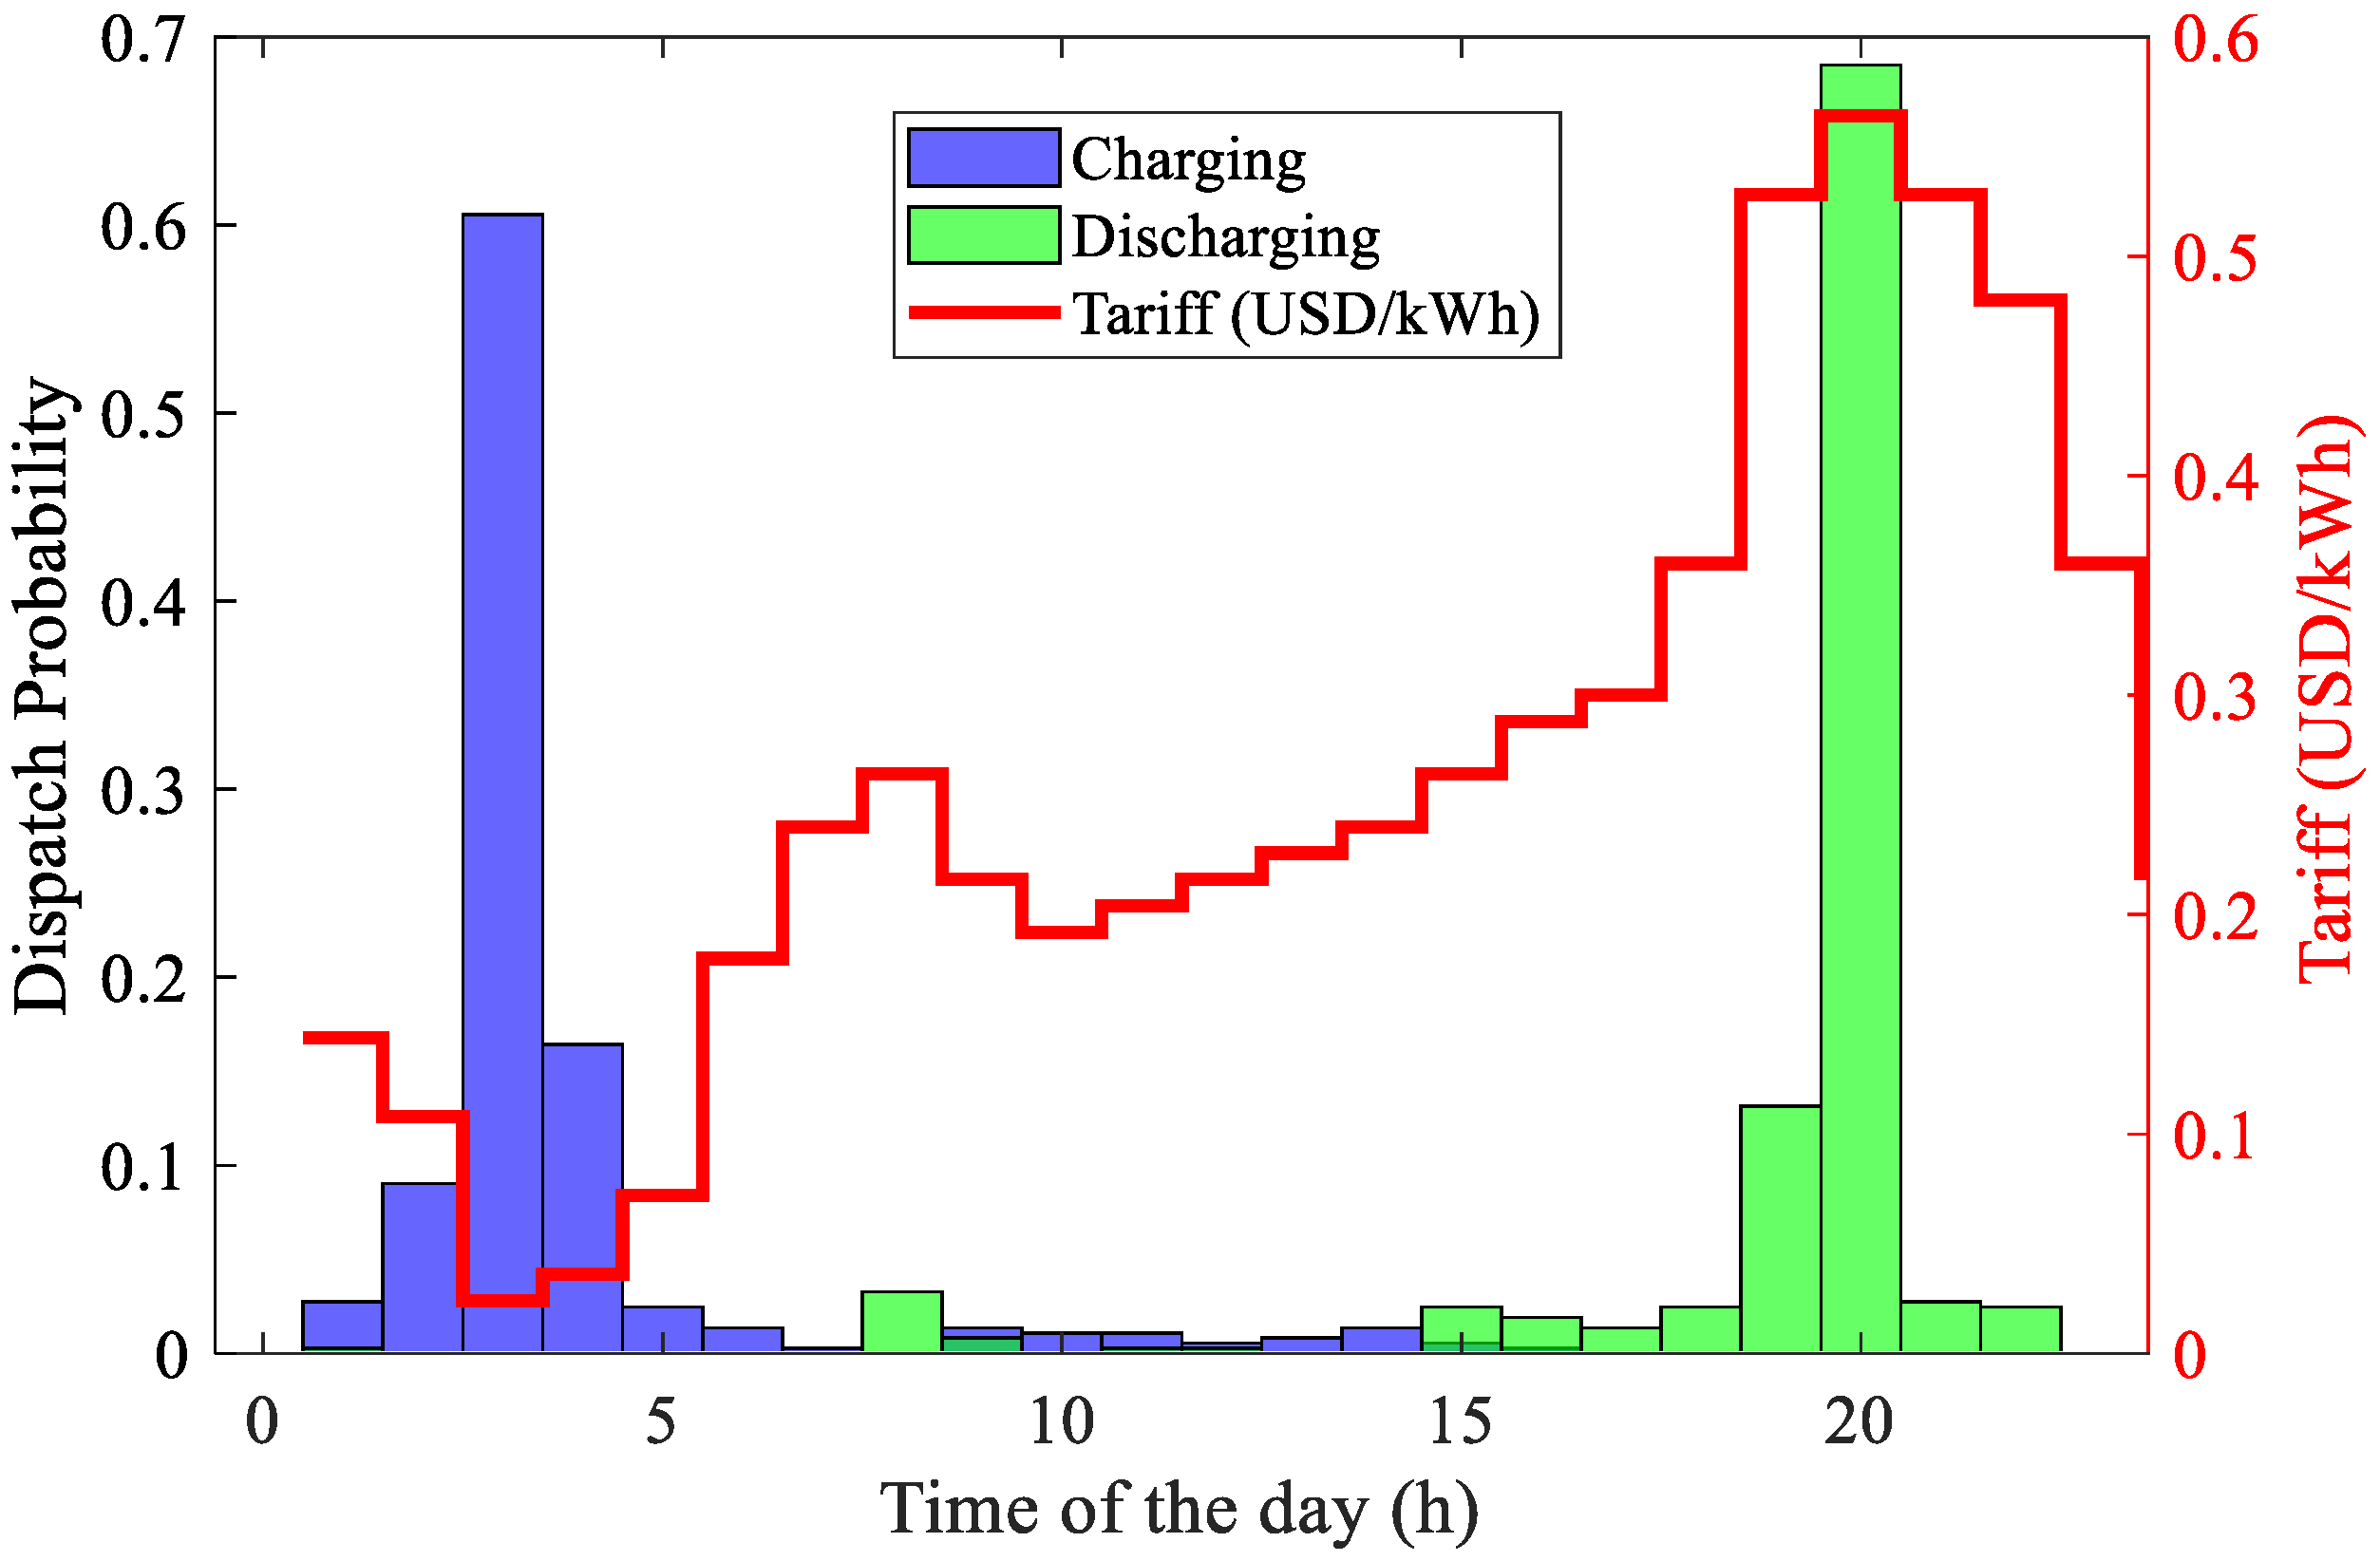
The optimization algorithm suggests the charging power and determines the corresponding cost for these suggestions. The optimization algorithms vary the scheduling of the charging/discharging power, again searching for the lowest daily cost. The lowest daily cost definitely occurs in the lowest tariff, as shown in Figure 9. It is clear that 90% of the charging hours occur at 03:00, in which the tariff is minimal. There is a small percentage of other charging at different hours that occurs due to the EV being on a driving trip during this period and the optimization algorithms search for another opportunity which often occurs at 01:00, 02:00, and 10:00. These significant findings demonstrate the superiority of the suggested technique and optimization algorithm presented in this work. As has been clearly shown in Table 1, the yearly degradation is 2.43%, which is 95.3% of the yearly wear of the UC technology. For this reason, the battery lifespan of G2V is 8.23 years, which is greater than the lifespan of the UC by about 4.7%. It is clear that there is not much improvement in the yearly wear cost of G2V compared to UC technologies. The main improvement in the cost is the yearly charging cost which is USD 436.6 compared to USD 917.8 for the UC technology. This means that the optimal scheduling of charging power with G2V reduced the yearly charging cost to 47.5% compared to the charging cost of the UC, which proves the superiority of using optimal scheduling charging power. The yearly battery wear cost is USD 559.6, which is lower than the one associated with the UC by 5%. The total yearly cost of G2V technology is USD 996.2 compared to USD 1505.3 with UC technology, which means that the optimal scheduling of charging with G2V reduced the yearly cost to 66.2% compared to UC technology. This means that G2V reduced the cost by USD 508.7 compared to the cost associated with the UC technology.

5.3.3. V2G Charging Simulation Results

V2G bidirectional charging/discharging technology can substantially reduce the charging cost by charging the EV at periods with low tariffs, discharging the saved energy at times of high tariffs, and reaping benefits from the tariff difference. The charging/discharging schedule for V2G technology for a certain day is illustrated in Figure 10 as an example. This figure illustrates that the battery started charging at low tariff periods (04:00 to 06:00) until the SoC reached the maximum value and waited for the driving trip that started between 10:00 and 15:00; the battery SoC reached the lowest value and then the EVA started to charge the battery again between 16:00 and 18:00 until it reached its maximum SoC. When the tariff increased, it started discharging its stored energy to the grid between 19:00 and 21:00 to reap benefits from the tariff difference.
Table 1 presents a summary of V2G technology’s simulation findings for comparison with UC and G2V technologies. The yearly wear of V2G is 5.34%, which is almost double the wear associated with UC and G2V technologies, which means that the wear on the EV battery increases when it participates in V2G applications and reduces its life to 3.7453 years compared to 7.8431 and 8.23 years in UC and G2V technologies, respectively. These important results show that participation in V2G substantially increases the wear of the battery and reduces its lifespan compared to UV and G2V technologies and, for this reason, a detailed wear mechanism and economic analysis of these technologies should be provided to encourage/discourage EV owners to take part in V2G technologies.
The yearly charging cost that was used to supply the EV with the required energy during the driving trip and the discharging power to the electric utility during the high tariff time is USD 765.4, which is 83.4% of the charging cost of the UC that was used for supplying the EV battery during the driving trip only. The charging cost associated with V2G is definitely higher than the one associated with G2V because it is the cost of the driving trip and the discharge energy in V2G compared to the supply of the driving trip energy for G2V technology.
The yearly wear cost of V2G technology is USD 1230.9, which is more than the wear cost associated with UC and G2V technologies. The total yearly wear and charging cost is USD 1996.3 which is higher than the ones associated with UC and G2V technologies, but this high cost is compensated with the income from participating in the V2G program. The yearly income from selling the energy to the electric power system in V2G technology is USD 5240.7. Then, the total revenue is the difference between the income and the cost plus the cost associated with the UC (5240.7 − 1996.3 + 1505.3 = USD 4749.7).
The results showing the charging and wear cost contribution in the total cost of the UC, G2V, and V2G technologies are shown in Figure 11.
Table 1. The comparison between three different technologies under study.
ItemsDumb ChargeG2VV2G
Yearly battery degradation (%)2.552.435.34
Battery lifespan (years)7.84318.233.7453
Yearly charging cost (USD)917.8436.6765.4
Yearly wear cost (USD)587.5559.61230.9
Total yearly cost (USD)1505.3996.21996.3
Income due to V2G (USD)----5240.7
Yearly revenue compared to UC (USD)--508.74749.7

5.4. Sensitivity Analysis

This section will be used to measure the effect of changing stress factors on different outcomes due to the use of an EV from an EV owner’s point of view.
The first study was used to measure the effect of changing the difference between the high and low tariffs on different dispatch technologies used with the EVA. During this study, the tariff changed similarly to the original one shown in the simulation section but with different values between the highest and lowest tariff. The results from this study are shown in Figure 12. It is clear from the upper trace of this figure that the profit gained from V2G technology exponentially increases with an increase in the difference between the higher and lower tariffs. So, it is recommended that EV owners participate in V2G technology when the difference in tariffs is high.
Another important result gained from this study is inversely proportional to the difference in tariff, while it is directly proportional to the cost associated with unregulated charging (UC).
The third trace shown in Figure 12 illustrates the variation between the profit gained from G2V technology compared to the UC technology, along with a change in the difference between the highest and lowest tariffs. It is clear from this figure that the profit of G2V technology is directly proportional to the tariff difference, with a lower increase compared to V2G technology.
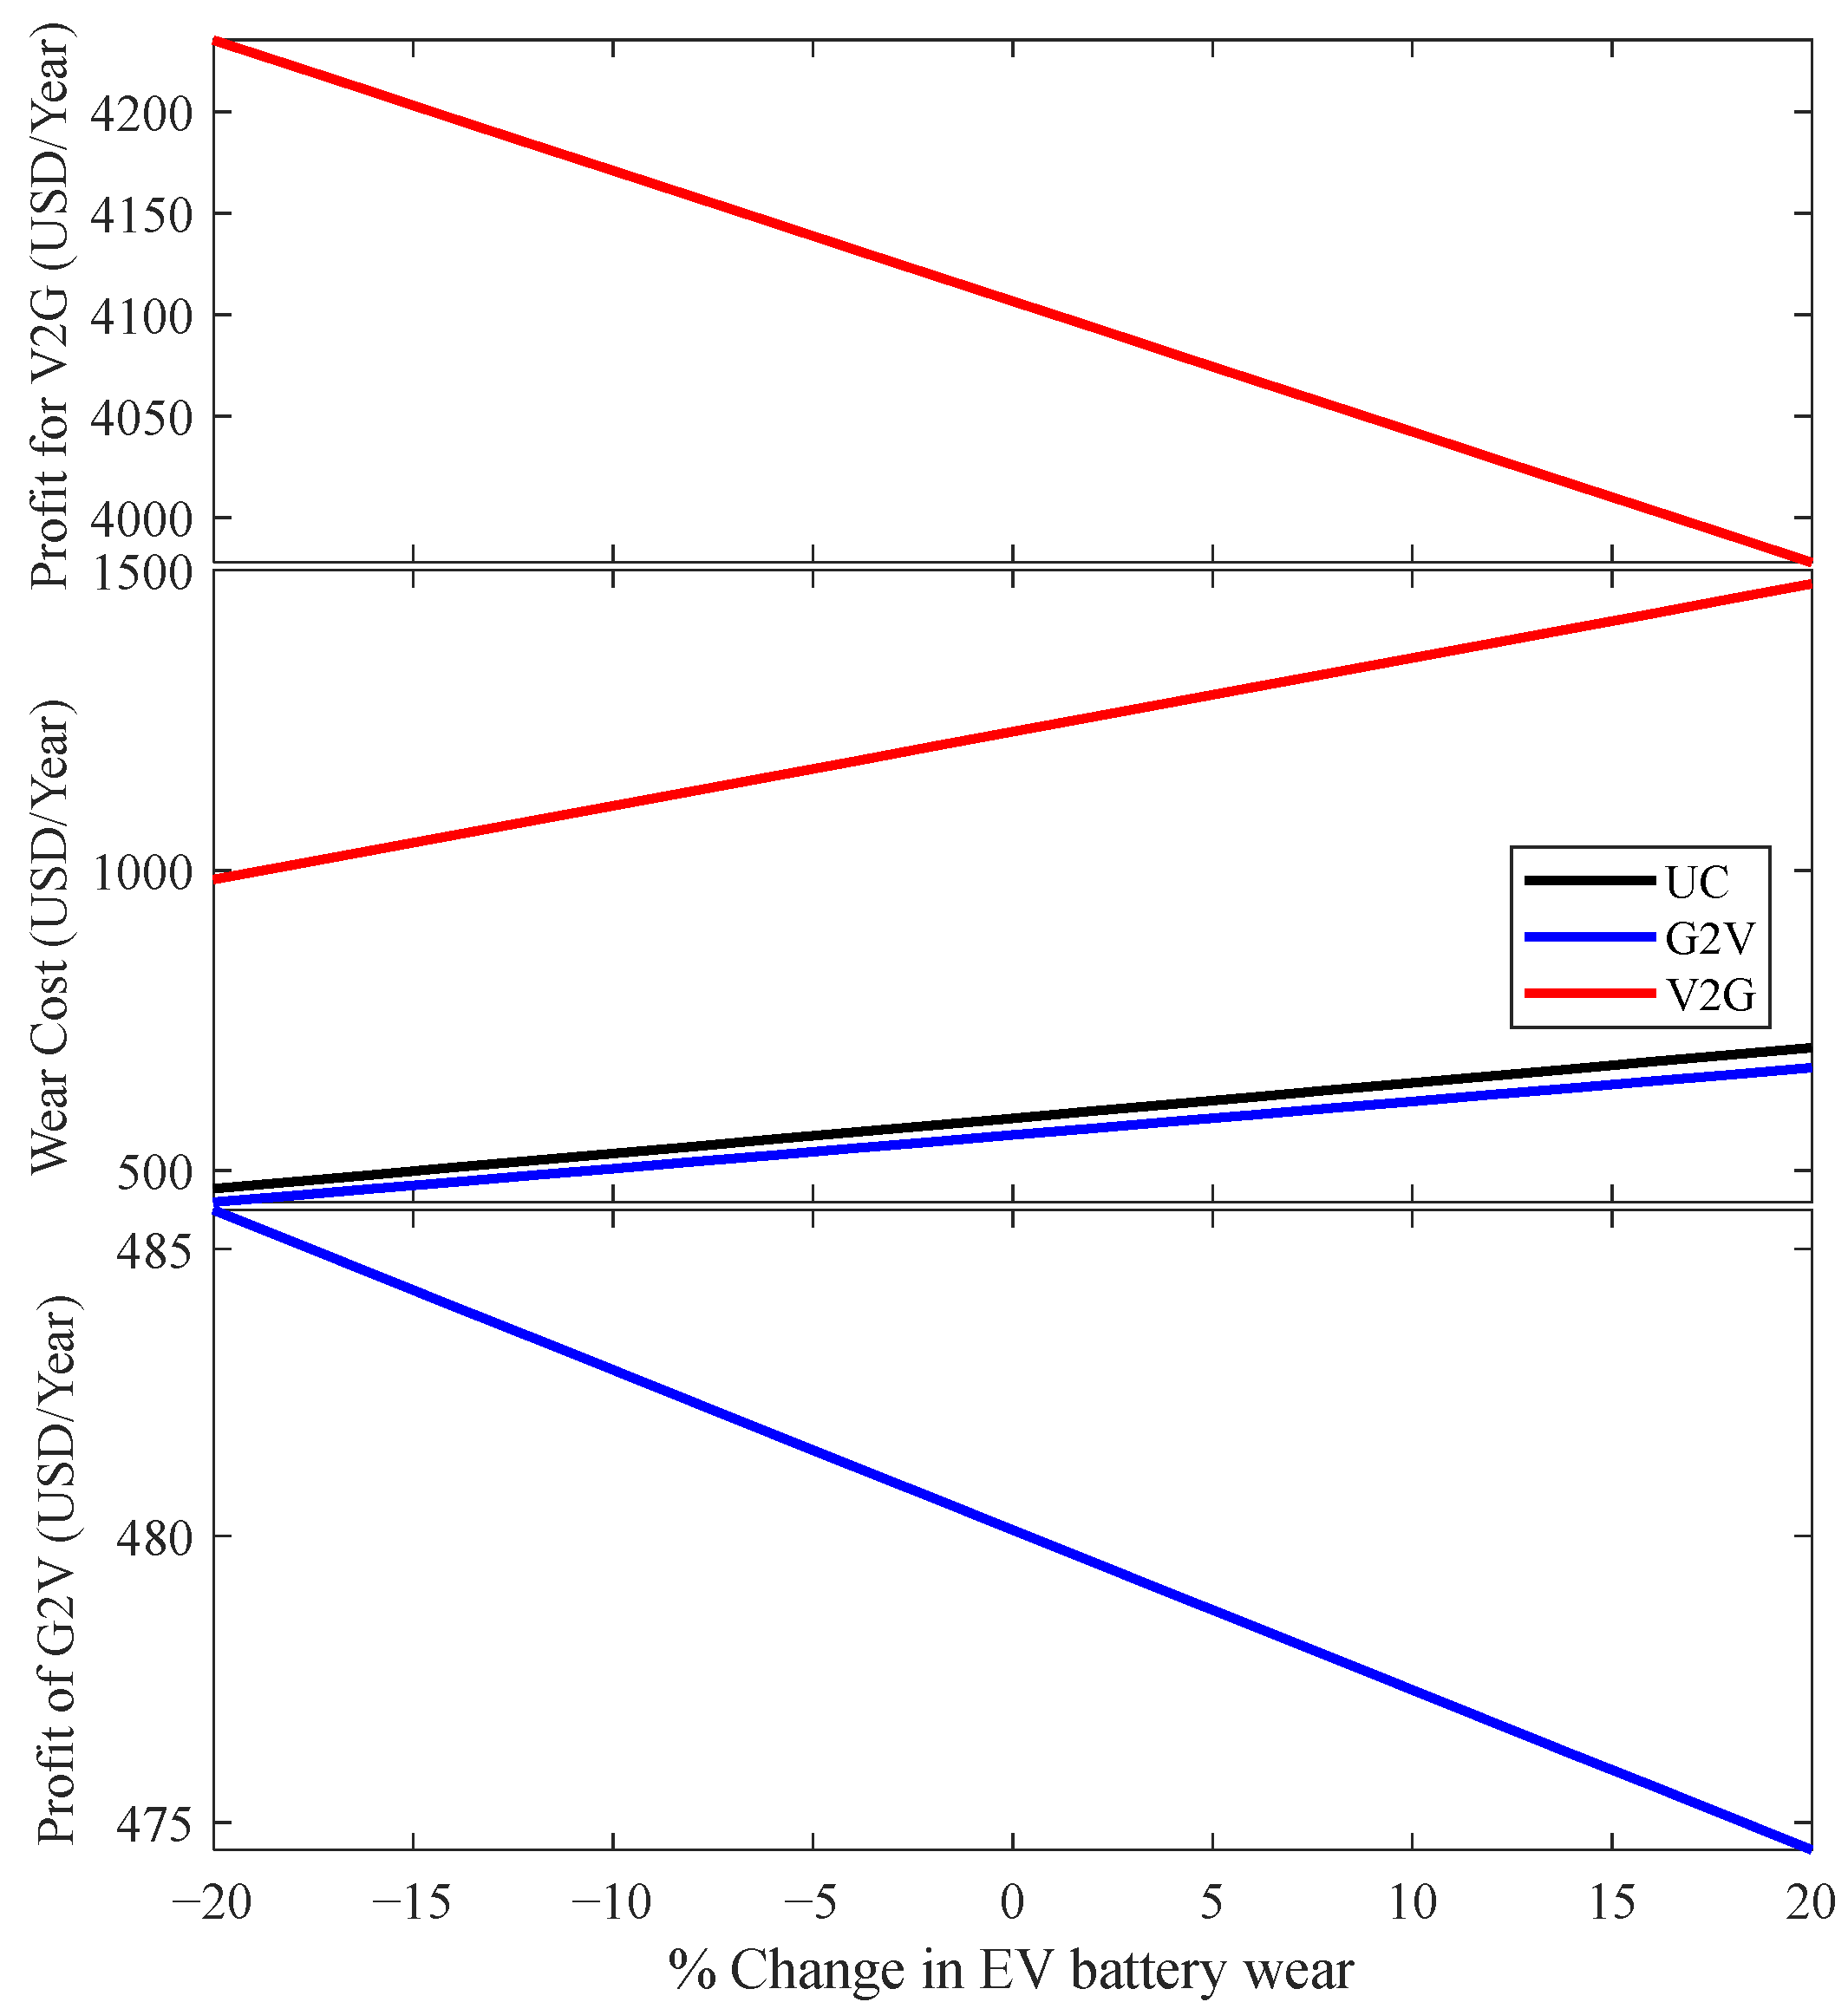
The second sensitivity analysis was introduced to measure the effect of a ±20% increase in wear cost on different economic results. The upper trace of Figure 13 shows the effect of the variation in the wear cost variation on V2G profit. It is clear from this trace that V2G profit is inversely proportional to the battery wear cost. Moreover, the middle trace of Figure 13 shows the wear cost of different dispatch strategies with the wear variation. The lowest trace shows the effect of battery wear on the profit of G2V technology. This trace shows that the profit of G2V is inversely proportional to the battery wear value.

5.5. Results and Discussion

The results shown in Table 1 show the salient results from the simulation of the UC, G2V, and V2G charging technologies used with EVA. Many useful results should be discussed in this section, as shown in the following points:
  • The yearly degradation in G2V technology is slightly lower than the one associated with the UC because of almost the same amount of energy charged/discharged from the battery to supply the EV trip and the self-discharge rate of the battery. Meanwhile, the wear value associated with V2G is almost double the value associated with UC and G2V technologies because extra degradation occurs for charging/discharging to support the grid during peaks. For this reason, it is important to help EV owners decide to participate in V2G technology by providing an accurate wear model and optimal charging/discharging power schedule to be sure that the income from V2G will cover the extra cost due to the degradation. Moreover, EV owners should know that with V2G technology, they should replace their batteries in half the years that they can be used with UC or G2V technologies.
  • The yearly charging cost of G2V technology is almost half the one associated with UC technology. This means that even with EV owners’ distrust in V2G technology, they should not lose the benefits associated with G2V technology. Furthermore, the yearly charging cost of V2G used to supply the EV during the driving trip and the supply of the grid with the energy at peaks is lower than the charging cost of UC to just supply the driving trip only. These great results proved the superiority of V2G technology compared to UC technology. These important results encourage EV owners to participate in V2G technologies.
  • The yearly cost of G2V technology is 66% of the one for the UC technology used for the same purpose. This means there is a 33% reduction in the yearly cost of using G2V technology compared to the UC one. These very important results should be considered by EV owners, to reduce their electricity bills, and power system operators, for peak shaving and valley filling of the load demand curve, which can significantly improve the performance of the power system and avoid the big investments used to cover the loads during high peaks for a short period of time.
  • The yearly income of participating in V2G using the optimal scheduling strategy introduced in this paper is USD 5240.7, which covers the yearly cost, and EV owners can make USD 3244.4 net yearly profit. If the cost of the UC technology is considered, the net profit can be increased to USD 4749.7. This high profit proves the superiority of the use of V2G technology compared to UC and G2V technologies.

6. Conclusions and Future Work

6.1. Conclusions

The exponential increase in the utilization of electric vehicles (EVs) imposes many challenges to the power system, especially if there is unregulated charging. Unidirectional grid-to-vehicle (G2V) technology can partially reduce the impacts of these challenges on the power system, where EV batteries will charge during off-peak periods using an EV aggregator (EVA). This technology avoids the peak period due to the high tariff associated with it and charges the batteries during the low tariff period which can flatten the load demand curve and participate in improving the performance of the power system. Moreover, bidirectional vehicle-to-grid (V2G) technology can further improve the performance of the power system over G2V by discharging the stored energy in the EV batteries at peak periods, which can participate in the peak shaving of the curve. Undoubtedly, V2G technology improves power system performance, but there is a fear amongst EV owners of participating in this technology due to distrust in inaccurate battery wear models and the smart technologies used in current EVAs. This paper solved this problem by introducing a detailed wear model that considers the accurate instantaneous operating conditions to determine the wear cost and other costs and compare them with the total income due to selling the stored energy of EVs during high tariff periods. Moreover, this study introduced optimal scheduling for G2V and V2G charging technologies for the highest benefits for EV owners. This is an accurate model and the optimal charging EVAs participate in increasing the awareness of EV owners in the benefits they can earn from participating in G2V or V2G technologies without fear. The accurate model used for these technologies showed that participation in G2V technology reduced the yearly cost by 33% compared to unregulated charging. Moreover, the use of V2G technology provides each EV owner with USD 3244.4 net yearly profit after covering the charging and wear costs. Moreover, the net profit of the use of V2G is USD 4749.7 compared to the costs associated with UC technology. The superior results extracted from the accurate model introduced in this paper showed the superiority of the use of V2G, which can benefit EV owners and power systems as well.

6.2. Future Work

The use of a smart EVA in charging/discharging EV batteries is a fast-developing research topic, and this study introduced an important idea for an accurate wear model of EV batteries and optimal dispatch strategy for V2G and G2V technologies. This study can be extended to add vehicle-to-everything (V2X) integration technology for a more holistic energy management approach. Moreover, the study can be extended to examine how V2X may be used to build energy communities and microgrids to improve resilience and energy independence. There is also a very important topic that should be covered in upcoming research studies which can cover user engagement and incentives by developing innovative incentive schemes that reward users for V2G participation and contribute to grid stability and environmental benefits. Researchers and developers may further unleash the potential of V2G technology and contribute to a more efficient, user-centric, sustainable energy economy by aggressively pursuing research in these new areas.

Funding

This research was funded by Deputyship for Research & Innovation, Ministry of Education, in Saudi Arabia, IFKSURC-1-6202.

Data Availability Statement

Data is contained within the article.

Acknowledgments

The authors extend their appreciation to the Deputyship for Research & Innovation, Ministry of Education, in Saudi Arabia for funding this research (IFKSURC-1-6202).

Conflicts of Interest

The author declares that he is not an employee of Saudi Electricity Company, but only an employee of King Saud University. The author declares no conflict of interest.

References

  1. Global Population Is Growing. 2022. Available online: https://knowledge4policy.ec.europa.eu/foresight/global-population-growing_en (accessed on 21 June 2023).
  2. IEA (International Energy Agency). Net Zero by 2050: A Roadmap for the Global Energy Sector. 2021. Available online: https://iea.blob.core.windows.net/assets/deebef5d-0c34-4539-9d0c-10b13d840027/NetZeroby2050-ARoadmapfortheGlobalEnergySector_CORR.pdf (accessed on 21 June 2023).
  3. Thompson, A. Economic implications of lithium ion battery degradation for Vehicle-to-Grid (V2X) services. J. Power Sources 2018, 396, 691–709. [Google Scholar] [CrossRef]
  4. Crozier, C.; Morstyn, T.; Deakin, M.; McCulloch, M. The case for Bi-directional charging of electric vehicles in low voltage distribution networks. Appl. Energy 2020, 259, 114214. [Google Scholar] [CrossRef]
  5. Electric Car Sales Break New Records with Momentum Expected to Continue Through 2023. Available online: https://www.iea.org/energy-system/transport/electric-vehicles (accessed on 21 June 2023).
  6. Yilmaz, M.; Krein, P. Review of the impact of vehicle-to-grid technologies on distribution systems and utility interfaces. IEEE Trans. Power Electron. 2012, 28, 5673–5689. [Google Scholar] [CrossRef]
  7. Kempton, W.; Tomić, J. Vehicle-to-grid power fundamentals: Calculating capacity and net revenue. J. Power Sources 2005, 144, 268–279. [Google Scholar] [CrossRef]
  8. Tomić, J.; Kempton, W. Using fleets of electric-drive vehicles for grid support. J. Power Sources 2007, 168, 459–468. [Google Scholar] [CrossRef]
  9. Lunz, B.; Walz, H.; Sauer, D. Optimizing vehicle-to-grid charging strategies using genetic algorithms under the consideration of battery aging. In Proceedings of the 2011 IEEE Vehicle Power and Propulsion Conference, Chicago, IL, USA, 6–9 September 2011; IEEE: Piscataway, NJ, USA; pp. 1–7. [Google Scholar]
  10. Rutherford, M.; Yousefzadeh, V. The impact of electric vehicle battery charging on distribution transformers. In Proceedings of the 2011 Twenty-Sixth Annual IEEE Applied Power Electronics Conference and Exposition (APEC), Fort Worth, TX, USA, 6–11 March 2011; IEEE: Piscataway, NJ, USA; pp. 396–400. [Google Scholar]
  11. Desbiens, C. Electric vehicle model for estimating distribution transformer load for normal and cold-load pickup conditions. In Proceedings of the 2012 IEEE PES Innovative Smart Grid Technologies (ISGT), Washington, DC, USA, 16–20 January 2012. [Google Scholar]
  12. Bae, S.; Kwasinski, A. Spatial and temporal model of electric vehicle charging demand. IEEE Trans. Smart Grid 2011, 3, 394–403. [Google Scholar] [CrossRef]
  13. Etezadi-Amoli, M.; Choma, K.; Stefani, J. Rapid-charge electric-vehicle stations. IEEE Trans. Power Deliv. 2010, 25, 1883–1887. [Google Scholar] [CrossRef]
  14. Lassila, J.; Haakana, J.; Tikka, V.; Partanen, J. Methodology to analyze the economic effects of electric cars as energy storages. IEEE Trans. Smart Grid 2011, 3, 506–516. [Google Scholar] [CrossRef]
  15. Alotaibi, M.A.; Eltamaly, A.M. A smart strategy for sizing of hybrid renewable energy system to supply remote loads in Saudi Arabia. Energies 2021, 14, 7069. [Google Scholar] [CrossRef]
  16. Eltamaly, A.M. Optimal Dispatch Strategy for Electric Vehicles in V2G Applications. Smart Cities 2023, 6, 3161–3191. [Google Scholar] [CrossRef]
  17. Shao, S.; Pipattanasomporn, M.; Rahman, S. Grid integration of electric vehicles and demand response with customer choice. IEEE Trans. Smart Grid 2012, 3, 543–550. [Google Scholar] [CrossRef]
  18. Eltamaly, A.M.; Alotaibi, M.A.; Alolah, A.I.; Ahmed, M.A. IoT-based hybrid renewable energy system for smart campus. Sustainability 2021, 13, 8555. [Google Scholar] [CrossRef]
  19. UK Government Department for Business, Energy & Industrial Strategy. Government Funded Electric Car Charge Points to Be Smart by July 2019. Available online: https://www.gov.uk/government/news/ government-funded-electric-car-chargepoints-to-be-smart-by-july-2019 (accessed on 15 August 2023).
  20. Society of Automotive Engineers. Measurement of Carbon Dioxide, Carbon Monoxide, and Oxides of Nitrogen in Diesel Exhaust; SAE J177. 2002; Society of Automotive Engineers: Warrendale, PA, USA.
  21. Eltamaly, A.M.; Ahmed, M.A. Performance Evaluation of Communication Infrastructure for Peer-to-Peer Energy Trading in Community Microgrids. Energies 2023, 16, 5116. [Google Scholar] [CrossRef]
  22. Jarvis, R.; Moses, P. Smart grid congestion caused by plug-in electric vehicle charging. In Proceedings of the 2019 IEEE Texas Power and Energy Conference (TPEC), College Station, TX, USA, 7–8 February 2019; IEEE: Piscataway, NJ, USA; pp. 1–5. [Google Scholar]
  23. Ireshika, M.; Lliuyacc-Blas, R.; Kepplinger, P. Voltage-Based Droop Control of Electric Vehicles in Distribution Grids under Different Charging Power Levels. Energies 2021, 14, 3905. [Google Scholar] [CrossRef]
  24. Nunna, H.; Battula, S.; Doolla, S.; Srinivasan, D. Energy management in smart distribution systems with vehicle-to-grid integrated microgrids. IEEE Trans. Smart Grid 2016, 9, 4004–4016. [Google Scholar] [CrossRef]
  25. García-Villalobos, J.; Zamora, I.; Martín, J.S.; Asensio, F.; Aperribay, V. Plug-in electric vehicles in electric distribution networks: A review of smart charging approaches. Renew. Sustain. Energy Rev. 2014, 38, 717–731. [Google Scholar] [CrossRef]
  26. Moreira, R.; Ollagnier, L.; Papadaskalopoulos, D.; Strbac, G. Optimal multi-service business models for electric vehicles. In Proceedings of the 2017 IEEE Manchester PowerTech, Manchester, UK, 18–22 June 2017; IEEE: Piscataway, NJ, USA; pp. 1–6. [Google Scholar]
  27. Saber, A.; Venayagamoorthy, G. Intelligent unit commitment with vehicle-to-grid—A cost-emission optimization. J. Power Sources 2010, 195, 898–911. [Google Scholar] [CrossRef]
  28. Ma, Y.; Houghton, T.; Cruden, A.; Infield, D. Modeling the benefits of vehicle-to-grid technology to a power system. IEEE Trans. Power Syst. 2012, 27, 1012–1020. [Google Scholar] [CrossRef]
  29. Andersson, S.; Elofsson, A.; Galus, M.; Göransson, L.; Karlsson, S.; Johnsson, F.; Andersson, G. Plug-in hybrid electric vehicles as regulating power providers: Case studies of Sweden and Germany. Energy Policy 2010, 38, 2751–2762. [Google Scholar] [CrossRef]
  30. López, M.; De La Torre, S.; Martín, S.; Aguado, J. Demand-side management in smart grid operation considering electric vehicles load shifting and vehicle-to-grid support. Int. J. Electr. Power Energy Syst. 2015, 64, 689–698. [Google Scholar] [CrossRef]
  31. Calearo, L.; Thingvad, A.; Ipsen, H.; Marinelli, M. Economic value and user remuneration for ev based distribution grid services. In Proceedings of the 2019 IEEE PES Innovative Smart Grid Technologies Europe (ISGT-Europe), Bucharest, Romania, 29 September–2 October 2019; IEEE: Piscataway, NJ, USA; pp. 1–5. [Google Scholar]
  32. Zecchino, A.; Prostejovsky, A.; Ziras, C.; Marinelli, M. Large-scale provision of frequency control via V2G: The Bornholm power system case. Electr. Power Syst. Res. 2019, 170, 25–34. [Google Scholar] [CrossRef]
  33. Ortega-Vazquez, M. Optimal scheduling of electric vehicle charging and vehicle-to-grid services at household level including battery degradation and price uncertainty. IET Gener. Transm. Distrib. 2014, 8, 1007–1016. [Google Scholar] [CrossRef]
  34. Uddin, K.; Jackson, T.; Widanage, W.; Chouchelamane, G.; Jennings, P.; Marco, J. On the possibility of extending the lifetime of lithium-ion batteries through optimal V2G facilitated by an integrated vehicle and smart-grid system. Energy 2017, 133, 710–722. [Google Scholar] [CrossRef]
  35. Farzin, H.; Fotuhi-Firuzabad, M.; Moeini-Aghtaie, M. A practical scheme to involve degradation cost of lithium-ion batteries in vehicle-to-grid applications. IEEE Trans. Sustain. Energy 2016, 7, 1730–1738. [Google Scholar] [CrossRef]
  36. Rohr, S.; Wagner, S.; Baumann, M.; Müller, S.; Lienkamp, M. A techno-economic analysis of end of life value chains for lithium-ion batteries from electric vehicles. In Proceedings of the 2017 Twelfth International Conference on Ecological Vehicles and Renewable Energies (EVER), Monte Carlo, Monaco, 11–13 April 2017; IEEE: Piscataway, NJ, USA; pp. 1–14. [Google Scholar]
  37. Marongiu, A.; Roscher, M.; Sauer, D. Influence of the vehicle-to-grid strategy on the aging behavior of lithium battery electric vehicles. Appl. Energy 2015, 137, 899–912. [Google Scholar] [CrossRef]
  38. Petit, M.; Prada, E.; Sauvant-Moynot, V. Development of an empirical aging model for Li-ion batteries and application to assess the impact of Vehicle-to-Grid strategies on battery lifetime. Appl. Energy 2016, 172, 398–407. [Google Scholar] [CrossRef]
  39. Bashash, S.; Moura, S.; Forman, J.; Fathy, H. Plug-in hybrid electric vehicle charge pattern optimization for energy cost and battery longevity. J. Power Sources 2011, 196, 541–549. [Google Scholar] [CrossRef]
  40. Quinn, C.; Zimmerle, D.; Bradley, T. An evaluation of state-of-charge limitations and actuation signal energy content on plug-in hybrid electric vehicle, vehicle-to-grid reliability, and economics. IEEE Trans. Smart Grid 2012, 3, 483–491. [Google Scholar] [CrossRef]
  41. Guille, C.; Gross, G. A conceptual framework for the vehicle-to-grid (V2G) implementation. Energy Policy 2009, 37, 4379–4390. [Google Scholar] [CrossRef]
  42. Amjad, S.; Rudramoorthy, R.; Neelakrishnan, S.; Varman, K.; Arjunan, T. Evaluation of energy requirements for all-electric range of plug in hybrid electric two-wheeler. Energy 2011, 36, 1623–1629. [Google Scholar] [CrossRef]
  43. Beer, S.; Gómez, T.; Dallinger, D.; Momber, I.; Marnay, C.; Stadler, M.; Lai, J. An economic analysis of used electric vehicle batteries integrated into commercial building microgrids. IEEE Trans. Smart Grid 2012, 3, 517–525. [Google Scholar] [CrossRef]
  44. Zhang, X.; Sun, Y.; Duan, Q.; Huang, Y. The charging load model of electric vehicle based on cloud model. In Proceedings of the 2016 11th International Conference on Computer Science & Education (ICCSE), Nagoya, Japan, 23–25 August 2016; IEEE: Piscataway, NJ, USA; pp. 415–418. [Google Scholar]
  45. Jinil, N.; Reka, S. Deep learning method to predict electric vehicle power requirements and optimizing power distribution. In Proceedings of the 2019 Fifth International Conference on Electrical Energy Systems (ICEES), Chennai, India, 21–22 February 2019; IEEE: Piscataway, NJ, USA; pp. 1–5. [Google Scholar]
  46. Chen, F.; Chen, Z.; Dong, H.; Yin, Z.; Wang, Y.; Liu, J. Research on the influence of electric vehicle multi-factor charging load on a regional power grid. In Proceedings of the 2018 10th International Conference on Measuring Technology and Mechatronics Automation (ICMTMA), Changsha, China, 10–11 February 2018; IEEE: Piscataway, NJ, USA; pp. 163–166. [Google Scholar]
  47. Chaudhari, K.; Kandasamy, N.; Krishnan, A.; Ukil, A.; Gooi, H. Agent-based aggregated behavior modeling for electric vehicle charging load. IEEE Trans. Ind. Inform. 2018, 15, 856–868. [Google Scholar] [CrossRef]
  48. Zhang, L.; Li, Y. Optimal management for parking-lot electric vehicle charging by two-stage approximate dynamic programming. IEEE Trans. Smart Grid 2015, 8, 1722–1730. [Google Scholar] [CrossRef]
  49. Sarrafan, K.; Sutanto, D.; Muttaqi, K.; Town, G. Accurate range estimation for an electric vehicle including changing environmental conditions and traction system efficiency. IET Electr. Syst. Transp. 2017, 7, 117–124. [Google Scholar] [CrossRef]
  50. Wang, H.; Wang, B.; Fang, C.; Liu, W.; Huang, H. Bidding strategy research for aggregator of electric vehicles based on clustering characteristics. In Proceedings of the 2019 Chinese Control And Decision Conference (CCDC), Nanchang, China, 3–5 June 2019; IEEE: Piscataway, NJ, USA; pp. 6150–6156. [Google Scholar]
  51. Şengör, İ.; Çiçek, A.; Erenoğlu, A.; Erdinç, O.; Taşcikaraoğlu, A.; Catalão, J. User-comfort oriented bidding strategy for electric vehicle parking lots. In Proceedings of the 2019 IEEE Milan PowerTech, Milan, Italy, 23–27 June 2019; IEEE: Piscataway, NJ, USA; pp. 1–6. [Google Scholar]
  52. Yang, J.; Fei, F.; Xiao, M.; Pang, A.; Zeng, Z.; Lv, L.; Gao, C. A noval bidding strategy of electric vehicles participation in ancillary service market. In Proceedings of the 4th International Conference on Systems and Informatics (ICSAI), Hangzhou, China, 11–13 November 2017; pp. 306–311. [Google Scholar]
  53. Herre, L.; Dalton, J.; Soder, L. Optimal day-ahead energy and reserve bidding strategy of a risk-averse electric vehicle aggregator in the nordic market. In Proceedings of the IEEE Milan PowerTech, Milan, Italy, 23–27 June 2019; pp. 1–6. [Google Scholar]
  54. Rassaei, F.; Soh, W.; Chua, K. Distributed scalable autonomous market-based demand response via residential plug-in electric vehicles in smart grids. IEEE Trans. Smart Grid 2016, 9, 3281–3290. [Google Scholar] [CrossRef]
  55. Alotaibi, M.; Eltamaly, A. Upgrading Conventional Power System for Accommodating Electric Vehicle through Demand Side Management and V2G Concepts. Energies 2022, 15, 6541. [Google Scholar] [CrossRef]
  56. Eltamaly, A. A novel energy storage and demand side management for entire green smart grid system for NEOM city in Saudi Arabia. Energy Storage 2023, e515. [Google Scholar] [CrossRef]
  57. Han, S.; Han, S.; Aki, H. A practical battery wear model for electric vehicle charging applications. Appl. Energy 2014, 113, 1100–1108. [Google Scholar] [CrossRef]
  58. Zhang, Y.; Yi, X.; Fu, H.; Wang, X.; Gao, C.; Zhou, J.; Rao, A.M.; Lu, B. Reticular Elastic Solid Electrolyte Interface Enabled by an Industrial Dye for Ultrastable Potassium-Ion Batteries. Small Struct. 2023, 2300232. [Google Scholar] [CrossRef]
  59. Eltamaly, A.M. An Accurate Piecewise Aging Model for Li-ion Batteries in Hybrid Renewable Energy System Applications. Arab. J. Sci. Eng. 2023, in press. [Google Scholar] [CrossRef]
  60. Venkatapathy, K.; Tazelaar, E.; Veenhuizen, B. A systematic identification of first to second life shift-point of lithium-ion batteries. In Proceedings of the 2015 IEEE Vehicle Power and Propulsion Conference (VPPC), Montreal, QC, Canada, 19–22 October 2015; IEEE: Piscataway, NJ, USA; pp. 1–4. [Google Scholar]
  61. Condon, F.; Martínez, J.M.; Eltamaly, A.M.; Kim, Y.C.; Ahmed, M.A. Design and implementation of a cloud-IoT-based home energy management system. Sensors 2023, 23(, 176. [Google Scholar] [CrossRef] [PubMed]
  62. Data on Cars Used for Testing Fuel Economy. Available online: https://www.epa.gov/compliance-and-fuel-economy-data/datacars-used-testing-fuel-economy (accessed on 10 November 2022).
  63. Lotze, C.; Marszal, P.; Schröder, M.; Timme, M. Dynamic stop pooling for flexible and sustainable ride sharing. New J. Phys. 2022, 24, 023034. [Google Scholar] [CrossRef]
  64. Hartmann, N.; Özdemir, E. Impact of different utilization scenarios of electric vehicles on the German grid in 2030. J. Power Sources 2011, 196, 2311–2318. [Google Scholar] [CrossRef]
  65. Weiller, C. Plug-in hybrid electric vehicle impacts on hourly electricity demand in the United States. Energy Policy 2011, 39, 3766–3778. [Google Scholar] [CrossRef]
  66. Almutairi, Z.A.; Eltamaly, A.M.; El Khereiji, A.; Al Nassar, A.; Al Rished, A.; Al Saheel, N.; Al Marqabi, A.; Al Hamad, S.; Al Harbi, M.; Sherif, R.; et al. Modeling and Experimental Determination of Lithium-Ion Battery Degradation in Hot Environment. In Proceedings of the 2022 23rd International Middle East Power Systems Conference (MEPCON), Cairo, Egypt, 13–15 December 2022; pp. 1–8. [Google Scholar]
  67. Zhu, L.; He, J.; He, L.; Huang, W.; Wang, Y.; Liu, Z. Optimal Operation Strategy Of PV-Charging-Hydrogenation Composite Energy Station Considering Demand Response. Energies 2022, 15, 5915. [Google Scholar] [CrossRef]
  68. Neubauer, J.; Pesaran, A.; Williams, B.; Ferry, M.; Eyer, J. A Techno-Economic Analysis of PEV Battery Second Use: Repurposed-Battery Selling Price and Commercial and Industrial End-User Value, (Vol. 1, No. NREL/CP-5400-53799); National Renewable Energy Lab. (NREL): Golden, CO, USA, 2012. [Google Scholar]
  69. Eltamaly, A.M. A novel musical chairs algorithm applied for MPPT of PV systems. Renew. Sustain. Energy Rev. 2021, 146, 111135. [Google Scholar] [CrossRef]
  70. Eltamaly, A. Musical chairs algorithm for parameters estimation of PV cells. Sol. Energy 2022, 241, 601–620. [Google Scholar] [CrossRef]
  71. Eltamaly, A.M. An Improved Cuckoo Search Algorithm for Maximum Power Point Tracking of Photovoltaic Systems under Partial Shading Conditions. Energies 2021, 14, 953. [Google Scholar] [CrossRef]
  72. Yang, X.S.; Deb, S. Cuckoo search via lévy flights. In Proceedings of the 2009 World Congress on Nature & Biologically Inspired Computing (NaBIC), Coimbatore, India, 9–11 December 2009; pp. 210–214. [Google Scholar]
  73. Hu, Z.; Liu, S.; Luo, W.; Wu, L. Intrusion-detector-dependent distributed economic model predictive control for load frequency regulation with PEVs under cyber attacks. IEEE Trans. Circuits Syst. I Regul. Pap. 2021, 68, 3857–3868. [Google Scholar] [CrossRef]
Figure 1. The ACC along with DoD for LIB used in this study.
Energies 16 08112 g001
Figure 2. The daily driving distance distribution of the EV for a full year of operation.
Energies 16 08112 g002
Figure 3. The flag for each operating condition of the EV battery (red is trip period, blue is plug-in period).
Energies 16 08112 g003
Figure 4. The charging/discharging schedules of different technologies under study.
Energies 16 08112 g004
Figure 5. This art of the musical chairs game shows 3 players and two chairs as an example.
Energies 16 08112 g005
Figure 6. The MCA with V2G technology flowchart.
Energies 16 08112 g006
Figure 7. The block diagram of the simulation program used to implement the proposed strategy.
Energies 16 08112 g007
Figure 8. The dispatch probability during day hours for a complete year along with the tariff (USD/kWh) for unregulated charge technology.
Energies 16 08112 g008
Figure 9. The dispatch probability during day hours for a complete year along with the tariff (USD/kWh) for G2V technology.
Energies 16 08112 g009
Figure 10. The dispatch probability during day hours for a complete year along with the tariff (USD/kWh) for V2G technology.
Energies 16 08112 g010
Figure 11. The charging and wear cost contributions in the total cost of the UC, G2V, and V2G technologies.
Energies 16 08112 g011
Figure 12. The effect of changing the difference between the high and low tariffs on different dispatch technologies used with the EVA.
Energies 16 08112 g012
Figure 13. The effect of changing the EV battery on different dispatch technologies used with the EVA.
Energies 16 08112 g013
Disclaimer/Publisher’s Note: The statements, opinions and data contained in all publications are solely those of the individual author(s) and contributor(s) and not of MDPI and/or the editor(s). MDPI and/or the editor(s) disclaim responsibility for any injury to people or property resulting from any ideas, methods, instructions or products referred to in the content.