Article

Comparative Analysis and Optimal Operation of an On-Grid and Off-Grid Solar Photovoltaic-Based Electric Vehicle Charging Station

1
Faculty of Engineering, University of New Brunswick, 15 Dineen Drive, Fredericton, NB E3B 5A3, Canada
2
Faculty of Electrical Engineering, Bialystok University of Technology, ul. Wiejska 45D, 15-351 Bialystok, Poland
3
Department of Electrical, Computer and Biomedical Engineering, Toronto Metropolitan University, 350 Victoria St., Toronto, ON M5B 2K3, Canada
*
Author to whom correspondence should be addressed.
Energies 2023, 16(24), 8086; https://doi.org/10.3390/en16248086
Submission received: 4 November 2023 / Revised: 5 December 2023 / Accepted: 14 December 2023 / Published: 15 December 2023
(This article belongs to the Section E: Electric Vehicles)

Abstract

:
One of the key strategies for decarbonization and green transportation is using electric vehicles (EVs). However, challenges like limited charging infrastructure, EV battery characteristics, and grid integration complexities persist. This study proposes a mixed-integer linear programming (MILP) approach to optimize a grid-connected solar PV-based commercial EV charging station (SPEVCS) with a battery energy storage system (BESS) for profit maximization. The MILP model efficiently manages SPEVCS operations, considering solar power fluctuations, EV charging patterns, and BESS usage. By coordinating charging schedules, grid stability is reinforced, and excess solar power can be lucratively managed. Comparing grid-connected and off-grid SPEVCS scenarios highlights grid integration benefits. Solar power mismatches with optimal charging periods pose a challenge, addressed here by BESS utilization and import/export of deficit/surplus power from/to the grid. The proposed framework incorporates solar power forecasts and probabilistic EV arrival predictions, enhancing decision accuracy. This approach fosters viable commercial EV charging, promotes green transportation, and reinforces grid resilience.

1. Introduction

Renewable energy (RE) sources show significant promise as a viable substitute for fossil-fueled energy, resulting in a continuous global increase in their share. Among these sources, solar photovoltaic (PV) technology continues to see significant growth. According to ref. [1], the manufacturing costs of solar panels have decreased considerably, making them the most economical and accessible form of electricity. Over a decade from 2010 to 2020, the prices of solar modules plummeted by up to 93%, and simultaneously, the global weighted-average levelized cost of electricity (LCOE) associated with solar modules dropped by 85% [1].
In addition to the escalating adoption of RE sources, there are concerted efforts to maximize the use of electric vehicles (EVs), as they are among the most efficient and eco-friendly forms of transportation. The European Commission has set ambitious targets, aiming for a 55% reduction in emissions from passenger cars and a 50% reduction from vans by 2030, with a goal of achieving zero emissions in new passenger cars by 2035 [2]. However, EVs face challenges related to batteries, including slow charging times, replacement costs, limited driving range, and other constraints [3,4]. The insufficient and inconvenient access to EV charging infrastructure further hampers their widespread use [5,6]. Due to a scarcity of suitable charging facilities in public spaces, most EVs are charged at home. As per ref. [7], private charging infrastructure will suffice for those countries with high availability of garages; however, for countries with low garage availability, public charging infrastructure is required, and, to enable long-distance travel, such infrastructures must be facilitated along the routes.
To lessen the electrical load burden on the main electrical distribution network due to the penetration of EVs and prevent grid instability, a solar PV-based EV charging facility would be a viable option. A SPEVCS will allow a well-scheduled charging routine so that the frequent effect on the network grid caused by the stochastic nature of the EV charging pattern is reduced. Additionally, the surplus power injected into the grid from the SPEVCS benefits the distribution system and the local energy market by reducing grid demand, aiding in voltage regulations, supporting RE goals, and facilitating energy independence, amongst others.
The EV charging standards are categorized into three distinct tiers according to their speed and power characteristics. These categorizations have been established and ratified by the Electric Power Research Institute (EPRI) and the Society of Automotive Engineers (SAE), denoting them as AC Level 1, AC Level 2, and AC Level 3 (DC Fast Charging) [8,9]. While Level 1 is the slowest and is generally used for domestic purposes, Level 2 and Level 3 are used for public commercial purposes [10]. As per ref. [11], accessible public fast charging options can reduce anxiety related to range coverage and thereby encourage the use of EVs. They conclude that the majority of the charging events, ranging from 50% to 80%, occur at home. From 15% to 20%, charging events take place at the workplace and only a small fraction of approximately 5% takes place at public charging locations. The EV charging fee varies locally, and it depends on several factors, including the type of charging station (CS), location, and prevailing electricity prices in the market.
With regard to the current study, similar works have been carried out in refs. [12,13]. In ref. [12], the authors have proposed an optimization procedure where the profit from a PV-based CS is maximized considering the vehicle arrival pattern. However, the fundamental difference between their method and the method proposed in this paper is the nature of the linkage between the SPEVCS and the grid. An energy storage system (ESS) is considered in their papers; however, the SPEVCS sells power only to the EV, and therefore, the revenue generation is only due to the charging of the EV. However, in this paper, the power flow is considered bi-directional, which enables the SPEVCS to either sell or buy electricity from the power grid based on the status of the solar power and the EV load. In ref. [13], the objective is to minimize the electricity cost of the parking lot of the EVs instead of directly optimizing the profit based on revenue generation. Additionally, the operational costs of the SPEVCS and battery energy storage system (BESS) have not been considered.
While solar-powered CS provides a convenient solution for EVs, there exists a contrasting characteristic between the two. EVs are typically charged during the night when solar power generation is at its minimum. As per ref. [14], EV owners usually tend to charge EVs for between 18 h and 6 h rather than daytime. Public CSs are usually preferred during the day, and private CSs are preferred during the night. The study’s analysis shows that for both private and public CSs, the peak is usually 18 h to 21 h. Therefore, a BESS is used to effectively support the operation of a PV-based CS. During midday, when the solar power is at its highest and the EV load is low, the surplus energy forwarded and stored in the battery to be used during the low solar power period. However, in the case of substantially higher solar PV generation, with BESS energy at its desired state-of-charge (SoC), the surplus energy is exported to the grid.
Further, ref. [15] considers profit maximization, assuming the flexible price of energy. In this case, the cost of charging and discharging depends on the SoC of the BESS. However, the authors do not consider the depth-of-discharge (DoD) of the ESS and the sale of electricity to the grid when solar PV generation is substantially high. Ref. [16] takes into account a specific combined admission and pricing procedure for EVs, where profit maximization is based on the EV arrival and queuing activities. However, they do not consider any renewable energy sources for EV charging. Additionally, in ref. [6], profit maximization is carried out from the operator’s perspective by considering the optimal investment in the CS equipment.
In this study, we considered different stochastic factors in the operation of the CS. The EV arrival probability, which is the load demand probability, along with the solar PV forecast were taken into consideration, and then we implemented a mixed-integer linear programming (MILP) method to determine the best solution. The primary advantage of using MILP is its capability to handle complex optimization problems with a mix of discrete and continuous variables within a single framework. We considered a grid-connected SPEVCS that prioritizes addressing the mismatch between the solar PV and EV charging characteristics.
A flowchart explaining the methodology used in this work is shown in Figure 1.
The proposed formulation takes into account the intermittent characteristics of both solar power and the load demand (EVs). For such cases, one of the strategies is to purchase power from the grid to supply to the SPEVCS in the case of deficit power and to sell it to the grid when surplus power is available in the SPEVCS.
The case study was based in Poland, a region that experiences comparatively reduced solar energy intake in contrast to many other regions. Therefore, the proposed algorithm’s performance was evaluated under representative energy conditions, featuring moderate solar radiation intensity from 100 to 600 W/m2 and accounting for potential variations across periods and seasons. This translates to operational circumstances where the PV panels, a pivotal component of the system, function at approximately 20% to 40% below their rated specifications. These chosen criteria subject the CS to demanding operating scenarios due to the lower efficiency of acquiring solar energy.

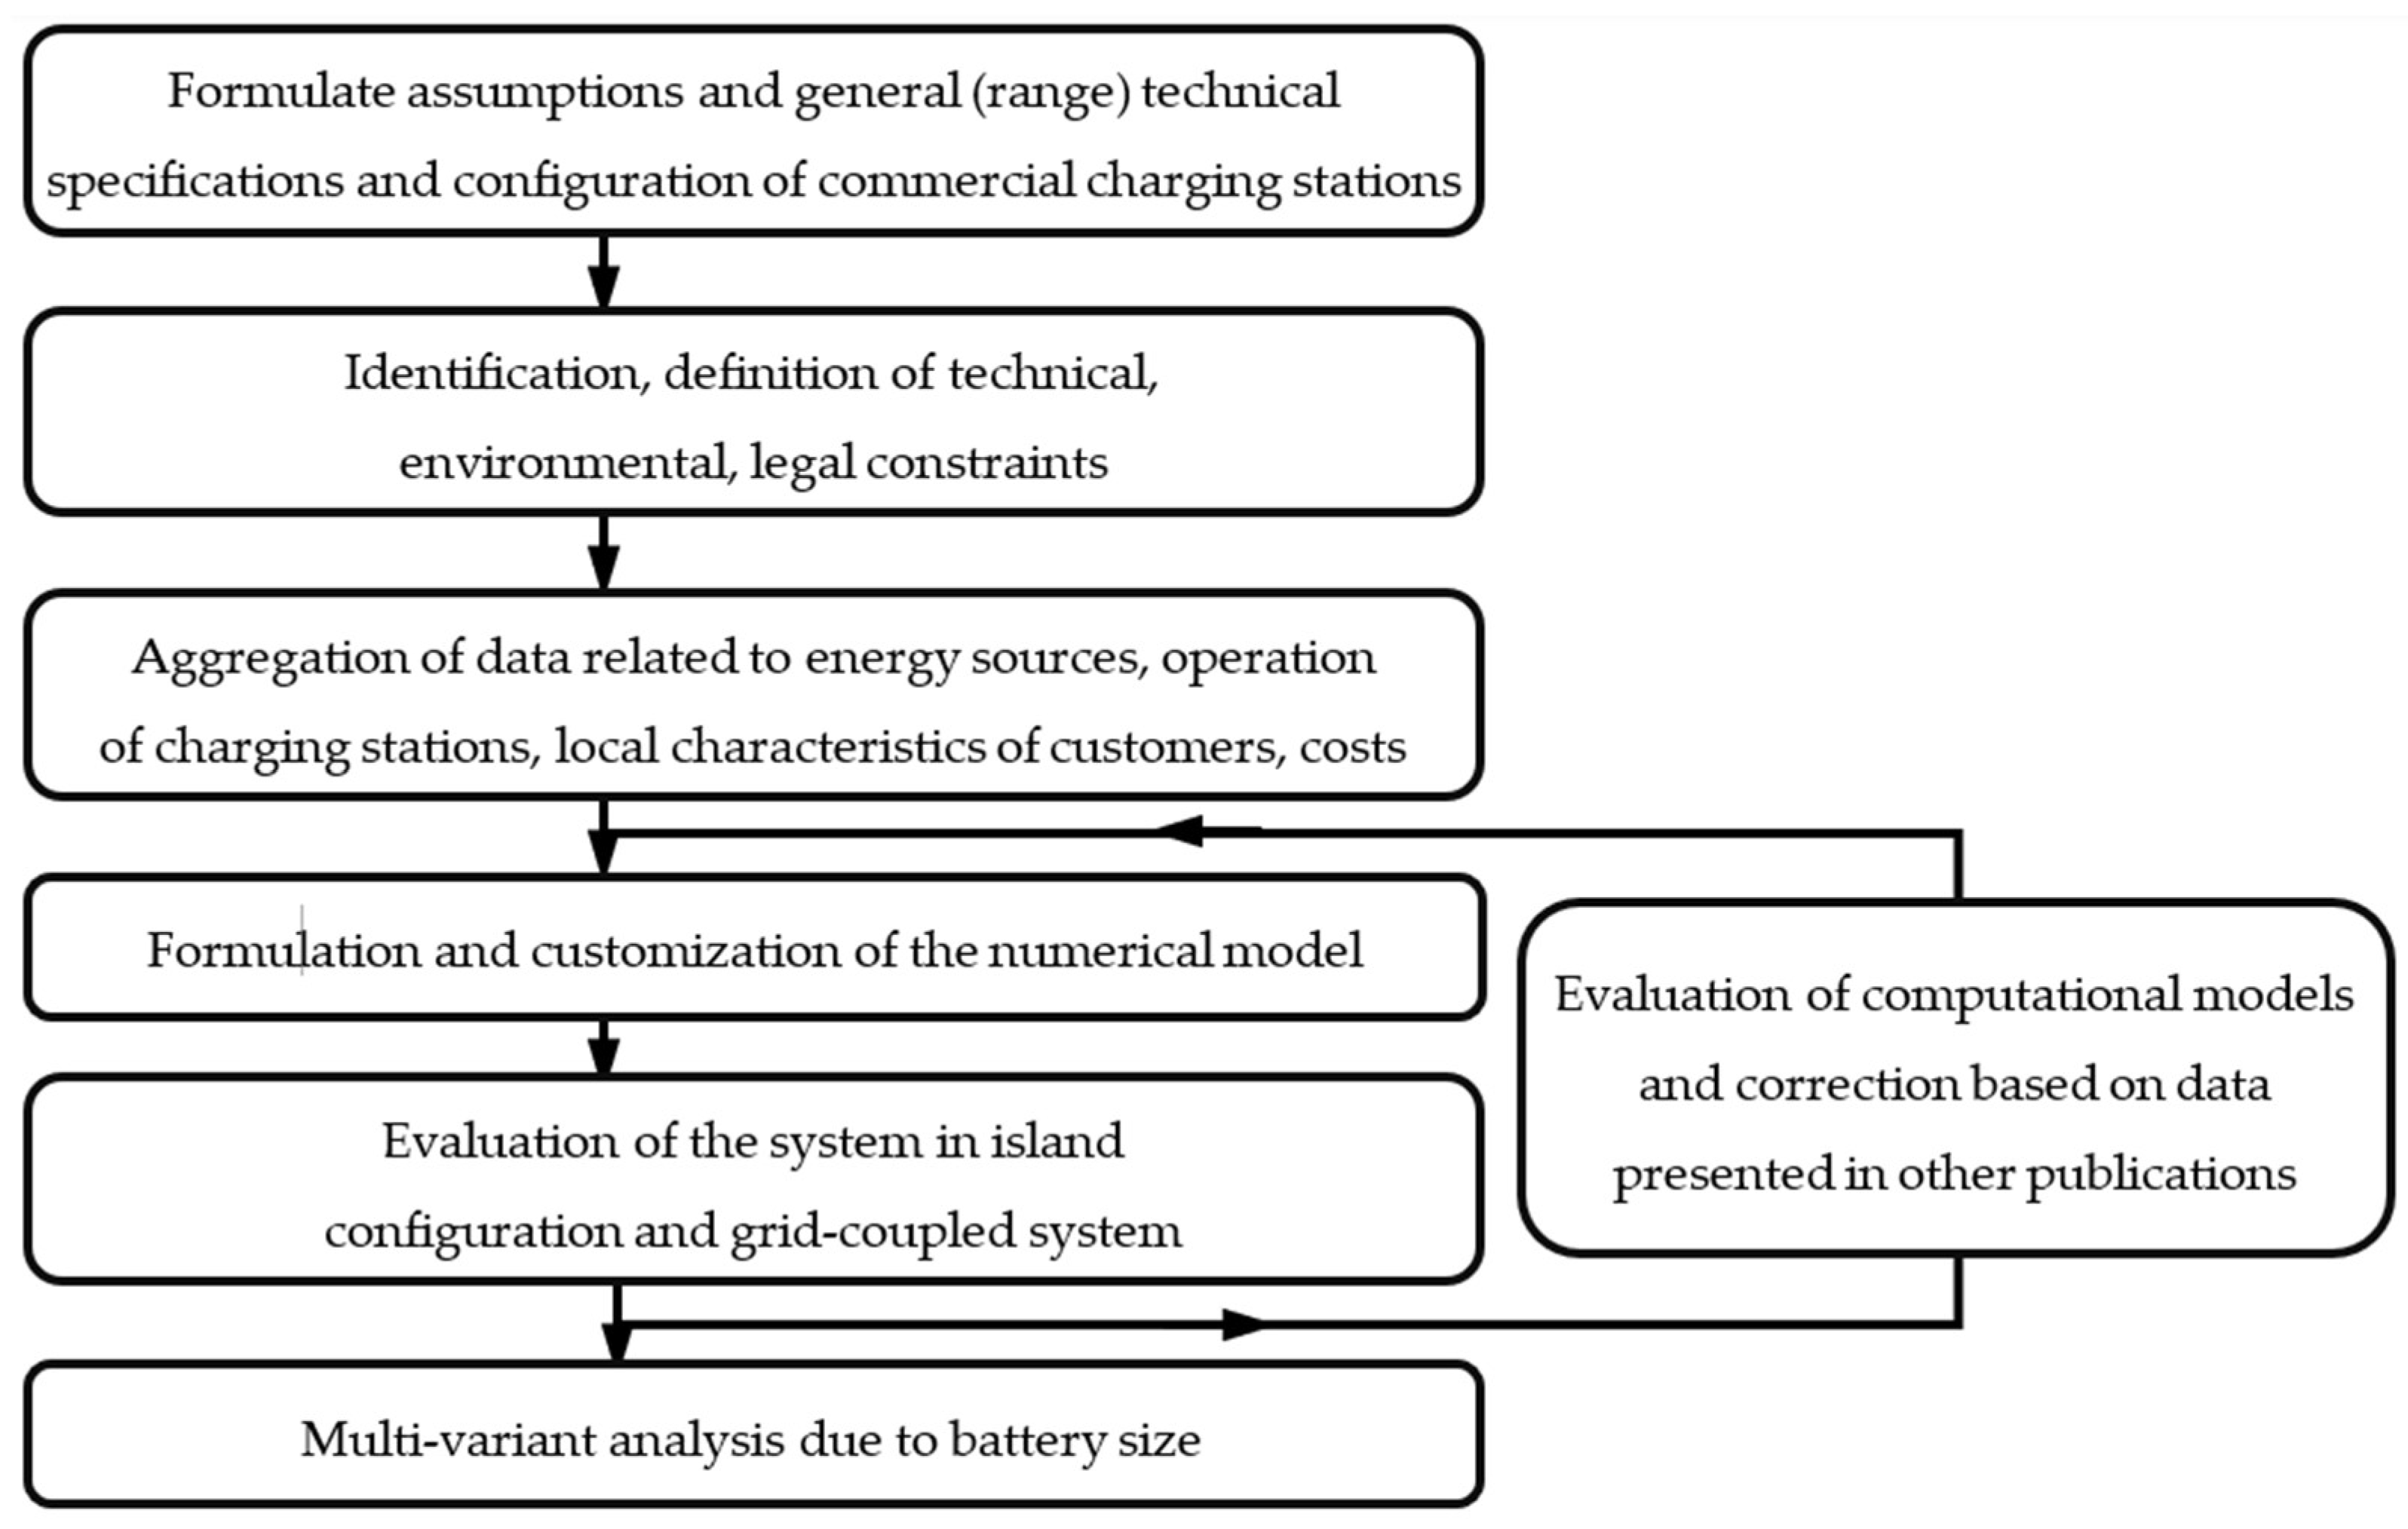
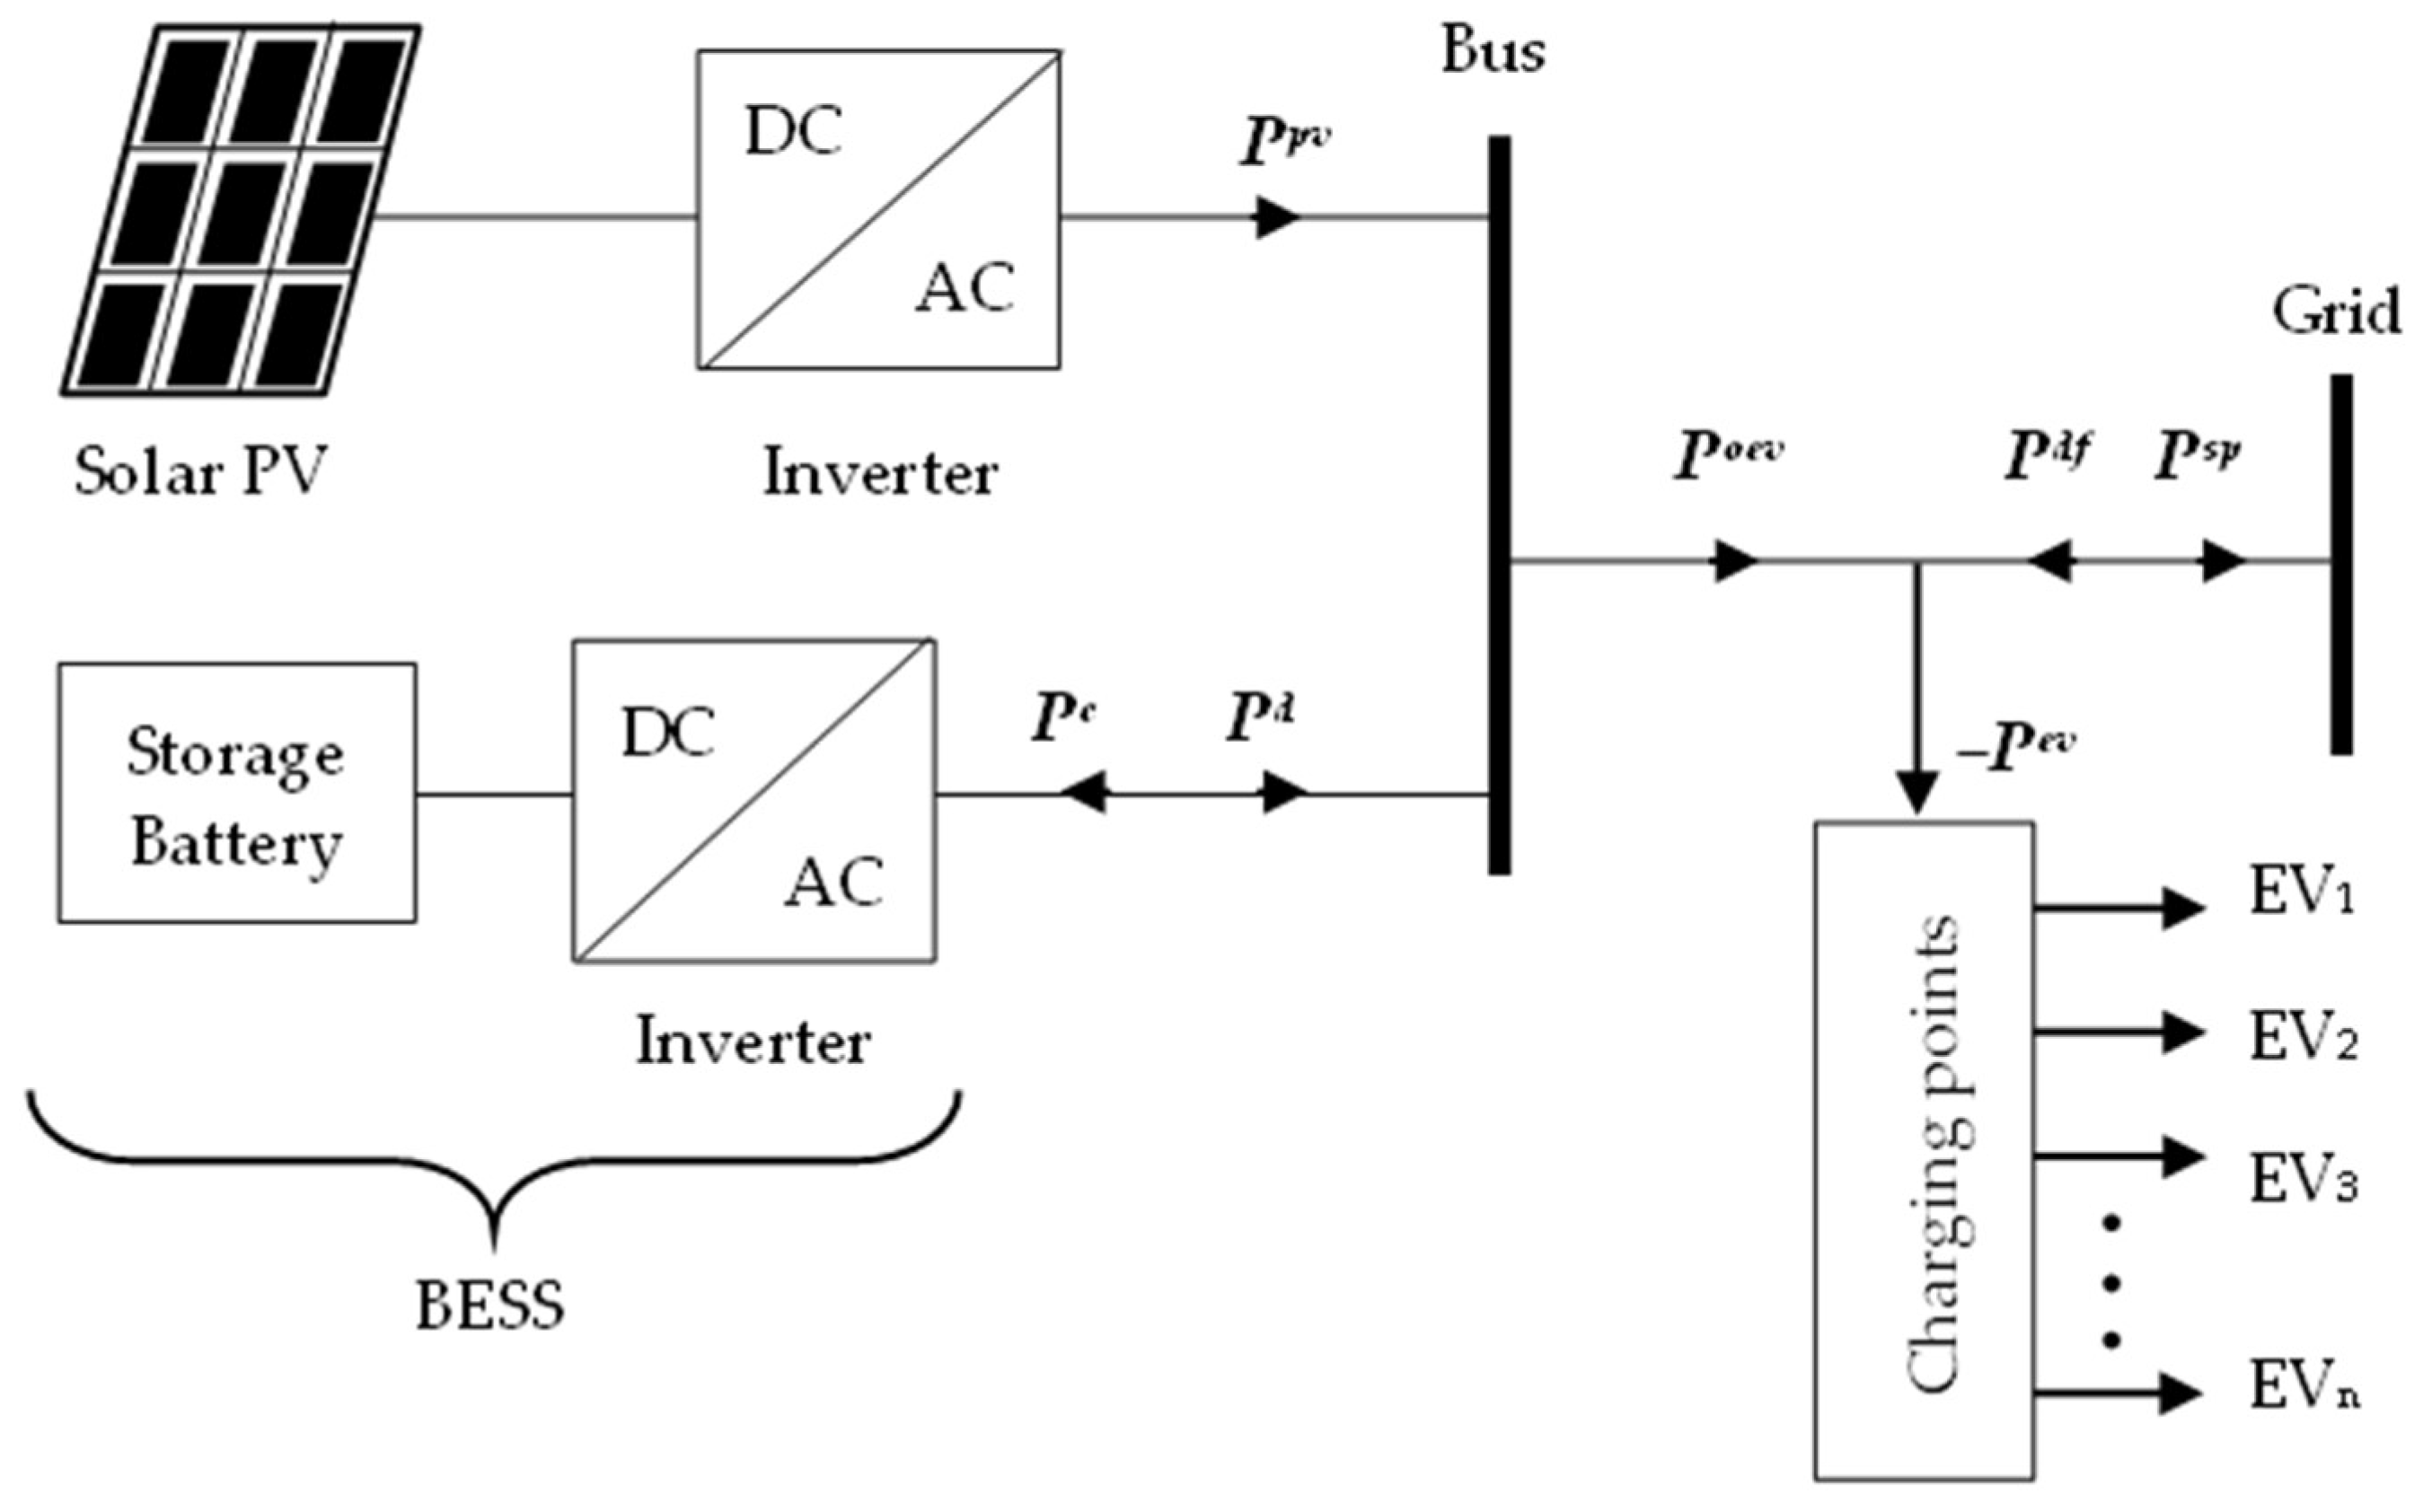
2. SPEVCS Model and Formulation

The solar PV system along with the BESS and the grid collectively supply power to the EV load. The layout diagram is shown in Figure 2. The grid serves a dual role: (i) supply deficit power, denoted as P d f , to the SPEVCS during insufficient power and (ii) purchase power from the SPEVCS when surplus power, denoted as P s p , is available.

2.1. Revenue and EV Charging Modality

The proposed formulation considers the 24 h day-ahead data at the SPEVCS which includes the solar power forecast and the EV arrival probability at the CS. The net profit for the 24 h period, denoted as NT, is considered. For simplicity, a single charging rate α for the EV is considered instead of considering two separate price tariffs (based on peak and off-peak charging periods). The sources of revenue are charging the EVs and exporting the surplus energy to the grid. The priority is to charge the EVs as the price of charging EVs is higher than the price for selling the surplus energy to the grid (β). Therefore, the net revenue is the combined revenues from charging the EV R e v , sale of electricity to the grid R g r 1 and the sale of energy purchased from the grid and sold to the EV R g r 2 .

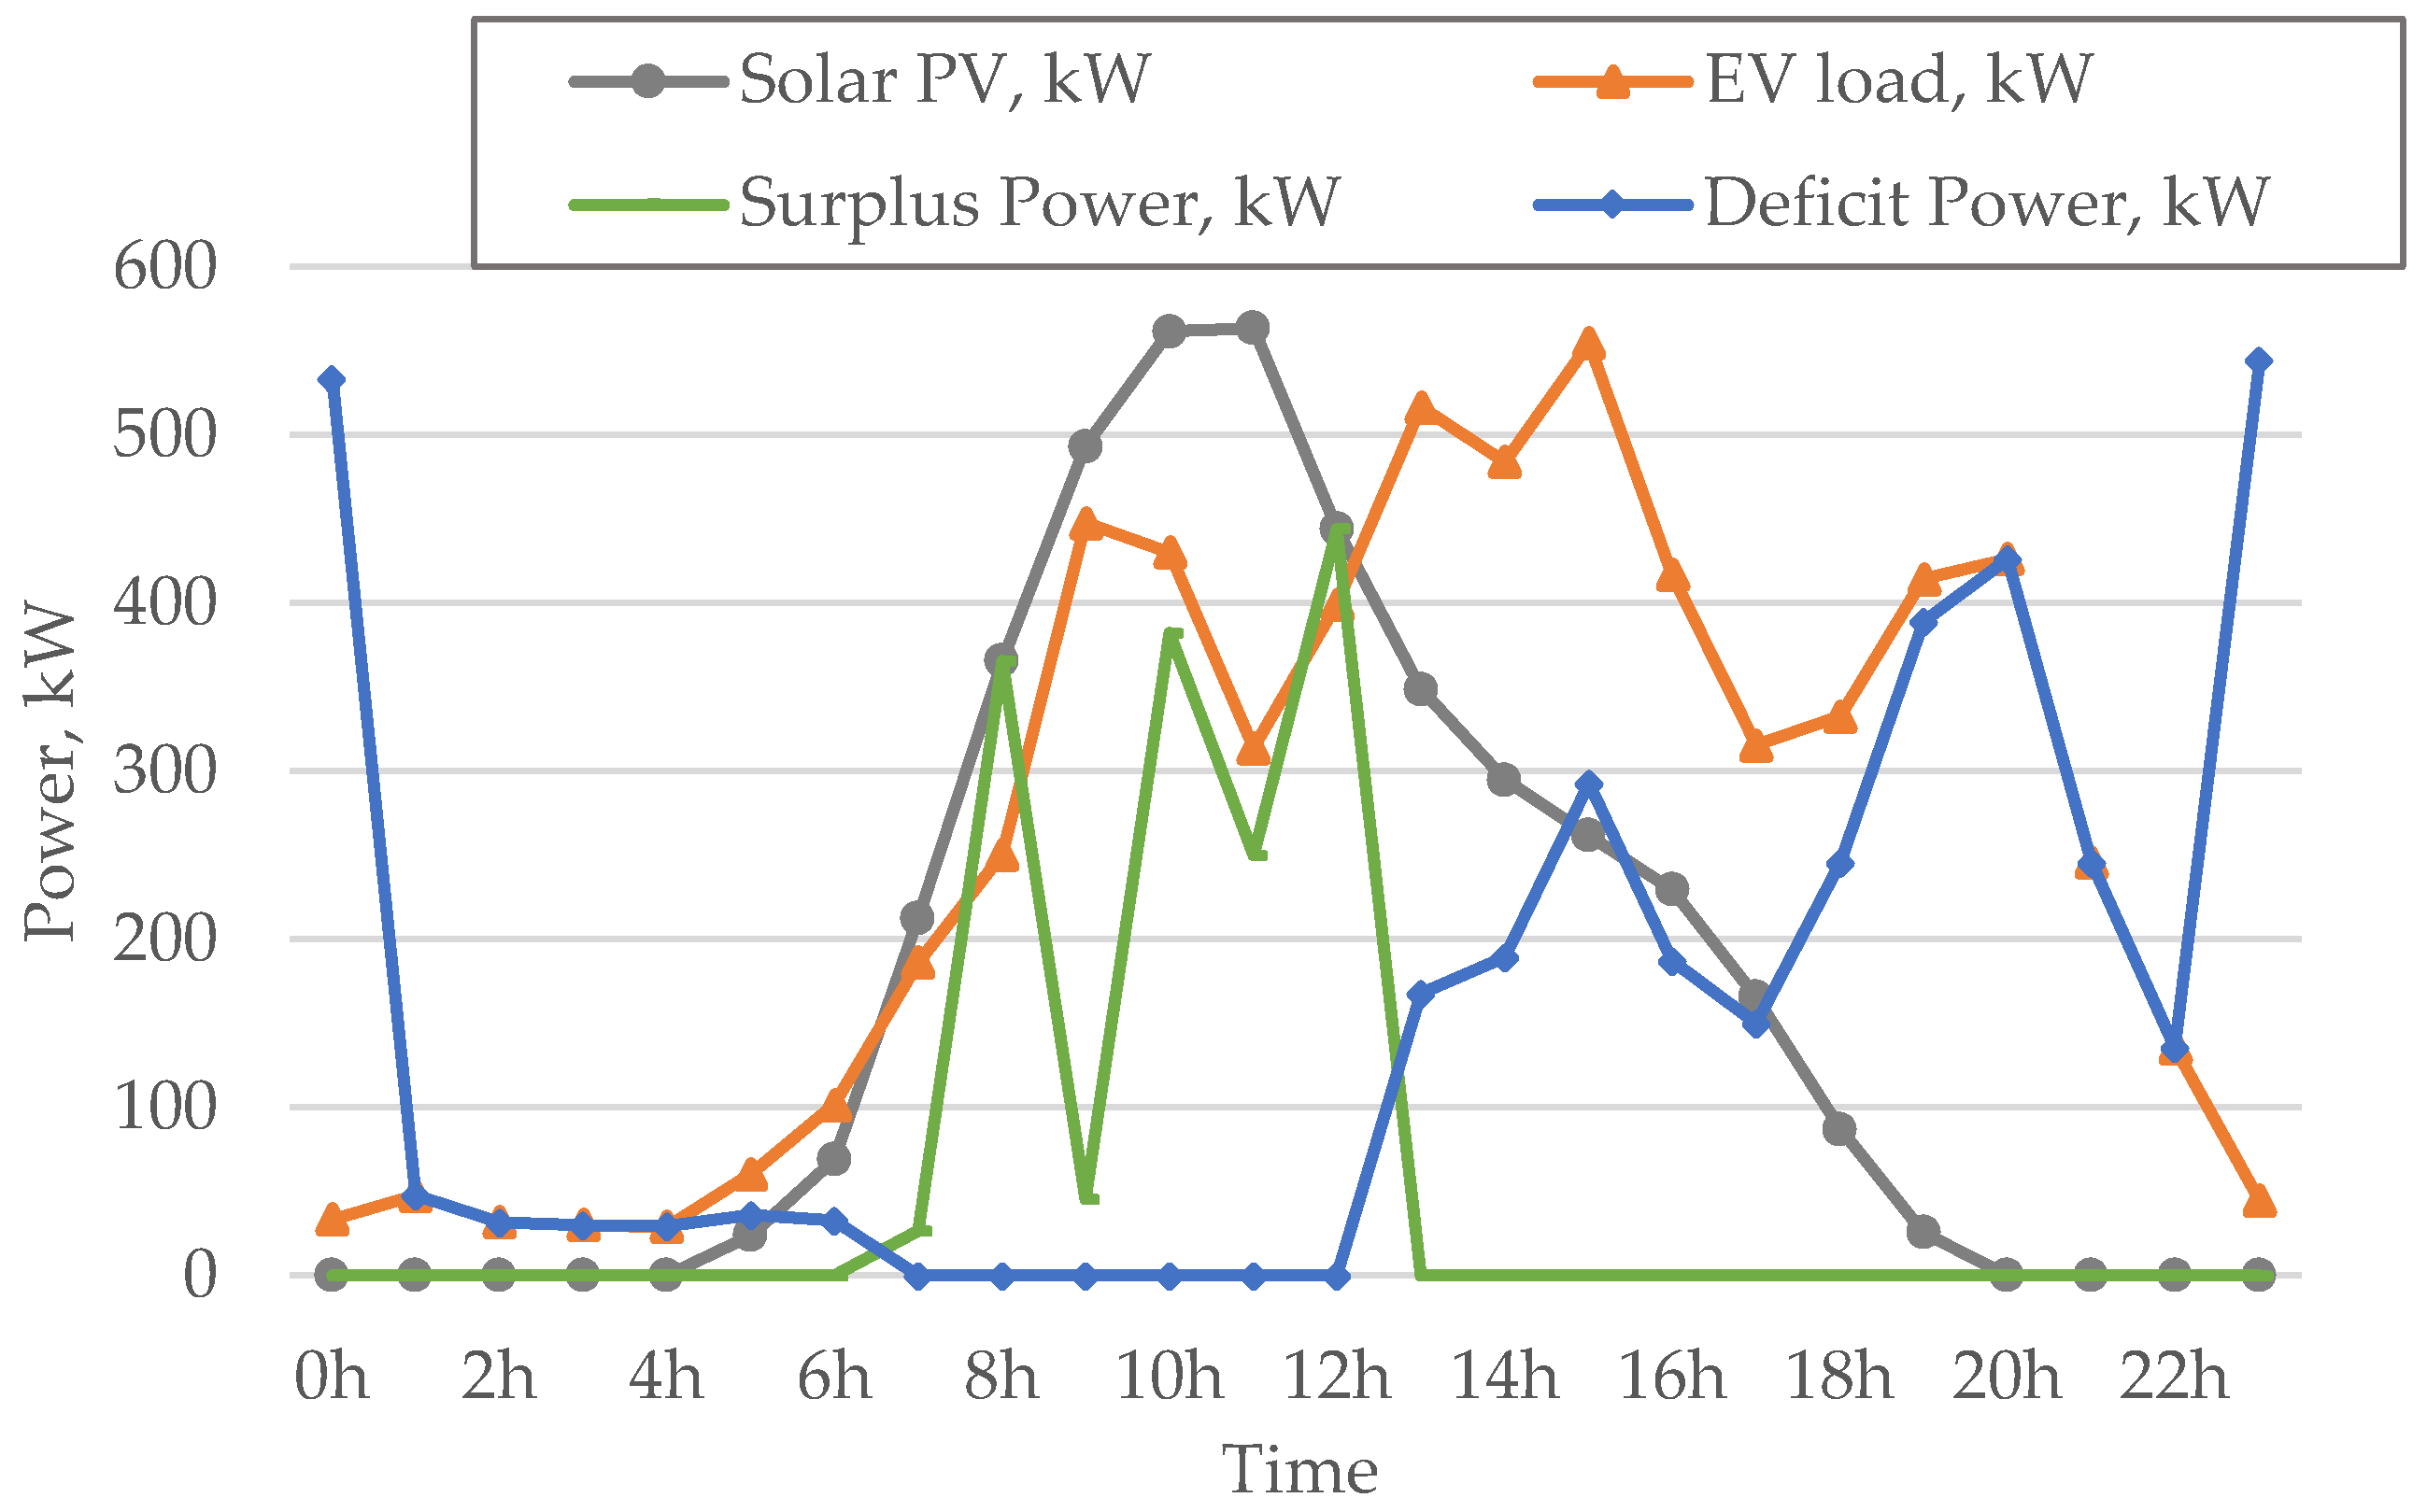
2.2. Surplus and Deficit Power

When the solar power P p v = P 1 p v , P 2 p v , P 3 p v , , P N T p v is higher than the EV load P e v = P 1 e v , P 2 e v , P 3 e v , , P N T e v , which usually occurs during two situations, midday or when energy needed for charging EVs is low (e.g., low number of EVs for charging), this results in the surplus power P s p = P 1 s p , P 2 s p , P 3 s p , , P N S P s p . The instances when P s p exists in the NT period is denoted by NSP instances. The surplus power P s p is stored in the battery and can be either exported and sold to the grid or used during a suitable period. Considering the net power output P i o e v , the surplus power P i s p at the ith instance in NT period is
P i s p = P i o e v P i e v , t = 0 , , N T ( P t o e v P t e v 0 ) ,
where P t o e v   a n d   P t e v are the net power output from the SPEVCS and EV load, respectively.
The deficit power P d f = P 1 d f , P 2 d f , P 3 d f , , P N D F d f   to be imported from the grid is eventually sold to the EV. The instances when P d f exists in the NT period are denoted by NDF. The P d f can alternately be considered as revenue at a lowered cost (α − γ), where γ is the price at which P d f is purchased from the grid. The deficit power P j d f   at the jth instance in the NT period is then
P j d f = P j e v P j o e v , t = 0 , , N T P t e v P t o e v 0 .
A standalone or off-grid SPEVCS suffers from the stochastic characteristics of solar power. For such an off-grid SPEVCS, the discrepancy between the characteristics of solar power and the unpredictable arrival of EVs necessitates a larger capacity for energy storage devices [17,18], which further complicates the energy management at the CS. Therefore, to support both the solar photovoltaic system and BESS, the SPEVCS must be connected to the grid. This allows the SPEVCS to import power when the combined output of solar power and the BESS cannot meet the load demand and to export surplus power to the grid. The limits on the surplus power P s p and the deficit power P d f are
0 P t s p P t s p ¯ U t s p ,
0 P t d f P t d f ¯ U t d f ,
where P t s p ¯ is the upper bound for surplus power, and P t d f ¯ is the upper bound for the deficit power.
The SPEVCS should either import or export power from/to the power grid only at a given time t. To enforce this condition, the following constraint is used
U t s p + U t d f 1 ,
where the binary variables U t s p are a component of U s p = U 1 s p , U 2 s p , U 3 s p , , U N S P s p that indicates the operational status of the surplus power P s p , and U t d f is a component of U d f = U 1 d f , U 2 d f , U 3 d f , , U N D F d f that indicates the operational status of the deficit power P d f .
During the formulation of the model, additional binary variables (e.g., U p v , U s p , U d f ) were defined to represent the operational status of respective components of the system. While the implementation of binary variables increases the complexity of the model, it allows for the modeling of additional states. By making use of the binary variables (vectors), it is possible to model various operating states of system components, mapping specific and emergency operating states. These states can be further integrated into the work. The introduction of the binary variables also enables the consideration of shutdowns due to limited equipment availability, maintenance, breakdowns, exceeding the maximum allowable power, or disagreements with energy sales.

2.3. Net Revenue

The total revenue is the sum of the following three components.
(i)
The revenue generated from charging the EV is
R e v = t = 1 N T P t p v + η b P t d P t c α
or
R e v = t = 1 N T P t o e v α .
(ii)
Revenue made from selling the surplus power P s p to the grid is
R g r 1 = i N S P P i s p β , t = 0 , , N T ( P t o e v P t e v 0 ) .
(iii)
Revenue from the sale of grid power, the deficit power purchased from the grid and sold to EV load, can be conveniently treated as revenue given by
R g r 2 = j N D F P j d f ( α γ ) t = 0 , , N T P t e v P t o e v 0
Therefore, the net revenue is
R n e t = R e v + R g r 1 + R g r 2 .

2.4. Formulation of the Photovoltaic System: Economic Submodel
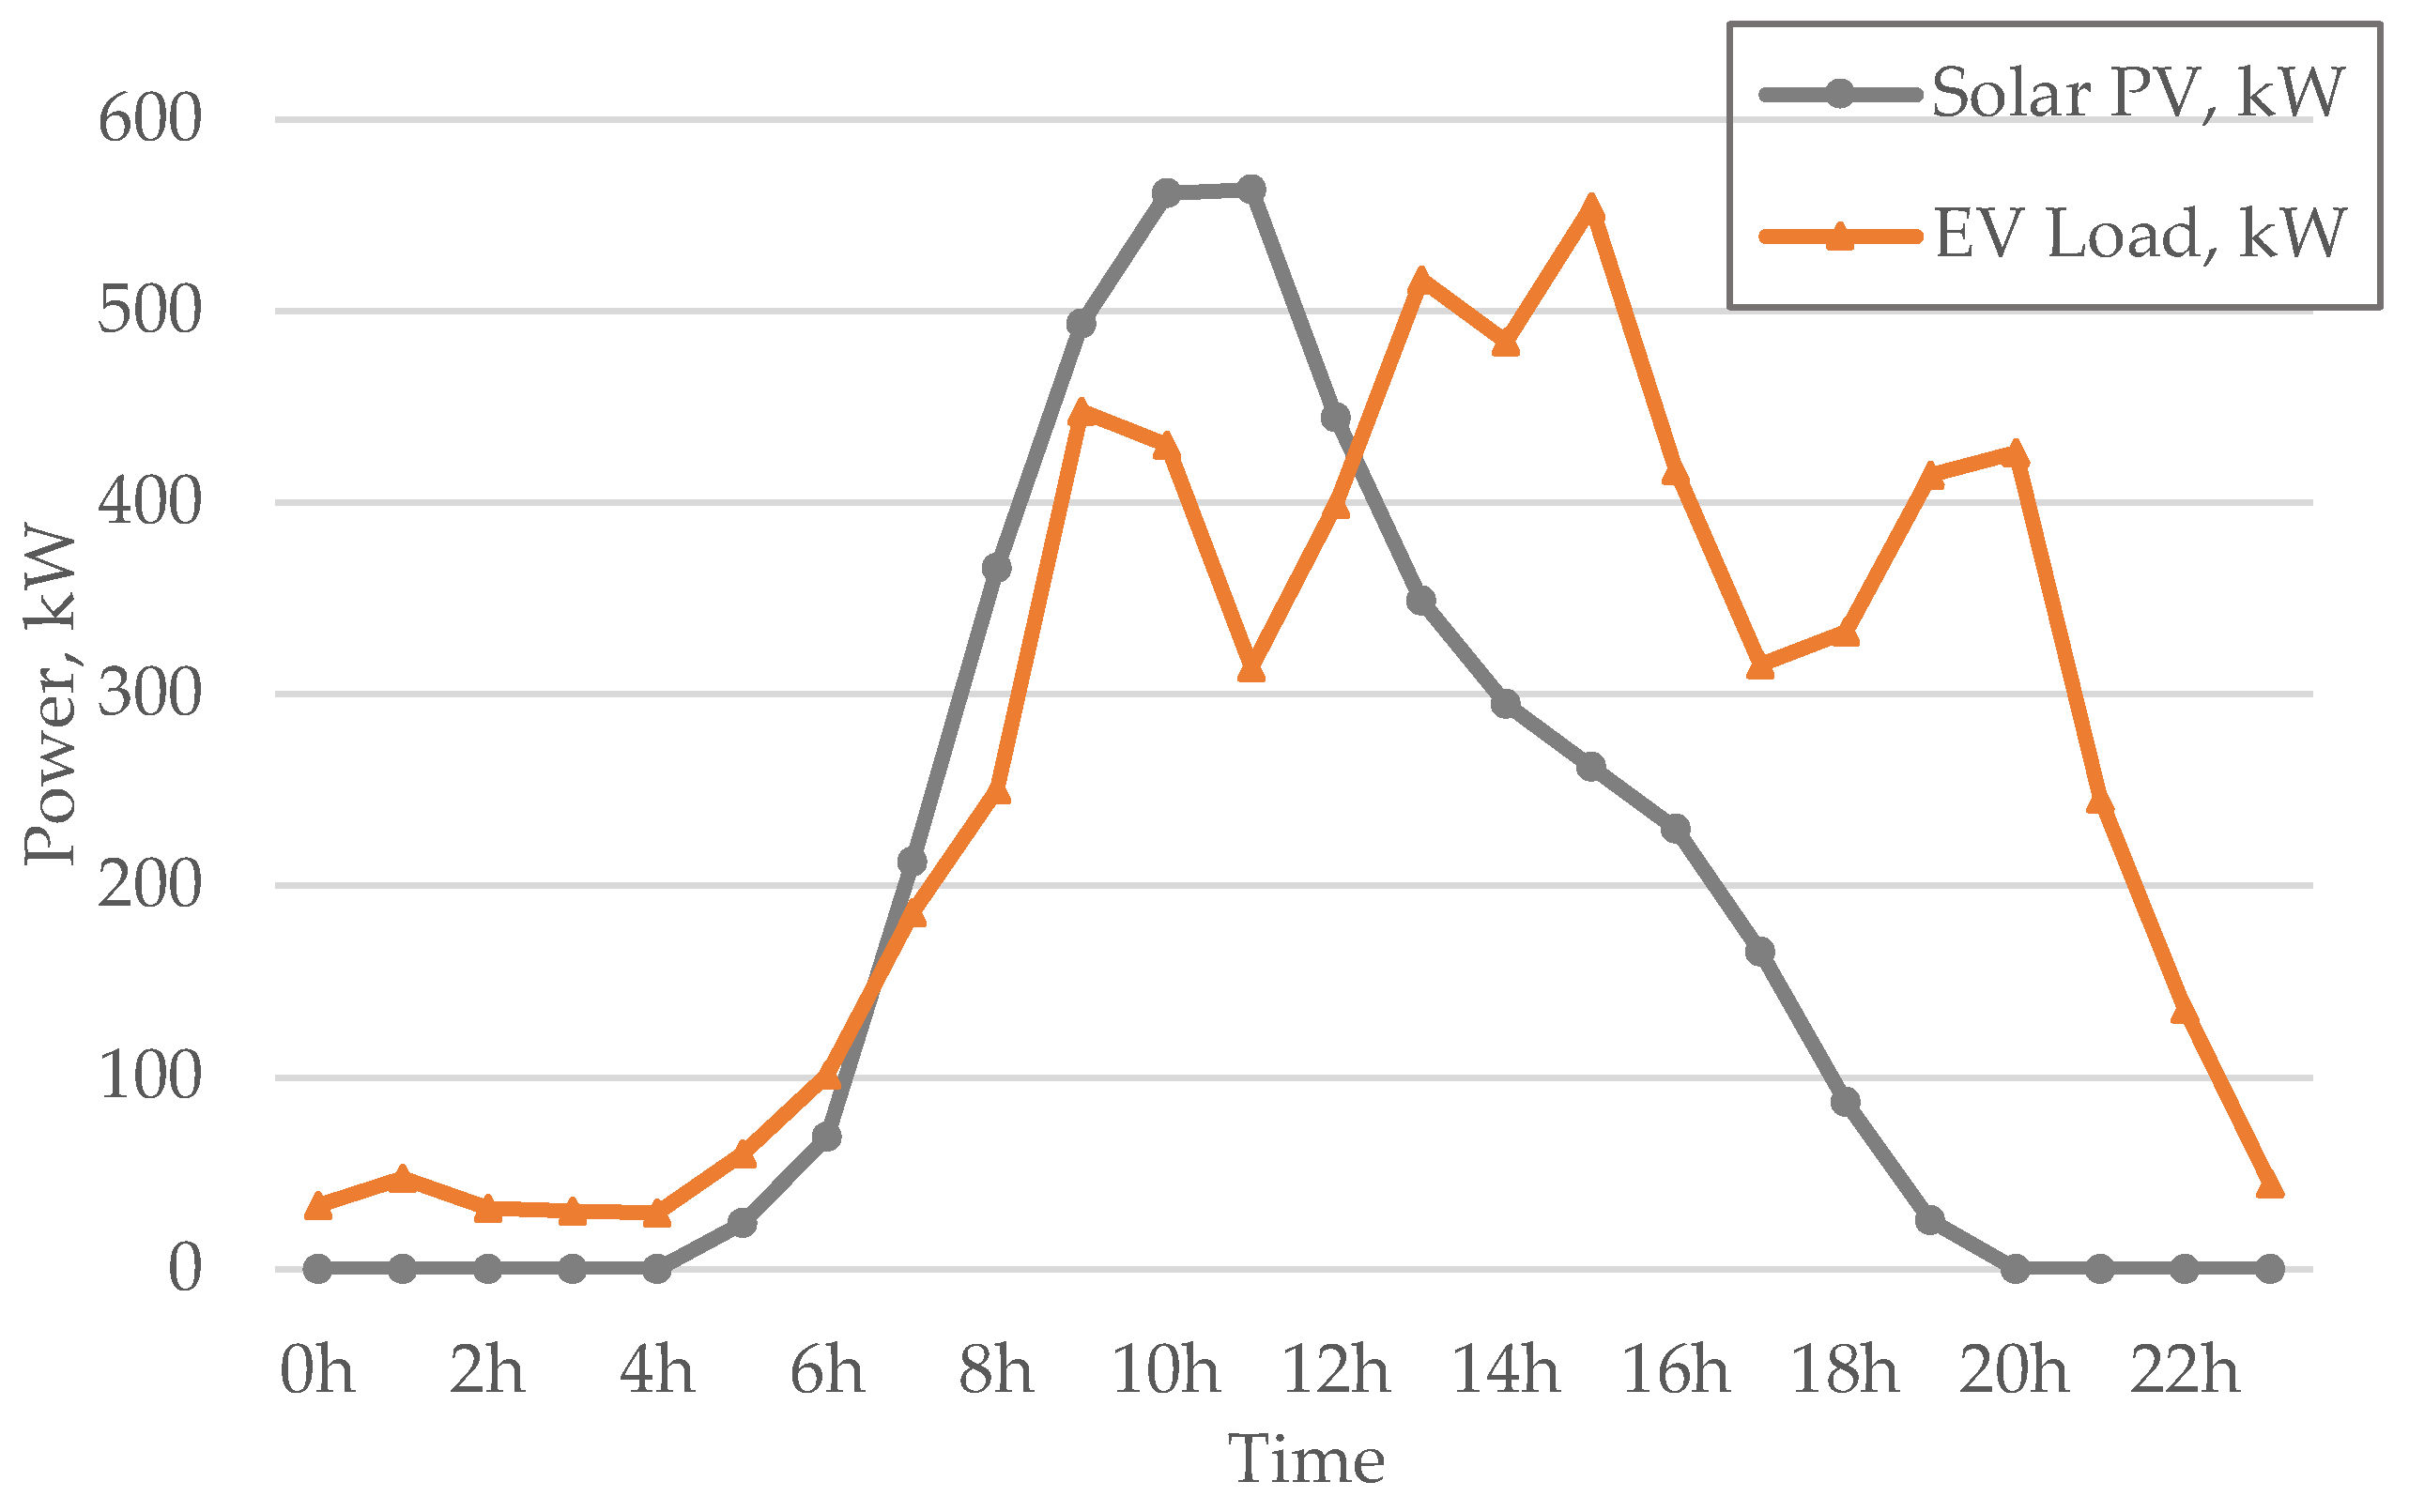
A beta distribution can be used to satisfactorily describe the solar irradiance [19,20], and the best forecast is the median of the beta probability density function [21]. Accordingly, in this study, we consider the median of the 24 h forecast of PV generation P p v ~ as the best forecast. Subsequently, the solar PV generation P t p v at the consecutive tth hour is constrained by a binary variable U t p v . The U t p v is an element of the vector U p v = U 1 p v , U 2 p v , U 3 p v , , U N T p v representing the operational status of the PV system and P p v ~ as given below
0 P t p v P t p v ~ U t p v .
The CPV, which is the total cost of the PV system, is obtained by considering the fixed cost A p v and the linearly varying costs B p v of the PV system as given in ref. [22]. The CPV is determined as follows:
C P V = t = 1 N T A p v U t p v + B p v P t p v .
The fixed cost includes components of the financial outlays that do not vary, such as the exploitation of PV panels (investment costs), while the linearly varying cost includes those that vary with the performance of related components, such as the cost of operation and maintenance.

2.5. The Load Model

Fast EV chargers with ratings ranging from 7 kWh to 22 kWh are usually installed at the car parks across the United Kingdom [23]. In Poland, there are currently 1700 EV CSs, of which around 30% are DC charging points and around 70% are slow AC chargers with a power of at most 22 kWh [24]. Therefore, the load considered in this paper comprises 36 units of 22 kWh unit each. As the characteristic of EV arriving at the CS is highly stochastic, it is difficult to accurately predict the load demand. It remains a challenge to accurately forecast the EV load demand; however, various works to model EV load charging demand forecasts to successfully manage and plan EV charging have been carried out in refs. [25,26,27]. In our work, we consider the probability of arrivals as given in ref. [28]. The probability of EV arrival is the load P t e v at every tth hour. It is further defined as the relative value ρ t e v (%) of the capacity of the charging station K. The EV load at the tth hour is
P t e v = K   ρ t e v .
Further, we have considered the probability of EV arrival and further narrowed it down to a relative value, ρ t e v , which is defined as a percentage of the capacity of the CS at every instant ‘t.’ This allows us to maintain uniformity in discussing the probability of EV arrival while facilitating a detailed analysis of the case.

2.6. Battery Energy Storage System

The BESS is required to support the solar PV system when it is unable to meet the load demand, especially during the night and when the EV load is higher. Solar power is highly stochastic, while EV load requires power throughout the day and night. Therefore, at the tth hour, the combined net power from the PV system and BESS is
P t o e v = P t p v + η b P t d P t c
where P t d is the discharging power, and P t c is the charging power of the battery at the tth specified hour. The coefficient η b is the efficiency of the battery, and U t c and U t d are the binary variables that represent the battery’s operational status while charging and discharging, respectively. For the battery, Equations (15) and (16) give the limitations while being charged and discharged, respectively, at the tth hour
0 P t c P t c ¯ U t c ,
0 P t d P t d ¯ U t d ,
where P t c ¯ is the maximum charging power and P t d ¯ is the maximum discharging power at time t.
Additionally, the following constraint has been enforced to ensure that the battery either exclusively charges or exclusively discharges at any given time t
U t c + U t d 1 .
(i)
Costs related to the discharge–charge cycle.
The number of charging/discharging cycles has an impact on a battery’s life. Therefore, this cost per cycle, associated with every charging cycle, is considered, and it is denoted by the constant C b . To keep track of every discharge–charge cycle, a binary variable S = S 1 , S 2 , S 3 , , S N T is used and it is given by the following at time t,
S t = max U t c U t 1 c , 0 .
Subsequently, the total discharge–charge cost of the battery is
κ b = t = 1 N T C b S t .
(ii)
Battery energy limits
The characteristics of the BESS play a crucial role in shaping the final outcome. Specifically, the battery capacity as well as its initial state of charge, denoted as E(0), significantly influence the system’s performance. The total battery energy, E t at the tth hour is
E t = E 0 + s = 1 t P s c P s d .
The battery energy limits are
0 E t E ¯
where E ¯ is the maximum battery energy limit.
The costs for the BESS are dependent on the battery charging, discharging, and the discharge–charge cycle. The fixed and linearly varying costs during charging state are denoted by A c , B c , respectively, and the fixed and linearly varying costs during discharging state are denoted by A d , B d , respectively. The total cost for the BESS is
T C b = κ b + t = 1 N T A c U t c + B c P t c + A d U t d + B d P t d .
The cost of purchasing and operating batteries, including a limited number of charge and discharge cycles, significantly shapes the performance of the system. The selection of battery capacity must be based on the operating conditions of the CS. As part of this work, a multivariate analysis of the system was conducted using batteries of different capacities. This approach facilitated the identification of the optimal battery capacity for a CS with a known operating profile.

2.7. Overall Solution and the Net Profit

The net profit PR is derived from the balance between the revenue given by Equation (10) and the total costs of the PV system and BESS given by Equations (12) and (22), respectively. The net profit includes the income from selling power to the grid and charging the load. It is given by
P R = R n e t C P V T C b
or,
P R = t = 1 N T P t o e v α + i N S P P i s p β + j N D F P j d f α γ t = 1 N T C b S t + j p v , c , d N T A j U t j + B j P t j .
The overall system output is given by
P t p v + η b P t d P t c + P t d f P t s p P t e v = 0
and the complete solution X is accordingly described by
X = U s p , U d f , U c , U d , P s p , P d f , P c , P d , S .
The objective is to solve for X in Equation (26) subject to the constraints given in Section 2.1, Section 2.2, Section 2.3, Section 2.4, Section 2.5 and Section 2.6. Considering the nature of the formulation, the MILP (mixed-integer linear programming) scheme is applied to obtain the solution. MATLAB R2022b was used in this work, and special scripts were prepared by the authors to declare and verify the constraints and assumptions, followed by the implementation of control procedures. The developed scripts enable the analysis of various parameters of the system to assess the efficiency of the SPEVCS. Various factors can be analyzed using the scalable computational code prepared in the MATLAB environment. An abstract of the code, treating a few of the constraints is shown below:
  • prob.Constraints.pvconstr = PPV(1:NT) <= PPV(1:NT).*Upv(1,1:NT);
  • prob.Constraints.charconstr = PBC(1,1:NT) <= PBCMAX.*Uc(1,1:NT);
  • prob.Constraints.discharconstr = PBD(1,1:NT) <= PBDMAX.*Ud(1,1:NT);
  • prob.Constraints.spconstr = PSP(1,1:NT) <= PSPMAX(1,1:NT).*Usp(1,1:NT);
  • prob.Constraints.dfconstr = PDF(1,1:NT) <= PDFMAX(1,1:NT).*Udf(1,1:NT);
  • prob.Constraints.spconstrp = PSP(1,1:NT) >= 0;
  • prob.Constraints.dfconstrp = PDF(1,1:NT) >= 0;

3. Data, Results, and Analysis

Datasets, results, analysis, and subsequent explanations are provided in this section.

3.1. SPEVCS Data

In this study, a SPEVCS of 1 MWp capacity is considered. The location considered is Warsaw, Poland (52.2297° N, 21.0122° E). To increase effectiveness, solar PV generation data during one of the hottest days, when the irradiance was at maximum, have been considered. These data, corresponding to 19 July 2019, have been taken from ref. [29] and are shown in Figure 3 alongside the EV load data. The one-sided PV panels with a constant tilt angle (35°) have been considered, and the associated cost parameters have been taken from refs. [17,22].
A lithium-ion (Li-ion) battery with a lifecycle of 3500 cycles at 80% depth of discharge (DoD) and a total lifespan of 10 years has been considered, along with the associated costs as per ref. [30]. Therefore, C b has been computed accordingly based on these data. The costs, including relevant data, have been taken from [17]. The battery parameters considered in the study are given in Table 1.

3.2. Tariff and Load Data

Numerous papers have forecasted EV arrivals, particularly in terms of power demand [31,32], and the variations in the loading pattern have been noted to be very minimal. In ref. [31], forecasts were generated based on the power demand resulting from the charging of one million EVs.
Similarly, in ref. [32], a short-term prediction of the EV arrival probability for charging within a day was conducted. Given the large number of EVs studied, the probability of EV arrival data from reference [32] were used. In this study, the data have been normalized to the charging station’s capacity, K, and are further given in terms of the percentage of K as given in Equation (13). The maximum occupancy of the CS is assumed to be 70%, and the load is considered a percentage of the CS capacity ρ e v . The relevant data are given in Table 2.
The cost of charging an EV at a public CS in Poland is 2.09 PLN/kWh, which is approximately equivalent to 0.44 USD/kWh as per ref. [33]. This rate applies to DC chargers with a power rating of 100 kW or less, and therefore we take α to be 0.44 USD/kWh.
Currently, Poland does not have a well-established mechanism that allows owners of solar PV systems to sell surplus power back to the grid. The net-billing system was introduced in April 2022 (instead of the net-metering settlement), through which consumers are paid for surplus energy fed into the grid at the wholesale price, which is lower than the electricity bought from the grid. In this paper, we consider the β at 0.965 PLN/kWh (0.238 USD /kWh) and γ at 0.739 PLN/kWh (0.182 USD/kWh) [34].

3.3. Results and Analysis

A lithium-ion battery, with a capacity of 1 MWh, efficiency ( η b ) of 90%, and depth of discharge (DoD) of 80%, is considered in this paper. Given that the battery size and initial SOC exert a substantial influence on the outcomes, discussion is based on these factors. Analysis based on the optimal battery size for an off-grid system as determined by ref. [17] was performed for the proposed grid-connected system and is presented in the subsequent section.

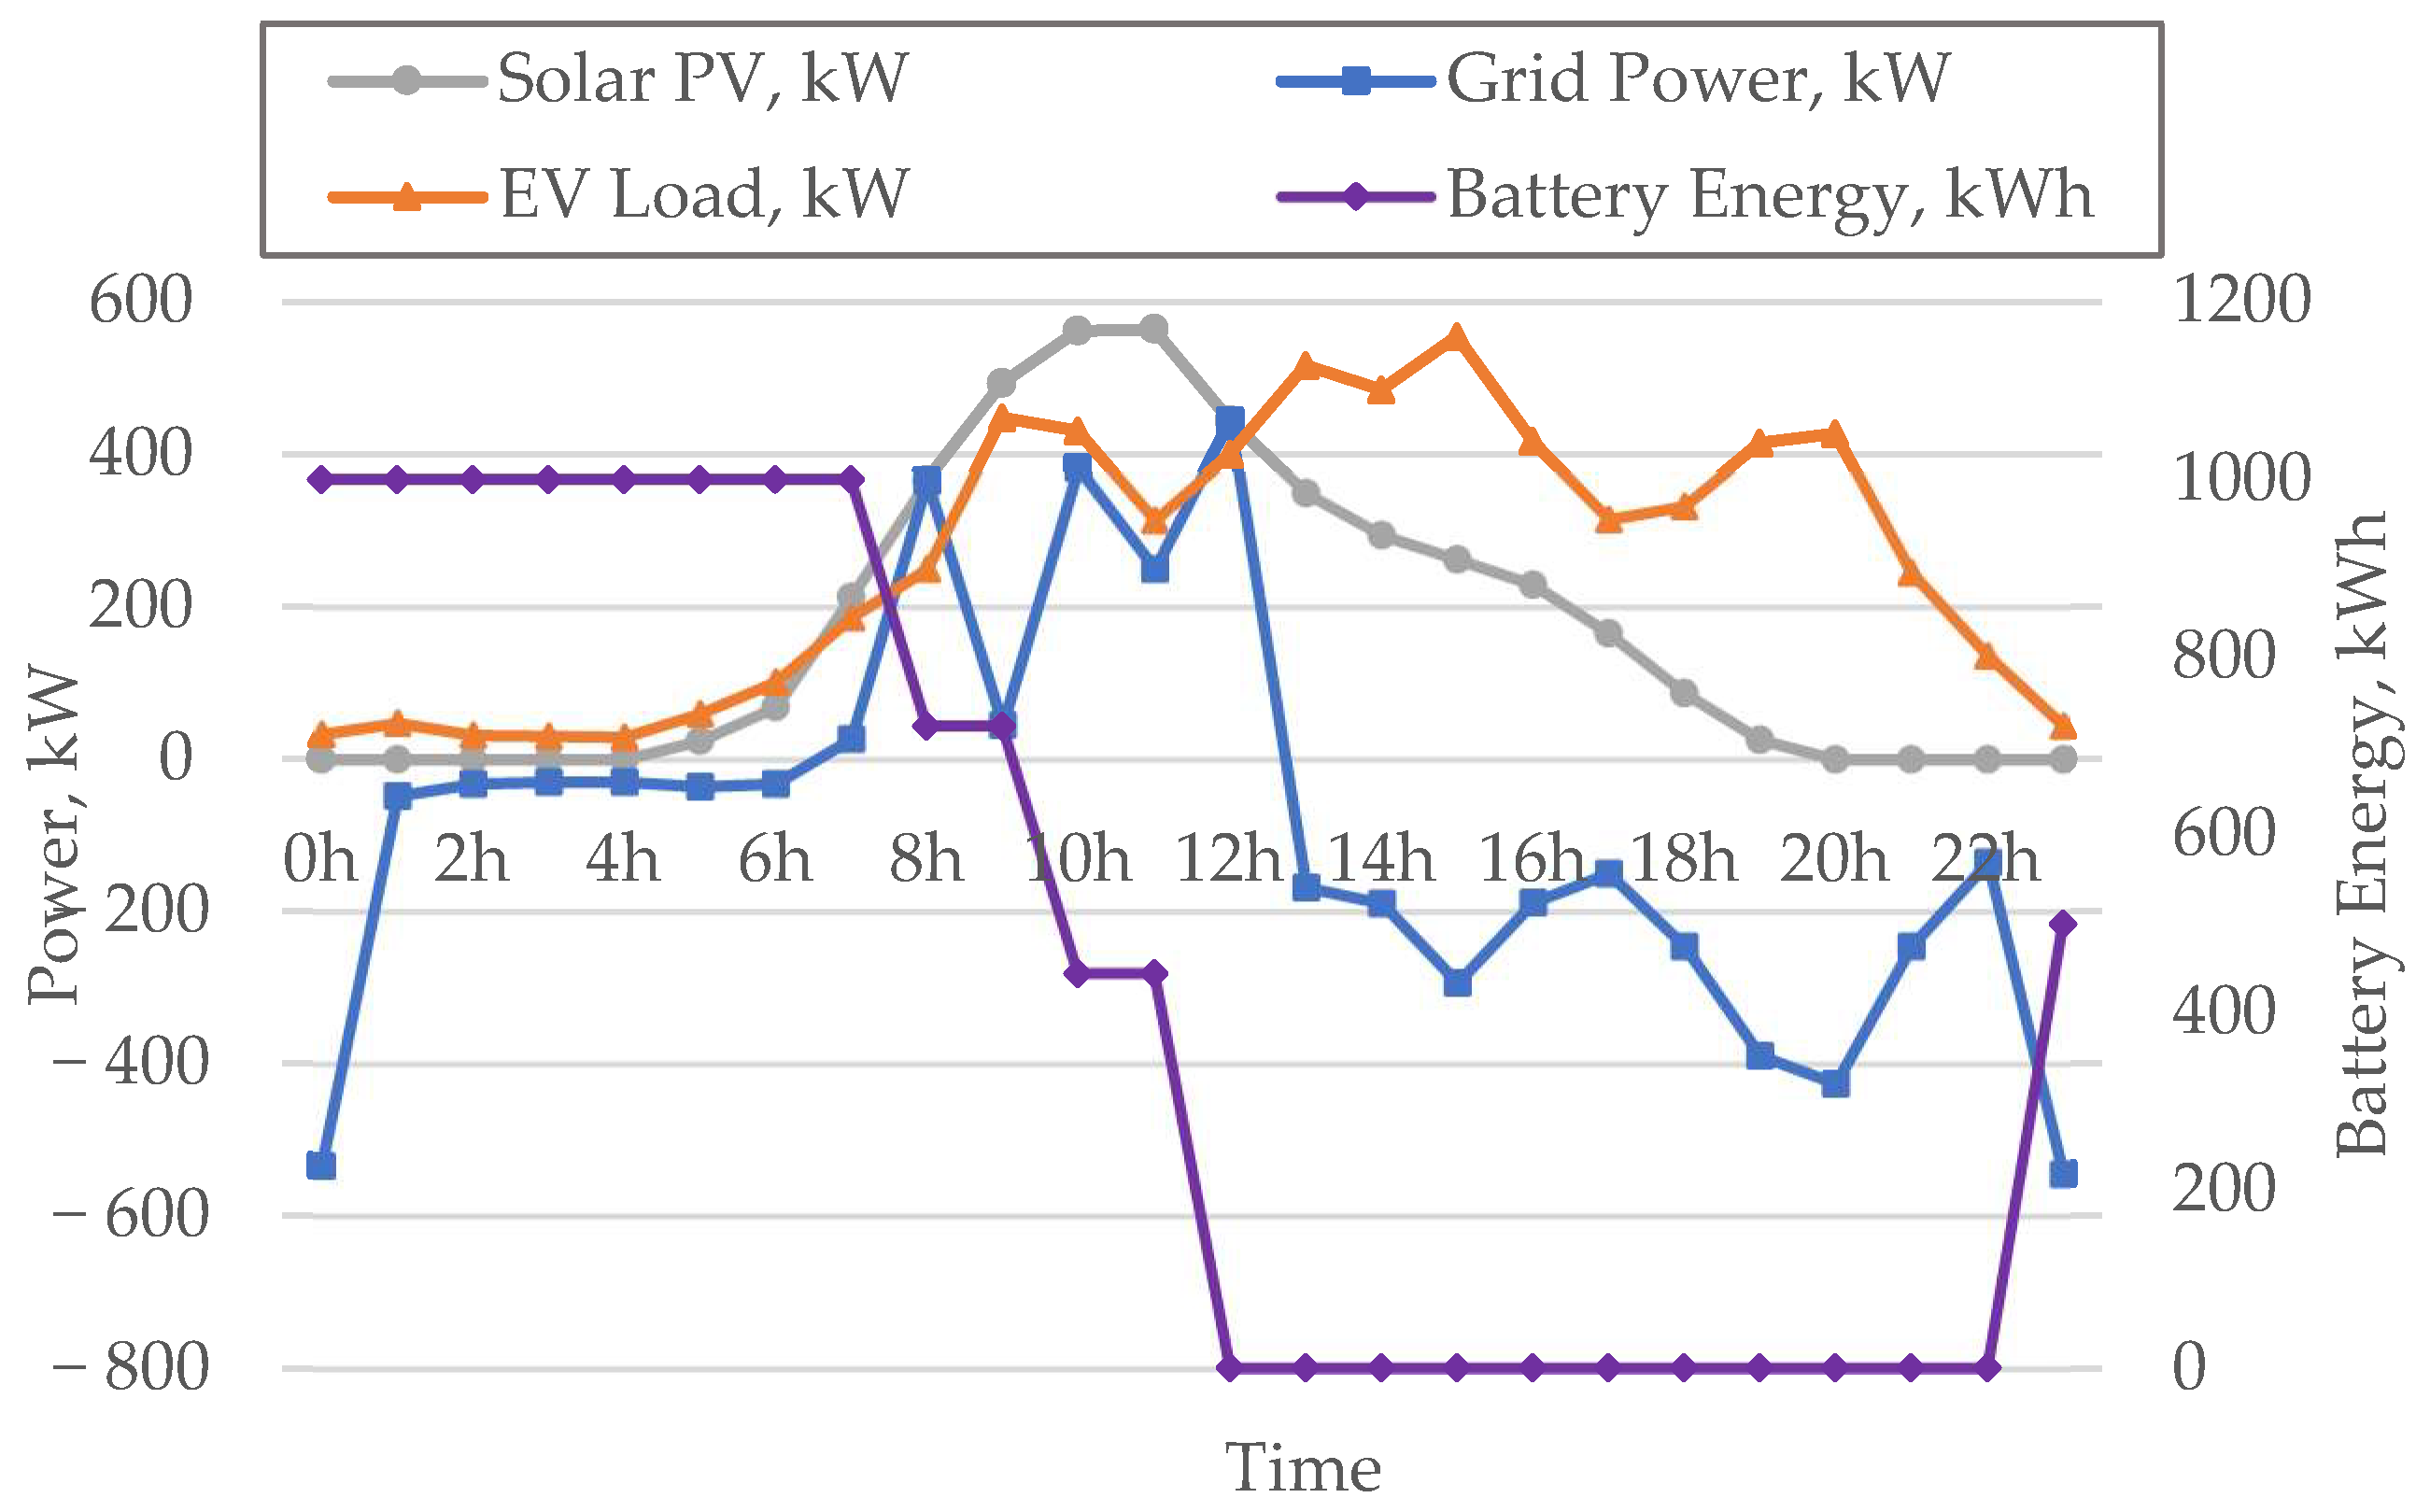
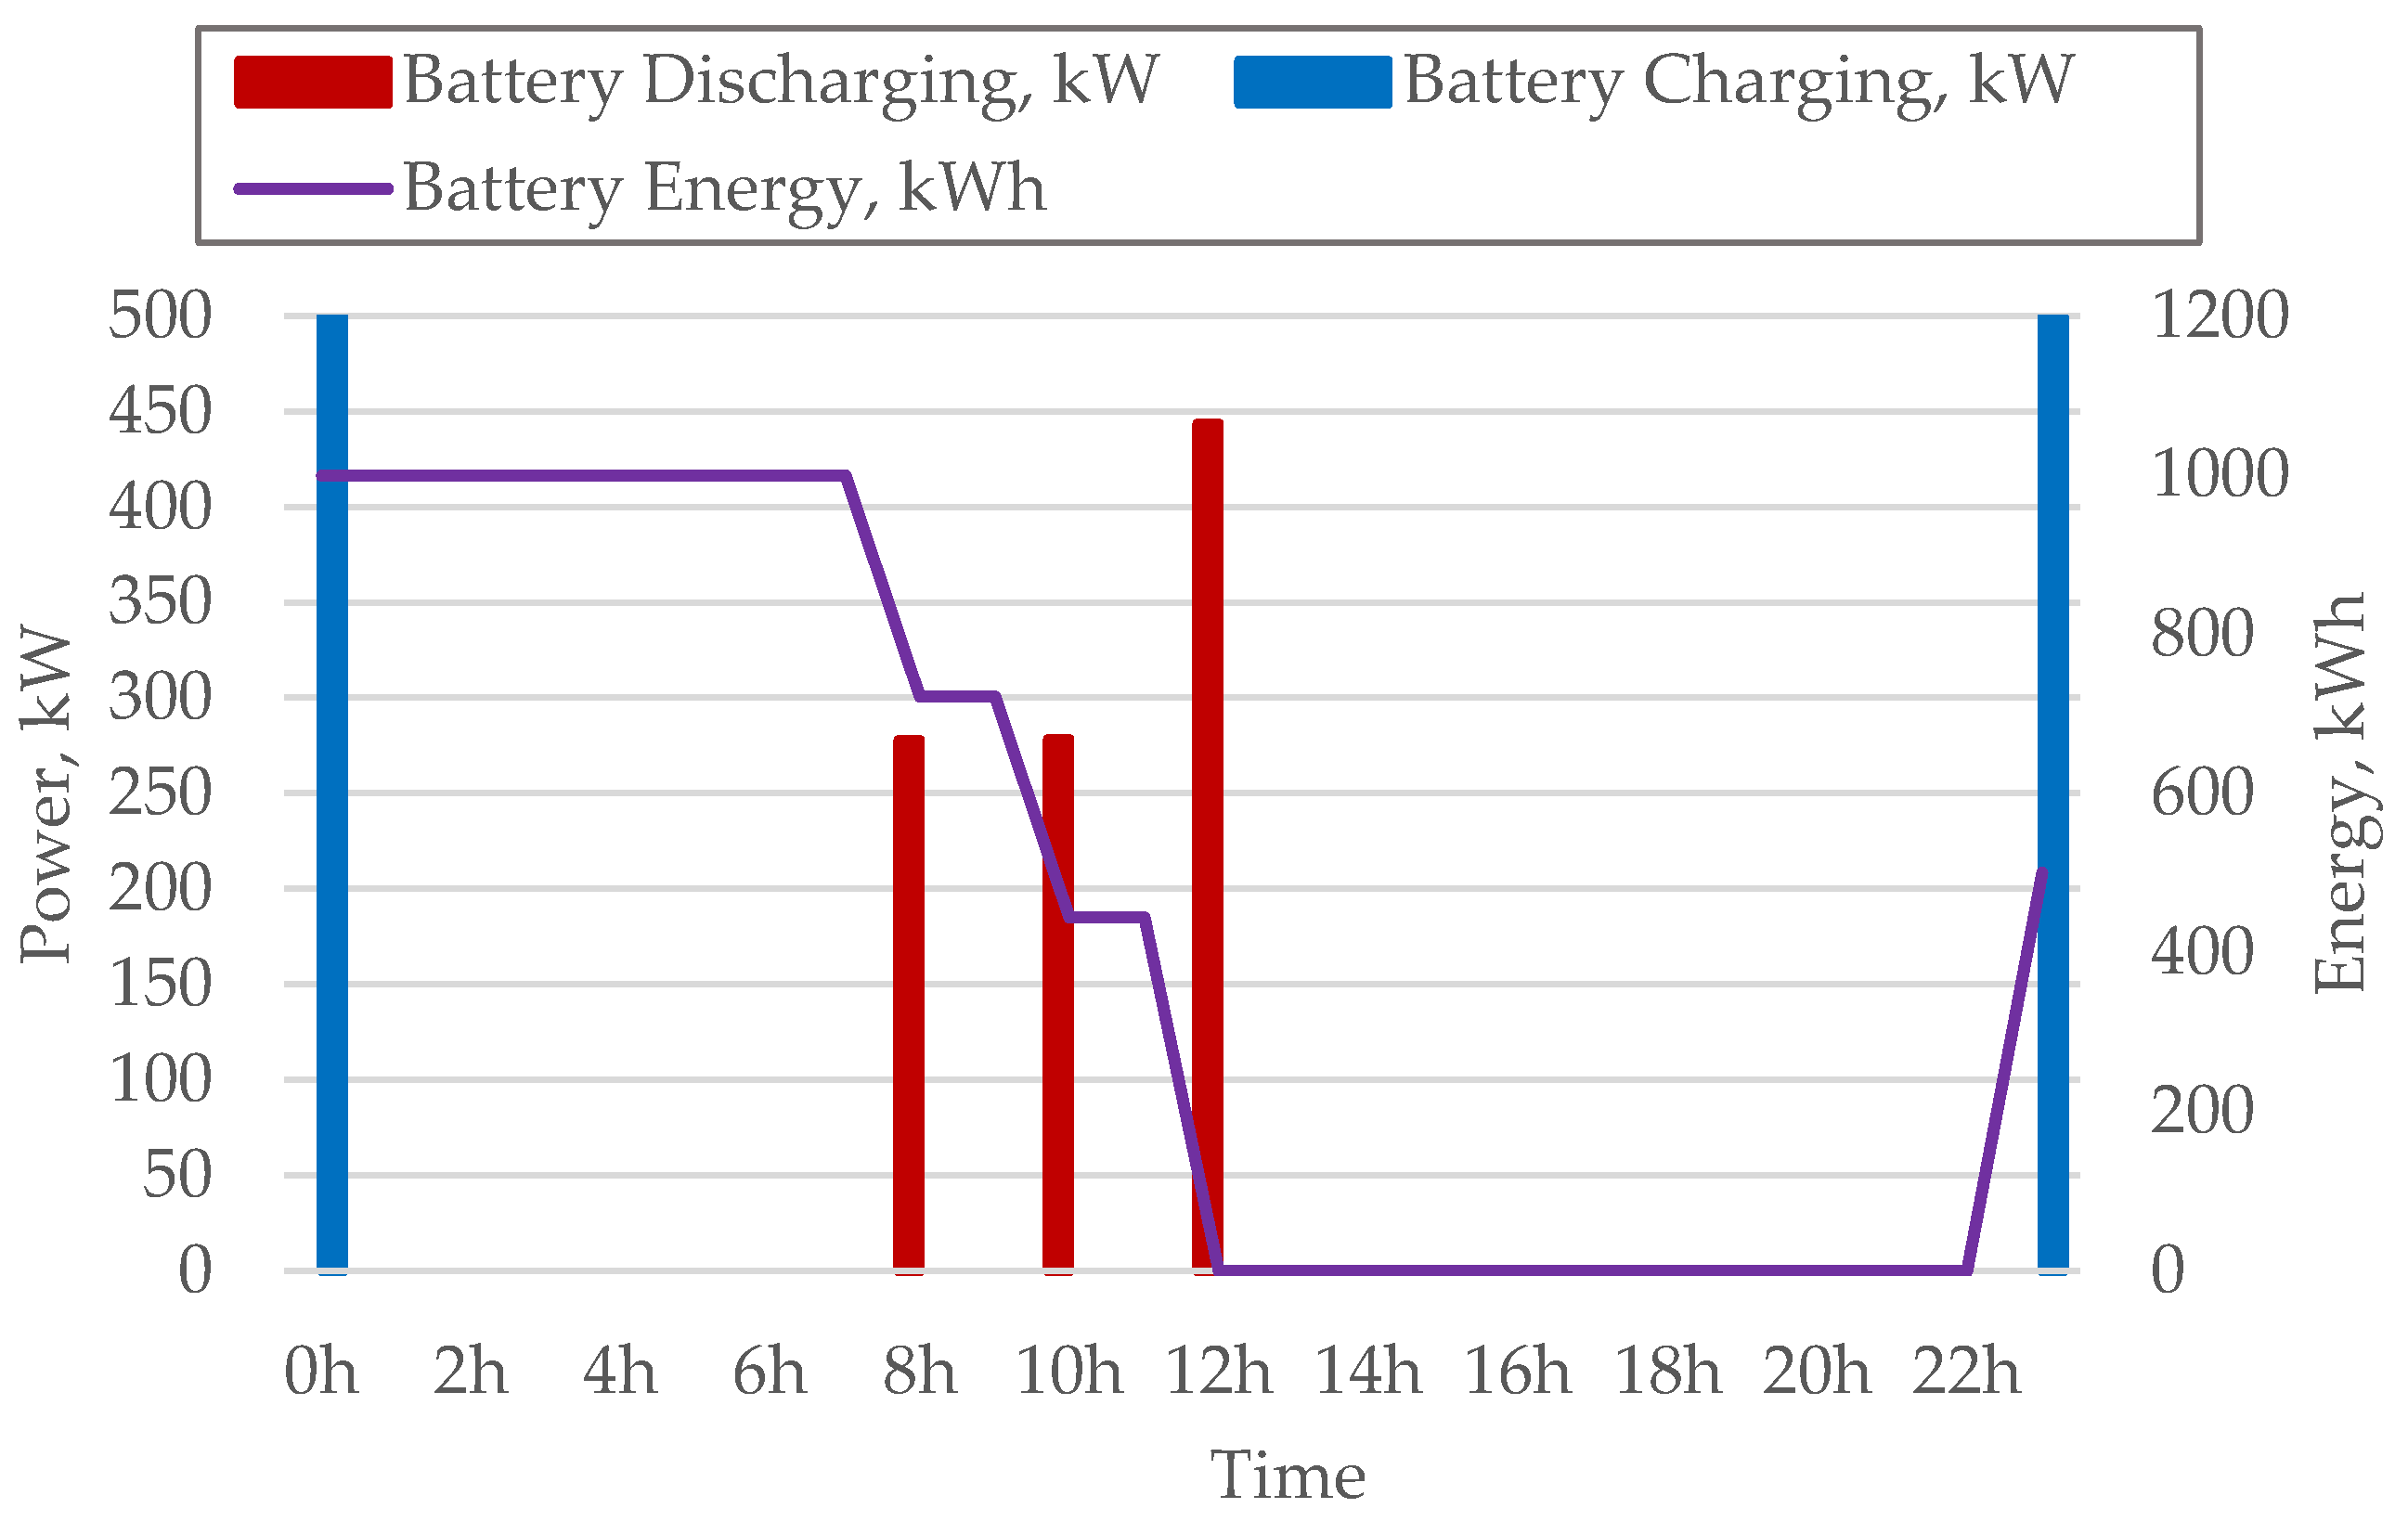
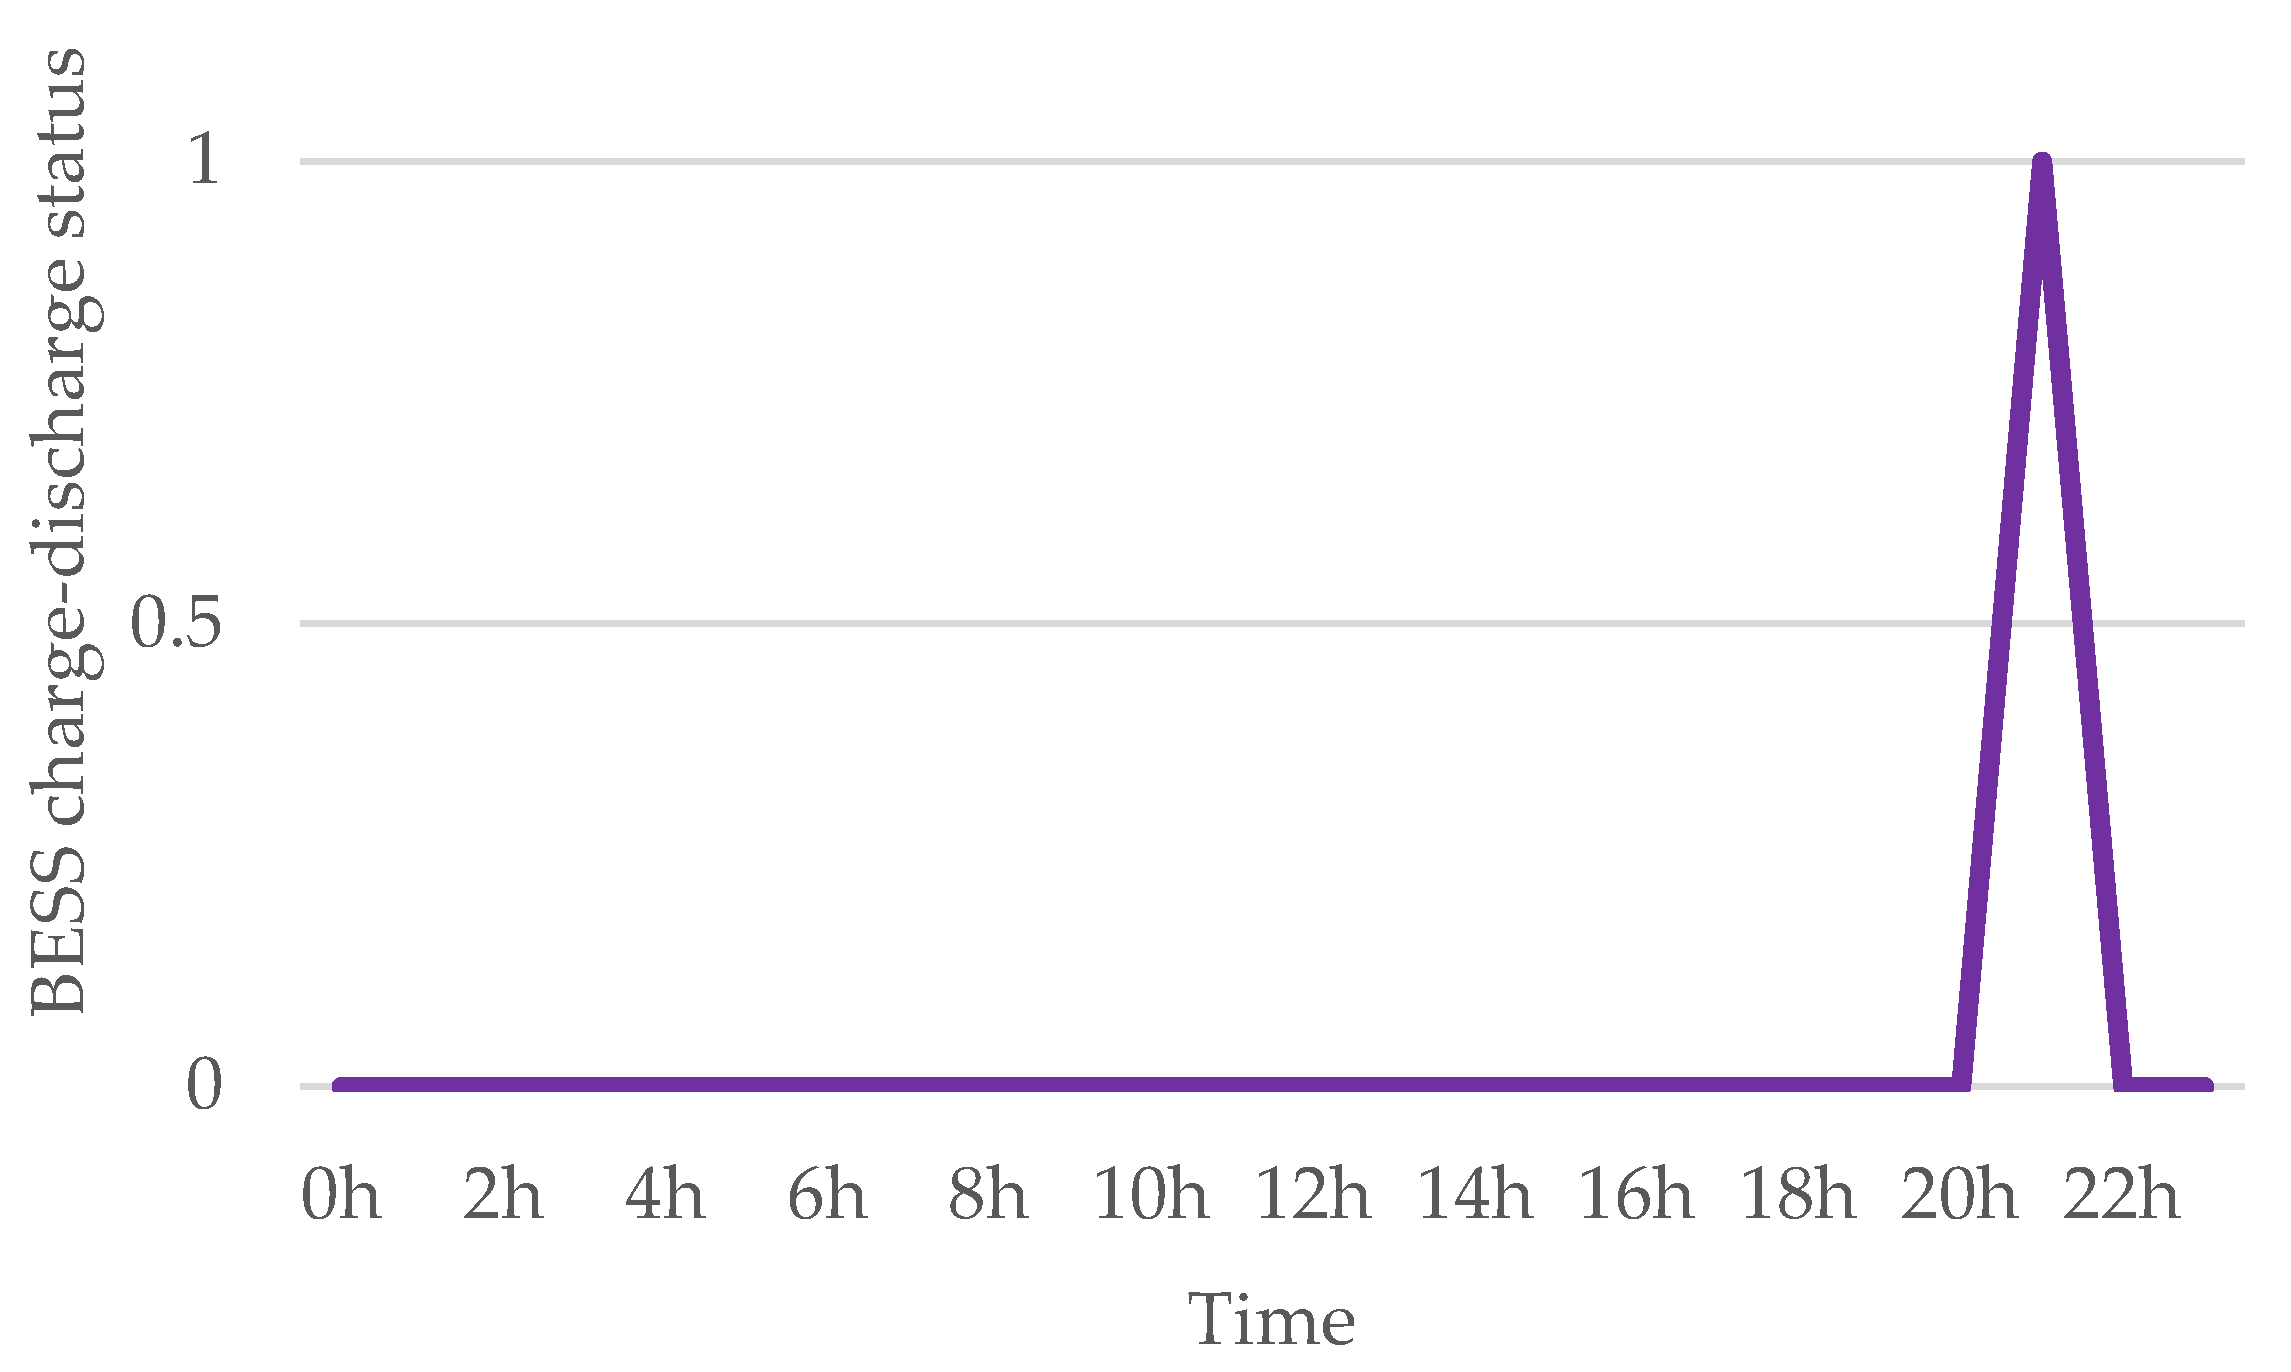
3.3.1. SPEVCS with the Grid

Figure 3 shows the solar power and EV arrival data. The BESS and/or grid must supply power to meet the load demand during 0 h to 4 h and 21 h to 23 h since solar power is zero during those hours. The solar power is high only between 7 h and 12 h ( P p v > P e v ), during which the system must meet the load demand, charge the battery, and/or sell surplus power P s p to the grid.
In this analysis, the battery energy capacity E ¯ = 1000 kWh and the initial condition E(0) = 500 kWh have been considered. However, the constraint in Equation (21) is violated for an off-grid system since it cannot fulfill the total load demand. A larger battery size is required for operation, which was found to be E ¯ = 3000 kWh, E(0) = 2500 kWh in ref. [17]. Alternatively, the deficit power can be purchased from the grid while maintaining the original battery capacity.
The same battery size is maintained in the current study, while allowing the system to import deficit power from the grid, and a comparison is drawn between the results obtained in ref. [17] and the proposed method. The load is considered to be 70% of the CS capacity at any instant.
Table 3 shows that in the case of an off-grid system, constraints suffer from a violation leading to the need for a larger battery. Additionally, a grid-connected system yields a profit of USD 3129.6 while retaining the existing battery size.
Analysis was carried out and discussion is presented based on these values for the proposed grid-connected system. The surplus power P s p and deficit power P d f against P p v and P e v are shown in Figure 4. As seen, when the load P e v is higher than the solar power P p v between 0 h and 6 h and 13 h and 23 h, the deficit power is purchased from the grid. The load is met with additional power from the grid, the battery, or a combination of both, for which the factor depends on the constraints for maximum profit. Likewise, when the solar power is greater than the load, the surplus power between 7 h and 12 h is sold to the grid. Any additional power from the PV system during peak hours can be sold to the grid, used for charging the battery, or simultaneously used for charging the battery and supplying power to the grid.
The grid power, battery energy, solar power, and EV load are shown in Figure 5. A positive grid power indicates surplus power P s p , while negative grid power indicates deficit power P d f . As seen in Figure 5, from 13 h to 19 h, the load is supplied solely through solar power and the grid. However, at 20 h, as the solar power is absent, grid power is used for charging the battery to maintain the state of charge E(0) at 500 kWh at the end of the NT period as well as to meet the load. Therefore, at the end of the NT period, the SOC or the initial battery energy is maintained at 500 kWh.
From 7 h onward, when P p v > P e v , the solar power (212.63 kW) supplies power to the load (186.12 kW) and simultaneously exports surplus power to the grid (26.50 kW); therefore, the grid power stands at 26.50 kW. The schedule of the charging and discharging status of the battery is presented in Figure 6, where the battery is fully charged to its capacity of 1000 kW and shows discharge at 8 h, 10 h, and 12 h. The battery is recharged through the grid to maintain E(0) at 500 kW at the end of the NT period.
The BESS functions by supplying power to fulfill load demands, injecting power into the grid, or employing a combination of both strategies to maximize overall profitability. To ensure operational integrity, a pertinent constraint is enforced, restricting the battery to either charging or discharging mode exclusively during any specific moment. This constraint guarantees smooth energy flow management. The optimization variable S, which describes the charging–discharging cycle, is shown in Figure 7. Throughout the NT period, S is maintained at 1, which is observed at 21 h.
The proposed formulation also demonstrates its effectiveness by harnessing the surplus power, which otherwise is wasted. The excess energy is allocated to either charge the battery or be sold to the grid at the existing market rate or a combination of both. Consequently, this approach optimally exploits both the available solar energy and the capabilities of the BESS, resulting in enhanced scheduling and profit for the SPEVCS.

3.3.2. Optimal Battery Size

In ref. [17], the proposed formulation was conducted on an off-grid PV-based commercial EV CS for maximum profit. The BESS has a significant influence on the profit margin. A solar PV system alone is not able to meet the load demand. Such demands can be met by:
(i)
Increasing the battery size, and/or
(ii)
Purchasing deficit power from the grid.
Therefore, the optimal battery size and E(0) are determined. The algorithm of ref. [17] is as follows:
(1)
Data Input
  • Provide data (solar PV, EV probability, constants).
  • Determine the probability of EV arrival or load demand.
(2)
Model Formulation
  • Define variables for the solar PV, EV load, BESS, and overall system.
(3)
Revenue Calculation
  • Define conditions for revenue calculations based on the sale of power to the EV load.
(4)
Surplus Power Management
  • If the solar power output exceeds the EV load demand, store the surplus power in the battery and designate favorable time periods for using the stored surplus power.
(5)
Optimization
  • Make use of the MILP method to determine the optimal solution.
  • Define objective functions and constraints based on the charging strategy, revenue calculation, surplus power management, and system characteristics.
(6)
Solution (Mode 1)
  • Use the MILP algorithm to solve the optimization problem and obtain the optimal solution for maximizing profit from the off-grid solar PV CS.
(7)
Solution (Mode 2)
  • Use the MILP algorithm to solve the optimization problem by relaxing the constraint on the battery capacity so that the optimal size of the battery for maximum profit can be achieved.
Therefore, in ref. [17], the optimal battery size for maximum profit was found to be considerably large. The battery size and SOC were determined to be E ¯ = 3000 kWh and E 0 = 2500 kWh, respectively. However, with the proposed method, the SPEVCS with the same battery specifications and connected to the grid results in a higher profit. Table 4 shows the profit that can be made with the proposed system compared to the off-grid system proposed in ref. [17].
The proposed formulation results in a total daily profit of USD 3739. However, it is not recommended due to the considerable size of the battery required for a 1 MWp SPEVCS, which would incur additional associated costs and upfront costs amongst others. Alternatively, as shown in the earlier section, selecting a battery with a smaller capacity of 1000 kWh yields a profit of USD 3129.6, resulting in a marginal difference of only USD 509.4.
The identification of the optimal battery size for the SPEVCS demands a multifaceted analysis, extending beyond mere profit considerations. Economic factors, encompassing installation, maintenance, and infrastructure costs, must align with the financial objectives of the project. Simultaneously, a conscientious evaluation of the environmental impact, including resource extraction and production processes associated with larger batteries, is crucial for ensuring ecological sustainability. Moreover, a forward-looking approach is essential to assess the long-term sustainability of the chosen battery size, considering factors such as lifespan, cycle durability, and compatibility with evolving technologies. The incorporation of MILP enhances the optimization process, providing a systematic and mathematical framework to precisely determine the optimal battery size and profit. This analytical approach considers discrete variables, such as the battery capacity, alongside continuous variables, facilitating a more accurate representation of real-world constraints and contributing to a more robust and reliable decision-making process for the SPEVCS. By integrating these considerations into the decision-making process, a judicious choice can be made to optimize profitability while fostering a sustainable and environmentally responsible SPEVCS.

4. Conclusions

An innovative approach for optimizing the operation of a solar PV-based commercial EV charging station (SPEVCS) integrated with a battery energy storage system (BESS) and grid interaction has been proposed. The effectiveness of the formulation was validated through comprehensive datasets, results analysis, and subsequent explanations.
The dataset utilized comprised solar PV generation, BESS parameters, grid interaction costs, EV arrival probabilities, and load demands. These datasets were crucial for establishing the efficacy of the proposed methodology. The SPEVCS considered in this study, although hypothetical, accurately represented real-world conditions, and the dataset’s validity substantiated the study’s credibility. The case study was based in Poland, and therefore, the proposed algorithm’s performance was evaluated under representative energy conditions where the PV panels operated below their rated specifications, leading to challenging CS conditions.
The analysis demonstrated that the proposed formulation offers effective solutions for both off-grid and grid-connected systems. In the case of an off-grid scenario, a larger battery size was identified as essential to meet load demands, while in a grid-connected configuration, a profit-oriented approach was adopted. The optimization process effectively balanced solar power generation, battery charging, discharging, and grid interactions to maximize profit. Surplus solar power was optimally harnessed by either storing it in the battery or selling it to the grid. Conversely, during periods of deficit solar power, efficient management of grid power and battery discharge was observed to meet the load demand.
The study also scrutinized the optimal battery size for profit maximization. The comparison revealed that while a larger battery size could potentially yield marginally higher profits, the practicality and cost-effectiveness of implementing such a system remained a challenge. Therefore, the proposed formulation suggested a more reasonable battery size that achieved substantial profits without significantly increasing costs.
In conclusion, the proposed formulation showcased a balanced approach to utilizing solar energy, BESS capabilities, and grid interactions for optimal profit in a SPEVCS. By intelligently managing energy flows and interactions, the proposed method demonstrated its potential to contribute to the efficiency and sustainability of renewable energy systems.

Author Contributions

Conceptualization, A.D.; methodology, A.D., B.B. and B.V.; software, A.D.; validation, A.D., B.B. and B.V.; formal analysis, A.D.; investigation, A.D.; resources, A.D.; data curation, A.D.; writing—original draft preparation, A.D.; writing—review and editing, B.B. and B.V.; visualization, A.D.; supervision, B.B. and B.V.; project administration, A.D. and B.B.; funding acquisition, B.B. All authors have read and agreed to the published version of the manuscript.

Funding

This research received no external funding. The APC was funded by the Ministry of Education and Science, Poland, at the Bialystok University of Technology under the research project WZ/WE-IA/7/2023.

Data Availability Statement

The datasets are available publicly. The solar PV data are available in ref. [29], and the EV arrival data have been obtained from ref. [32].

Conflicts of Interest

There are no conflict of interest.

Nomenclature

SymbolDefinition
A c fixed cost of battery charging
A d fixed cost of battery discharging
A p v fixed cost of the solar PV system
B c linearly varying cost of battery charging
B d linearly varying cost of battery discharging
B p v linearly varying cost of the solar PV system
C b cost of battery associated with every charging cycle of the battery
D o D depth of discharge of the battery
E ( 0 ) battery power, initial state of charge of battery
E ¯ maximum battery energy
E t total battery energy at the specified time t
K charging station’s capacity
P c charging power
P t c ¯ maximum charging power at time t
P d discharging power
P t d ¯ maximum discharging power at time t
P d f deficit power (power delivered to the SPEVCS from the grid)
P t d f ¯ upper bounds of the deficit power at time t
P e v EV load power (power required to load EV)
P p v solar power (power from PV panels)
P p v ~ median of the day-ahead solar power generation forecast
P o e v net power output from the SPEVCS and EV
P s p surplus power (power purchase from the SPEVCS to the grid)
P t s p ¯ upper bounds of the surplus power at time t
P R net profit
R e v revenue from charging the EV
R g r 1 revenue from selling energy to the grid
R g r 2 revenue from selling energy purchased from the grid and sold to the EV
R n e t net revenue
S binary status (charge/discharge) of the battery
U c operational status of the battery while charging
U d operational status of the battery while discharging
U d f operational status of the deficit power
U s p operational status of the surplus power
α charging rate (single price tariff)
β selling rate (the price of surplus energy sold to the grid)
γ price   of   energy   when   deficit   power   P d f is purchased from the grid
η b the efficiency of the battery
ρ t e v relative value of EV powers connected to the charging station at time t

References

  1. Solar Energy. Available online: https://www.irena.org/Energy-Transition/Technology/Solar-energy (accessed on 21 September 2023).
  2. Cifuentes-Faura, J. European Union Policies and Their Role in Combating Climate Change over the Years. Air Qual. Atmos. Health 2022, 15, 1333–1340. [Google Scholar] [CrossRef] [PubMed]
  3. Wassiliadis, N.; Schneider, J.; Frank, A.; Wildfeuer, L.; Lin, X.; Jossen, A.; Lienkamp, M. Review of Fast Charging Strategies for Lithium-Ion Battery Systems and Their Applicability for Battery Electric Vehicles. J. Energy Storage 2021, 44, 103306. [Google Scholar] [CrossRef]
  4. Miri, I.; Fotouhi, A.; Ewin, N. Electric Vehicle Energy Consumption Modelling and Estimation—A Case Study. Int. J. Energy Res. 2021, 45, 501–520. [Google Scholar] [CrossRef]
  5. Wang, G.; Xu, Z.; Wen, F.; Wong, K.P. Traffic-Constrained Multiobjective Planning of Electric-Vehicle Charging Stations. IEEE Trans. Power Deliv. 2013, 28, 2363–2372. [Google Scholar] [CrossRef]
  6. Baik, S.; Jin, Y.; Yoon, Y. Determining Equipment Capacity of Electric Vehicle Charging Station Operator for Profit Maximization. Energies 2018, 11, 2301. [Google Scholar] [CrossRef]
  7. Funke, S.Á.; Sprei, F.; Gnann, T.; Plötz, P. How Much Charging Infrastructure Do Electric Vehicles Need? A Review of the Evidence and International Comparison. Transp. Res. Part Transp. Environ. 2019, 77, 224–242. [Google Scholar] [CrossRef]
  8. Khan, W.; Ahmad, A.; Ahmad, F.; Saad Alam, M. A Comprehensive Review of Fast Charging Infrastructure for Electric Vehicles. Smart Sci. 2018, 6, 100006. [Google Scholar] [CrossRef]
  9. Falvo, M.; Sbordone, D.; Bayram, I.S.; Devetsikiotis, M. EV Charging Stations and Modes: International Standards. In Proceedings of the International Symposium on Power Electronics, Electrical Drives, Automation and Motion, SPEEDAM 2014, Ischia, Italy, 1 June 2014; pp. 1134–1139. [Google Scholar]
  10. Mukherjee, J.C.; Gupta, A. A Review of Charge Scheduling of Electric Vehicles in Smart Grid. IEEE Syst. J. 2015, 9, 1541–1553. [Google Scholar] [CrossRef]
  11. Lee, J.H.; Chakraborty, D.; Hardman, S.J.; Tal, G. Exploring Electric Vehicle Charging Patterns: Mixed Usage of Charging Infrastructure. Transp. Res. Part Transp. Environ. 2020, 79, 102249. [Google Scholar] [CrossRef]
  12. Nishimwe, H.L.F.; Yoon, S.-G. Combined Optimal Planning and Operation of a Fast EV-Charging Station Integrated with Solar PV and ESS. Energies 2021, 14, 3152. [Google Scholar] [CrossRef]
  13. Jiang, W.; Zhen, Y. A Real-Time EV Charging Scheduling for Parking Lots with PV System and Energy Store System. IEEE Access 2019, 7, 86184–86193. [Google Scholar] [CrossRef]
  14. Moon, H.; Park, S.Y.; Jeong, C.; Lee, J. Forecasting Electricity Demand of Electric Vehicles by Analyzing Consumers’ Charging Patterns. Transp. Res. Part Transp. Environ. 2018, 62, 64–79. [Google Scholar] [CrossRef]
  15. Alghamdi, T.G.; Said, D.; Mouftah, H.T. Profit Maximization for EVSEs-Based Solar Energy in Smart Cities. In Proceedings of the 2021 International Wireless Communications and Mobile Computing (IWCMC), Harbin, China, 28 June 2021; pp. 1575–1580. [Google Scholar]
  16. Wang, S.; Bi, S.; Zhang, Y.-J.A.; Huang, J. Electrical Vehicle Charging Station Profit Maximization: Admission, Pricing, and Online Scheduling. IEEE Trans. Sustain. Energy 2018, 9, 1722–1731. [Google Scholar] [CrossRef]
  17. Dukpa, A.; Butrylo, B. MILP-Based Profit Maximization of Electric Vehicle Charging Station Based on Solar and EV Arrival Forecasts. Energies 2022, 15, 5760. [Google Scholar] [CrossRef]
  18. Puranen, P.; Kosonen, A.; Ahola, J. Technical Feasibility Evaluation of a Solar PV Based Off-Grid Domestic Energy System with Battery and Hydrogen Energy Storage in Northern Climates. Sol. Energy 2021, 213, 246–259. [Google Scholar] [CrossRef]
  19. Singla, A.; Singh, K.; Kumar Yadav, V. Optimization of Distributed Solar Photovoltaic Power Generation in Day-Ahead Electricity Market Incorporating Irradiance Uncertainty. J. Mod. Power Syst. Clean Energy 2021, 9, 545–560. [Google Scholar] [CrossRef]
  20. Khatod, D.K.; Pant, V.; Sharma, J. Evolutionary Programming Based Optimal Placement of Renewable Distributed Generators. IEEE Trans. Power Syst. 2013, 28, 683–695. [Google Scholar] [CrossRef]
  21. Dukpa, A.; Duggal, I.; Venkatesh, B.; Chang, L. Optimal Participation and Risk Mitigation of Wind Generators in an Electricity Market. IET Renew. Power Gener. 2010, 4, 165. [Google Scholar] [CrossRef]
  22. Lugo-Laguna, D.; Arcos-Vargas, A.; Nuñez-Hernandez, F. A European Assessment of the Solar Energy Cost: Key Factors and Optimal Technology. Sustainability 2021, 13, 3238. [Google Scholar] [CrossRef]
  23. Development of Rapid Ultra Rapid Charging UK. Available online: https://uk.mer.eco/news/the-development-of-rapid-ultra-rapid-charging-in-the-uk/ (accessed on 14 June 2022).
  24. Ministry of Climate and Environment—Gov.Pl Website; New Programme of NFOŚiGW—An Impulse for the Development of Electric Vehicle Charging Infrastructure in Poland. Available online: https://www.gov.pl/web/climate/new-programme-of-nfosigw--an-impulse-for-the-development-of-electric-vehicle-charging-infrastructure-in-poland (accessed on 12 July 2022).
  25. Nait-Sidi-Moh, A.; Ruzmetov, A.; Bakhouya, M.; Naitmalek, Y.; Gaber, J. A Prediction Model of Electric Vehicle Charging Requests. Procedia Comput. Sci. 2018, 141, 127–134. [Google Scholar] [CrossRef]
  26. He, Y.; Venkatesh, B.; Guan, L. Optimal Scheduling for Charging and Discharging of Electric Vehicles. IEEE Trans. Smart Grid 2012, 3, 1095–1105. [Google Scholar] [CrossRef]
  27. Xydas, E.S.; Marmaras, C.E.; Cipcigan, L.M.; Hassan, A.S.; Jenkins, N. Forecasting Electric Vehicle Charging Demand Using Support Vector Machines. In Proceedings of the 2013 48th International Universities’ Power Engineering Conference (UPEC), Dublin, Ireland, 2–5 September 2013; pp. 1–6. [Google Scholar]
  28. Quiros-Tortos, J.; Ochoa, L.; Butler, T. How Electric Vehicles and the Grid Work Together: Lessons Learned from One of the Largest Electric Vehicle Trials in the World. IEEE Power Energy Mag. 2018, 16, 64–76. [Google Scholar] [CrossRef]
  29. Renewables.ninja. Available online: https://www.renewables.ninja/ (accessed on 14 June 2022).
  30. Mongird, K.; Viswanathan, V.; Balducci, P.; Alam, J.; Fotedar, V.; Koritarov, V.; Hadjerioua, B. An Evaluation of Energy Storage Cost and Performance Characteristics. Energies 2020, 13, 3307. [Google Scholar] [CrossRef]
  31. Lojowska, A.; Kurowicka, D.; Papaefthymiou, G.; van der Sluis, L. Stochastic Modeling of Power Demand Due to EVs Using Copula. IEEE Trans. Power Syst. 2012, 27, 1960–1968. [Google Scholar] [CrossRef]
  32. Li, Y.; Huang, Y.; Zhang, M. Short-Term Load Forecasting for Electric Vehicle Charging Station Based on Niche Immunity Lion Algorithm and Convolutional Neural Network. Energies 2018, 11, 1253. [Google Scholar] [CrossRef]
  33. GreenWay. Your Partner in Electromobility. Available online: https://greenwaypolska.pl/uslugi-ladowania (accessed on 22 August 2023).
  34. RCEm. Market Monthly Electricity Price—PSE. Available online: https://www.pse.pl/oire/rcem-rynkowa-miesieczna-cena-energii-elektrycznej (accessed on 10 August 2023).
Figure 1. Methodology of the research.
Energies 16 08086 g001
Figure 2. SPEVCS with the grid.
Energies 16 08086 g002
Figure 3. Distribution of solar PV and EV load.
Energies 16 08086 g003
Figure 4. The surplus power P s p and deficit power P d f .
Energies 16 08086 g004
Figure 5. Grid power and battery energy.
Energies 16 08086 g005
Figure 6. Charging and discharging schedule of the battery.
Energies 16 08086 g006
Figure 7. The number of battery cycles (charging–discharging).
Energies 16 08086 g007
Table 1. Battery parameters.
Efficiency, η b (%)90
Depth of discharge: DoD (%)80
Battery size: E ¯ (kWh) 1000
Table 2. Day-ahead forecast of EV arrival [32].
Time0 h1 h2 h3 h4 h5 h6 h7 h8 h9 h10 h11 h
EV arrival data from [32]28240226925124650385015602100375736122635
Load   based   on   the   probability   of   arrivals   ρ e v (%)4.26.04.03.83.77.612.823.531.656.554.339.6
Time12 h13 h14 h15 h16 h17 h18 h19 h20 h21 h22 h23 h
EV arrival data from [32]33544335406346543498264727953479357720591135374
Load   based   on   the   probability   of   arrivals   ρ e v (%)50.465.261.170.052.639.842.052.353.831.017.15.6
Table 3. Comparative analysis with that of ref. [17] for the predefined parameters: E ¯   = 1000 kWh and E(0) = 500 kWh.
Off-Grid System—Profit Using Ref. [17]Grid-Connected System—Profit
Not possible to optimize as the battery size is small.
Violation of constraint Equation (21)
Deficit power is purchased from the grid,
resulting in a profit of USD 3129.6
Table 4. Comparative analysis of the solution with optimal battery size, E ¯ = 3000 kWh, E(0) = 2500 kWh.
Profit as per Ref. [17]Profit—Proposed Method
USD 2674.3USD 3739
Disclaimer/Publisher’s Note: The statements, opinions and data contained in all publications are solely those of the individual author(s) and contributor(s) and not of MDPI and/or the editor(s). MDPI and/or the editor(s) disclaim responsibility for any injury to people or property resulting from any ideas, methods, instructions or products referred to in the content.

