Article

Utilization of Sunflower Husk Ash in the Production of Polyurethane Materials

Faculty of Metals Engineering and Industrial Computer Science, Department of Heat Engineering and Environment Protection, AGH University of Krakow, Mickiewicza 30 Av., 30-059 Krakow, Poland
*
Author to whom correspondence should be addressed.
Energies 2023, 16(24), 8080; https://doi.org/10.3390/en16248080
Submission received: 27 November 2023 / Revised: 8 December 2023 / Accepted: 13 December 2023 / Published: 15 December 2023
(This article belongs to the Special Issue Biomass, Biofuels and Waste)

Abstract

:
Energy produced from waste biomass is more environmentally friendly than that produced from fossil resources. However, the problem of managing waste from the thermal conversion of biomass arises. The overarching goal of this article was to propose a method of utilizing biomass ash (sunflower husk) as a filler that positively affects the properties of rigid polyurethane foams. The scope of the presented research is to obtain and characterize rigid polyurethane foams (RPUFs) with the addition of two types of fillers: sunflower husks (SHs) and sunflower husk ash (SHA). First, an analysis of the fillers was carried out. The carbon content of SHs (C~49%) was ten times higher in comparison to SHA’s carbon content (C~5%). The morphology of the fillers and the particle size distribution were determined, which showed that in the case of SHs, particles with a size of 500–1000 µm predominated, while in SHA, the particles were 1–20 µm. The content of inorganic compounds was also determined. Potassium and calcium compounds were the most abundant in both fillers. The second part of the research was the analysis of polyurethane materials with the addition of fillers. The obtained results indicate that filler addition had a positive effect on the dimensional stability of the foams by eliminating the risk of material shrinkage. The biodegradation process of polyurethane materials was also carried out. The reference foam weight loss after 8 weeks was ~10%, while the weight loss of the foam containing SHA was over 28%. Physical and mechanical properties, cell structure, and thermal stability tests were also carried out. The use of bio-waste fillers creates a possibility for the partial replacement of petrochemical products with environmentally friendly and recycled materials, which fits into the circular economy strategy.

1. Introduction

Polyurethanes are a group of materials widely used as insulating materials [1]. One of the most frequently chosen thermal insulation materials is rigid polyurethane foam (RPUF). Polyurethane foams are most often produced by the intensive mixing of two components: polyether or polyester polyol with polyisocyanate (toluene diisocyanate, methylenediphenylene) [2]. In addition, other ingredients are added such as blowing agents, which are responsible for the formation of closed cells, catalysts, and surfactants, which are used to unify the formed foam cells [3]. Apart from the relatively easy and quick synthesis of the material, RPUF is characterized by very good functional properties. In addition, RPUF is characterized by the lowest thermal conductivity coefficient of all available thermal insulation materials and has a very good biological and chemical resistance [4].
Due to the sustainable development implemented in many countries and the importance of environmental protection, plastics, including RPUF, are problematic. It has been estimated that by 2050, the weight of plastic in the oceans will exceed the total weight of the fish living there. Therefore, the possibility for the partial replacement of petrochemical products with environmentally friendly and recycled materials should be pursued.
In accordance with the principle of the circular economy, polyurethane foams can be made more environmentally friendly by replacing some petrochemicals with waste e.g., fly ash, bio-based fillers [5,6] and other natural substances. The main problem with this approach is that often the natural materials used in RPUF technology negatively affect the properties of the foams. Therefore, it is very important to properly select the fillers. In order to increase, i.a., mechanical strength, the literature describes the use of fillers in the form of fibers, nanoparticles, and solid particles. Among the fibers described in the literature, synthetic or natural fibers can be distinguished. The group of synthetic fibers includes, among others, aramid fibers, which, due to their unique properties, positively affect the properties of polymeric materials [7]. Currently, however, more emphasis is placed on the use of natural fibers, which have a similar effect on the final properties of polyurethane composites but are safer for human health and the environment. Natural fibers described in the literature include jute, flax, betelnut fiber, banana fiber, and kenaf fiber [8,9]. Another group of fillers reported in the literature are nanofillers. The introduction of nanofillers to polyurethane foams results in the creation of both light and strong materials with good mechanical properties. The group of nanofillers used in the technology of rigid polyurethane foams includes nanosilica, nanocalcium carbonate, and nanoclay [10].
A simple and economical approach is to introduce particulate fillers into the RPUF system. These types of fillers improve the properties of the foams, and due to the fact that they are most often waste that requires management, they reduce the production cost of polyurethane materials. The literature describes the use of such fillers as talc, calcium carbonate, dolomite, egg shells, and various types of nut shells [1,11]. Ribeiro Da Silva et al. [12] described the possibility of using rice husk ash as a filler, which is another example of a particulate filler. It has been noted that this filler contains a large amount of silica. Additionally, even a small addition of rice husk ash has a positive effect on the physicochemical properties of polyurethane foams, i.e., thermal conductivity, density, and morphology. Kairytė et al. [13,14] described the possibility of using biomass ash as a filler in polyurethane composites. They found that the addition of this type of filler lowered the thermal conductivity of the materials as a result of structure modification. The biomass ash also had a beneficial effect on the mechanical properties of the foams [15].
This work proposes to apply two forms of filler: natural fibers derived from sunflower husks (SHs) and a particulate filler in the form of sunflower husk ash (SHA) into the RPUFs production. SHs are waste biomass generated in the food industry. They are a waste widely available due to the fact that sunflower oil is one of the most common types of cooking oil. Currently, SHs are mainly thermally recycled, as a result of which, SHA is formed [16]. This is an important topic from an energy standpoint, as it allows for the production of green energy. SHs are an excellent fuel that has a high energy value due to the fat content in its composition. Our work also points to opportunities to solve the problem of ash storage. SHs are a desirable filler in RPUF technology because they contain a large amount of cellulose (48.4%), one of the naturally occurring polymers. Due to the fact that it has hydroxyl groups in its structure, it is possible to reduce the amount of petrochemical substances during the production of RPUFs. The hydroxyl groups have a positive effect on the reactivity of the polyol mixture with filler and isocyanate. In addition, SHs contain a large amount of lignin (17.0%) and trace amounts of K, Ca, and Mg [15]. Lignin and cellulose are compounds that decompose at high temperatures (lignin at 280–500 °C and cellulose at 250–350 °C). Due to the fact that SHs contain large amounts of these compounds, it may also increase the thermal stability of the obtained composites [6,17]. However, in the studies presented so far, the effect of ash from SHs on the properties of RPUFs has not been analyzed. This is an important topic from the point of view of waste management because Poland is one of the largest producers of sunflower oil in the world. Therefore, a lot of waste is generated, which is then subjected to thermal conversion. In order to avoid ash storage, a good solution would be to use it as a filler in polyurethane foams.

2. Materials and Methods

2.1. Reagents for the Production of Rigid Polyurethane Foam

Polyurethane composites were prepared on the basis of the EKOPRODUR PM4032 system purchased from the PCC Group (Poland). The system for producing polyurethane foams consisted of a poly premix (component A) and an isocyanate (component B). Fillers were prepared for the synthesis of rigid polyurethane foams.
In the first stage of the research, SHs were dried at 105 °C in order to remove moisture from them. The drying process lasted about 24 h until a constant mass of dried husks was observed. The husks were then ground with the use of a laboratory grinder (IKA MultiDrive Control, Freiburg, Germany). SHA was obtained by the combustion of SHs at 550 °C. This process was carried out in accordance with the ISO 18122:2015 standard [18] “Solid biofuels–determination based on ash content” in a muffle furnace.
The synthesis of polyurethane composites began with component A, which was mixed with fillers to obtain a homogeneous mixture. The isocyanate (component B) was then added and mixed at 1200 rpm for about 8 s (until exotherm)—the details are in Table 1. The obtained polyurethane mixture was poured into molds and left for 48 h. The operation was repeated 4 times, and as a result, three foams with additives of 3% of SHA and 7% of SH (PU_3SHA7SH), 5% of both fillers (PU_5SHA5SH), 10% of SHA (PU_10SHA), and one reference foam without fillers (PU_REF) were obtained. All the foams were cut and prepared for testing in accordance with the standards.

2.2. Characterization of Fillers and Rigid Polyurethane Foam Samples

Prior to the incorporation of the filler into the polymer matrix, both fillers were characterized using several methods. The LECO CHN 628 (LECO Corporation, Benton Harbor, MI, USA) device was used to determine the content of carbon, hydrogen, and nitrogen. The scanning electron microscope JEOL JSM5410 (JEOL, Peabody, MA, USA) was used to observe the structure of the fillers. In addition, in order to determine the size of the filler particles used in the synthesis of RPUFs, the laser diffraction method was used (Mastersizer 2000S device; Malvern Instruments Ltd., Malvern, UK). In order to assess the chemical composition of the biomass and the ash from this biomass, the X-ray fluorescence (XRF) instrumental technique was used using tablets melted with the WD-XRF ZSX Primus II Rigaku lamp (Rh lamp) (Rigaku, Japan, Tokyo). This method uses a qualitative analysis of the spectrum by identifying spectral lines and determining their possible simultaneous occurrence. Using the SQX (Fundamental Parameter Method) calculation program, a semi-quantitative analysis was developed.
The dynamic viscosity of the polyol premix was determined using the Brookfield method on a Brookfield DV2T Viscometer (Brookfield Engineering Laboratories, Inc., Middleboro, MA, USA). The apparent density of the RPUFs was determined by geometric method according to ISO 845 [19]. The samples used in the tests had a volume of 100 cm3. The surface morphology, cell size distribution, and the influence of filler on the cellular structure were examined with a scanning electron microscope, JEOL JSM5410 (JEOL, Peabody, MA, USA). The closed-pore content was derived through SEM image analysis. The software developed quantified the black regions in the microphotographs, signifying open pores. Three microphotographs were scrutinized for each sample, and the mean value was established. The dimensional stability testing was performed according to ASTM D2126 [20]. The changes in linear dimensions and weight due to the exposure of the foams to 70 °C were measured weekly for 7 weeks. The friability was determined on the basis of the ASTM C421 [21] procedure. The test consists of rotating the weighed samples in an oak box with cubes and weighing them after the process; the brittleness is determined from the difference in mass. Twelve cubic samples with dimensions of 25 × 25 × 25 mm were used in the tests. The biodegradability was determined in accordance with ASTM D5988 [22]. Weighed samples were stored in soil for 49 days. Every 7 days, they were removed, washed with distilled water, and reweighed. Biodegradability (% D) was calculated as the ratio of the difference in weight before and after soil residence. Additionally, the LECO CHN 628 (LECO Corporation, Benton Harbor, MI, USA) device measured the concentrations of C, H, and N in the samples kept in the soil. The initial sample dimensions were 100 × 50 × 25 mm. The hardness was measured as reported by ASTM D2240 [23] using the Shore HD3000 OO (Hildebrand, Germany). The sample used in the study had dimensions of 25 × 25 × 25 mm. In order to assess the thermal stability of the produced composites, thermogravimetric analysis and differential scanning calorimetry (STA 449 F3 Jupiter (NETZSCH Gerätebau GmbH, Selb, Germany)) were performed. The thermal stability of the samples was analyzed in platinum crucibles in an air atmosphere in the temperature range of 25–700 °C at a heating rate of 10 °C min−1.

3. Results

3.1. Fillers Characteristics

The results of C, H, and N content measurements for SHA are shown in Table 2, while the results of this analysis for SHs have been researched and published in another paper [5]. The content of the analyzed elements is at a comparable level, as shown in other studies [16]. The carbon content in the fillers is an important parameter because it affects the flammability of the resulting polyurethane composites. SHA has a significantly lower carbon content than SHs. The content of the remaining compounds, hydrogen and nitrogen, is also lower for SHA. The decrease in the amount of the analyzed elements in SHA compared to raw husks is related to the combustion process, during which they are oxidized into CO2, NO, or H2O [24]. The most desirable fillers in polyurethane foam technology are those with the lowest possible C content. Such fillers can reduce the need for flame-retardant compounds. Therefore, the use of elemental content analysis in the study of fillers is important for evaluating the further properties of the foams.
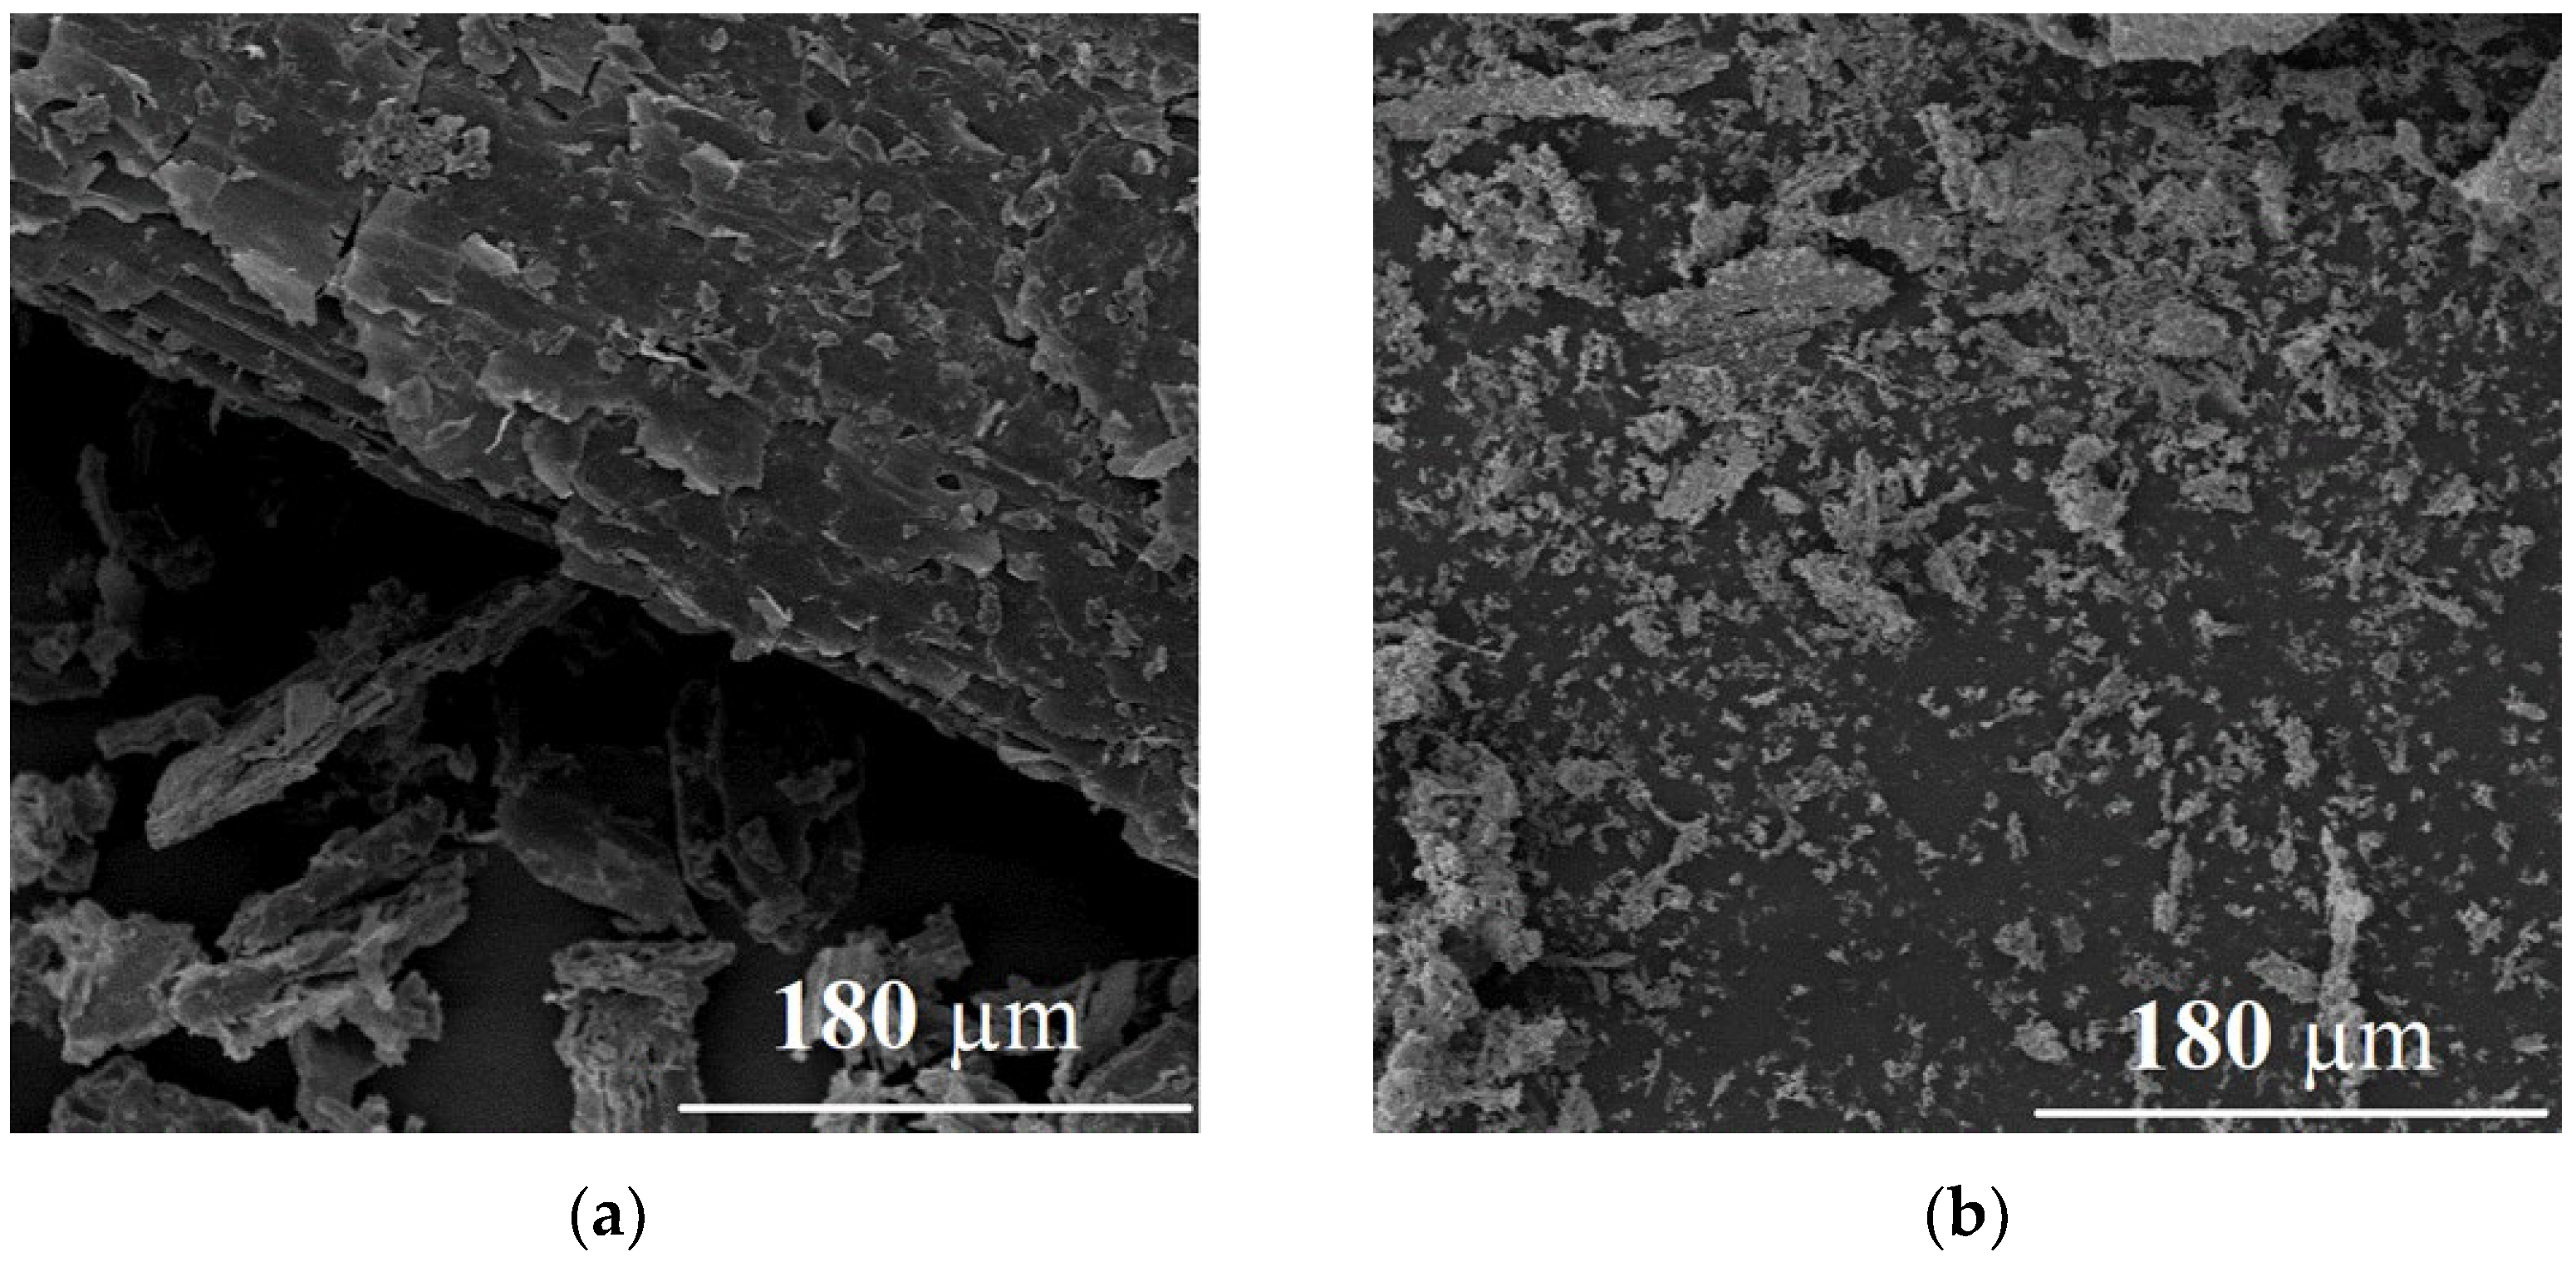
Figure 1a,b show the microscopic structure of fillers. The presence of lignocellulosic structure fibers can be observed in the shredded SHs (Figure 1a). On the other hand, the ash from SHs is in the form of particles with a size of a few microns. The SEM image also shows ash clusters, which is a typical phenomenon during ash formation and indicates the presence of a sintering agglomeration process. In addition, this type of ash does not contain spherical particles, which are typical for coal ash.
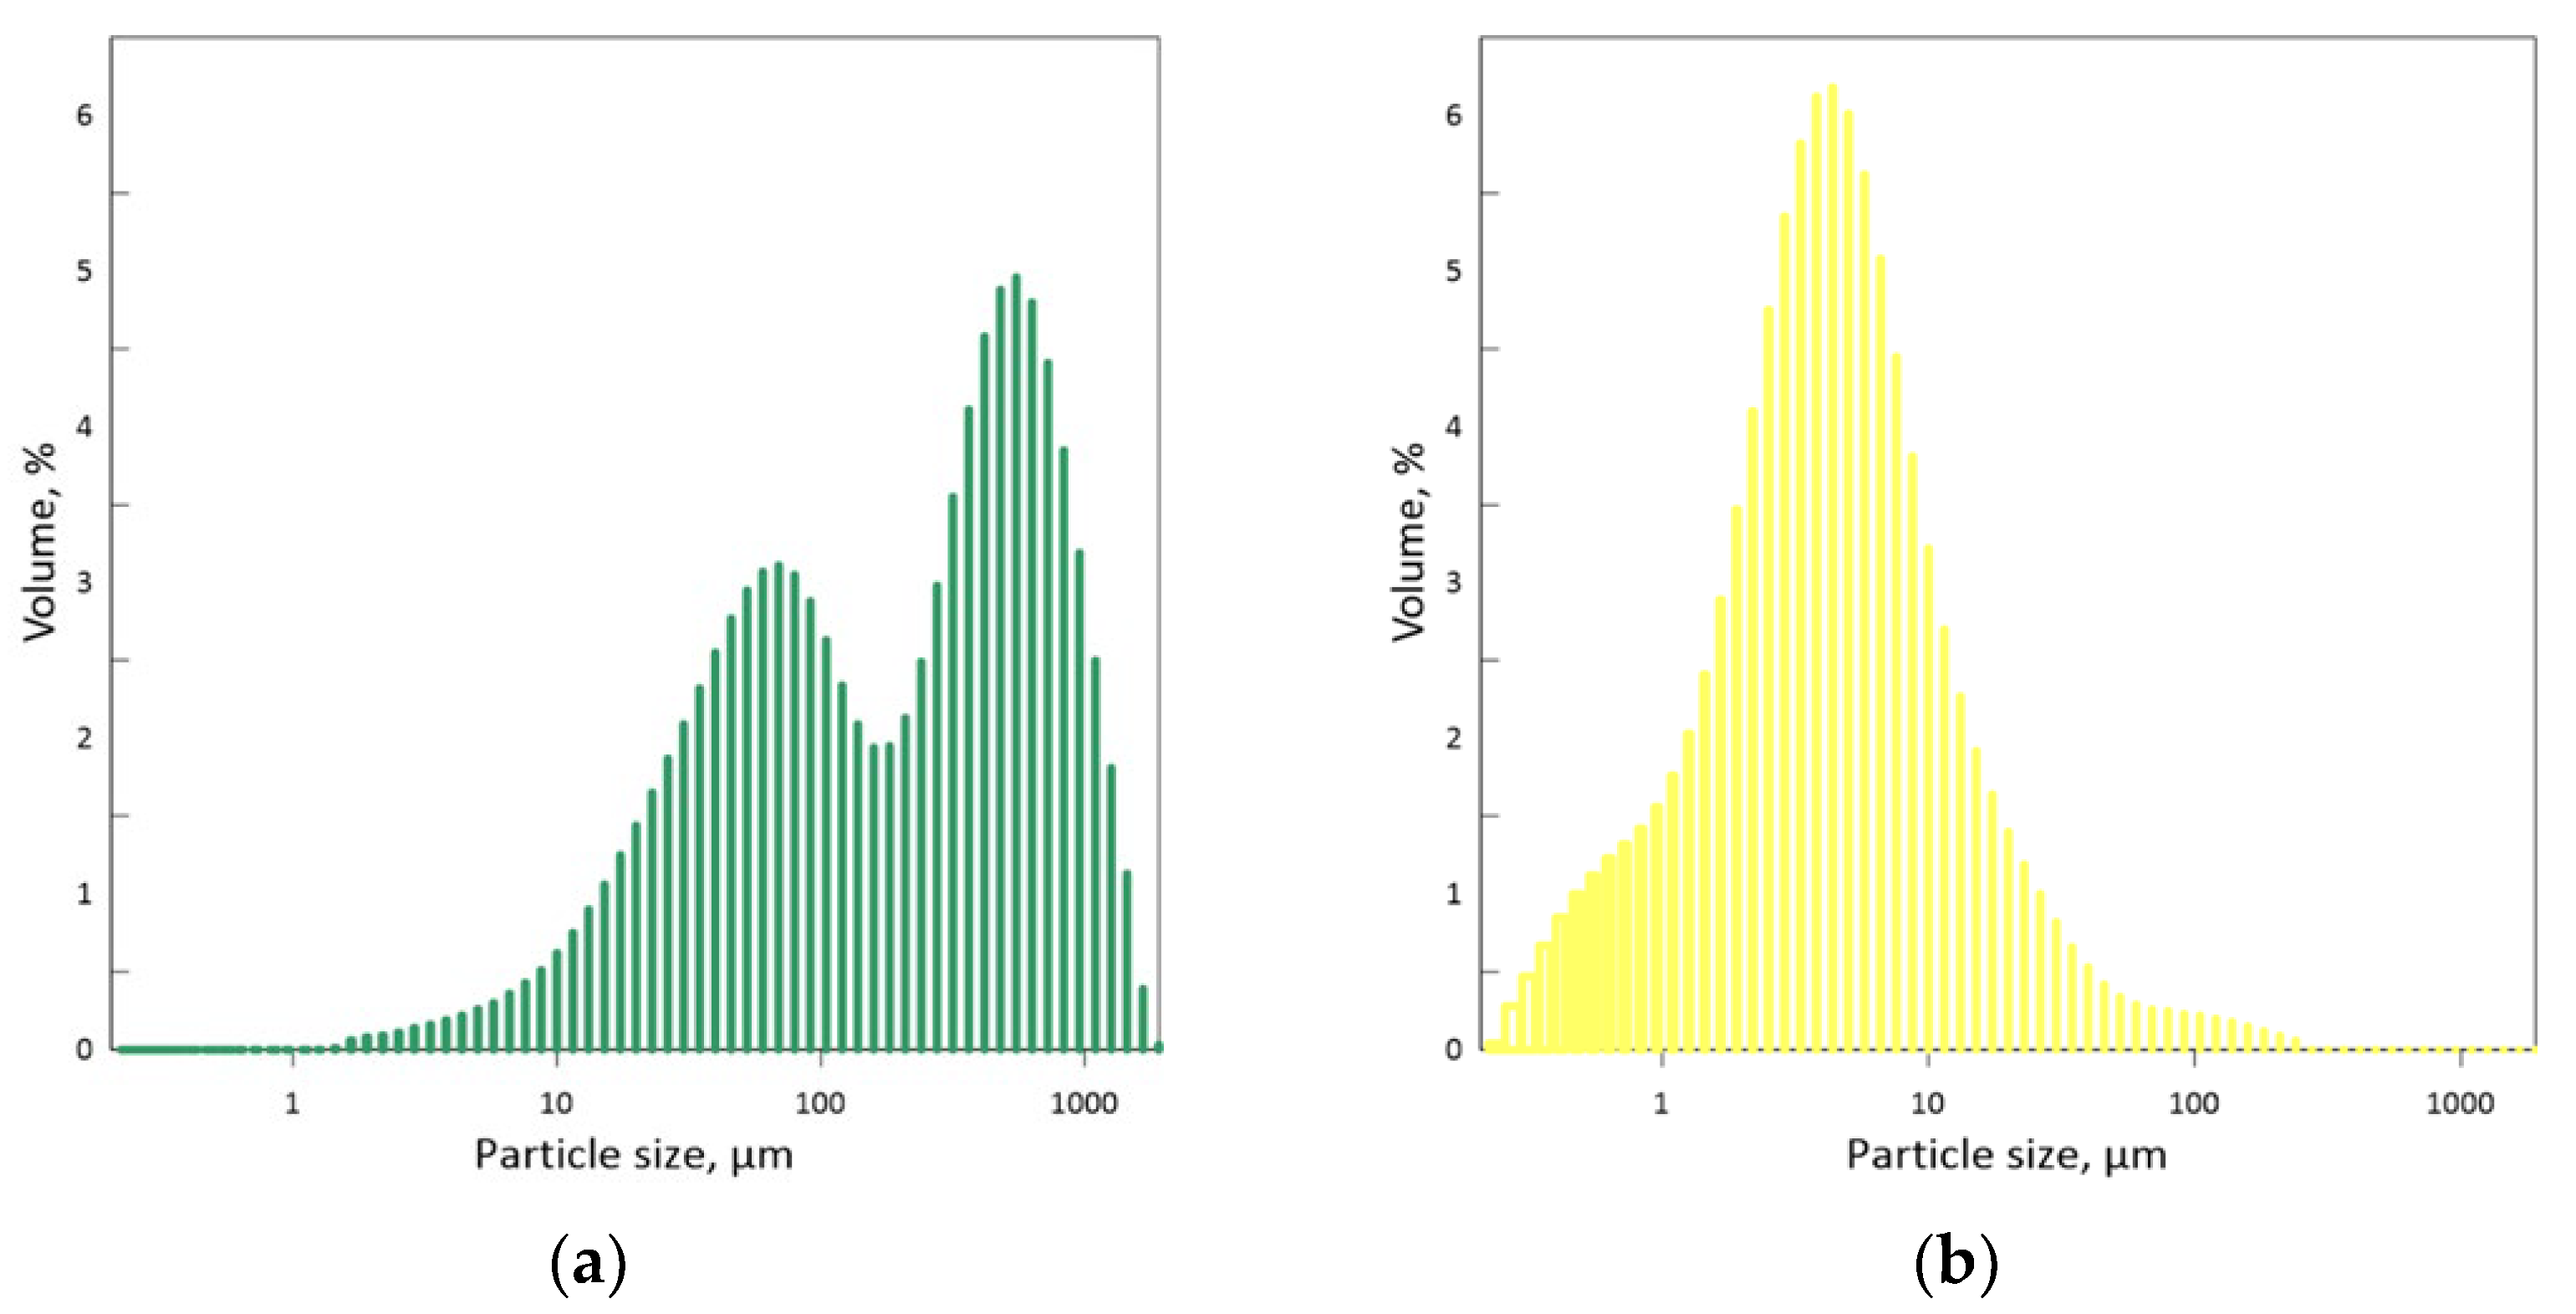
In order to characterize the fillers, a study of the particle size distribution was carried out for both raw biomass (SHs) and ash from this biomass (SHA). The obtained results are presented in Figure 2a,b. In both types of fillers, the particle size distribution ranged between 0.200 and 1000 µm. However, in the case of SHs, particles with a size of 100–1000 µm accounted for the largest share. On the other hand, for SHA, such particles were almost non-existent, and for this type of filler, the largest number of particles was observed in the size range of 1–100 µm. Guo et al. [25] reported in their work that the size distribution of the fragments after comminution and the comminution process itself is correlated with the properties of the material. Biomass particles are needle-shaped after grinding due to the anisotropy in the spatial structure.
The chemical compositions of SHs and SHA determined by the XRF instrumental technique are presented in Table 3. The results are given in elementary form for individual filler components. Biomass ash (SHA) contained the highest content of potassium and calcium, 34.66% and 26.18%, respectively. Raw biomass (SH) samples also showed highest potassium and calcium concentrations of 42.98% and 16.82%, respectively. The obtained results confirm that the main elements in ashes from biomass are, among others, Ca and K [26,27,28].

3.2. Properties of Polyurethane Composites

The conducted research allowed us to assess the potential of the application of agricultural waste, such as SHs and ash from them, in rigid polyurethane foam technology. The assessment was based on basic tests such as apparent density, surface morphology, dimensional stability, brittleness, and hardness. Additionally, an analysis of the thermal stability and biodegradability was performed.
The results of viscosity are shown in Table 4. The highest viscosity value was obtained for the sample containing SHs and SHA in a ratio of 7:3. However, in all samples tested, the introduction of the filler increased the viscosity by more than 18 times compared to the pure polyol.

3.2.1. Density and Cellular Morphology

Apparent density and cellular morphology are the basic properties of the RPUF that should be analyzed. Their values influence the other functional parameters of the material. The apparent density of rigid polyurethane foams increased when fillers were added, reaching values of 36.2 kg/m3 (PU_REF), 41.9 kg/m3 (PU_3SHA7SH), 43.5 kg/m3 (PU_5SHA5SH), and 44.9 kg/m3 (PU_10SHA). This was also reported by numerous studies in the literature [14,29,30,31]. Particularly noteworthy, however, is the fact that the apparent density for composites increased with the increase in the SHA filler. This may be due to the initially increasing lightness of the dynamic mixture with the filler, which was reported by other researchers [13,32].
The cellular structure is another crucial parameter determining the properties of foams. Particularly, the size of the cells and the thickness of the walls and ribs determine the mechanical and physical properties of RPUFs [33,34]. The structure of the obtained composites (size of cells and type: open or closed) depends on the viscosity of the reaction mixture, pressure, and temperature of the foaming process. Figure 3 shows that PU_REF foam had regular cells with thin ribs. With the increase in filler content, in particular SHA, the cells assumed irregular shapes and the thickness of the ribs increased. The increase in the concentration of fillers also caused an increase in the number of open cells (Table 5). Similar observations were noted by other researchers [35].
Figure 3 shows that the obtained polyurethane composites had a closed-cell structure with a slight tendency to open after adding fillers. The smaller diameter of the cells after the addition of fillers resulted from the fact that the mixture’s viscosity increased and cell expansion became more difficult. In addition, filler particles are an excellent place for the nucleation of new cells, which in turn leads to the formation of more cells with a smaller diameter. Only in the case of PU_5SHA5SH did the cell diameter increase, which may be due to the inadequate distribution of the filler in the polyurethane matrix.

3.2.2. Mechanical Properties

The change in the apparent density could affect the mechanical properties of the analyzed materials. Therefore, two basic properties were tested: the hardness of polyurethane composites and their friability. The addition of fillers in the form of SHs and SHA caused the deterioration of friability in relation to unmodified foam, for which this parameter was 4.5%, while for PU_10SHA, the brittleness value more than doubled and amounted to 10.8% (Table 6). However, it has been reported in the literature that composites with a friability of about 10% can be successfully used in the construction and packaging industries [35]. Similarly to friability, the hardness measured by the Shore OO method also deteriorated for foams with fillers compared to the reference foam. It was observed that SHs had a positive effect on this parameter because, for PU_3SHA7SH, which contained about 7% SH and only 3% SHA, the hardness was at a similar level as that of PU_REF. However, with the increase in the concentration of the SHA filler, the hardness decreased, and for the foam that contained 10% SHA, the hardness was lower by about 15% when compared to the basic foam. The decrease in hardness was related to the fact that the number of polyurethane bonds was reduced due to the formation of bonds with fillers. Bonds of this type are less durable than urethane bonds; therefore, the hardness decreases. Such observations were also reported by other scientists in their works [36].
Changes in the linear dimensions of length (Δl), width (Δb), thickness (Δρ), and loss of mass (Δm) during the dimensional stability test are summarized in Table 7. Dimensional stability was tested by simulating the aging process at 70 °C in a laboratory dryer with forced airflow. The research was conducted over a period of seven weeks. Studies published so far indicate that the largest changes in the above-mentioned parameters occurred within 24 h and 72 h [35]. However, our research has shown that for this type of composite with SH and SHA fillers, the materials are stable for up to one week. However, the largest difference in the changes in dimensions and weight was noted after four weeks.
The analyzed parameters of the changes in linear dimensions and mass loss are very important in the context of using RPUFs as thermal insulation materials. They largely depend on the type of blowing agent used. Large changes in linear volumes can cause the plasticization of the polyurethane matrix as a result of dissolving blowing agents in it [37]. Linear dimensions in the aging process can change in two different ways: the so-called shrinkage of the material, marked in the table below with the symbol “−”, i.e., reducing linear dimensions, and the second change is increasing linear dimensions. In Table 7, it can be seen that the reduction in linear dimensions applied only to foam not modified with fillers (PU_REF). This is a very unfavorable phenomenon because it could cause the shrinkage of, e.g., building insulation, and the loss of the original purpose of the insulation material. Therefore, despite the fact that foams modified with fillers show greater changes in dimensions, the use of fillers eliminates the effect of the so-called shrinkage of foams at elevated temperatures. The weight loss is related to ongoing changes, i.e., water evaporation or material degradation. The weight loss for materials with fillers was greater than for unmodified foam by about 40%. However, the weight loss is not influenced by the type and concentration of the filler, because the results of weight loss for RUPFs with fillers were similar.

3.2.3. Biodegradability

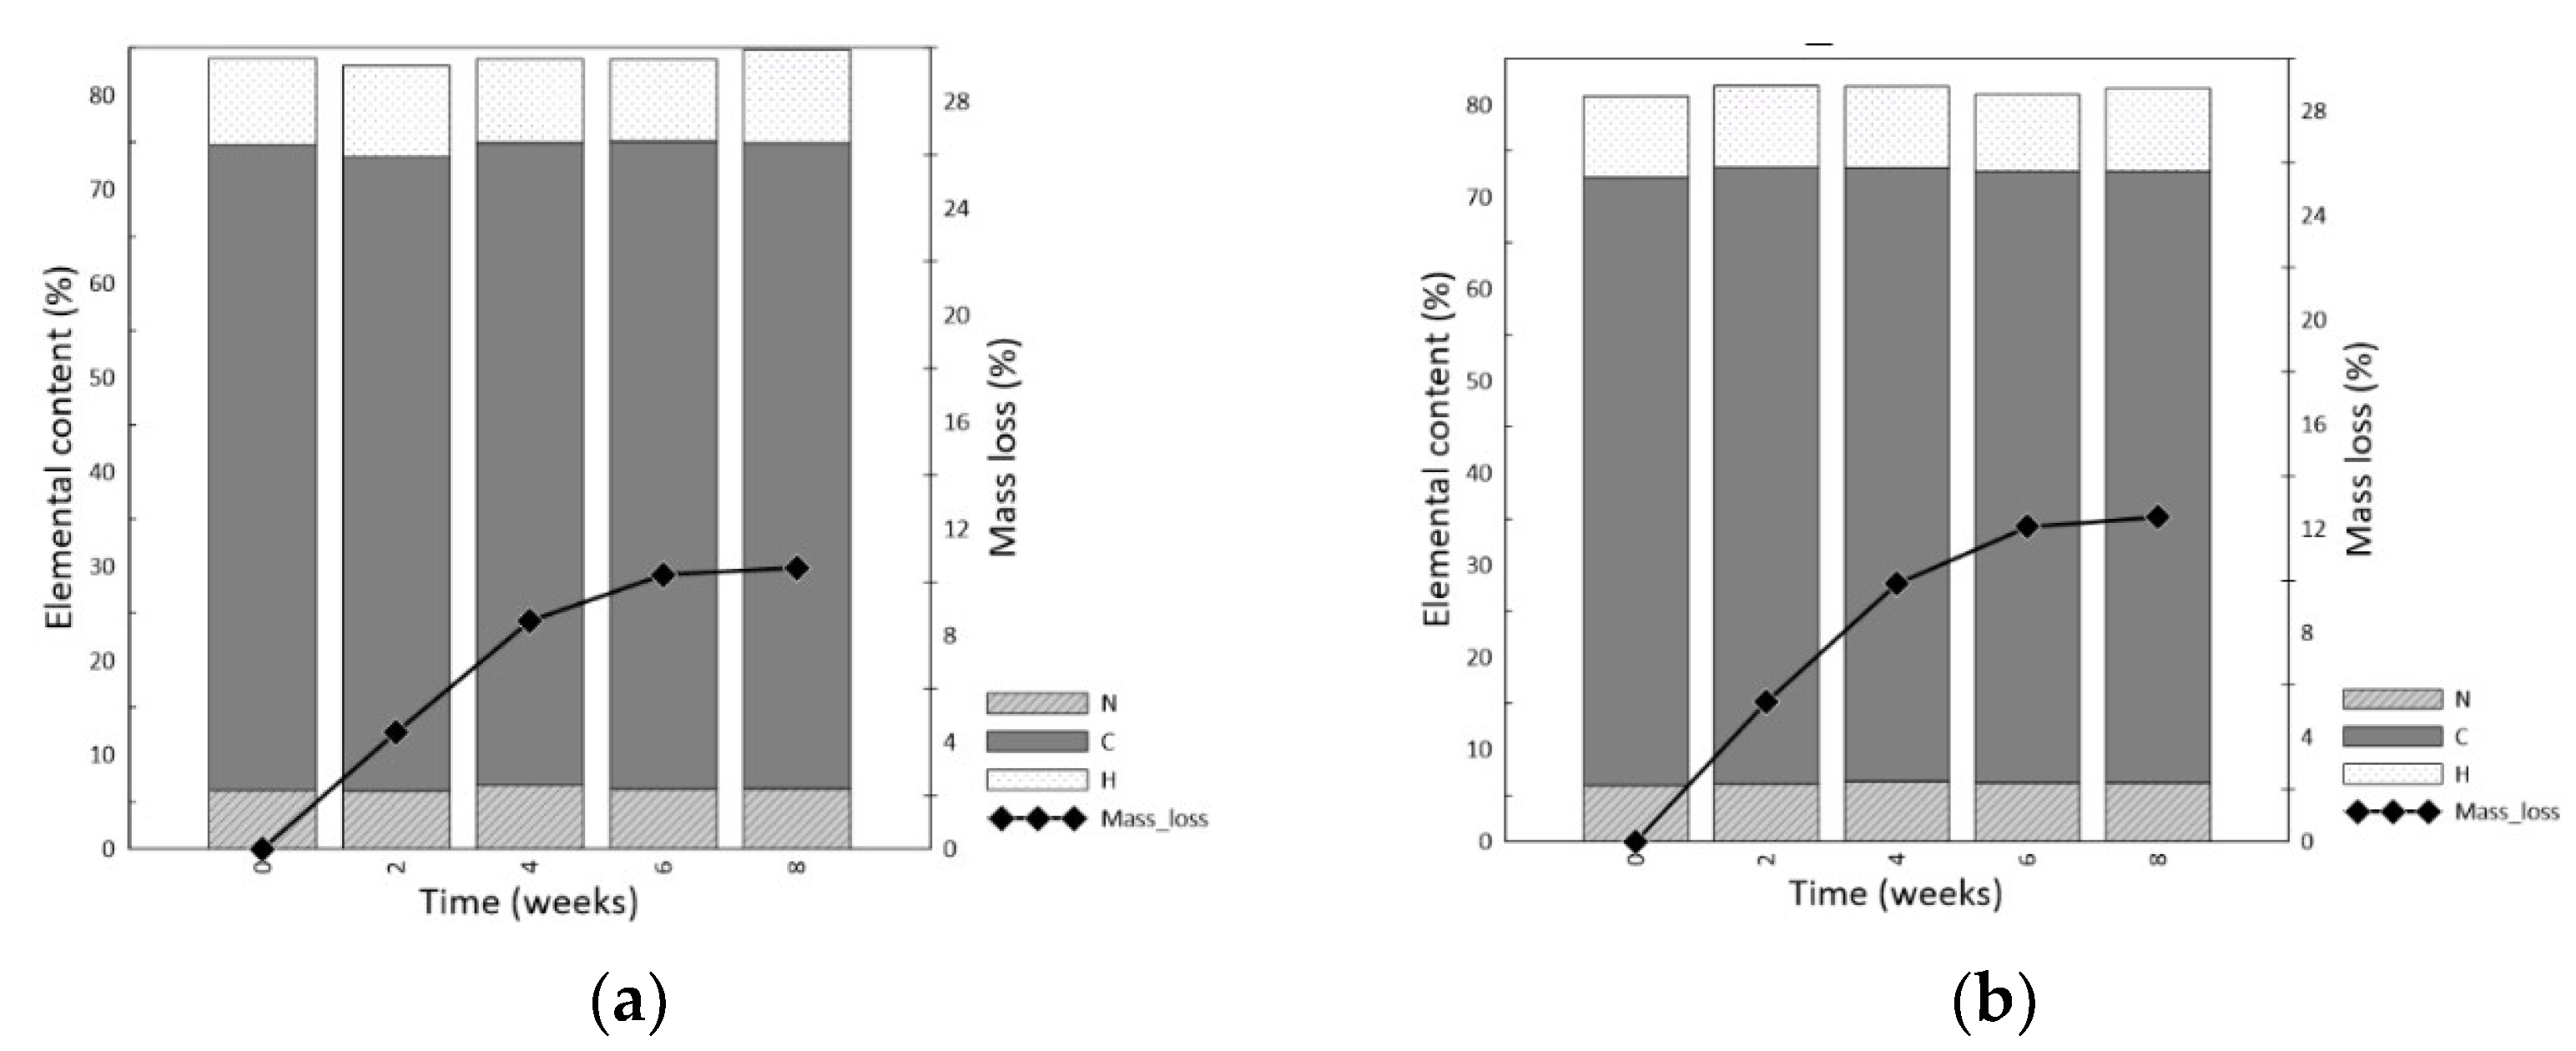
Due to the introduction of biodegradable fillers in the form of husks and ash from SHs to the analyzed polyurethane composites, their impact on the biodegradation process in soil was investigated. The tested composites were placed in the soil for eight weeks and the mass loss and contents of the elements carbon, hydrogen, and nitrogen were determined. The results are shown in Figure 4.
The obtained tests show that the content of elements in the case of foams modified with fillers changes with the time of the residence of the materials in the soil. In contrast, the reference foam hardly shows these changes. The impact of the introduction of biofillers can be clearly seen after losing weight. The greatest weight loss was noted for PU_10SHA (about 30%), while for PU_REF, only 10% of the weight was lost after eight weeks. Borowicz et al. [38] analyzed the impact of reducing the amount of petrochemical polyol and replacing it with bio-polyol produced from white mustard seeds on the biodegradability of RPUFs. They also indicate in their article the positive impact of introducing biodegradable substances into foams on the process of their decomposition in the soil.

3.2.4. Thermal Analysis

The degradation resistance of RPUFs at elevated temperatures is important in the context of the use of these materials in various industries. Therefore, the effect of fillers (SHs, SHA) on thermal stability was evaluated by thermogravimetric analysis (TG) and differential scanning calorimetry (DSC). The obtained results are shown in Figure 5a,b.
The TG curves (Figure 5a) show a slight weight loss at about 50 °C, which is confirmed by the DTG curve. A large percentage of the weight loss for all samples at this temperature is related to the migration of the blowing agent enclosed in the polyurethane matrix to the environment. Initially, up to the temperature of 250 °C, higher thermal resistance was observed for foams with fillers. The largest mass loss for foams with fillers was in the range of 200–550 °C, while for PU_REF, the largest mass loss was recorded at temperatures of 200–600 °C. In these temperature ranges, the urethane bonds break and the isocyanate rings degrade. The higher rate of the degradation of foams with fillers at higher temperatures resulted from the decomposition of organic substances contained in the fillers (Table 8). SHs consist mainly of cellulose, hemicellulose, and lignin. Cellulose and hemicellulose degrade at temperatures of 240–350 °C, while lignin degrades at 280–500 °C [39].
On the DSC curve (Figure 5b), three peaks could be observed—one endothermic and two smaller exothermic ones. Based on the curves, it can be concluded that in the case of foams with fillers, the exothermic effects prevailed and were significantly higher than for the reference foam. For PU_REF on the DSC curve, there are no such distinguishing exothermic effects as for foams with fillers. The effects on the curve were related to various transformations taking place in the analyzed materials under the influence of temperature. The first effect was related to the diffusion of the blowing agent. The second effect is associated with the degradation of bonds and the reaction of OH groups with NCO groups and also with the degradation of organic substances derived from fillers.

4. Conclusions

The influence of waste from the food industry and the thermal utilization of biomass on the properties of rigid polyurethane foams was investigated. Elemental analysis showed that SHs have more than ten times the carbon content of SHA. SHs also had a higher nitrogen and hydrogen content than SHA. The SH biomass contained larger particles (100–1000 µm) than the ash from this biomass (10–100 µm). The morphology showed that the structure of SHs was developed and had longitudinal fibers, while in SHA, no spherical particles, which are typical for coal ash, were observed. The XRF analysis showed that the raw biomass mainly contained K (43.0%) and Ca (16.8%). Similarly, the ash from this biomass also contained the same inorganic compounds K (34.7%) and Ca (26.2%). In the second stage, the influence of the fillers used on the most important properties of the foams was examined. It was found that the filler amplified the apparent density value. The highest value of the apparent density was characteristic of PU_10SHA foam (44.9 kg/m3), whereas PU_REF had an apparent density of (36.2 kg/m3). The fillers also caused a modification in the structure of the foams, which was characterized by lower homogeneity, a smaller cell diameter, and thicker ribs. The mechanical properties deteriorated, the brittleness of foams with fillers maximally doubled, and the hardness decreased. On the other hand, the fillers contributed to the improvement in dimensional stability by eliminating the unfavorable phenomenon of the so-called “shrinkage” of foams that was observed only for PU_REF. The positive effect of fillers was also observed in the case of thermal stability up to 250 °C. RPUFs are usually used at these temperatures. In addition, fillers increased the rate of foam biodegradation. For PU_REF, the weight loss after seven weeks was about 10%, while for PU_10SHA, the weight loss over the same period was about 30%.
In conclusion, it was found that the addition of SHs and SHA fillers had a positive effect on most properties of RPUFs. Therefore, these fillers can be successfully used in the synthesis of foams.
Author Contributions

Conceptualization, P.Z., B.Z.-K., A.M. (Aneta Magdziarz) and M.K.; methodology, P.Z., B.Z.-K. and M.K., investigation, P.Z., B.Z.-K., M.K. and A.M. (Aneta Magdziarz); resources, P.Z., B.Z.-K. and M.K.; writing—original draft preparation, P.Z., B.Z.-K., A.M. (Aneta Magdziarz) and M.K.; writing—review and editing, P.Z., B.Z.-K., M.K., A.M. (Anna Magiera) and A.M. (Aneta Magdziarz); visualization, P.Z. and M.K.; supervision, M.K. and A.M. (Aneta Magdziarz). All authors have read and agreed to the published version of the manuscript.

Funding

This work was funded by the Ministry of Science and Higher Education, Poland (grant AGH-UST no 16.16.110.663).

Data Availability Statement

The data presented in this study are available on request from the corresponding author. The data are not publicly available due to privacy.

Conflicts of Interest

The authors declare no conflict of interest.

References

  1. Członka, S.; Strąkowska, A.; Kairytė, A. Effect of walnut shells and silanized walnut shells on the mechanical and thermal properties of rigid polyurethane foams. Polym. Test 2020, 87, 106534. [Google Scholar] [CrossRef]
  2. Brondi, C.; Di Maio, E.; Bertucelli, L.; Parenti, V.; Mosciatti, T. Competing bubble formation mechanisms in rigid polyurethane foaming. Polymer 2021, 228, 123877. [Google Scholar] [CrossRef]
  3. Berardi, U.; Madzarevic, J. Microstructural analysis and blowing agent concentration in aged polyurethane and polyisocyanurate foams. Appl. Therm. Eng. 2020, 164, 114440. [Google Scholar] [CrossRef]
  4. Xu, G.; Zhang, X.; Qing, Q.; Gong, J. A nonlinear constitutive model of rigid polyurethane foam considering direction-dependence and tension–compression asymmetry. Constr. Build. Mater. 2022, 339, 127540. [Google Scholar] [CrossRef]
  5. Głowacz-Czerwonka, D.; Zakrzewska, P.; Oleksy, M.; Pielichowska, K.; Kuźnia, M.; Telejko, T. The influence of biowaste-based fillers on the mechanical and fire properties of rigid polyurethane foams. Sustain. Mater. Technol. 2023, 36, e00610. [Google Scholar] [CrossRef]
  6. Zakrzewska, P.; Zygmunt-Kowalska, B.; Kuźnia, M.; Szajding, A.; Telejko, T.; Wilk, M. Biomass Origin Waste as Activators of the Polyurethane Foaming Process. Energies 2023, 16, 1354. [Google Scholar] [CrossRef]
  7. Agrawal, A.; Kaur, R.; Walia, R.S. PU foam derived from renewable sources: Perspective on properties enhancement: An overview. Eur. Polym. J. 2017, 95, 255–274. [Google Scholar] [CrossRef]
  8. Gu, R.; Sain, M.M.; Konar, S.K. A feasibility study of polyurethane composite foam with added hardwood pulp. Ind. Crops Prod. 2013, 42, 273–279. [Google Scholar] [CrossRef]
  9. Kuranska, M.; Prociak, A. Porous polyurethane composites with natural fibres. Compos. Sci. Technol. 2012, 72, 299–304. [Google Scholar] [CrossRef]
  10. Estravís, S.; Tirado-Mediavilla, J.; Santiago-Calvo, M.; Ruiz-Herrero, J.L.; Villafañe, F.; Rodríguez-Pérez, M.Á. Rigid polyurethane foams with infused nanoclays: Relationship between cellular structure and thermal conductivity. Eur. Polym. J. 2016, 80, 1–15. [Google Scholar] [CrossRef]
  11. Zieleniewska, M.; Leszczyński, M.K.; Szczepkowski, L.; Bryśkiewicz, A.; Krzyżowska, M.; Bień, K.; Ryszkowska, J. Development and applicational evaluation of the rigid polyurethane foam composites with egg shell waste. Polym. Degrad. Stab. 2016, 132, 78–86. [Google Scholar] [CrossRef]
  12. Ribeiro Da Silva, V.; Mosiewicki, M.A.; Yoshida, M.I.; Coelho Da Silva, M.; Stefani, P.M.; Marcovich, N.E. Polyurethane foams based on modified tung oil and reinforced with rice husk ash II: Mechanical characterization. Polym. Test 2013, 32, 665–672. [Google Scholar] [CrossRef]
  13. Kairytė, A.; Członka, S.; Boris, R.; Vėjelis, S. Vacuum-based impregnation of liquid glass into sunflower press cake particles and their use in bio-based rigid polyurethane foam. Materials 2021, 14, 5351. [Google Scholar] [CrossRef]
  14. Kairytė, A.; Członka, S.; Šeputytė-Jucikė, J.; Vėjelis, S. Impact of Sunflower Press Cake and Its Modification with Liquid Glass on Polyurethane Foam Composites: Thermal Stability, Ignitability, and Fire Resistance. Polymers 2022, 14, 4543. [Google Scholar] [CrossRef] [PubMed]
  15. Kairytė, A.; Kizinievič, O.; Kizinievič, V.; Kremensas, A. Synthesis of biomass-derived bottom waste ash based rigid biopolyurethane composite foams: Rheological behaviour, structure and performance characteristics. Compos. Part A Appl. Sci. Manuf. 2019, 117, 193–201. [Google Scholar] [CrossRef]
  16. Patiño, A.A.B.; Lassalle, V.L.; Horst, M.F. Magnetic hydrochar nanocomposite obtained from sunflower husk: A potential material for environmental remediation. J. Mol. Struct. 2021, 1239, 130509. [Google Scholar] [CrossRef]
  17. Väisänen, T.; Haapala, A.; Lappalainen, R.; Tomppo, L. Utilization of agricultural and forest industry waste and residues in natural fiber-polymer composites: A review. Waste Manag. 2016, 54, 62–73. [Google Scholar] [CrossRef] [PubMed]
  18. ISO 18122:2022; Solid Biofuels—Determination of Ash Content. ISO: Geneva, Switzerland, 2022.
  19. PN-EN ISO 845:2010; Porous Plastics and Rubbers-Determination of Apparent Density. ISO: Geneva, Switzerland, 2010.
  20. ASTM D2126-10(2019); Standard Test Method for Response of Rigid Cellular Plastics to Thermal and Humid Aging. ASTM International: West Conshohocken, PA, USA, 2019.
  21. ASTM C421-08(2020); Standard Test Method for Tumbling Friability of Preformed Block-Type and Preformed Pipe-Covering-Type Thermal Insulation. ASTM International: West Conshohocken, PA, USA, 2020.
  22. ASTM D5988-18; Standard Test Method for Determining Aerobic Biodegradation of Plastic Materials in Soil. ASTM International: West Conshohocken, PA, USA, 2018.
  23. ASTM D2240-15; Standard Test Method for Rubber Property—Durometer Hardness. ASTM International: West Conshohocken, PA, USA, 2021.
  24. Bala-Litwiniak, A.; Zajemska, M. Computational and experimental study of pine and sunflower husk pellet combustion and co-combustion with oats in domestic boiler. Renew. Energy 2020, 162, 151–159. [Google Scholar] [CrossRef]
  25. Guo, Q.; Chen, X.; Liu, H. Experimental research on shape and size distribution of biomass particle. Fuel 2012, 94, 551–555. [Google Scholar] [CrossRef]
  26. Sieradzka, M.; Mlonka-Mędrala, A.; Magdziarz, A. Comprehensive investigation of the CO2 gasification process of biomass wastes using TG-MS and lab-scale experimental research. Fuel 2022, 330, 125566. [Google Scholar] [CrossRef]
  27. Vassilev, S.V.; Baxter, D.; Andersen, L.K.; Vassileva, C.G. An overview of the composition and application of biomass ash. Part 1. Phase-mineral and chemical composition and classification. Fuel 2013, 105, 40–76. [Google Scholar] [CrossRef]
  28. Weber, K.; Quicker, P. Properties of biochar. Fuel 2018, 217, 240–261. [Google Scholar] [CrossRef]
  29. Barczewski, M.; Kurańska, M.; Sałasińska, K.; Michałowski, S.; Prociak, A.; Uram, K.; Lewandowski, K. Rigid polyurethane foams modified with thermoset polyester-glass fiber composite waste. Polym. Test 2020, 81, 106190. [Google Scholar] [CrossRef]
  30. Hou, L.; Li, H.; Liu, Y.; Niu, K.; Shi, Z.; Liang, L.; Yao, Z.; Liu, C.; Tian, D. Synergistic effect of silica aerogels and hollow glass microspheres on microstructure and thermal properties of rigid polyurethane foam. J. Non Cryst. Solids 2022, 592, 121753. [Google Scholar] [CrossRef]
  31. Li, T.T.; Liu, P.; Wang, H.; Dai, W.; Wang, J.; Wang, Z.; Shiu, C.-W.; Lin, J.H. Preparation and characteristics of flexible polyurethane foam filled with expanded vermiculite powder and concave-convex structural panel. J. Mater. Res. Technol. 2021, 12, 1288–1302. [Google Scholar] [CrossRef]
  32. Miedzińska, K.; Członka, S.; Strąkowska, A.; Strzelec, K. Biobased polyurethane composite foams reinforced with plum stones and silanized plum stones. Int. J. Mol. Sci. 2021, 22, 4757. [Google Scholar] [CrossRef] [PubMed]
  33. Dolomanova, V.; Jens, C.M.R.; Jensen, L.R.; Pyrz, R.; Timmons, A.B. Mechanical properties and morphology of nano-reinforced rigid PU foam. J. Cell. Plast. 2011, 47, 81–93. [Google Scholar] [CrossRef]
  34. Yan, D.; Xu, L.; Chen, C.; Tang, J.; Ji, X.; Li, Z. Enhanced mechanical and thermal properties of rigid polyurethane foam composites containing graphene nanosheets and carbon nanotubes. Polym. Int. 2012, 61, 1107–1114. [Google Scholar] [CrossRef]
  35. Paciorek-Sadowska, J.; Borowicz, M.; Isbrandt, M.; Czupryński, B.; Apiecionek, Ł. The use of waste from the production of rapeseed oil for obtaining of new polyurethane composites. Polymers 2019, 11, 1431. [Google Scholar] [CrossRef]
  36. Husainie, S.M.; Deng, X.; Ghalia, M.A.; Robinson, J.; Naguib, H.E. Natural fillers as reinforcement for closed-molded polyurethane foam plaques: Mechanical, morphological, and thermal properties. Mater. Today Commun. 2021, 27, 102187. [Google Scholar] [CrossRef]
  37. Modesti, M.; Adriani, V.; Simioni, F. Chemical and physical blowing agents in structural polyurethane foams: Simulation and characterization. Polym. Eng. Sci. 2000, 40, 2046–2057. [Google Scholar] [CrossRef]
  38. Borowicz, M.; Paciorek-Sadowska, J.; Lubczak, J.; Czupryński, B. Biodegradable, flame-retardant, and bio-based rigid polyurethane/polyisocyanurate foams for thermal insulation application. Polymers 2019, 11, 1816. [Google Scholar] [CrossRef]
  39. Yu, K.; Zhang, Z.; Liang, J.; Liang, C. Natural biomass-derived porous carbons from buckwheat hulls used as anode for lithium-ion batteries. Diam. Relat. Mater. 2021, 119, 108553. [Google Scholar] [CrossRef]
Figure 1. SH (a) and SHA (b) microphotography.
Energies 16 08080 g001
Figure 2. Particle size distribution of SHs (a) and SHA (b).
Energies 16 08080 g002
Figure 3. RPUF microphotographs.
Energies 16 08080 g003
Figure 4. Biodegradability of PU_REF (a), PU_3SHA7SH (b), PU_5SHA5SH (c), and PU_10SHA (d).
Energies 16 08080 g004aEnergies 16 08080 g004b
Figure 5. TG curves and DTG curves (a) and DSC curves (b) of RPUFs.
Energies 16 08080 g005
Table 1. Formulations and material contents of RPUFs.
ComponentsPU_REFPU_3SHA7SHPU_5SHA5SHPU_10SHA
Component A, g60606060
Component B, g72727272
SHA, g-4.397.3214.64
SH, g-10.257.32-
Table 2. The elemental analysis of C, H, and N.
FillerC, wt.%H, wt.%N, wt.%
SHA4.561.040.17
Table 3. Chemical composition of SHs and SHA.
K, %Ca, %Mg, %S, %P, %Cl, %Si, %Al, %Na, %Fe, %Cr, %
SH42.9816.825.523.122.030.670.570.220.180.12-
SHA34.6626.182.712.941.281.070.510.17-1.740.46
Table 4. Viscosity of polyol premix.
FillerDynamic Viscosity, mPa·s
Polyol510
Polyol with 3% SHA and 7% SH9840
Polyol with 5% SHA and 5% SH9780
Polyol with 10% SHA8740
Table 5. Horizontal cell diameter and closed-cell content of RPUFs.
SampleHorizontal Cell Diameter, µmClosed Cells Content, %
PU_REF343 ± 0.390 ± 0.1
PU_3SHA7SH314 ± 0.485 ± 0.9
PU_5SHA5SH397 ± 0.287 ± 0.8
PU_10SHA317 ± 0.583 ± 0.9
Table 6. Hardness and friability of RPUFs.
SampleHardness Shore OOFriability, %
PU_REF75.1 ± 0.34.5 ± 0.1
PU_3SHA7SH73.8 ± 0.45.8 ± 0.9
PU_5SHA5SH67.8 ± 0.26.8 ± 0.8
PU_10SHA63.5 ± 0.510.8 ± 0.9
Table 7. Dimensional stability of RPUFs: length (Δl), width (Δb), thickness (Δρ), and loss of mass (Δm).
SampleΔl, %Δb, %Δρ, %Δm, %
Weeks147147147147
PU_REF−0.320.000.900.31−3.997.753.719.52−12.601.152.222.87
PU_3SHA7SH0.460.721.150.652.398.870.057.0010.972.143.514.76
PU_5SHA5SH0.301.001.890.783.587.281.597.747.282.244.004.79
PU_10SHA0.461.222.630.824.439.103.164.2410.882.364.034.95
Table 8. Thermal degradation parameters of RPUFs.
SampleT5%, °CT10%, °CT50%, °CTDTGmax, °C
PU_REF154209342665
PU_3SHA7SH167230338626
PU_5SHA5SH163216336661
PU_10SHA172225374557
Disclaimer/Publisher’s Note: The statements, opinions and data contained in all publications are solely those of the individual author(s) and contributor(s) and not of MDPI and/or the editor(s). MDPI and/or the editor(s) disclaim responsibility for any injury to people or property resulting from any ideas, methods, instructions or products referred to in the content.