Abstract
This paper presents an approach to estimate demand in the Polish Power System (PPS) using the historical electricity usage of 27 thousand commercial customers, observed between 2016 and 2020. The customer data were clustered and samples as well as features were created to build neural network models. The goal of this research is to analyze if the clustering of customers can help to explain demand in the PPS. Additionally, considering that the datasets available for commercial customers are typically much smaller, it was analyzed what a minimal sample size drawn from the clusters would have to be in order to accurately estimate demand in the PPS. The evaluation and experiments were conducted for each year separately; the results proved that, considering adjusted R2 and mean absolute percentage error, our clustering-based method can deliver a high accuracy in the load estimation.
1. Introduction
The basis for ensuring a safe and economically effective operation of each national power system is an appropriate planning of its operation in various time horizons. The priority is to meet the recipients’ demand for power and electricity, taking into account the conditions of the grid, the operation of the units and the safety requirements for system operation. When planning the supply side of capacity, it is necessary to ensure a required power surplus over the consumers’ demand for power, the so-called power reserves, to be prepared in the event of a failure resulting in a loss of production capacity, as well as for an unexpected increase in power demand by consumers.
The operation of each power system is planned in such a way that no single failure will lead to an overload of network elements or will cause a violation of any other criteria of safe system operation, such as required voltage levels, frequencies, permissible load on network elements, etc. Any violation of the above criteria is associated with emergency events, further increasing the risk of uncontrolled shutdowns of system components, leading to power outages. The dynamics of physical phenomena in the event of emergency shutdowns are very complex, which limits the possibility of reacting to the development of accidents. Hence, it is very important to properly plan the operation of networks and generation resources with an appropriate safety margin.
In order to guarantee the efficiency of this type of system, the continuous monitoring of electricity demand is necessary. An effective planning of the operation of national power systems is essentially based on the verification of the power balance in a specific planning horizon. Therefore, the question arises whether it is possible to effectively balance the production of electricity with the demand of consumers for this energy, while ensuring the required excess power. The energy usage patterns of the consumers are extremely varied and, as a whole, are affected by known and unknown events, e.g., household usage peaks during football championships and, for the companies, just before Christmas. Understanding the behavior of certain groups in the PPS and foreseeing their changes is a key for effective balancing of the electricity production and demand of consumers, while ensuring the required excess power. The aforementioned excess capacity for the analyzed time horizon is a kind of measure of the future balance situation.
Since electricity consumption behavior may vary between the customers, a cluster-based load curve estimation which describes the variation in load demand from the consumer side on a power source over a period of time, is sometimes considered [1,2]. Clustering enables the discovery of underlying patterns in electricity datasets and serves as the prerequisite for robust modeling, i.e., by first clustering the customers, then modeling the clusters separately, and finally, aggregating the data.
It is considered that the improvement provided with the clustering strategy (compared to the traditional approach on the aggregated level, i.e., on the available population of customers) not only depends on the number of the clusters, but also on the size of the customer base. Therefore, this article presents a cluster-based approach to estimate a demand model of the Polish Power System using neural networks and accounting for the size of the customer base. In particular, energy readings of 27 thousand commercial entities in Poland recorded between 2016 and 2020 are used to deliver the following contributions from the research:
- (1)
- A demonstration of how high frequency customer data can be utilized for the clustering and further, for demand estimation in the Polish Power System;
- (2)
- Confirmation of the minimum requirement in terms of the sample size drawn from the clusters to be able to estimate demand in the system;
- (3)
- The potential implications for the management and policy formulation within the Polish Power System are highlighted. Specifically, by employing a cluster-based approach to estimate demand, our methodology provides a more nuanced understanding of consumer behavior, enabling policymakers and energy managers to align better with strategy of the national power system.
Based on the literature review, as presented in the following section, there are multiple components being analyzed when modeling electricity demand, mainly for residential customers. Often, these works are focused on models and their technical characteristics to solve a problem through estimation or forecasting. In this context, the proposed research fills the gap related to the fact that only a few works use commercial data because the availability of such data for scientific purposes is very limited. Also, the cluster-based approach proposed here is an interesting alternative when modeling electricity demand as only a few works consider clustering as a viable option for robust modeling, mainly due to the fact that a sufficiently large collection of data to enable clustering is hardly available.
This paper is organized as follows. Section 2 describes related works; in Section 3, the dataset used for the analysis of the Polish Power System is characterized. This is followed by a brief methodology outlined in Section 4. Section 5 presents the approach to estimate the demand in the PPS as well as numerical experiments to analyze a minimal sample size to estimate demand with reasonable accuracy. Section 6 describes the insights gained from the analysis and presents conclusions.
2. Literature Review
In the current global situation, national power systems are of great interest to decision-makers in the global economy. There are many reasons for this, but the most important are the willingness to abandon fossil fuels (which are still the main source of electricity), the transition to green energy [3,4,5], and the possibility of reducing energy consumption, thus also reducing the demand for energy [6]. Moreover, equally important is looking for flexibility in energy markets, aimed primarily at ensuring the stability of power systems [7,8] and the impact of those systems on climate changes [9,10]. So, on the one hand, national power systems face the problem of decarbonization; on the other, they need to maintain a correct functioning of energy systems.
The problems of modern energy and power systems are considerable and complex. The task is basically to define an optimal set of technologies and mechanisms to support the transformation of such systems, while ensuring all interested parties obtain reliable access to the electricity supply. It is therefore a wide field of research for scientists and implementers. The modeling of energy systems is now a primary means for informing, guiding, and supporting decision-makers in this field in their efforts to coordinate the energy transition [11,12]. The main goal of this modeling is the identification of future patterns of energy supply and demand, as well as the development of strategies for the long-term transformation plans of the systems in question [13].
In terms of modeling energy systems, two research approaches can be formally distinguished. The first focuses on models and their technical characteristics, providing information on current methodological trends, challenges, and possible future research directions. These studies are mainly aimed at research dealing with energy modeling. They provide general overviews of different models [11,14,15,16], compare them in various aspects (scope, capabilities, features, etc.), identify common modeling concepts, outline future research directions or, consequently, identify models appropriate to given needs. At the same time, all analyses in this area relate to specific challenges faced by this type of modeling and refer to various methodological reviews used in the literature.
Thus, in reference [11], for example, the reviewed models were evaluated in terms of their characteristics, like their underlying methodology, analytical approach, time horizon and transformation path analysis, spatial and temporal resolution, licensing and modeling language. Paper [14], in turn, reviewed several existing bottom-up energy system models in order to classify them. In the study [15], the authors also proposed reviews of the changing role of electricity systems modeling but in a strategic manner, focusing on the modeling response to key developments, the move away from monopolies towards liberalized market regimes, and the increasing complexity brought about by policy targets for renewable energy and emissions. Pfenninger S. et al. [16] raised an issue of the crucial factors limiting openness of energy data and models: the lack of practical knowledge as well as personal and institutional inertia.
The second approach relates directly to the comparisons of different concepts developed in the literature. This creates a form of review research: without the need for analyzing the complexity of specific models, but rather through collecting various scenarios of energy and electrical systems, it aims to highlight key trends, differences, similarities, development paths, or the potential risks hidden in them. As a result, this approach considers the use of different analytical methods, the use of different parameters or specific initial or boundary conditions, etc. [17]. Often, it is mentioned in the literature that the models are not very transparent to the users, hence, there is a need to synthesize the available information and transform it into an effective policy. An overview of the results of several studies is presented in Table 1.

Table 1.
Overview of the research on power systems modeling.
Table 1.
Overview of the research on power systems modeling.
| Authors | Focus |
|---|---|
| Foley A.M. et al. [15] * | Overview of electricity system modeling techniques and review of proprietary electricity system models. |
| Gabriel S. et al. [18] * | Estimation of a large-scale mathematical model that computes equilibrium fuel prices and quantities in the U.S. energy sector. |
| Skinner C.W. [19] * | Development of a new national energy modeling system to provide annual forecasts of energy supply, demand, and prices on a regional basis in the United States and, to a limited extent, in the rest of the world. |
| Fattahi A. et al. [20] ** | Review of nineteen integrated energy system models (ESMs) to: identify the capabilities and shortcomings of current ESMs to adequately analyze the transition towards a low-carbon energy system; assess the performance of the selected models by means of the derived criteria; and discuss some potential solutions to address the ESM gaps. |
| Yan C. et al. [21] ** | Presentation of an integrated evaluation framework to evaluate the possible national multi-energy flow in China in the near future. The framework includes an integrated modeling for a national multi-energy system in China. These key national energy facilities are all modeled in a generalized network flow formulation. |
| Berntsen P. et al. [22] * | Long-range energy scenarios are used to inform national energy policy decisions. Use of a bottom-up energy system model EXPANSE with modeling to generate alternatives to assess the diversity of the existing ensemble of multi-organization, multi-model Swiss electricity supply scenarios. |
| Aryanpur V. et al. [23] ** | Presentation of national-scale energy systems optimization models, determination of a combination of supply and demand data requirements and socio-economic, environmental, and political issues, can challenge the results of a low-spatial resolution model. |
| Beaver R. [24] ** | Analysis of the structure of energy and economic models. |
| Mirakyan A. [25] ** | The analysis of existing national energy systems, as well as the prediction of potential future scenarios, is usually performed with the aid of an energy system model. The proposed framework can be used to identify and classify different types of uncertainty in context of energy planning in cities or territories. |
| Baghelai C. et al. [26] * | Characteristics of the uncertainty in the core elements of the US Department of Energy’s National Energy Modeling System. |
| DeCarolis J. et al. [27] ** | Energy system optimization models (ESOMs) are widely used to generate insight that informs energy and environmental policy. This paper shows the best practice for energy system optimization modelling and outlines a set of principles and modelling steps to guide ESOM-based analysis. |
| Pusnik M. et al. [28] ** | The main technical, economic, and environmental characteristics of the Slovenian energy system model REES-SLO are described. |
| Sahoo S. et al. [29] * | An integrated modeling-based approach for regional analysis was proposed. The modeling framework was subdivided into four major blocks: the economic structure, the built environment and industries, renewable energy potentials, and energy infrastructure, including district heating. The results show the added value of regionalized modeling as opposed to relying solely on national energy system models. |
| Collins S. et al. [30] ** | Long-term energy modelling challenges were identified including soft linkages between models of integrated energy systems and models of power systems, as well as an improvement in temporal and technical representation of power systems within models of integrated energy systems. |
| Gacitua L. at al. [31] ** | This publication presents a comprehensive and up-to-date review on expansion planning models and tools, with an emphasis on their application to energy policy analysis. It reviews the most significant policy instruments, with an emphasis on renewable energy integration, the optimization models that have been developed for expansion planning, and existing decision-support tools for energy policy analysis. |
| Wen X. et al. [32] * | The authors review existing accuracy indicators used for retrospective evaluations of energy models and scenarios. |
| Chaudry M. et al. [33] * | An integrated energy system model is described. It is used to show the impacts on the environment due to different low carbon options to decarbonize a regional energy system in the context of national targets and constraints. |
| Hanna R. et al. [34] ** | This study explores how different energy systems models and scenarios explicitly represent and assess potential disruptions and discontinuities (socio-economic, political and technological). |
| Huang K. et al. [35] * | Energy system optimization models (ESOM) to simulate energy and emissions changes under different economic and technological scenarios or prospective policy cases were considered. |
| Batas Bjelić I. et al. [36] * | In this paper, the achievement of the goals of the EU2030 is modeled by introducing an innovative method of soft-linking EnergyPLAN with the generic optimization program (GenOpt). The result of the optimization loop is an optimal national energy master plan (as a case study, the energy policy in Serbia was used), followed by a sensitivity analysis of the exogenous assumptions and with a focus on the contribution of a smart electricity grid. |
| Yan C. et al. [37] * | The authors present an analytical method to model the dependent multi-energy capacity outage states and their joint outage probabilities of an integrated energy system for its reliability assessment. |
| Martinsen T. [38] ** | This paper reviews the characteristics of technology learning and discusses its application in energy system modelling in a global–local perspective. Its influence on the national energy system, exemplified by Norway, is investigated using global and national Markal models. The dynamic nature of the learning system boundaries and the coupling between the national energy system and the global development and manufacturing system are elaborated. |
| Davis M. et al. [39] * | This research presents a framework for developing a scientific tool with a long-range energy alternative planning (LEAP) system for evaluating energy consumption and greenhouse gas (GHG) emission mitigation pathways for a national energy system. The developed framework is applied to create a bottom-up (technology-explicit), data-intensive (over 2 million data points), multi-regional (13 integrated regions) energy model of Canada, one of the world’s most energy- and emission-intensive nations. |
| Lund H. et al. [40] ** | The authors analyze diversity of models and their implicit or explicit theoretical backgrounds. |
Studies in the field of the first approach are marked in the table with the symbol * and the second approach with **.
Moving from the issues of various modeling concepts of national power systems to issues related to electricity demand, it is worth referring to several studies in this area. The analysis of the demand for this type of energy is the basic element of the stability of the national power systems. Research in this area was carried out by, among others, a team led by Kazemzadeh M. [41], which made attempts to develop a hybrid method for forecasting the annual peak load and total energy demand of Iran’s national energy system. For Indonesia, the forecasting of electricity consumption has been recently carried out by McNeil M., Karali N., and Letschert V. [42]. In their research, they considered a novel bottom-up modeling approach to analyze the potential of energy efficiency to reduce the country’s electricity demand. The LOADM curve model used in this case combines the total national electricity demand for each end user—as modeled by the bottom up energy analysis system (BUENAS)—with hourly end-user demand profiles. The publication of Ouedraogo N. [43] is an example of this type of analysis for the African continent. The paper developed a scenario-based model to identify and provide a range of electricity needs in Africa and to derive them from the African energy system. The approach was implemented through the application of the scenario methodology developed by Schwartz in the context of the “Long-range Energy Alternative Planning” energy and economic modeling platform. Although most analyses of this type relate essentially to highly industrialized regions, there are studies referring to exceptionally underdeveloped economies. An example is the first multi-purpose, long-term energy planning optimization model adapted to national power systems with a small existing energy infrastructure developed for Uganda by Trotter P., Cooper N., and Wilson P. [44]. Assessment and evaluation of flexible demand in a Danish future energy scenario was the basis of the research by Kwon P.S. and Østergaard P. [45]. They assessed the distant future potential of elastic demand in the energy system.
Of course, there are many more examples of energy system analyses. They are conducted for various applications, taking into account many concepts. The cluster-based approach proposed by the authors of this publication may be an interesting alternative when modeling electricity demand.
It should be emphasized that the data used in the analyzes are unique and real. The analyzed dataset has already been used by the authors in one study [46]. An important contribution here is to clarify the energy demand in the national energy system through commercial customer data. Also, the goal is to draw attention to the so-called minimum sample size taken from clusters necessary to estimate the demand in the considered energy system.
3. Data Characteristics
This study focuses on the Polish Power System, as the data which were obtained are tightly connected to companies operating on Polish territory. The data include profiles of supply and demand from the Polish Power System for the years from 2016 to 2020 and the energy readings of 27,160 commercial entities in Poland recorded for the same period.
The research is based on unique data, but the methods and analysis can be applied to any national power system of any European country.
Each power system is characterized by the volatility of electricity demand due to the fact that the customers’ demand varies throughout the days, weeks, and years. It is closely related to the behavior of energy users who cover their energy needs. The changes in the load can be seasonal and recurring, related to the daily activities of people, or to the technological processes of production plants. They can also be irregular, for example as a result of changes in weather conditions, such as temperature or cloudiness. Higher peak loads in the winter months are associated with greater energy needs of the end-users for heating in case they have electric heating or heating pumps. Additionally, the highest peak loads occur on working days, lower ones on non-holiday Saturdays, and the lowest ones on Sundays and public holidays. Figure 1 shows the average weekly volatility of the load in the Polish Power System in 2018 and for each month separately.
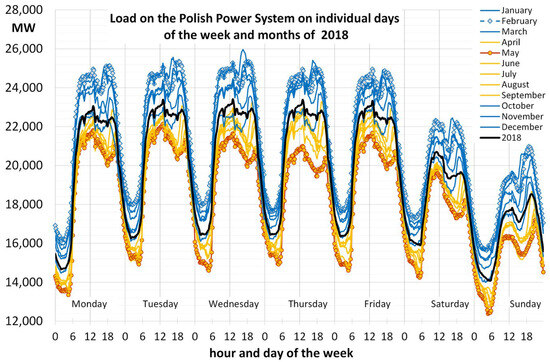
Figure 1.
Weekly volatility in the electricity load in the Polish Power System in 2018. Source: [47].
Despite significant changes in the load volume from month to month, there are characteristic night valleys with relatively low loads, which remain stable between 22:00 and 6:00. The load volume in working days when comparing months is very similar. There also is a visible reduction in the load on Saturdays and, especially, on Sundays.
An important regularity regarding the load in the Polish Power System is the shift in the evening load peaks due to the change in sunset times. This shift is not only associated with the use of artificial lighting, but also with the fact that people’s activity after dusk is moved to houses which triggers the use of various electrical devices. The average daily volatility of the Polish Power System for each month of 2018 is presented in Figure 2.
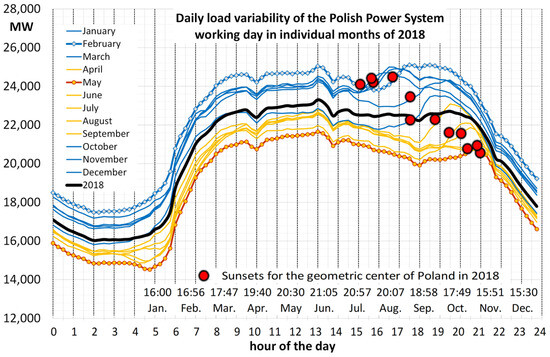
Figure 2.
Daily volatility in the Polish Power System for each month of 2018. Source: [47].
The analysis of Figure 2 shows that the evening peak in winter months occurs immediately after sunset. Another important observation is that the load peaks in the summer months occur at noon.
Due to the correlation between the energy demand and the energy price, knowledge about the peak periods and minimum demand observed in the power system is important for managing the costs of electricity supply through switching energy carriers (e.g., coal, gas, etc.) depending on the load level. This enables the standardization of responses from power plants to meet the energy needs of their customers. Those correlations are reflected in the tariff groups and time zones offered by energy companies for making the settlements with customers.
In order to build an accurate model of the electricity demand in the power system, it should be remembered that, in the case of national energy systems, an important issue is related to the availability of disaggregated data on the customer level. Such low level customer data are helpful to analyze the impact of specific customers’ groups on the shape of the demand curve, which can be used further for the demand side management (DSM) and demand side response (DSR) programs for the efficient use of the electricity.
This study was prepared based on a historical dataset of 27,160 commercial entities located in the central-eastern part of Poland; the data were obtained from Data Bridge—a company which specializes in gathering data from energy supply companies. This dataset contains hourly data recorded for every customer between 01 January 2016 and 31 December 2020, enriched with calendar data (weekdays, months, and holiday indicators) and meteorological data including temperature and humidity.
Initially, the dataset contained more customers, however, it was necessary to perform data pre-processing to improve the quality, i.e., all the readings whose values were less or equal to zero or those with repeating time stamps were removed. In addition, the customers with less than ten different values in their readings were discarded. The structure of the dataset as well as some basic statistics in terms of the electricity volume are provided in Table 2. Based on Table 2, it can be concluded that between 30% and 50% of the customers are small businesses, i.e., those for whom the average daily demand is less than 10 kWh. Large businesses, i.e., over 150 kWh, represent approximately 10% of all the customer base. Also, the total number of customers for the year 2017 is much smaller compared to other years. This is due to the fact that data were obtained from multiple energy suppliers and their customer base was not stable in 2017 due to market consolidation and migration of the customers between energy suppliers.

Table 2.
The structure of the dataset in terms of the electricity volume (in kWh) and the number of entities observed between 2016 and 2020.
As shown in Figure 3, a number of weekly and daily cycles is observed on the aggregated load curve. For instance, the daily load curves have different shapes depending on the day (workday, Saturday, Sunday, or holiday). This is visible on the graph: the beginning of May starts on hour 1, which is midnight on the 1st of May 2019. The first and third of May are national holidays in Poland, and in 2019, the first of May was a Wednesday. The second of May is often taken as a bridge-holiday and as such it appears more similar to a non-holiday Saturday. From the fifth of May (hour 96), the normal weekly pattern emerges: 5 weekdays, Saturday and Sunday. During the working days, there are clearly defined peaks in the middle of the days, and smaller peaks in the evenings. Finally, the consumption is significantly lower during the weekend days compared to working days.
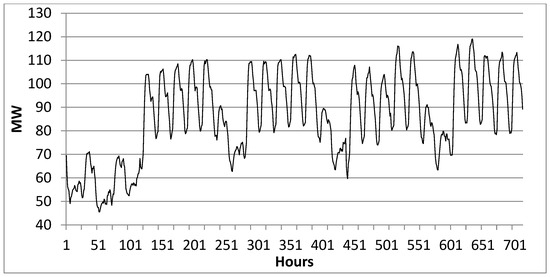
Figure 3.
Hourly load data observed between May 1st (0:00) and 31st (23:00), 2019 for the customers.
Based on Figure 4, it can be concluded that the analyzed data for 27,000 commercial customers constitute approx. 1% of the total volume of the power (in MW) of the Polish Power System and, at the same time, exhibit a load curve similar to the PPS curve. The similarity between both curves is quite high: 0.75 measured with the coefficient of determination (R2).
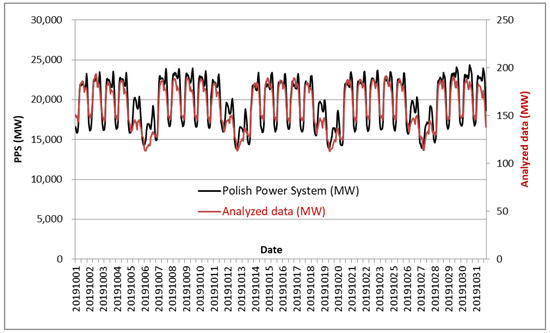
Figure 4.
Hourly energy consumption curves in October 2019 for the analyzed data (red pattern) in relation to the Polish Power System (black pattern).
4. Methodology
4.1. Clustering
Since energy consumption behavior might vary among customers, different energy consumption patterns can be grouped using clustering algorithms; these clusters can be used to achieve a better understanding of customer profiles and to perform load modeling. The prerequisite for the clustering of the customers’ profiles was proper data preprocessing, i.e., creating, for each customer and each year, matrices containing electricity consumption where the dimensions were month, weekday, and hour. An example of such a matrix for 2016 for one of the customers is presented in Figure 5. Each cell represents the average consumption in each hour for the customer calculated over four or five values, e.g., four Mondays (weekday = 1) in January (month = 1) 2016. It shows an increased consumption with red cells and a lower consumption with green cells.
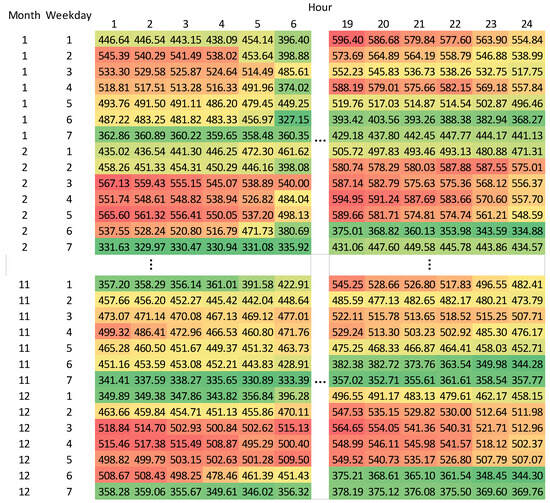
Figure 5.
Consumption matrix for one of the customers observed during 2016.
The data were normalized by row, i.e., the vector with 24 values for each hour, using standardization: (x-mean(x))/std(x); this yielded the matrices with normalized consumption which were used to determine similarity between customers’ profiles. Each time, similarity was calculated using the Euclidean distance between two normalized matrices for two customers’ profiles, in other words element-wise operations were applied. Next, hierarchical clustering using Ward’s method was performed. It considers cluster analysis through an analysis of variance where the minimum variance criterion reduces the total within-cluster variance, instead of using distance measures to create the clusters [48]. The method involves an agglomerative clustering algorithm which starts at the leaves and works its way to the root. During the process, the method looks for groups of leaves that form into branches, the branches into limbs and finally into the root. Ward’s method starts out with n clusters of size 1 and continues until all the observations are included in one cluster.
Applications of Ward’s method were used to determine the largest number of distinct clusters that have non-overlapping patterns. For this purpose, energy load profiles for working days, Saturdays, and Sundays were plotted for each cluster created in the 2016–2020 data. The clustering into 20 clusters was considered as the one best meeting that goal. Another rationale for selecting 20 clusters as a cut-off was based on the number of observations, i.e., entities, in each of the clusters. It stems from the fact that clusters should contain a sufficient number of observations to create meaningful and actionable groups of customers. Figure 6 presents a visualization of 20 clusters in terms of energy profiles for working days, Saturdays, and Sundays for 2020, while the number of entities in each cluster is provided in Table 3.
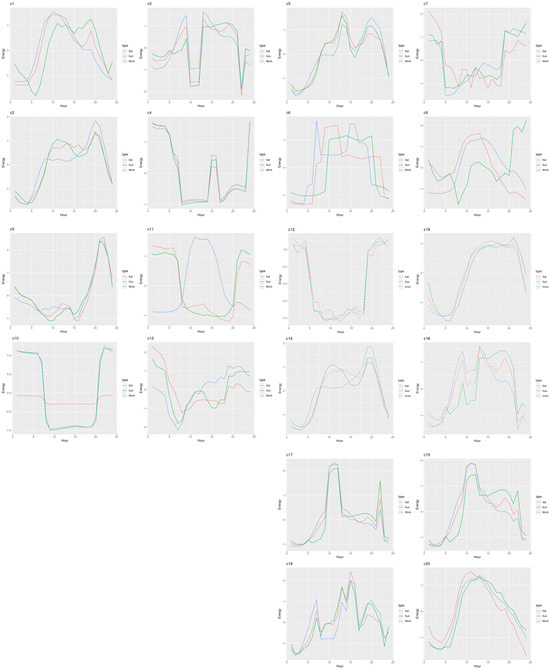
Figure 6.
Visualization of 20 clusters (C1–C20) based on 2020 data (profiles are provided separately for working days, Saturdays, and Sundays).

Table 3.
The number of entities in each cluster for 2016–2020.
As shown in Figure 6, the comparison of clusters and their load profiles allows the identification of significant differences between the profiles which cannot be seen on the aggregated level of the Polish Power System. There are several clusters which show increased consumption during the day, with one or two spikes, as opposed to some other clusters, with low demand during the day but with increased demand during the night. Those profiles are useful for building tariff structures, demand-side management, planning of the distribution system, and for defining critical segments which can impact the power system when balancing the energy market.
4.2. Neural Networks for Estimation
Artificial neural networks (ANN) were first introduced by Warren McCulloch and Walter Pitts in 1943, who created a computational model for neural networks based on a threshold logic algorithm. The idea of this computational model was inspired by biological nervous systems consisting of a large number of elemental processing units, called neurons, which are organized in input, hidden, and output layers [49,50]. Each neuron in the network is characterized by input weights, an activation function, and a threshold. In the simplest artificial neural networks, neurons are usually connected in a feedforward manner so data processing moves only in one direction, from the input nodes through the hidden layer, to finally reach the output neurons.
A multilayer perceptron (MLP), introduced by Frank Rosenblatt in 1958, is a feedforward artificial neural network model with multiple layers of neurons which are fully connected to the next neurons in each layer. With an adequate learning method and with a sufficient number of neurons in the hidden layers, the MLP networks are able to deliver precise and satisfactory approximation for any type of bounded piecewise continuous functions [51].
The MLP network utilizes a supervised learning backpropagation technique which is widely recommended as the most efficient procedure for the training of neural networks and used in conjunction with gradient descent optimization method [52]. The main issue in the application of neural networks is finding the proper values for the weights between the input and the output layer. Starting with random weights, an input dataset is presented to the network to make initial estimations. During the learning process, the differences between the estimated and the measured values are used to assess the error. Then, the error is propagated back through the whole network to update the weights and to obtain improved results, as we want the algorithm to find those properties of the input data that are most relevant for modeling the target function. More details regarding the MLP architecture and learning algorithms are elaborated on in [50,53,54].
Figure 7 presents an example of a three-layer neural network which consists of an input layer with a set of input neurons, one hidden layer with computation neurons, an output layer, and weights between all the layers.
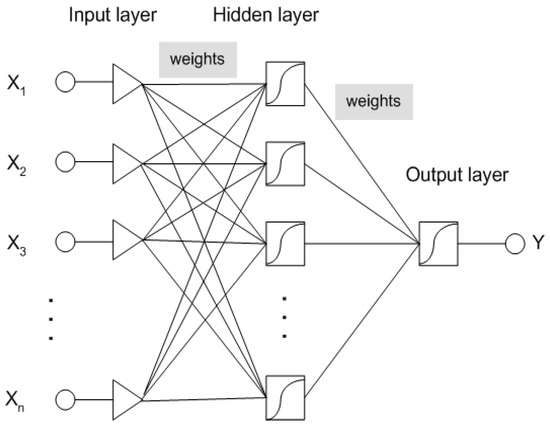
Figure 7.
The three layer MLP artificial neural network.
For the purpose of demand estimation, an MLP feedforward artificial neural network was used as this is undoubtedly one of the most commonly used architectures in practical applications of ANN, especially in applications related to estimation and classification [52].
5. Modeling Electricity Demand in the Polish Power System
Energy demand, a critical aspect of energy systems, is the measure of electrical energy required by end-users within a specific timeframe. The knowledge of expected energy demand is essential for ensuring a stable and resilient energy infrastructure. The determinants influencing energy demand are multifaceted. Economic growth plays a pivotal role, as expanding industries and increased commercial activities elevate energy needs. Technological advancements, particularly in energy-efficient appliances and industrial processes, can either mitigate or intensify demand. Furthermore, societal changes, such as shifts in lifestyle and demographic patterns, significantly impact energy consumption. Lastly, climate and weather conditions are also important.
The transition towards renewable energy sources further complicates energy demand dynamics. While renewable integration offers sustainability benefits, the intermittency of sources like solar and wind introduces additional complexities in demand forecasting and grid management. Smart grid technologies, demand response programs, and energy storage solutions emerge as pivotal strategies in addressing these challenges, ensuring a harmonious balance between energy supply and demand.
Understanding energy demand is imperative for policymakers, energy planners, and stakeholders to formulate effective strategies that enhance energy efficiency, reduce environmental impact, and foster a reliable and resilient energy future. Also, it is pivotal for sustainable energy systems, influenced by factors like economic trends, technological shifts, and societal changes.
In the context of the PPS, our research employs clustering techniques on historical electricity usage data from commercial customers. As we delve into modelling electricity demand, this study provides valuable insights into the effectiveness of clustering-based models, showing their potential for accurate load estimation.
5.1. The Approach to Estimate the Demand
The main factors affecting electricity demand on a country-wide level are gross domestic product, energy prices, income, the characteristics of economic urbanization, and climate and seasonal factors. The magnitude of those determinants differs across countries, time periods, and studies, even for the same country; therefore, our goal was to explain the demand through the available high frequency data of commercial customers rather than building a macro-economic model.
Modeling the load in the national power system is an important aspect—not only for the economy, but also for the safety and reliability of the power system operations. The models are necessary for the planning and modernization of the whole system and for creating strategic directions, including market transformation. Moreover, knowledge of the load curve characteristics is necessary to take appropriate actions in balancing the available generation capacity and the demand.
In this context, a data-driven approach, with no theoretical assumptions, was used to estimate a model in which consumers (and specific consumer clusters) create energy demand and thus are responsible for the shape of the load curve. The model that reflects the actual structure of the market through the clusters of customers will help to analyze the demand in the Polish Power System and its fluctuations. For this purpose, various models were tested taking into account up to 25 features, including the results of the clustering. The modeling was not limited to 20 clusters but the whole range of clusters (between 1 and 20 clusters) and their electricity usage were considered in the models. This was to analyze the relation between the number of clusters formulated and the precision of demand estimation.
The following variables were used to create the MLP models:
- ○
- Feature 1—day type: working day, Saturday, Sunday, or holiday;
- ○
- Feature 2—the time of the day: (1) morning peak: between 7:00 and 13:00 for working days (Monday-Friday), regardless of the month; (2) afternoon peak: between 16:00 and 21:00 during winter months, i.e., between October and March; between 19:00 and 22:00 during summer months, i.e., between April and September; (3) off-peak periods;
- ○
- Feature 3—season: (1) summer (May–August); (2) winter (November–February); (3) other (March, April, September, October);
- ○
- Feature 4—temperature observed in hourly intervals;
- ○
- Feature 5—humidity observed in hourly intervals;
- ○
- Features 6—25-aggregated hourly electricity usage within each cluster (between 1 and 20 clusters). Each cluster is the result of the hierarchy of the dendrogram obtained for the hierarchical clustering using Ward’s method, as shown in Section 3.
Some basic statistics for the variables which were used to create the MLP models are presented in Table 4. Variables C1 to C20 show aggregated hourly electricity usage within each cluster.

Table 4.
Descriptive statistics for the variables which were used to create the models.
To assess the performance of the models, the mean absolute percentage error (MAPE) and adjusted R2 were used. MAPE is a measure of prediction accuracy and it expresses the accuracy as a ratio defined by the formula:
where is the actual value and is the forecast value.
Adjusted R2 is a measure which provides better precision by considering the impact of additional independent variables that tend to skew the results of R2 measurements; it is defined as:
where is the number of points in a data sample and is the number of independent variables in the model, excluding the constant.
All presented simulations were prepared using R software (version 4.1) and nnet (version 7.3-16) library.
For each year, twenty MLP networks were trained; the difference between the networks was in the number of neurons in the input and hidden layers. Each explainable model was built for the hourly demand of the Polish Power System. The models varied from six neurons matching with six input-features (the five features mentioned earlier as well as the aggregated usage treated as a single cluster), up to twenty-five neurons matching with twenty-five input-features (the five aforementioned combined with the separate usage of the twenty clusters). Additionally, another twenty MLP models were created, but this time with random clusters, i.e., clusters of equal size with customers randomly assigned to each of them. The models with random clusters were used for comparison with the models which used the statistically derived clusters as input variables.
Each neural network consisted of one input layer (number of neurons ranging from six up to twenty-five which is in line with increasing number of clusters being considered as the inputs to the network), one hidden layer, and one output layer with one neuron and was trained using the nnet function which implements the Broyden–Fletcher–Goldfarb–Shanno algorithm (BFGS). Importantly, all input features were scaled using standardization. The varying number of features and neurons stems from the fact that, in the simulations, we considered various numbers of clusters and the associated energy volume. Specifically, for the first ANN simulation, there was only one time series for only one cluster, i.e., the entire population. For the second simulation, there were two time series for two clusters dividing the entire population, etc. Eventually, following the dendrogram, there were 20 time series for 20 clusters.
Wanting to follow the golden rule that each subsequent layer has fewer neurons than the previous (pyramid), the hidden layer contained two neurons less than the input layer. Neurons in the hidden layer were activated using sigmoid function, while the neuron in the output layer was activated using linear function. To prevent overfitting, the regularization term (weight decay) that uses as the penalty the sum of squares of the weights was set at its default value 0.0005 The models were built using cross-validation regime and the results were averaged. Due to the fact that analysis deals with feature vector (not a time sequence), these validation samples were randomly selected.
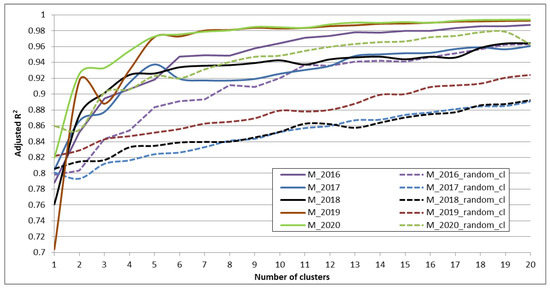
Figure 8.
Adjusted R2 for the models (each year separately) depending on the number of extracted clusters (solid lines) and compared to the models with random clusters (dashed lines).
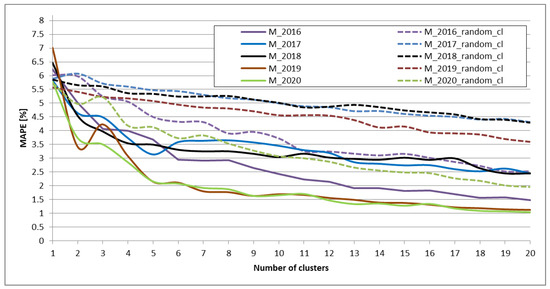
Figure 9.
MAPE for the models (each year separately) depending on the number of extracted clusters (solid lines) and compared to the models with the random clusters (dashed lines).
- ○
- For both adjusted R2 and MAPE, there is a clear relation: the higher the number of clusters used, the better the results are;
- ○
- Adjusted R2 is between 0.96 and 0.99 when the aggregated electricity usage is considered for 20 segments in the models; at the same time, the models with random segments perform worse as adjusted R2 is much lower, i.e., between 0.89 and 0.96;
- ○
- MAPE is between 1% and 2.5% when the aggregated electricity usage is considered for 20 segments in the models; at the same time the models with random segments perform worse as adjusted MAPE is much higher, i.e., between 2% and 4.5%;
- ○
- The best results are obtained for 2016, 2019, and 2020 which might be due to the fact that our source data contain more data points (as presented in Table 2).
In Figure 10 and Figure 11, a comparison between actual PPS demand and model’s estimates is also presented (as an example, January and July 2019 data were considered). These indicate that the models are fitting the PPS curve well and that the results are better when more clusters are considered as the inputs for the models (one cluster vs. ten clusters in the example).
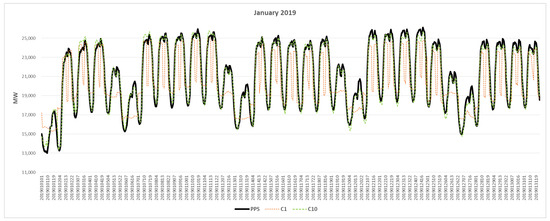
Figure 10.
Actual PPS demand (black solid line) for January 2019 compared with the model’s estimates; built for one cluster (dashed orange line) and ten clusters (dashed green lines).
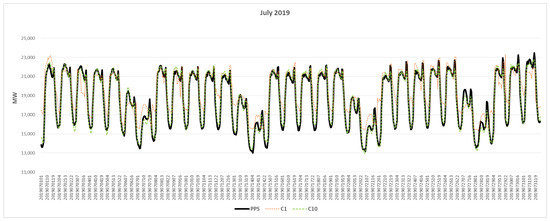
Figure 11.
Actual PPS demand (black solid line) for July 2019 compared with the model’s estimates; built for one cluster (dashed orange line) and ten clusters (dashed green lines).
5.2. Minimum Sample Size to Estimate Demand
Based on the literature review, the dataset used in this work is considered large as it represents the usage of 27,000 commercial customers. Usually, datasets that are available to scientists are significantly smaller which might impact the results and even make conclusions skewed and biased. Therefore, in this work, it was additionally analyzed what would be a minimal sample size taken from the clusters to estimate demand in the Polish Power System with good precision.
For this purpose, three random samples were prepared from each segment (from 1 to 20) and for each year, having 50%, 10%, and 1% of the data drawn from the original dataset. Additionally, similar samples having 50%, 10%, and 1% of the data drawn from the random clusters were prepared, i.e., segments of equal size with the customers who were randomly assigned to those clusters.
As previously stated, twenty MLP networks were trained for each year and for each sample (50%, 10%, and 1%), starting with a network with six neurons in the hidden layer to one with twenty-five neurons in the hidden layer. Additionally, another twenty MLP networks were created for each year and for each sample (50%, 10%, and 1%), but this time, with random clusters.
The results of the MLP networks are as follows (as shown in Figure 12):
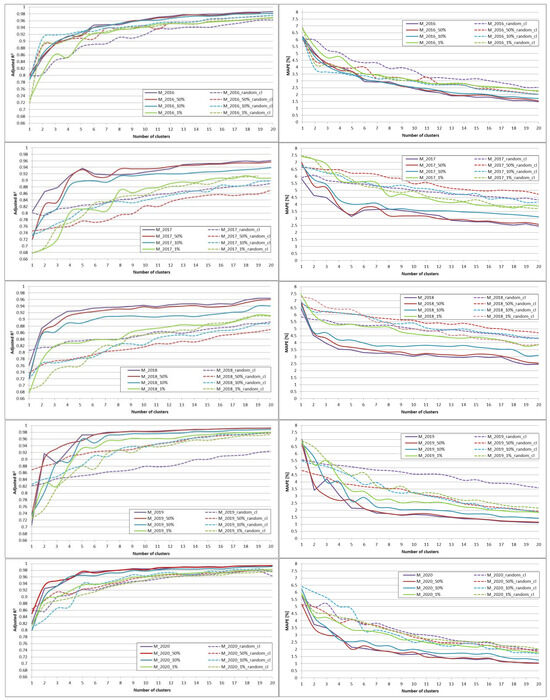
Figure 12.
Adjusted R2 (on the left) and MAPE (on the right) for the models (each year shown separately) depending on the number of extracted clusters and the sample size (solid lines) compared to the models with random clusters (dashed lines).
- ○
- For both measures, adjusted R2 and MAPE, there is a clear relation: with a bigger sample, better results are achieved;
- ○
- When the sample size of 50% is drawn from each of the clusters, then both adjusted R2 and MAPE are close to the results obtained for the complete dataset;
- ○
- When the sample size of 10% is drawn, then some slight deterioration in terms of the adjusted R2 and MAPE is observed; specifically, R2 is lower by 0.02 and MAPE is higher by 0.5 p.p. when comparing with the results obtained on the complete dataset; Nevertheless, such a sample still enables the models to be produced with reasonable accuracy;
- ○
- When the sample size of only 1% is drawn, then further deterioration in terms of the adjusted R2 and MAPE is observed; specifically, R2 is lower by up to 0.05 and MAPE is higher by 1 p.p. when comparing with the results obtained on the complete dataset;
- ○
- The 1% sample is considered too small to build reliable models as the results are close to the results obtained for random clusters;
- ○
- For the random clusters and the samples drawn from those clusters, it is observed that adjusted R2 and MAPE are worse than the results obtained on the complete dataset;
- ○
- As previously, the best results are obtained for 2016, 2019, and 2020, which might be due to the fact that more data are available for those years.
6. Conclusions
This study analyzed commercial customers in Poland based on a real dataset with hourly power consumption records of 27,000 businesses spread throughout 2016–2020.
Since electricity consumption behavior may vary between the customers, a cluster-based estimation of the demand curve was considered. Such an approach enables the discovery of underlying patterns in electricity datasets and serves as the prerequisite for robust modeling and estimation, i.e., by first clustering the customers and then modeling the demand in the power system through the profiles associated with the clusters as the input variables.
It was proved that the clustering-based method with MLP models for demand estimation in the Polish Power System decreases the mean absolute percentage error substantially compared to the approach without clusters, while fitting the load curve well, which was confirmed using adjusted R2.
Through the experiments, it was confirmed that the clustering of customers helps to estimate the demand in the Polish Power System significantly better than on an aggregated level, i.e., using the whole population. Specifically, there is a clear relation: the more clusters are used, the better the results are in terms of adjusted R2 and MAPE. With 20 clusters, the models deliver MAPE as low as 1% and adjusted R2 as high as 0.99.
As far as the size of the sample drawn from the clusters is concerned, it is observed that when a sample of size 50% is drawn from each of the clusters, then both adjusted R2 and MAPE are close to the results obtained on the complete dataset. When a sample size of 10% is considered then a slight deterioration in terms of both these measures is observed; however, such a sample still enables us to build the models with reasonable accuracy. Finally, when a sample of only 1% is drawn, further deterioration in terms of the adjusted R2 and MAPE is observed and such a sample is considered too small to build reliable models as the results are close to the results obtained for random clusters. This experiment clearly shows that small samples might impact the results and make conclusions skewed or biased, therefore the dataset should be sufficiently large. Finally, by employing a cluster-based approach to estimate demand, our research provides a far-reaching understanding of consumer behavior, enabling policymakers and energy managers to focus their strategies based on distinct customer clusters for proper demand-side management, planning of distribution systems and for defining critical segments which have the biggest impact on the power system. For example, those clusters which contribute to demand peaks should be considered for targeted actions (e.g., incentives) to flatten the peaks, as these pose a problem for the stability of the system.
Some limitations should be considered in the context of the results in the study. Since the research is based on data from Polish market it may impact generalization of the results. Nevertheless, the methods and analysis proposed here can be applied to any national power system of any European country and thus enable generalization of the findings.
There are a couple of promising applications of cluster analysis for managing the load in a power system which could be considered for further research. These are related to tariff design for specific customer groups and demand response programming which helps to flatten the load curve, thus contributing to an increased stability of the system.
Author Contributions
Conceptualization, T.Z. and K.G.; data curation, K.G., A.O. and W.R.; formal analysis, K.G. and J.B.; funding acquisition, T.Z., K.G., G.M. (Grzegorz Matejko) and G.M. (Grzegorz Mentel); investigation, J.J., A.O. and J.V.; methodology, T.Z., K.G. and G.M. (Grzegorz Mentel); project administration, T.Z. and K.G.; resources, J.J.; software, K.G. and J.B.; supervision, T.Z.; validation, G.M. (Grzegorz Matejko), M.C. and W.R.; visualization, K.G. and J.B.; writing—original draft, T.Z. and K.G.; writing—review and editing, G.M. (Grzegorz Matejko), J.B., G.M. (Grzegorz Mentel), M.C., J.J., A.O., W.R. and J.V. All authors have read and agreed to the published version of the manuscript.
Funding
This research was funded by the National Centre for Research and Development, Poland, grant number POIR.01.01.01-00-2023/20-00.
Data Availability Statement
The dataset presented in this study (in anonymized form) is available on request from the corresponding author. It is not available publicly as it belongs to the company that received the funding.
Conflicts of Interest
The authors declare no conflict of interest.
References
- Wijaya, T.K.; Vasirani, M.; Humeau, S.; Aberer, K. Cluster-based aggregate forecasting for residential electricity demand using smart meter data. In Proceedings of the 2015 IEEE International Conference on Big Data (Big Data), Santa Clara, CA, USA, 29 October–1 November 2015; pp. 879–887. [Google Scholar] [CrossRef]
- Laurinec, P.; Lucká, M. Clustering-based forecasting method for individual consumers electricity load using time series representations. Open Comput. Sci. 2018, 8, 38–50. [Google Scholar] [CrossRef]
- IEA. Global Energy Review 2021. Available online: https://www.iea.org/reports/global-energy-review-2021 (accessed on 20 October 2023).
- IEA. World Energy Outlook 2021. Available online: https://www.iea.org/reports/world-energy-outlook-2021 (accessed on 20 October 2023).
- IPCC. Summary for policymakers. In Climate Change 2021: The Physical Science Basis. Contribution of Working Group I to the Sixth Assessment Report of the Intergovernmental Panel on Climate Change; Cambridge University Press: Cambridge, UK, 2021; Available online: https://www.ipcc.ch/report/ar6/wg1/#SPM (accessed on 20 October 2023).
- Malinauskaite, J.; Jouhara, H.; Ahmad, L.; Milani, M.; Montorsi, L.; Venturelli, M. Energy efficiency in industry: EU and national policies in Italy and the UK. Energy 2019, 172, 255–269. [Google Scholar] [CrossRef]
- Forouli, A.; Bakirtzis, E.A.; Papazoglou, G.; Oureilidis, K.; Gkountis, V.; Candido, L.; Ferrer, E.D.; Biskas, P. Assessment of Demand Side Flexibility in European Electricity Markets: A Country Level Review. Energies 2021, 14, 2324. [Google Scholar] [CrossRef]
- Heilmann, E.; Klempp, N.; Wetzel, H. Design of regional flexibility markets for electricity: A product classification framework for and application to German pilot projects. Util. Policy 2020, 67, 101133. [Google Scholar] [CrossRef]
- Steinberg, D.C.; Mignone, B.K.; Macknick, J.; Sun, Y.; Eurek, K.; Banger, A.; Livneh, B.; Averyt, K. Decomposing supply-side and demand-side impacts of climate change on the US electricity system through 2050. Clim. Chang. 2020, 158, 125–139. [Google Scholar] [CrossRef]
- Pilli-Sihvola, K.; Aatola, P.; Ollikainen, M.; Tuomenvirta, H. Climate change and electricity consumption—Witnessing increasing or decreasing use and costs? Energy Policy 2010, 38, 2409–2419. [Google Scholar] [CrossRef]
- Lopion, P.; Markewitz, P.; Robinius, M.; Stolten, D. A review of current challenges and trends in energy systems modeling. Renew. Sustain. Energy Rev. 2018, 96, 156–166. [Google Scholar] [CrossRef]
- Jebaraj, S.; Iniyan, S. A review of energy models. Renew. Sustain. Energy Rev. 2006, 10, 281–311. [Google Scholar] [CrossRef]
- Herbst, A.; Toro, F.; Reitze, F.; Jochem, E. Introduction to energy systems modelling. Swiss J. Econ. Stat. 2012, 148, 111–135. [Google Scholar] [CrossRef]
- Prina, M.G.; Manzolini, G.; Moser, D.; Nastasi, B.; Sparber, W. Classification and challenges of bottom-up energy system models—A review. Renew. Sustain. Energy Rev. 2020, 129, 109917. [Google Scholar] [CrossRef]
- Foley, A.M.; Gallachóir, B.P.Ó.; Hur, J.; Baldick, R.; Mc Keogh, E.J. A strategic review of electricity systems models. Energy 2010, 35, 4522–4530. [Google Scholar] [CrossRef]
- Després, J.; Hadjsaid, N.; Criqui, P.; Noirot, I. Modelling the impacts of variable renewable sources on the power sector: Reconsidering the typology of energy modelling tools. Energy 2015, 80, 486–495. [Google Scholar] [CrossRef]
- Pfenninger, S.; Hirth, L.; Schlecht, I.; Schmid, E.; Wiese, F.; Brown, T.; Davis, C.; Gidden, M.; Heinrichs, H.; Heuberger, C.; et al. Opening the black box of energy modelling: Strategies and lessons learned. Energy Strategy Rev. 2018, 19, 63–71. [Google Scholar] [CrossRef]
- Gabriel, S.A.; Kydes, A.S.; Whitman, P. The national energy modeling system: A large-scale energy-economic equilibrium model. Oper. Res. 2001, 49, 14–25. [Google Scholar] [CrossRef]
- Skinner, C.W. National Energy Modeling System. Gov. Inf. Q. 1993, 10, 41–51. [Google Scholar] [CrossRef]
- Fattahi, A.; Sijm, J.; Faaij, A. A systemic approach to analyze integrated energy system modeling tools: A review of national models. Renew. Sustain. Energy Rev. 2020, 133, 110195. [Google Scholar] [CrossRef]
- Yan, C.; Bie, Z. Evaluating National Multi-energy System Based on General Modeling Method. Energy Procedia 2019, 159, 321–326. [Google Scholar] [CrossRef]
- Berntsen, P.B.; Trutnevyte, E. Ensuring diversity of national energy scenarios: Bottom-up energy system model with Modeling to Generate Alternatives. Energy 2017, 126, 886–898. [Google Scholar] [CrossRef]
- Aryanpur, V.; O’Gallachoir, B.; Dai, H.; Chen, W.; Glynn, J. A review of spatial resolution and regionalisation in national-scale energy systems optimisation models. Energy Strategy Rev. 2021, 37, 100702. [Google Scholar] [CrossRef]
- Beaver, R. Structural comparison of the models in EMF 12. Energy Policy 1993, 21, 238–248. [Google Scholar] [CrossRef]
- Mirakyan, A.; De Guio, R. Modelling and uncertainties in integrated energy planning. Renew. Sustain. Energy Rev. 2015, 46, 62–69. [Google Scholar] [CrossRef]
- Baghelai, C.; Moumen, F.; Cohen, M.; Kydes, A.; Harris, C.M. Uncertainty in the National Energy Modeling System. I: Method Development. J. Energy Eng. 1995, 121, 108–124. [Google Scholar] [CrossRef]
- DeCarolis, J.; Daly, H.; Dodds, P.; Keppo, I.; Li, F.; McDowall, W.; Pye, S.; Strachan, N.; Trutnevyte, E.; Usher, W.; et al. Formalizing best practice for energy system optimization modelling. Appl. Energy 2017, 194, 184–198. [Google Scholar] [CrossRef]
- Pusnik, M.; Sucic, B.; Urbancic, A.; Merse, S. Role of the national energy system modelling in the process of the policy development. Therm. Sci. 2012, 16, 703–715. [Google Scholar] [CrossRef]
- Sahoo, S.; van Stralen, J.N.P.; Zuidema, C.; Sijm, J.; Yamu, C.; Faaij, A. Regionalization of a national integrated energy system model: A case study of the northern Netherlands. Appl. Energy 2022, 306, 118035. [Google Scholar] [CrossRef]
- Collins, S.; Deane, J.P.; Poncelet, K.; Panos, E.; Pietzcker, R.C.; Delarue, E.; Pádraig, Ó.; Gallachóir, B. Integrating short term variations of the power system into integrated energy system models: A methodological review. Renew. Sustain. Energy Rev. 2017, 76, 839–856. [Google Scholar] [CrossRef]
- Gacitua, L.; Gallegos, P.; Henriquez-Auba, R.; Lorca, Ā.; Negrete-Pincetic, M.; Olivares, D.; Valenzuela, A.; Wenzel, G. A comprehensive review on expansion planning: Models and tools for energy policy analysis. Renew. Sustain. Energy Rev. 2018, 98, 346–360. [Google Scholar] [CrossRef]
- Wen, X.; Jaxa-Rozen, M.; Trutnevyte, E. Accuracy indicators for evaluating retrospective performance of energy system models. Appl. Energy 2022, 325, 119906. [Google Scholar] [CrossRef]
- Chaudry, M.; Jayasuriya, L.; Jenkins, N. Modelling of integrated local energy systems: Low-carbon energy supply strategies for the Oxford-Cambridge arc region. Energy Policy 2021, 157, 112474. [Google Scholar] [CrossRef]
- Hanna, R.; Gross, R. How do energy systems model and scenario studies explicitly represent socio-economic, political and technological disruption and discontinuity? Implications for policy and practitioners. Energy Policy 2021, 149, 111984. [Google Scholar] [CrossRef]
- Huang, K.; Eckelman, M.J. Appending material flows to the National Energy Modeling System (NEMS) for projecting the physical economy of the United States. J. Ind. Ecol. 2022, 26, 294–308. [Google Scholar] [CrossRef]
- Batas Bjelić, I.; Rajaković, N. Simulation-based optimization of sustainable national energy systems. Energy 2015, 91, 1087–1098. [Google Scholar] [CrossRef]
- Yan, C.; Bie, Z.; Liu, S.; Urgun, D.; Singh, C.; Xie, L. A Reliability Model for Integrated Energy System Considering Multi-energy Correlation. J. Mod. Power Syst. Clean Energy 2021, 9, 811–825. [Google Scholar] [CrossRef]
- Martinsen, T. Technology learning in a small open economy-The systems, modelling and exploiting the learning effect. Energy Policy 2011, 39, 2361–2372. [Google Scholar] [CrossRef]
- Davis, M.; Ahiduzzaman, M.; Kumar, A. How to model a complex national energy system? Developing an integrated energy systems framework for long-term energy and emissions analysis. Int. J. Glob. Warm. 2019, 17, 23–58. [Google Scholar] [CrossRef]
- Lund, H.; Arler, F.; Østergaard, P.A.; Hvelplund, F.; Connolly, D.; Mathiesen, B.V.; Karnøe, P. Simulation versus optimisation: Theoretical positions in energy system modelling. Energies 2017, 10, 840. [Google Scholar] [CrossRef]
- Kazemzadeh, M.R.; Amjadian, A.; Amraee, T. A hybrid data mining driven algorithm for long term electric peak load and energy demand forecasting. Energy 2020, 204, 117948. [Google Scholar] [CrossRef]
- McNeil, M.A.; Karali, N.; Letschert, V. Forecasting Indonesia’s electricity load through 2030 and peak demand reductions from appliance and lighting efficiency. Energy Sustain. Dev. 2019, 49, 65–77. [Google Scholar] [CrossRef]
- Ouedraogo, N.S. Modeling sustainable long-term electricity supply-demand in Africa. Appl. Energy 2017, 190, 1047–1067. [Google Scholar] [CrossRef]
- Trotter, P.A.; Cooper, N.J.; Wilson, P.R. A multi-criteria, long-term energy planning optimisation model with integrated on-grid and off-grid electrification—The case of Uganda. Appl. Energy 2019, 243, 288–312. [Google Scholar] [CrossRef]
- Kwon, P.S.; Østergaard, P. Assessment and evaluation of flexible demand in a Danish future energy scenario. Appl. Energy 2014, 134, 309–320. [Google Scholar] [CrossRef]
- Ząbkowski, T.; Gajowniczek, K.; Matejko, G.; Brożyna, J.; Mentel, G.; Charytanowicz, M.; Jarnicka, J.; Olwert, A.; Radziszewska, W. Changing Electricity Tariff—An Empirical Analysis Based on Commercial Customers’ Data from Poland. Energies 2023, 16, 6853. [Google Scholar] [CrossRef]
- Matejko, G. Energy Demand Management; ECCC Foundation: Lublin, Poland, 2021. [Google Scholar]
- Ward, J.H., Jr. Hierarchical Grouping to Optimize an Objective Function. J. Am. Stat. Assoc. 1963, 58, 236–244. [Google Scholar] [CrossRef]
- Fausett, L.V. Fundamentals of Neural Networks: Architectures, Algorithms and Applications; Pearson: London, UK, 1993. [Google Scholar]
- Simon, H. Neural Networks: A Comprehensive Foundation; Prentice Hall: Upper Saddle River, NJ, USA, 1999. [Google Scholar]
- Funahashi, K.I. On the approximate realization of continuous mappings by neural networks. Neural Netw. 1989, 2, 183–192. [Google Scholar] [CrossRef]
- Werbos, P.J. The Roots of Backpropagation: From Ordered Derivatives to Neural Networks and Political Forecasting; John Wiley & Sons: Hoboken, NJ, USA, 1994. [Google Scholar]
- Hertz, J.; Krogh, A.; Palmer, R.G. Introduction to the Theory of Neural Computation; Westview Press: Hoboken, NJ, USA, 1991. [Google Scholar]
- Masters, T. Neural, Novel and Hybrid Algorithms for Time Series Prediction; John Wiley & Sons: New York, NY, USA, 1995. [Google Scholar]
Disclaimer/Publisher’s Note: The statements, opinions and data contained in all publications are solely those of the individual author(s) and contributor(s) and not of MDPI and/or the editor(s). MDPI and/or the editor(s) disclaim responsibility for any injury to people or property resulting from any ideas, methods, instructions or products referred to in the content. |
© 2023 by the authors. Licensee MDPI, Basel, Switzerland. This article is an open access article distributed under the terms and conditions of the Creative Commons Attribution (CC BY) license (https://creativecommons.org/licenses/by/4.0/).