Article

The Origin of Overpressure in the Pinghu Tectonic Zone of Xihu Depression and Its Relationship with Hydrocarbon Accumulation

1
Shanghai Branch of CNOOC (China) Co., Ltd., Shanghai 200335, China
2
Department of Geology, Northwest University, Xi’an 710069, China
*
Author to whom correspondence should be addressed.
Energies 2023, 16(24), 8055; https://doi.org/10.3390/en16248055
Submission received: 27 October 2023 / Revised: 24 November 2023 / Accepted: 8 December 2023 / Published: 14 December 2023
(This article belongs to the Section H: Geo-Energy)

Abstract

:
Clarification of the cause of overpressure is of great significance for the study of hydrocarbon generation, migration and accumulation processes under an overpressure environment, and the prediction of predrilling pressure. The cause of overpressure in Xihu Depression is still controversial. This study, based on mudstone compaction research and organic matter correction of logging data, ascertained the causes of overpressure in the Pinghu tectonic zone, Xihu Depression. A modified discrimination method for overpressure genesis was used and the overpressure–hydrocarbon distribution relationship was explored. The results show the following: (1) Vertically, overpressure is located in the lower section of the Pinghu Formation, with a pressure coefficient of 1.1–1.7 and a pressure relief feature. On the plane, the pressure coefficient in the Pingzhong area exceeds that in the Pingbei area. (2) The main causes of abnormal high pressure in the research area are undercompaction and fluid expansion. The fluid expansion mechanisms include overpressure transmission and hydrocarbon charging within the reservoir as well as hydrocarbon generation pressurisation and overpressure transmission within the source rock. (3) In the surge section of kaolinite, under fluid pressure, kaolin migrates toward the low-pressure areas, decreasing the porosity in low-pressure areas and preserving pores in high-pressure areas. The evolution of fluid pressure can be divided into two stages: pressurisation; and both pressurisation and pressure relief. Pressurisation and pressure relief drive hydrocarbon charging, but hydrocarbons are more enriched in overpressure layers.

1. Introduction

Globally, there are 180 sedimentary basins containing overpressure systems, accounting for two thirds of all sedimentary basins [1,2]. Overpressure is the driving force of hydrocarbon expulsion [3,4]. It is also a key parameter dominating the fluid potential, which drives the secondary migration of hydrocarbons [5]. The proportion of deep clastic rock overpressure reservoirs worldwide has reached 80%, with overpressure reservoirs with porosity greater than 12% accounting for over 80% of them [6]. Overpressure is crucial for the formation of deep large-scale reservoirs.
The study of the causes of overpressure is the basis for understanding the overpressure formation process, simulating overpressure evolution, predicting predrilling formation pressure, and clarifying the relationship between overpressure and hydrocarbon accumulation [7]. The discrimination methods for the causes of overpressure mainly include the comprehensive compaction curve method [8], the acoustic velocity–effective stress diagram method [9,10], and the acoustic velocity–density diagram method [11]. These discrimination methods aim to determine the compaction or loading curve, which is the benchmark for discriminating the causes of overpressure. Compared with sandstone, the particle size of mudstone is relatively uniform, and the diagenesis is relatively simple, which can better reflect the compaction or loading laws of the formation. In practical applications, the variation in the porosity of mud shale or the logging parameters reflecting the porosity (such as acoustic time difference, density, neutron, etc.) with depth is often used to study the compaction law of the formation [12].
However, the following problems remain when using the acoustic velocity–effective stress diagram method and the acoustic velocity–density diagram method: (1) when establishing the loading curve, the logging acoustic velocity and density of sandstone and mudstone are often mixed and used; (2) even if the logging acoustic velocity and density of mud shale are used, organic matter correction is not performed on the logging data in the source rock section; and (3) misunderstandings and deviations persist in the understanding and use of these two methods. These lead to significant differences in understanding the causes of overpressure.
Previous studies on the causes of overpressure in the Pinghu tectonic zone in the Xihu Depression have made slight progress; however, a significant controversy remains. It is understood that the causes of overpressure include hydrocarbon generation pressurisation and undercompaction [13]; hydrocarbon generation pressurisation, undercompaction, and transfer pressurisation [14]; mainly undercompaction pressurisation, supplemented by hydrocarbon generation pressurisation [15]; and undercompaction in the early stage, and hydrocarbon generation pressurisation in the late stage [16]. The main reasons for the controversy are (1) the error in establishing the loading/compaction curve; and (2) the deviation in the use of discrimination methods for the cause of overpressure.
This study, based on solid research on mudstone compaction and in combination with organic matter correction of logging data, accurately identified the cause of overpressure in the Pinghu tectonic zone in the Xihu Depression. A modified discrimination method for overpressure genesis was employed. Finally, the relationship between overpressure and hydrocarbon distribution was explored.

2. Geological Setting

The East China Sea Shelf Basin is located in the East China Sea. It is the largest Mesozoic–Cenozoic backarc rift basin in China’s offshore waters. The basin is located between the subduction zone of the Western Pacific and the Indo-Eurasian collision zone, creating a complex tectonic environment [17]. The Xihu Depression is located in the eastern part of the East China Sea Shelf Basin, with an area of approximately 59,000 km2. From west to east, it can be roughly divided into the West Slope Belt (WSB), Central Anticline Belt (CAB), and Eastern Fault Belt (EFB). The Pinghu tectonic belt (PTB) located at WSB can be further divided into the following areas: Pinghu (PH), Baoyunting (BYT), Wuyunting (WYT), Kongqueting (KQT), and Tuanjieting (TJT). Two sets of normal fault systems were developed during the fault depression period of the Pinghu tectonic zone: one set is mainly distributed in the north-northeast and northeast directions; another set is distributed in the northwest direction [18]. Based on the active period, it can be divided into early prevailing faults (Palaeocene–late Eocene), middle prevailing faults (Oligocene–early Miocene), and full prevailing faults (Palaeocene–early Miocene) [19]. These faults provide channels for the vertical transmission of overpressure.
Based on the existing drilling data, the Cenozoic strata in the Xihu Depression are sequentially classified from old to new as follows: Baoshi Formation (E2b), Pinghu Formation (E2p), Huagang Formation (E3h), Longjing Formation (N11l), Yuquan Formation (N12y), Liulang Formation (N13l), Santan Formation (N2s), and Quaternary Donghai Group (Qd). The sedimentary system of the Baoshi Formation (E2b) mainly comprises turbulent delta riverbed and fan delta sediments. The Pinghu Formation (E2p) usually comprises dark grey mudstone, calcareous mudstone, some gravel and sandstone, and coal seams. The lithology of the Huagang Formation (E3h) comprises lower coarse sandstone and upper mudstone. The lithology of the Longjing Formation (N11l) is mainly sandstone and mudstone, mixed with a small number of coal seams. There is a fragile layer at the top. The Yuquan Formation (N12y) developed grey-brown and grey-green mudstone and light-grey siltstone, which often developed intertwined with coal seams. The upper and middle sections of the Liulang Formation (N13l) are often interspersed with mudstone and siltstone interlayers, with gravel interbedded with intermediate sandstone developed at the bottom [20].
The mudstone of the Eocene Pinghu Formation (E2p) is well developed and distributed throughout the entire depression. Its cumulative thickness ranges from 400 to 1000 m, and accounts for over 50% of the total thickness of the formation. Additionally, the Pinghu Formation (E2p) was formed in the middle and late stages of rifting, with a high tectonic subsidence rate. At this time, strata onlap was widely occurring, the basin area was expanding, the terrestrial clastic system was declining, and fine-grained coastal lake and bay facies sedimentation were widely developed. This made a basin evolution stage conducive to the development of good hydrocarbon source rocks. At this time, the sedimentation rate of the Pinghu Formation was as high as 300 m/Ma. The high sedimentation rate in the middle and late stages of rifting often makes them a significant period for the formation of hydrocarbon generation overpressure and undercompaction overpressure in source rocks of the basin [21,22].
The Pinghu slope belt is a crucial gas-producing region; several medium–large-scale gas fields such as Pinghu (PH), Baoyunting (BYT), Kongqueting (KQT), Wuyunting (WYT), and Tuanjieting (TJT) have been discovered.

3. Research Methods

Many studies have been conducted on the mechanism of overpressure [6,8,9,10,11], which can be divided into ① undercompaction, ② tectonic extrusion, ③ transfer effect, and ④ fluid expansion, of which the last three are produced by the reduction in the formation load, which is called unloading-induced overpressure. Undercompaction and fluid expansion mean that the fluids are supporting some of the overburden. The integrated mudstone compaction curve, VES (vertical effective stress) -VP (sound velocity) intersection chart, and DEN (density) -VP (sound velocity) intersection chart are relatively reliable and convenient identification methods, which have been successfully applied in many overpressure-developed basins in China [7,10,16]. A comprehensive mudstone compaction curve [8] can be developed by comparing the change trends in the four curves of interval transit time, resistivity, density, and compensated neutrons in the same depth section of a single well; when all four curves are characterized by high porosity, undercompaction overpressure is developed, and the cause of overpressure can be preliminatively identified and the depth of overpressure development can be determined. The VES-VP crossplot [9] distinguishes undercompaction overpressure from unloading overpressure. After the formation of undercompaction overpressure, formation porosity remains unchanged and falls on the loading curve of normal compaction, while unloading overpressure decreases the effective stress due to unloading action, deviates from the loading curve of the normal section, and falls on the unloading curve. At the same time, the variation in porosity caused by overpressure of different unloading causes can be further distinguished based on this. In the DEN-VP crossplot [9], the undercompaction overpressure falls on the loading curve of the normal compaction section, while the overpressure caused by other mechanisms lies outside the loading curve. Different overpressures are identified according to the different response characteristics of different unloading overpressures to sound velocity and density. In this paper, the revised overpressure identification method is used. The new method is reflected in the use of a segmented compaction model that takes chemical compaction into account [23].

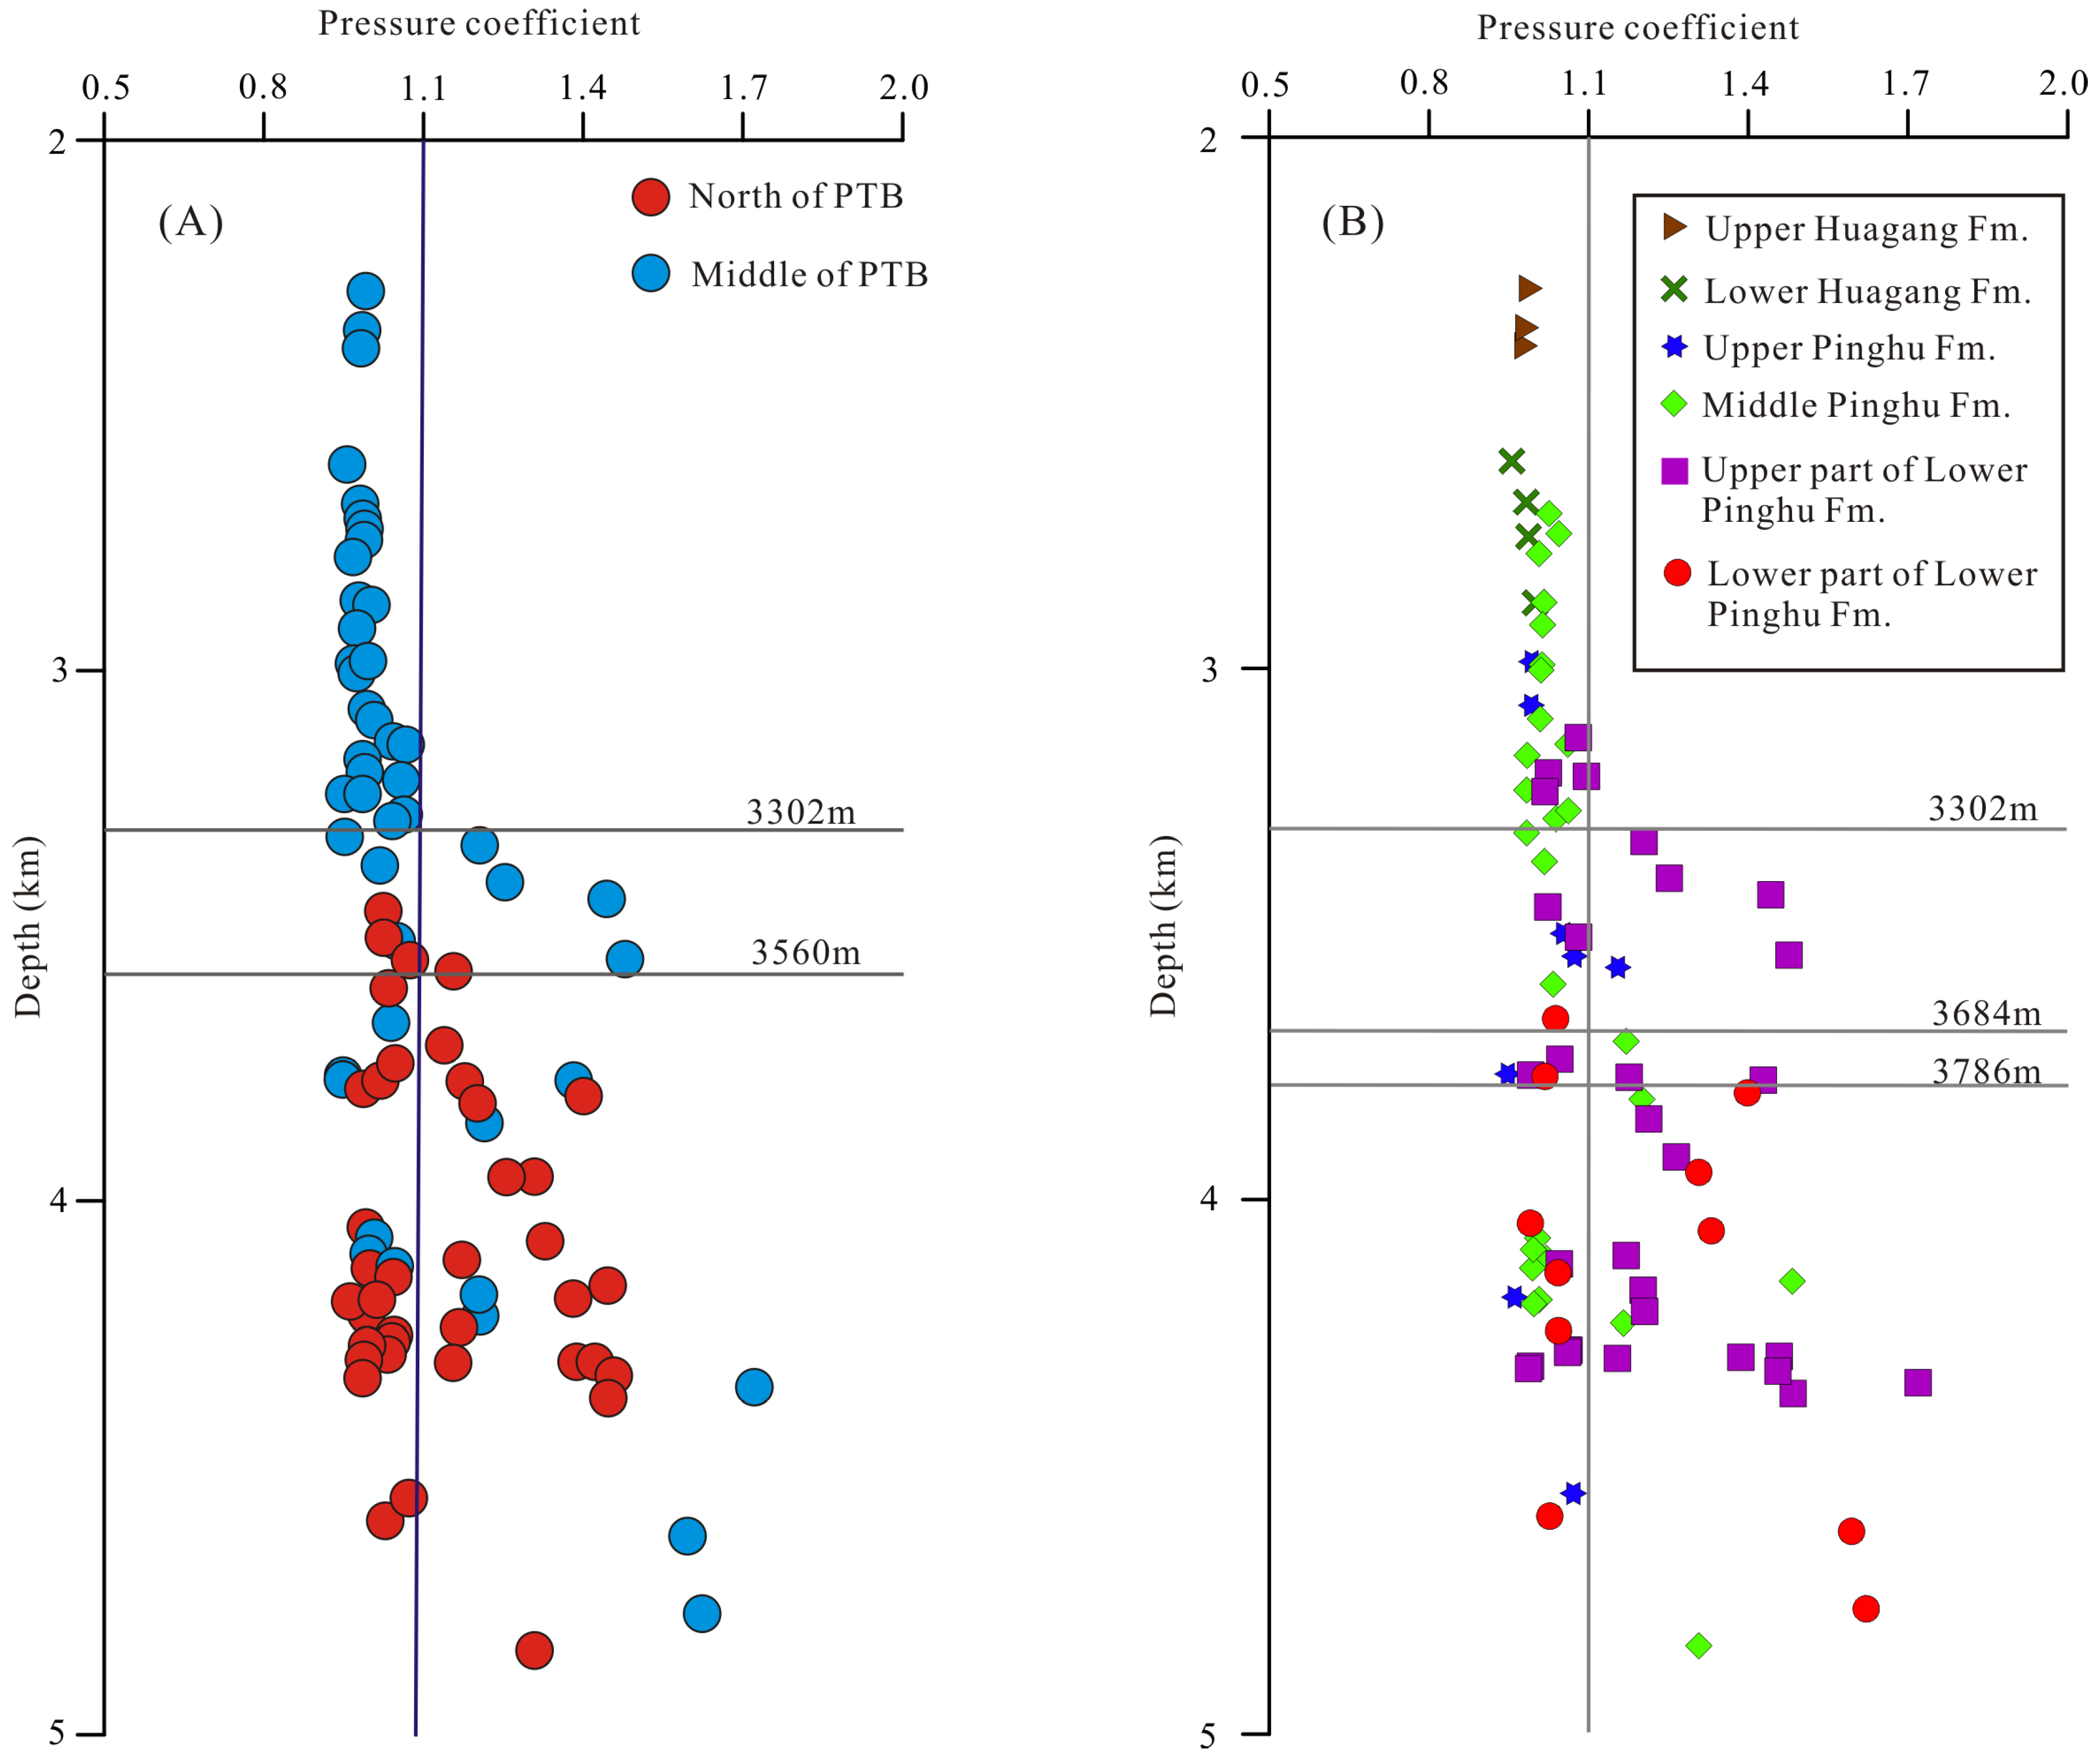
4. Distribution of Overpressure Measured via DST (Drill Stem Test)

The overpressure data are derived from the drill stem test. The pressure coefficient is the fluid pressure divided by the hydrostatic pressure at the corresponding depth. In the Pingbei area, the overpressure occurs at a depth of 3560 m, with a pressure coefficient of 1.0–1.5. The overpressure is relatively low. In the Pingzhong area, the overpressure occurs at a depth of 3302 m, with a pressure coefficient in the 1.0–1.7 range. The overpressure is high, making it a regional high-value zone (see Figure 1A).
The overpressure layers in the Pinghu tectonic zone are mainly in the middle and lower sections of the Pinghu Formation, while the Huagang Formation and the upper section of the Pinghu Formation are under normal pressure. The overpressure in the middle section of the Pinghu Formation occurs at a burial depth of 3684 m, with a pressure coefficient of 1.1–1.4. The overpressure occurs in the upper part of the lower section of the Pinghu Formation at a burial depth of 3302 m, with a pressure coefficient in the 1.1–1.7 range; the pressure changes are complex. As the burial depth increases, the pressure shows multiple reversals from increasing to decreasing. The overpressure occurs in the lower part of the lower section of the Pinghu Formation, with a pressure coefficient in the 1.0–1.7 range (see Figure 1B).

5. Compaction of Mudstone

Mechanical compaction is controlled and influenced by effective stress. During compaction, the particles that constitute the sediment bind more tightly in the vertical direction, causing decreases in porosity, conductivity, and permeability and an increase in bulk density. Different pressure mechanisms and systems exhibit distinct compaction phenomena, with specific evolution patterns in porosity, bulk density, conductivity, and permeability [12]. Therefore, studying the compaction law of mudstone is a prerequisite for qualitative or quantitative research on the hydrodynamic field of the formation. The direct measurement of certain rock properties, especially in situ measurement, is limited. Moreover, different lithologies have varied responses to the testing methods. Therefore, the current research on compaction laws is mainly conducted based on the electrical measurement curves of mudstone.

5.1. Mudstone Deorganic Compaction Correction

The abnormally high value of acoustic time difference caused by the high abundance of organic matter cannot objectively reflect the changes in formation porosity. Quantitative research on the impact of organic matter on the compaction curve can reduce the uncertainty of compaction research results. The equivalent volume model of rock considering kerogen was constructed based on the principle of mudstone compaction research. The hydrocarbon source rock rich in organic matter was divided into four parts: rock skeleton, solid organic matter, pores, and pore fluids. Depending on whether the source rock has passed the hydrocarbon generation threshold, the fluid composition in the pores can be divided into two types: (1) in the pores of immature source rocks, formation water is filled; and (2) in mature hydrocarbon source rocks, some organic matter is converted into hydrocarbons, and the fluid in the pores comprises hydrocarbons and formation water, which is a hydrocarbon-rich fluid. Based on the established geological model, a correction equation for the increase in acoustic time difference caused by organic matter was proposed [24] as follows:
Δ t T O C = Δ t + ρ o m Δ t m a Δ t f Δ t f Δ t m a Δ t f Δ t ρ o m Δ t m a Δ t f + ρ r o c k Δ t o m Δ t m a k ω T O C Δ t f
where Δtma is the acoustic time difference of the rock skeleton, with a value of 187 μs/m; Δtf is the acoustic time difference of the pore fluid, with a value of 620 μs/m; Δtom is the acoustic time difference of organic matter, with a value of 550 μs/m; ρom is the density of organic matter, with a value of 1.1 g/cm3; ρrock is the skeletal density of mud shale, with a value of 2.8 g/cm3; ωTOC is the organic carbon content; and κ is the organic matter conversion coefficient, usually taken as 1.25.
The logging curve reflects the physical characteristics of the formation. To further verify the accuracy of the logging curve after organic matter correction, the measured porosity–depth curve and the measured density–depth curve were established. Based on the example of K1 (Figure 2), it was identified that the acoustic time difference–depth curve corrected by removing organic matter was basically consistent with the measured porosity–depth curve. The acoustic time difference–depth curve without organic matter correction significantly differed from the measured porosity–depth curve below 3500 m. In other words, the acoustic time difference curve corrected by removing the organic matter is more in line with the measured changes in rock pores. Therefore, the comprehensive compaction curve of mudstone corrected by removing the organic matter can better reflect the actual compaction situation of mudstone.

5.2. Compaction Law of Mudstone

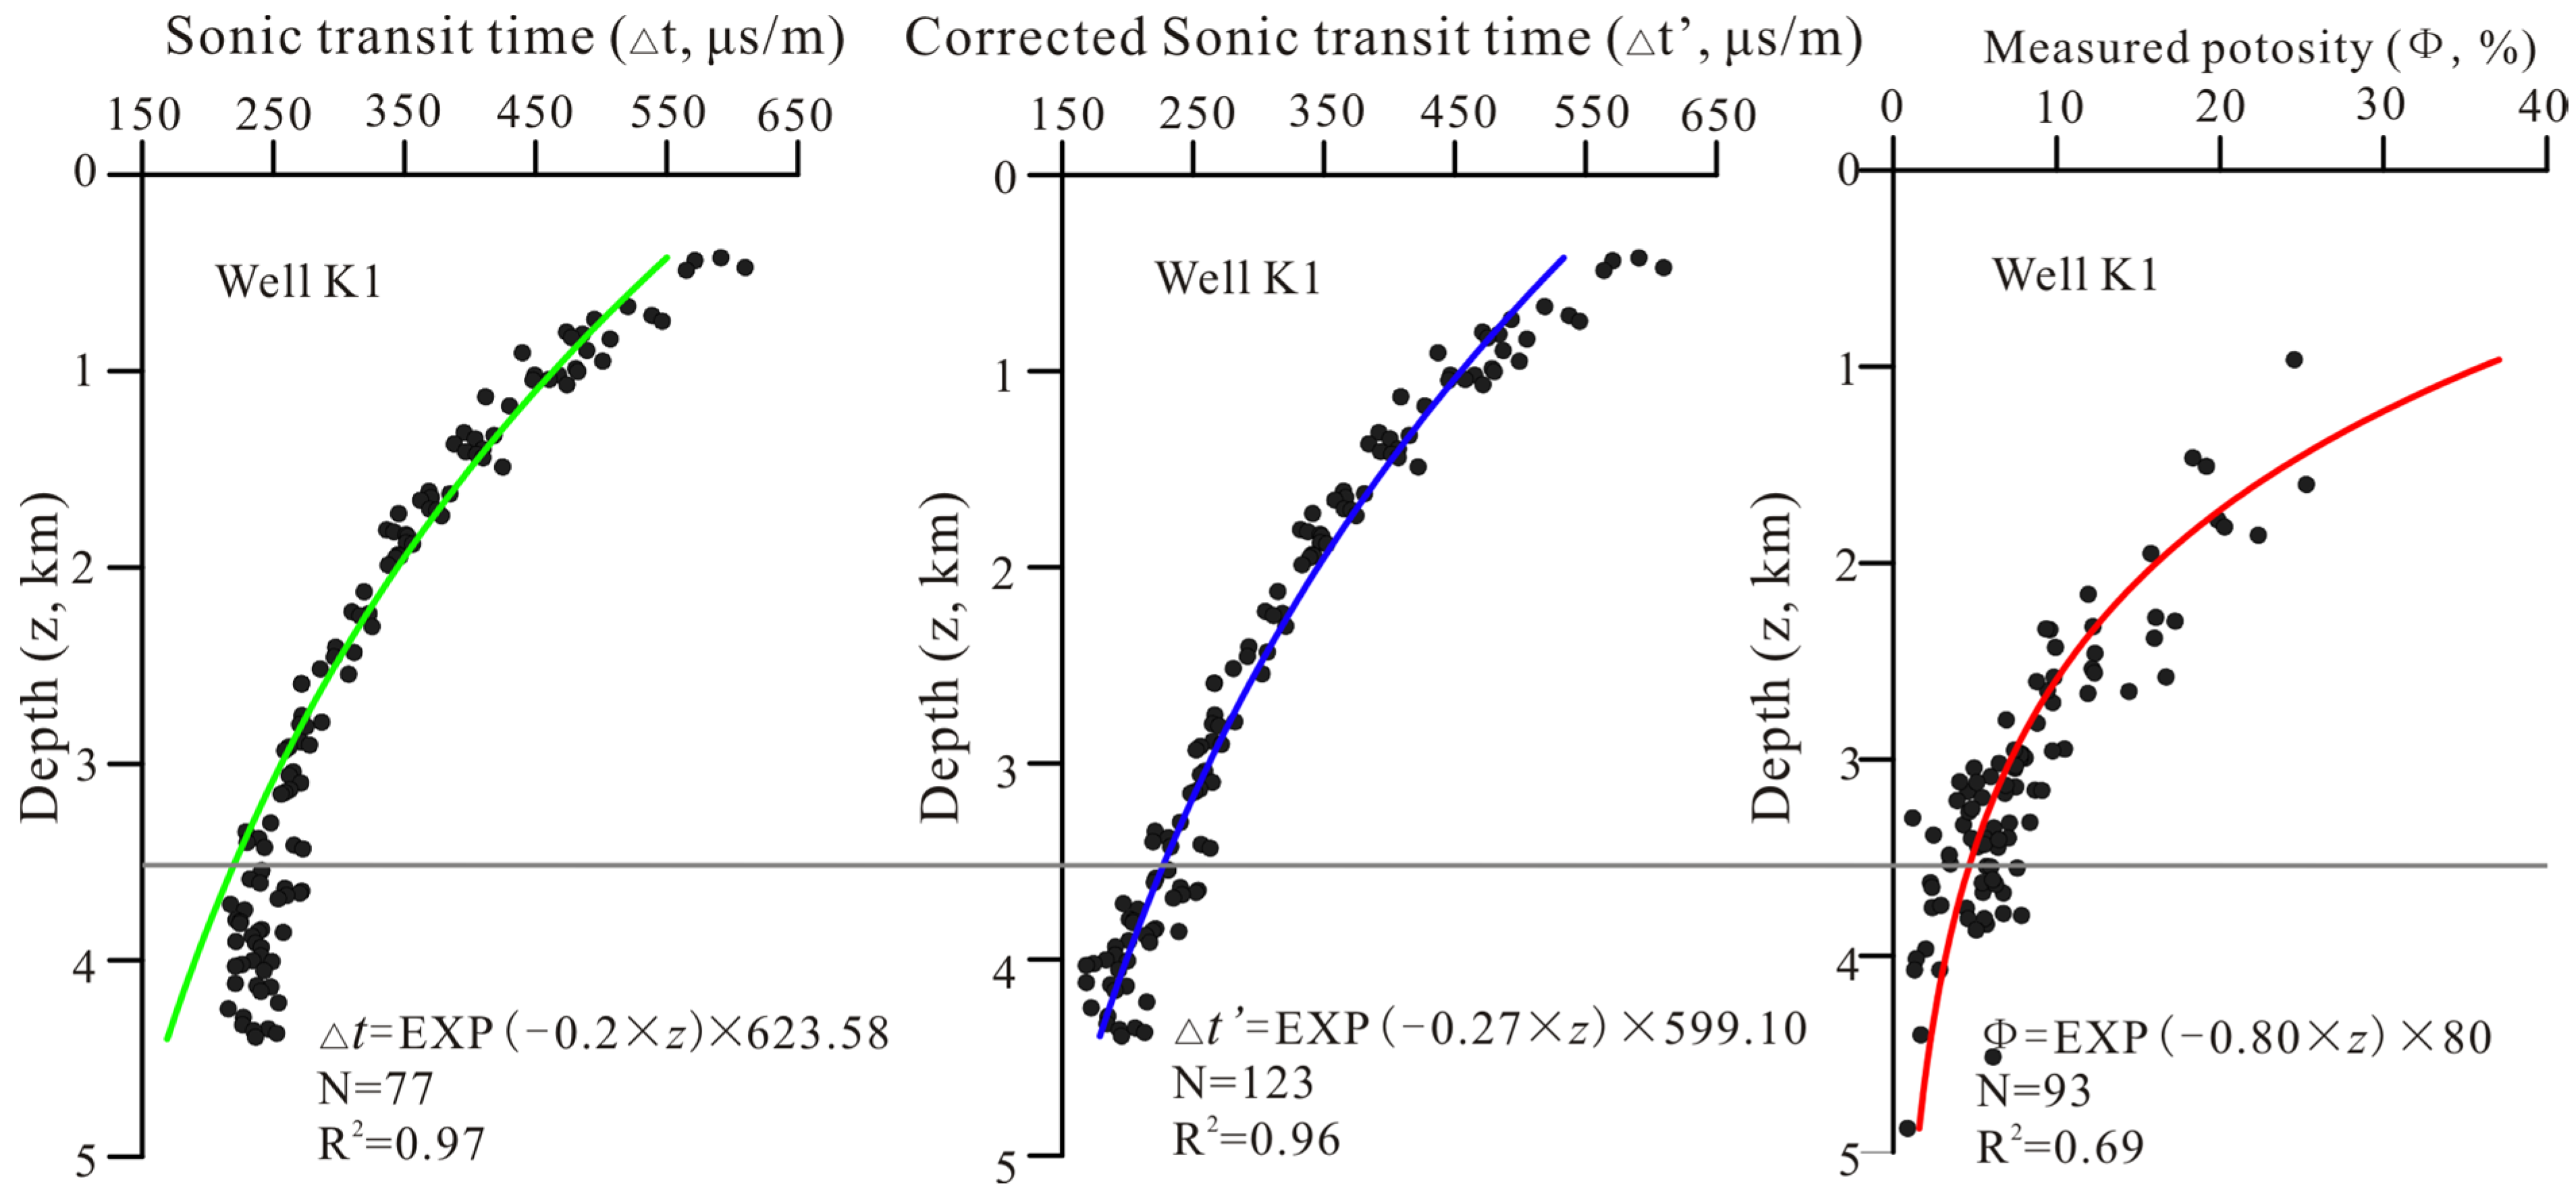
5.2.1. Relationship between Acoustic Travel-Time and Burial Depth

When the formation pressure is hydrostatic, the relation between the acoustic travel-time and burial depth of compaction sediment can be expressed via an empirical equation [12,25]:
Δ t = Δ t 0 e c z
where Δt and Δt0 represent the acoustic travel-time of mudstone at burial depth z and on the surface (z = 0), respectively; c’ is the compacting factor.
The compaction law of mudstone in the Pinghu tectonic zone can be divided into two types. The first type is mainly located in the Baoyunting, Tuanjieting, and Pinghu areas, with relatively balanced mudstone compaction and obvious regional distribution characteristics. The depth of the end point of the normal section is mainly concentrated between 3.0 and 3.5 km, and the compacting factor (c’) is mainly concentrated between 0.2 and 0.3. The end points of the normal sections of the Baoyunting and Tuanjieting areas are mainly located in the upper section of the Pinghu Formation, while that of the Pinghu area is mainly located in the middle and upper sections of the Pinghu Formation (Figure 3A). The second type is mainly located in the Wuyunting and Kongqueting areas. Mudstone compaction significantly varies and is irregularly distributed in the same area. The depths of the end points of the normal sections are mainly concentrated between 3.1 and 4.4 km. The compacting factors (c’) are mainly concentrated between 0.14 and 0.3. They are distributed from the lower section of the Huagang Formation to the upper part of the lower section of the Pinghu Formation (Figure 3B).

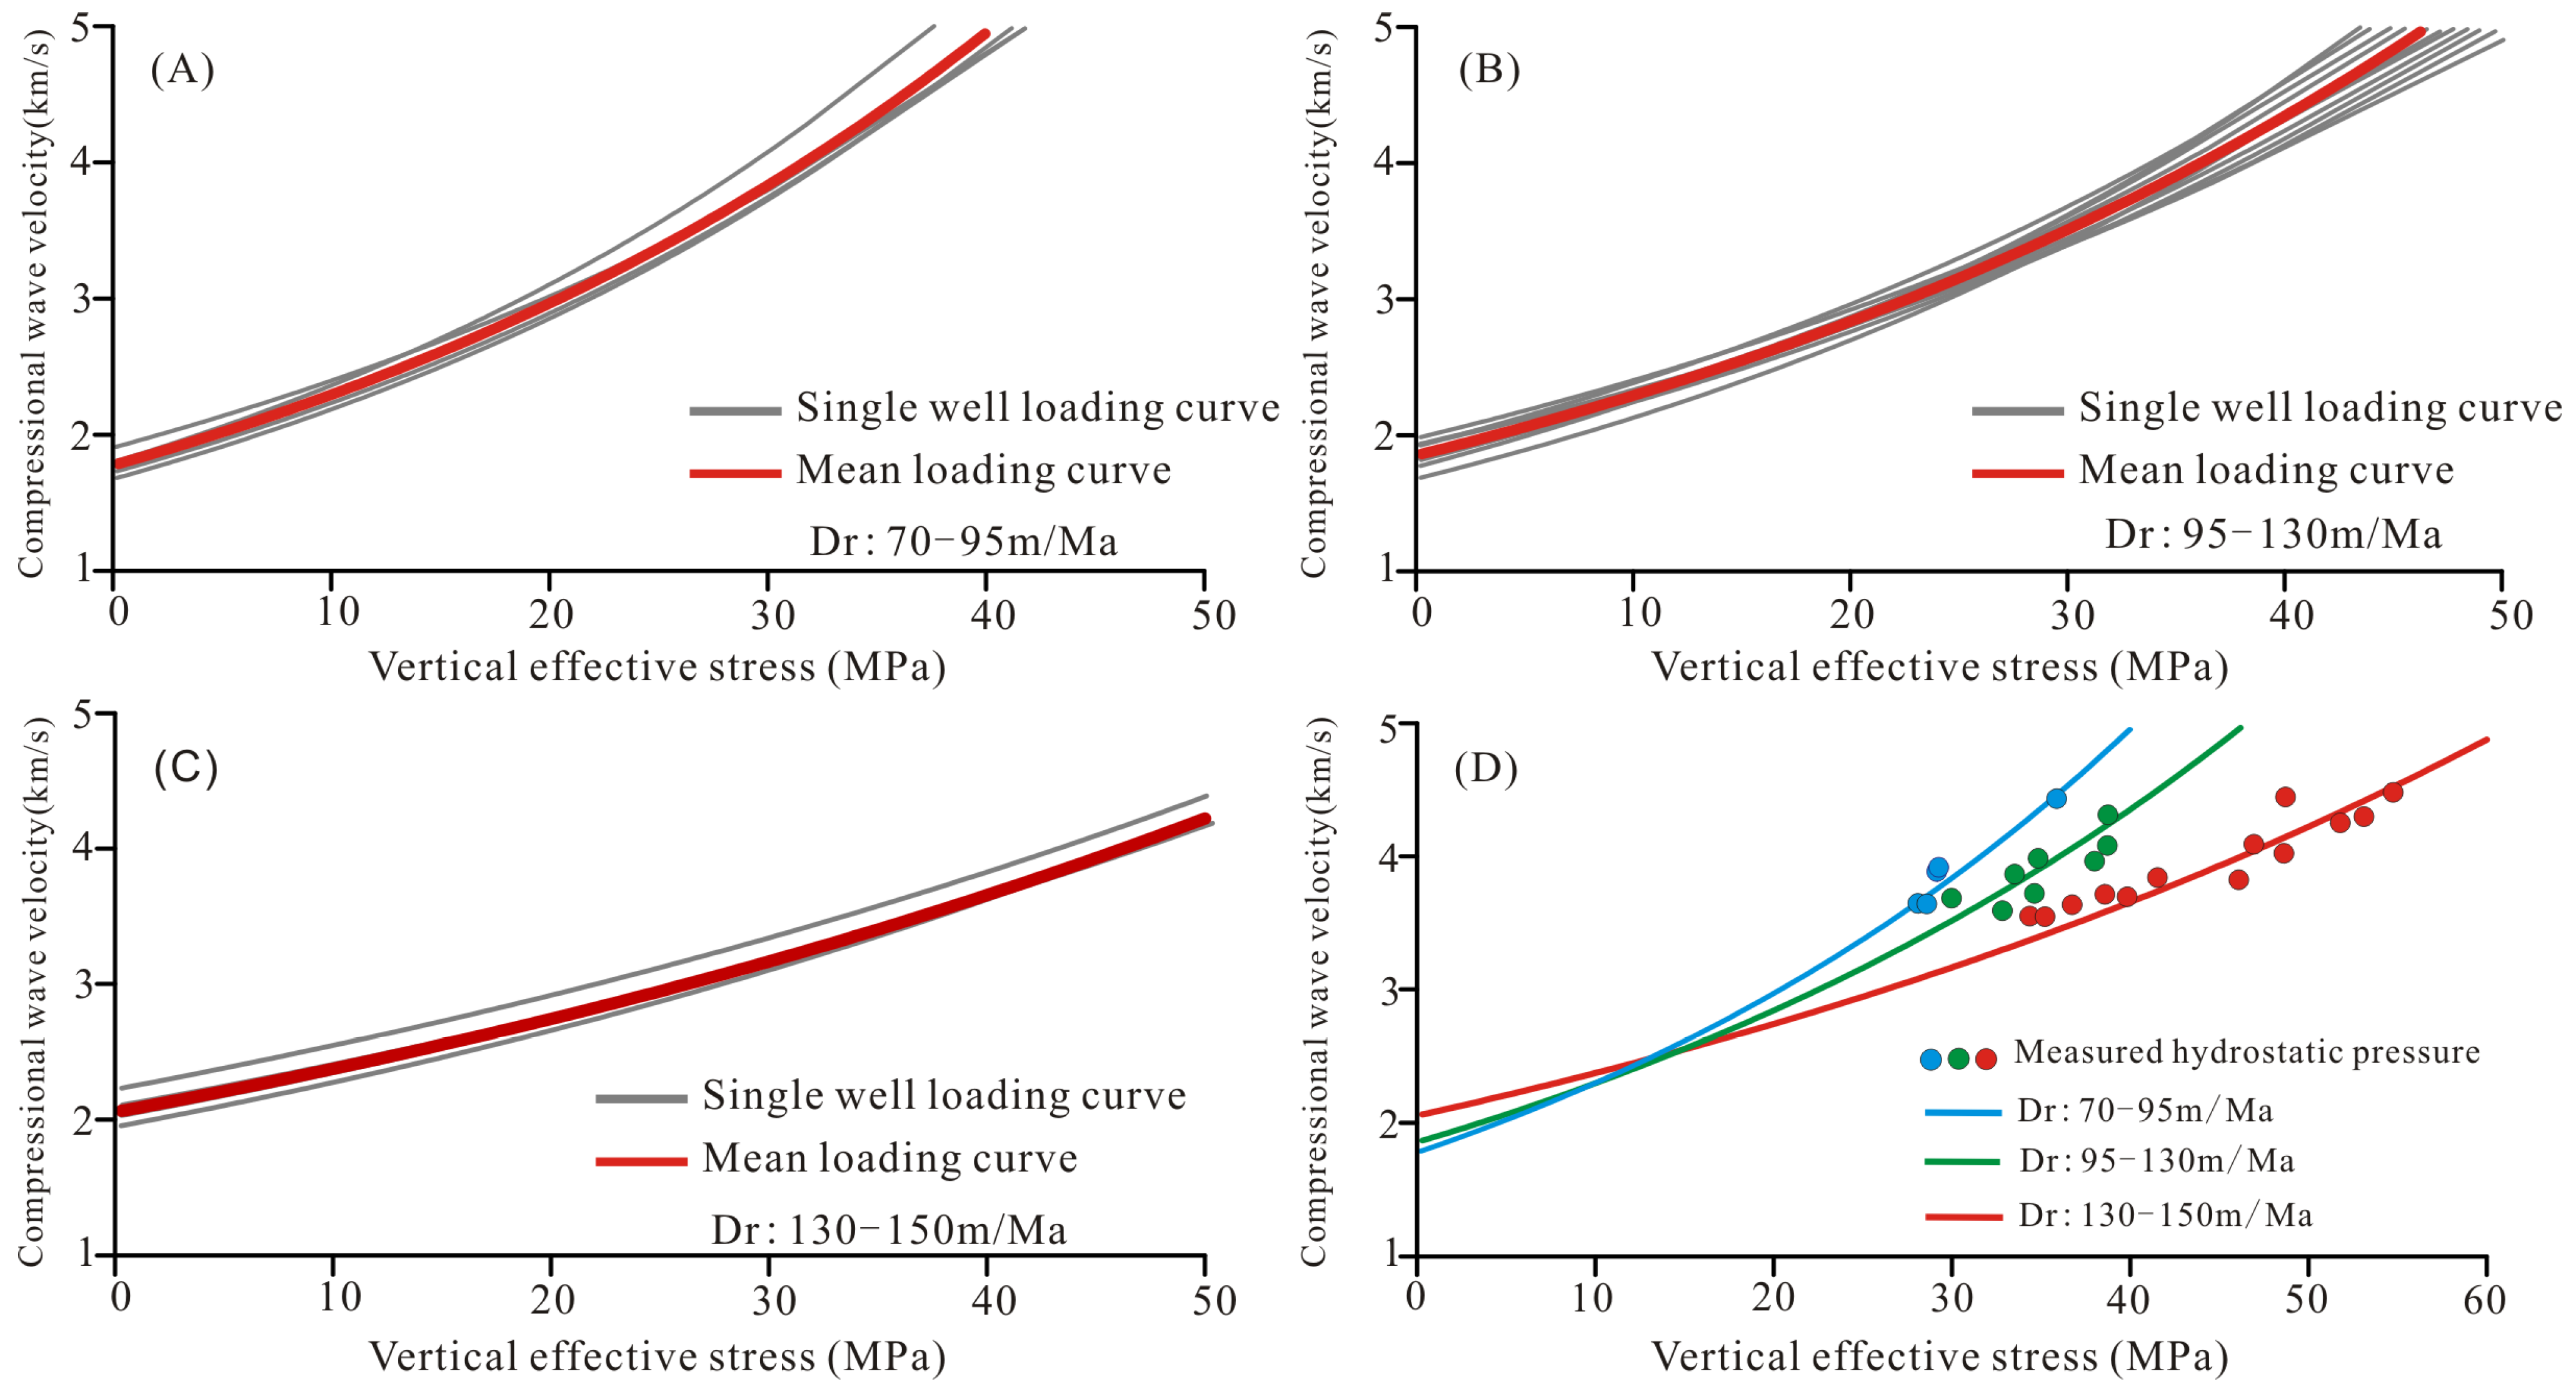
5.2.2. Relationship between Acoustic Velocity and Vertical Effective Stress

The average acoustic velocity–vertical effective stress curve can describe the loading behaviour of rocks during compaction, which can further characterise the compaction law of mudstone. For the convenience of research and comparison, the single-well loading curves of the Pinghu tectonic zone can be divided into three types based on the sedimentation rate and mudstone compaction law, namely the curves with low, medium, and high sedimentation rates. The low sedimentation rate ranges from 70 to 95 m/Ma. The curves with low deposition rates (Dr = 70 to 95 m/Ma) are mainly found in wells in the Pinghu area (Figure 4A). The medium sedimentation rate ranges from 95 to 130 m/Ma. The curves with medium sedimentation rates are mainly found in the wells in the Baoyunting and Tuanjieting areas (Figure 4B). The high sedimentation rate ranges from 130 to 150 m/Ma. The curves with high sedimentation rates are mainly found in the wells in the Wuyunting area (Figure 4C). This classification conforms to the loading law reflected by measured hydrostatic pressure (Figure 4D).

6. Origin of Overpressure

We combined the comprehensive compaction curve method [8], the modified acoustic velocity–effective stress diagram method [9,10], and the acoustic velocity–density diagram method [11] to discriminate the causes of overpressure in the study area.

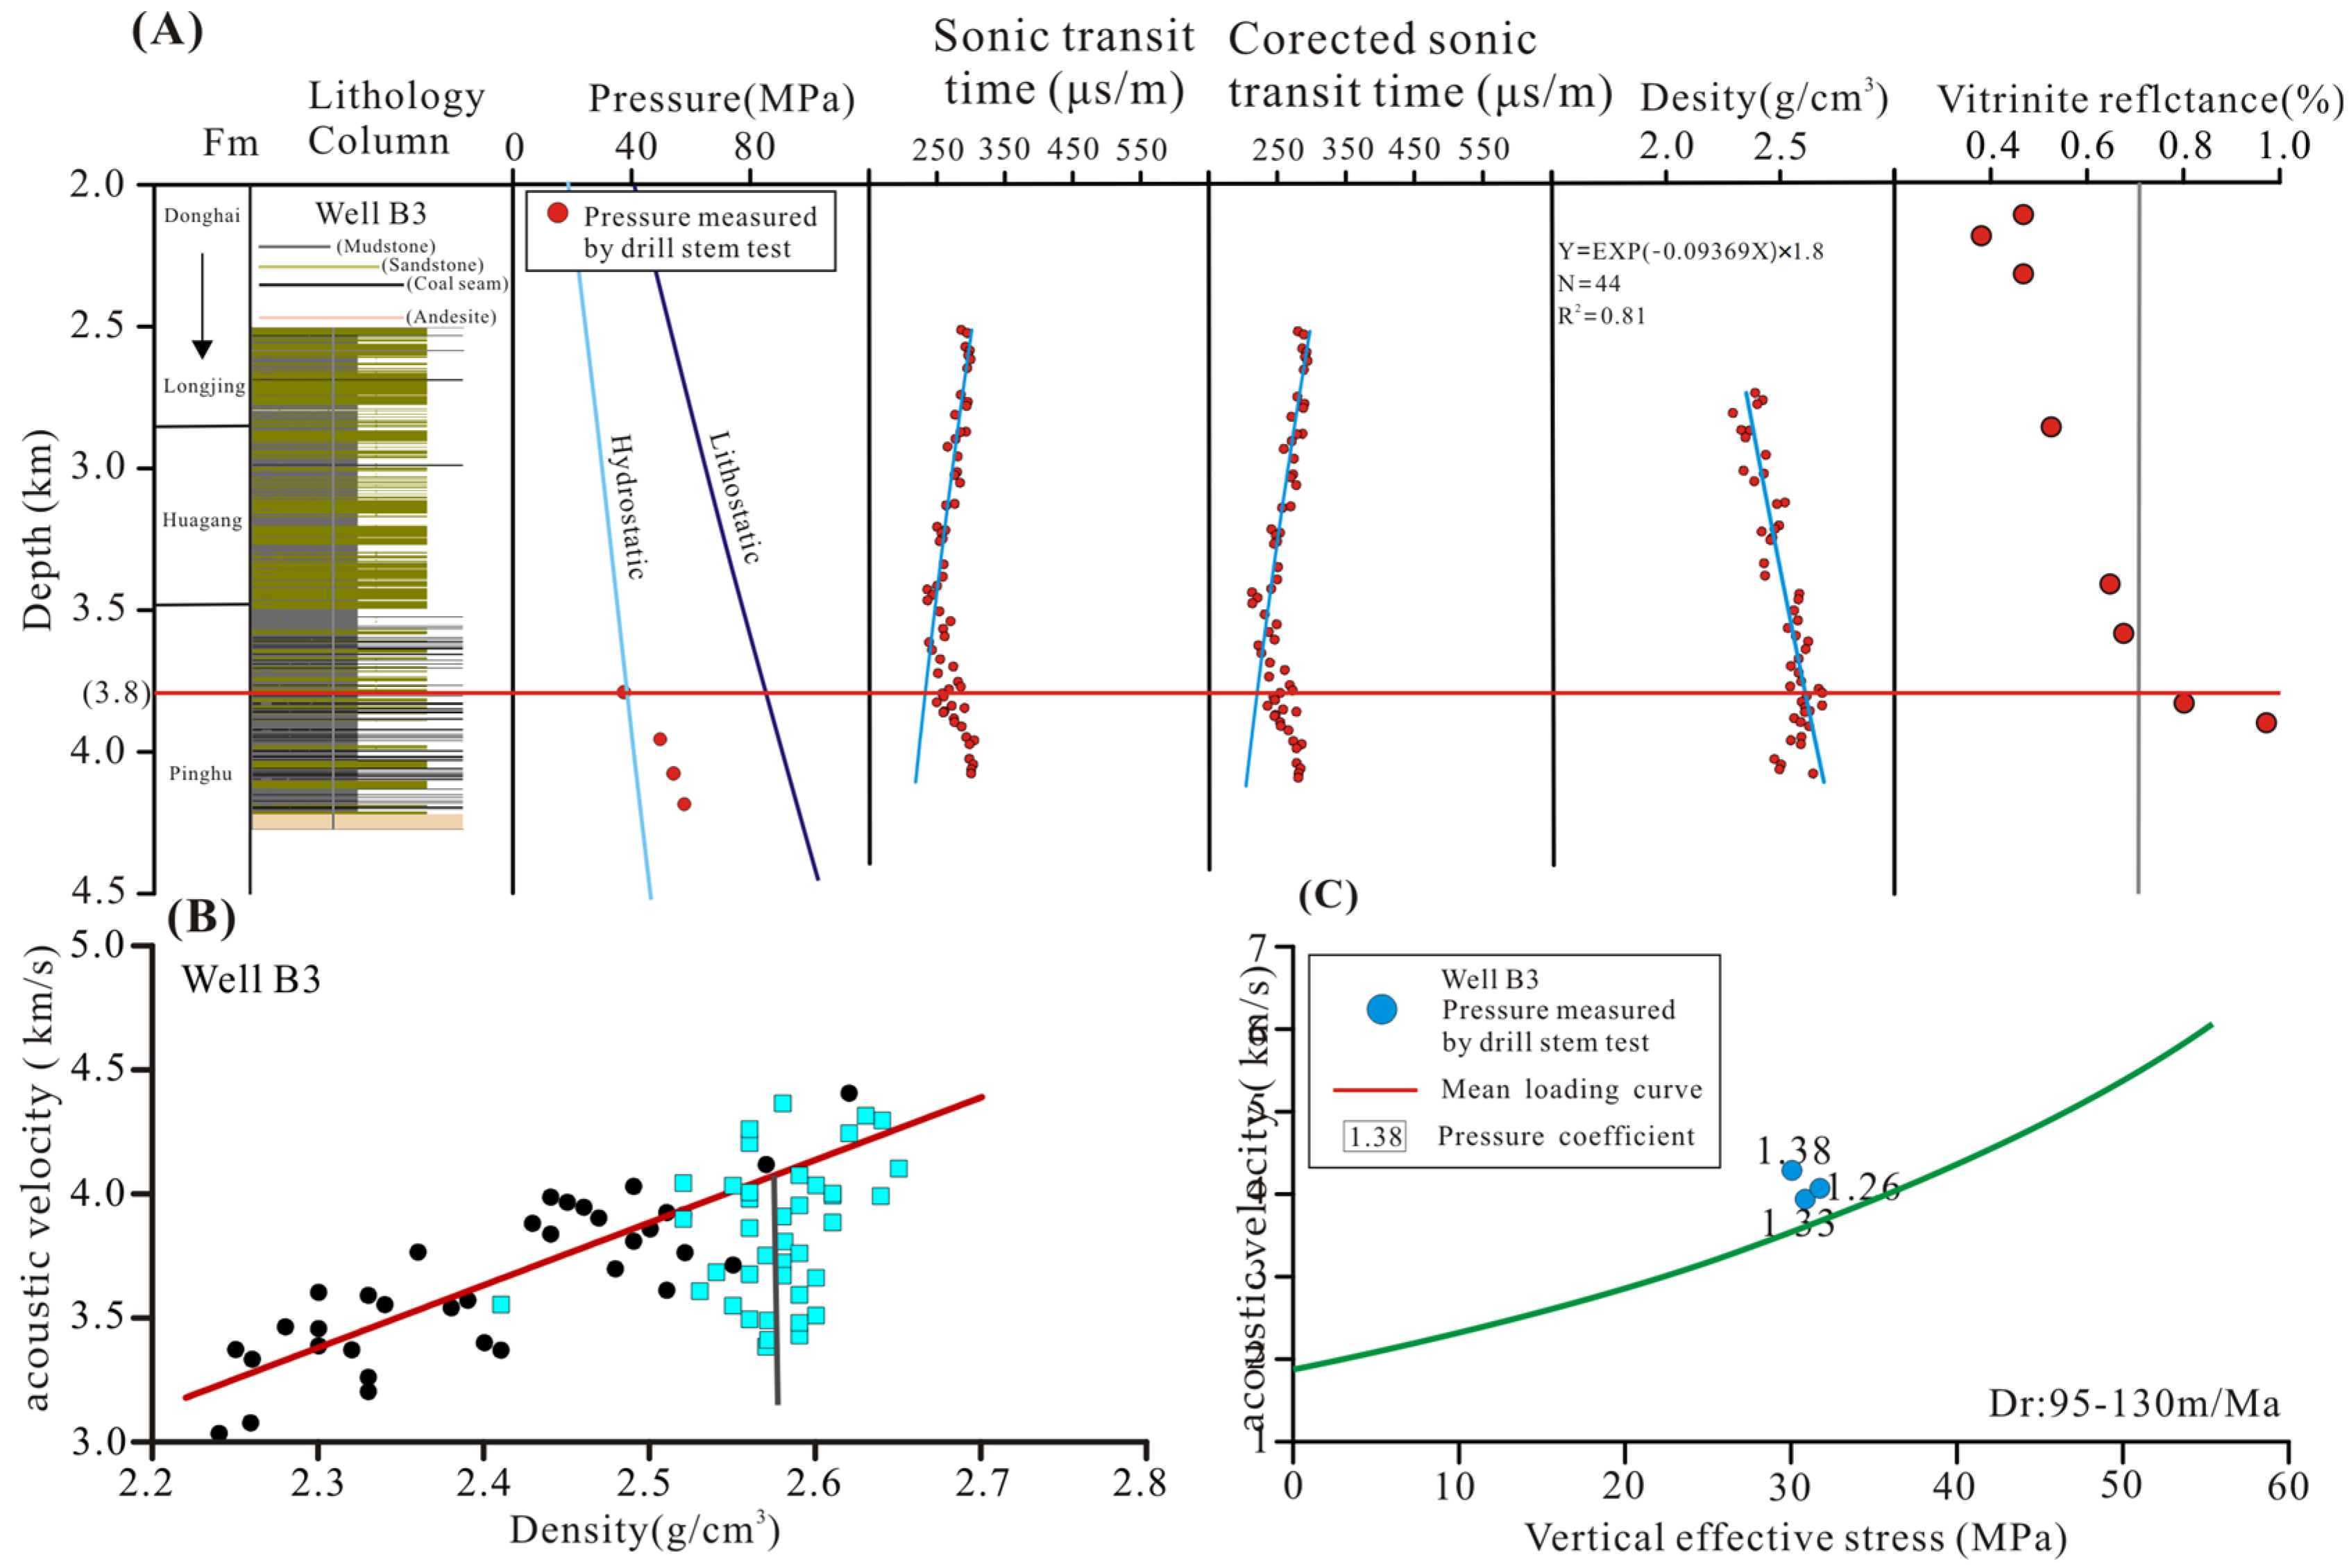
6.1. Kongqueting Area

The main causes of overpressure in the Kongqueting area are undercompaction and fluid expansion. The typical well is K4. According to the characteristics of the comprehensive logging curves, the initial depth of the overpressure section in K4 is 4400 m (Figure 5A). At this depth, the density logging curve and acoustic time difference curve undergo synchronous reversal (Figure 5A). The acoustic time difference gradually increases with depth, and the density gradually decreases with depth (Figure 5A). The acoustic velocity–density points in the overpressure section first deviate vertically and then gradually approach the curve as the depth increases (Figure 5B). The pressure measurement points are located on the average acoustic velocity–vertical effective stress curve (Figure 5C). This indicates that overpressure is caused by fluid expansion and undercompaction pressurisation.

6.2. Wuyunting Area

The main causes of overpressure in the Wuyunting area are undercompaction and fluid expansion. The typical well is W3. The initial depth of overpressure in W3 is 3800 m (Figure 6A). At this depth, the density logging curve and acoustic time difference curve undergo synchronous reversal (Figure 6A), and the acoustic velocity–density points in the overpressure section are distributed on the acoustic velocity–density curve in the normal section (Figure 6B), while the pressure measurement points are located on the average acoustic velocity–vertical effective stress curve (Figure 6C). This indicates that overpressure is due to undercompaction pressurisation.

6.3. Baoyunting Area

The main cause of overpressure in the Baoyunting area is fluid expansion. The typical well is B3. According to the measured pressure data, the initial depth of the overpressure section in B3 is 3800 m (Figure 7A). At this depth, the density logging curve undergoes a reversal and gradually decreases as the depth increases, but the reversal depth of acoustic time difference is 3600 m (Figure 7A). These two curves are not synchronised. The acoustic time difference gradually increases with depth (Figure 7A). Additionally, the acoustic velocity–density points in the overpressure section are distributed below the acoustic velocity–density curve in the normal section (Figure 7B), while the pressure measurement points are located above the average acoustic velocity–vertical effective stress curve (Figure 7C), and the reflectivity of the vitrinite is >0.8 (Figure 7A). This indicates that overpressure is caused by fluid expansion.

6.4. Pinghu Area

The main causes of overpressure in the Pinghu area are undercompaction and fluid expansion. The typical well is P6. The initial depth of the overpressure section in P6 is 3250 m (Figure 8A). At this depth, the density logging curve and acoustic time difference curve undergo synchronous reversal (Figure 8A). The density changes in a nearly linear manner with increasing depth, while the acoustic time difference changes in an approximately linear manner with increasing depth (Figure 8A). Additionally, the acoustic velocity–density points in the overpressure section gradually deviate vertically from the curve as the depth increases (Figure 8B), with the pressure measurement points (3286 m) located on the average acoustic velocity–effective stress curve (Figure 8C). This indicates that overpressure is caused by fluid expansion and undercompaction pressurisation.

7. Relationship between Overpressure and Hydrocarbon Accumulation

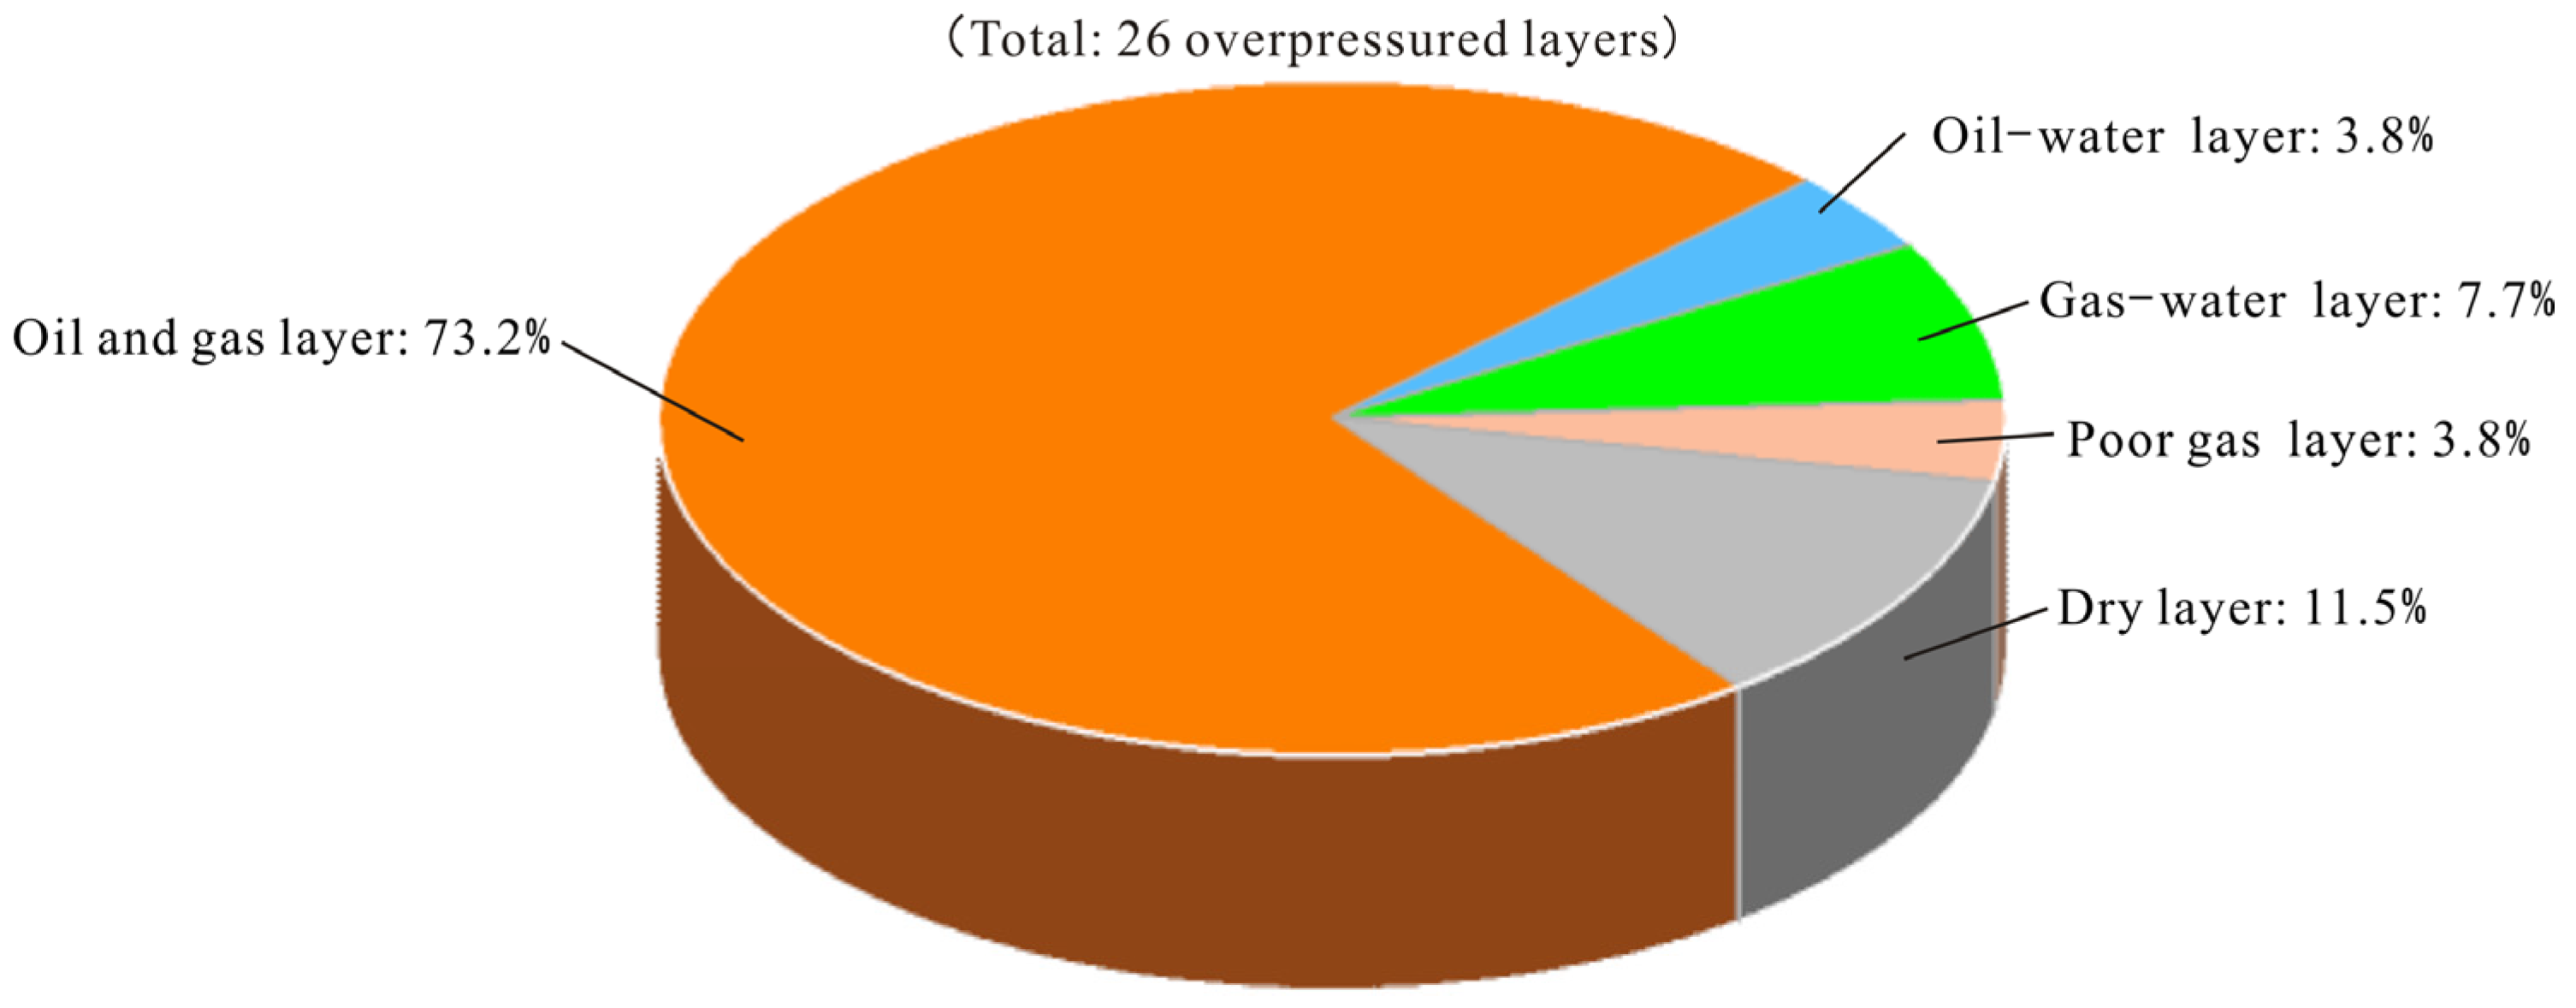
7.1. Relationship between Hydrocarbon Distribution and Overpressure

The above analysis shows that the current abnormal pressure system in the Pinghu tectonic zone includes both overpressure and relief systems. To better express the relationship between abnormal pressure and hydrocarbon distribution, this study analysed the relationship between abnormal pressure systems and hydrocarbon distribution. Among the 26 overpressure layers in the Pinghu tectonic zone, the oil-and-gas layers account for 73.2%, the oil–water layer accounts for 3.8%, the gas–water layer accounts for 7.7%, the poor gas layer accounts for 3.8%, and the dry layer accounts for 11.5% (Figure 9). The probability of hydrocarbon bearing in abnormal pressure layers is greater than 50%, and this largely controls the hydrocarbon distribution.

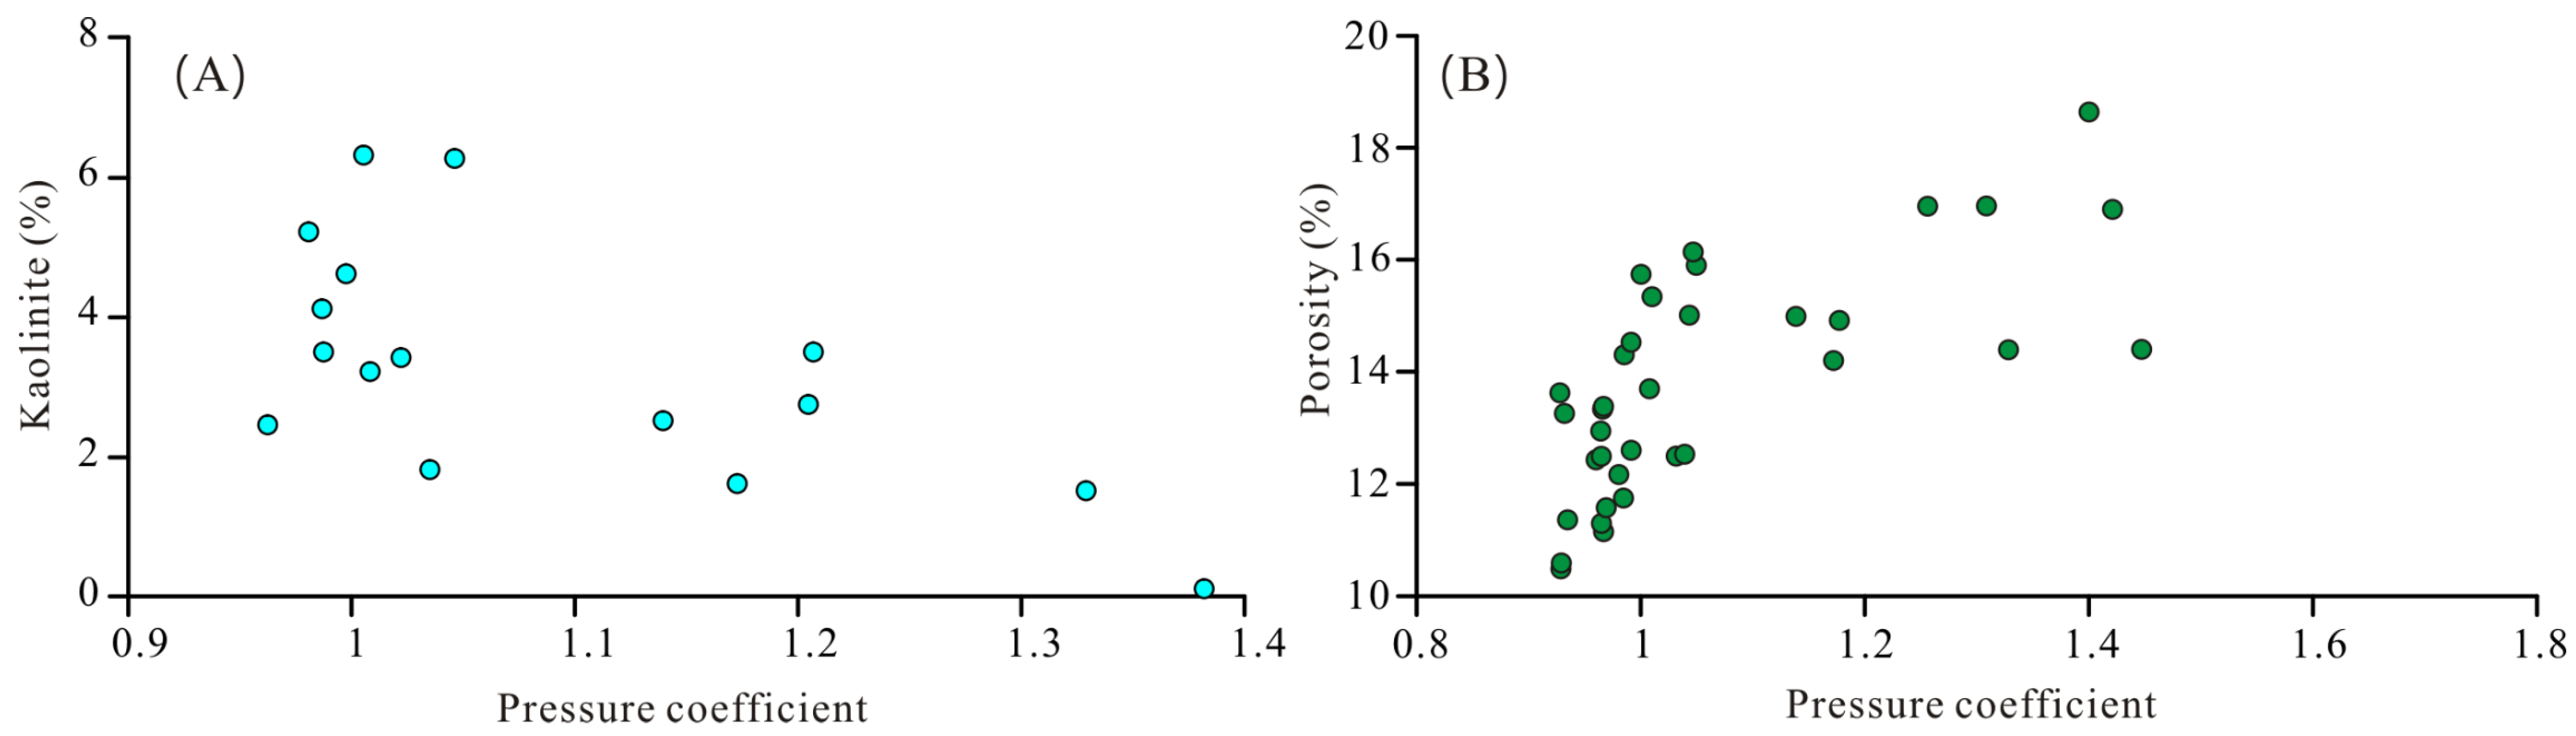
7.2. Relationship between Overpressure and Reservoir Physical Properties

The deep layers of the Pinghu tectonic zone mainly comprise low–medium porosity and low–medium permeability reservoirs, including the Pinghu Formation, part of the lower section of the Huagang Formation, and the upper part of the Baoshi Formation. The measured porosity can be divided into two sections at the depth of 3900 m. The porosity of the reservoir above 3900 m is greater than 10%. As the depth increases, the porosity gradually decreases, and the permeability range is 0–600 mD, with a large span. At reservoir depths of 3900–4800 m, the porosity steeply decreases with increasing depth. The porosity can reach as high as 20% and as low as 5%, and the permeability range is 0–200 mD, with most values less than 100 mD. At this depth range, the content of clay minerals suddenly increases. Among them, the average content of authigenic kaolinite is higher than that of clay minerals such as illite, chlorite, and illite–smectite mixed-layer clay. However, the distribution of kaolinite content is uneven, with a large span. High values can reach up to 8% and low values can be as low as 1% [23].
Microscopic observation reveals that authigenic kaolinite is produced in a pore-filled form. Kaolinite crystals are present to varying degrees in most intergranular pores. Part of kaolinite is filled in the throat, reducing the width of the throat. It causes poor reservoir performance at the depth range of 3900 m to 4800 m, which causes a destructive effect [26]. Research has identified that the content of kaolinite is controlled by overpressure. The higher the pressure coefficient, the lower the content of kaolinite and the higher the porosity (Figure 10A,B). Conversely, the higher the content of kaolinite, the lower the porosity (Figure 10A,B). This finding shows that in the surge section of kaolinite, under the action of fluid pressure, kaolin migrates and enriches toward the low-pressure areas, resulting in a decrease in the porosity in low-pressure areas and preservation of the pores in high-pressure areas.

7.3. Relationship between Hydrocarbon Charge and Overpressure

Buoyancy and overpressure are the main driving forces of primary and secondary migration of oil and gas. According to the pressure of fluid inclusions, the evolution of fluid pressure can be divided into three stages. First, the pressurisation stage mainly occurred at 13–8 Ma, with a maximum pressure of 50 MPa. Thereafter, the evolution of fluid pressure entered the second stage, mainly occurring between 8 and 5 Ma. Impacted by the Longjing Movement, the formation began to uplift and erode, and fluid pressure began to decrease until the hydrostatic pressure was reached. The third stage mainly occurred between 5 Ma and today, including pressurisation and pressure relief. The current pressure system is mainly the result of pressurisation and pressure relief during the third stage, which further proves the existence of pressure leakage [20].

8. Conclusions

By using the latest identification method of overpressure genesis and combining it with the geological background, we clarified the genesis of overpressure in Xihu Depression and its relationship with oil and gas distribution, reservoir physical properties, and oil and gas charging, and obtained the following important understandings:
  • The distribution characteristics of formation pressure measured using the DST show that in the vertical direction, overpressure is mainly located in the lower section of the Pinghu Formation, with a pressure coefficient in the 1.1–1.7 range and a pressure relief feature. On the plane, the pressure coefficient in the Pingzhong area is higher than that in the Pingbei area.
  • The compaction and loading laws of mudstone were studied based on organic matter correction. It was identified that under the main control of the sedimentation rate, there are three types of acoustic velocity–effective stress curves of mudstone in the study area. The main causes of abnormally high pressure in the research area are undercompaction and fluid expansion. The fluid expansion mechanisms include the overpressure transmission and hydrocarbon charging within the reservoir as well as the hydrocarbon generation pressurisation and overpressure transmission within the source rock. The formation mechanism of overpressure slightly varies among the different layers.
  • The relationship between overpressure and hydrocarbon distribution shows that the hydrocarbons are more enriched in the overpressure layers than in the relief layers. In the surge section of kaolinite, under the action of fluid pressure, kaolin migrates and enriches toward the low-pressure areas, resulting in a decrease in the porosity in low-pressure areas and preservation of the pores in high-pressure areas. The evolution of fluid pressure can be divided into two stages. The first stage mainly involved pressurisation. The second stage included both pressurisation and pressure relief. Both stages were in the period of hydrocarbon accumulation. Both pressurisation and pressure relief are the driving forces for hydrocarbon charging.

Author Contributions

Conceptualisation, J.L. and D.Q.; methodology, C.F.; software, W.Y. and X.W.; validation, J.L., D.Q. and Y.D.; formal analysis, H.S.; investigation, Y.D.; resources, H.S.; data curation, X.W.; writing—original draft preparation, J.L. and C.F.; writing—review and editing, J.L. and C.F.; visualisation, W.Y.; supervision, Y.D. and W.Y.; project administration, Y.D.; funding acquisition, J.L. All authors have read and agreed to the published version of the manuscript.

Funding

This research was funded by "Research on Pressure Pre-monitoring Method of Complex Geological Conditions in Xihu Sag".

Data Availability Statement

This research includes a confidentiality agreement signed. The original drilling and seismic data are not allowed to be disclosed.

Conflicts of Interest

Authors Li, J.; Qin, D.; Yin, W.; Wang, X.; Dai, Y.; Shi, H. were employed by the company Shanghai Branch of CNOOC (China) Co., Ltd., Shanghai 200335, China. The remaining authors declare that the research was conducted in the absence of any commercial or financial relationships that could be construed as a potential conflict of interest.

References

  1. Dou, X.; Zheng, H.Y.; Jiao, X.Q. Abnormal pressure and hydrocarbon accumulation. Earth Sci. Front. 1995, 29, 19–23. [Google Scholar]
  2. Zha, M.; Qu, J.X.; Zhang, W.H. The relationship between overpressure and reservoir forming mechanism. Pet. Explor. Dev. 2002, 29, 19–23. [Google Scholar]
  3. Snarsky, A.N.; Freiberger, F.C. Die primare Migration des Erdols. Freib. Forschungsch 1962, 123, 63–73. [Google Scholar]
  4. Hubbert, M.K.; Willis, D.G.W. Mechanics of hydraulic fracturing. AAPG Memoir 1972, 18, 153–163. [Google Scholar] [CrossRef]
  5. Hubbert, M.K. The Theory of Ground-Water Motion. J. Geol. 1940, 48, 785–944. [Google Scholar] [CrossRef]
  6. Wang, W.Y.; Pang, X.Q.; Wu, L.Y.; Chen, D.X.; Huo, Z.P.; Pang, Y.; Chen, D. Pressure distribution features of deep and middle-shallow hydrocarbon reservoir in global oil and gas-bearing basins. Acta Pet. Sin. 2015, 26, 194–202. [Google Scholar]
  7. Fan, C.Y.; Wang, G.; Wang, Z.L.; Han, X.J.; Chen, J.; Zhang, K.L.; Zhang, B.S. Prediction of multiple origin overpressure in deep fold-thrust belt: A case study of Kuqa subbasin, Tarim Basin, northwestern China. AAPG Bull. 2021, 105, 1511–1533. [Google Scholar] [CrossRef]
  8. Hermanrud, C.; Wensaas, L.; Teige, G.M.G.; Vik, E.; Bolas, H.M.N.; Hansen, S. Shale porosities from well logs on Haltenbanken (offshore mid-Norway) show no influence of overpressuring. In Abnormal Pressures in Hydrocarbon Environments; AAPG Memoir; Law, B.E., Ulmishek, G.F., Slavin, V.I., Eds.; American Association of Petroleum Geologists: Tulsa, OK, USA, 1998; Volume 70, pp. 65–85. [Google Scholar]
  9. Bowers, G.L. Pore pressure estimation from velocity data; accounting for overpressure mechanisms besides undercompaction. SPE Drill. Complet. 1995, 10, 89–95. [Google Scholar] [CrossRef]
  10. Fan, C.Y.; Wang, Z.L.; Wang, A.G.; Fu, S.T.; Wang, L.Q.; Zhang, Y.S.; Kong, H.Y.; Zhang, X. Identification and calculation of transfer overpressure in the northern Qaidam Basin, northwest China. AAPG Bull. 2016, 100, 23–39. [Google Scholar] [CrossRef]
  11. Tingay, M.R.P.; Morley, C.K.; Laird, A.; Limpornpipat, O.; Krisadasima, K.; Pabchanda, S.; Macintyre, H.R. Evidence for overpressure generation by Kerogen to gas maturation in the northern Malay Basin. AAPG Bull. 2013, 97, 637–672. [Google Scholar] [CrossRef]
  12. Chen, H.L.; Tang, X.Y. A study of clay compaction and primary migration of oil and gas. Oil Gas Geol. 1981, 2, 114–122. [Google Scholar]
  13. Yang, C.Y.; Sun, P.; Tian, C.; Zhang, S.P.; Jiang, Y.M. Distribution and Formation Mechanism of Overpressure in Pinghu Formation, Xihu Sag, East China Sea. Offshore Oil 2013, 33, 8–12. [Google Scholar]
  14. Wang, L.; Yang, R.; Sun, Z.; Wang, L.; Guo, J.; Chen, M. Overpressure: Origin, Prediction, and Its Impact in the Xihu Sag, Eastern China Sea. Energies 2022, 15, 2519. [Google Scholar] [CrossRef]
  15. Du, M.D.; Ye, J.R.; Wu, J.F.; Shan, C.; Lei, C. Overpressure Formation Mechanism in Xihu Depression of the East China Sea shelf basin. Earth Sci. 2017, 42, 119–129. [Google Scholar]
  16. Su, A.; Du, J.M.; He, C.; Yu, Y.; Wang, C.W.; Luo, J.Y. Overpressure and hydrocarbon accumulation in Pinghu structural belt in Xihu Depression, East China Sea. J. Cent. South Univ. 2017, 48, 742–750. [Google Scholar]
  17. Zhu, X.J.; Chen, J.F.; Li, W. Hydrocarbon generation potential of Paleogene coals and organic rich mudstones in Xihu sag, East China Sea Shelf basin, offshore eastern China. J. Pet. Sci. Eng. 2020, 184, 106450. [Google Scholar] [CrossRef]
  18. Tang, X.J.; Jiang, Y.M.; Zhang, P.J.; Wang, C.; He, X.J.; Yang, M. Fault characteristic and its control on traps of fault structural layer in the northern Pinghu Slope Belt, Xihu Sag, East China sea shelf basin. Mar. Geol. Front. 2019, 35, 34–43. [Google Scholar]
  19. Yang, C.H.; Zeng, G.D.; Li, S.Q.; Liang, R.B. Fault development characteristics and hydrocarbon accumulation in Pingbei area of Xihu Sag, East China Sea. Pet. Geol. Exp. 2014, 36, 64–69+82. [Google Scholar]
  20. Su, A.; Chen, H.H.; Lei, M.Z.; Li, Q. Paleo-pressure evolution and its origin in the Pinghu slope belt of the Xihu Depression, East China Sea Basin. Mar. Pet. Geol. 2019, 107, 198–213. [Google Scholar] [CrossRef]
  21. Jiang, W.B. Study on Reservoir Formation Characteristics of the Central Inversion Tectonic Belt in Xihu Sag, East China Sea; China University of Geosciences: Beijing, China, 2012. [Google Scholar]
  22. Zhang, Z. Features of Formation Pressure and Its Relationship with the Oil and Gas Distribution in the PH Structural Belt of Xihu Sag; Chengdu University of Technology: Chengdu, China, 2018. [Google Scholar]
  23. Fan, C.Y.; Wang, G. The significance of a piecemeal geometric model of mudstone compaction: Pinghu Slope, Xihu Depression, Eastern China. Mar. Pet. Geol. 2021, 131, 105138. [Google Scholar] [CrossRef]
  24. Li, C.; Zhang, L.K.; Luo, X.R. A quantitative method for revising abnormally high sonic data in rich-organic rock during compaction study. J. China Univ. Pet. 2016, 40, 77–87. [Google Scholar]
  25. Magara, K. Compaction and Migration of Fluids in Miocene Mudstone, Nagaoka Plain, Japan. AAPG Bull. 1968, 52, 2466–2501. [Google Scholar]
  26. Hu, M.Y.; Shen, J.; Hu, D. Reservoir characteristics and its main controlling factors of the Pinghu Formation in Pinghu structural belt, Xihu Depression. Oil Gas Geol. 2013, 34, 185–191. [Google Scholar]
Figure 1. Relationship between pressure coefficient and burial depth in the different areas (A) and formations (B).
Energies 16 08055 g001
Figure 2. Comparison between deorganic corrected sonic transit time and measured porosity of mudstone in well K1.
Energies 16 08055 g002
Figure 3. The two kinds of compaction curves of mudstone in the study area.
Energies 16 08055 g003
Figure 4. Single well loading curves and mean loading curves with different deposition rates of 70-95m/Ma (A), 95-130m/Ma (B) and 130-150m/Ma (C); (D) Measured hydrostatic pressure and three kinds of mean loading curves at different deposition rate ranges (Dr).
Energies 16 08055 g004
Figure 5. Origin identification diagram of overpressure in Kongqueting (KQT) area. (A) Comprehensive compaction curves. (B) Logging density and compressional wave velocity intersection diagram. (C) Loading curves.
Energies 16 08055 g005
Figure 6. Origin identification diagram of overpressure in Wuyunting (WYT) area. (A) Comprehensive compaction curves. (B) Logging density and compressional wave velocity intersection diagram. (C) Loading curves.
Energies 16 08055 g006
Figure 7. Origin identification diagram of overpressure in Baoyunting (BYT) area. (A) Comprehensive compaction curves. (B) Logging density and compressional wave velocity intersection diagram. (C) Loading curves.
Energies 16 08055 g007
Figure 8. Origin identification diagram of overpressure in Pinghu (PH) area. (A) Comprehensive compaction curves. (B) Logging density and compressional wave velocity intersection diagram. (C) Loading curves.
Energies 16 08055 g008
Figure 9. Relationship between overpressure layer and oil and gas bearing in Pinghu tectonic belt.
Energies 16 08055 g009
Figure 10. Relationship between kaolinite (A), porosity (B), and pressure coefficient.
Energies 16 08055 g010
Disclaimer/Publisher’s Note: The statements, opinions and data contained in all publications are solely those of the individual author(s) and contributor(s) and not of MDPI and/or the editor(s). MDPI and/or the editor(s) disclaim responsibility for any injury to people or property resulting from any ideas, methods, instructions or products referred to in the content.

