Article

The Tools and Parameters to Consider in the Design of Power Transformer Cooling Systems

by
Przemyslaw Goscinski
1,
Zbigniew Nadolny
1,*,
Ryszard Nawrowski
2 and
Tomasz Boczar
3
1
Institute of Electric Power Engineering, Faculty of Environmental Engineering and Energy, Poznan University of Technology, 60-965 Poznan, Poland
2
Institute of Electrical Engineering and Electronics, Faculty of Control, Robotics and Electrical Engineering, Poznan University of Technology, 60-965 Poznan, Poland
3
Institute of Electric Power Engineering and Renewable Energy, Faculty of Electrical Engineering Automatic Control and Informatics, Opole University of Technology, 45-758 Opole, Poland
*
Author to whom correspondence should be addressed.
Energies 2023, 16(24), 8000; https://doi.org/10.3390/en16248000
Submission received: 9 November 2023 / Revised: 30 November 2023 / Accepted: 8 December 2023 / Published: 10 December 2023
(This article belongs to the Special Issue Design and Optimization of Power Transformer Diagnostics II)

Abstract

:
Transformers are the most important elements of electric power systems. Many conditions must be met for power transformers to work properly. One of them is a low operating temperature. This condition will be met if the transformer cooling system is properly designed. One of the components of a cooling system is insulating liquid. The heat transfer coefficient α of liquid determines its ability to cool the transformer. The higher its value, the more effectively the liquid transfers heat to the environment. This article describes the influence of the position of the heat source, which is usually in the windings of the transformer, on the coefficient α value of the insulating liquid. The vertical and horizontal positions of the heat source were analyzed. The coefficient α was analyzed at different points of the heat source. The tests were carried out for mineral oil and various esters. Heat transfer coefficient measurements were carried out for various surface heat loads of the heat source. It has been proven that, in the case of a horizontal heat source, the coefficient α has a value several dozen percent higher than in the case of a vertical source. It has been proven that the coefficient α has different values in different places of the heat source. Regardless of the location, the highest value of the coefficient α occurred in the lower part of the heat source.

1. Introduction

1.1. Determination of the Temperature Field in a Transformer

Properly designing a transformer cooling system guarantees its proper operation for many years. To meet this condition, it is necessary to know the temperature distribution in the designed cooling system. There are two main approaches to determining the temperature distribution. One of them is the use of computer simulation. The second is a simple calculation regarding the temperature drops in individual parts of the transformer.
The first solution is a very time-consuming and relatively expensive task. It requires the shapes and dimensions of the transformer elements to be implemented into a computer program. Most often, these are three-dimensional programs. Then, it is necessary to assign values for different thermal properties to the individual components. This process is extremely time-consuming and requires designers with a lot of experience. The next step is the process of calculating the temperature field, which is usually carried out using the finite element method. This process, depending on the capacity of computer, can take up to several weeks. It has been noted that this solution is time-consuming and requires both an expensive computer and expensive software.
The second solution is relatively quick and cheap. It does not require the use of an expensive computer and software. It consists of a simple calculation of the temperature drops in individual transformer elements. Such calculations require the knowledge of the dimensions of individual elements and the values of the thermal properties that are responsible for temperature distribution. In the case of fluids such as mineral oil or air, this property is the heat transfer coefficient α. According to studies in the literature, the value of the mineral oil coefficient α is equal to 100 W·m−2·K−1 [1,2,3,4]. The authors’ research shows that the coefficient α of an insulating liquid can have different values. They depend, among other things, on the type of liquid, as well as the temperature and length of the heat source [5].
One transformer manufacturer asked us for additional information about whether the value of the heat transfer coefficient α of the insulating liquid depends on the position of the heat source (vertical or horizontal). The aim of this study was to compile information on the influence of various factors on the value of the liquid coefficient α. Such information can be used in the design of a cooling system using a method consisting of a simple calculation of the temperature drops in individual parts of the transformer.

1.2. Research Overview

Our main research aim was to measure the heat transfer coefficient α of insulating liquids used in power transformers and to ascertain the influence of the position of the heat source, which is usually in the windings of the transformer, on the coefficient α value of the insulating liquid. Our research also concerned the measurement of the α coefficient at different points of the heat source, such as the top, side/middle, and bottom of the heat source. Measurements were carried out for typical insulating liquids such as mineral oil, natural ester, natural ester with reduced viscosity, and synthetic ester. The measurements of the α coefficient were carried out for different surface heat load values, which should be understood as different temperature values.
It has been proven that a horizontal heat source has better cooling conditions compared to a vertical heat source. It has also been proven that the bottom of the heat source is characterized by better heat dissipation conditions compared to the side/middle of the source or its top part.

1.3. Research Novelty

The novel aspect of this study lies in the fact that we directly measured the heat transfer coefficient α of insulating liquids and established the coefficient’s dependence on the position of the heat source for different types of liquids and different heat load values. The α coefficient best describes the ability of a liquid to dissipate heat. This coefficient is the result of many properties of the liquid, such as its viscosity, specific heat, thermal conductivity, density, and coefficient of thermal expansion. Usually, in articles by other authors, it is possible to find information on how to measure the individual properties mentioned above. On this basis, it is difficult to assess the ability of a liquid to dissipate heat. Measuring the heat transfer coefficient α solves this problem.

2. Fundamentals of Transformer Temperature Distribution

2.1. Heat Sources in the Transformer

The transformer is dominated by two heat sources. The first is the loss in the transformer windings. These losses are often referred to as copper losses or active losses. The second significant source of heat is the transformer core. These losses are also called iron losses or passive losses. Winding losses, according to many studies, account for about 80% of total transformer losses. In contrast, core losses account for about 20% of all losses. Dielectric losses occur in the transformer isolation system. Their value does not exceed 1% of the total losses [6].
Losses in windings are divided into primary and additional. The former are losses in the windings, assuming that direct current flows through them. Additional losses, on the other hand, are the difference between the losses due to the alternating current flow in the windings and the primary losses. Primary losses result from the flow of current through windings of a certain resistance (Joule Lenz losses). On the other hand, the source of additional losses is the eddy currents generated by the scattering stream. Additional losses are emitted firstly in the windings but also in other elements of the transformer, such as the beams and tank [7,8,9,10,11,12,13].
Core losses are mainly related to magnetic losses. These losses occur as a result of the alternating magnetic flux in the core. Their sources are magnetic hysteresis [14,15,16,17] and eddy currents [18,19]. Hysteresis losses are proportional to the surface area of the magnetic hysteresis loop in the transformer core. The narrower the loop, the lower the hysteresis losses. On the other hand, eddy current losses are the result of the initial load on the transformer, the recipient of which is its core of a certain resistance value. Thus, regardless of whether the transformer is loaded or not, these losses will always occur. The losses in the core depend on the thickness and type of sheet metal and on the magnetic induction. These losses are reduced by using thin, isolated sheets and increasing the resistivity of the material from which they are made. An increase in resistivity can be achieved by adding silicon [20,21,22].
The last group of losses are dielectric losses [23,24]. They consist of partial discharge losses and polarization losses. The former depend on the degree of aging of the insulation system. This should be understood primarily as the degree of moisture in the solid insulation, the degree of polymerization of cellulose, and the degree of contamination of the surface of the bushing insulators. Polarization losses, on the other hand, depend on the electric field stress, the dielectric loss coefficient tan(delta), and the electrical permittivity of the insulating materials.

2.2. Transformer Cooling System

The cooling system plays an important role in the proper operation of the transformer. It is usually associated with heat sinks and fans located on the outer surface of tanks. In fact, this arrangement starts at the point where heat is generated, such as in the windings. The cooling system consists of windings (copper and paper insulation), an insulating liquid, a tank, heat sinks, and fans. All of these elements have a significant impact on cooling efficiency.
For a cooling system to be effective, the solid materials of the system, such as copper and paper insulation (windings) and steel (tank), should have a high specific thermal conductivity λ. On the other hand, the insulating liquid should have a high heat transfer coefficient α. Heat sinks, on the other hand, should have a large heat dissipation surface.
The insulating liquid plays an important role in the transformer cooling system. Its heat transfer coefficient α should be as high as possible. The coefficient α is the result of the many properties of a liquid, such as its specific heat, thermal conductivity, density, viscosity, and thermal expansion.

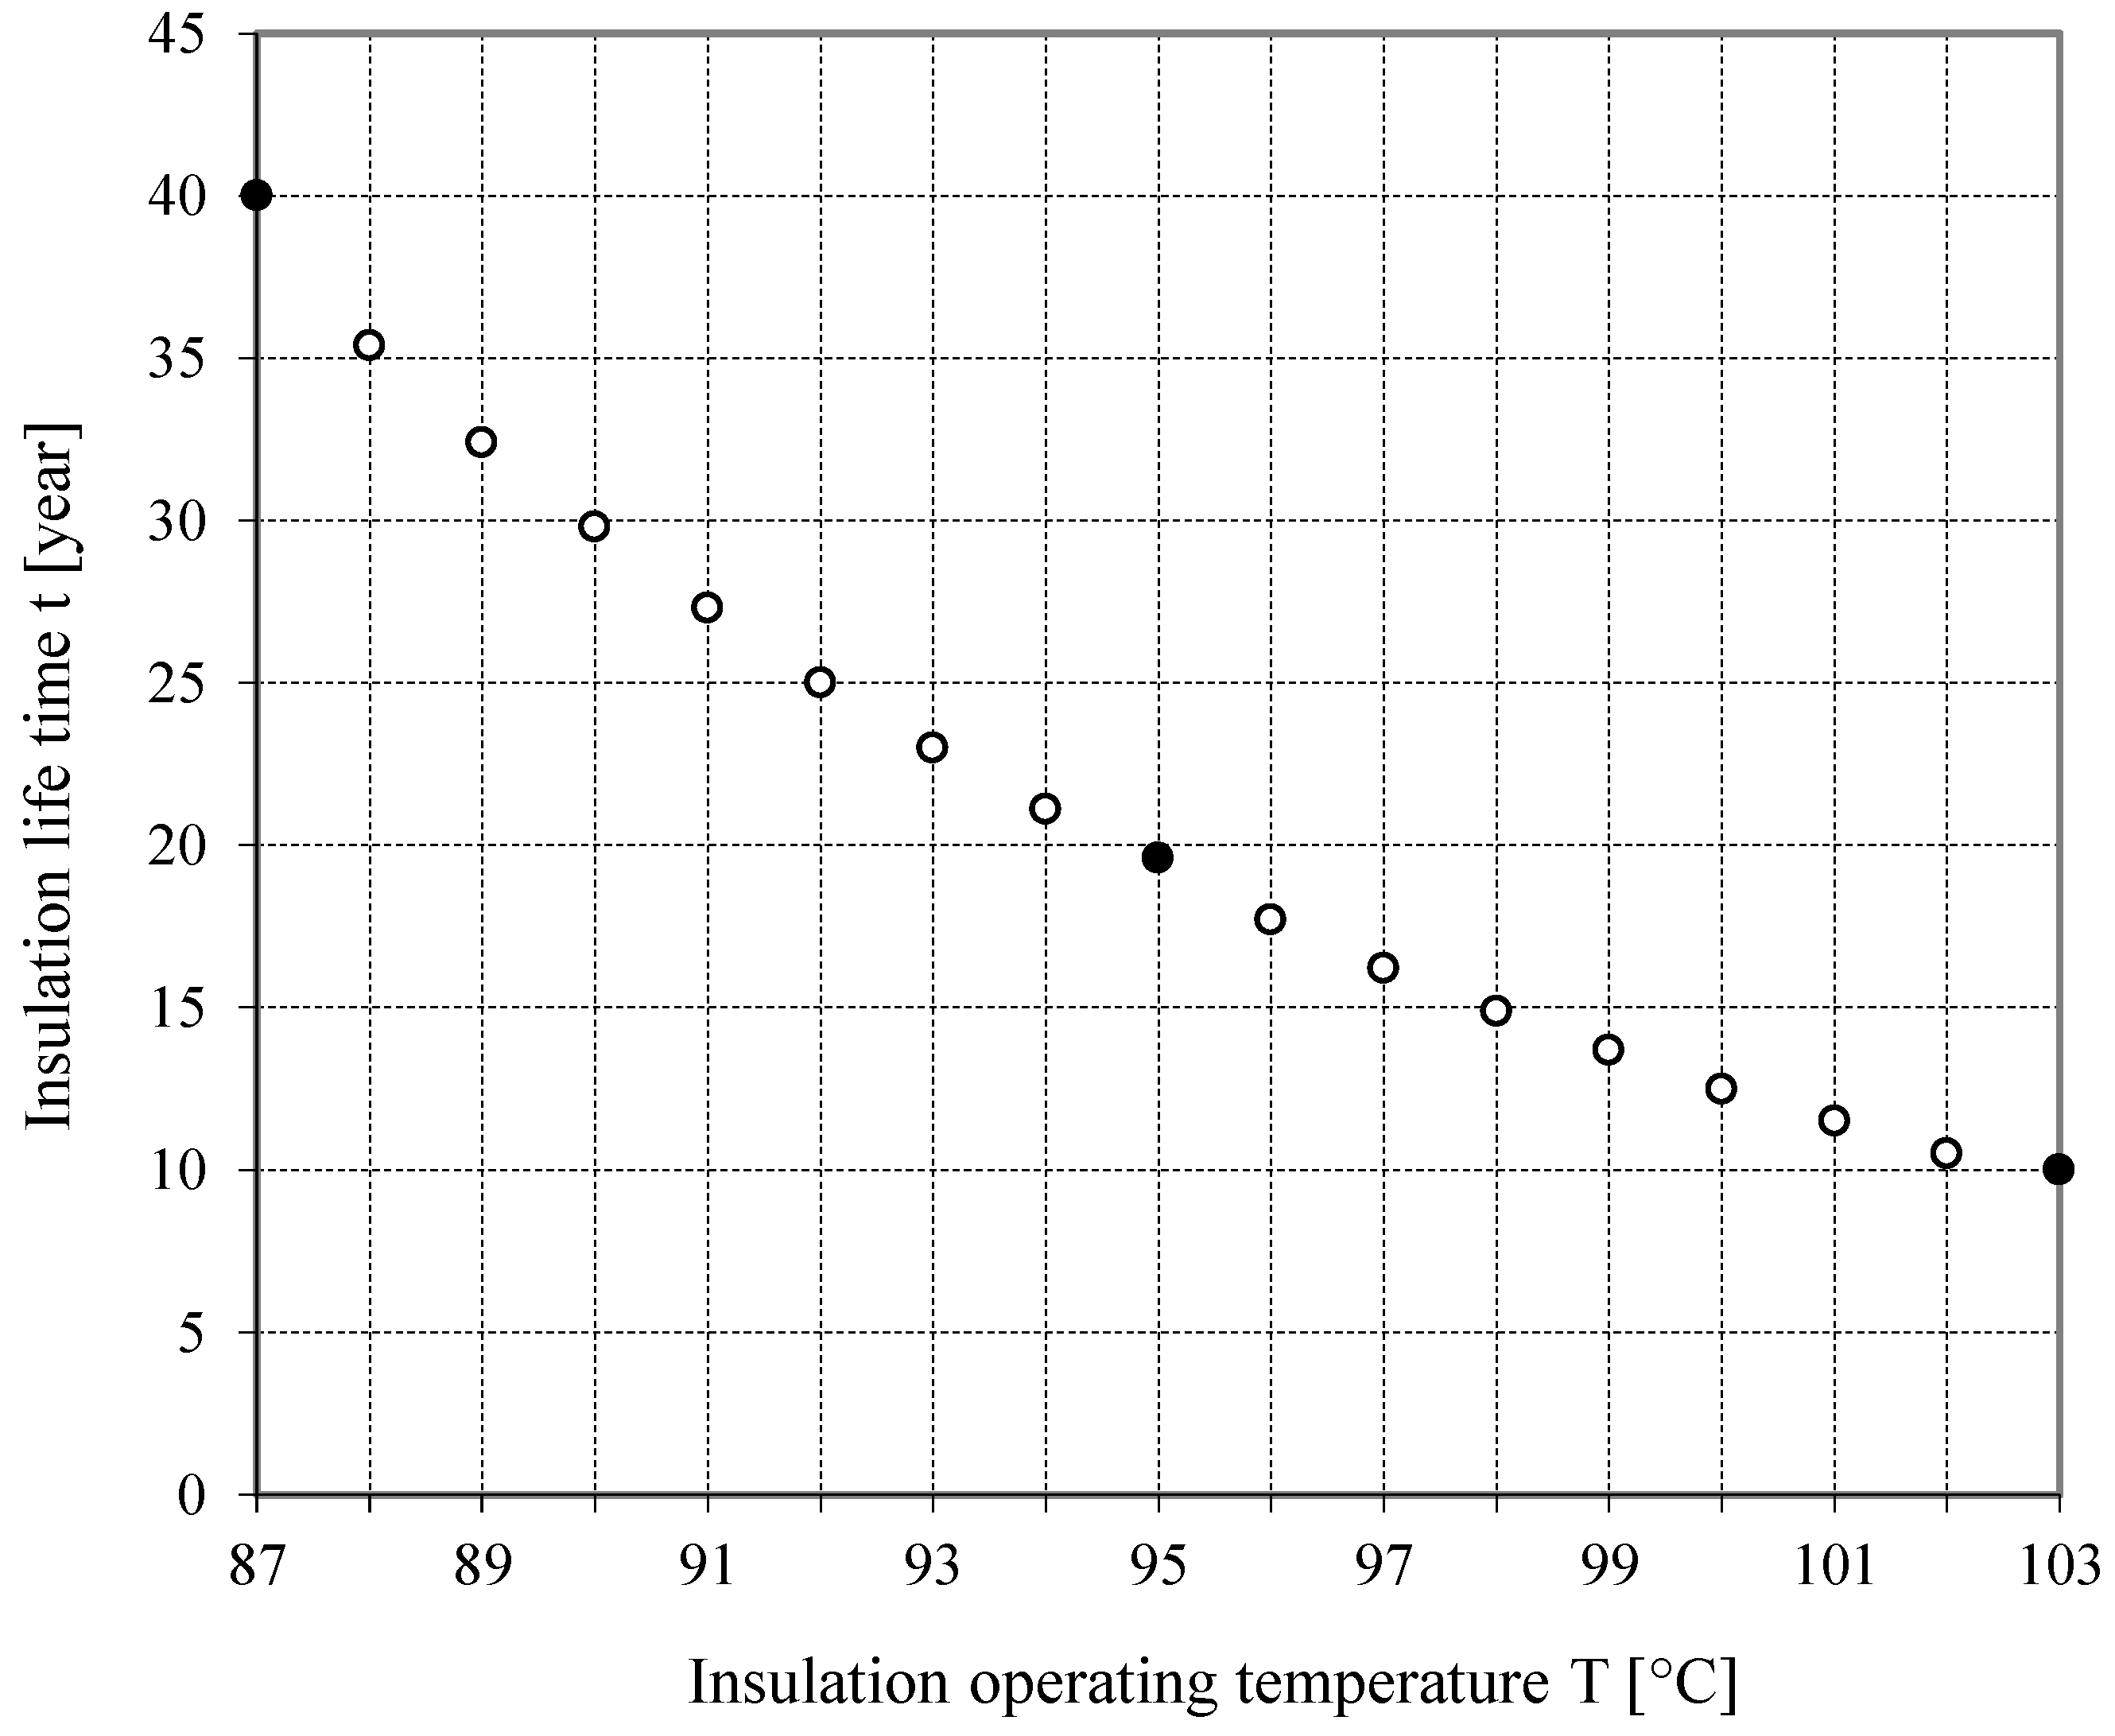
2.3. Effects of Increased Temperature in the Transformer

When analyzing the effects of increased temperature in a transformer, attention should be paid its insulation system. The insulation system is the most temperature-sensitive component of a transformer. For this reason, according to many authors, the lifetime of a transformer is the same as the lifetime of its insulation system [25,26,27].
The lifetime of a transformer is expressed, among other things, by Montsinger’s law, also known as the 8 degree law. The Formula (1) describes this law by expressing the durability of mineral oil-impregnated paper insulation with respect to temperature [1]:
t = 7154 · 10 4 · e 0.0865 · T
where t represents the absolute lifetime of transformer insulation [year]; T represents the insulation operating temperature [°C]. The above law is based on the assumption that at 95 °C, the lifetime of transformer insulation is 20 years. Such a lifetime is adopted by transformer manufacturers. This law describes the lifetime of an insulation system operating at any temperature. The name 8 degrees law means that increasing or decreasing the temperature by 8 °C will result in a two-fold increase in the lifetime of the insulation system, respectively. Figure 1 describes the aforementioned relationship, i.e., the relationship between insulation lifetime and insulation operating temperature. At 95 °C, the insulation lifetime is 20 years. At 8 degrees lower (87 °C), it becomes twice as long, standing at 40 years, and at 8 degrees higher (103 °C), it becomes twice as short as the original value of 20 years (only 10 years). The shortcoming of Montsinger’s law is its failure to take into account other factors that accelerate the aging process of transformer insulation, such as moisture and the influence of oxygen. Similar in thermal terms to Montsinger’s law are the Büssing formula and the Arrhenius–Dankin formula (used in the USA), which is used to assess the effect of temperature on the aging process of insulation made of organic materials [28,29,30,31,32].
Clark narrowed the scope of the 8 degree law to temperatures above 120 °C and formulated, like Kerr, the 5 degree law for temperatures ranging from 75 °C to 100 °C. This law states that a decrease or increase in temperature of 5 °C will result in a doubling or shortening of the life of the insulation, respectively. Some researchers provide other values (e.g., Berthelot—6 °C; Moses—range 8 ÷ 12 °C). A doubling and extending of the insulation lifetime can be caused by temperatures between 5.5 °C and 9.0 °C. For cellulose insulation, a temperature value between 6 °C and 8 °C is used. When the insulation is heavily worn, a lower temperature should be used within the specified range, and if it is new, a higher temperature should be used [1,31].
Shortening the life of the transformer due to increased temperature should be associated with the negative influence of temperature on the properties of the insulation system. The basic properties of this system are electrical strength, electrical resistance, dielectric loss coefficient, and electrical permittivity. Equally important properties are the degree of polymerization of the cellulose (in the case of cellulose paper), the degree of moisture in the paper, and the acid number of the insulating liquid.
Formula (2) states that the electrical strength of insulation decreases as its temperature increases [32]:
W T = W 15 ° C · e 0.003 · T 15
where WT represents the electrical strength of insulation at T [kV], W15°C represents the electrical strength at 15 °C [kV], and T represents the insulation operating temperature [°C].
The decrease in the electrical strength of the insulation is primarily caused by the decrease in its resistance. Formula (3) describes the changes in resistivity as a function of temperature changes [32]:
R T 2 = R T 1 · 2 T 2 T 1 10 ° C
where RT2 represents insulation resistance at T2 [Ω]; RT1 represents insulation resistance at T1 [Ω].
An increase in the temperature of the insulation system causes a rapid increase in its dielectric loss coefficient tan(delta) [1,33,34]. According to Clark, an increase in temperature from 20 °C to 100 °C results in a 50% increase in the tan(delta) ratio for dry paper and a 150% increase for damp paper.
An increase in the temperature of the insulation system causes an increase in its electrical permittivity ε, which, like the dielectric loss coefficient, contributes to the increase in dielectric losses. According to [34], a temperature increase of 10 °C to 100 °C corresponds to an increase in electrical permittivity of about 100%.
The higher temperature of the paper insulation causes the cellulose polymer chains to break. The length of a cellulose chain, called the DP (Degree of Polymerization), of the new insulation is about 1200 ÷ 1300, and the temperature-aged insulation is only 300 ÷ 400 [31,35]. Breaking cellulose chains has many negative consequences. Firstly, the mechanical strength of the paper decreases and it becomes brittle. This is a negative phenomenon because the paper is the insulation system of the windings. Secondly, during the degradation of cellulose, free hydrogen atoms are formed, and these atoms, by reacting with oxygen, contribute to the formation of water and thus to an increase in the moisture content of the insulation system.
The increase in water content in paper, indirectly caused by increased temperature and the presence of oxygen, has many negative consequences for the insulation system, such as a decrease in electrical strength [36], a decrease in resistance [1], an increase in the dielectric loss coefficient (delta) [31,37], an increase in the intensity of partial discharges [38], or an increase in the probability of gas bubbles appearing in the insulating liquid [39,40,41,42].
As reported in [31,43], as the temperature of mineral oil increases, its acid number increases. For example, after 80 days of oxidizing of mineral oil at 80 °C, the acid number was below 0.1 mgKOH·gliquid−1, and after oxidation at 140 °C, the acidity of the oil increased ten-fold. The acidification of the oil can accelerate the process of precipitation. This may result in a decrease in the patency of heat sinks and an increase in the viscosity of the insulating liquid. Both of these phenomena are dangerous for the efficiency of the transformer cooling system.
Increased temperature has many negative effects. These include, first of all, a reduction in the service life of the transformer insulation. This fact should be associated with a decrease in the electrical strength of the insulation, a decrease in the insulation resistance, an increase in the dielectric loss coefficient, and an increase in electrical permittivity. Increased temperature also causes a decrease in the degree of cellulose polymerization, which may result in an increase in the moisture content of the insulation. An increase in temperature also causes an increase in the acidity of the mineral oil.

3. Motivation, Aim, Thesis, and Scope of Research

The main motive for conducting our research was to supplement the knowledge about how the value of the heat transfer coefficient α of the insulating liquid can change depending on the position of the heat source (vertical, horizontal). The obtained research results can be used in the design of transformer cooling systems.
The aim of the study was to determine the heat transfer coefficient α of the insulating liquid for the vertical and horizontal position of the heat source. The authors also determined the values of the liquid coefficient α at different points of the heat source. In the case of the vertical position, these places were the top, middle, and bottom parts of the heat source. On the other hand, in the case of the horizontal position, these places were the top, side, and bottom parts of the heat source.
The authors’ proposed thesis centers upon the position of the heat source in relation to the ground (vertical, horizontal) and whether it has an impact on the heat transfer coefficient α of the insulating liquid. The different positions of the heat source produce different conditions for heat transfer, which, in the case of liquids, is mainly based on the phenomenon of convection. The authors also assume that different places in the heat source (top, middle, and bottom for the vertical position; top, side, and bottom for the horizontal position) are characterized by different heat transfer conditions.
The studies were carried out using liquids such as mineral oil, natural esters, natural esters with reduced viscosity, and synthetic esters. These are the most commonly used insulating liquids. The tests were performed for various heat source surface heat load values (1000, 2000, 3000 W·m−2). These are typical values of heat load used in modern transformers.

4. Materials and Methods

4.1. Insulating Liquids
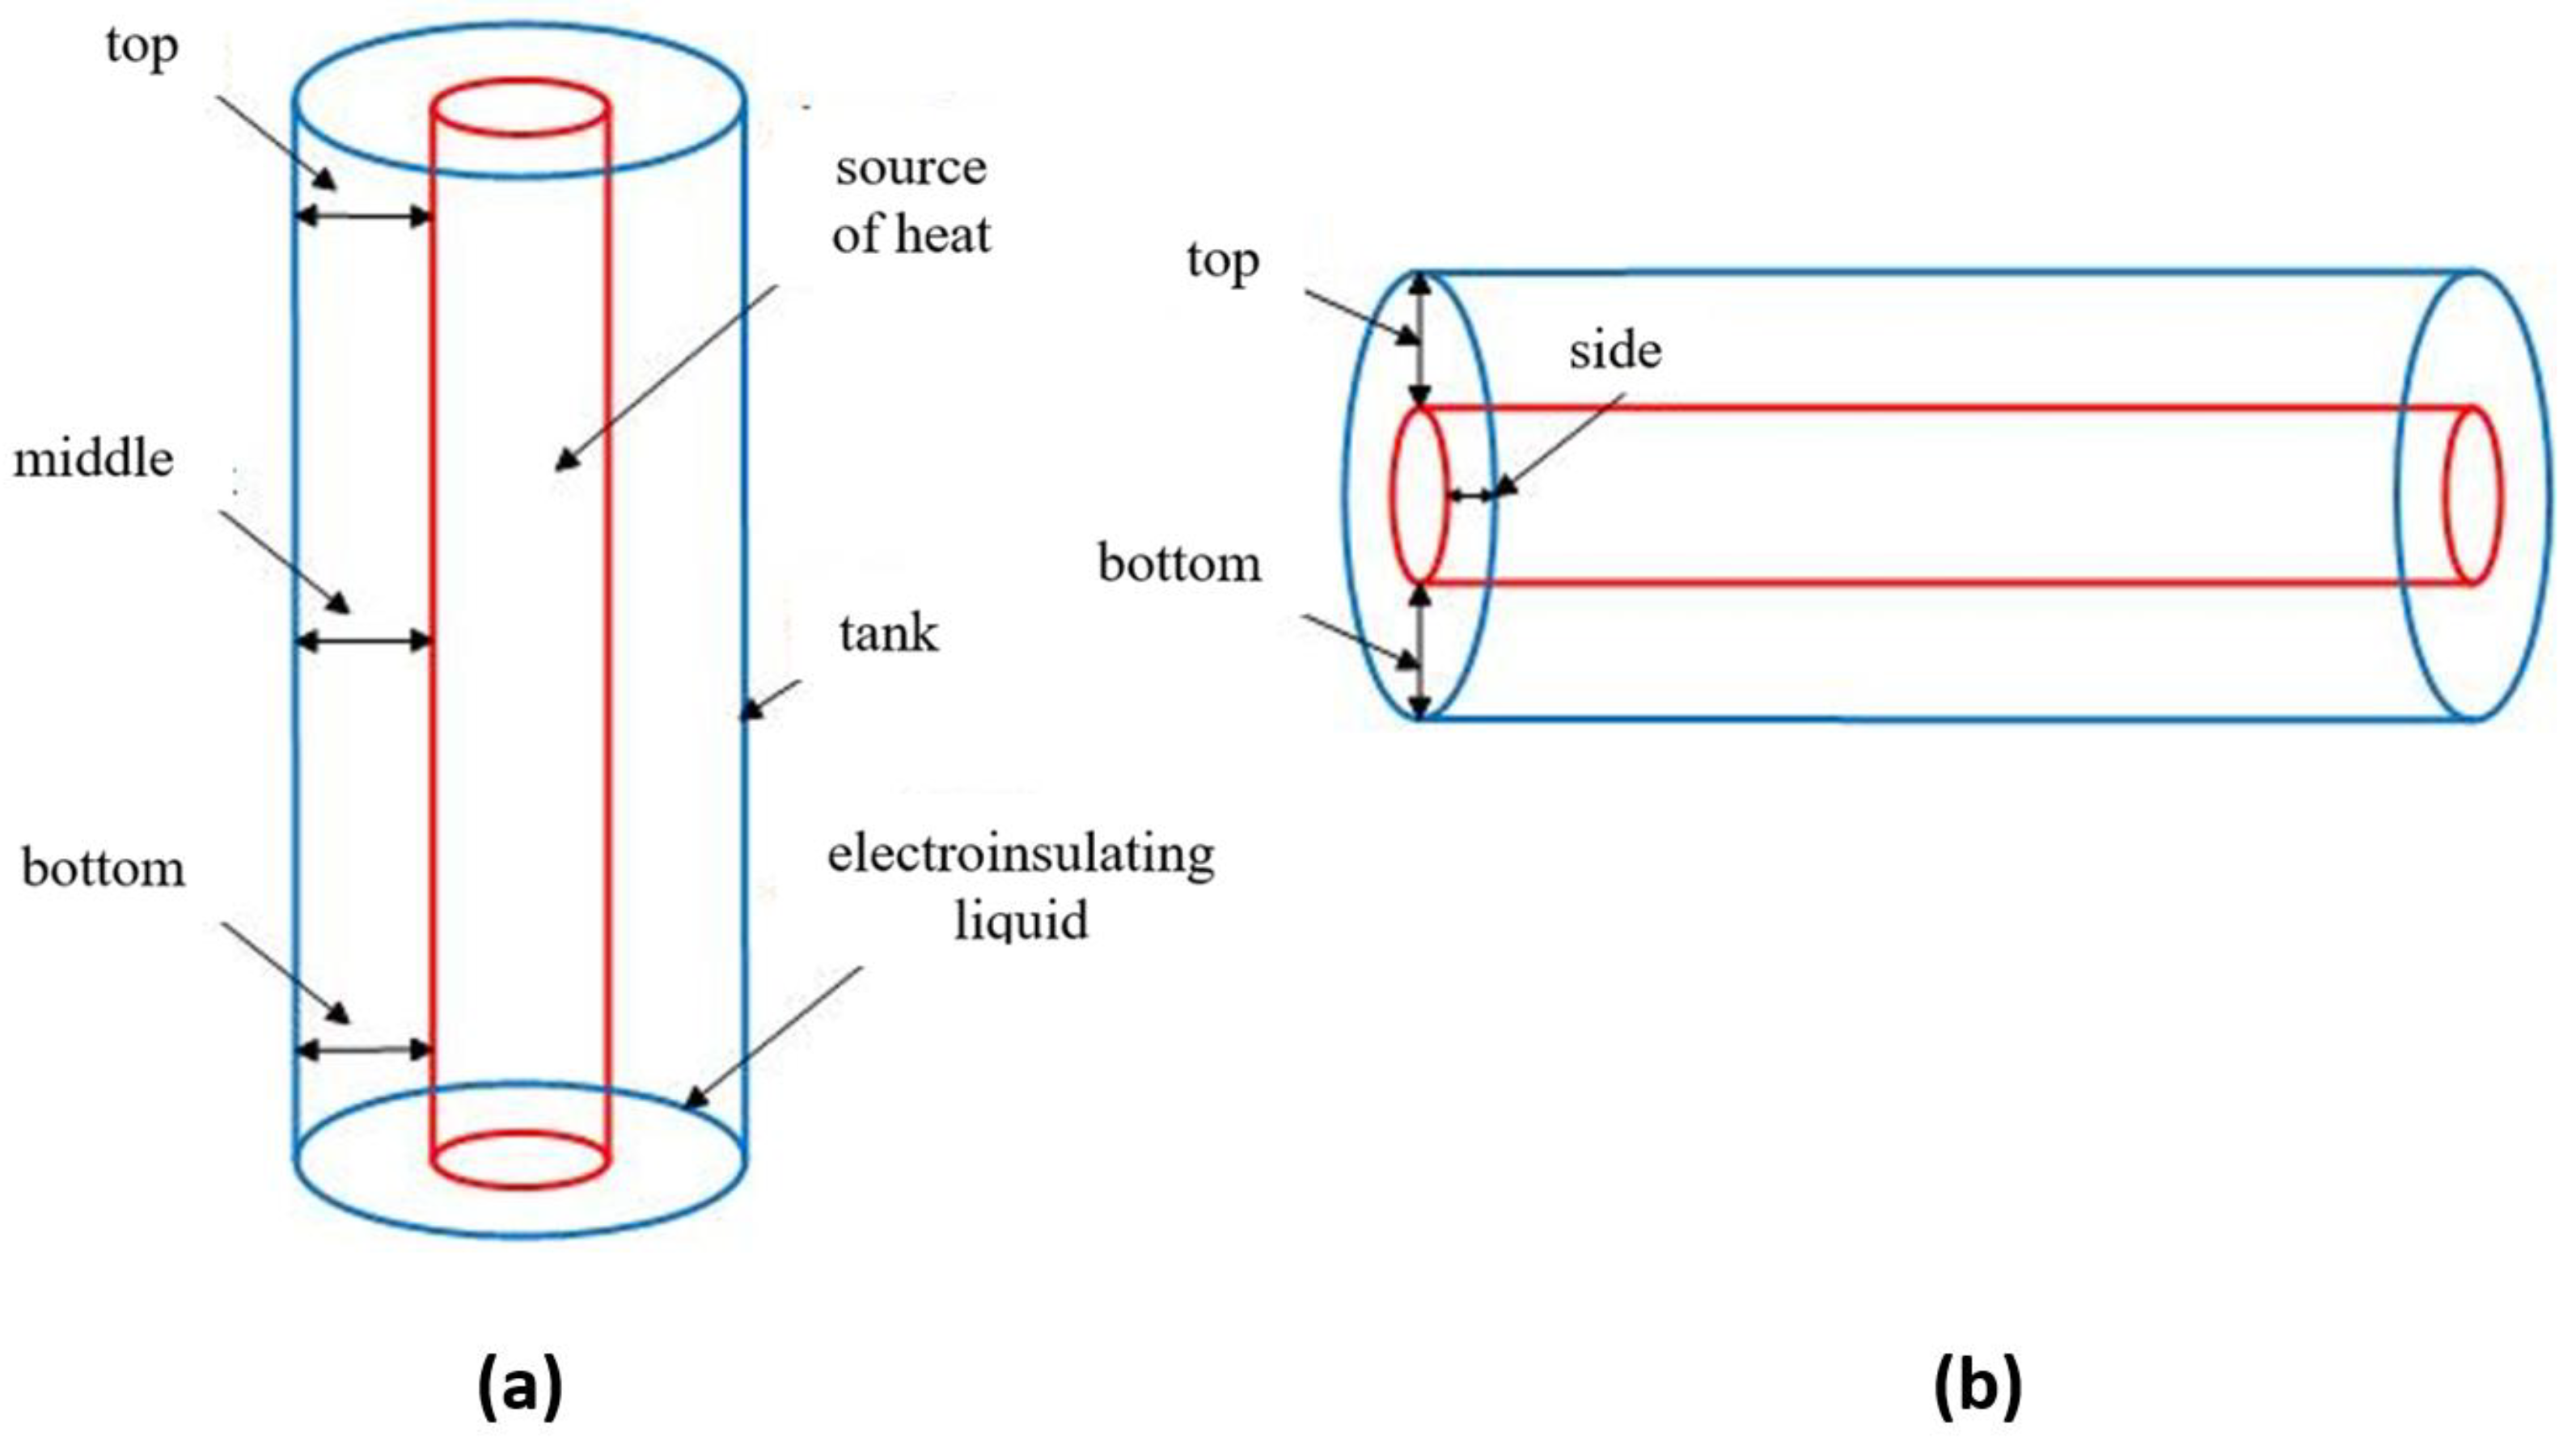
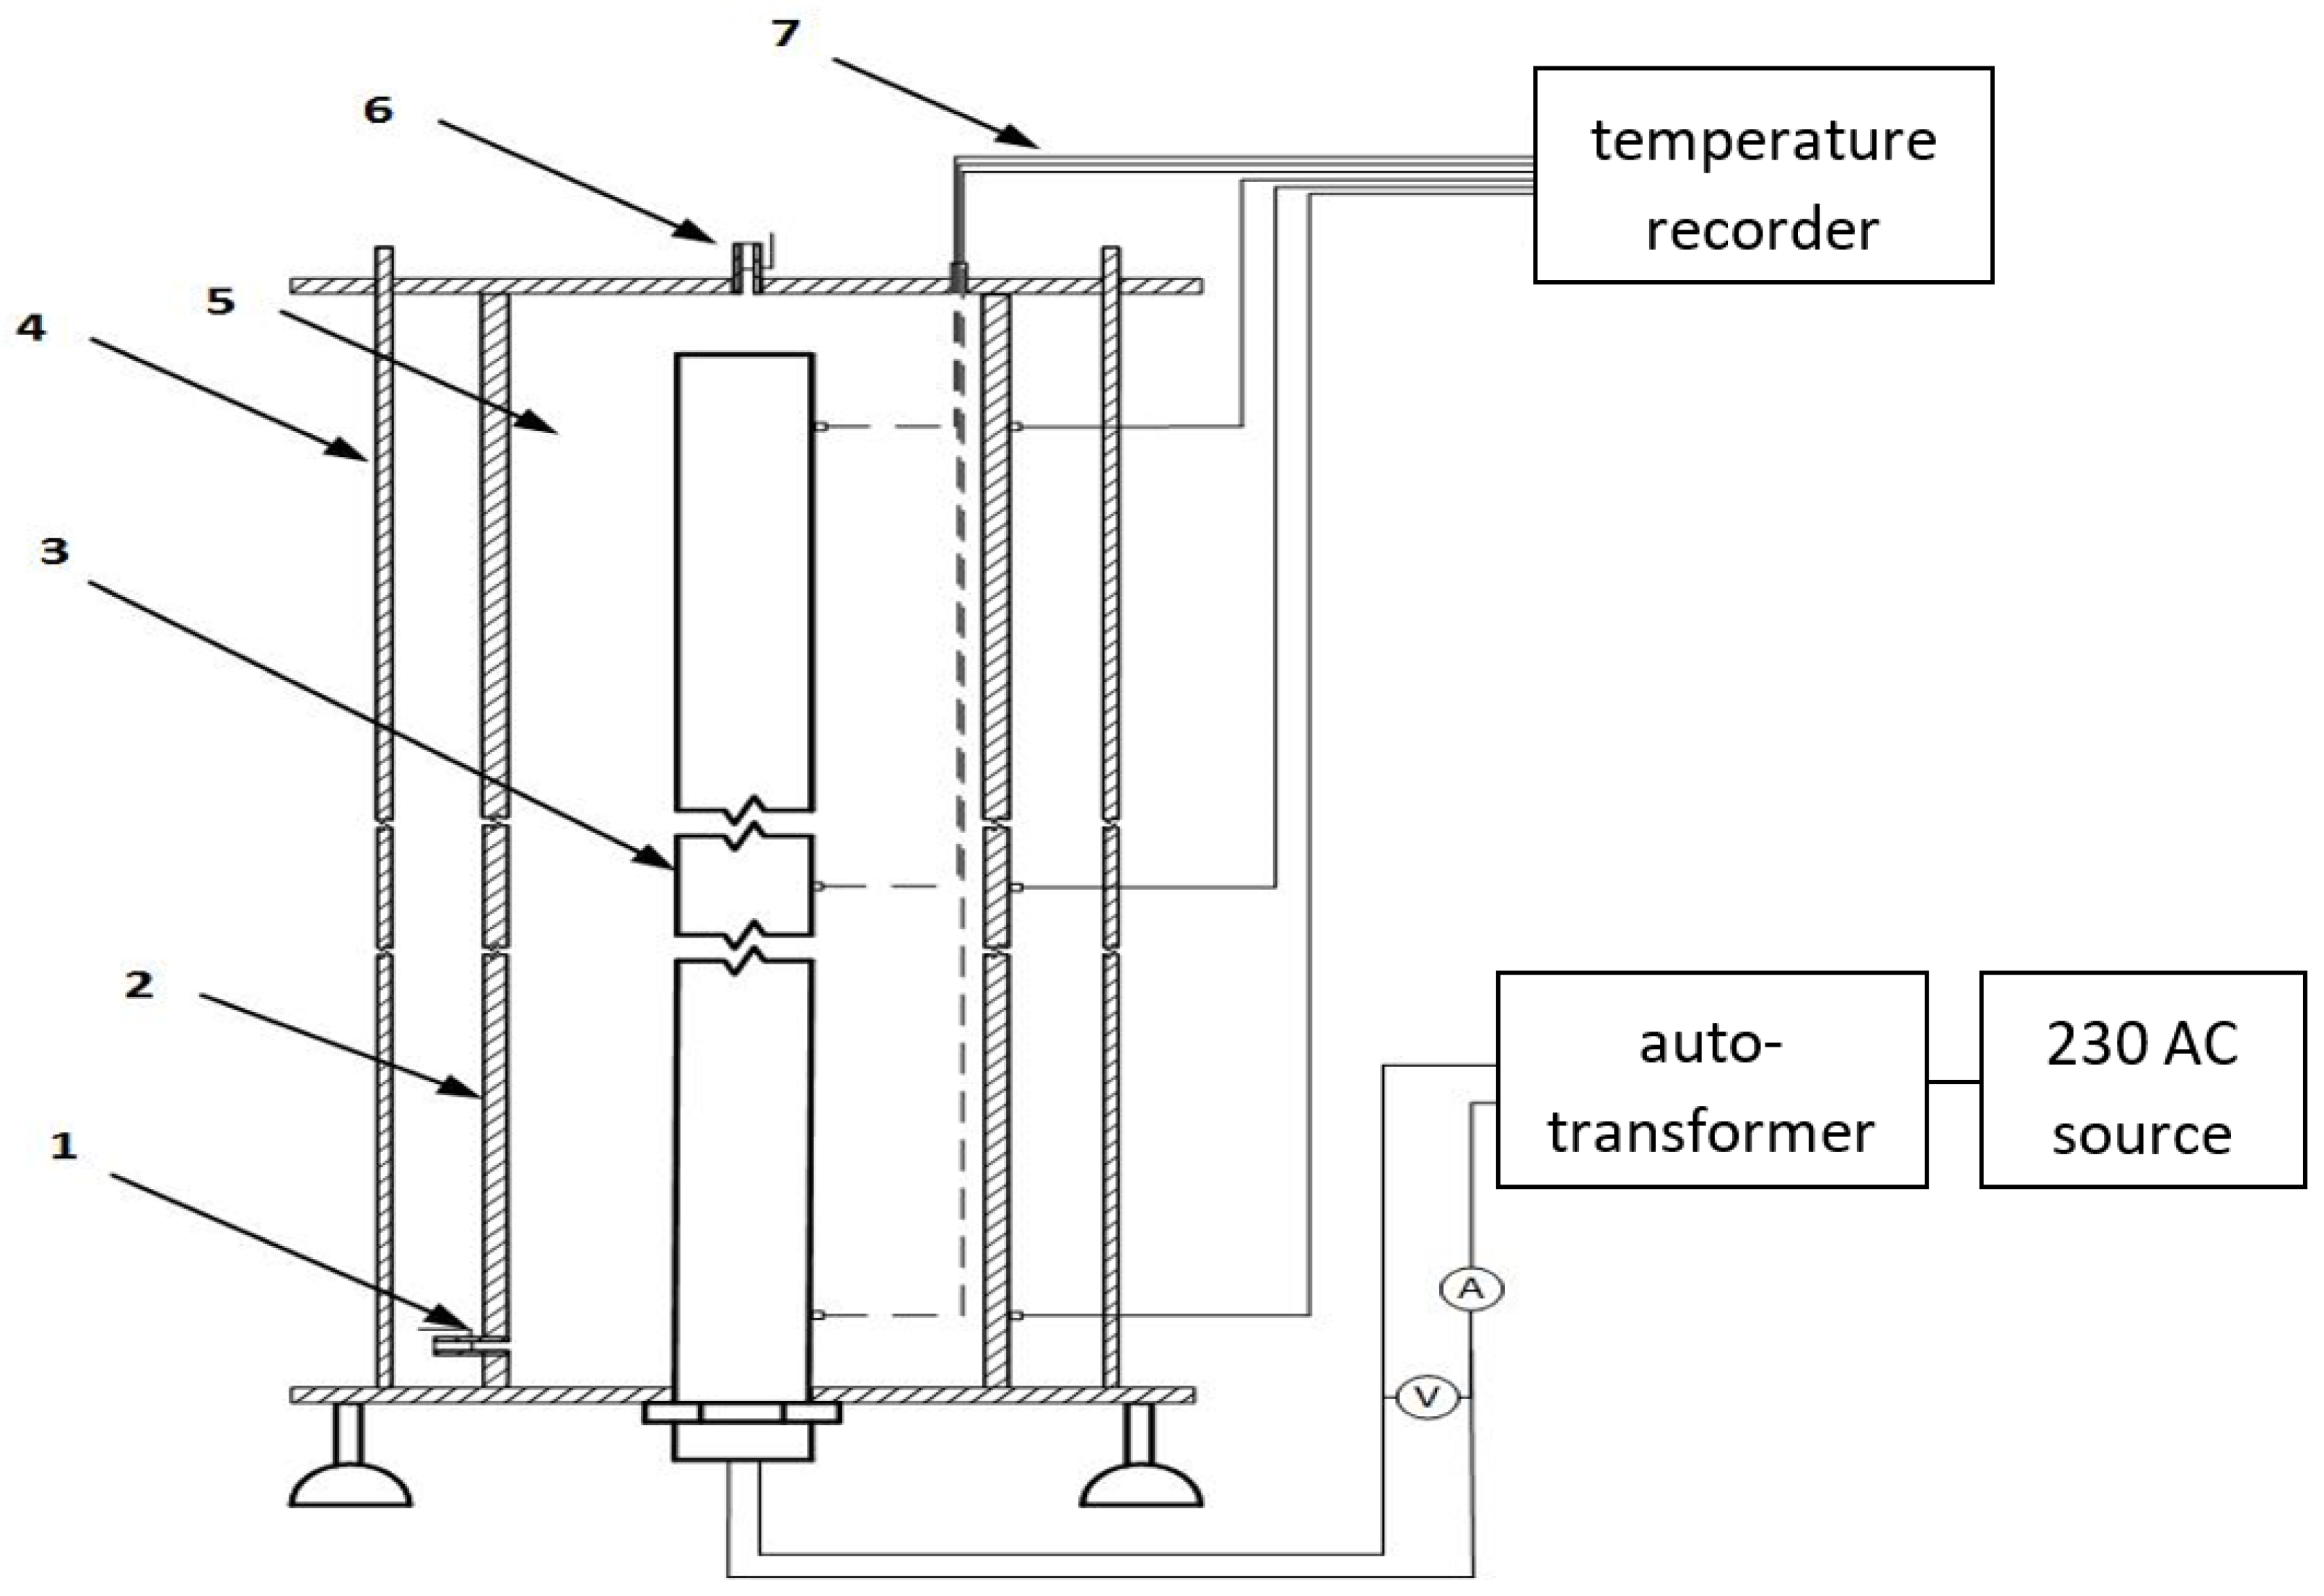
The most commonly used insulating liquids in transformers, namely mineral oil, natural ester, natural ester with reduced viscosity, and synthetic ester, were the investigated materials. It is not the intention of the authors to promote or act to the detriment of companies producing insulating liquids. For this reason, the article does not include commercial data regarding the tested liquids. Table 1 presents basic data regarding the analyzed liquids in terms of their electrical and thermal properties.
By analyzing the electrical properties, it can be concluded that all the analyzed liquids have similar breakdown voltages. Regarding electrical resistivity, mineral oil proved to be the most advantageous liquid. In terms of dielectric loss rate, the synthetic ester is the best liquid. On the other hand, when analyzing electrical permittivity, the natural ester and the synthetic ester had the highest and most favorable value. This means that the high permittivity of the esters will displace the electric field stress from the liquid to the paper insulation. This is advantageous because the insulating liquid has a lower electrical strength than paper. Summarizing the most important electrical properties, it is not possible to clearly indicate the most advantageous liquid.
When analyzing thermal properties, it should be noticed that the key thermal feature of a liquid is the heat transfer coefficient α. The higher the value, the more effectively the liquid cools. Formula (4) describes the relationship between coefficient α and temperature difference ΔT [2]:
α = q Δ T
where α represents the heat transfer coefficient [W·m−2·K−1], q represents the surface heat load [W·m−2], and ΔT represents the temperature difference [K] between the heat source and the cooling surface (transformer tank). After transforming Formula (4), it is possible to obtain the following:
Δ T = q α
As you can see, the higher the value of the coefficient α, the lower the value of ΔT (i.e., the lower the value of the temperature of the heat source).
The heat transfer coefficient α is the result of many properties, such as specific heat cp, thermal conductivity λ, viscosity ν, density ρ, and thermal expansion β, all of which are considered in Formula (6) [2]:
α = c · λ 1 n · g n · δ 3 n 1 · β n · Δ T n · ρ n · c p n · ν n
where c and n are geometric constants depending on the product of Grashof and Prandtl numbers, and g is the gravity [m·s−2]. Based on Formula (4), it can be concluded that as the thermal conductivity λ, density ρ, coefficient of thermal expansion β and specific heat cp increase, and viscosity ν decrease, the heat transfer coefficient α of the liquid should increase. Regarding specific heat, the natural ester is the most advantageous liquid. On the other hand, in terms of thermal conductivity, the natural ester with reduced viscosity turned out to be the most effective liquid. In terms of viscosity, mineral oil is the most advantageous liquid. On the other hand, in terms of density, the synthetic ester is the best liquid. The coefficient of thermal expansion of all the analyzed liquids was the same. It turns out that the key thermal property that had the greatest impact on the heat transfer coefficient α was the viscosity of the liquid. The viscosity of mineral oil is several times lower than that of the other liquids. For this reason, mineral oil has the highest heat transfer coefficient and thus cools the transformer most efficiently.

4.2. Methods

In this subsection, the authors’ system for determining the heat transfer coefficient α for the insulating liquids will be presented and described. Firstly, the concept behind measuring the heat transfer coefficient α in our research will be described. Next, the principle of operation of the measuring system and its construction will be discussed. This type of system has been described in detail in previous works. This subsection also presents the results derived from measuring of the coefficient α when using different types of liquids, heat loads, and heating element lengths. For this reason, in this article, the authors briefly describe the measurement system.
The idea behind measuring the heat transfer coefficient α was to create a thermal disturbance and record this disturbance over time. The measurement of the coefficient α consisted of heating the liquid in the tank by using the heat source and recording temperature changes over time, both on the surface of the heat source and on the outer surface of the tank.
The measurement system one uses should introduce a thermal disturbance and allow for its recording. In this study, the disturbance was caused by an electric current. It was assumed that the produced power Q would be transferred to the liquid and then to the walls of the tank, where the liquid and the heat source were located. The elements of the measurement system were selected in such a way so as to enable the measurement of the coefficient α on the basis of an extended version of Formula (4). Substituting into (4), the formula for the surface heat load q is as follows:
q = Q S
where Q represents power [W], and S represents the surface area of the heating element [m2], and the formula for the temperature difference ΔT is as follows:
Δ T = T h T t
where ΔT represents the difference between the heat source and the tank [K], Th represents the temperature on the surface of the heat source [K], and Tt represents the temperature on the surface of the tank [K]. We obtained the following formula:
α = Q S · ( T h T t )
By substituting the product of current I and voltage U in place of Q, we obtained the final Formula (10), which allowed to determine the heat transfer coefficient α:
α = U · I S · ( T h T t )
where U represents the voltage [V], and I represents the current [A].
Figure 2 shows a scheme of the measurement system for determining the coefficient α when the heat source is positioned vertically (Figure 2a) and horizontally (Figure 2b). The figure shows the places where the coefficient α is measured. For the vertical system, these were top, middle, and bottom parts of the heat source, and for the horizontal system, they were the top, side, and bottom parts of the heat source.
Figure 3 shows a diagram of the laboratory layout used in the tests. Inside the steel pipe (number 2), which served as a tank, there was a heating element (number 3). The used pipe had a diameter of 88.9 mm, a wall thickness of 3.2 mm, and a height of 1.7 m. A 1.6 m long heater was used. This length of the heater approximately corresponds to the winding height of the designed power transformers. Then, the remaining dimensions had to be selected so that the heater could be safely set to the heat load q. This condition was fulfilled by a heater with a diameter of 22 mm and a resistance of 36 Ω.
The space between the heater and the tank was filled with insulating liquid. The following new electrical insulating liquids were used in the study: mineral oil, natural ester, synthetic ester, and natural ester with reduced viscosity.
In order to protect the measuring system against liquid leaks and increasing pressure from inside the tank, valve number 6 was used. This valve also had another function. When the tested insulating liquid was changed to another one, it was used to pour another test liquid. On the other hand, valve number 1 was used to pour out the test liquid.
The autotransformer made it possible to set the voltage U and the current I and thus the heat output Q. The power produced a heat flux that introduced a thermal disturbance. This stream caused the convection movement of the insulating liquid. As a result, a drop in temperature was produced in the way of the heater and the outer surface of the tank ΔT. The final measurement of the heater power Q and the temperature drop ΔT was made in a steady state. This condition was observed after about 6 h.
The temperature was measured using Pt-1000 sensors. The method for their installation is shown in Figure 3. The measuring range of the sensors ranged from −50 °C to 200 °C. Six sensors were used in the study. Three measuring sensors were installed on the surface of the heater, specifically on its top, middle, and bottom parts; the other three were mounted on the outer surface of the tank, also on its top, middle, and bottom parts.

5. Measurement Results

5.1. Results of the Heat Transfer Coefficient α Measurements

Table 2 presents the measurements of the heat transfer coefficient α for when the heat source was in a vertical position relative to the ground. Measurements were taken at various locations, such as the top, middle, and bottom parts of the heat source, as shown in Figure 2a. The measurements of coefficient α were performed for different liquids, namely mineral oil, natural ester, reduced-viscosity natural ester, and synthetic ester. The measurements of the heat transfer coefficient were carried out for different values of surface heat load q (1000, 2000, and 3000 W·m−2). The length of the heat source was 800 mm.
Table 3, as in Table 2, presents the results of the measurements of the heat transfer coefficient α for when the heat source was in a horizontal position relative to the ground. These measurements were taken at various locations, such as the top, side, and bottom of the heat source, as shown in Figure 2b. The types of insulating liquid, the surface heat load q, and the length of the heat source were the same as for the measurements of the coefficient α in Table 2.
Each measurement of the coefficient α, the average values of which are listed in Table 2 and Table 3, was repeated five times.

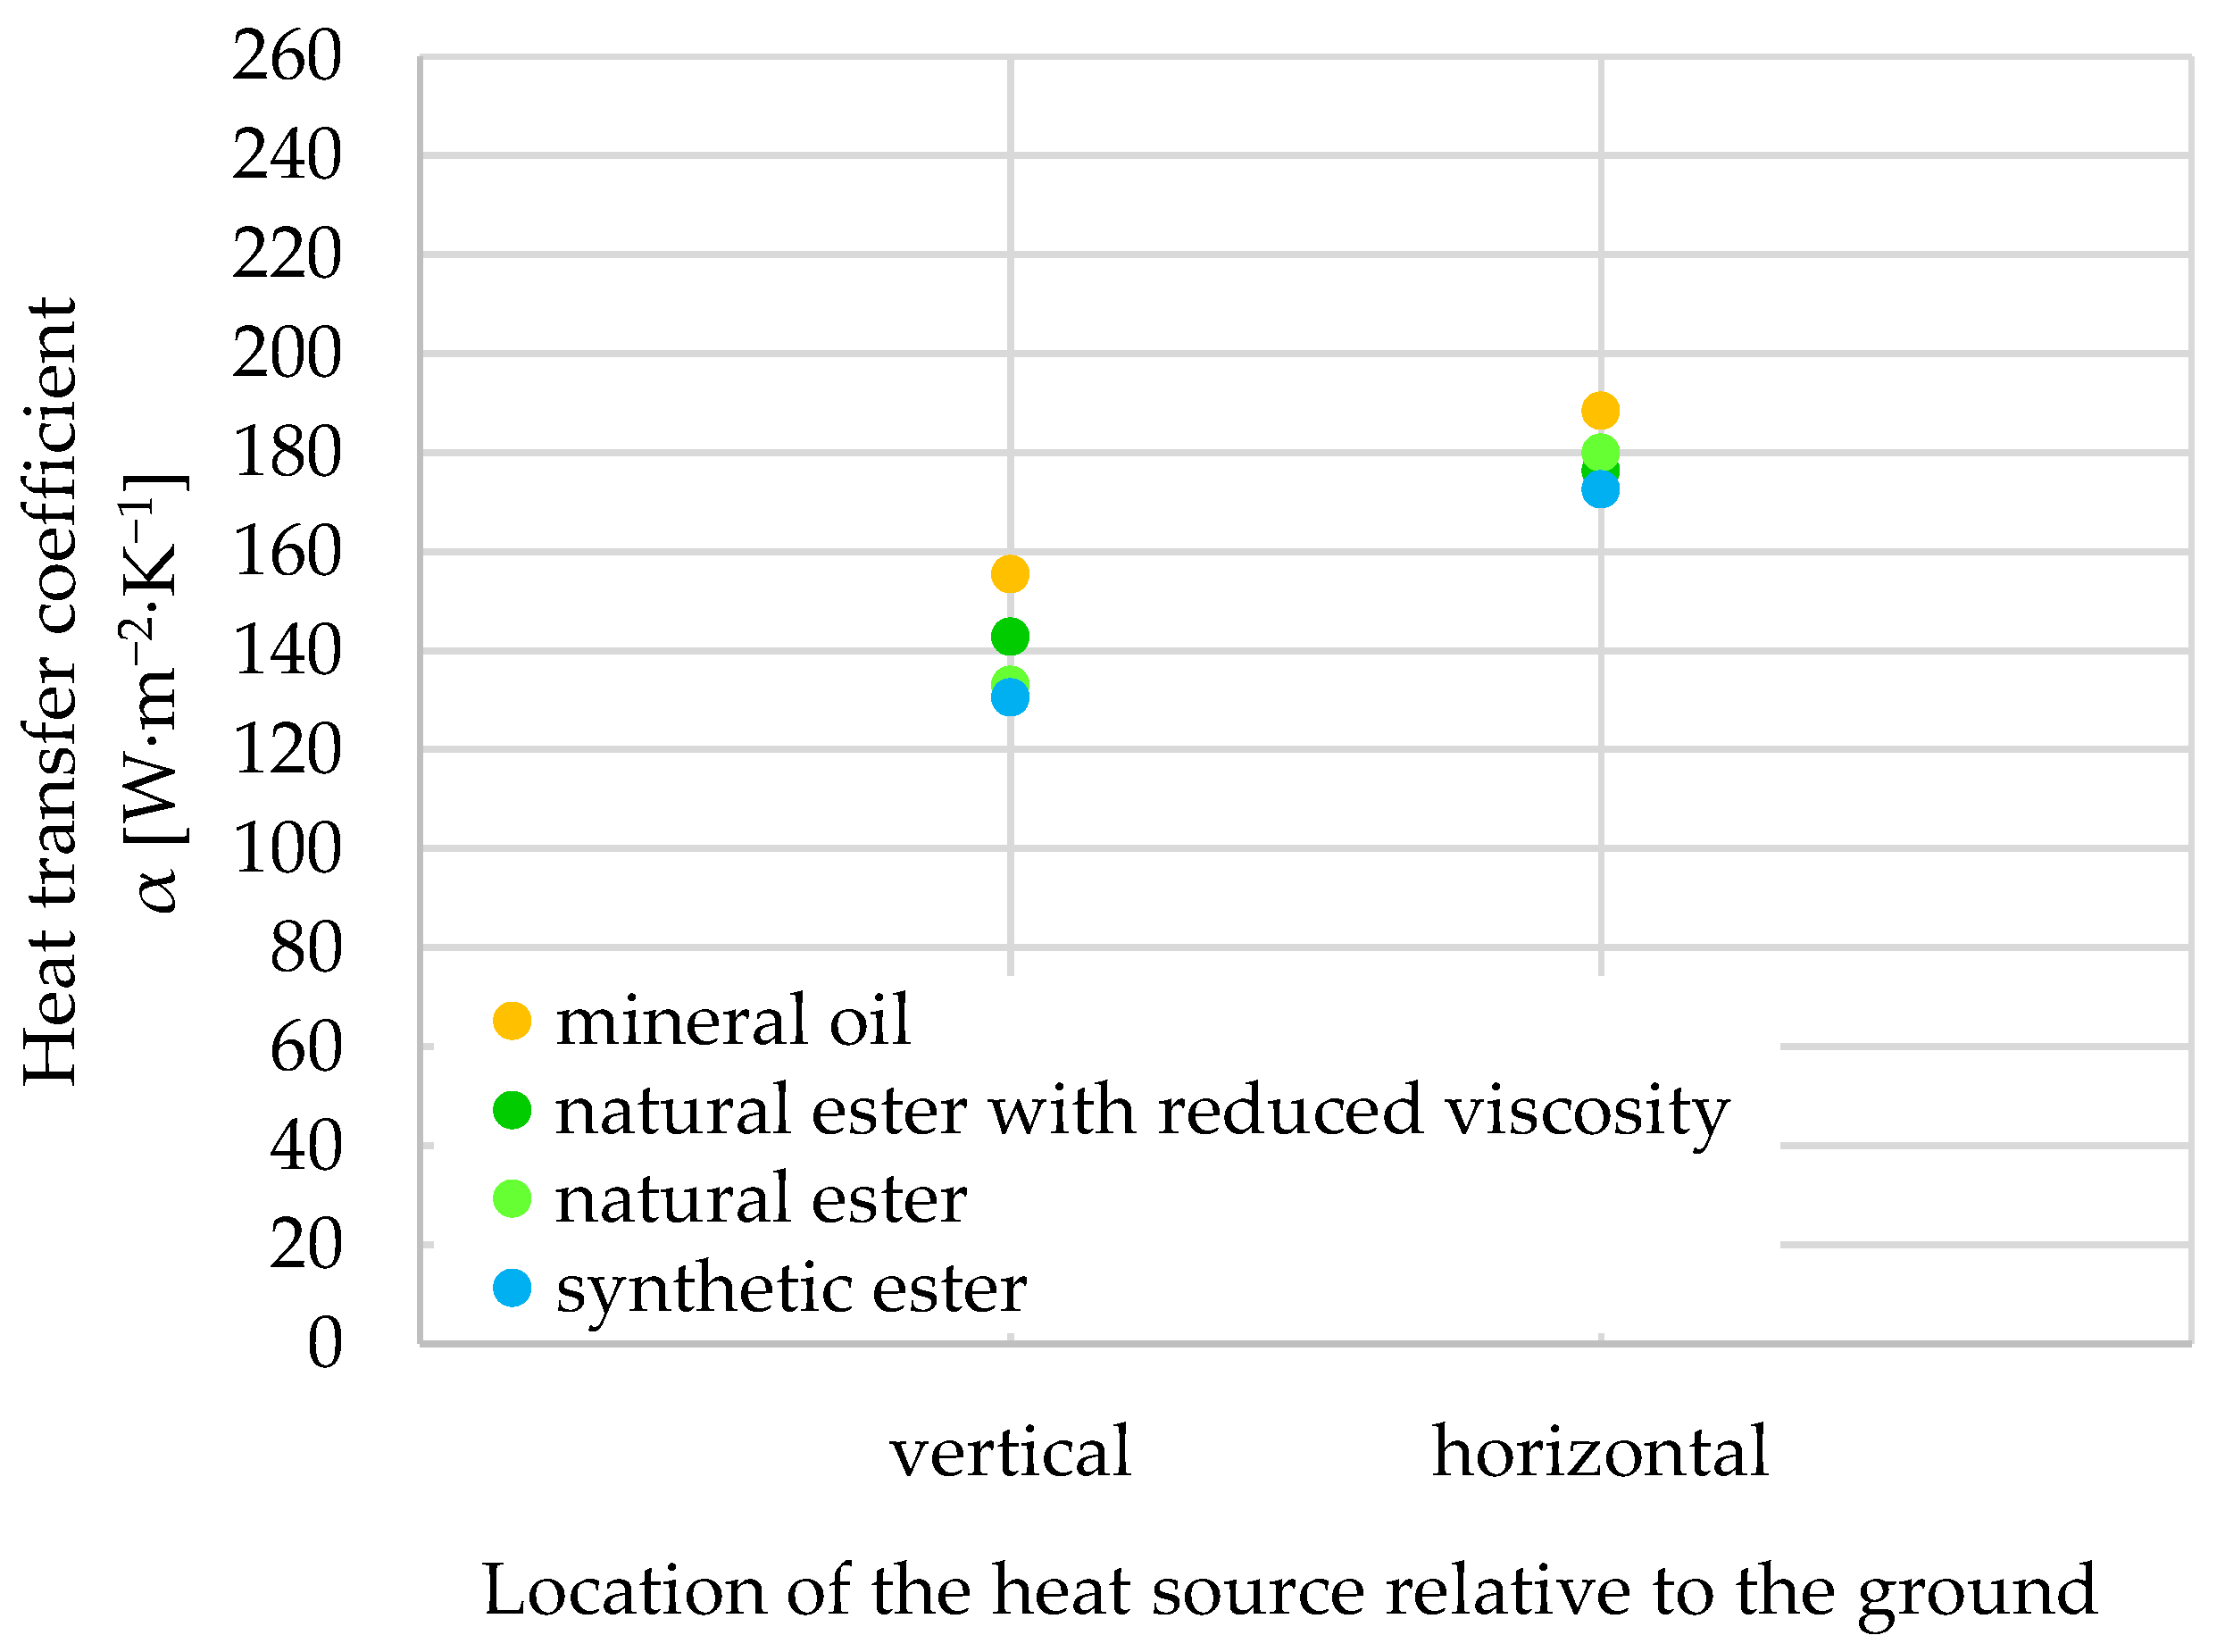
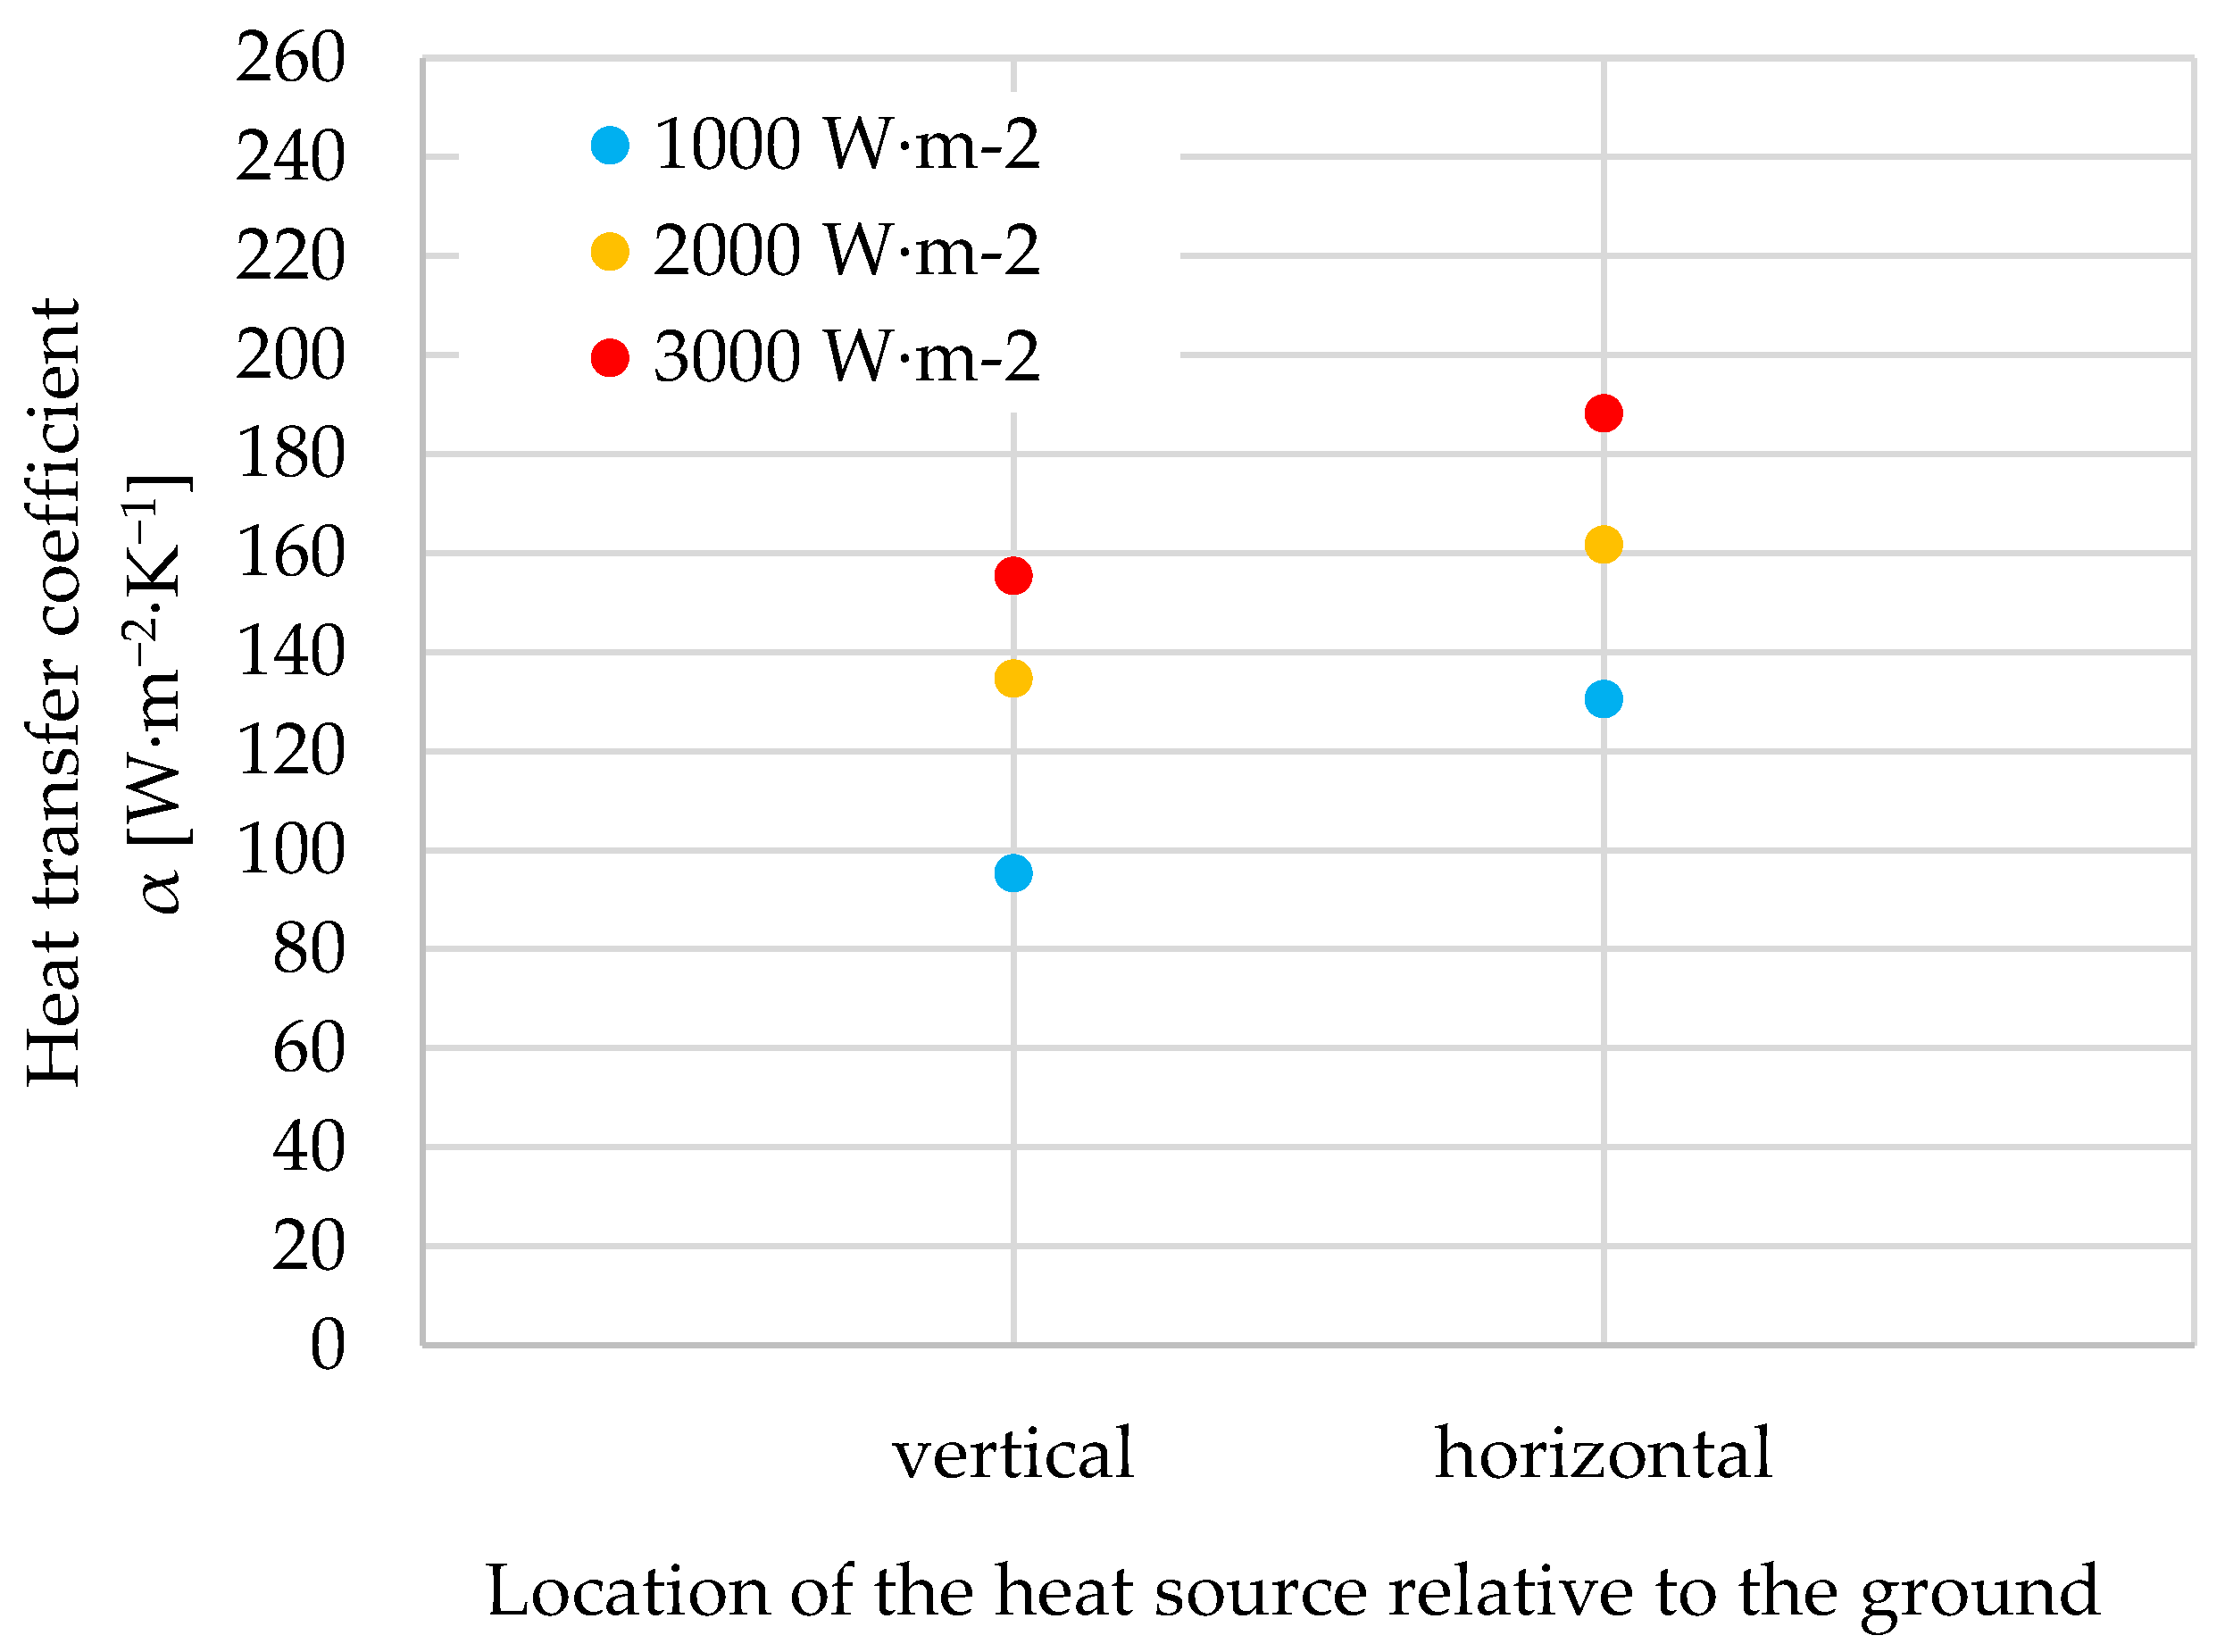
5.2. Heat Transfer Coefficient α for Vertically and Horizontally Positioned Heat Sources

Figure 4, based on the data from Table 2 and Table 3, shows the results of measurements of the heat transfer coefficient α for each heat source position (vertical and horizontal) and for the different insulating liquids. The surface heat load was equal to 3000 W·m−2. As can be seen, the coefficient α of the insulating liquid always had higher values when the heat source was in a horizontal position compared to when it was in a vertical position. The difference is about 30%. This was true regardless of the type of insulating liquid used.
Figure 5, as in Figure 4, shows the heat transfer coefficient α for each heat source position (vertical and horizontal) and for different surface heat load q values. Measurements of the coefficient α were carried out for mineral oil. As in the previous case, the coefficient α values for the horizontal heat source were about 30% higher compared to the vertical source. This was true regardless of the value of the surface heat load q.
In order to explain the differences in the heat transfer coefficient α for the vertical and horizontal position of the heat source, it is necessary to analyze the path along which the liquid is heated. For the horizontal position, the insulating liquid heats up over a relatively short path, equal to half the circumference of the heat source. The liquid is then cooled on the outer surface. The length of this path is equal to about 30 mm, assuming that the radius of the heat source (electric heater) is equal to 11 mm. In the case of the vertical position, the length of the path along which the liquid heats up is much longer, equal to the length of the heat source (800 mm). This means that heat transfer is less effective for the vertical position than for the horizontal position.

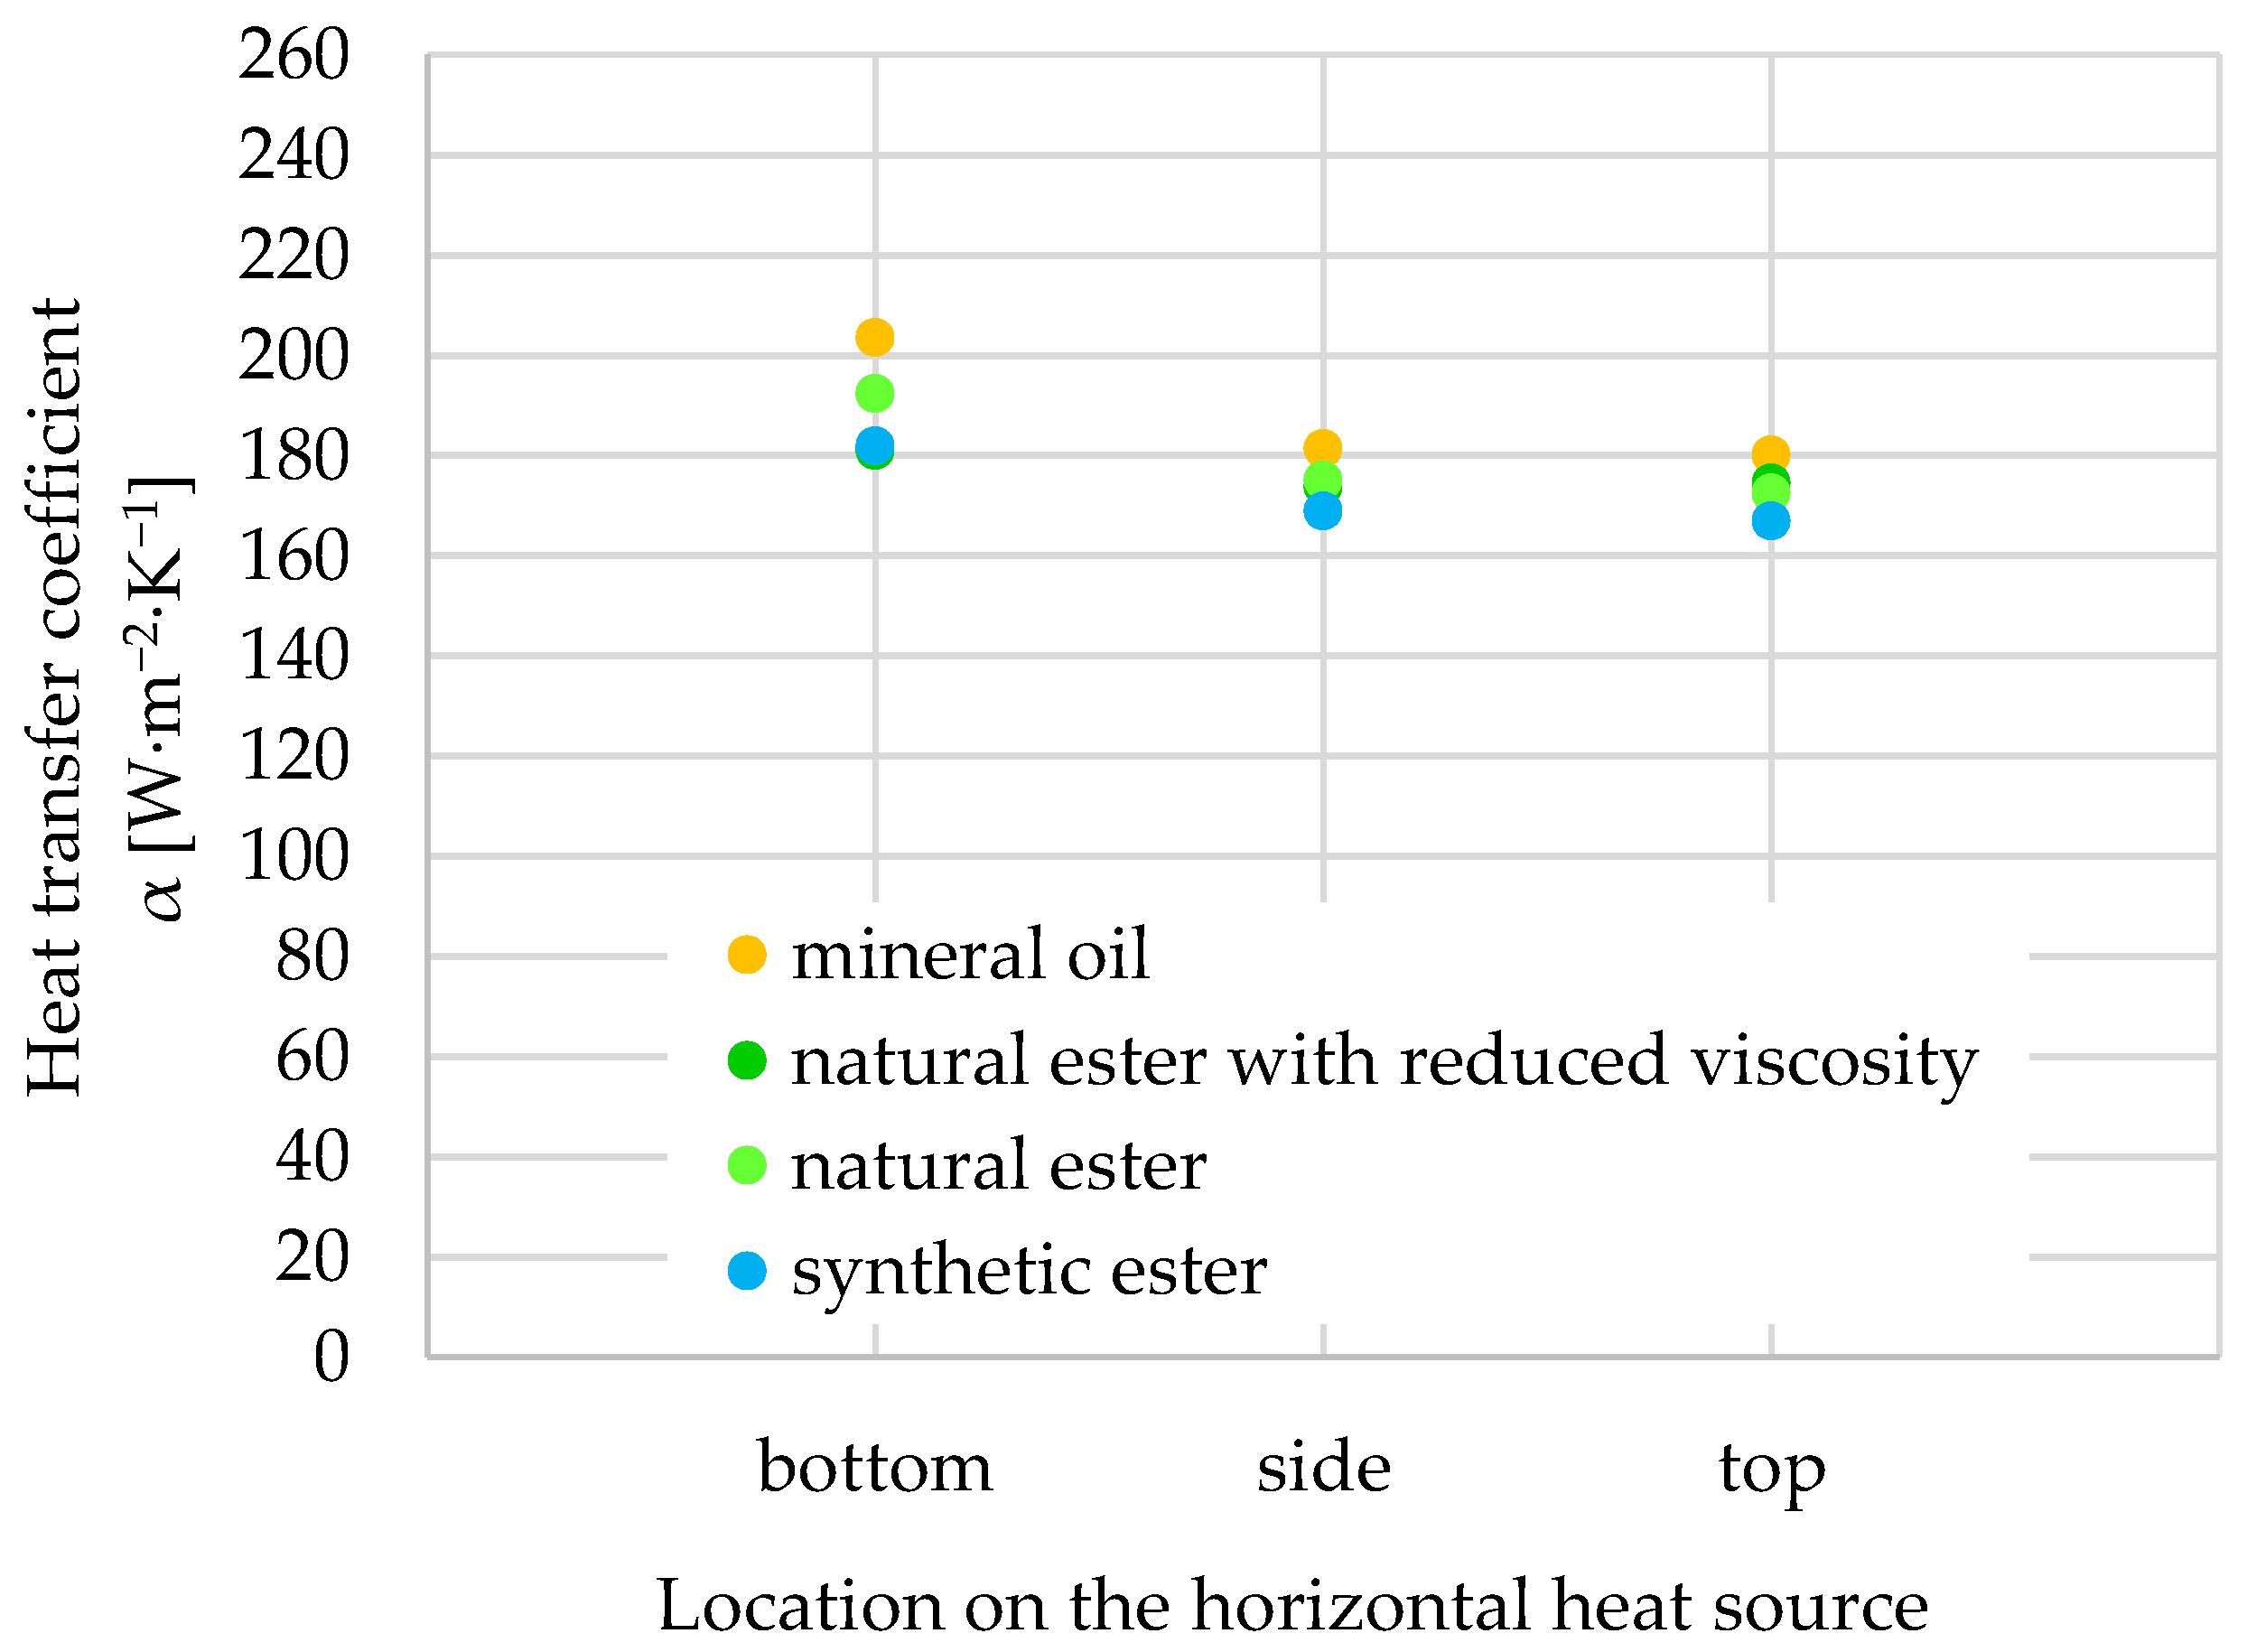
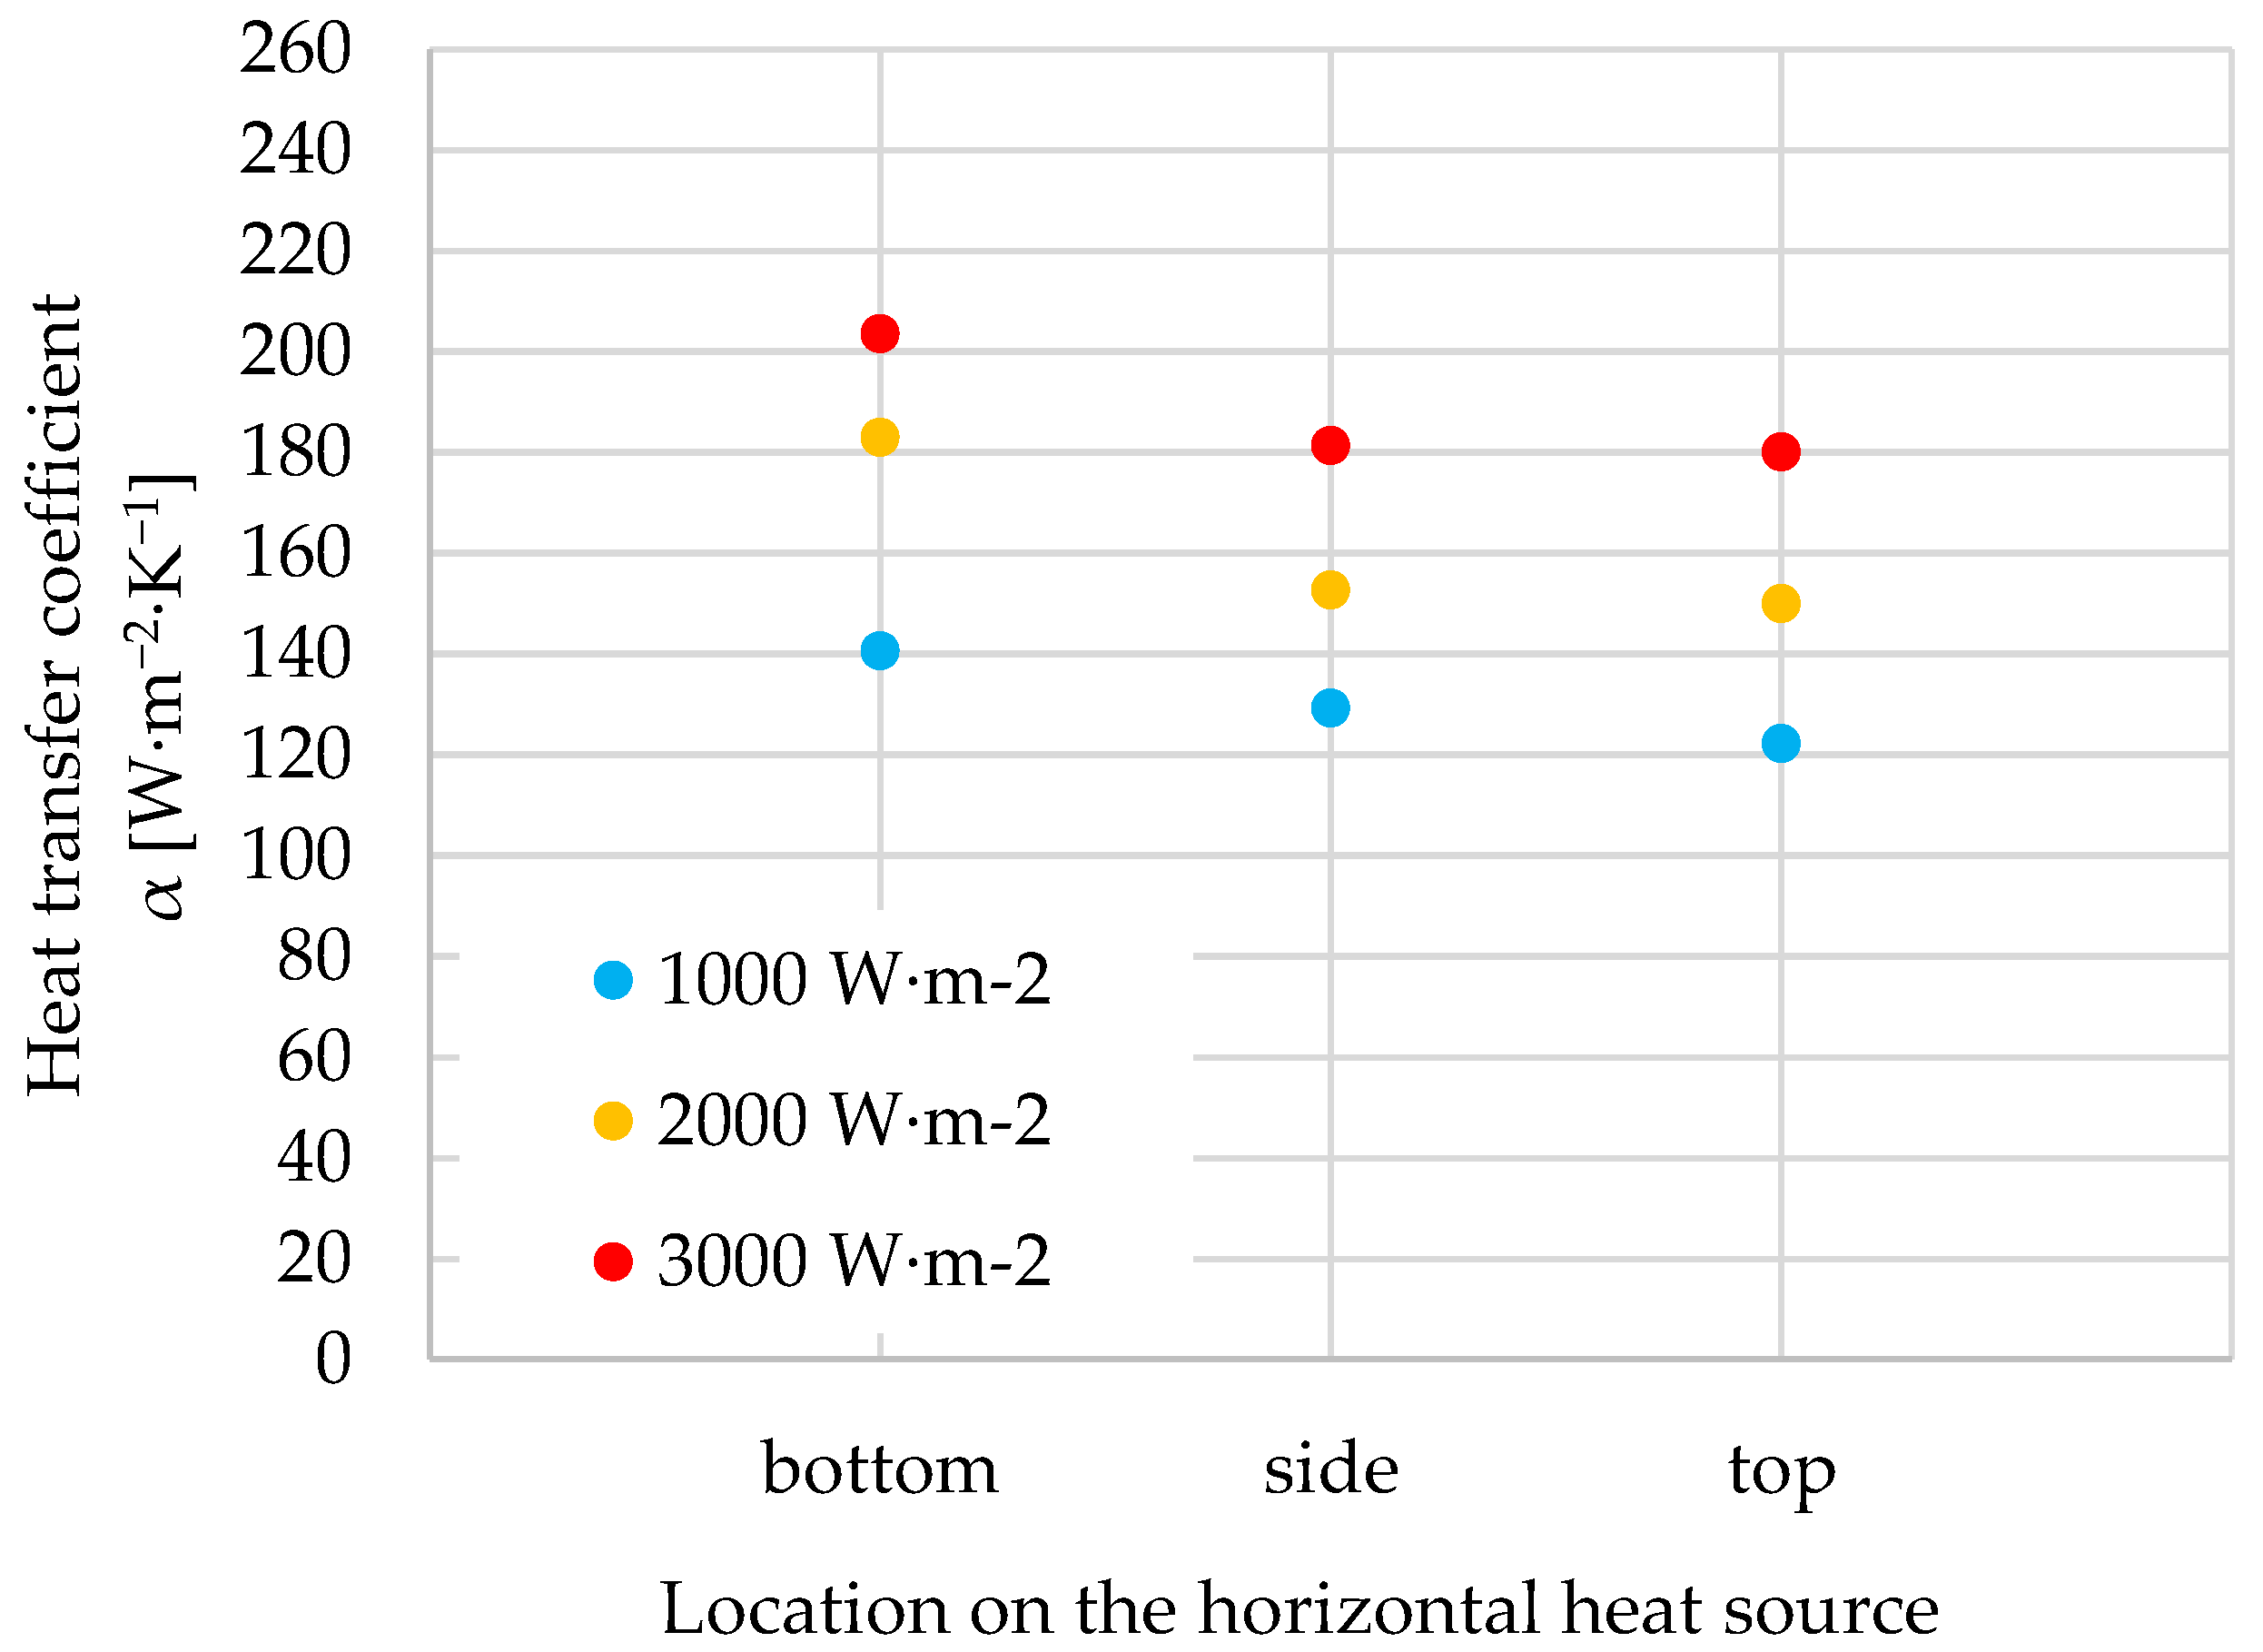
5.3. Heat Transfer Coefficient α at Different Locations of a Horizontally Positioned Heat Source

Figure 6 shows the values of the heat transfer coefficient α in different places of the horizontal heat source (bottom, side, top—Figure 2b) for the different types of insulating liquids. The surface heat load q was equal to 3000 W·m−2. As can be seen, the highest values of the coefficient α were recorded in the lower part of the heat source, and the lowest were recorded in the upper part. The difference between them was about 20%. This was true regardless of the type of insulating liquid used.
Figure 7, as well as Figure 6, shows the values of the coefficient α at different locations of the horizontal heat source for different values of the surface heat load q. The analyzed liquid was mineral oil. As can be seen, the highest values of the heat transfer coefficient were measured in the lower part of the heat source, and the lowest were measured in the upper part. The differences between them were about 20–30%. This relationship was observed independently of the value of the surface heat load q.
Regardless of the type of liquid and the value of the surface heat load q, the highest value of the heat transfer coefficient α was always found in the lower part of the horizontal heat source, and the smallest in its upper part. The differences between them were about 20–30%. In order to explain this phenomenon, the probable motion of the liquid must be taken into account. The insulating liquid heats up both in the lower, side, and upper parts of the heat source. The heated liquid, which has a lower density, moves upwards due to the convection movement. This causes the heated liquid to accumulate in the middle and, above all, in the upper part of the source. Thus, at the top of the source, the temperature of the liquid is the greatest. This means that this is where the temperature difference ΔT between the heat source and the outer wall (tank) will be the largest. According to Formula (4), the higher the value of ΔT, the smaller the value of the coefficient α. This shows why the heat transfer coefficient has the lowest values in the upper part of the horizontal heat source, and the values of the coefficient α are the highest in the lower part of the horizontal heat source.

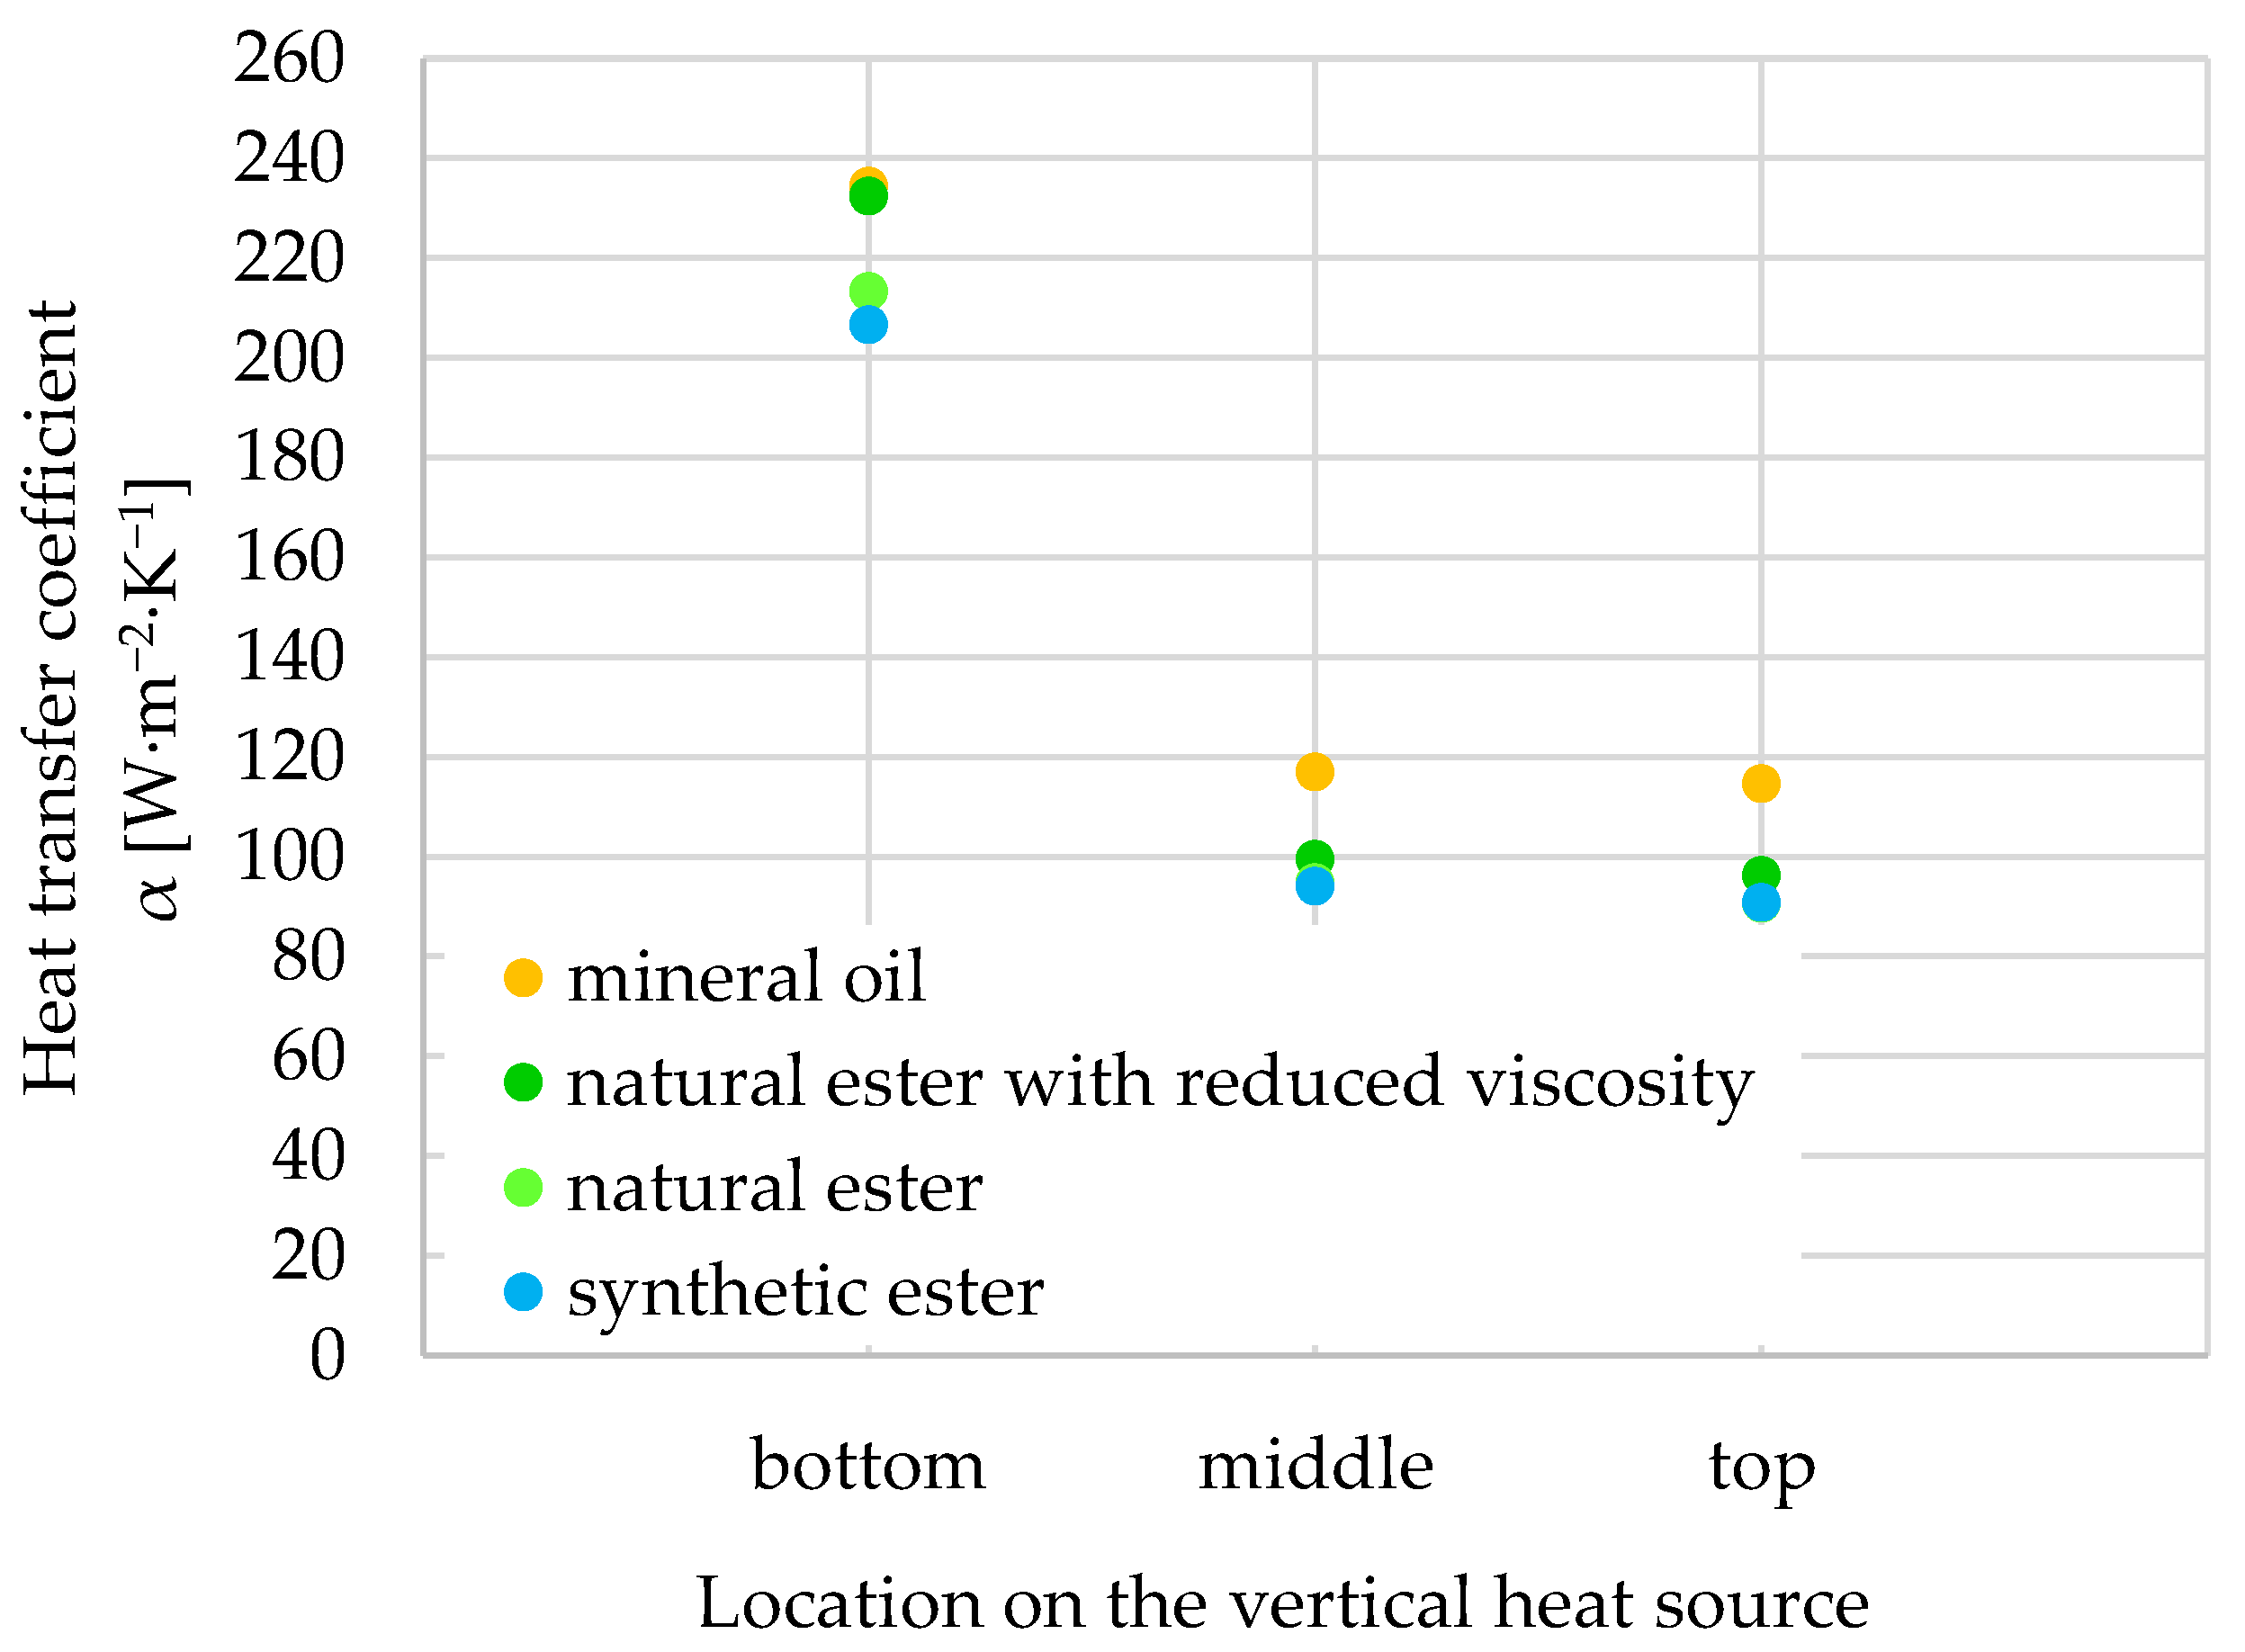
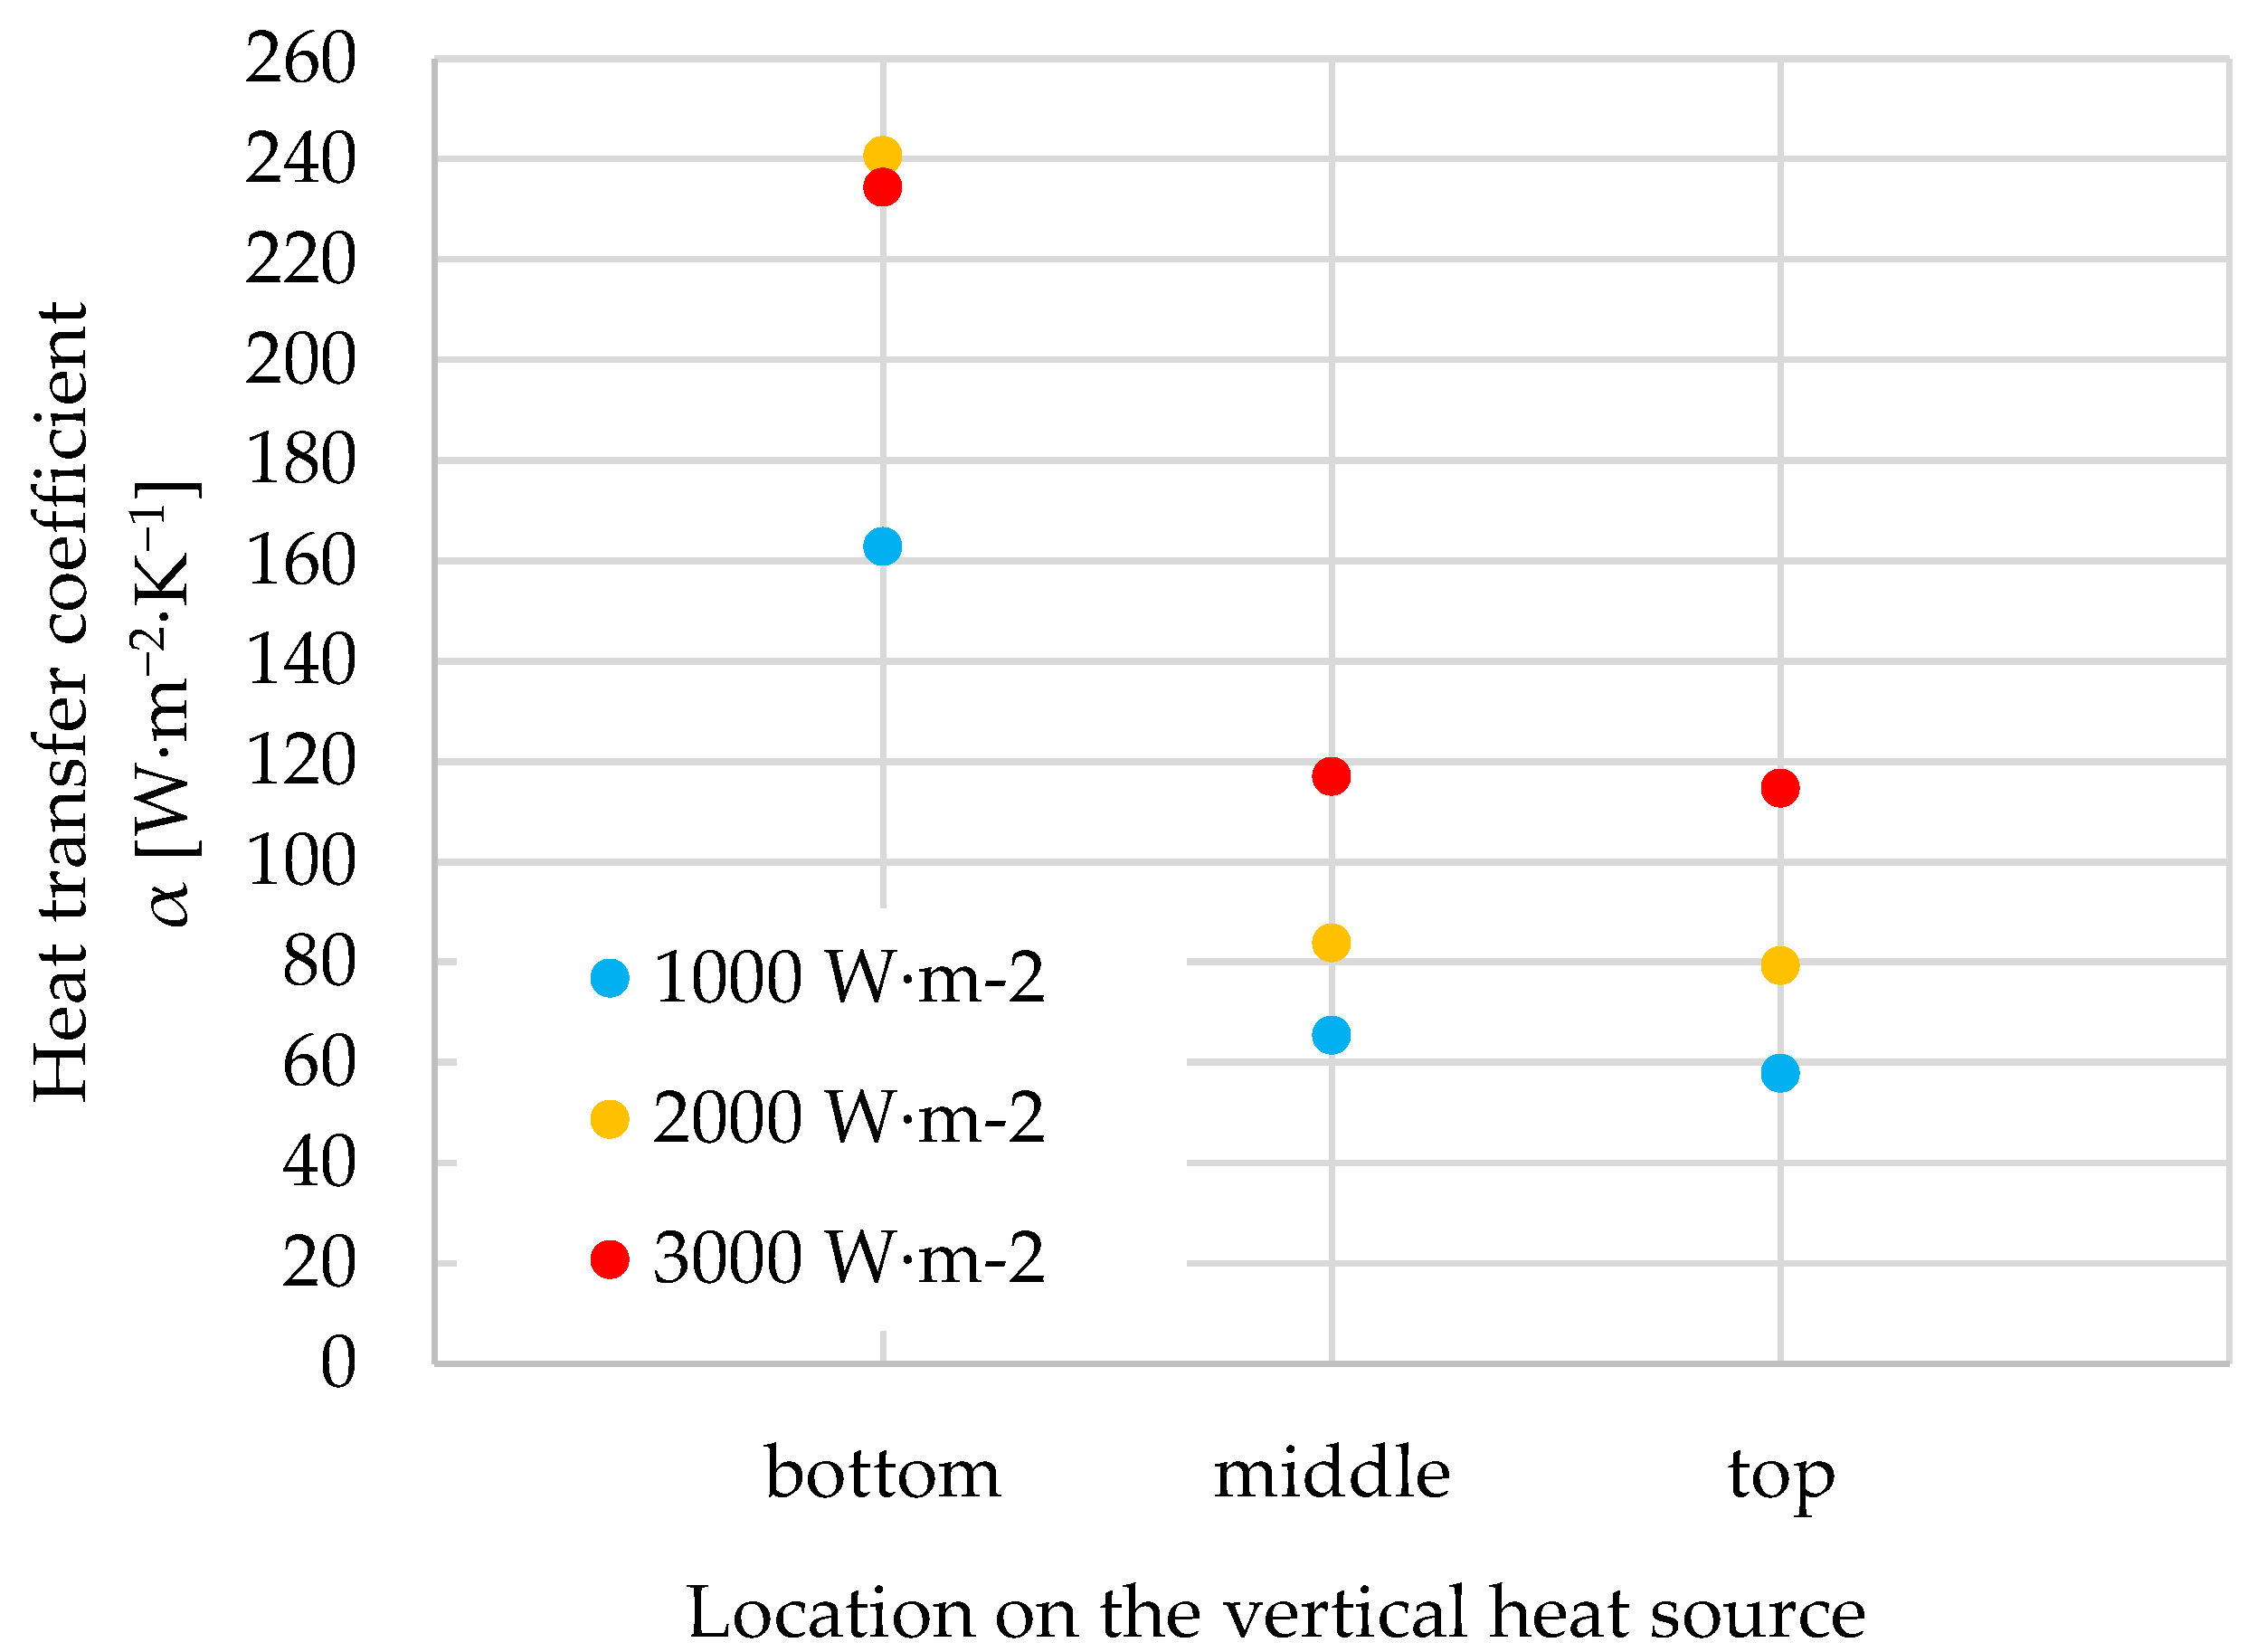
5.4. Heat Transfer Coefficient α at Different Locations of a Vertically Positioned Heat Source

Figure 8 shows the results of measurements of the heat transfer coefficient α in different places of the vertical heat source (top, middle, bottom—Figure 2a). The values of the coefficient α are presented for different types of insulating liquid. The surface heat load was equal to 3000 W·m−2. As can be seen in the figure, the highest value of the heat transfer coefficient occurred in the lower part of the vertical heat source, and the lowest in its upper part. The difference between the lower and upper parts was relatively large, equal to about 100%. This trend was measured regardless of the type of insulating liquid.
Figure 9, as well as Figure 8, shows the values of the coefficient α at different locations of the vertical heat source for different surface heat load q values. The analyzed liquid was mineral oil. As can be seen in the figure, the highest α values were measured at the bottom of the heat source, and the lowest were measured at the top. The differences between them were relatively large, equal to about 100%. This was true regardless of the value of the surface heat load q.
As in the case of a horizontal heat source, the highest value of the heat transfer coefficient α always occurred in the lower part of the heat source, and the smallest in the upper part of the source. The differences between them were significant, equal to about 100%. This was true regardless of the type of liquid and the value of the surface heat load q. The explanation for this phenomenon is similar to that for a horizontal heat source. The insulating liquid heats up in every part of the heat source. The heated liquid, moving as a result of convection movement, accumulates in the upper part of the heat source. The result is that the temperature at the top of the heat source is the highest. This means that this is where the heat transfer coefficient α has the smallest values, and at the bottom of the source, the values of the coefficient α are the largest. This phenomenon occurs with even greater intensity in the case of a horizontal heat source. This is because, for a horizontal heat source, the liquid only accumulates heat in a path of 30 mm, which is half of the circumference of the heat source (Figure 2b). On the other hand, for a vertical heat source, this path is much longer, equal to the length of the heat source, i.e., 800 mm (Figure 2a). For this reason, the differences in the coefficient α between the upper and lower parts of the heat source for the case of a vertical heat source are much greater (about 100%) than for the horizontal heat source (20–30%).

6. Conclusions

The position of the heat source in the power transformer relative to the ground is of great importance in the process of transferring heat to the environment. The heat transfer coefficient α always had higher values for the case of a horizontal heat source compared to a vertical source. This means that a horizontal source is more efficient at dissipating heat to the environment compared to a vertical source. The difference between the two cases was about 30%. This was true regardless of the type of insulating liquid and value of the surface heat load q. Thus, the authors proved the thesis that the position of the heat source has an impact on the efficiency of transferring heat to the environment.
The location of the heat source has a significant impact on the heat transfer coefficient α. The highest value of this coefficient occurs in the lower part of the heat source, and the lowest in its upper part. This means that in the lower part of the source, the heat energy is more efficiently transferred to the environment than to the upper part of the source. This happens regardless of the position of the heat source relative to the ground (vertical, horizontal), the type of insulating liquid used, and the value of the surface heat load q. In the case of using a horizontal heat source, the difference in the coefficient α between the lower and upper part of the source was about 20–30%. However, in the case of using a vertical heat source, the difference was significant, equal to about 100%. Thus, the authors proved the thesis that the place of the heat source has an impact on the efficiency of heat dissipation in the power transformer.
The obtained values of the heat transfer coefficient α for different positions of the heat source relative to the ground (vertical, horizontal) and in different places of the heat source (bottom, middle/side, top) differ significantly from each other. This means that they must be taken into account in the design process, and their consideration will significantly facilitate the determination of the temperature field distribution in power transformers.
As written before, there are two methods used to design the cooling system of a power transformer. The first one uses the results of a computer simulation of the temperature field distribution. This method is relatively expensive and time-consuming. The second method is to quickly calculate the temperature drops on individual transformer components. This is a relatively cheap and fast method, but its main disadvantage is the fact that a constant value of the heat transfer coefficient α equal to 100 W·m−2·K−1 is assumed. The presented research results prove that this assumption is wrong. The α coefficient can take in a wide range of values, i.e., 50÷240 W·m−2·K−1. These differences are due, among other things, to the influence of the location of the heat source.
Table 4 shows heat transfer coefficient α values as a function of heat source location regarding the use of a vertical heat source, mineral oil as an insulating liquid, and a surface heat load of 2000 W·m−2. The table shows the results derived from calculating the temperature drop ΔT corresponding to the different values of the α coefficient (calculated on the basis of Formula (5)). As can be seen, the temperature drop in the top part of the heat source is equal to 25.20 °C, and for the bottom part, it is only 8.31 °C. The difference between the drops was equal to 16.89 °C. Such a large difference is twice as high as the temperature value of Montsinger’s 8 °C law. As demonstrated, when designing a cooling system, the location of the heat source and its positioning (horizontal or vertical) must be taken into account.

Author Contributions

Conceptualization, P.G. and Z.N.; methodology, P.G.; formal analysis, T.B.; investigation, P.G.; data curation, P.G.; writing—original draft preparation, Z.N.; writing—review and editing, R.N.; supervision, Z.N. All authors have read and agreed to the published version of the manuscript.

Funding

The research described in this paper was financed by the Poznan University of Technology’s financial resources for statutory activity. The number of projects: 0711/SBAD/4560.

Conflicts of Interest

The authors declare no conflict of interest.

References

  1. Jezierski, E. Transformers. In Theoretical Basics; Scientific and Technical Publishing House: Warsaw, Poland, 1965; p. 450. [Google Scholar]
  2. Luo, C.; Li, C.; Wan, X.; Zhao, Z. Convective Heat Transfer Coefficient of Insulation Paper–Oil Contact Surface of Transformer Vertical Oil Channel. Coatings 2023, 13, 81. [Google Scholar] [CrossRef]
  3. Cano-Pleite, E.; Barrado, A.; Garcia-Hernando, N.; Olías, E.; Soria-Verdugo, A. Numerical and Experimental Evaluation and Heat Transfer Characteristics of a Soft Magnetic Transformer Built from Laminated Steel Plates. Sensors 2021, 21, 7939. [Google Scholar] [CrossRef] [PubMed]
  4. Mansour, D.E.A.; Elsaeed, A.M. Heat Transfer Properties of Transformer Oil-Based Nanofluids Filled with Al2O3 Nanoparticles. In Proceedings of the International Conference of Power and Energy (PECon), Kuching, Malaysia, 1–3 December 2014; IEEE: Piscataway, NJ, USA, 2015. [Google Scholar]
  5. Goscinski, P.; Nadolny, Z.; Tomczewski, A.; Nawrowski, R.; Boczar, T. The Influence of Heat Transfer Coefficient α of Insulating Liquids on Power Transformer Cooling Systems. Energies 2023, 16, 2627. [Google Scholar] [CrossRef]
  6. Nadolny, Z. Determination of Dielectric Losses in a Power Transformer. Energies 2022, 15, 993. [Google Scholar] [CrossRef]
  7. Martínez, V.L.; López, E.P.; Romeu, J.M.; Monrós, C.A.; Cañamero, L.M. Assessment of Load Losses Caused by Harmonic Currents in Distribution Transformers Using the Transformer Loss Calculator Software. Environments 2023, 10, 177. [Google Scholar] [CrossRef]
  8. Bukreev, A.; Vinogradov, A. A Method for Estimating Power Losses in Power Transformers without Disconnecting them from the Mains and with Ranking for Short-Circuit Losses, Load Losses and Idling Losses. In Proceedings of the 4th International Conference on Control Systems, Mathematical Modelling, Automation and Energy Efficiency (SUMMA), Lipetsk, Russia, 9–11 November 2022; IEEE: Piscataway, NJ, USA, 2022. [Google Scholar]
  9. Steinmetz, T.; Cranganu-Cretu, B.; Smajic, J. Investigations of No-Load and Load Losses in Amorphous Core Dry-Type Transformers. In Proceedings of the XIX International Conference on Electrical Machines (ICEM 2010), Rome, Italy, 6–8 September 2010; IEEE: Piscataway, NJ, USA, 2010. [Google Scholar]
  10. Khan, S.; Maximov, S.; Perez, R.E.; Galvan, J.C.O.; Vazquez, E.M.; Garcia, L. Computation of Stray Losses in Transformer Bushing Regions Considering Harmonics in the Load Current. Appl. Sci. 2020, 10, 3527. [Google Scholar] [CrossRef]
  11. Suechoey, B.; Tadsuan, S.; Khluabwannarat, P.; Chompoo-Inwai, C. An Analysis of Total Loss and Temperature of Oil-Immersed Transformer with Short Circuit Test Linear Load and Non-Linear Load. In Proceedings of the International Power Engineering Conference, Singapore, 29 November–2 December 2005; IEEE: Piscataway, NJ, USA, 2005. [Google Scholar]
  12. Sadati, S.B.; Tahani, A.; Darvishi, B.; Dargahi, M.; Yousefi, H. Comparison of Distribution Transformer Losses and Capacity Under Linear and Harmonic Loads. In Proceedings of the 2nd International Power and Energy Conference, Johor Bahru, Malaysia, 1–3 December 2008; IEEE: Piscataway, NJ, USA, 2009. [Google Scholar]
  13. Guo, J.; Fan, K.; Yang, B.; Yang, H.; Peng, Q.; Zheng, H. Investigation on Temperature Rise Characteristic and Load Capacity of Amorphous Alloy Vegetable Oil Distribution Transformers with 3D Coupled-Field Method. Machines 2022, 10, 67. [Google Scholar] [CrossRef]
  14. Sieradzki, S.; Rygal, R.; Soinski, M. Apparent Core Losses and Core Losses In 5 Limb Amorphous Transformer Of 160 kVA. In Proceedings of the International Magnetics Conference (INTERMAG), San Francisco, CA, USA, 6–9 January 1998; IEEE: Piscataway, NJ, USA, 2002. [Google Scholar]
  15. Sun, H.; Jing, C.; Zeng, H.; Su, Y.; Yang, S.; Zhang, Y.; Bachagha, T.; Zhou, T.; Hou, L.; Ren, W. Martensitic Transformation, Magnetic and Mechanical Characteristics in Unidirectional Ni–Mn–Sn Heusler Alloy. Magnetochemistry 2022, 8, 136. [Google Scholar] [CrossRef]
  16. Dawood, K.; Komurgoz, G.; Isik, F. Modelling of Distribution Transformer for Analysis of Core Losses of Different Core Materials Using FEM. In Proceedings of the 8th International Conference on Modelling Simulation and Applied Optimization (ICMSAO), Manama, Bahrain, 15–17 April 2019; IEEE: Piscataway, NJ, USA, 2019. [Google Scholar]
  17. Yue, S.; Yang, Q.; Li, Y.; Zhang, C.; Xu, G. Core Loss Calculation of the Soft Ferrite Cores in High Frequency Transformer under Non-Sinusoidal Excitations. In Proceedings of the 20th International Conference on Electrical Machines and Systems (ICEMS), Sydney, Australia, 11–14 August 2017; IEEE: Piscataway, NJ, USA, 2017. [Google Scholar]
  18. Bastiaens, K.; Curti, M.; Krop, D.C.J.; Jumayev, S.; Lomonova, E.A. Spectral Element Method Modeling of Eddy Current Losses in High-Frequency Transformers. Math. Comput. Appl. 2019, 24, 28. [Google Scholar] [CrossRef]
  19. Drandić, A.; Frljić, S.; Trkulja, B. Methodology for Eddy Current Losses Calculation in Linear Variable Differential Transformers (LVDTs). Sensors 2023, 23, 1760. [Google Scholar] [CrossRef] [PubMed]
  20. Freitag, C.; Leibfried, T. Mixed Core Design for Power Transformers to Reduce Core Losses. In Proceedings of the International Conference on Optimization of Electrical and Electronic Equipment (OPTIM) & Intl Aegean Conference on Electrical Machines and Power Electronics (ACEMP), Brasov, Romania, 25–27 May 2017; IEEE: Piscataway, NJ, USA, 2017. [Google Scholar]
  21. Frljić, S.; Trkulja, B.; Žiger, I. Calculation of the Eddy Current Losses in a Laminated Open-Type Transformer Core Based on the A, T −A Formulation. Appl. Sci. 2021, 11, 11543. [Google Scholar] [CrossRef]
  22. Eberle, W.; Liu, Y.F.; Han, Y. New Measurement Methods to Characterize Transformer Core Loss and Copper Loss in High Frequency Switching Mode Power Supplies. In Proceedings of the 35th Annual Power Electronics Specialists Conference, Aachen, Germany, 20–25 June 2004; IEEE: Piscataway, NJ, USA, 2004. [Google Scholar]
  23. Karaman, H.S.; Mansour, D.E.A.; Lehtonen, M.; Darwish, M.M.F. Condition Assessment of Natural Ester–Mineral Oil Mixture Due to Transformer Retrofilling via Sensing Dielectric Properties. Sensors 2023, 23, 6440. [Google Scholar] [CrossRef] [PubMed]
  24. Kunakorn, A.; Pramualsingha, S.; Yutthagowith, P.; Nimsanong, P.; Kittiratsatcha, S. Accurate Assessment of Moisture Content and Degree of Polymerization in Power Transformers via Dielectric Response Sensing. Sensors 2023, 23, 8236. [Google Scholar] [CrossRef] [PubMed]
  25. Kwak, S.S.; Im, Y.C.; Kim, Y.S. Long-Lifetime Event-Driven Wireless Monitoring System for Pole-Mounted Transformers. Appl. Sci. 2021, 11, 7313. [Google Scholar] [CrossRef]
  26. Shenton, M.J.; Herman, H.; Heywood, R.J.; Stevens, G.C. The Use of Spectroscopy with Chemometrics to Assess the Condition and Predict the Lifetime of Paper and Oil Used as Transformer Insulation. In Proceedings of the Eighth International Conference on Dielectric Materials, Measurements and Applications, Edinburgh, UK, 17–21 September 2000; IET: Piscataway, NJ, USA, 2002. [Google Scholar]
  27. Polanský, R.; Hahn, P.; Kadlec, P.; Moravcová, D.; Prosr, P. Quantifying the Effect of Catalysts on the Lifetime of Transformer Oil. Appl. Sci. 2020, 10, 1309. [Google Scholar] [CrossRef]
  28. Ebenezer, M.; Rajkumar, M.R.; Chandramohanan Nair, P.S. Determination of Temperature Distribution and Reduction of Life of a Dry Type Three Phase Transformer. In Proceedings of the 10th International Conference on the Properties and Applications of Dielectric Materials, Bangalore, India, 24–28 July 2012; IEEE: Piscataway, NJ, USA, 2012. [Google Scholar]
  29. Notingher, P.V.; Tanasescu, G. Determination of Estimated, Consumed and Remaining Lifetimes of Paper—Oil Transformers Insulation Based on Winding Insulation Resistance. In Proceedings of the International Conference on High Voltage Engineering and Application (ICHVE), Athens, Greece, 10–13 September 2018; IEEE: Piscataway, NJ, USA, 2019. [Google Scholar]
  30. Husnayain, F.; Latif, M.; Garniwa, I. Transformer Oil Lifetime Prediction Using the Arrhenius Law Based on Physical and Electrical Characteristics. In Proceedings of the International Conference on Quality in Research (QiR), Lombok, Indonesia, 10–13 August 2015; IEEE: Piscataway, NJ, USA, 2016. [Google Scholar]
  31. Kolbinski, K. Electrotechnical Materials Science; Scientific and Technical Publishing House: Warsaw, Poland, 1976; p. 155.
  32. Jezierski, E. Construction and Design; Scientific and Technical Publishing House: Warsaw, Poland, 1963; p. 117.
  33. Inhof, A. Electrical Insulating Materials in High Voltage Technology; Scientific and Technical Publishing House: Warsaw, Poland, 1963; p. 127.
  34. Sicinski, Z. Electrical Insulating Materials; Scientific and Technical Publishing House: Warsaw, Poland, 1965; p. 85.
  35. Slowikowska, H. Diagnostic Indicators of Thermal Processes Occurring in Cellulose Insulation of Oil Transformers. In Proceedings of the 8th Scientific and Technical Conference: Power and Special Transformers, Kazimierz Dolny, Poland, 13–15 October 2010. [Google Scholar]
  36. Slowikowski, S.J. A Method to Describe the Breakdown Risk of Zygomatic Insulation of Oil-Filled Transformers in Use. In Proceedings of the International Conference: Transformer’11, Torun, Poland, 1–3 June 2011. [Google Scholar]
  37. Przybylek, P.; Moranda, H.; Moscicka-Grzesiak, H. Bubble Effect in Bushings with Insulation made of Various Materials. Meas. Autom. Monit. 2011, 57, 406–408. [Google Scholar]
  38. Mosinski, F.; Bochenski, B. Transformer Life Time Criteria. In Proceedings of the International Conference: Transformer’07, Torun, Poland, 30 May–1 June 2007. [Google Scholar]
  39. Slowikowska, H. Progress in the Diagnosis of Thermal Processes Occurring in Paper Insulation of Oil Transformers. Meas. Autom. Monit. 2011, 57, 401–405. [Google Scholar]
  40. Przybylek, P. The influence of selected factors on the bubble effect initiation temperature. Meas. Autom. Monit. 2011, 57, 409–412. [Google Scholar]
  41. Buchacz, T.; Olech, W.; Olejniczak, H. Current problems regarding the threat of oil-paper insulation of transformers. In Proceedings of the International Conference: Transformer’09, Torun, Poland, 2–4 June 2009. [Google Scholar]
  42. Gielniak, J.; Graczkowski, A.; Moranda, H.; Przybylek, P.; Walczak, K.; Nadolny, Z.; Moscicka-Grzesiak, H.; Feser, K.; Gubanski, S.M. Moisture in Cellulose Insulation of Power Transformers—Statistics. IEEE Trans. Dielectr. Electr. Insul. 2013, 20, 82–987. [Google Scholar] [CrossRef]
  43. Perrier, C.; Beroual, A.; Bessede, J.L. Experimental Investigations on different Insulating Liquids and Mixture for Power Transformers. In Proceedings of the International Symposium on Electrical Insulation, Indianapolis, IN, USA, 19–22 September 2004. [Google Scholar]
  44. Goscinski, P.; Dombek, G. Contemporary Trends in the Use of Electrical Insulating Liquids used in High Voltage Power Transformers. In Between Evolution and Revolution—In Search of an Energy Strategy, Politics, Economy, Technology, Transport; Clean Energy Foundation: Komorniki, Poland, 2018; pp. 567–577. [Google Scholar]
  45. Rozga, P. Characteristics of Electrical Insulating Fluids for Power Transformers Alternative to Mineral Oil. In Technical and Information Bulletin of Lodz Branch of the Association of Polish Electricians; Association of Polish Electricians: Lodz, Poland, 2015; pp. 2–6. ISSN 2082-7377. [Google Scholar]
  46. Gradnik, T.; Lukan, T.; Čuček, B.; Končan-Gradnik, M. Impact of Ageing on Thermal Properties of Power Transformer Insulating Liquids. In Proceedings of the 21st International Conference on Dielectric Liquids (ICDL), Sevilla, Spain, 29 May–2 June 2022; IEEE: Piscataway, NJ, USA, 2022. [Google Scholar]
  47. Dombek, G.; Nadolny, Z.; Marcinkowska, A. Thermal properties of natural ester and low viscosity natural ester in the aspect of the reliable operation of the transformer cooling system. Maint. Reliab. 2019, 21, 384–391. [Google Scholar] [CrossRef]
Figure 1. Insulation lifetime of transformer t depending on its operating temperature T according to Montsinger’s law of 8 degrees (prepared on the basis of Formula (1)).
Energies 16 08000 g001
Figure 2. Scheme of the measurement system for determining the heat transfer coefficient α for when the heat source is positioned vertically (a) and horizontally (b).
Energies 16 08000 g002
Figure 3. Diagram of the designed system for determining the heat transfer coefficient α: 1—valve, 2—tank (steel pipe), 3—heating element (heater), 4—pin fixing the top and bottom cover of the tank, 5—electro-insulating liquid, 6—valve, 7—measuring probes.
Energies 16 08000 g003
Figure 4. The heat transfer coefficient α, depending on the position of the heat source, with different types of insulating liquids (length of the heating element d = 800 mm; surface heat load q = 3000 W·m−2).
Energies 16 08000 g004
Figure 5. The heat transfer coefficient α, depending on the position of the heat source, with different surface heat load values q when using mineral oil as the insulating liquid (length of heating element d = 800 mm).
Energies 16 08000 g005
Figure 6. The heat transfer coefficient α, depending on the location on the horizontal heat source, for different types of insulating liquid (length of heat source d = 800 mm; surface heat q = 3000 W·m−2).
Energies 16 08000 g006
Figure 7. The heat transfer coefficient α depending on the location on the horizontal heat source, for different surface heat load q values when using mineral oil as an insulating liquid; length of heat source d = 800 mm.
Energies 16 08000 g007
Figure 8. The heat transfer coefficient α, depending on the location on the vertical heat source, for different types of insulating liquid (length of heat source d = 800 mm; surface heat q = 3000 W·m−2).
Energies 16 08000 g008
Figure 9. The heat transfer coefficient α, depending on the location on the vertical heat source, for different surface heat load q values when using mineral oil as the insulating liquid (length of heat source d = 800 mm).
Energies 16 08000 g009
Table 1. Fundamental electrical and thermal properties of insulating liquids used in power transformers for temperature T = 60 °C [44,45,46,47].
Type
of Liquid
Mineral
Oil
Natural
Ester
Natural Ester with Reduced ViscositySynthetic
Ester
Electrical properties
Breakdown voltage Ub [kV]68757575
Electrical resistivity [Ω·m]108 ÷ 1014108 ÷ 10121010 ÷ 1011108 ÷ 1012
tan(delta)<0.00200.00500.04000.0006
Electrical permittivity ε2.263.202.823.20
Thermal properties
Specific heat cp [J·kg−1·K−1]2077216619902052
Thermal conductivity λ [W·m−1·K−1]0.1280.1780.1880.153
Viscosity ν [mm2·s−1]5.418.310.014.0
Density ρ [kg·m−3]845892863940
Thermal expansion β [K−1]0.000780.000780.000780.00078
Heat transfer coefficient α [W·m−2·K−1]134.67118.85123.12112.99
Table 2. Results of measurements of the heat transfer coefficient α at different locations of the heat source when positioned vertically for different insulating liquids and different surface heat load values (length of heat source d = 800 mm).
Heat Transfer Coefficient α [W·m−2·K−1]
Type
of Liquid
Mineral
Oil
Natural Ester with Reduced ViscosityNatural Ester Synthetic
Ester
Surficial heat power [W·m−2]1000
Place on
heat source
top57.9454.6651.7849.93
middle65.4665.0362.4261.08
bottom162.78149.53138.82138.50
average95.3989.7484.3483.17
Surficial heat power [W·m−2]2000
Place on
heat source
top79.3678.0171.0670.35
middle83.8481.6878.4076.19
bottom240.81209.67207.10192.44
average134.67123.12118.85112.99
Surficial heat power [W·m−2]3000
Place on
heat source
top114.7396.2490.6990.93
middle116.9899.5894.9194.09
bottom234.49232.56213.44206.76
average155.40142.79133.01130.59
Table 3. Results of measurements of the heat transfer coefficient α at different locations of the heat source when positioned horizontally for different types of insulating liquid and different heat load values (length of heat source d = 800 mm).
Heat Transfer Coefficient α [W·m−2·K−1]
Type
of Liquid
Mineral
Oil
Natural Ester with Reduced ViscosityNatural Ester Synthetic
Ester
Surficial heat power [W·m−2]1000
Place on
heat source
top122.22119.72121.35106.57
side129.15121.24127.64109.53
bottom140.57127.17135.83119.14
average130.65122.71128.27111.75
Surficial heat power [W·m−2]2000
Place on
heat source
top150.00147.69151.64132.67
side152.67148.31157.60136.93
bottom182.91157.00168.03147.75
average161.86151.00159.09139.12
Surficial heat power [W·m−2]3000
Place on
heat source
top180.00174.43172.57167.00
side181.42173.76175.09168.99
bottom203.59180.90192.35181.83
average188.34176.36180.00172.61
Table 4. Heat transfer coefficient α as a function of the location on a vertical heat source when using mineral oil as an insulating liquid (surface heat load 2000 W·m−2).
Location of the
Heat Source
Heat Transfer Coefficient
α [W·m−2·K−1]
Temperature Decrease
ΔT [°C]
top79.3625.20
middle83.8423.86
bottom240.818.31
Disclaimer/Publisher’s Note: The statements, opinions and data contained in all publications are solely those of the individual author(s) and contributor(s) and not of MDPI and/or the editor(s). MDPI and/or the editor(s) disclaim responsibility for any injury to people or property resulting from any ideas, methods, instructions or products referred to in the content.

