1. Introduction
The main components of power transformers rated for voltages of 100 kV and higher are the ferromagnetic core, high and low voltage windings, and their insulation. Windings are made in the shape of coaxial cylinders, insulated with cellulose materials. These components are placed in a sealed tank and filled with insulating oil. In such a way, a series-parallel arrangement is formed in the shape of a cylindrical capacitor. The insulation in this capacitor consists of pressboard barriers parallel to the windings and pressboard spacers perpendicular to the windings. Cellulose materials, when stored in open air, contain a significant amount of moisture, up to 8–10% [
1,
2], rendering them unsuitable for insulation. After assembling the transformer components in the tank, a vacuum drying process is performed, which reduces the moisture content of the cellulose insulation to below 1% by weight [
3,
4]. After drying, the transformer is vacuum-filled with insulating oil.
In this process, vacuum impregnation of cellulose takes place. This protects the pressboard from moisture penetration, slows down the aging processes, and enhances its insulating properties [
5,
6]. Insulating oil fills the channels between barriers and spacers, and also impregnates the pressboard. During the operation of the transformer, power losses in the form of heat occur in both the core and the windings. The insulating oil absorbs this heat, serving a cooling function for the transformer. The efficiency of the cooling depends on the mechanical and thermal properties of the oil, such as kinematic viscosity, density, thermal conductivity, and specific heat [
7,
8,
9,
10].
During many years of operation, the moisture level of the pressboard gradually increases. It transforms from a cellulose–oil composite to a cellulose–oil–moisture composite. Reaching or exceeding a moisture level of 5% by weight, considered the critical level, can cause catastrophic failure of the power transformer [
4,
11,
12,
13]. To prevent such failures, periodic checks on the moisture content in the pressboard are essential. Due to the hermetic design of transformers, several electrical methods are employed for this purpose. The Polarization Depolarization Current method (PDC) [
14,
15] involves measurements of insulation polarization and depolarization using DC voltage. In the Return Voltage Measurement method (RVM) [
16,
17,
18] time–voltage parameters are determined via cyclic charging and discharging insulation with DC voltage, the values of which depend on moisture content and measurement temperature. Currently, the Frequency Domain Spectroscopy method (FDS) [
19,
20,
21,
22] is widely used. It determines the AC dielectric characteristics of the insulation. Additionally, meters dedicated to FDS measurements usually have software that estimates the moisture content of the cellulose component of the insulation based on frequency–temperature dependencies of the loss tangent. Power transformer insulation is a cylindrical series-parallel capacitor. The oil channel and spacers are connected in parallel. In series with them are barriers. The loss tangent of a homogeneous material is a function of four parameters—conductivity, permittivity, temperature, and frequency. For series-parallel insulation, the conductivity and permeability of both the pressboard and oil should be considered, as well as the geometric dimensions of spacers, barriers, and the oil channel. This means that for every frequency and temperature, the transformer insulation’s loss tangent is a function of six parameters. To precisely estimate the moisture content of the pressboard in a transformer, information on the effect of moisture on the material parameters for both the pressboard and oil is required. FDS meter software estimating pressboard moisture was developed based on so-called standard characteristics [
23]. These characteristics were determined in laboratory tests. For this purpose, pressboard plates were moistened to various moisture contents, impregnated with mineral oil, and then temperature–frequency characteristics were determined [
24,
25,
26,
27]. Recent publications [
28,
29], have determined that FDS meter software provides moisture values inconsistent with actual ones. This implies that the models assumed in the meter software do not consider the real phenomena of conductivity and dielectric relaxation occurring in transformer insulation. Also, the reference dependencies used to develop the software are not precise. This results from the fact that measurements were performed at only three points per frequency decade, and for activation energy calculations, only three measurement temperatures were used [
24,
25,
26,
27]. Most importantly, these publications omit tests for the critical moisture content of 5% by weight.
Mineral oil, previously used in power transformers, has several significant drawbacks in terms of environmental impact. Firstly, it is produced from fossil resources, which results in carbon footprint creation during transformer production. Secondly, it is very poorly biodegradable, which can lead to environmental contamination in the event of failure. Recently, an alternative to mineral oils has emerged, so-called bio-oils. Nynas AB Raffinaderivagen, Sweden, produces Nytro Bio 300X bio-oil from plant-based resources, and with the use of green hydrogen. Furthermore, bio-oil is highly biodegradable, which eliminates the possibility of soil contamination. From research conducted by Nynas and Energo-Complex companies, it was determined that a number of bio-oil parameters differ from those of mineral oil. For instance, viscosity is about twice as low, and the permittivity at a frequency of 50 Hz is about 15% lower. Other parameters also vary. This means that in order to develop software for estimating the moisture content in a pressboard impregnated with bio-oil, based on FDS measurements, appropriate reference characteristics need to be determined.
In connection with the above, the purpose of this work was as follows:
The preparation samples of a pressboard impregnated with bio-oil, with a water content ranging from 1% by weight to 5% by weight;
Precise measurement of fundamental AC parameters—phase shift angle and admittance of the cellulose–bio-oil–water nanoparticle composite in a temperature range from 293.15 K to 343.15 K with a step of 10 K;
The accurate determination of the activation energy values for relaxation times of the phase shift angle and admittance, activation energy of admittance, and generalized activation energy.
2. Materials and Methods
The analysis of the moisture content of the power transformers’ cellulose insulation is currently performed using the PDC, RVM, and FDS methods. The FDS method is most commonly used for this purpose. This is due to the fact that the software of FDS meters includes the ability to estimate, based on measurements on an actual transformer, the moisture content of the cellulose component of the insulation. The moisture estimation is based on comparing the curve obtained from the transformer measurement with previously obtained so-called “standard curves”. Standard frequency dependencies are determined in laboratory measurements for pressboards impregnated with insulating oil at different moisture levels for temperatures within the operating temperature range of transformer insulation.
In this study, standard curve laboratory measurements were performed on samples prepared in a traditional way, described, for example, in publications [
22,
25,
30,
31]. From the pressboard sheet (manufacturer Weidmann Electrical Technology), samples in the shape of a cylinder with a diameter of 200 mm were cut out. The cut samples were vacuum-dried at a temperature of about 353 K over 72 h. Then, using a precise scale, the sample’s weight was determined and its weight was calculated after reaching the desired pre-determined moisture level. Moisturizing was performed in atmospheric air, from which the pressboard absorbed moisture. After achieving the calculated sample weight, samples were immersed in bio-oil for impregnation. For the impregnation of pressboard, the insulating bio-oil Nynas NYTRO BIO 300X produced by Nynas AB Raffinaderivagen, Sweden, was used. The impregnation of samples intended for research was carried out at a temperature of 45 °C. Increasing the temperature reduces the viscosity of the oil, thus accelerating the impregnation process and shortening its time. In our case, the impregnation time at the elevated temperature was about 14 days. In the study, tests were conducted for samples with moisture contents of 1.0% by weight, 2.0% by weight, 3.0% by weight, 4.0% by weight, and 5.0% by weight. Each sample, during impregnation and subsequent storage before measurements, was kept in a separate airtight container.
Research on the phase shift angle and admittance of the pressboard–bio-oil–nanodrops of water composite was conducted on a measurement station, which has been described in publications [
32,
33,
34,
35]. The composite measurements using the FDS method were carried out in a flat three-electrode capacitor. After placing an impregnated and moistened pressboard sample in it, the capacitor was placed in a glass vessel and filled with bio-oil in a volume less than ten times the volume of the pressboard. After connecting the capacitor to the measurement system, the vessel was sealed. Then, the vessel, along with the capacitor, was placed in a thermostat. The accuracy of the temperature stabilization was no worse than ±0.05 °C. After stabilizing the set measurement temperature, measurements were made with a Dirana type FDS meter produced by the Omicron company. Measurements were taken from the highest to the lowest frequency, meaning from 5000 Hz to 10
−4 Hz. In the frequency range from 5000 Hz to 10
−3 Hz, 10 measurement points were taken per decade, and from 10
−3 Hz to 10
−4 Hz, 6 measurement points were taken. Measurements were conducted at temperatures ranging from 293.15 K to 343.15 K in 10 K steps.
In the study, the frequency–temperature dependencies of admittance
Y and phase shift angle
φ in the parallel equivalent circuit were investigated and analyzed. These parameters are fundamental for insulating materials. The phase shift angle
φ (
Figure 1) is defined as the difference in angles at which the instantaneous values of current and voltage cross zero [
36]:
where
φ is the phase shift angle,
φ(
i = 0) is the angle at which the instantaneous value of the current is zero, and
φ(
V = 0) is the angle at which the instantaneous value of the voltage is zero [
37]:
where
Y is admittance,
V is applied voltage, and
I is electric current.
Based on the values of the phase shift angle
φ and the admittance
Y, using the known formulas [
37], other insulation parameters, such as the loss tangent, power factor, real and imaginary components of complex capacitance, and conductance, can be calculated. Furthermore, by applying the dimensions of the insulating material—the thickness of the pressboard and the surface area of the measuring electrode of the capacitor, the material parameters of the insulation conductivity, and the real and imaginary components of complex permittivity—can be determined.
3. The Influence of Frequency and Temperature on the Phase Shift Angle and the Admittance of Moistened Pressboard Impregnated with Insulating Bio-Oil
In the study, particular attention was paid to the examination and analysis of the fundamental parameters of a pressboard impregnated with bio-oil, moistened to a moisture content of 5% by weight. This is due to the fact that such a high level of moisture is somewhat critical. Achieving and then exceeding a content of 5% by weight may cause catastrophic failure of the transformer [
11,
12].
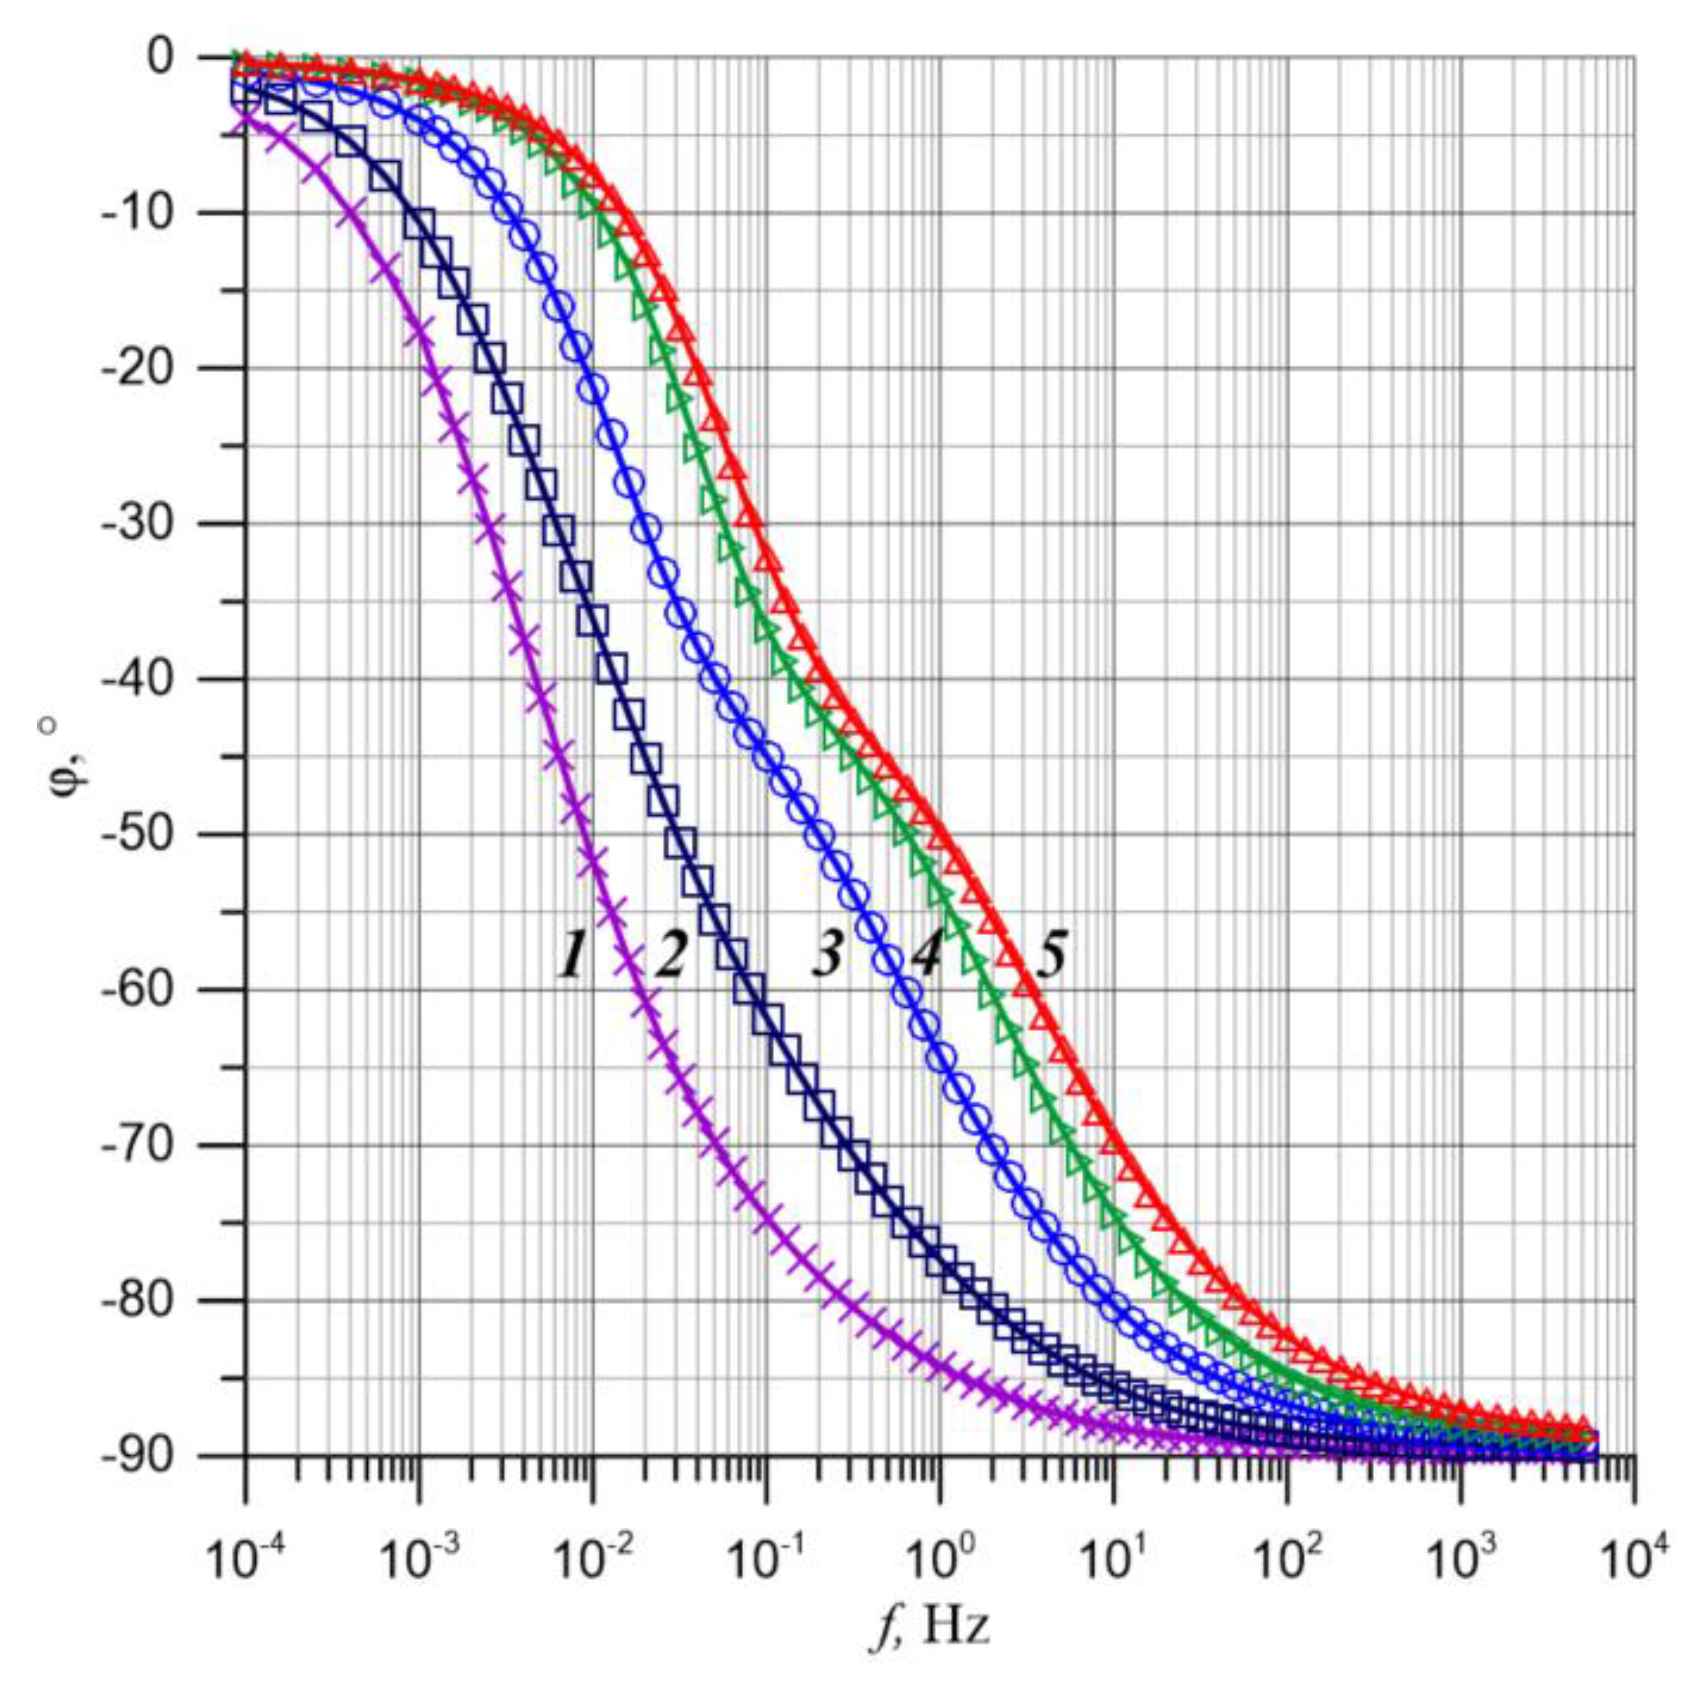
Figure 2 shows the frequency dependencies of the phase shift angle measured for the examined composite at temperatures from 293.15 K to 343.15 K with a step of 10 K.
Analysis of the curves presented in
Figure 2 (see, for example, the curve for a temperature of 70 °C) shows that an increase in frequency leads to a decrease in the phase shift angle values from about 0° to almost −90°. The entire frequency dependence can be divided into four sections. The first section, for the lowest frequencies, is characterized by a gradual decrease in
φ values. In the second section, a rapid decrease in the phase shift angle value is observed. At the end of this section, near a
φ value of about 40°, there is a slowdown, followed by the beginning of the third section where rapid changes in
φ are observed again. The last, fourth section shows a slowdown and the value approaches −90°. The presence of two sections of rapid changes in the
φ(
f) dependence, separated by a slower one, may suggest that there are two stages of dielectric relaxation in the composite. Similar changes in the curves were observed in publication [
38], where pressboard impregnated with a natural ester was studied, and in [
35], where pressboard impregnated with mineral oil was analyzed. The occurrence of two stages of dielectric relaxation in identical samples of pressboard, impregnated with three different insulating liquids, indicates that the mechanisms responsible for these stages are not related to the properties of the impregnating liquids. These mechanisms are more likely associated with the structure and properties of the impregnated pressboard.
The analysis of the curves presented in
Figure 2 shows that with the increase in measurement temperature, there is a shift towards higher frequencies. This is due to the reduction in dielectric relaxation times. As is known, in moistened pressboard, impregnated with mineral oil or synthetic ester, charge transfer occurs through the quantum mechanical phenomenon of electron tunneling between nanodroplets of water [
39]. In this case, the relaxation time is described by the following equation [
39]:
where
τ is the relaxation time,
τ0 is an unspecified numerical coefficient,
r is the distance over which the electron tunnels,
RB is the Bohr radius of the tunneling electron, ∆
Wτ is the activation energy of relaxation time, and
T is the temperature.
The curves presented in
Figure 2 were made for a pressboard sample with a 5% by weight water content, which means that the average distance
r over which the electrons tunnel is a constant value. Therefore, Equation (3) assumes a form known from the literature [
40,
41]:
where, according to Equation (3),
From Equations (4) and (5), it follows that in the studied sample, the relaxation time is a function of temperature only. In order to determine the relaxation time on the plots from
Figure 2, one should select the value of the phase shift angle
φi and read the frequency values at which this value occurs for different temperatures. The relative value of the relaxation time, accurate to the value of constant
A, is determined using the following equation:
where
τi(
T,
φi) is the relative relaxation time,
φi is the selected value of the phase shift angle, A is the constant value, and
f(
T,
φi) is the frequency at which the selected value of the phase shift angle
φi occurs at temperature
T.
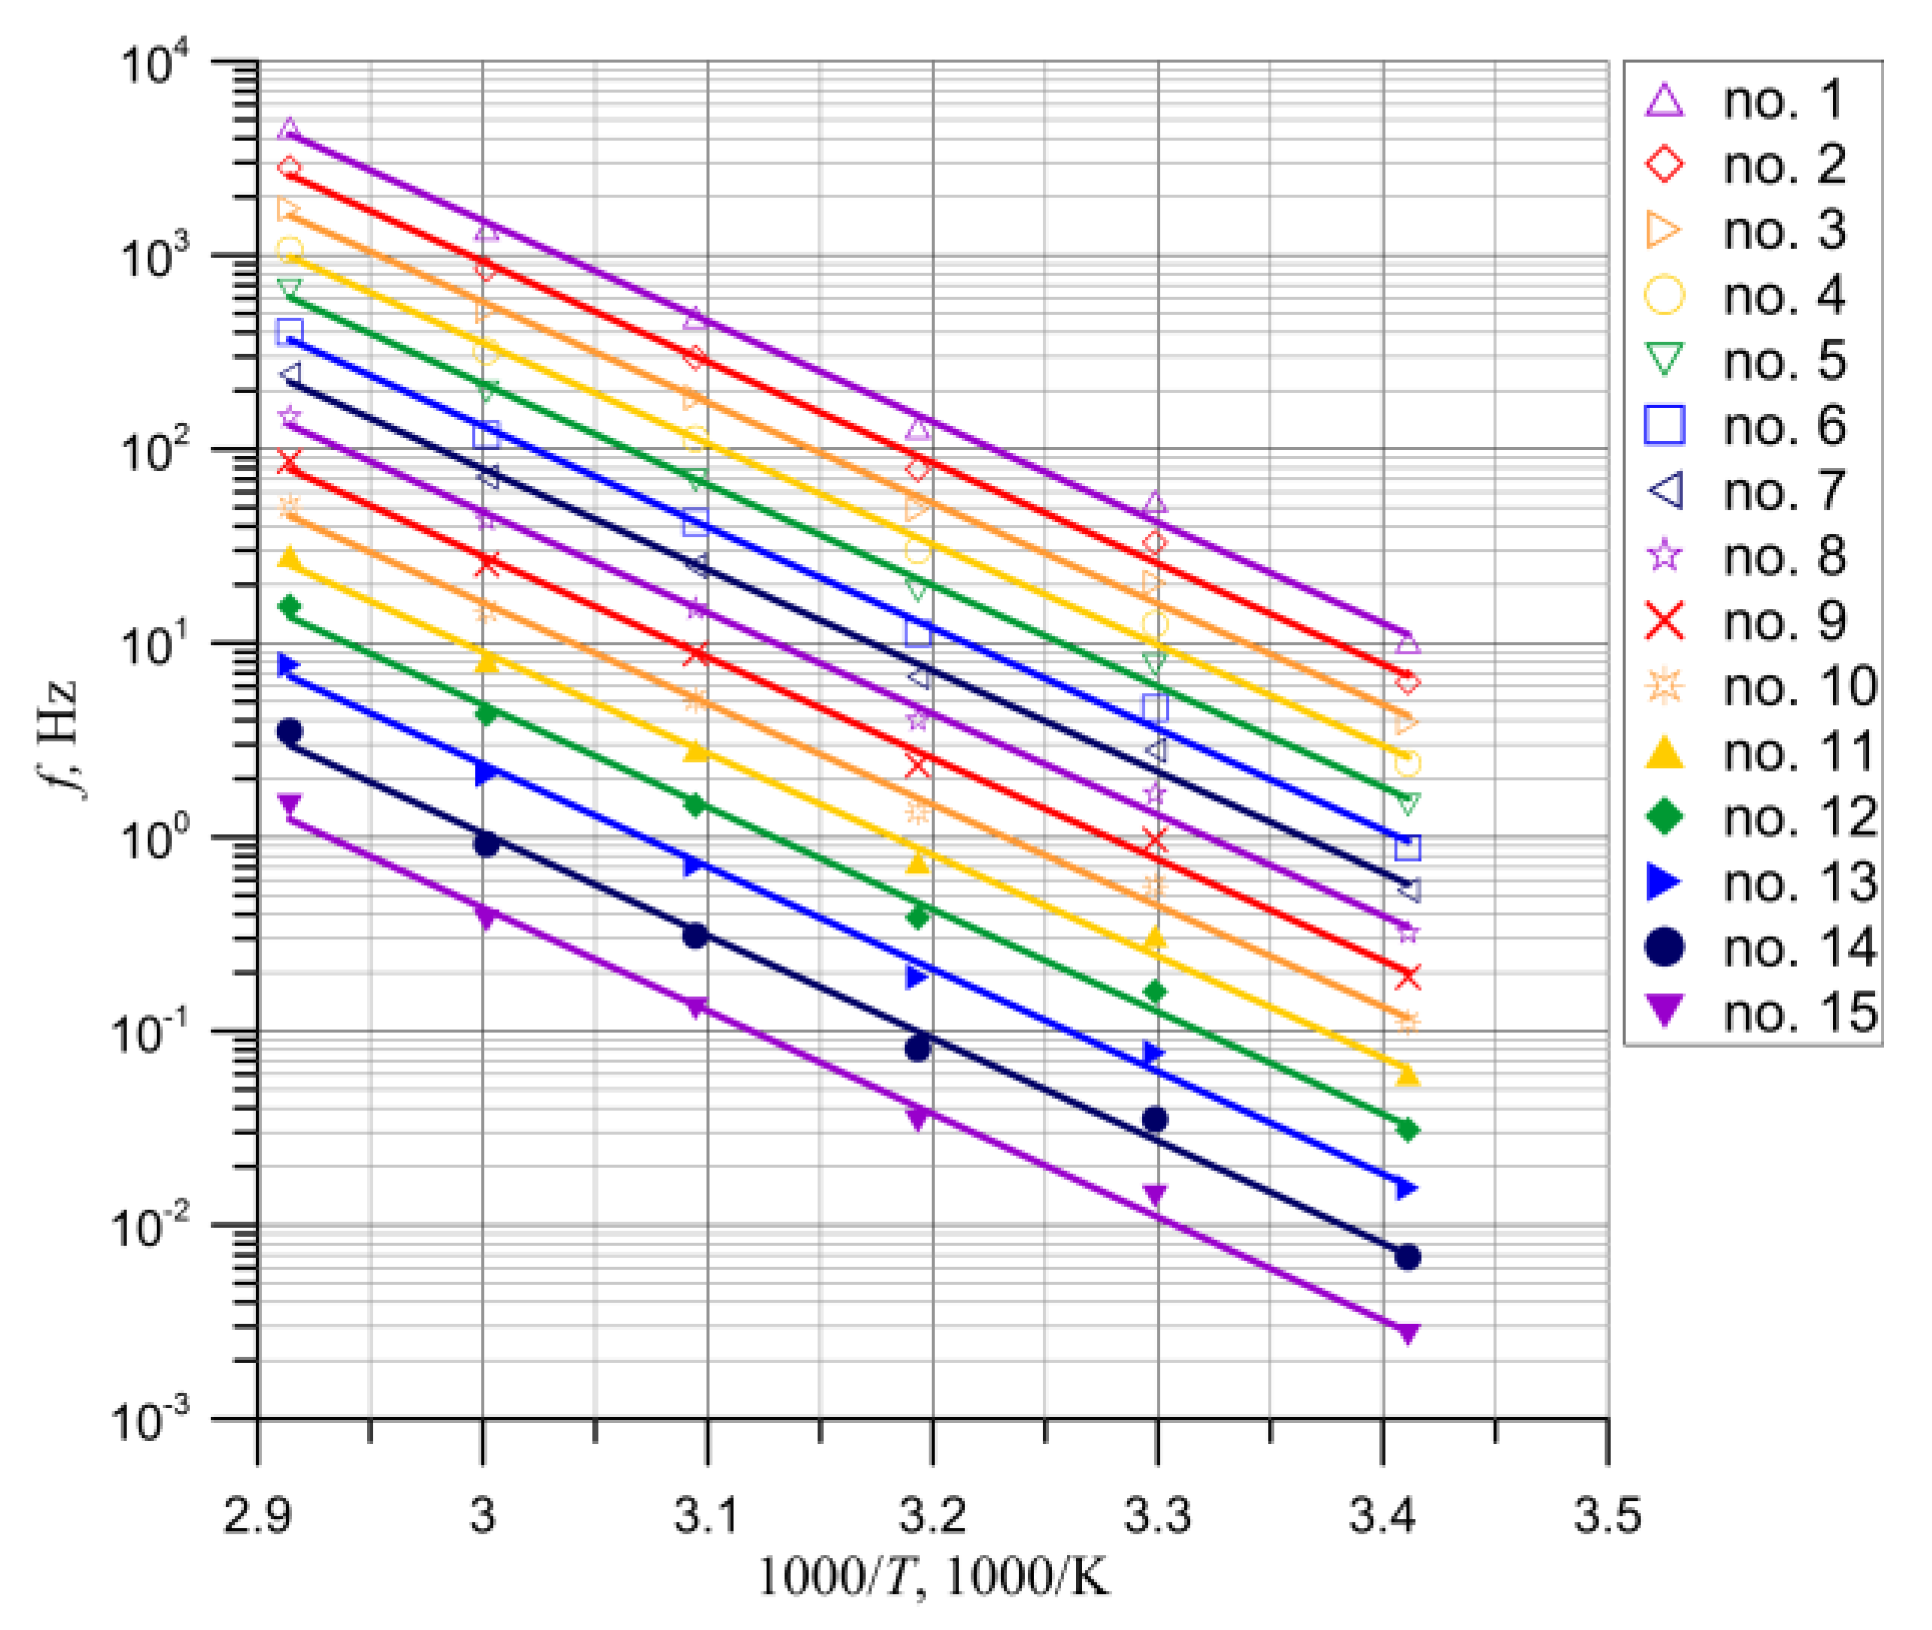
Based on Equation (6), determining the values of relative relaxation times for various measurement temperatures allows for the development of an Arrhenius plot and the determination of the activation energy of dielectric relaxation time using Equation (4). In this study, the determination of the activation energy of relaxation time was carried out for 15 values of phase shift angles
φi chosen from the low-frequency and high-frequency stages of rapid phase shift angle reduction.
Figure 3 presents 15 Arrhenius plots for the selected
φi values. Activation energy values for each
φi value are presented in
Table 1.
Figure 3 shows that the obtained experimental curves are decreasing linear functions. The determination coefficients
R2 for the approximating functions (
Table 1) are close to one, indicating high-quality linear approximation of the experimental results. From
Figure 3, it is evident that the curves on the Arrhenius plots are nearly parallel. This means, firstly, that within the examined temperature range, the activation energy of relaxation time is a constant value. Secondly, on both rapid reduction stages, the activation energy is the same. The creation of 15 Arrhenius plots allowed for a precise determination of the average value of the activation energy of relaxation time, standard deviation, and uncertainty in determining the activation energy. The uncertainty value was calculated in accordance with the document from reference [
42]. The obtained activation energy value for the phase shift angle is Δ
Wτϕ ≈ (1.032 ± 0.0309) eV. As can be seen, using 15
φi values to determine the activation energy resulted in a highly accurate determination.
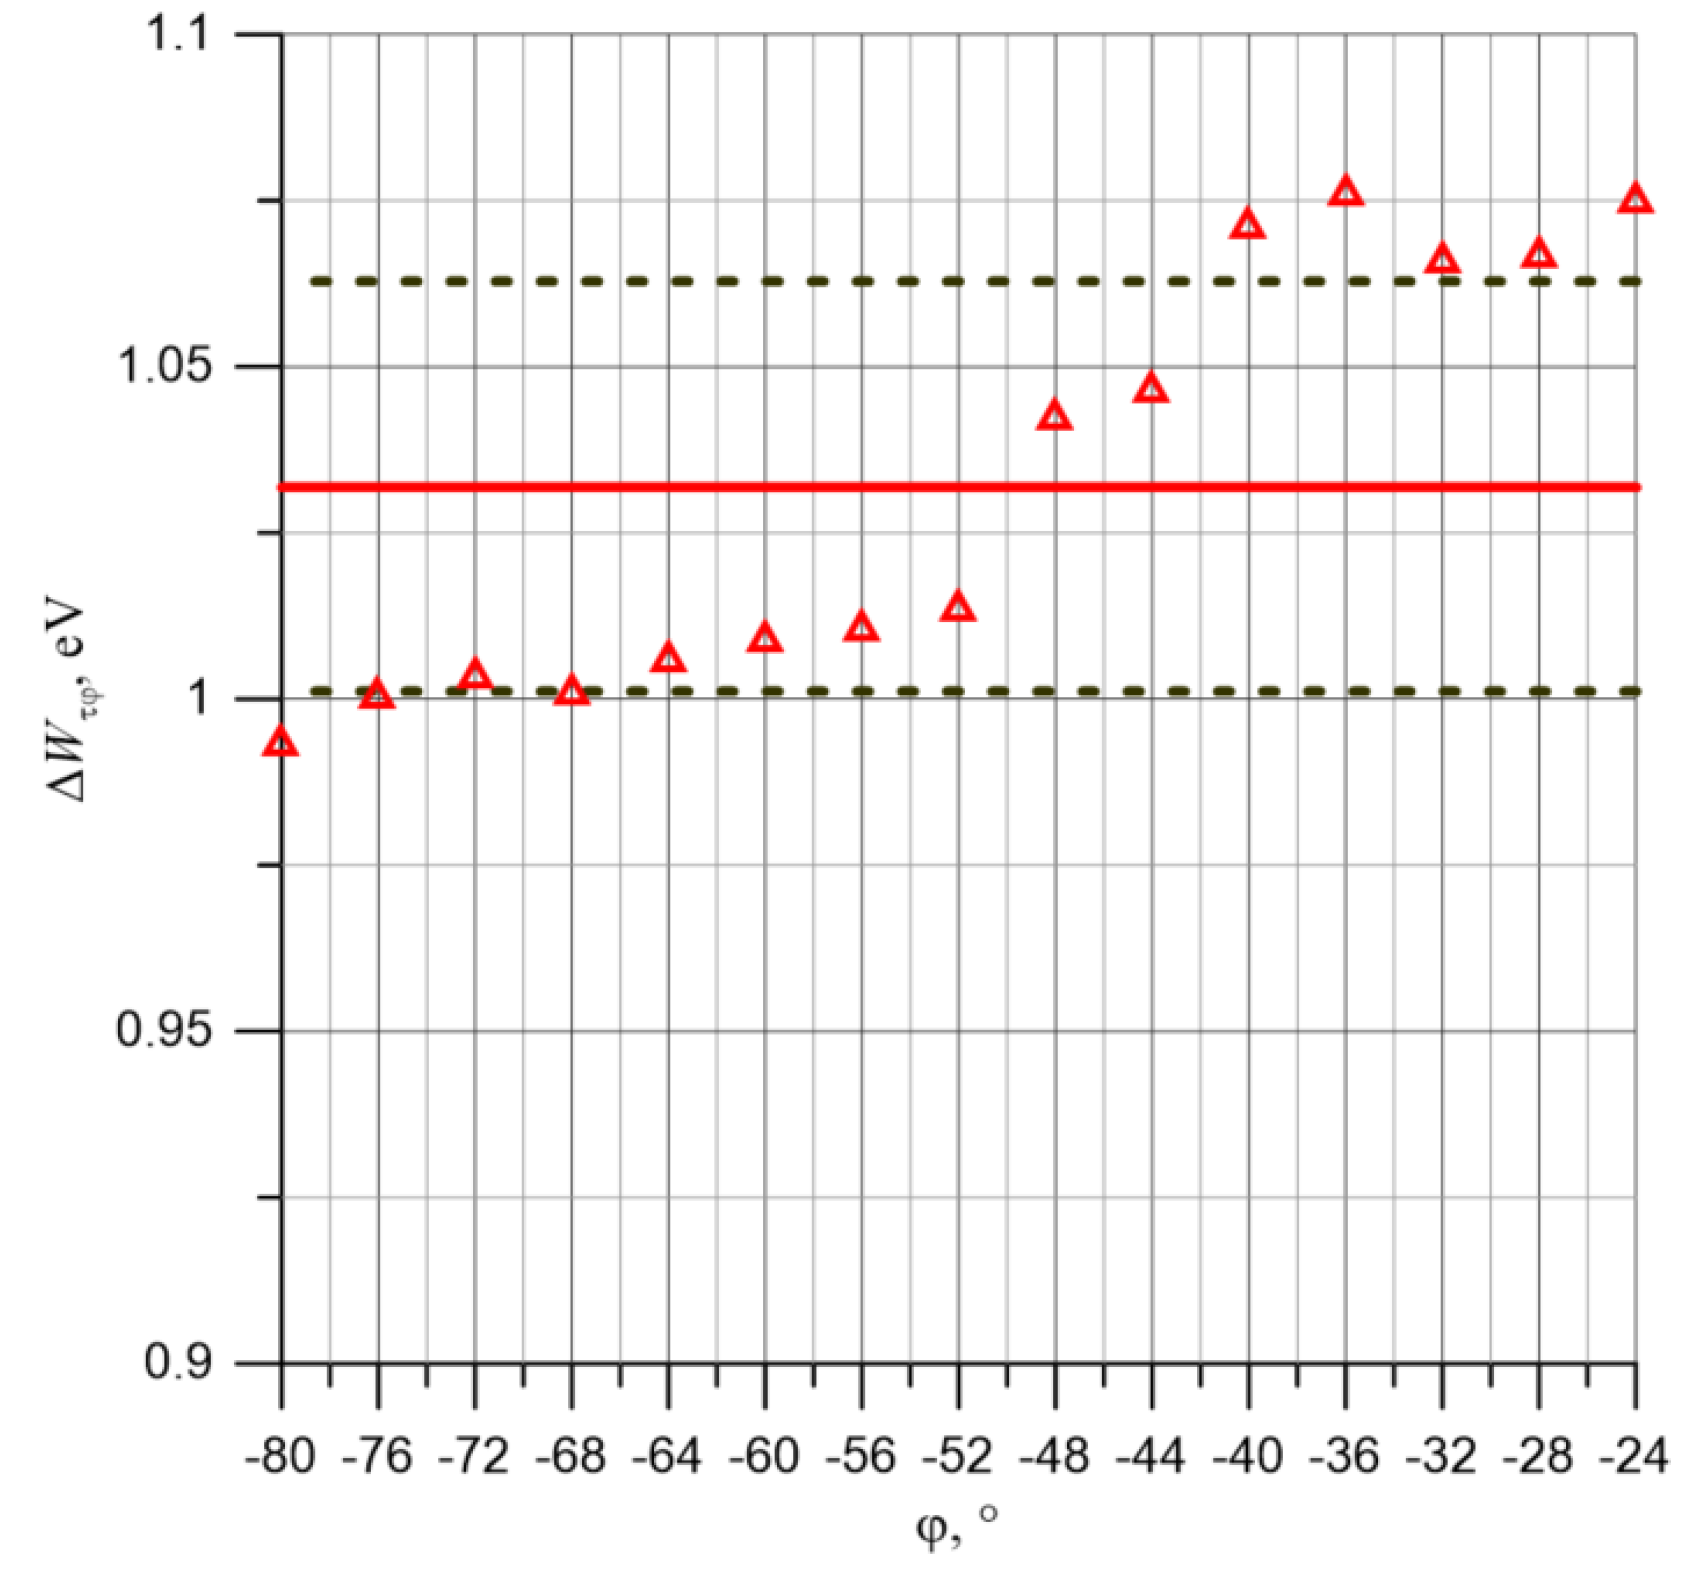
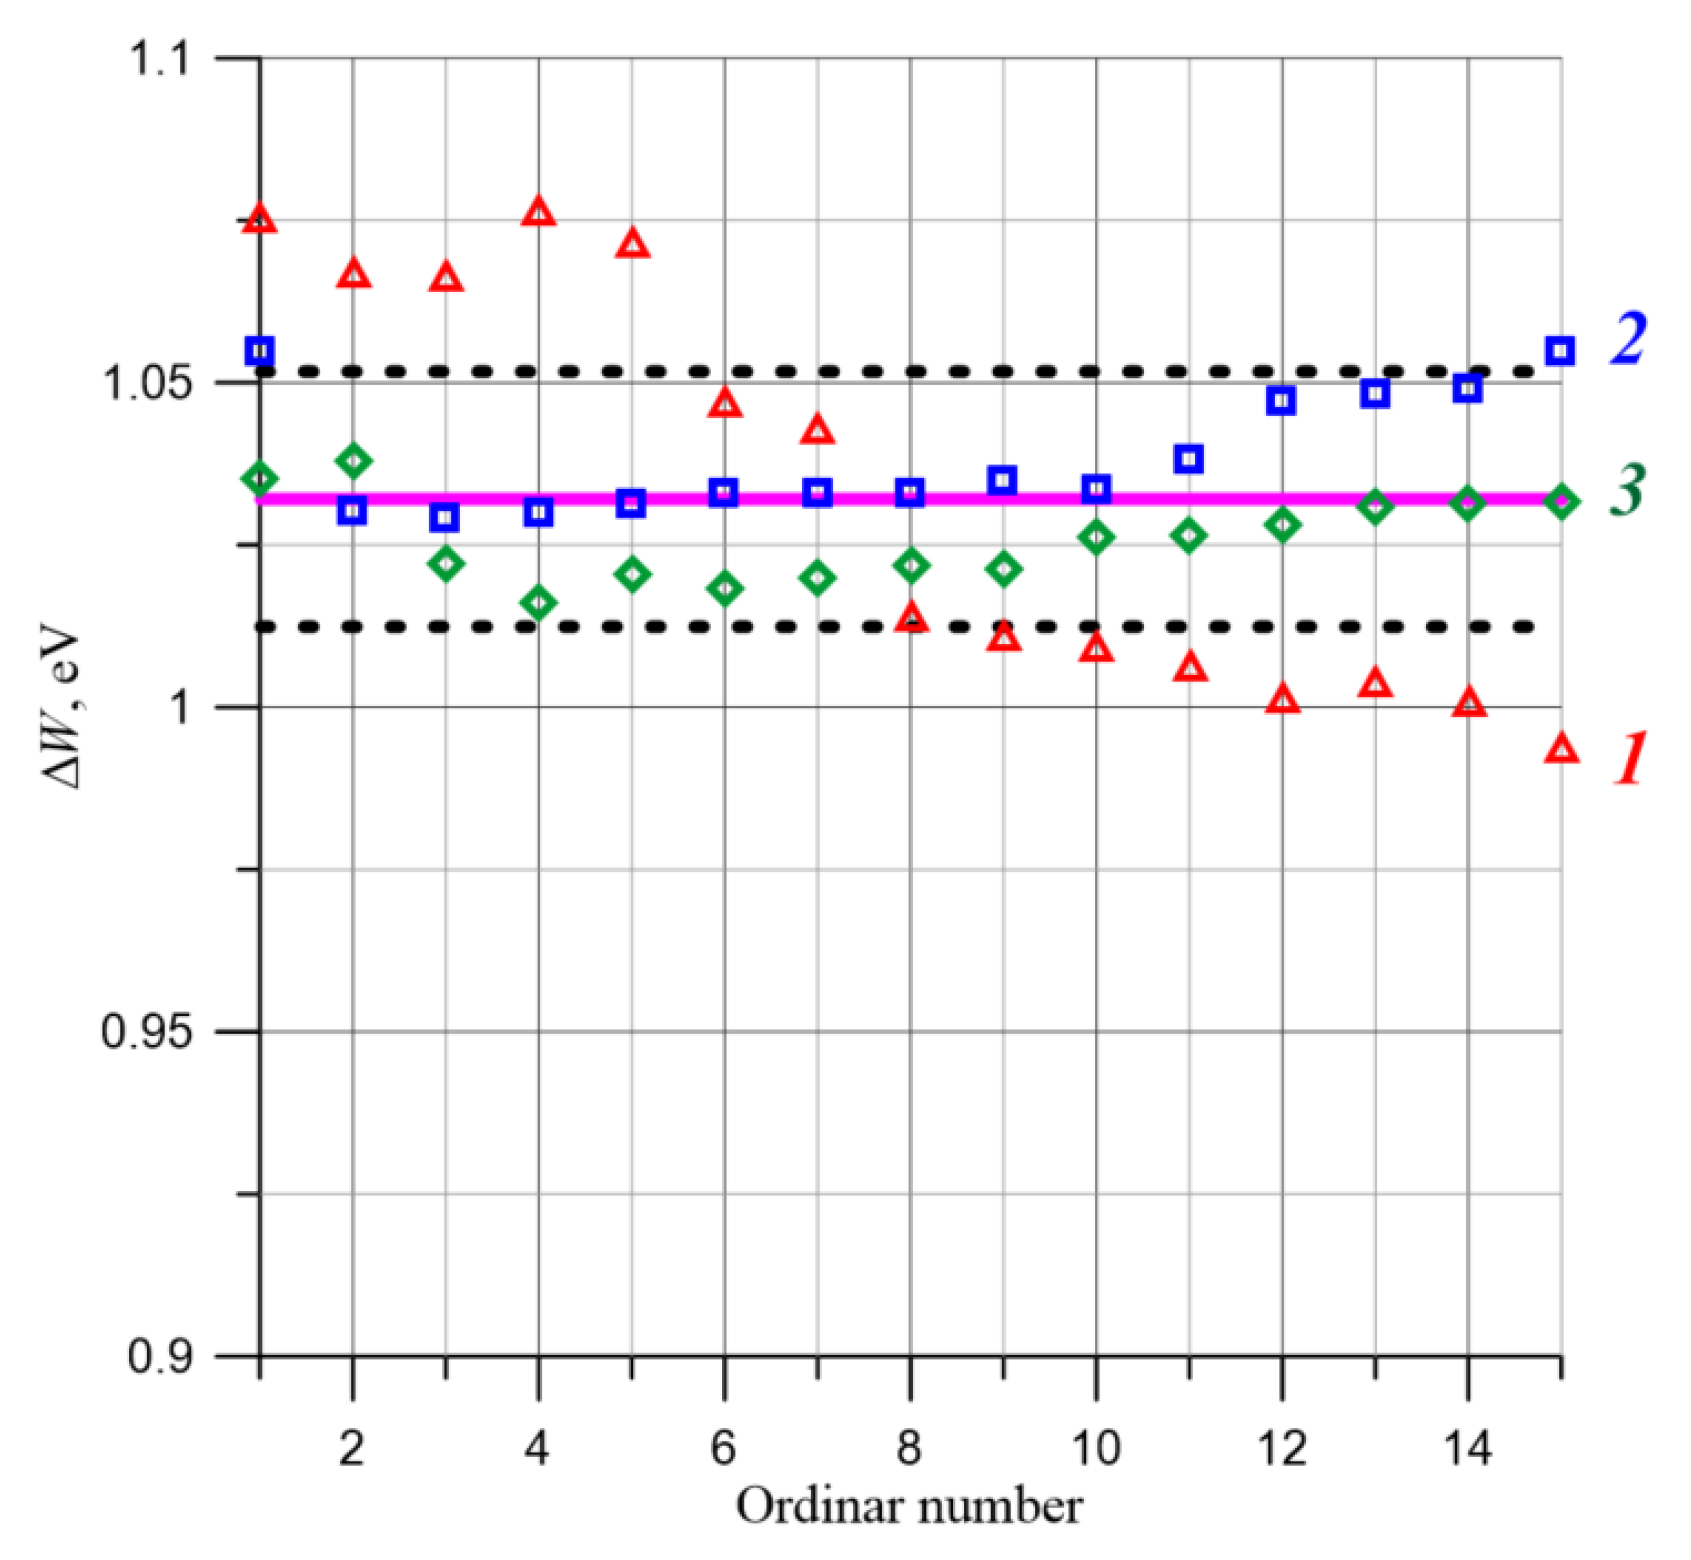
In
Figure 4, the relationship between the values of Δ
Wτϕi and the values of
φi, for which they were obtained, is shown. The average activation energy value and the average value ± standard deviation are plotted in the figure. In the area of lower
φi values, the activation energy values go beyond the range. This is due to the relatively large fluctuations for the lowest temperature, visible in
Figure 2. Additionally, as evident from
Figure 4, the activation energy values fall within the range determined by the standard deviation.
4. Studies of Temperature–Frequency Dependence of Admittance
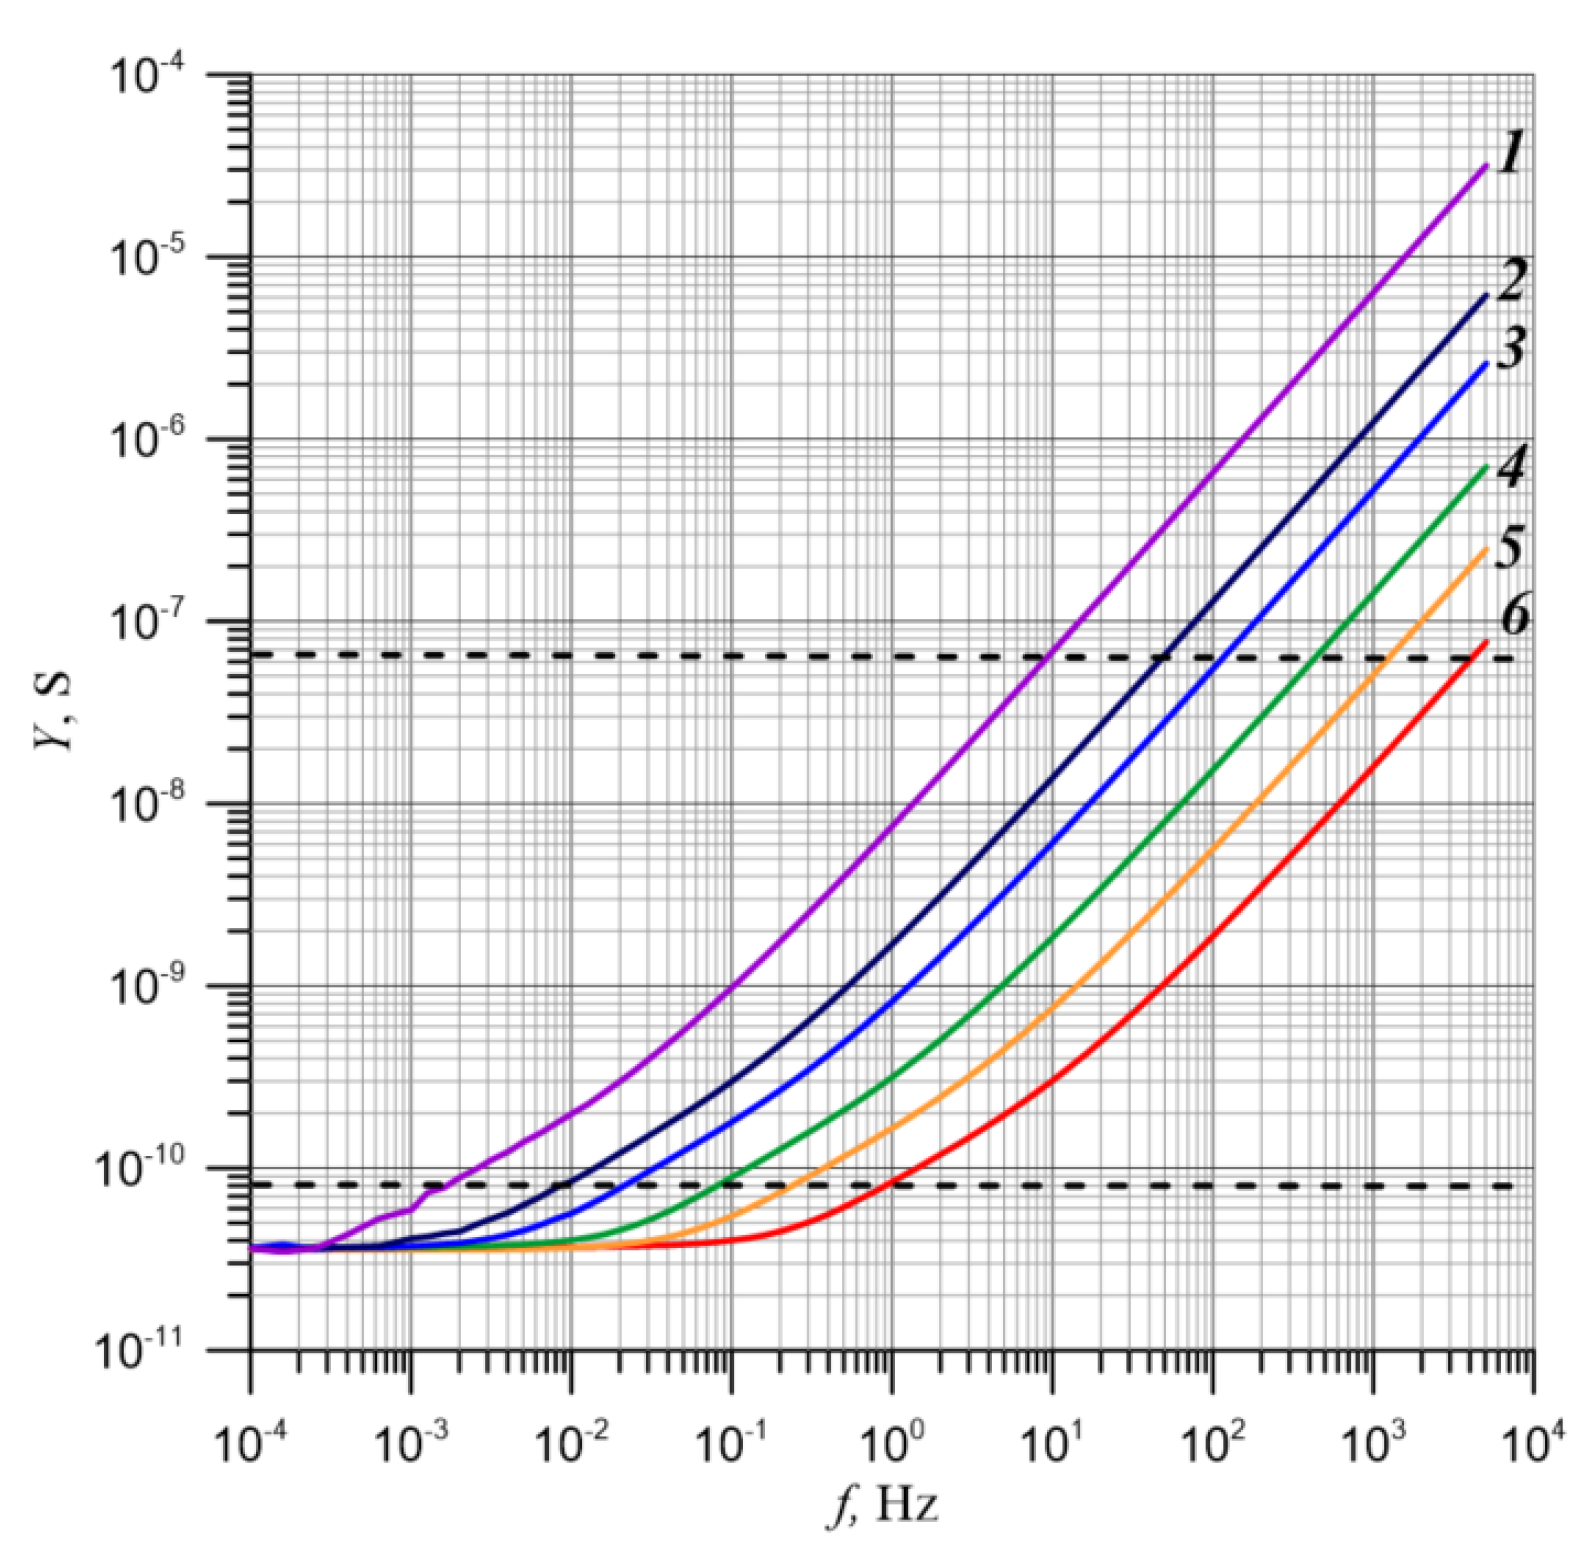
In
Figure 5, the experimental frequency dependencies of the cellulose–bio-oil–water nanoparticle composite with a 5% by weight water content are presented, determined at temperatures ranging from 293.15 K to 343.15 K with a step of 10 K.
The value of admittance primarily depends on the material parameters and the measurement frequency. The effect of the measurement temperature on the admittance value is determined using the activation energy of admittance and the activation energy of the admittance relaxation time [
35,
38].
When using double-logarithmic coordinates, the exponential relationship of the relaxation time to temperature, as determined by the activation energy of the admittance relaxation time, causes a shift in the curve along the
x-axis. Through the activation energy of admittance, there is a shift of the curve along the
y-axis. This means that the curve’s position is affected by both activation energies—the relaxation time of admittance and the admittance itself. Charge transfer in moistened composites of pressboard–insulating oil–moisture takes place via the quantum-mechanical phenomenon of electron tunneling [
39]. According to this mechanism, in the ultra-low frequency range, AC conductivity is equal to DC conductivity. This is evident from a flat segment of the curve in the ultra-low frequency range. This means that, in this frequency range, the relaxation time does not influence the conductivity value. As shown in
Figure 5, in the lowest frequency range, the admittance curve runs parallel to the
x-axis. This indicates that, in this range, the admittance value solely depends on the temperature. As temperature rises, the flat section moves along the
y-axis into higher values and is described by a known equation [
43]:
We observe this situation in
Figure 5 in the frequency range of approximately 10
−4 Hz and slightly higher.
Utilizing this observation, the Arrhenius plot was determined based on the admittance values at the frequency of 10
−4 Hz, from Equation (7), which is depicted in
Figure 6. The linear approximation of the experimental results is characterized by a determination coefficient of
R2 ≈ 0.9989, close to unity. This indicates that the activation energy of the admittance is temperature-independent, with its value being Δ
WY ≈ 1.024 eV. Using this value, the
Y(
f) curves were shifted along the
y-axis to the temperature of 293.15 K. The outcome of this operation is shown in
Figure 7.
From
Figure 7, it can be observed that in the low-frequency region, all the admittance curves have the same value, equal to the admittance for the temperature of 293.15 K. As the frequency increases, an increase in admittance is noted. What is characteristic is that the onset of its increase shifts to higher measurement frequencies with increasing temperature. This is related to the decrease in the relaxation time of admittance as the temperature rises, which can be described using Equation (4). To determine the values of the relaxation time of admittance for the curves presented in
Figure 7, 15 admittance values were selected from the range marked with horizontal lines, for which the occurrence frequencies were determined for each measurement temperature. Subsequently, using Equation (6), relative relaxation times of admittance were determined. Based on these, 15 Arrhenius plots were drawn, as shown in
Figure 8.
From
Figure 8, it is evident that each of the plots shows a linear relationship with a determination coefficient (
Table 1) close to unity. Based on this, 15 activation energies of the admittance relaxation time were determined, which are presented in
Table 1 and in
Figure 9. The value of the average activation energy of the admittance relaxation time, determined based on the data presented in
Table 1, is Δ
WτY ≈ (1.039 ± 0.0090).
In
Figure 9, the relationship between the activation energy of admittance relaxation time and admittance values is depicted, along with the average value and the average value ± standard deviation. As can be seen from
Figure 9, the activation energy values of admittance relaxation time fall within the range of the average value ± standard deviation, as listed in
Table 1.
The obtained activation energy of the admittance relaxation time was used to eliminate the influence of the relaxation time on the frequency characteristics of admittance in double logarithmic coordinates. To achieve this, we shift the
Y(
f) curves, obtained at temperatures
T ≥ 303.15 K, shown in
Figure 5, using the energy Δ
WτY, to the temperature of 293.15 K. The calculation results are presented in
Figure 10.
This allows for the elimination of the influence of the admittance relaxation time on the curves. The admittance values, shown in
Figure 10, depend solely on temperature. This enables the determination of the activation energy of the admittance Δ
WY over a wide frequency range. For this purpose, as shown in
Figure 10, a frequency range in which all six curves are located was selected and marked by vertical lines. Within this range, 15 frequency values were selected, for each of which the temperature dependence
Yi(
T) was determined. Subsequently, 15 Arrhenius curves were plotted (
Figure 11) from which 15 values of the activation energy of the admittance were determined; these are presented in
Table 1.
These values and the determination coefficients for each of the Arrhenius plots are presented in
Table 1. Based on the 15 values, the activation energy of the admittance ∆
WY was calculated to be approximately (1.026 ± 0.0063) eV.
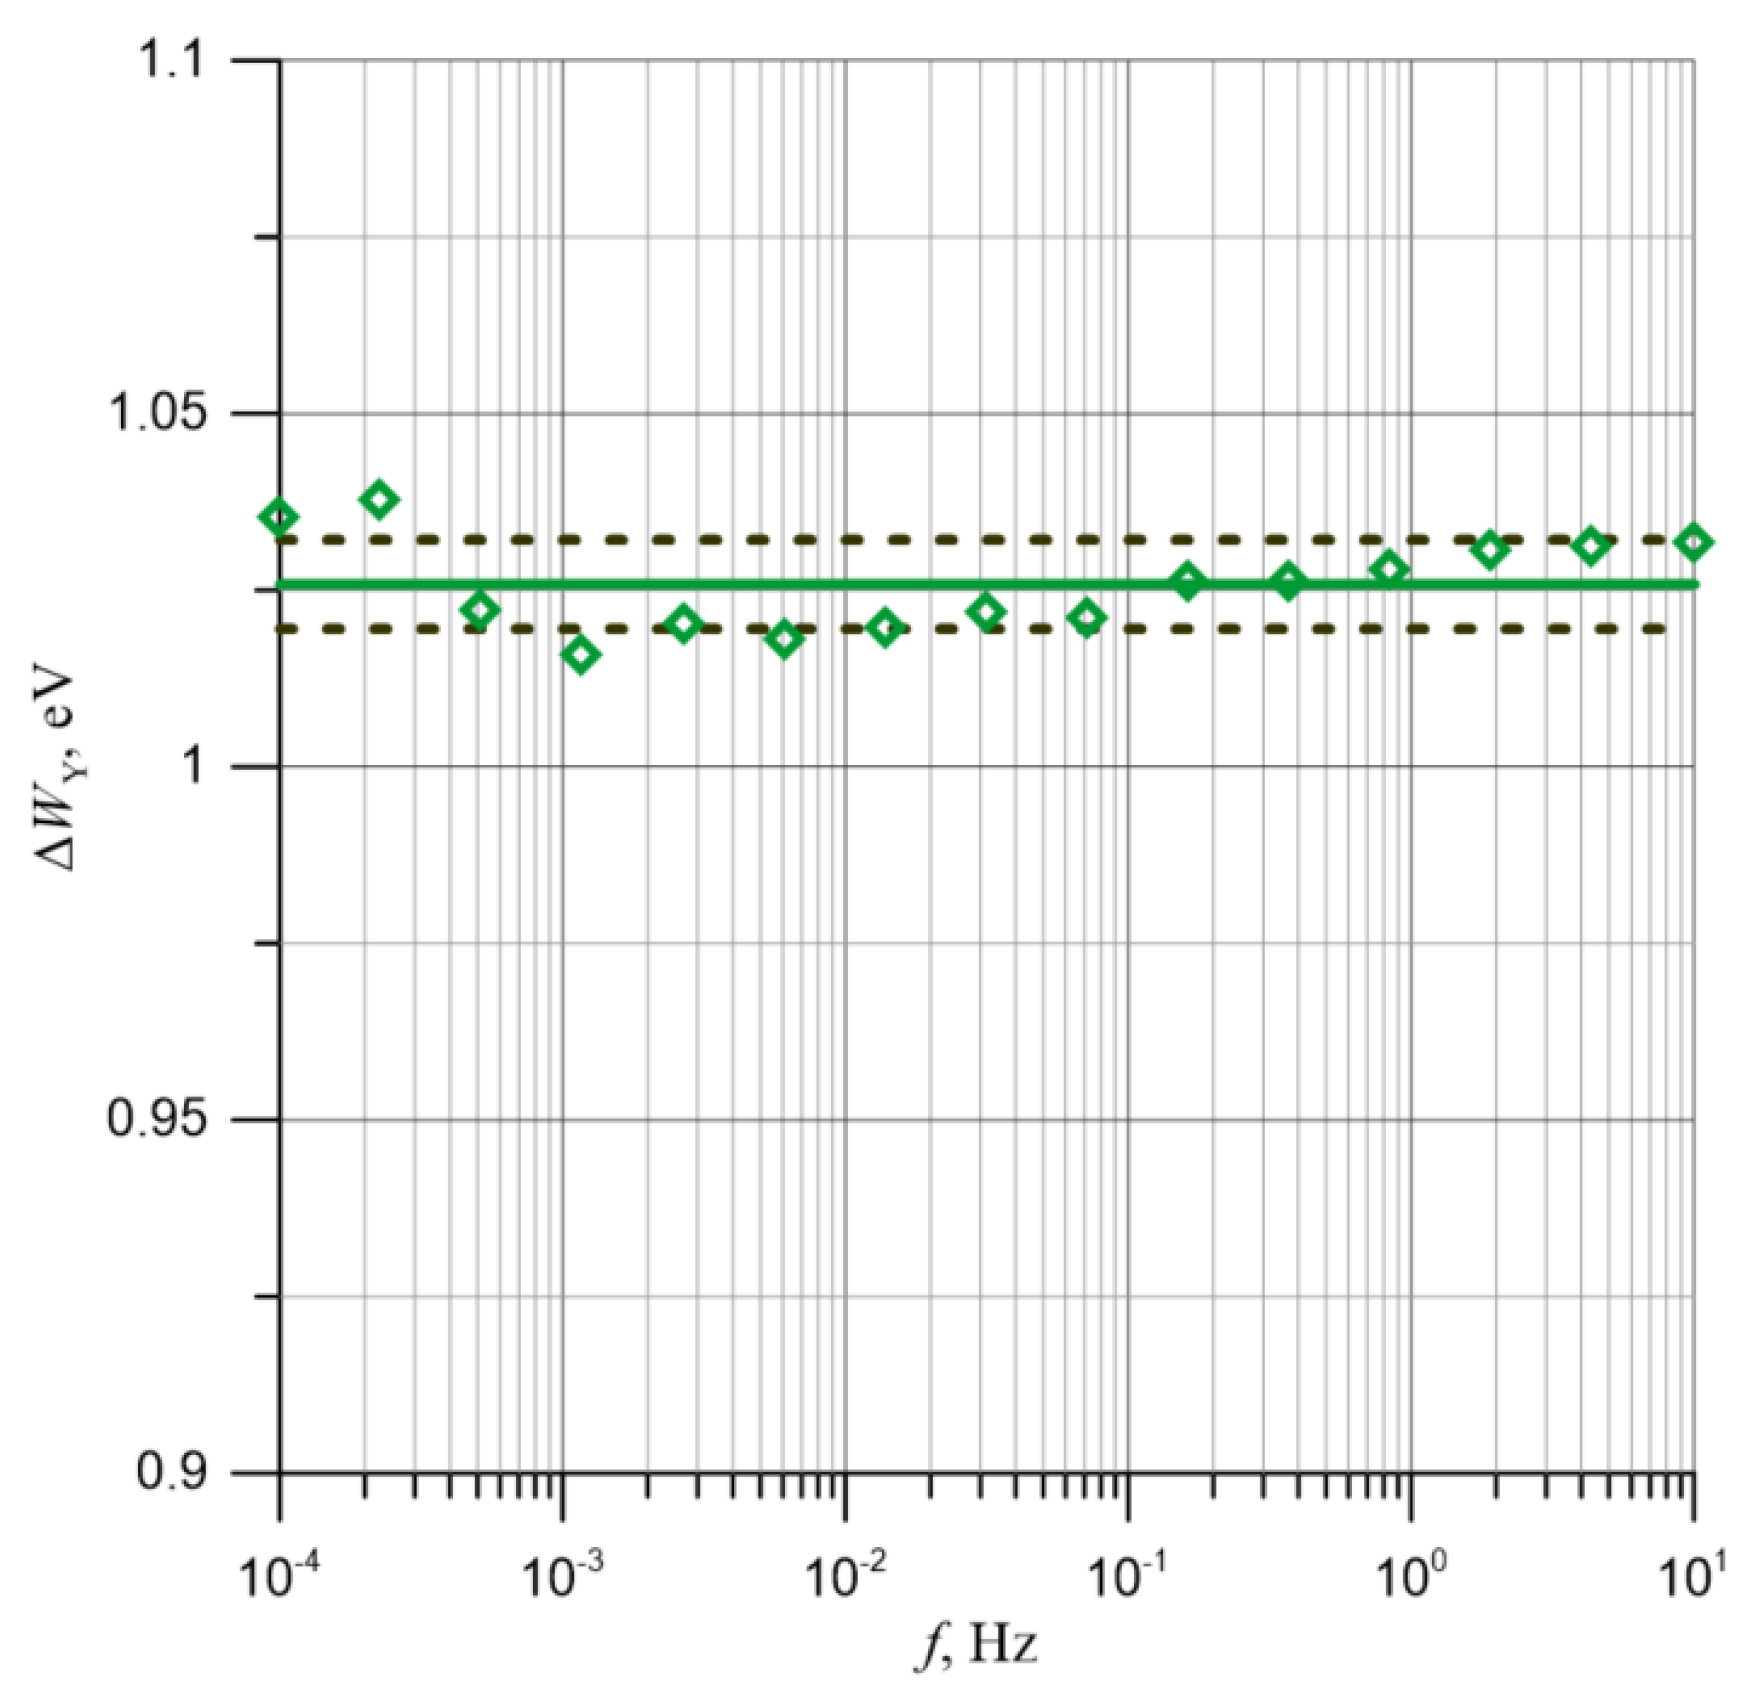
Figure 12 shows the values of the activation energy of the admittance ∆
WY, the average value, and the ranges of variation, determined using the average value ± the standard deviation. The figure indicates that ∆
WY is practically constant throughout the entire frequency measurement range.
5. Comparative Analysis of the Activation Energy of Fundamental AC Parameters for the Moistened Pressboard–Bio-Oil Composite Used in Power Transformer Insulation
In the previous chapter, 15 values of the activation energy for the phase shift angle relaxation time Δ
Wφ, the activation energy of the admittance relaxation time Δ
WτY, and the activation energy of the admittance ∆
WY were determined. A comparison of these values is presented in
Figure 13.
As can be seen, these values are close to each other within the uncertainty limits. Consequently, based on 45 values, a generalized activation energy was determined, with a value of ΔW ≈ (1.032 ± 0.0196) eV. The use of this generalized activation energy allows for the assessment of the temperature’s influence on both the phase shift angle and the admittance of the moisture-saturated pressboard impregnated with insulating oil.
In publication [
38], a generalized activation energy value for the phase shift angle and admittance for moistened pressboard, which was impregnated with synthetic ester, was determined to be Δ
W ≈ (0.793 ± 0.0453) eV. Similarly, in publication [
35], the generalized activation energy for moistened pressboard impregnated with mineral oil was determined to be Δ
W ≈ (0.8886 ± 0.0123) eV. By comparing the activation energy values for synthetic ester and mineral oil cases with the value obtained in this work for bio-oil, it is clear that the differences between these values significantly exceed the uncertainties of their measurements. This means, firstly, that when estimating moisture content in pressboard, the activation energy appropriate to the impregnating liquid should be applied. Secondly, it was absolutely justified for us to establish standard curves and a generalized activation energy for the case of pressboard impregnation with bio-oil.
The generalized activation energy Δ
W was used to recalculate the frequency dependencies of the phase shift angle and admittance obtained at different temperatures to the reference temperature of 293.15 K.
Figure 14 shows the recalculated curves of the phase shift angle.
From
Figure 14, it can be seen that minor differences occur only for the temperature of 293.15 K in the low-frequency range. This is related to the fact that in the phase shift angle curve at the temperature of 293.15 K (
Figure 2) in the frequency range below 5 × 10
−3 Hz, fluctuations appear due to relatively large measurement errors. However, the remaining curves perfectly overlap throughout the entire frequency range. This indicates that the shape of the frequency dependencies of the phase shift angle is independent of temperature.
In
Figure 15, frequency-dependent phase shift angles measured at a temperature of 333.15 K for samples with moisture content ranging from 1% by weight to 5% by weight are presented. From
Figure 15, it is evident that the shape of the frequency-dependent phase shift angles is influenced by the moisture content. In the plots for moisture contents of 1% by weight and 2% by weight, a single phase of reduction in values is observed. It is only for 3% by weight that two phases emerge—low and high frequency. This indicates that the shape of the phase shift angle plots is contingent upon the water content. Their positioning relative to the double-logarithmic coordinates is determined by the generalized activation energy and temperature.
The generalized activation energy was also used to adjust the admittance curves to the reference temperature of 293.15 K. For this purpose, the curves were first shifted along the
y-axis. The result of this adjustment is shown in
Figure 7. Subsequently, a calculation was performed to shift the curves along the
x-axis. The final result, obtained after two shifts, is presented in
Figure 16.
From
Figure 16, it can be observed that after the adjustments, all curves perfectly overlap. This implies that, similarly to the phase shift angle curves, the shape of the admittance curves depends on the moisture content in the pressboard–bio-oil composite. However, their position in relation to the double logarithmic coordinates is a function of the temperature dependence of admittance, determined by the generalized activation energy. The perfect overlap of both the phase shift angle curves (
Figure 14) and the admittance curves (
Figure 16) indicates that the generalized activation energy applied during the calculations accurately describes the temperature dependencies of the phase shift angle relaxation time, the relaxation time of admittance, and the value of admittance. This undoubtedly testifies to the charge transfer mechanism via electron tunneling between nanodroplets of water. If there were ionic transports in the material, as described, for instance, in [
43], the activation energies of the relaxation time and admittance should have significantly differed.
In this study, it was determined that in the composite of pressboard–bio-oil–moisture, the activation energy values of the phase shift angle relaxation time, the activation energy of the admittance relaxation time, and the activation energy of admittance are the same. This means that the remaining insulation parameters, which are derivatives of these parameters, namely the loss tangent, conductivity, and the real and imaginary components of complex permittivity, will also be described using the generalized activation energy determined in the study. This will allow for the development of methods to estimate the moisture content in the cellulose insulation of power transformers and to detect the critical moisture content, which is about 5% by weight. This will contribute to the elimination of the risk of catastrophic failure of power transformers associated with such a high moisture content.
6. Conclusions
In this study, the Frequency Domain Spectroscopy method was used to investigate the temperature–frequency dependencies of the fundamental parameters of a pressboard–bio-oil–moisture composite, namely the phase shift angle and admittance. These parameters are essential and sufficient for calculating other AC parameters of the insulating material, such as the loss tangent, the real and imaginary components of complex capacitance, conductance, as well as material parameters like conductivity and the real and imaginary components of complex permittivity.
Measurements were carried out from the highest to the lowest frequency. In the frequency range of 5000 Hz to 10−3 Hz, measurements were taken at 10 points per decade, and from 10−3 Hz to 10−4 Hz, 6 measurement points were taken. Measurements were carried out at temperatures ranging from 293.15 K to 343.15 K with a step of 10 K. The accuracy of temperature stabilization was less than ±0.05 K.
In the study, 15 Arrhenius plots were determined for various values of phase shift angles, from which the activation energy of the phase shift angles’ relaxation time was derived. Similarly, the activation energy values of the admittance relaxation time and the activation energy values of admittance were determined. It was established that all three values are the same within the bounds of uncertainty. Based on 45 values, the generalized activation energy was determined, with a value of ΔW ≈ (1.032 ± 0.0196) eV. The uncertainty of the generalized activation energy determination is very low, amounting to ±1.9%. Using the generalized activation energy value, phase shift angle curves determined for all temperatures were recalculated to 293.15 K. It was determined that after recalculating, all curves overlap perfectly. A similar operation was performed for the frequency-dependencies of admittance. In this case, too, the recalculated relations match perfectly. It was determined that the shape of the frequency-dependent curves of the phase shift angle and admittance depends solely on the moisture content in the composite of pressboard–bio-oil–water nanodroplets. The position of the curves in relation to the coordinate axes depends only on the temperature and is determined by the generalized activation energy. This implies that the other insulation parameters, which are derivatives of the phase shift angle and admittance, such as the loss tangent, conductivity, and the real and imaginary components of complex permittivity, are also described by the generalized activation energy. The use of the generalized activation energy identified in this study will allow for the development of precise methods to estimate the moisture content in the cellulose insulation of power transformers containing bio-oil. This will contribute to improving the accuracy of detecting critical moisture content, amounting to about 5% by weight, and eliminating the risk of catastrophic failure of power transformers associated with such high moisture content.


 ,
, 


