Article

Comprehensive Research on Construction and Stability of Horizontal-Well Cavity Natural Gas Storage in Thinly Bedded Salt Rocks in China

1
State Key Laboratory of Coal Mine Disaster Dynamics and Control, Chongqing University, Chongqing 400044, China
2
College of Mining, Liaoning Technical University, Fuxin 123000, China
3
Technology Innovation Center of Geohazards Automatic Monitoring, Ministry of Natural Resources, Chongqing Institute of Geology and Mineral Resources, Chongqing 401120, China
4
School of Metallurgy and Materials Engineering, Chongqing University of Science and Technology, Chongqing 401331, China
*
Author to whom correspondence should be addressed.
Energies 2023, 16(23), 7877; https://doi.org/10.3390/en16237877
Submission received: 19 October 2023 / Revised: 23 November 2023 / Accepted: 28 November 2023 / Published: 1 December 2023
(This article belongs to the Section D2: Electrochem: Batteries, Fuel Cells, Capacitors)

Abstract

:
This study aimed to overcome the difficulty of conducting the horizontal-well cavity leaching test in the field and to investigate the long-term stability of the horizontal-well salt-cavity natural gas storage. The simulation test design is combined with the similarity theory to study the cavity expansion characteristics and the influence law of cavity leaching parameters. Through the design of a rubber hose connection, an integrated closed test system for multi-stage horizontal-well cavity leaching and brine drainage was built. The test system also realises the repeatable backward movement of the injection well during the test. A similarity simulation of the test design was carried out, and the test platform was constructed to carry out multi-stage horizontal-well leaching tests with a nitrogen cushion. In the horizontal-well leaching tests with a nitrogen cushion, the influence laws of the well spacing, flow rate and liquid level position on cavity expansion were investigated. Based on the morphological characteristics of the horizontal-well cavity, a numerical model of the horizontal-well salt cavity was developed, which reflects the real cavity morphology leached in the test. The long-term stability of the horizontal-well salt-cavity natural gas storage under different internal pressures was investigated through numerical simulation.

1. Introduction

Natural gas is a low-carbon, environmentally friendly and high-quality clean energy source [1,2]. The natural gas consumption in China is expected to reach 600 billion m3 by 2035 and 670 billion m3 by 2050 [3,4]. However, China’s reliance on natural gas from abroad is high. The current reserve and peaking capacity in China’s gas storage system cannot meet the market demand for natural gas. Therefore, the construction of underground gas storage facilities should be massively expanded to ensure national energy security and residents’ quality of life [5,6].
Compared to other forms of natural gas storage, underground storage is safer, more economical and more secure than storage above ground. The most commonly used underground gas storage facilities include depleted oil storages, depleted gas reservoirs, aquifer gas storages, salt cavern gas storages and cavern gas storages. Aquifer gas storages have high exploration risks and require high geological conditions. The construction of a gas storage in depleted oil and gas storages requires a high level of ground handling requirements, and the amount of cushion gas used is large and cannot be fully recovered; thus, the construction of a cavern gas storage is large-scale and costly. Compared to other natural gas storage methods, salt rock resources are widely distributed and have large reserves. The low permeability of salt rock also means that natural gas leakage is extremely low and can be stored for a long time. Salt rock does not react with natural gas, so it is safe and stable, with little contamination. The injection and extraction efficiency is high, and the working gas volume is large, which is more advantageous for peak gas supply and flexible storage. The salt cavities formed after brine extraction and production are all gas storage resources that can be exploited and used. Compared with other natural gas storage facilities, salt rock is considered as the best underground natural gas storage site due to its low permeability, high ductility, creep properties and damage self-healing [7,8].
Unlike the thick salt beds and salt domes of Europe and the United States, China’s salt beds are mainly lacustrine sedimentary rocks. The geological characteristics of such layered salt rocks are thin and numerous salt layers, with salt layers often alternating with non-salt interbedded interlayers [9]. There are usually many difficulties in constructing vertical caverns in such formations using single-well leaching methods. For example, the height of the salt cavity is limited by the interlayers, and insoluble impurities accumulated at the bottom of the cavity congest the effective gas storage volume of the cavity [10,11]. In addition, there is the potential for the interlayers to collapse and cause shear damage to the casing [12,13,14]. Clearly, the horizontal-well cavity leaching technique is more suitable for the construction project of stratified salt rock natural gas storages in China.
However, the lateral span of the horizontal-well cavity is greater and there are more factors involved in the long-term stability of the salt-cavity natural gas storages [15,16]. Zhang et al. [17,18,19,20] investigated the stability of the surrounding rock of a horizontal-well natural gas storage. Li et al. [21,22] investigated the comparison of the safety and stability of cavities with different morphologies used to store different energy sources. Single-well and dual-well cavity leaching methods under the nitrogen cushion method have been studied [23,24,25]. Li et al. [26,27] studied the concentration field law and cavity expansion model of horizontal cavities and investigated the effects of well spacing and different cavity shapes on the horizontal-well cavity stability. Yang et al. [28] determined the characteristics of flow field zoning in horizontal wells. Nitrogen is used to replace the oil body to protect the cavity roof from dissolution during salt cavern construction [17,29]. Compared with the traditional oil cushion method, the nitrogen cushion method is more environmentally friendly and economical, and it does not pollute the brine. In addition, this technique makes the lateral span of the cavity top plate larger [30]. However, there are some limitations of the existing studies: (1) the influence law of a nitrogen cushion on cavity expansion and the control method of a nitrogen cushion in cavity leaching are unknown. (2) The experimental implementation of the multi-stage retreat control method for the horizontal-well cavity is difficult. (3) The cavity leaching process parameters directly affect the cavity morphology, which is critical to the safety of natural gas storage in the horizontal-well cavity. However, the existing stability studies of the horizontal-well cavity have not fully considered the actual cavity morphology of the horizontal-well cavity, and there is a discrepancy between the simulation calculation and the cavity morphology of the horizontal-well cavity formed during the actual dissolution.
To address the above problems, multi-stage nitrogen-cushion horizontal-well cavity leaching test exploration and simulation calculation were performed in this study, and the main research work is as follows: (1) calculation of similarity ratios and design of test parameters were carried out to realise the indoor test design of the horizontal-well cavity leaching simulation test; (2) we designed the rubber hose connection method and injection well setback method, realising the injection control of the nitrogen cushion and multi-stage setback of the injection well while ensuring the sealing, visibility and controllability of the leaching test; (3) we carried out multi-stage horizontal-well cavity leaching tests with nitrogen bedding. In conjunction with the expansion law of the cavity, we investigated the mechanism and mode of influence of leaching parameters in the horizontal-well cavity leaching test with a nitrogen cushion; (4) we established geological and numerical models that reflect the characteristics of the real cavity morphology, and we evaluated the stability in the long-term operation of the horizontal-well salt-cavity gas storage.

2. Horizontal-Well Cavity Leaching Test

Experimental studies that are difficult to perform in the field are usually carried out on small-scale models by means of similarity designs. Flow fields in model tests can be converted to prototype flows, and the prediction of phenomena in prototype flows can be achieved by observing the phenomenal characteristics of similar models designed for this purpose. The key to the similarity experimental design is to ensure that the model is similar to the prototype flow. Cavity leaching field tests in salt rock are time-consuming, costly and difficult when performing cavity measurements, making them difficult to perform.
Therefore, a cavity leaching test platform was designed based on the similarity theory. Simulation tests of horizontal-well cavity leaching with a nitrogen cushion were carried out in the laboratory to study the effects of cavity leaching parameters on the morphology, flow field and concentration field of the horizontal-well cavity and to optimize the cavity leaching technology.
Key control points for conducting similar horizontal-well cavity leaching tests include the following: similarity design and experimental design, design of rubber hose connections that can ensure tightness and design of repeatable injection port setback methods. The similarity design, preparation and control procedures for the horizontal-well cavity leaching test are described below.

2.1. Similarity Simulation Test Design

The implementation and design of similarity simulation tests is based on similarity theory. Similarity simulation tests are performed by designing a similarity model that reflects certain characteristics of the field prototype. The general steps of similarity design are as follows: 1. determine the problem and phenomenon to be investigated; 2. find out the variables therein and write the corresponding measures; 3. determine the basic measures; 4. determine the reference variables; and 5. calculate the dimensionless coefficients and obtain the equations in a dimensionless form.
The relationship between the field prototype and the test model is established through a ‘dimensional analysis’. Geometry l, dissolution time t, salt rock density ρ, dissolution rate ω, brine concentration c, temperature T and injection flow rate q are selected as key parameters based on the practical experience of cavity leaching technology in salt rock. The measures of these seven parameters are listed in Table 1.
There are four fundamental measures L, M, T and Θ in the key parameters. L is a length metric, T is a time metric, M is a mass metric and Θ is a temperature metric. According to the second similarity theorem, the system has three similarity criteria. L, t, ω, and T are chosen as the basic physical quantities, and the other three physical quantities can be expressed in terms of basic physical quantities. The physical quantity to be determined in this test is the water injection flow rate, which can be expressed as:
q = l α t β ω λ T γ
L α T β ( M L 2 T 1 ) λ Θ γ = L α 2 λ T β λ M λ Θ γ = L 3 T 1
α 2 λ = 3 , β λ = 1 , λ = 0 , γ = 0
The equality of measures at both ends of Equation (2) leads to α = 3, β = −1, λ = 0, γ = 0. Substituting these values into Equation (1) yields q = l 3 t 1 , and the π term associated with q is:
π q = q t l 3
The same method can be used to calculate the π terms associated with ρ and c, respectively, as:
ρ = l 1 t ω π ρ = ρ l t ω
c = l 1 t ω π c = l c t ω
lp denotes the prototype size, and lm denotes the model size. The geometric similarity ratio Kl can be expressed as:
K l = l p l m
The similarity ratios for the other six key parameters are as follows.
K q = q p q m ,   K ρ = ρ p ρ m ,   K t = t p t m ,   K c = c p c m ,   K ω = ω p ω m
Substituting all the similarity ratios into Equations (4)–(6) yields the following relationship between the similarity ratios:
K q K t K l 3 = 1 ,   K ρ K l K t K ω = 1 ,   K l K c K t K ω = 1
After determining Kl, Kρ and Kω, the rest of the similarity ratios are calculated sequentially according to Equation (9), and each similarity ratio is listed in Table 2.

2.2. Experiments Design

2.2.1. Test Procedure

Simulation tests of horizontal-well cavity leaching with a nitrogen cushion were carried out on salt bricks. The test platform is shown in Figure 1. The main material component of a salt brick is salt rock (NaCl), and the salt minerals coexisting with the salt rock are CaSO4·2H2O, CaSO4, Na2Ca(SO4)3, NaSO4·2H2O, NaSO4, SrSO4, CaCO3, CaMg(CO3)2, KCl, MgCl2·KCl·6H2O, K2Ca2Mg(SO4)4·2H2O, and 2Na2CO3NaHCO3·2H2O. The size of the salt brick used in the test was 600 mm × 200 mm × 200 mm, and the spacing between the straight well and the inclined well was 300 mm. The depth of the starting point of the inclination was 138 mm below the upper surface, and the size of the cavity surface was 600 mm × 200 mm. The bottom of the cavity was reserved as the protective layer with a thickness of 15 mm. The dimensions and connection methods of pipes and rubber hoses are shown in Table 3. Rubber hose 1# is used as the water injection tube. When the position of the water injection port needs to be moved back, the rubber hose 2# is pushed down so that it no longer wraps around rubber hose 1#, and rubber hose 1# can, therefore, be pulled back to achieve backward control of the position of the water injection port; then, rubber hose 2# is pushed back up to wrap around the casing and the water injection hose (rubber hose 1#) at the same time, and the test platform is again restored to its airtightness. The steps for the constructing of the cavity leaching platform are as follows:
  • Select a salt brick with few impurities and no obvious cracks, clean the surface and absorb the moisture. A uniform surface is selected as the front face, and the surface is hand polished to meet the flatness requirements of the test.
  • Lay the salt block flat with the selected face upwards, and mark the slot position on the cavity surface with a line. Drill a slot with a 6 mm diameter drill bit at the slot position on the cavity surface so that the slot width is the same, approximately 15 mm, with the top of the slot being slightly wider. A thinner layer of clear epoxy adhesive is applied evenly around the slots of the cavity surface and covered with a transparent plastic paper for sealing and bonding. It is necessary to control the dosage when applying the thin layer of adhesive to prevent the colloid from entering the slot. After slotting and sealing, due to the fluidity of the adhesive, it is necessary to keep the surface of the slotting cavity placed horizontally and wait for the epoxy resin adhesive to dry in order to avoid displacement of the adhesive before drying.
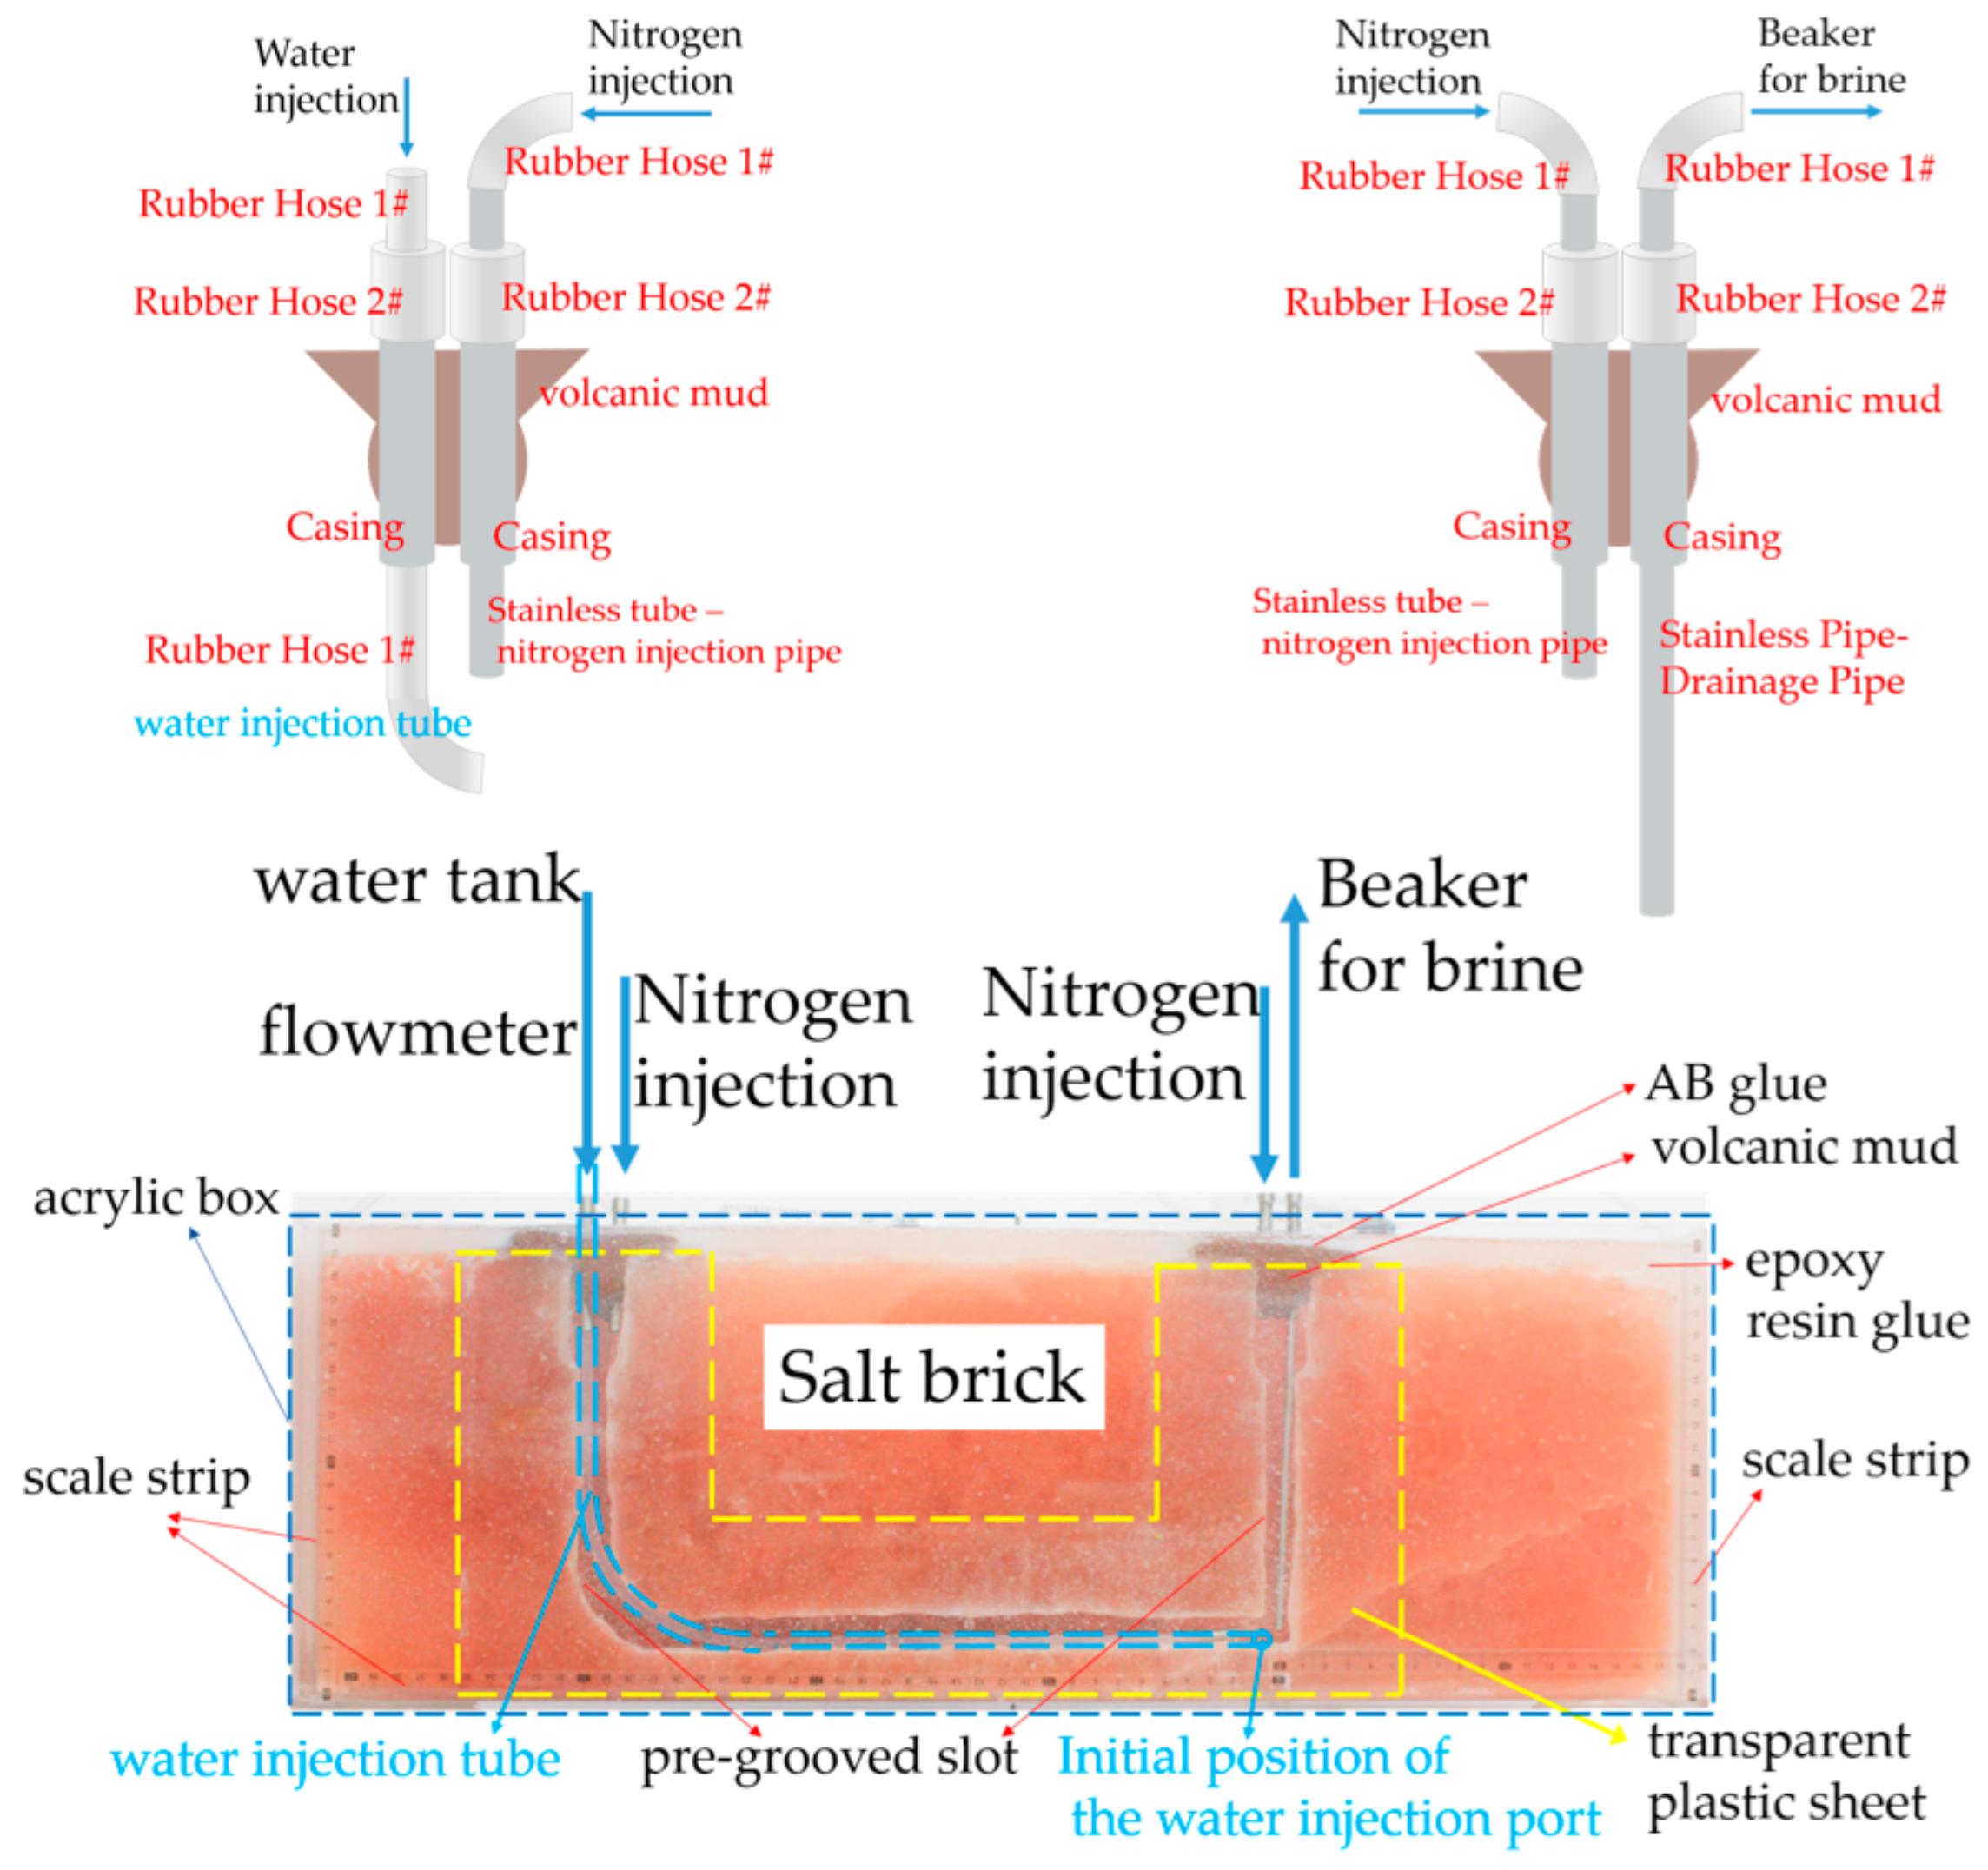
  • The salt brick cavity face is erected, the side-by-side casing and gas tubing are secured with volcanic mud, the casing tube is inserted into the upper end of the wellhead, and the upper surface of the volcanic mud is covered with a layer of AB adhesive to further seal the wellhead.
  • Place the salt brick as a whole into the transparent acrylic box. The length, width and height of the internal dimensions of the acrylic are 1 cm more than the length, width and height of the salt brick, and the thickness of the acrylic plate is 5 mm. After placing the salt brick, adjust the position of the salt brick so that it is roughly in the centre and the cavity surface is parallel to the acrylic box. Pour in a well-mixed clear epoxy resin adhesive from the top, filling the gap between the salt brick and the box to complete the overall seal. Glue scale strips to both sides and underneath the front of the acrylic box. After the adhesive has solidified, place the salt brick on a horizontal table with a high load-bearing capacity. Connect the water tank, flow meter and water injection tubes in turn with rubber hoses and place the end port of the drainage pipe in a beaker. Check and confirm the sealing of the connections and the test system. After opening the water tank valve and setting the flow meter to the design flow rate, the appropriate test can be carried out according to the design test parameters.
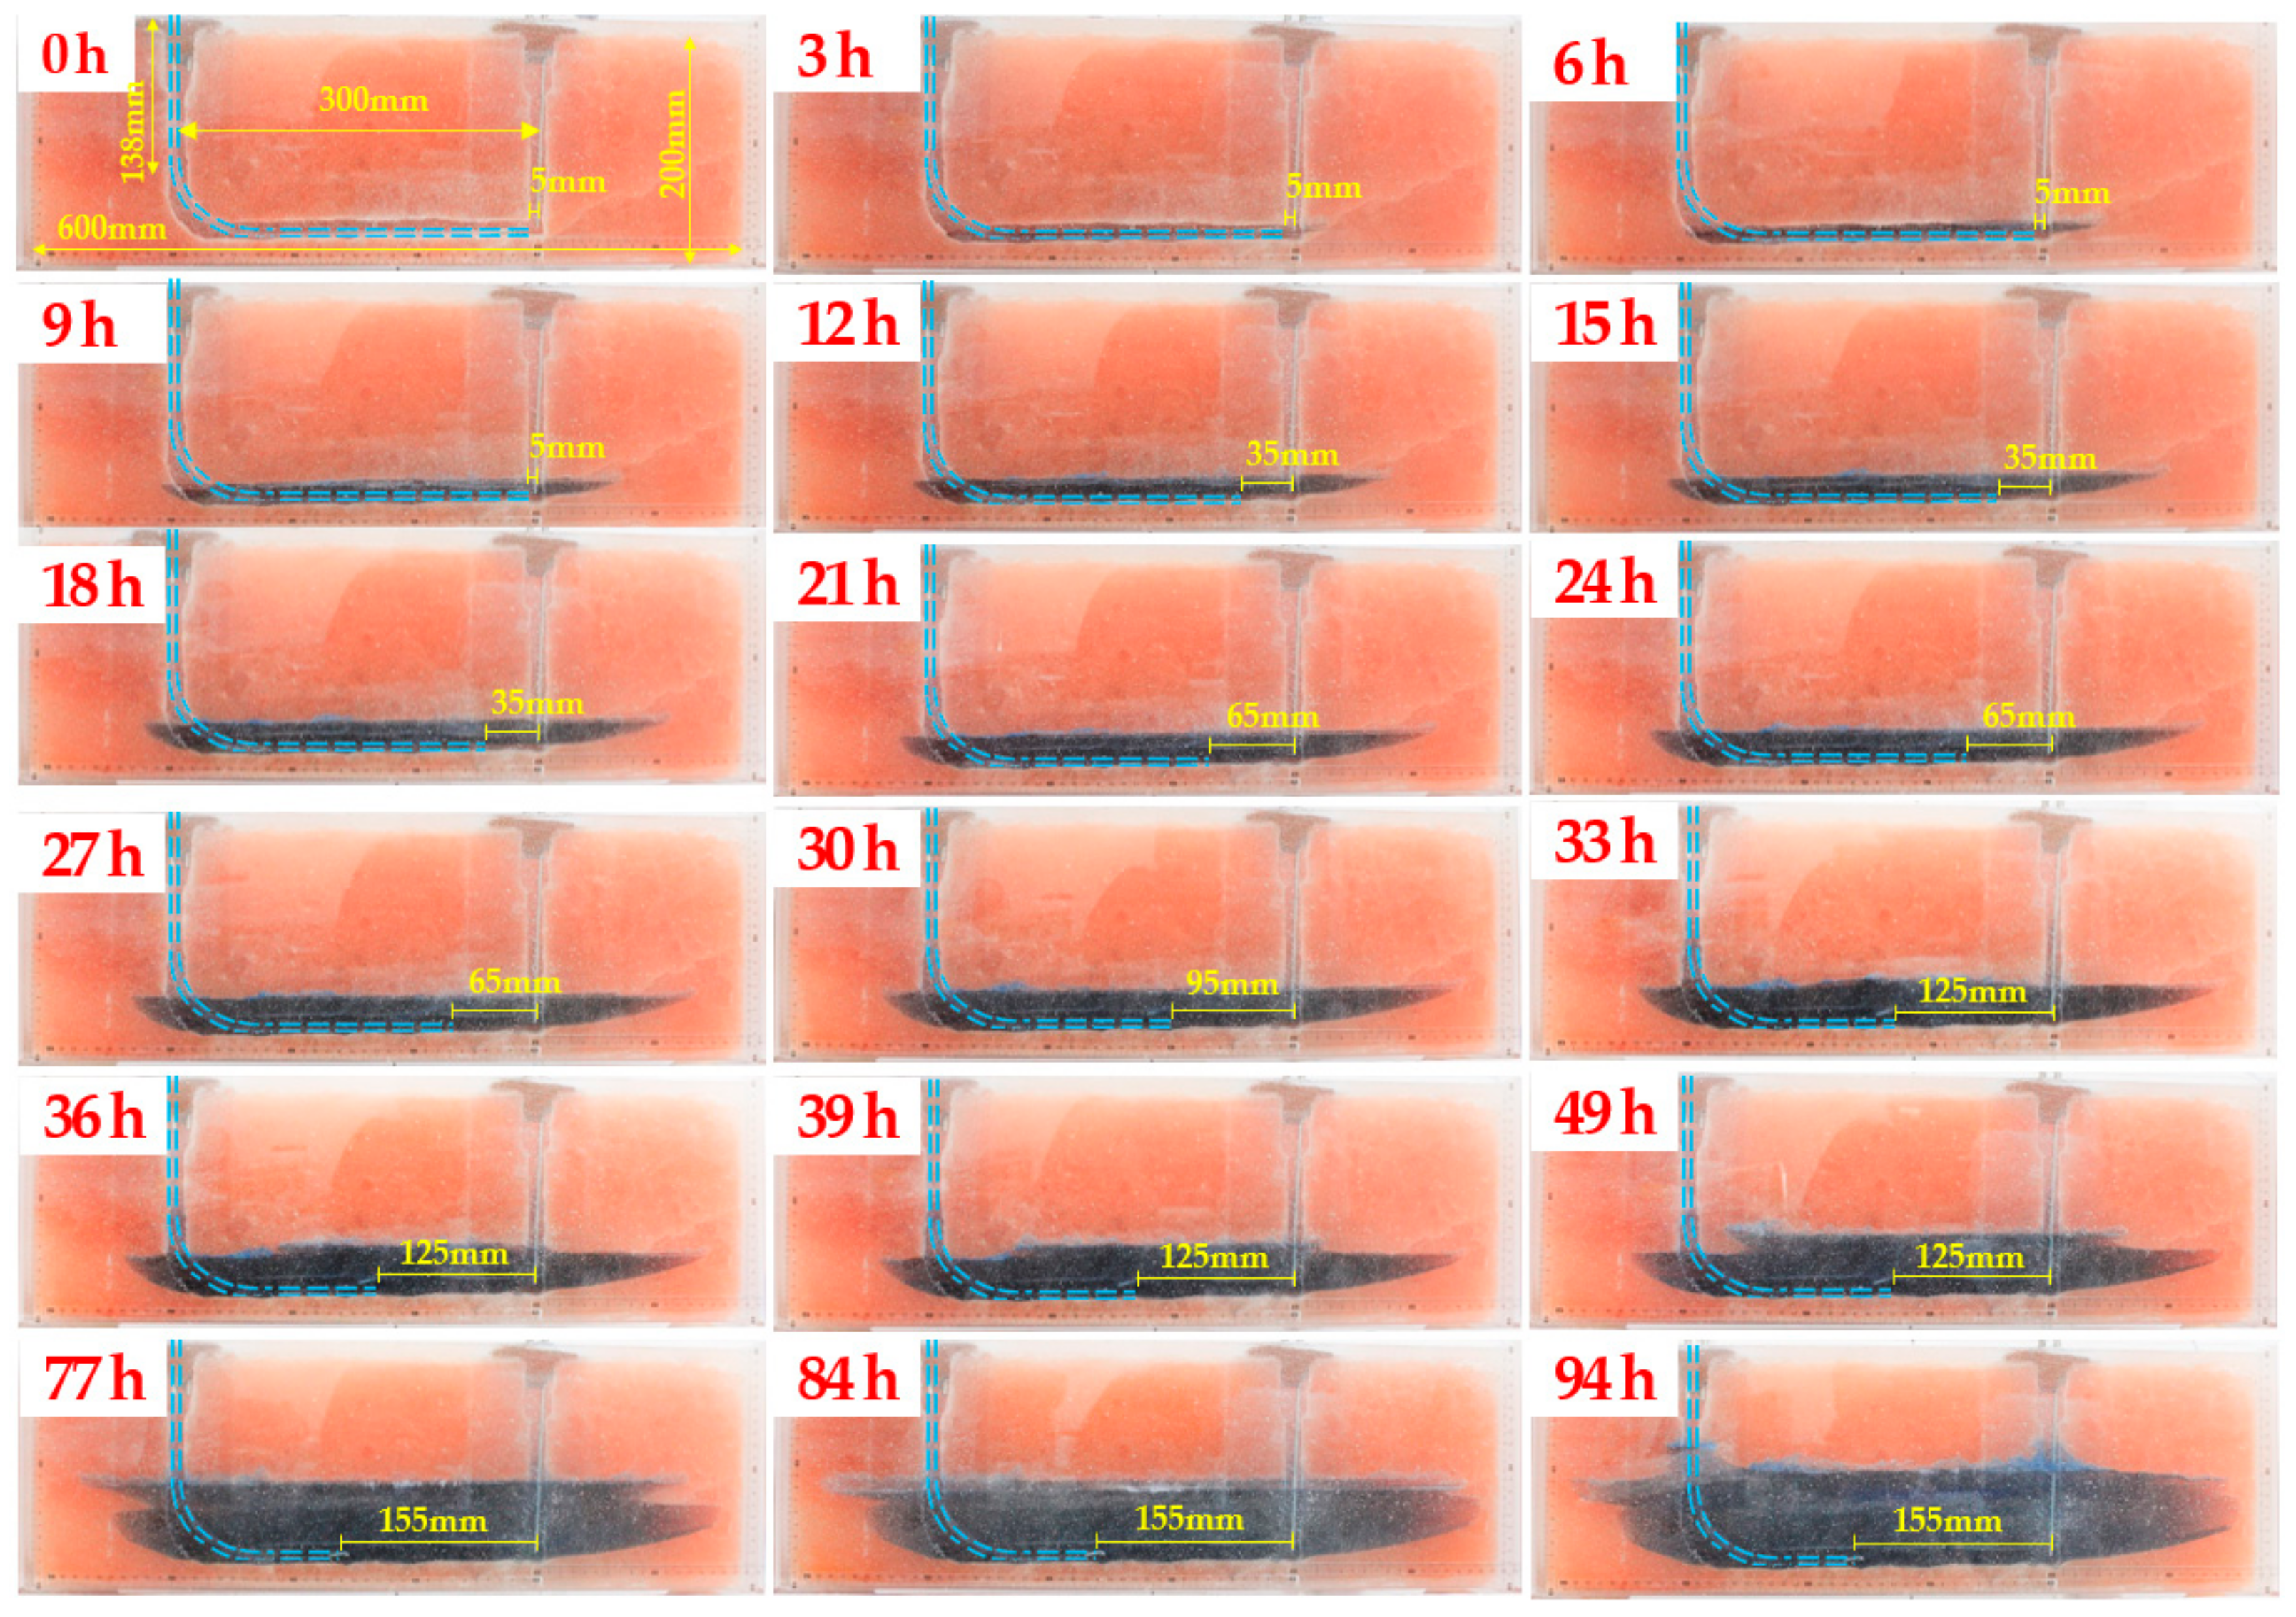
  • After the start of the test, the brine concentration and the brine volume at the brine discharge port are measured every 10 min, and the shape of the cavity at this time is recorded using a video camera; after the concentration is stabilized, the measuring interval is changed to 30 min; after the completion of a certain stage of the cavity leaching phase, the position of the water injection pipe, the drainage pipe and the liquid level are adjusted according to the test program, and the next cavity leaching phase is carried out.
By adjusting and controlling of the flow meter, dyed fresh water is injected into the cavity to dissolve the salt rock. As the cavity is well sealed, the brine in the cavity can be gradually discharged through the drainage well. The sealing of the test system is ensured by matching the tube diameters (Table 3). Flow rate control in the leaching process can be achieved by selecting flow meters with different ranges, and the test process can be controlled and repeated.

2.2.2. Horizontal-Well Cavity Leaching Test with Nitrogen Cushion in Large-Size Salt Rock

Due to the faster dissolution of the cavity wall near the water injection port, the right side of the cavity dissolves faster in the early stage, and the left side of the cavity dissolves faster in the later stage. To dissolve a more symmetrical cavity on both sides of the cavity, the position of the water injection port must be gradually moved back in stages to achieve a segmental dissolution of the salt rock. As the cavity volume gradually increases with dissolution, the flow rate should be increased accordingly to improve dissolution efficiency, and the flow rate will also affect the dissolution rate of the cavity. Under the situation that the injection port position is gradually receding and the flow rate is not fixed, how to adjust the position of the gas-liquid interface and form a regular and symmetrical cavity through the receding control, flow rate control and nitrogen cushion control is the key point of experimental research; meanwhile, how to ensure the dissolving efficiency of the horizontal-well cavity and improve the utilisation rate of the injected water are the main research contents of the experimental study on horizontal-well cavity leaching with nitrogen cushion in large-size salt rock.
The flow rate of 3 mL/min in the test corresponds to the flow rate of 15 m3/h in the field. During the cavity leaching process, the brine drainage well is always located at the bottom of the cavity, and the cavity is created using the reverse cycle cavity leaching method. The injection well is retreated at a distance of 30 mm each time. The dissolution of the lower part of the cavity is gradually controlled and promoted by injecting nitrogen to lower the liquid level layer by layer. After observing the expansion of the cavity, the water injection flow rate is adjusted, and the setback of the injection port position is carried out. Three sets of cavity leaching tests with nitrogen cushion were carried out in large-size salt rock bricks, one of which was analysed as a representative test, and the stages of the cavity dissolution process in this representative test are shown in Table 4 below.

2.3. Analysis of Test Results

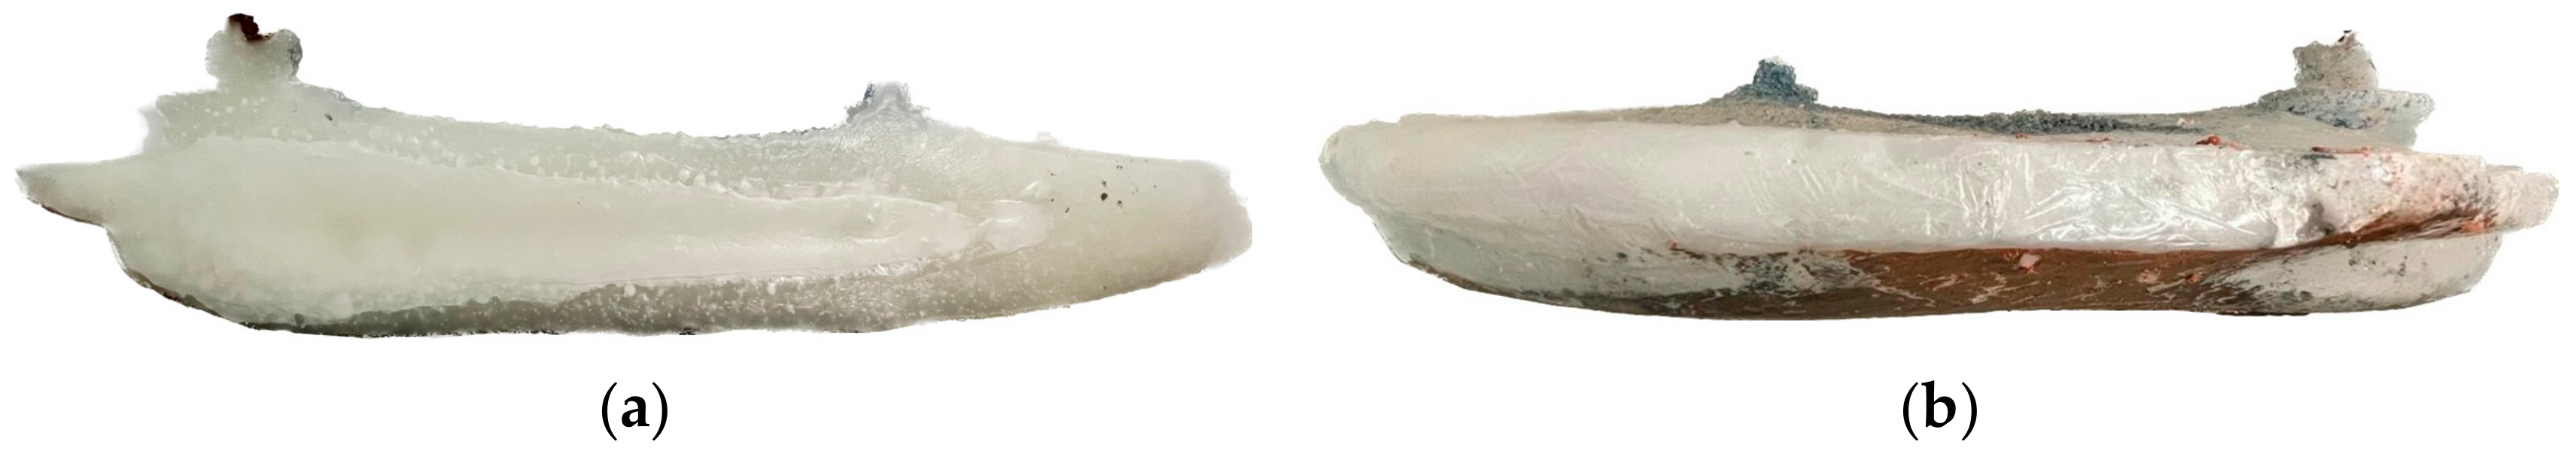
  • Extension of cavity morphology
The expansion process of the horizontal-well cavity is shown in Figure 2. With the increase in flow rate and liquid level, the cavity morphology gradually expands upward and to both sides. The cavity expansion characteristics in each stage are simultaneously affected by the flow rate, wellhead position and liquid level position at the same time. At stage 1, the fastest dissolution rate is observed on both sides of the cavity with the highest brine level due to the effect of brine concentration stratification. The dissolution rate on the right side is significantly higher than that on the left side because the water injection port is closer to the right side. In the third stage, the upward dissolution rate of the right horizontal trough is significantly faster than that of the left horizontal trough due to the influence of the position of the water inlet. In the later stages, dissolution occurs at the top of the right-side slot, so that the top wall of the cavity is above the liquid surface, while dissolution continues above the left-side slot, where the liquid surface is in close contact with the cavity wall. At stage 4, the increase in well spacing promotes dissolution in the upper wall of the left horizontal-well cavity, but the rate of dissolution differs between the two sides of the horizontal-well cavity, so that the right side of the upper wall of the horizontal-well cavity appears to be inclined at an angle to the left side. At stage 5, the dissolution surface of the upper wall of the horizontal-well cavity is still high on the right side and low on the left side, but there is no obvious inclined surface on the left-right transition surface, showing a relatively smooth transition.
At stage 6, the liquid surface appears slightly raised after the flow rate is increased, and the right liquid surface is still separated from the upper wall of the cavity by about 2 mm, and the entire liquid surface shows segments. At stage 7, the left liquid surface remains close to the left horizontal upper wall and dissolves upwards to form a very small space of dissolved bubbles, which float above the liquid surface, are close to the cavity wall, and continue to dissolve upwards to form an irregular upper dissolved surface. At stage 8, the liquid level rises slightly as the flow rate is increased, and the left side still maintains a certain width (about 45 mm) of the brine surface in direct contact with the upper wall of the cavity. The right boundary of the brine on the right side of the straight well is separated from the upper wall of the cavity, with a wider lateral extension on the right side at different brine heights. At stage 9, the liquid level rises again, partly in direct contact with the upper wall of the cavity and partly separated. At stage 10, the air pressure at the two ends is different due to the disjunction of the two sides of the cavity. The injection port is close to the right side, so the liquid level on the right side rises faster, the pressure is higher, and the dissolution is faster; whereas, the left side is farther away from the brine discharge well, and a space is created in the dissolution, leading to a decrease in pressure, so there is a large pressure difference between the inclined well and the end of the straight well.
At the 11th stage, the entire liquid surface is still in a left-high-right-low situation. The central part of the cavity dissolves the widest, while the left and right edges of the cavity have no obvious lateral expansion, and, thus, the central part of the cavity appears to have an obvious upward convex shape. At the 12th stage, the central bulge of the cavity gradually widens, and the transition surface of both sides gradually narrows. The highest part of the cavity wall and the widest part of the cavity morphology by the curved surface of the bulge transition to an isosceles trapezoid, and they are finally expanded to close to the rectangle. At the 13th stage, the flow rate increases, the highest liquid surface in the cavity is still in close contact with the upper wall of the cavity, which continues to dissolve upward, but the depth of dissolution inside the cavity is shallow. At stage 14, due to the rapid expansion at the highest liquid level, the transition region on both sides is changed from a sloping transition to an upper-wide and lower-narrow pattern. At stage 15, the highest liquid level continues to expand laterally while dissolving upwards. The gap between the lateral width at the highest level and the widest part of the cavity decreases due to the subsequent air connection between the ends of the two wells. At stage 16, because the injection port remained at a distance of 155 mm from the drainage well for a long time, the backside of the salt brick dissolved through at this stage, i.e., the depth of internal dissolution had exceeded the thickness of the salt brick. At stage 17, the liquid level gradually decreases with dissolution. Dissolution is wider in the lower part of the trough, fastest and deepest at the top of the central part of the cavity, and slower on the left side of the inclined well trough.
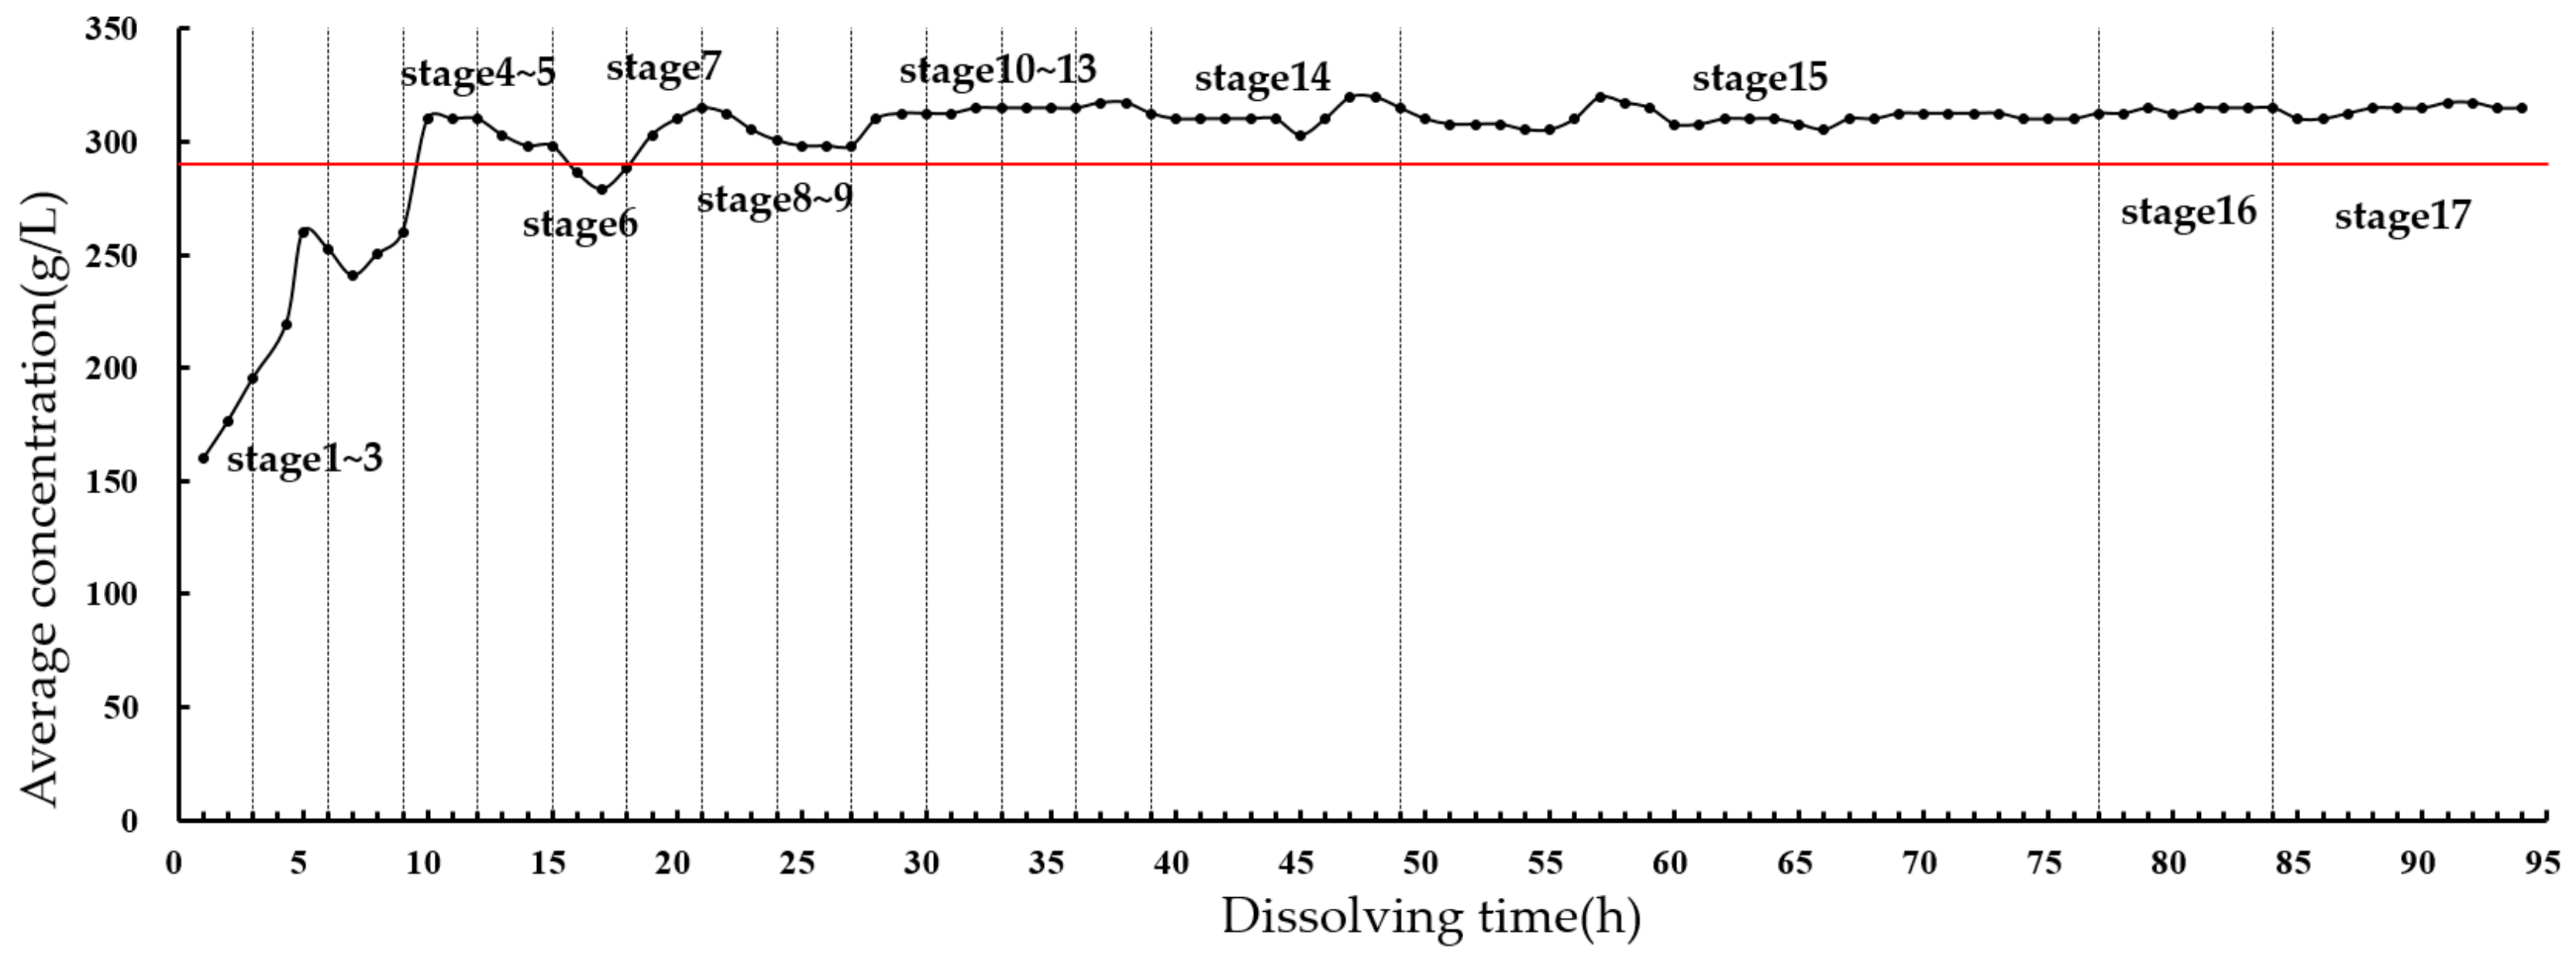
  • Brine discharge concentration
The main component of the discharged brine is a solution of a mixture of soluble salts. The main ions in brine are Na+, K+, Ca2+, Mg2+, Br, SO42− and Cl. The concentration of NaCl was measured in the test, and Figure 3 shows the curve of NaCl concentration versus time. During stages 1–3, the brine concentration increased gradually with dissolution. The average brine concentration for stages 1–3 was 236.1 g/L. At stages 4–6, the brine concentration increased significantly when the well spacing was increased to 35 mm. The average brine concentration for stages 4–6 was 294.1 g/L. At stages 7–9, the brine concentration first increased with flow rate and then decreased when the well spacing was increased to 65 mm. The average brine concentration for stages 7–9 was 302.9 g/L. At stage 10, the brine concentration remained high when the well spacing was reduced to 95 mm. At stages 11–13, the brine concentration increased steadily at a well spacing of 125 mm. The average brine concentration at stages 11–13 was 314.9 g/L. At stage 14, the flow rate was increased from 9 mL/min to 12 mL/min, but the brine concentration was minimally affected by the increase in flow rate, and the average brine concentration at stage 14 was 314.0 g/L. The average brine concentration at stage 14 was 314.0 g/L. Stages 15–17 had a well spacing of 155 mm and the brine concentration remained consistently high. At stage 17, when the flow rate was increased from 12 to 15 mL/min, the brine concentration was minimally affected and remained at a high level.
The well spacing at stages 1–3, 4–6 and 7–9 was 5, 35 and 65 mm, respectively, and the flow rate was increased from 3 mL/min to 6 mL/min and 9 mL/min, respectively A comparison of these stages shows that the brine discharge concentration is more affected by the increase in flow rate when the well spacing is small and the cavity volume is small. The smaller the cavity volume and the smaller the well spacing, the more the brine concentration is affected by the flow rate. As the well spacing increases, the range of influence of clear water gradually increases, and the increase in dissolved area and dissolution rate can lead to a significant increase in brine discharge concentration. A comparison of the changes in brine concentration from stages 3–4, stages 6–7, stages 9–10 and stages 10–11 shows that the incremental increase in brine concentration with increasing well spacing is progressively smaller. At stages 11–13, the well spacing was maintained at 125 mm, and the flow rate was gradually increased from 3 mL/min to 6 mL/min and 9 mL/min, but the brine concentration did not change significantly and did not decrease with the increase in flow rate. The effects of well spacing and flow rate on brine discharge concentration also gradually weakened with increasing cavity volume. When the well spacing was 125 mm and 155 mm, the injection port was close to the middle of the two wells, the clear water influence area was larger, and the brine volume was also larger; the brine discharge concentration was always kept at a more stable level at stages 11–17, which was weakly influenced by the well spacing and flow rate.

3. Numerical Analysis

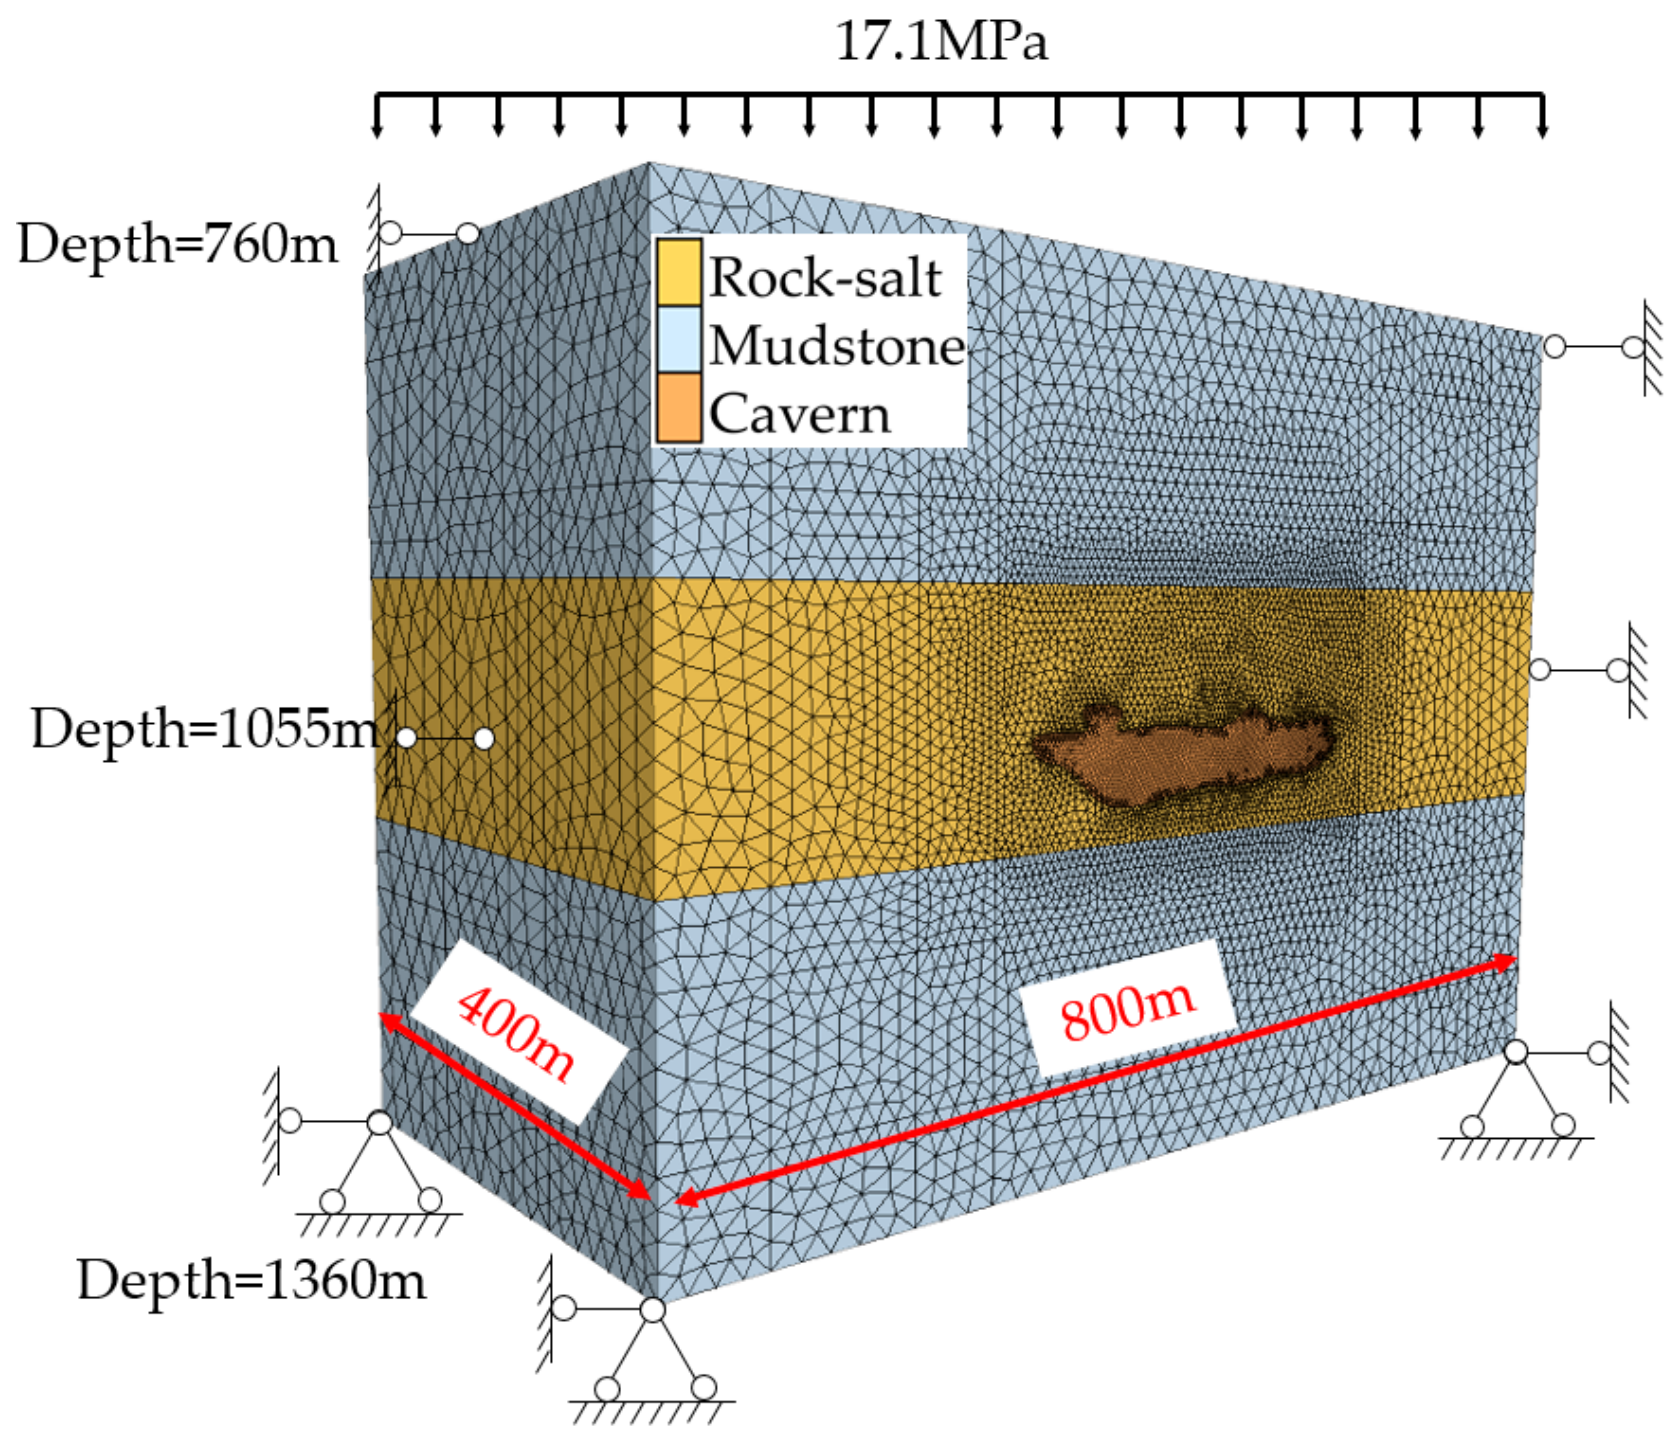
3.1. Numerical Modelling

The similarity ratio design was carried out prior to the horizontal-well cavity leaching test with the aim of reflecting the cavity expansion characteristics in the engineering reality through small-scale indoor tests, and overcoming the difficulty of conducting the actual engineering test. The cavity shape and dimensions were obtained by inverting the moulds and measurements at the end of the test, and the resulting cavity dimensions were enlarged according to the dimensional similarity ratio Kl. Thus, the geological numerical simulation calculations were carried out on the engineering scale, and the cavity leaching test provided the basic characteristics of the horizontal-well cavity for the numerical simulation calculations.
The main steps of the numerical simulation include the following: 1. modelling and meshing in Soildworks; 2. importing the model into Flac3D and naming the material domains; 3. setting the intrinsic model of the material and the mechanical parameters, setting the boundary conditions and the overlying stratum load, and solving the initial stress field; 4. setting the cavity brine stress after the cavity formation, and solving for the brine stress; and 5. setting the intrinsic creep model, creep parameters, and operating internal pressure, and performing simulation calculations of the long-term stability of the surrounding rock of the horizontal-well cavity natural gas storage. The steps of the numerical modelling and setting are described in detail below.
The numerical model of the horizontal-well salt cavity was established based on the regional conditions of Jiangsu Jintan salt mine, considering the actual depth and thickness of the salt layer, and the strata with dip angles in the range of 0°~5° were approximated as the horizontal strata. The length, width and height of the numerically calculated stratigraphic model were 800 m, 400 m and 600 m, respectively; the thickness of the upper mudstone layer was 210 m, the thickness of the middle saltstone layer was 170 m, the thickness of the lower mudstone layer was 220 m, and the total height was 600 m. The depth of the model was 760 m at the top surface, and the depth of the bottom surface was 1360 m.
In order to recreate as closely as possible the actual shape of the horizontal-well cavity after the cavity leaching test, Soildworks was used to model the cavity according to the measured and enlarged dimensional data of the horizontal-well cavity. In order to obtain the actual morphology of the horizontal-well cavity leached in the test, the acrylic box and the epoxy resin gel on the surface were disassembled after the cavity test, so that the cavity leached in the test was directly exposed, the paraffin was heated until the paraffin melted into wax water, the wax water was poured into the cavity and we waited for the paraffin to solidify, and then the paraffin was disassembled. The paraffin model of the horizontal-well cavity is shown in Figure 4. The three-dimensional dimensions of the paraffin model of the cavity were measured, and the cavity dimensions were enlarged according to the test similarity ratio Kl, so that the actual geological numerical model of the cavity could be obtained, and, thus, the numerical simulation calculations of the horizontal-well cavity could be carried out.
Once the model was created, tetrahedral meshing was performed using Hypemesh. To ensure the accuracy and efficiency of the calculation, the meshing was finer in the pericavity region. However, there were short edges, small gaps and irregular cuts in the pericavity model. In order to avoid mesh distortion and mesh delineation failure, some of the short edges, narrow cuts and irregular gaps were combined with the surrounding area through geometric patching. After mesh delineation, the model was converted to the Ansys format and then imported into Flac3D for the numerical simulation of the long-term stability of natural gas storage in a horizontal-well salt cavity.
After modelling and meshing, the boundary conditions and initial conditions were set. The origin of the coordinate system was located at the centre of the cavity. The salt layer was parallel to the plane of the XY coordinate system, and the Z-axis direction was the depth direction of the stratum. The bottom surface of the model was constrained by the displacement in the Z-axis direction. The four longitudinal surfaces were constrained by their respective normal directions. The top surface of the model was subjected to the equivalent uniform loading of the overlying rock layer. The initial density was set to 2.3 × 10³ kg/m3, and the hydrostatic pressure state was used to estimate the initial stress state, which means that the principal stresses in three directions are equal: σX = σY = σZ. According to the actual thickness of the stratum and the average density of the stratum, the average uniform load on the top surface of the model was 17.1 MPa. The geological model of the horizontal-well salt cavity natural gas storage is shown in Figure 5, and the boundary conditions and the initial stress distribution are also shown in Figure 5.
The effect of creep was not considered in the hydrostatic calculation. The Mohr–Coulomb model was used for all materials in the model, and the hydrostatic calculation parameters for salt rock and mudstone are given in Table 5.
Salt caverns undergo a long period of cavity dissolution before being used for gas storage, with a cavity leaching cycle of more than two years. Initial creep is completed within a few weeks [31,32], so that the salt cavern is already in a stable creep phase when it is used for gas storage. The initial stress and brine stress were calculated prior to the pressure operation of the salt cavern storage facility, and only the steady-state creep of the salt rock was considered in the long-term stability calculation of the horizontal-well cavity natural gas storage; the commonly used Norton–Power model for the steady-state creep of salt rock is as follows:
ε ˙ t = A ( σ 1 σ 3 σ * ) n
where, ε ˙ t is the steady creep rate, σ 1 and σ 3 are the maximum and the minimum principal stresses, σ * is a unit stress, A and n are two creep parameters, A = 6 × 10⁻⁶ MPa−3.5 and n = 3.5 for salt rock.

3.2. Analysis of Simulation Results

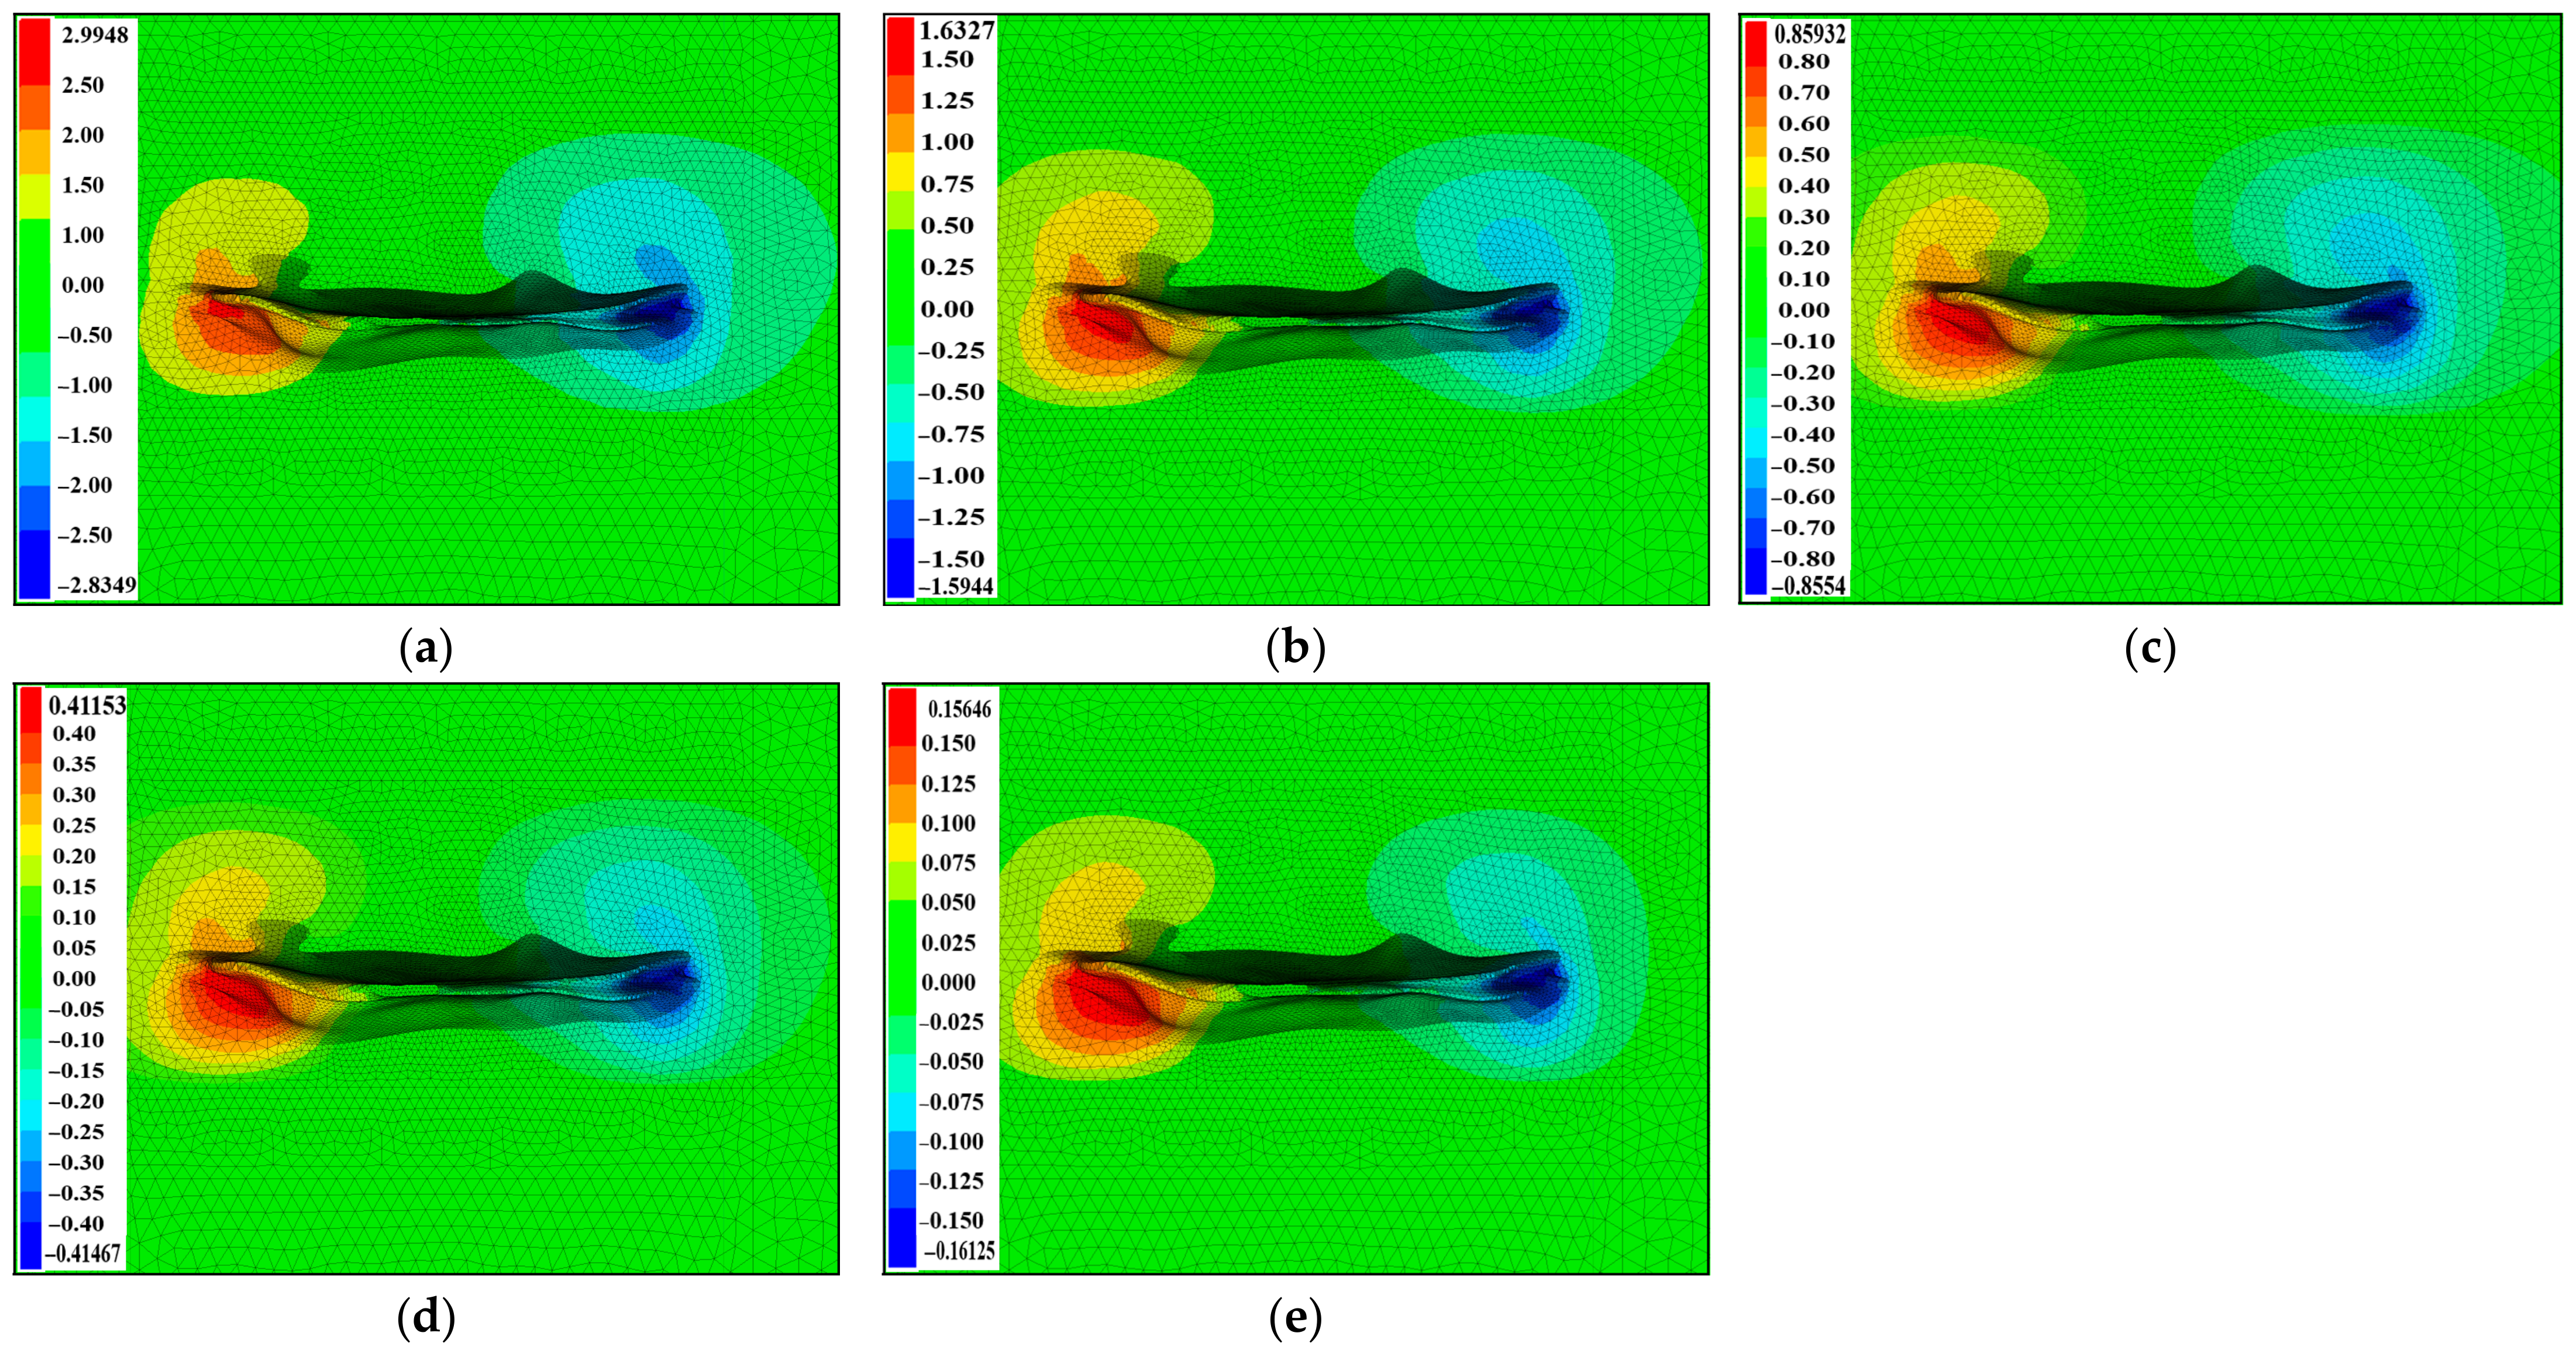
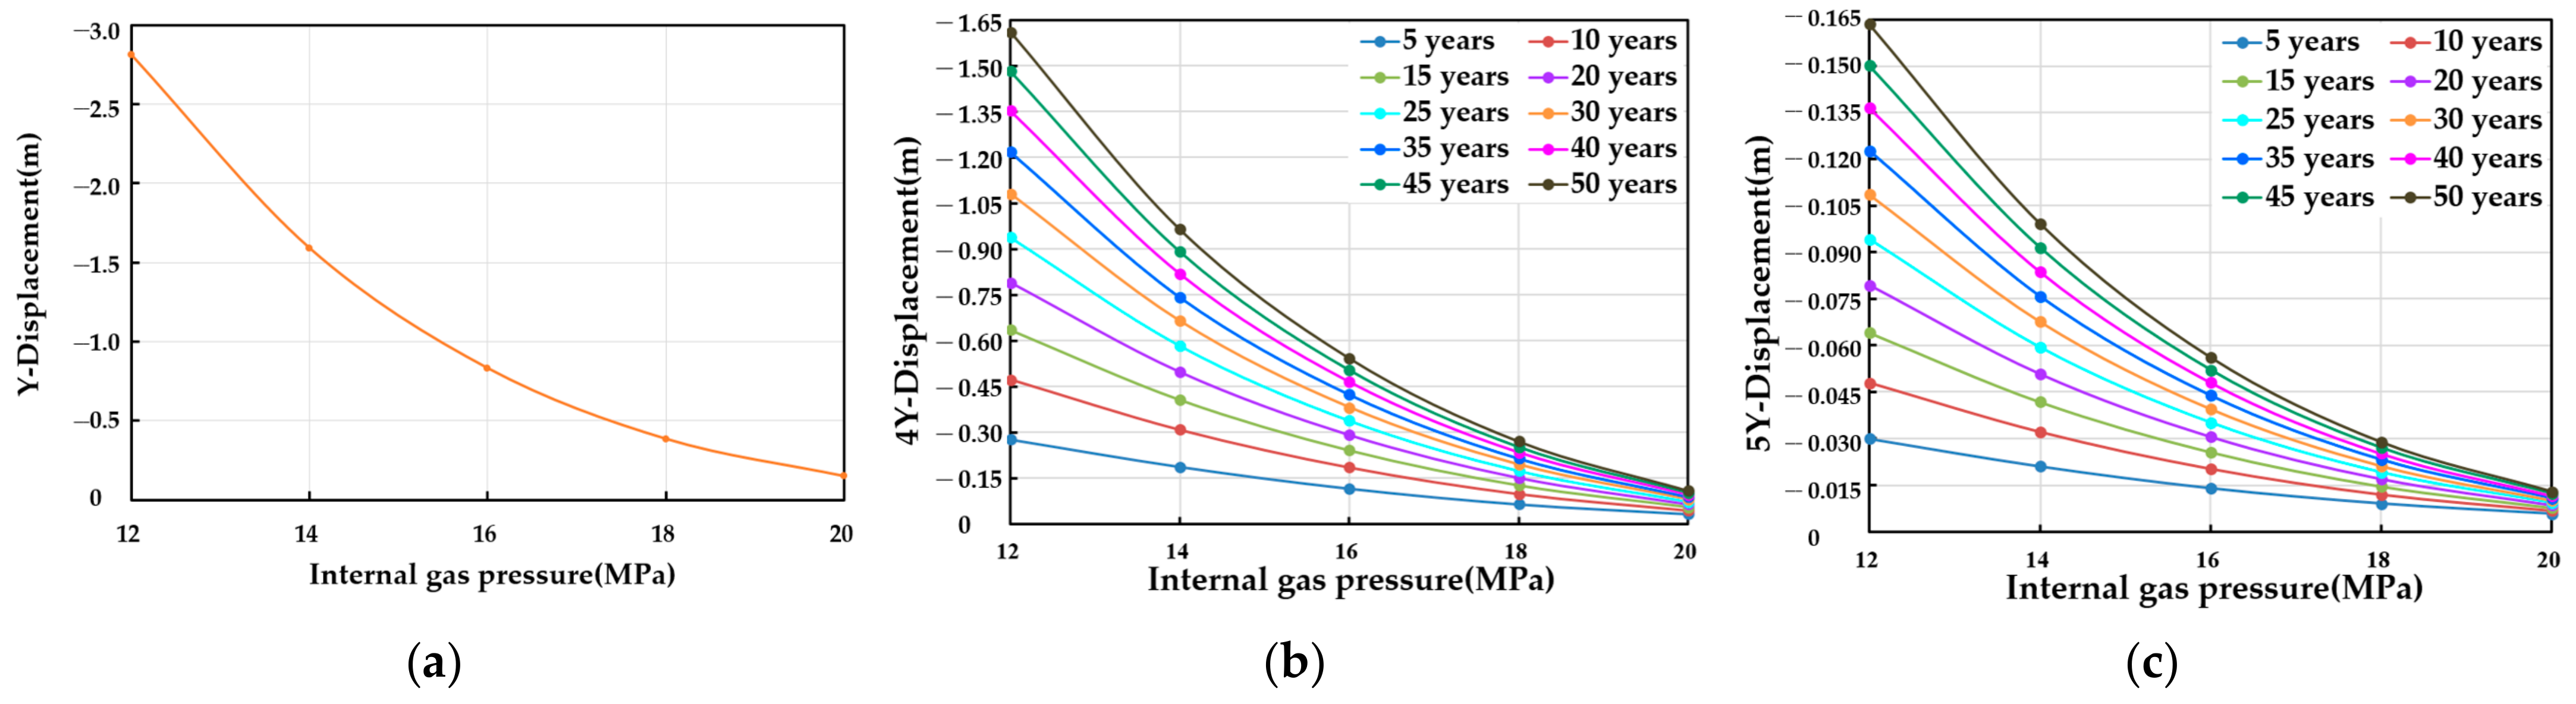
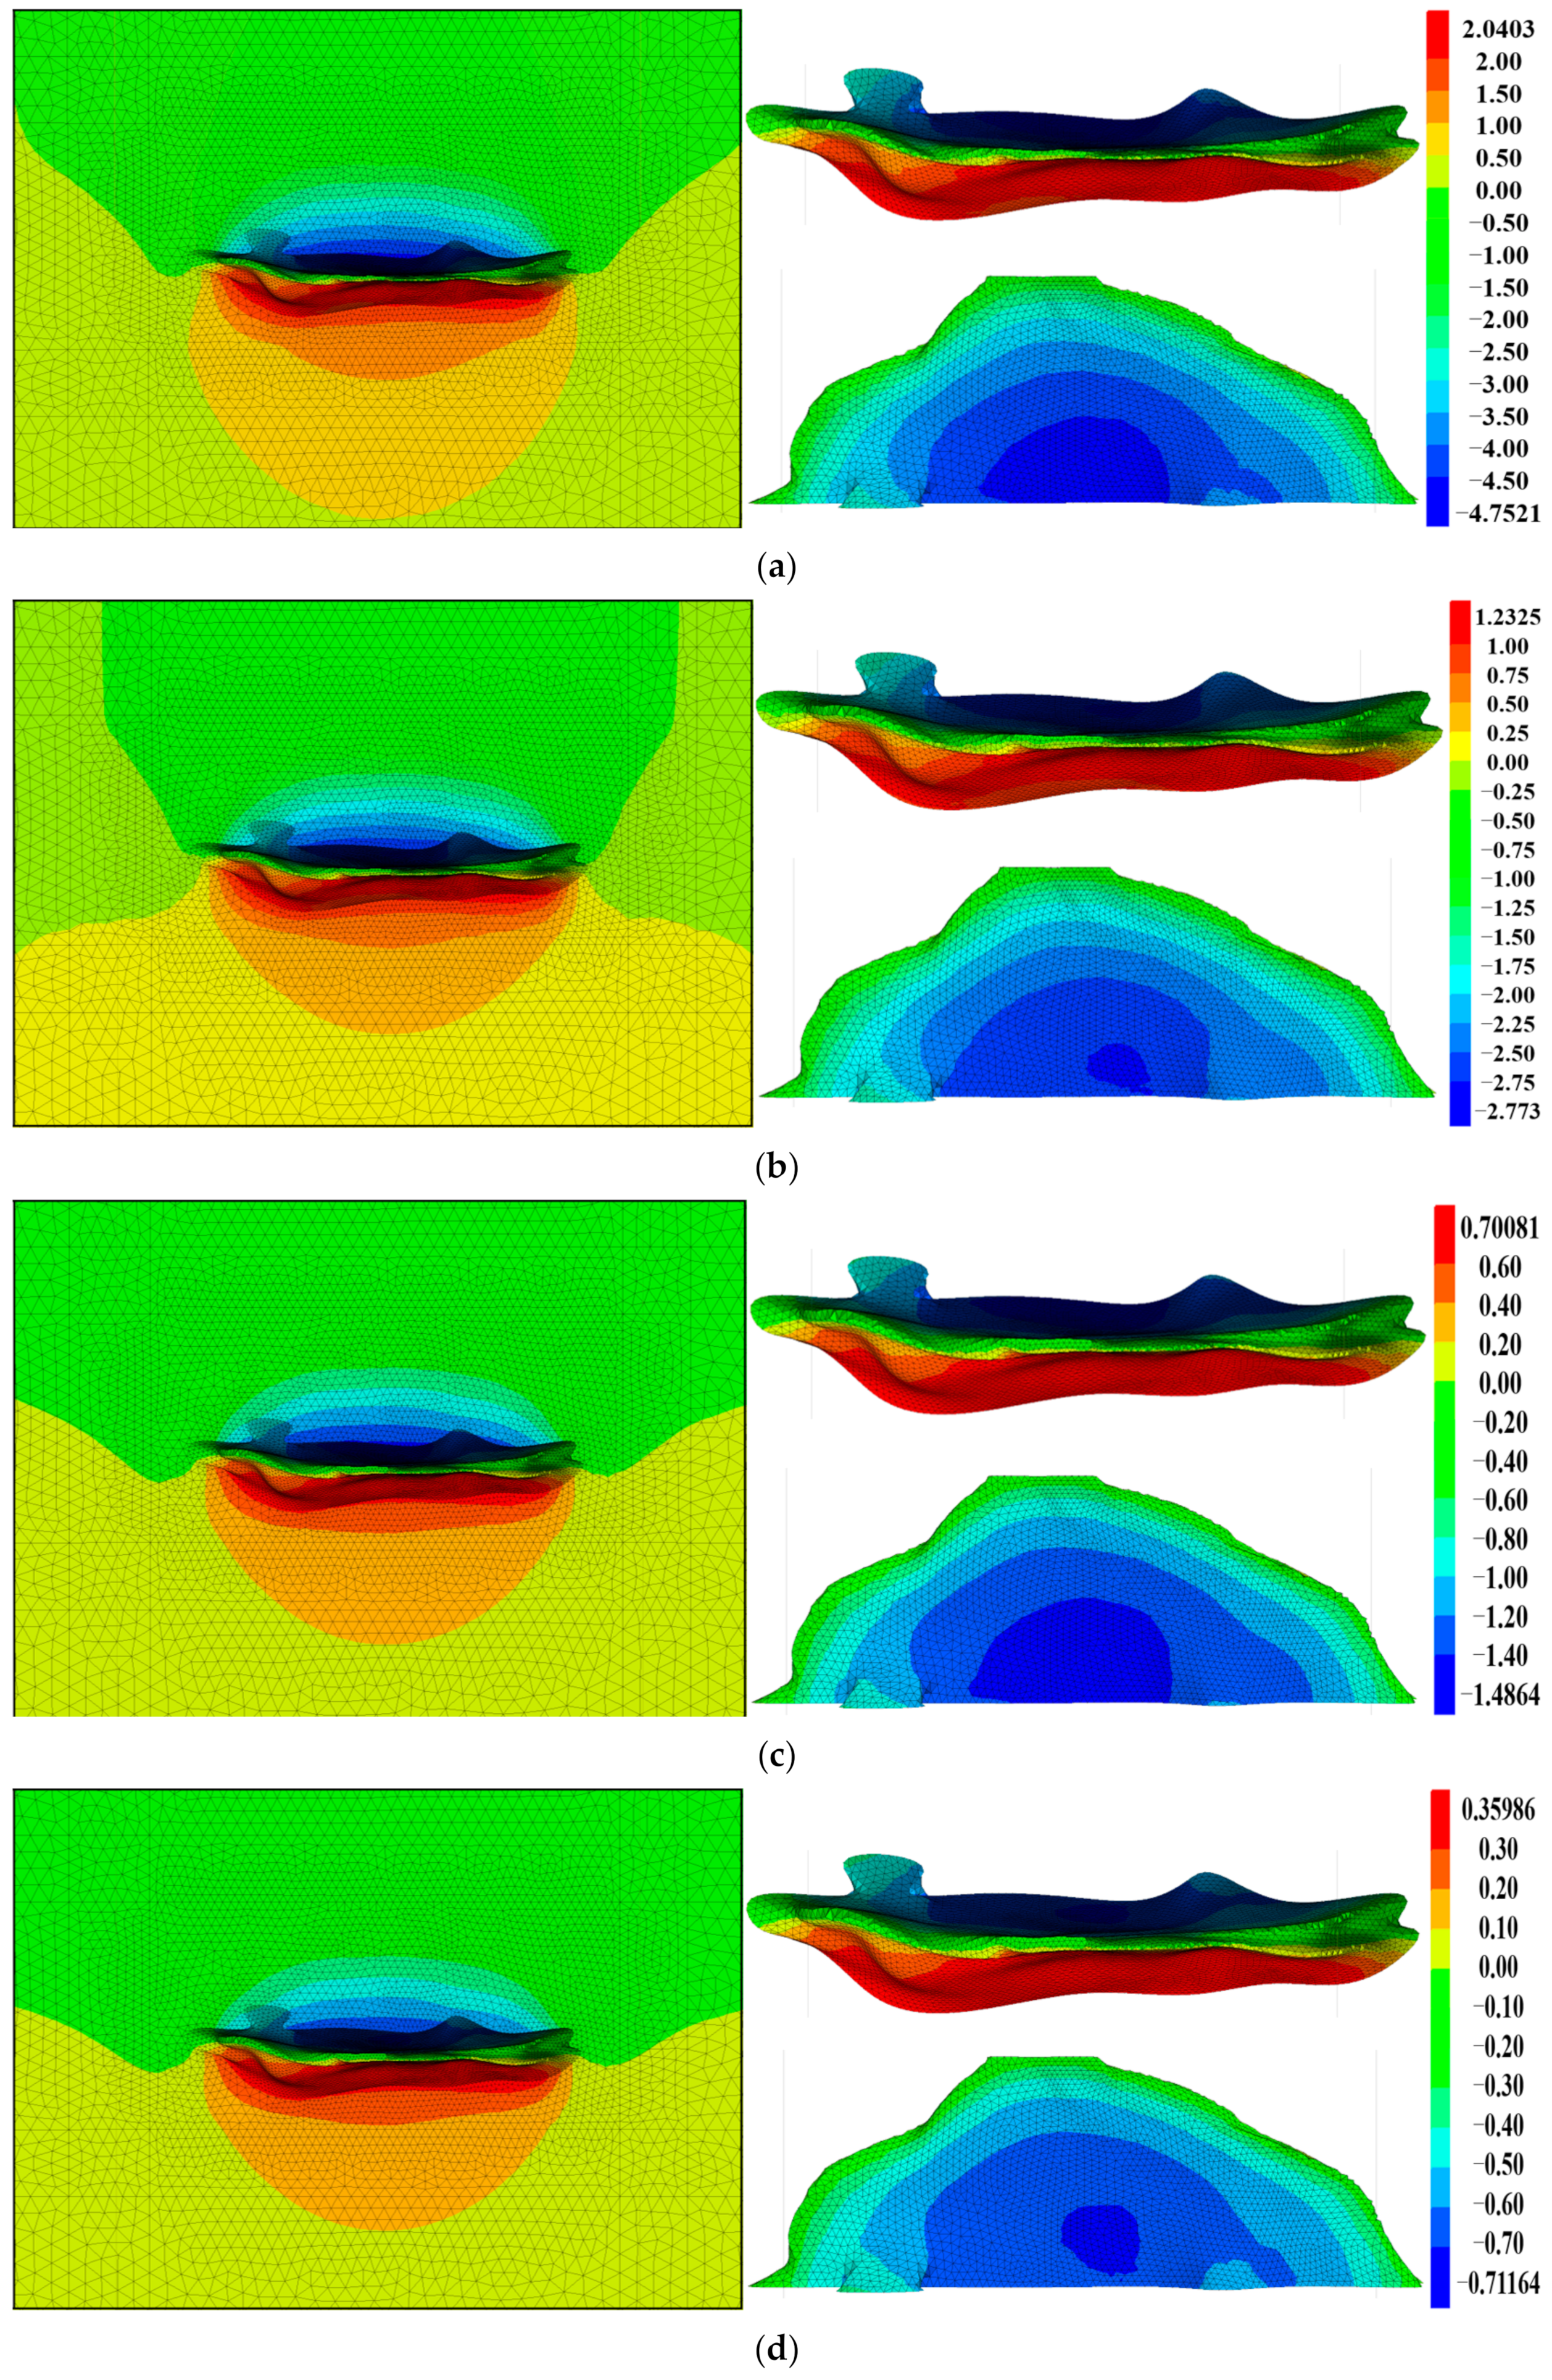
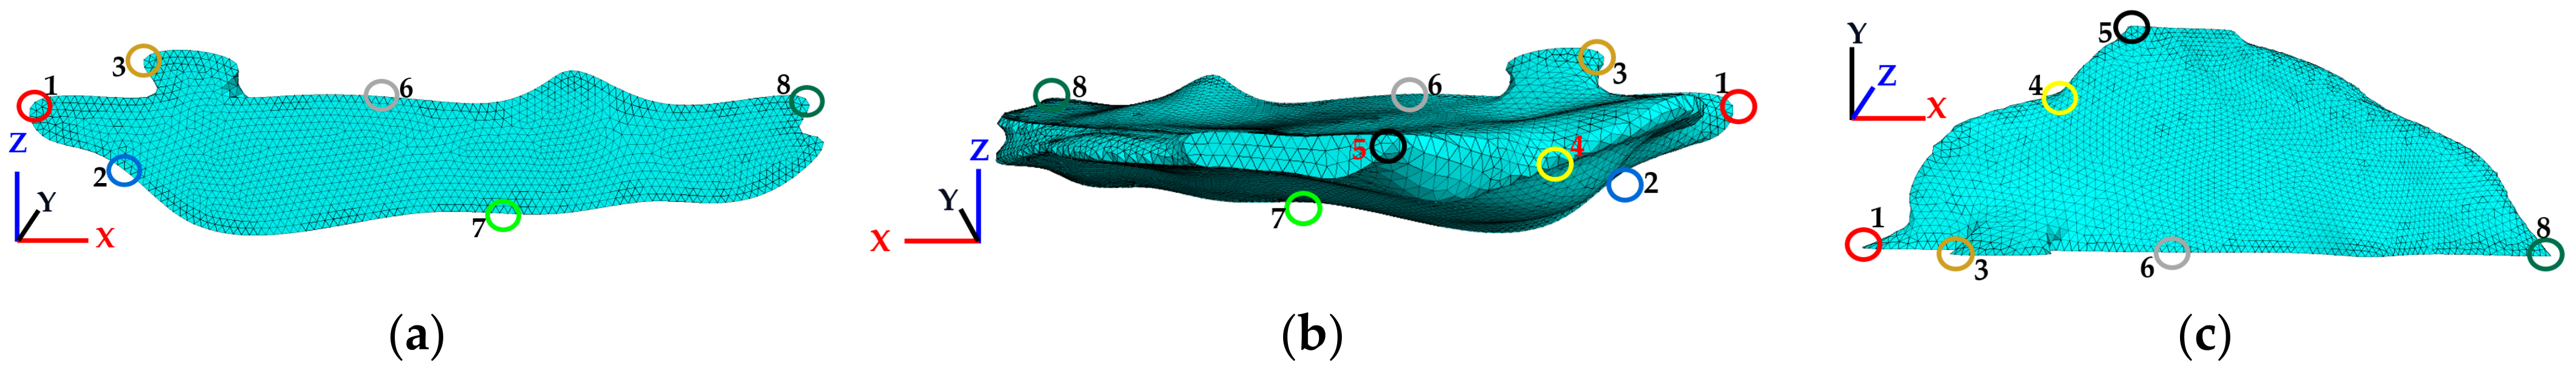
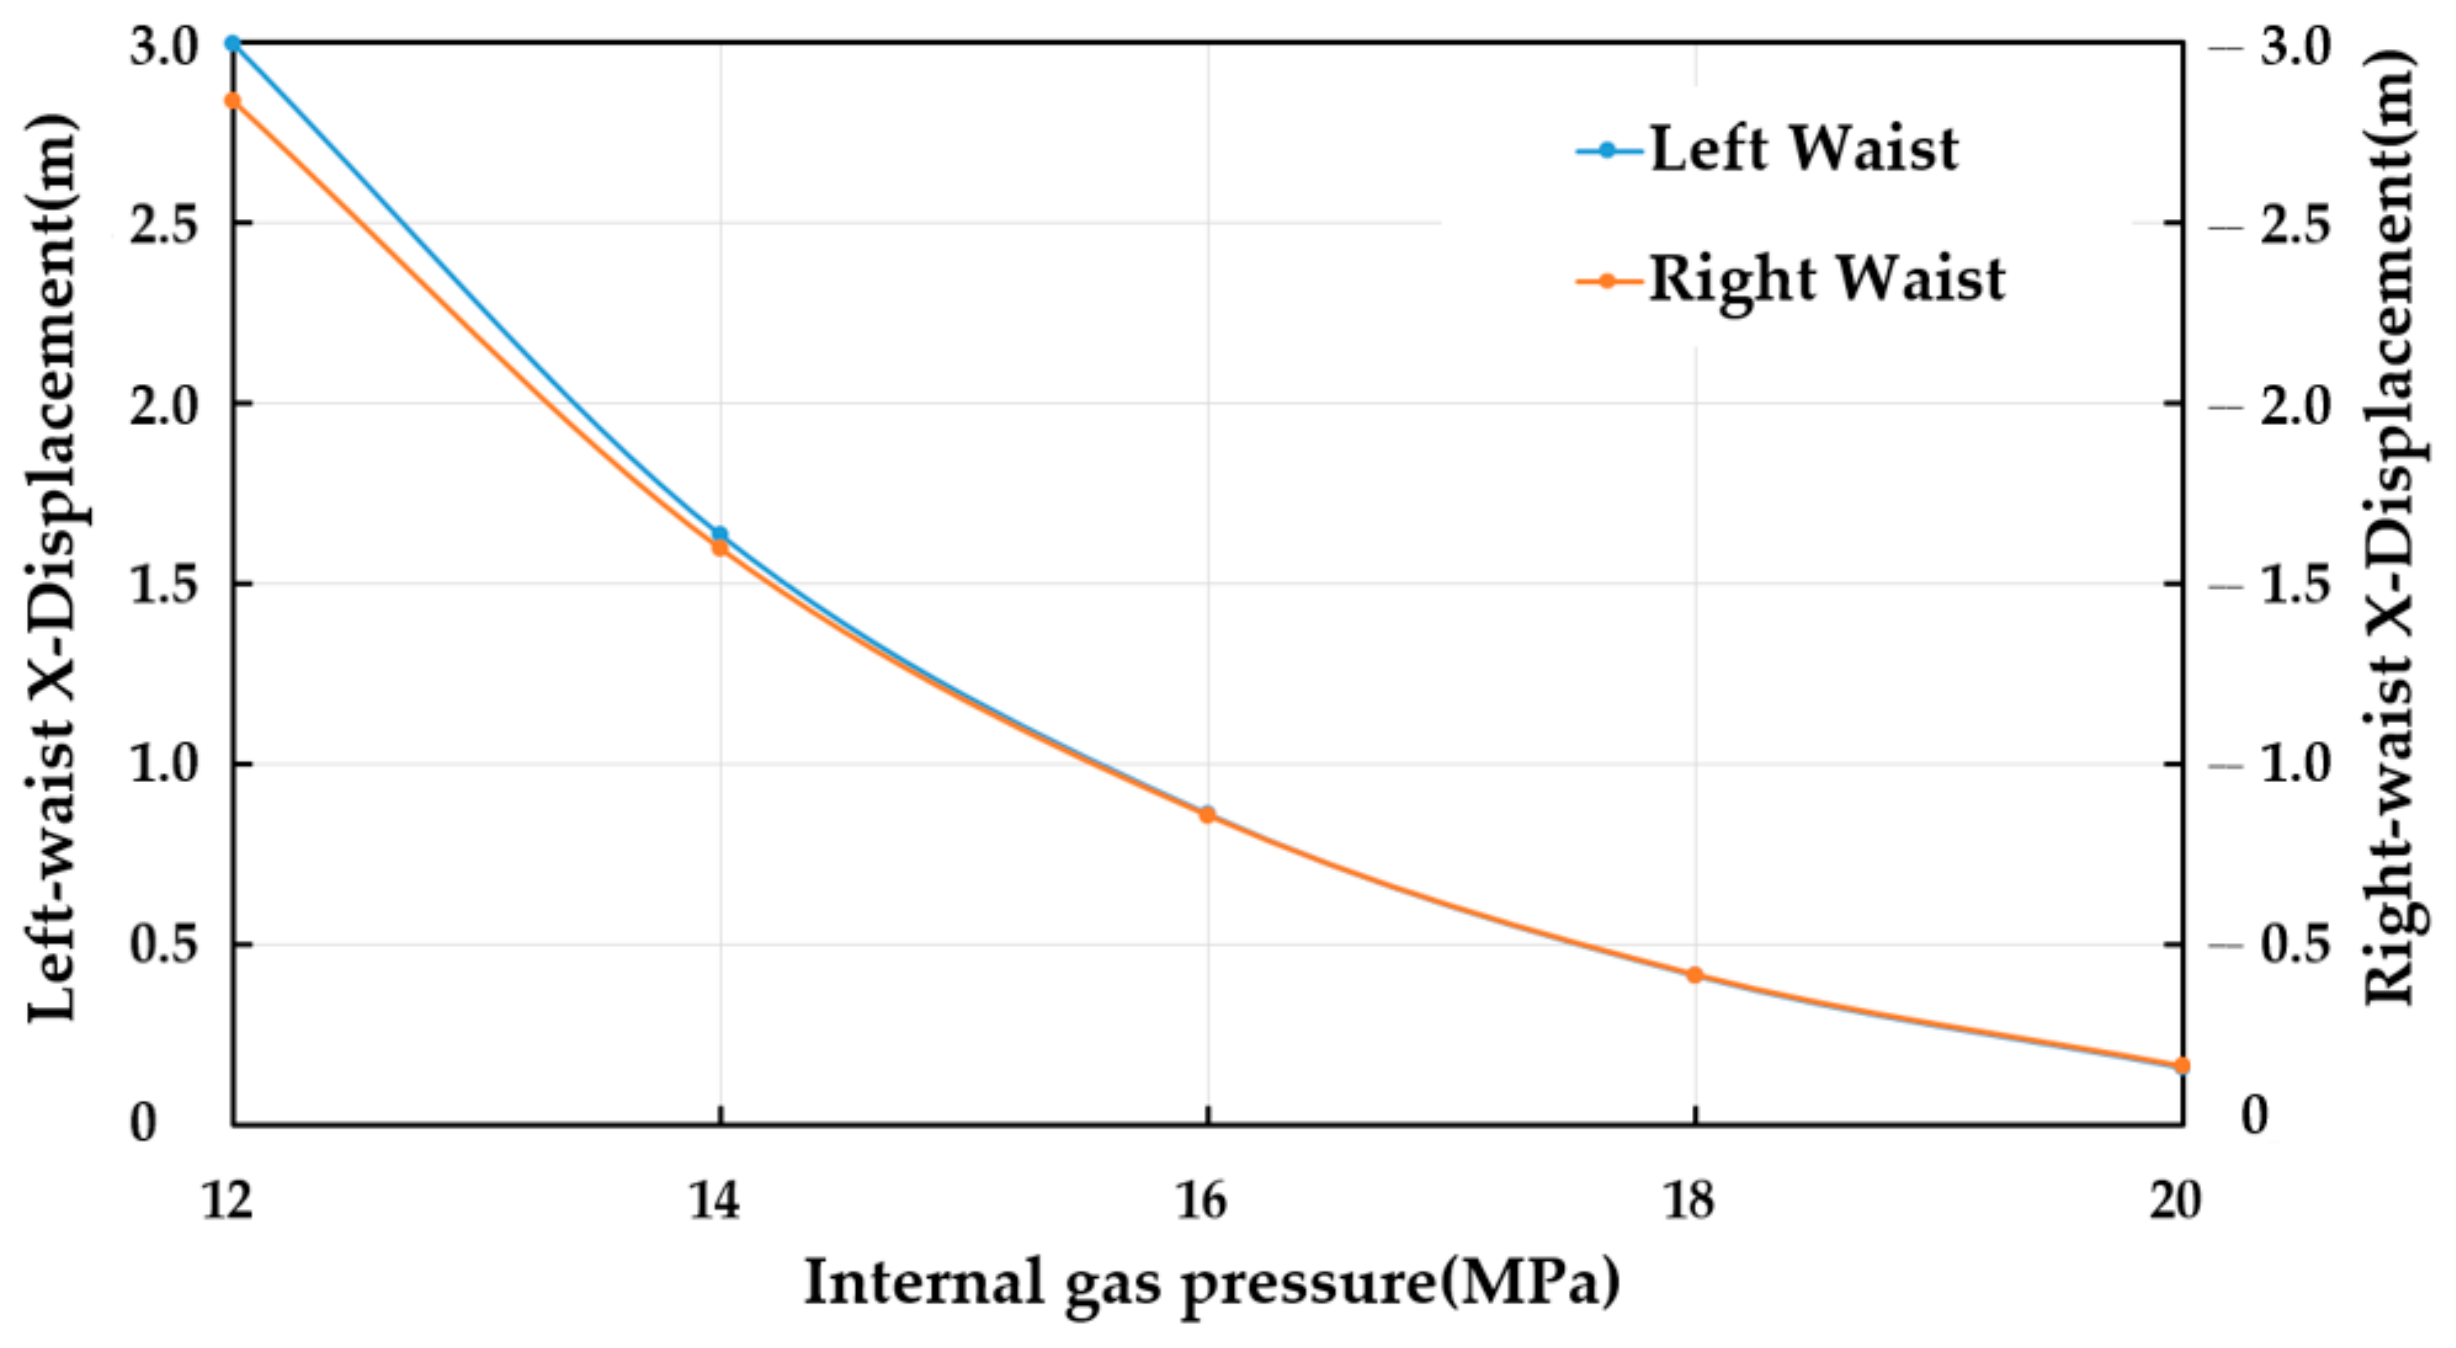
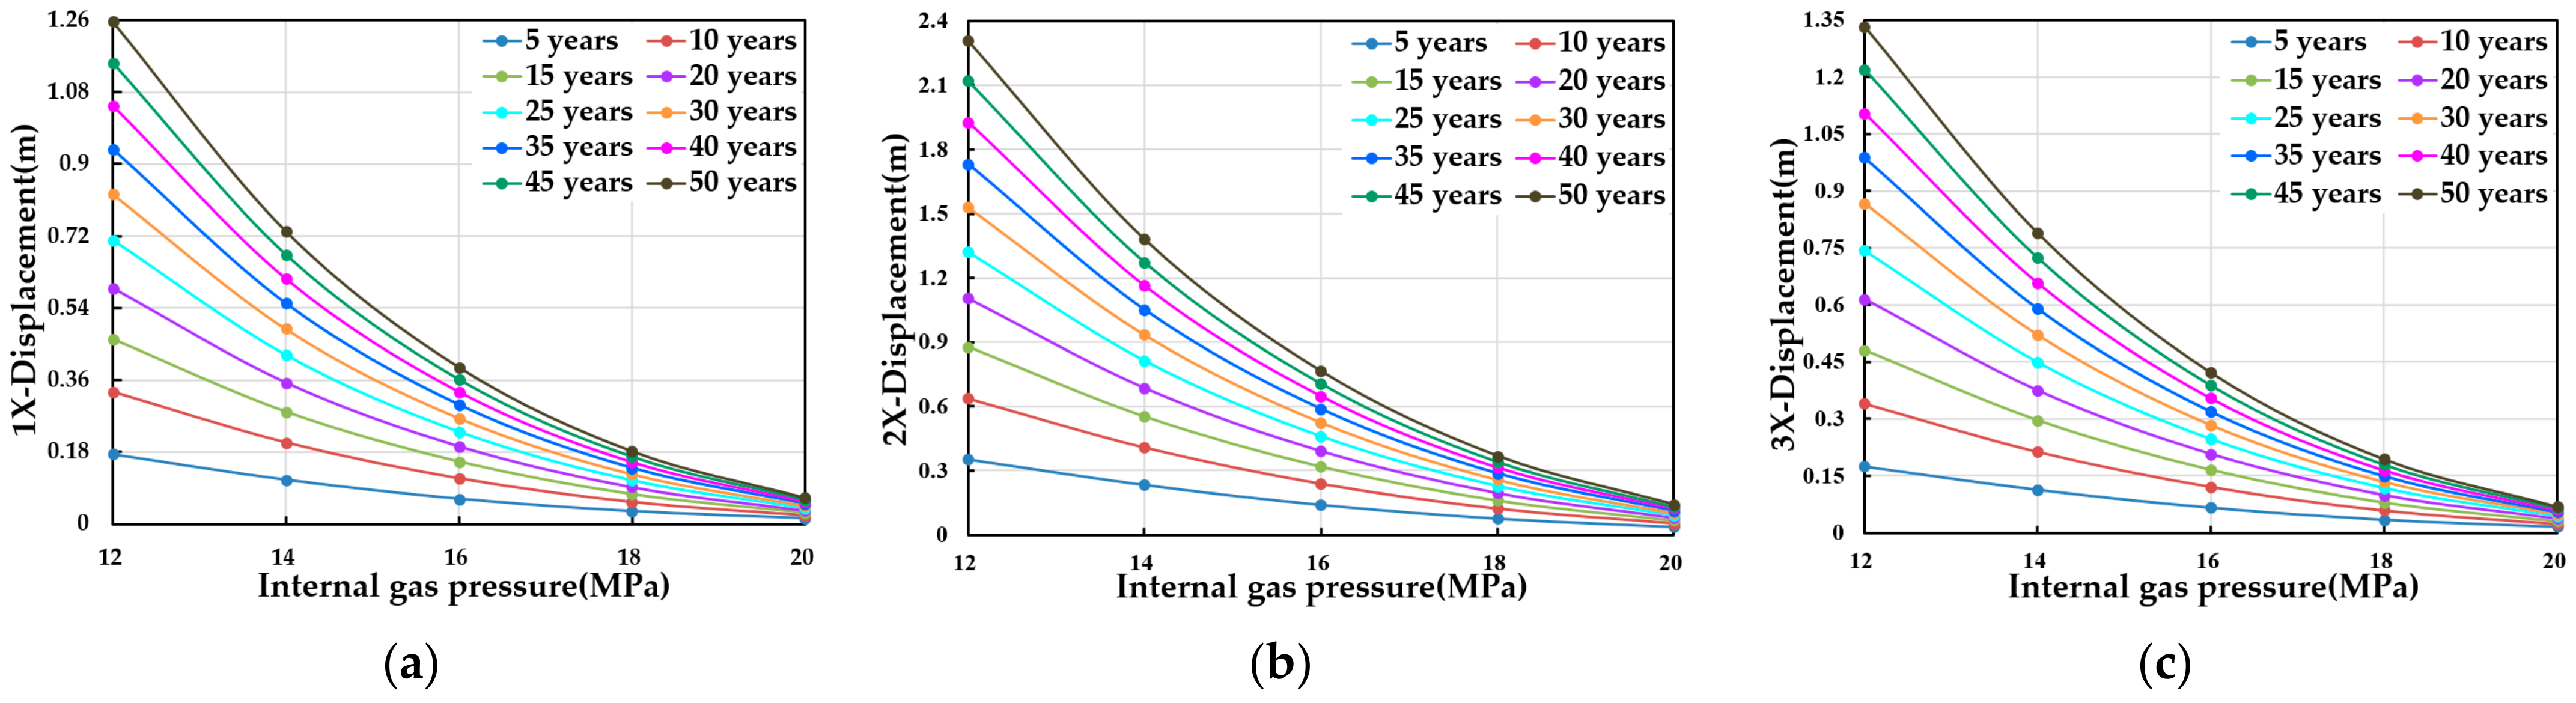
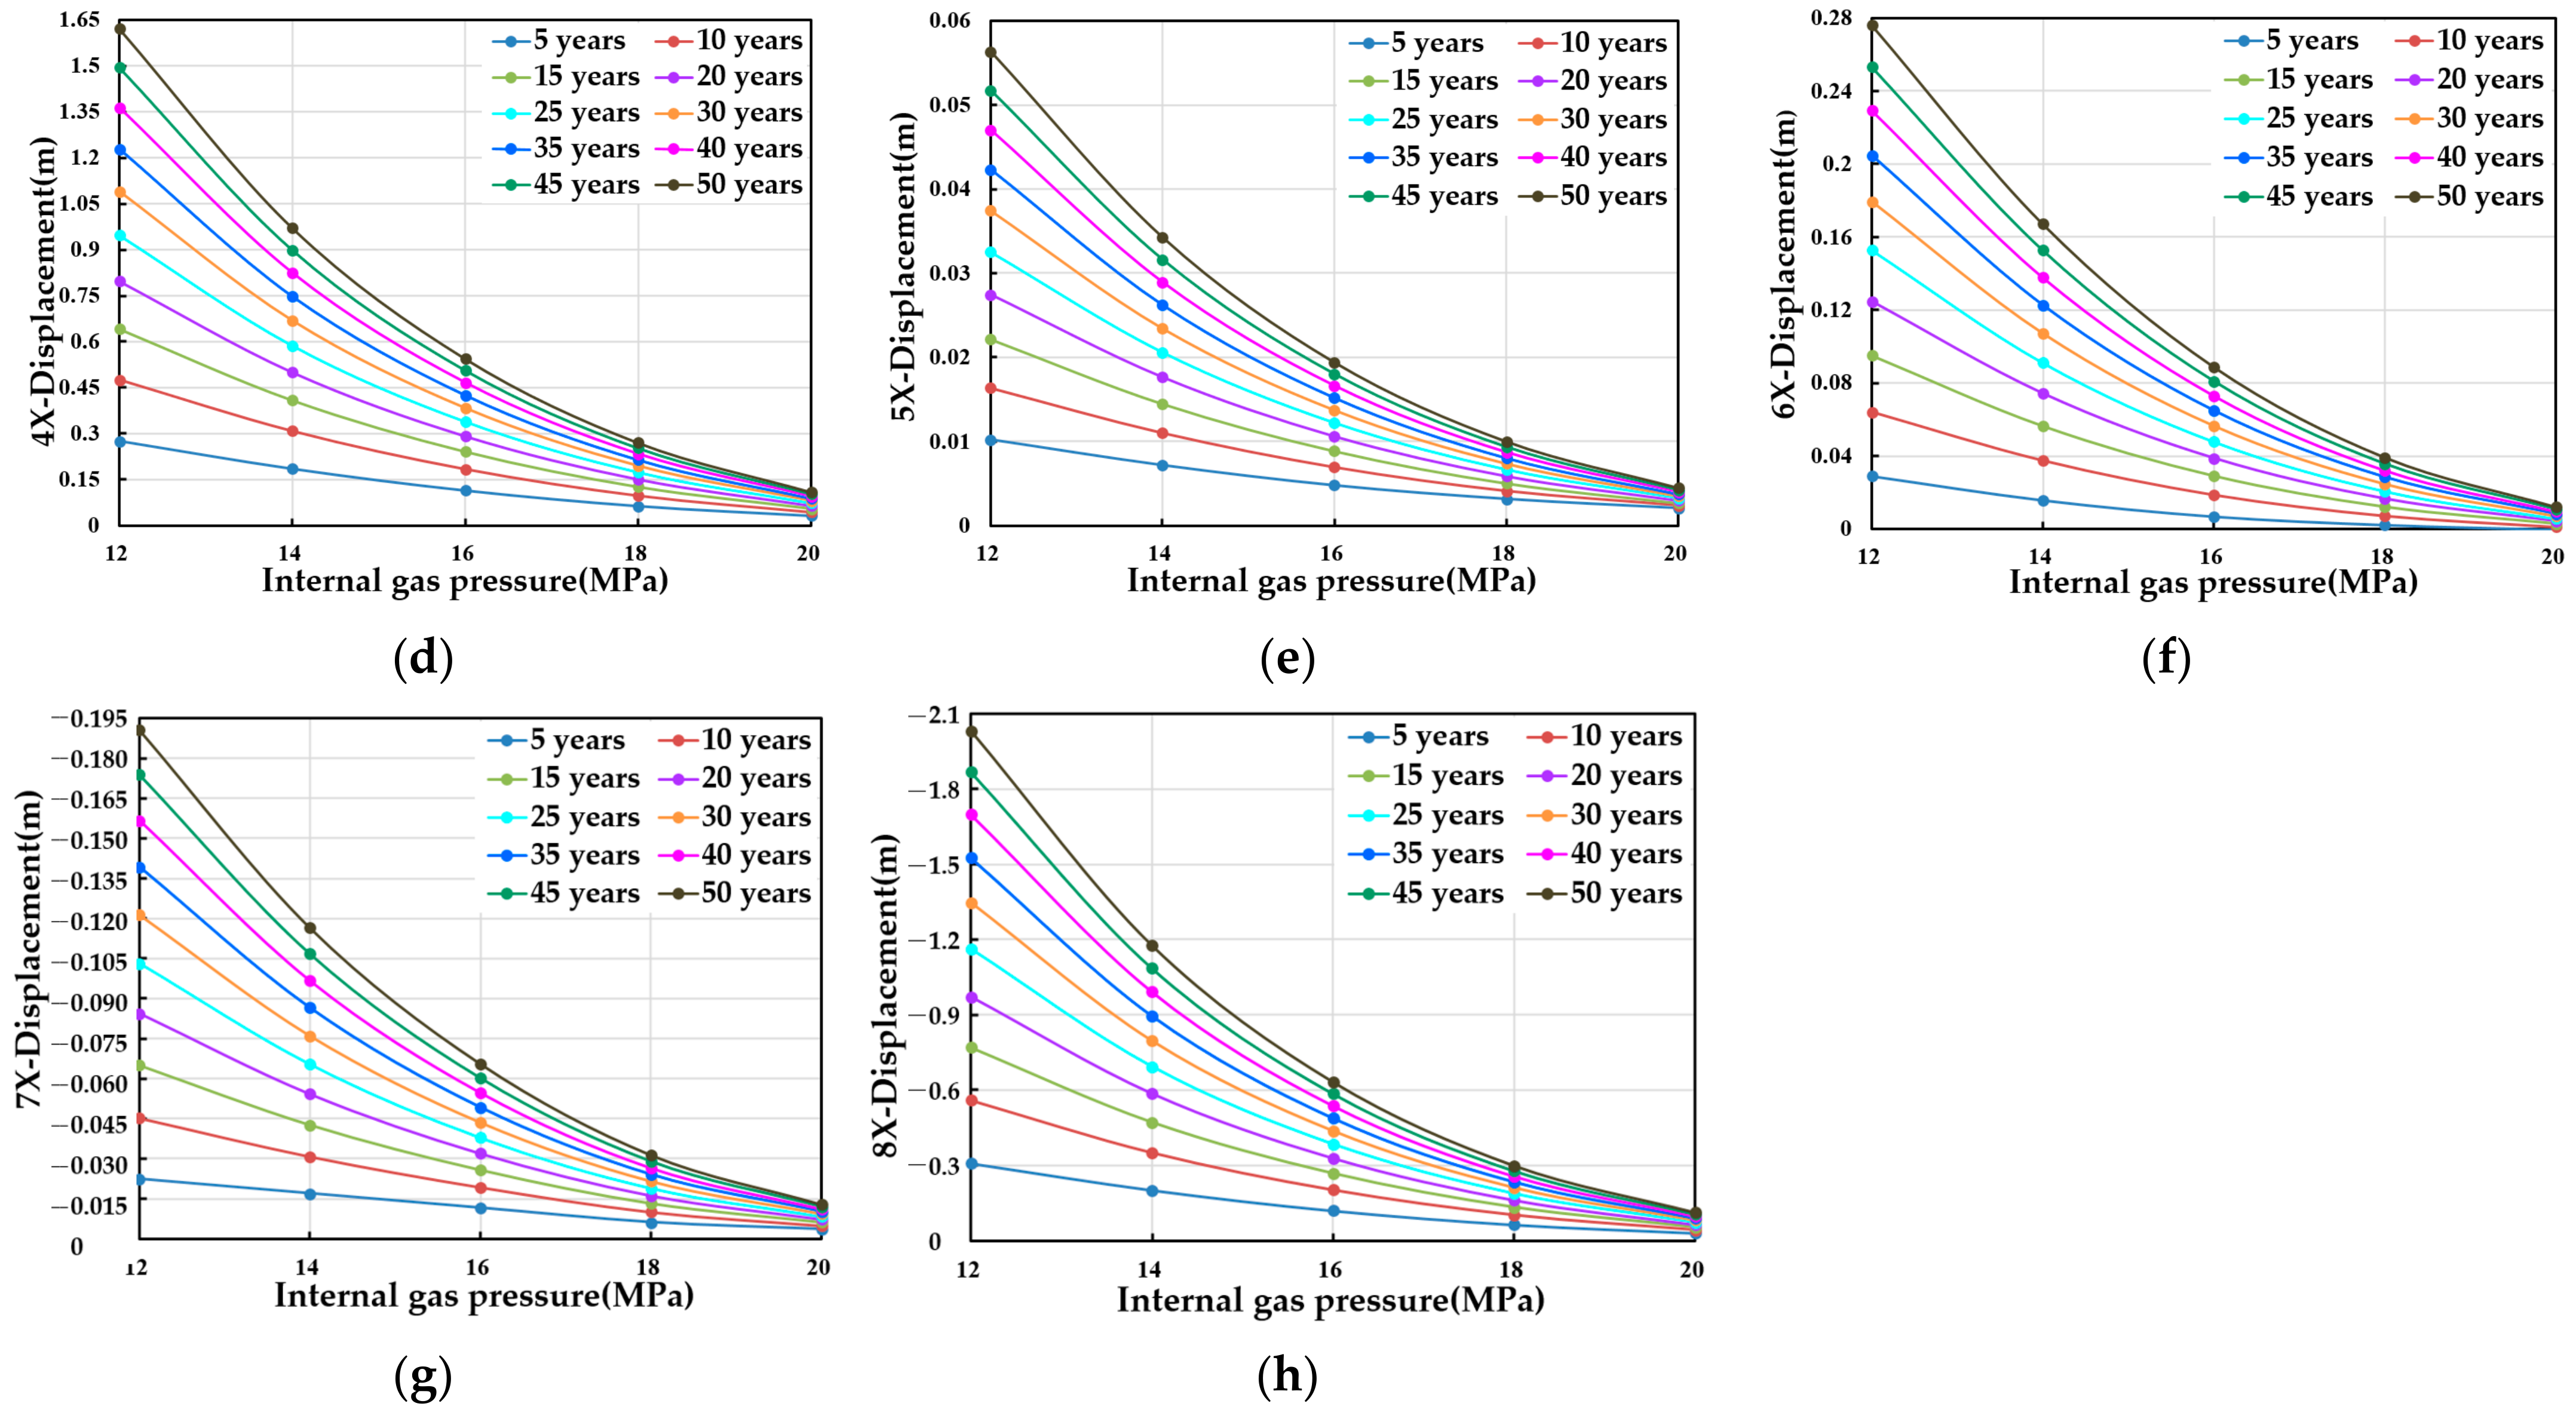
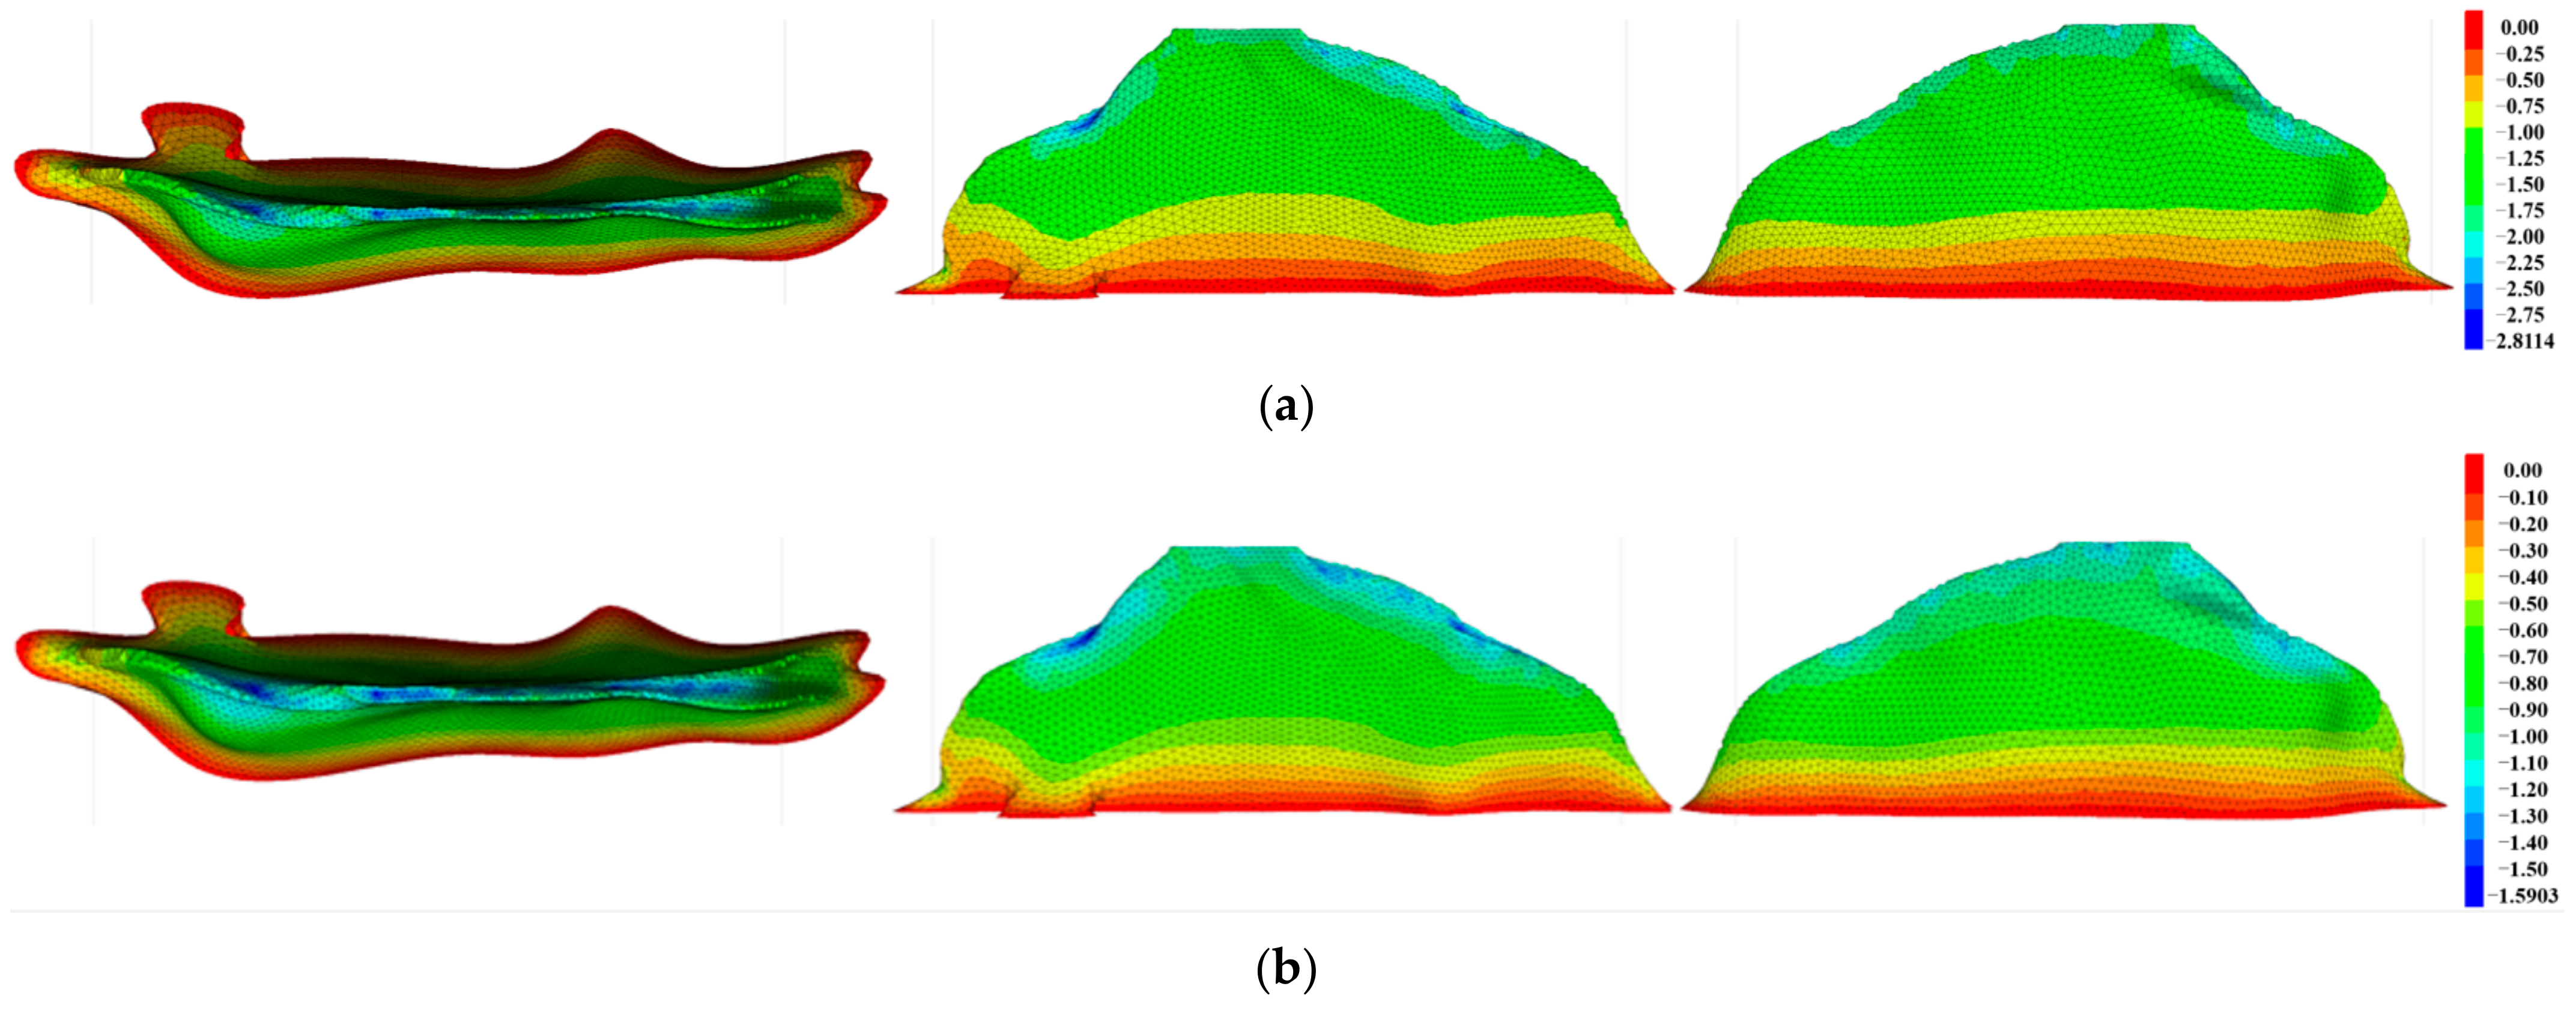
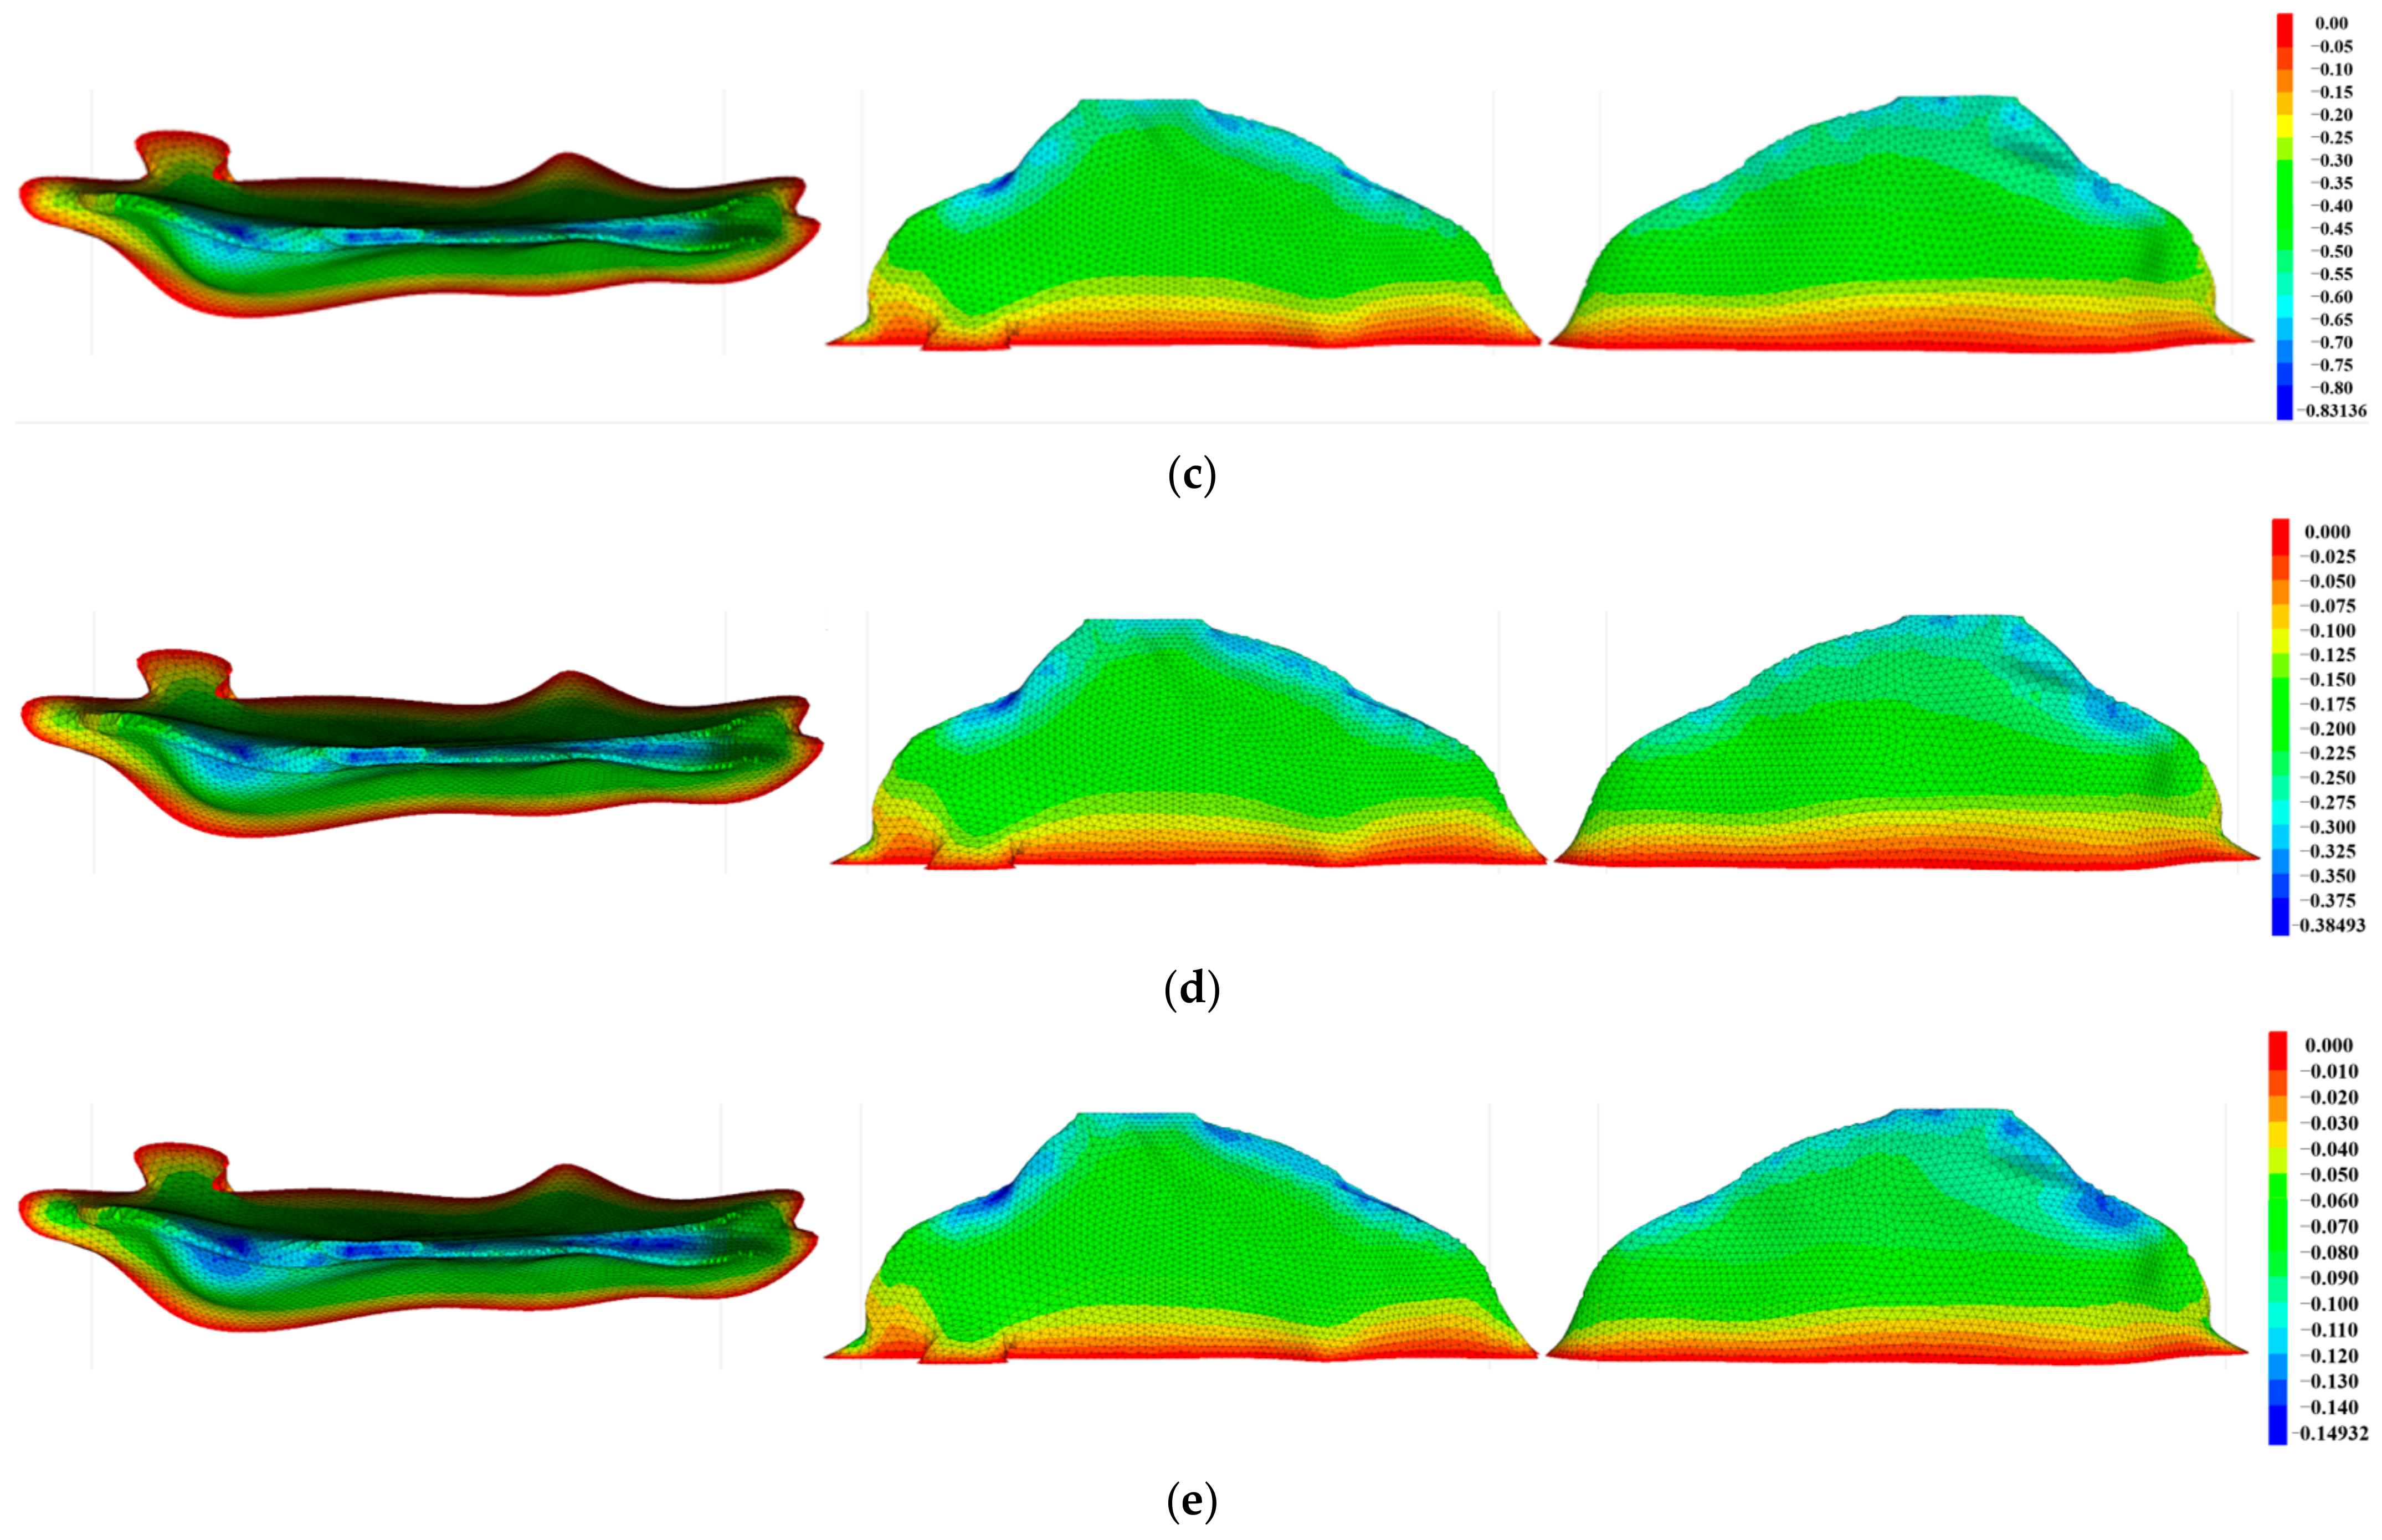
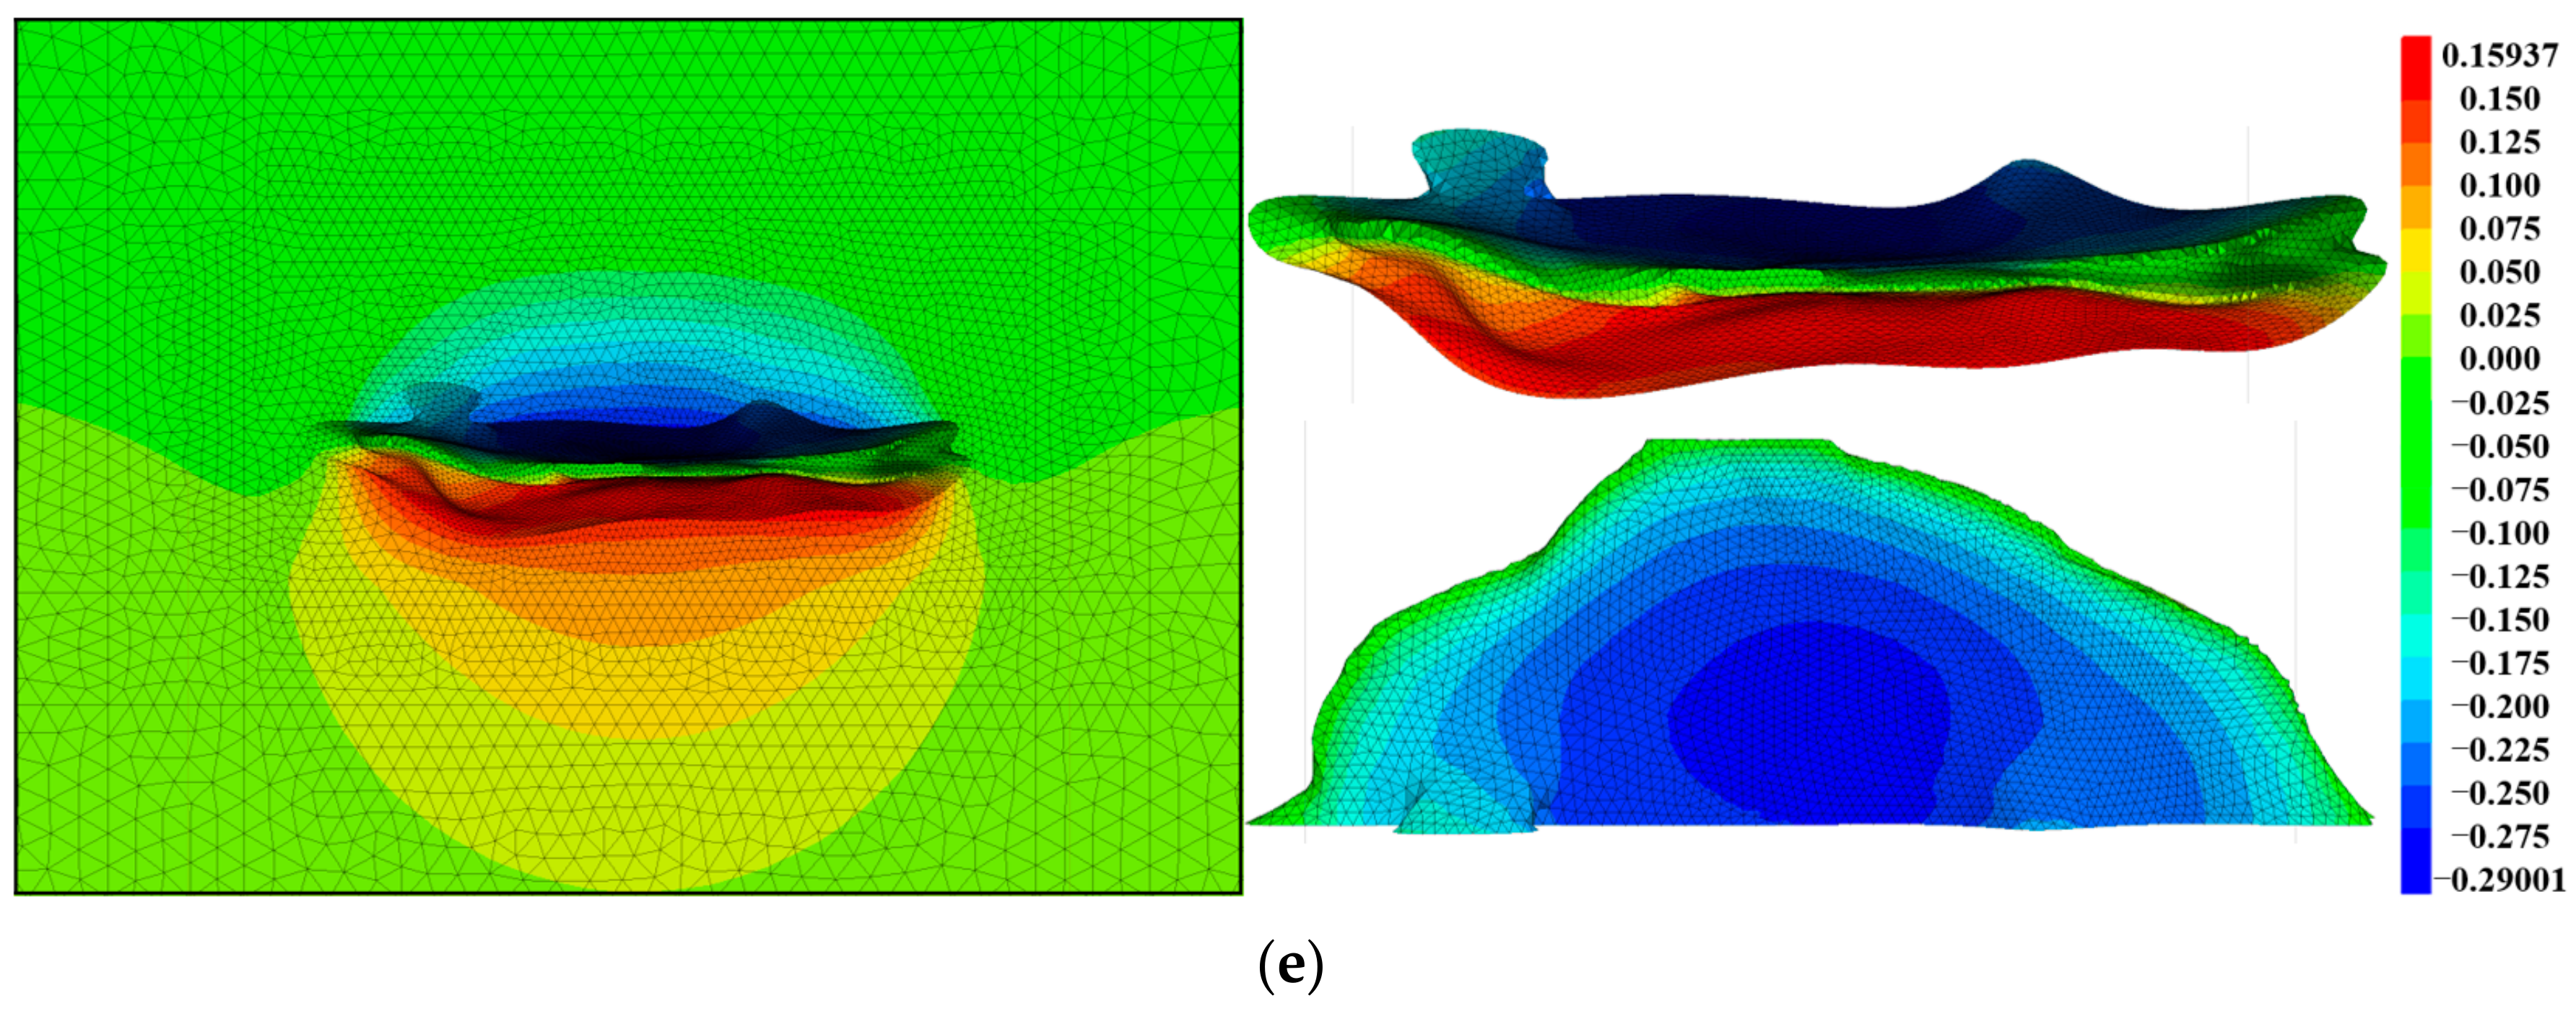
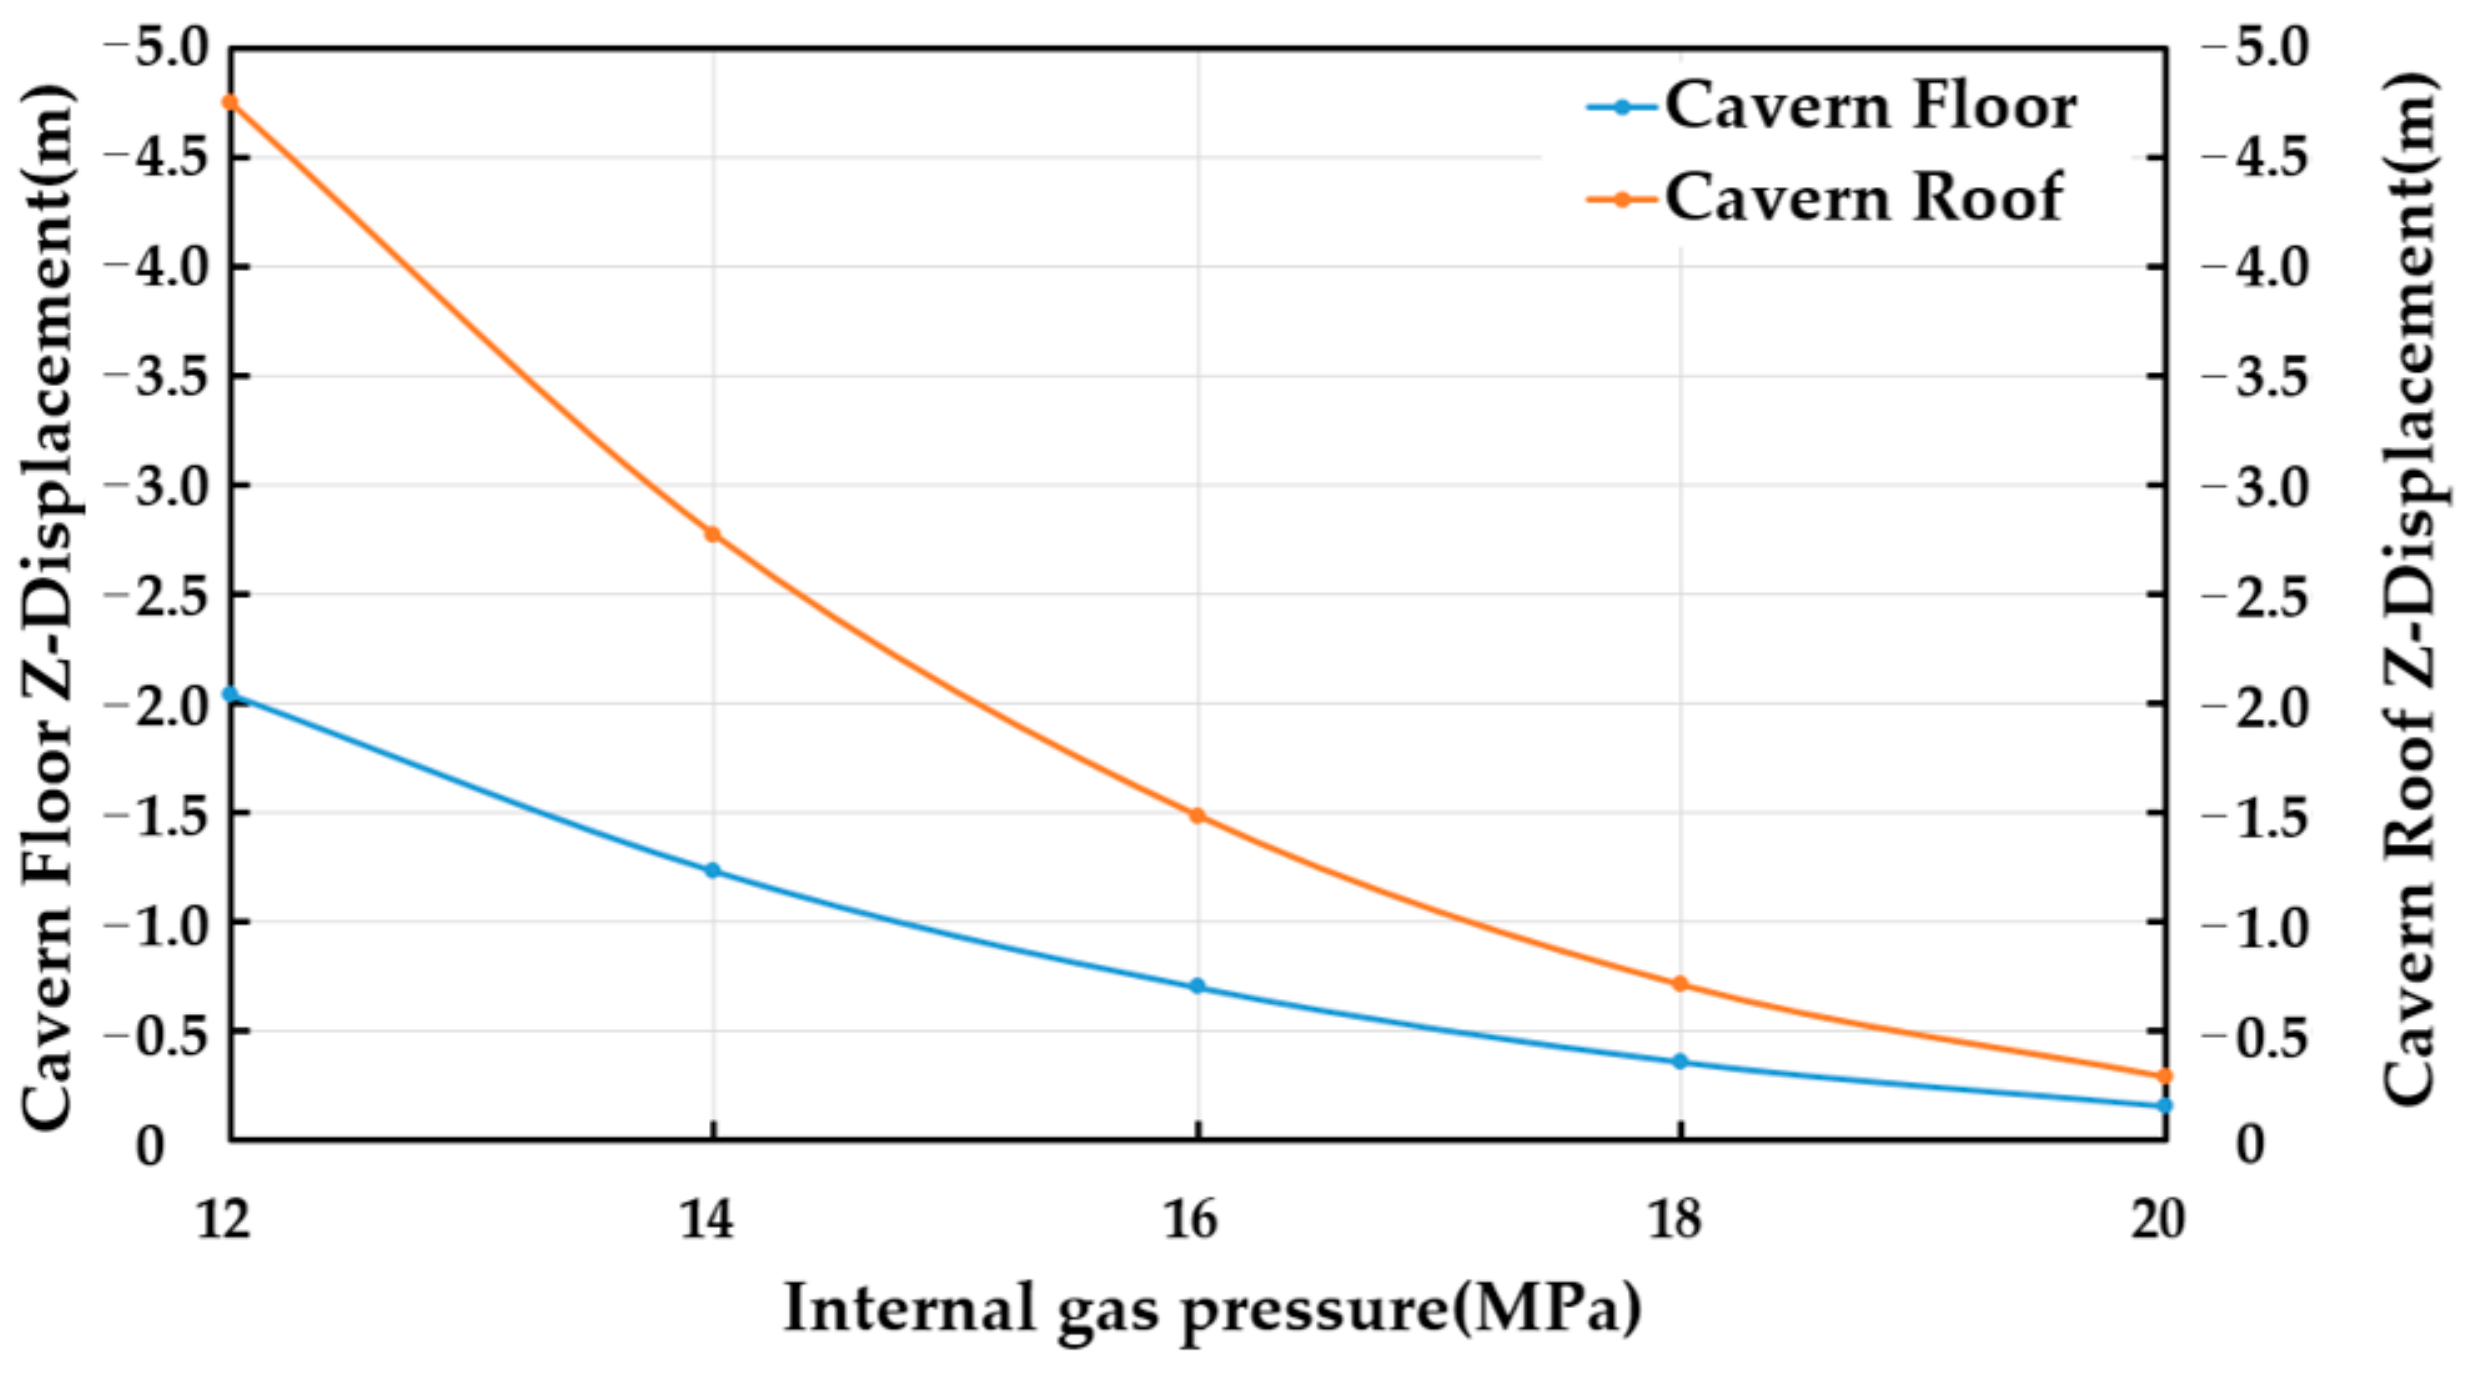
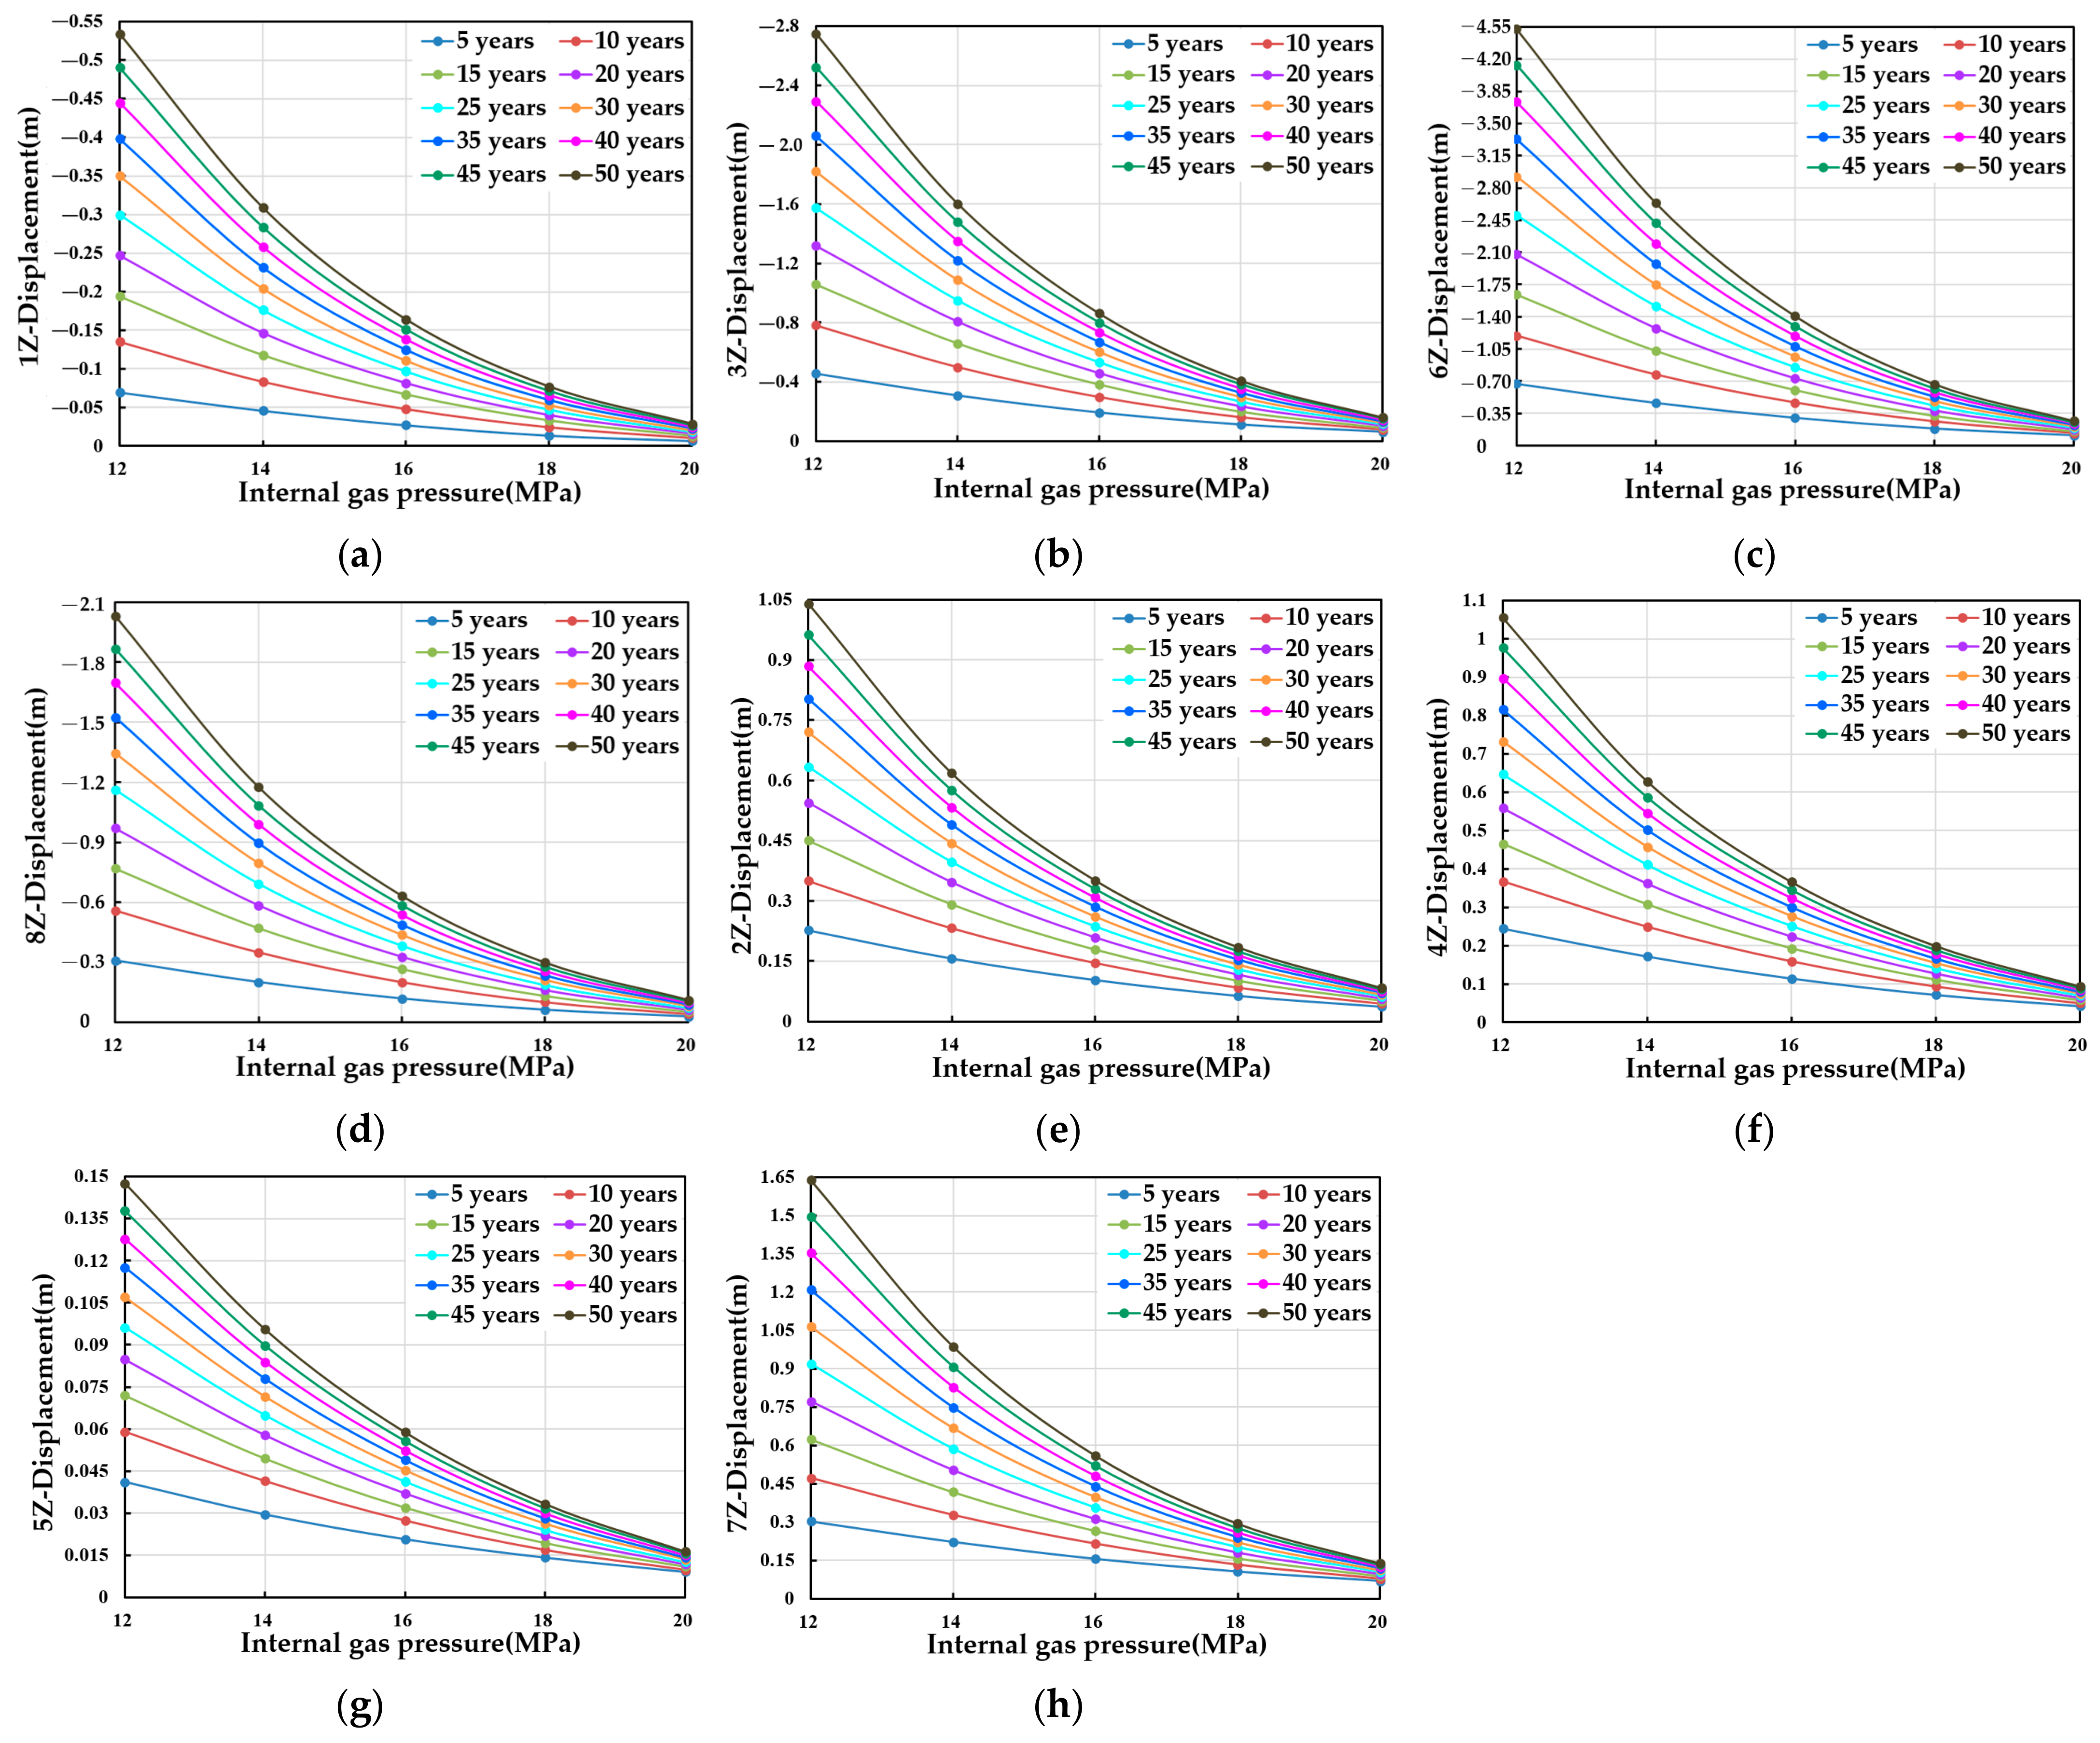
3.2.1. Displacement Analysis of Horizontal-Well Cavity

The displacement values of 1X~8X, 1Z~8Z, 4Y~5Y were recorded for the horizontal-well cavity perimeter during the long-term operation of the natural gas storage. The locations of these points are shown in Figure 6.
The X-direction displacement of the horizontal-well cavity under different pressures is shown in Figure 7. The maximum X-direction displacement of the 50-year creep on both sides of the cavity waist is shown in Figure 8. The maximum X-direction displacement is always located on both sides of the cavity waist. The left side of the cavity is positively displaced, the right side of the cavity is negatively displaced, and the cavity waist tends to contract. From the cavity waist to the centre and inside of the cavity, the X-direction displacement gradually decreases. Except for the cavity waist, the X-displacement at other positions of the model is close to zero. The X-displacements on both sides of the cavity waist are asymmetrically distributed. At a pressure of 12 MPa, the maximum displacement of the left waist is 2.99485 m, which is located at the lower left side of the cavity. The maximum displacement of the right waist is 2.83489 m, located in the lower middle of the right side of the cavity waist. The contraction of the left side of the cavity waist is slightly stronger than that of the right side, and the displacement difference between the two sides of the cavity waist gradually decreases with the increase in the internal pressure (Figure 8). The displacements of the two sides were 0.156458 m and 0.16125 m, respectively, under a pressure of 20 MPa, and the left side is slightly larger than the right side. As the internal pressure increases, the displacement in the X-direction gradually decreases, and the distribution range of the larger displacement value decreases, so the increase in the internal pressure is conducive to the reduction of the displacement of the two sides of the cavity waist.
In Figure 9, the variation curves of 1X~8X displacements with the internal pressure at each year point are plotted, where points 1~6 on the left side of the cavity are positive X-displacements, and points 7~8 on the right side of the cavity are negative X-displacements. The displacement increases with creep time, but the rate of displacement increase gradually decreases, and the effect of creep duration on displacement increase decreases with increasing internal pressure. At the same time, the displacement decreases with the increase in the internal pressure, and the fastest tendency of the displacement decrease is when the creep time is 50 years. When the internal pressure is 12 MPa, the displacements at the recording points of the X-displacement are thus: 2X > 8X > 4X > 3X > 1X > 6X > 7X > 5X; the maximum displacements are at points 2 and 8 on the left and right sides of the cavity waist, respectively. The minimum displacements are at points 5, 6 and 7, located in the middle and the inner parts of the cavity. The displacements at points 1, 3 and 4 located in the transition position are in the middle of displacement range. The relative magnitude of these X-displacements is consistent with the displacement distribution in Figure 7.
The Y-displacement of the cavity perimeter under different internal pressures is shown in Figure 10, and combined with Figure 11, it can be seen that the Y-displacement of the cavity perimeter under different internal pressures decreases with the increase in the internal pressure, the cavity perimeter shows a tendency of shrinkage, and the cavity shrinkage is weakened with the increase in the internal pressure. As the internal pressure increases, the rate of increase of the Y-displacement of the cavity tends to be flat. Due to the constraints of the model, the Y-direction displacement is mainly inside the cavity, and the maximum Y-displacement is located at the depression of the narrowing cross-section on both sides of the interior of the cavity (near point 4); the displacement is 4Y > 5Y (Figure 10). This is consistent with the results of Figure 11, which indicates that the flat shape of the cavity and the narrowing of the cross-section are the areas where the larger values of the Y-displacement are distributed.
The Z-displacements of the cavity perimeter under different internal pressures are shown in Figure 12. The maximum Z-displacements are located in the middle of the upper and lower sides of the cavity, with negative values on the upper side and positive values on the lower side, and the upper and lower sides tend to shrink. The narrowing zone or the inhomogeneous transition zone at the top of the cavity narrows the cavity laterally, which in turn affects the displacement distribution. The maximum displacement (maximum subsidence) at the top end of the cavity is distributed in the transverse region at the centre of the cavity, while the Z-displacement at the waist and the inner and outer edges of the cavity are close to zero. The Z-displacement curves of the cavity’s sinking top and the expanding cavity’s bottom at each pressure are shown in Figure 13, and the Z-displacement of the cavity’s top is always larger than that of the cavity’s bottom.
Figure 14 shows the Z-displacement curves at different points around the cavity under different internal pressures. The values of 2Z, 4Z, 5Z and 7Z are positive displacements, and the values of 1Z, 3Z, 6Z and 8Z are negative displacements. The Z-displacement increases with the increase in time and decreases with the increase in internal pressure. The effect of operating duration on displacement decreases as the internal pressures increases. At high internal pressures, the increase in displacement values with time is very small, and the curve goes from left to right and from thin to dense. At an internal pressure of 12 MPa, the displacements at each point of the Z-displacement recording points are as follows: 6Z > 3Z > 8Z > 7Z > 4Z > 2Z > 1Z > 5Z. The maximum displacement is located at point 6 across the top plate of the cavity, while the minimum displacements are located at points 1 and 5 at the waist and outer edge of the cavity. The relative magnitudes of the Z-displacements are consistent with the displacement distribution in Figure 12.

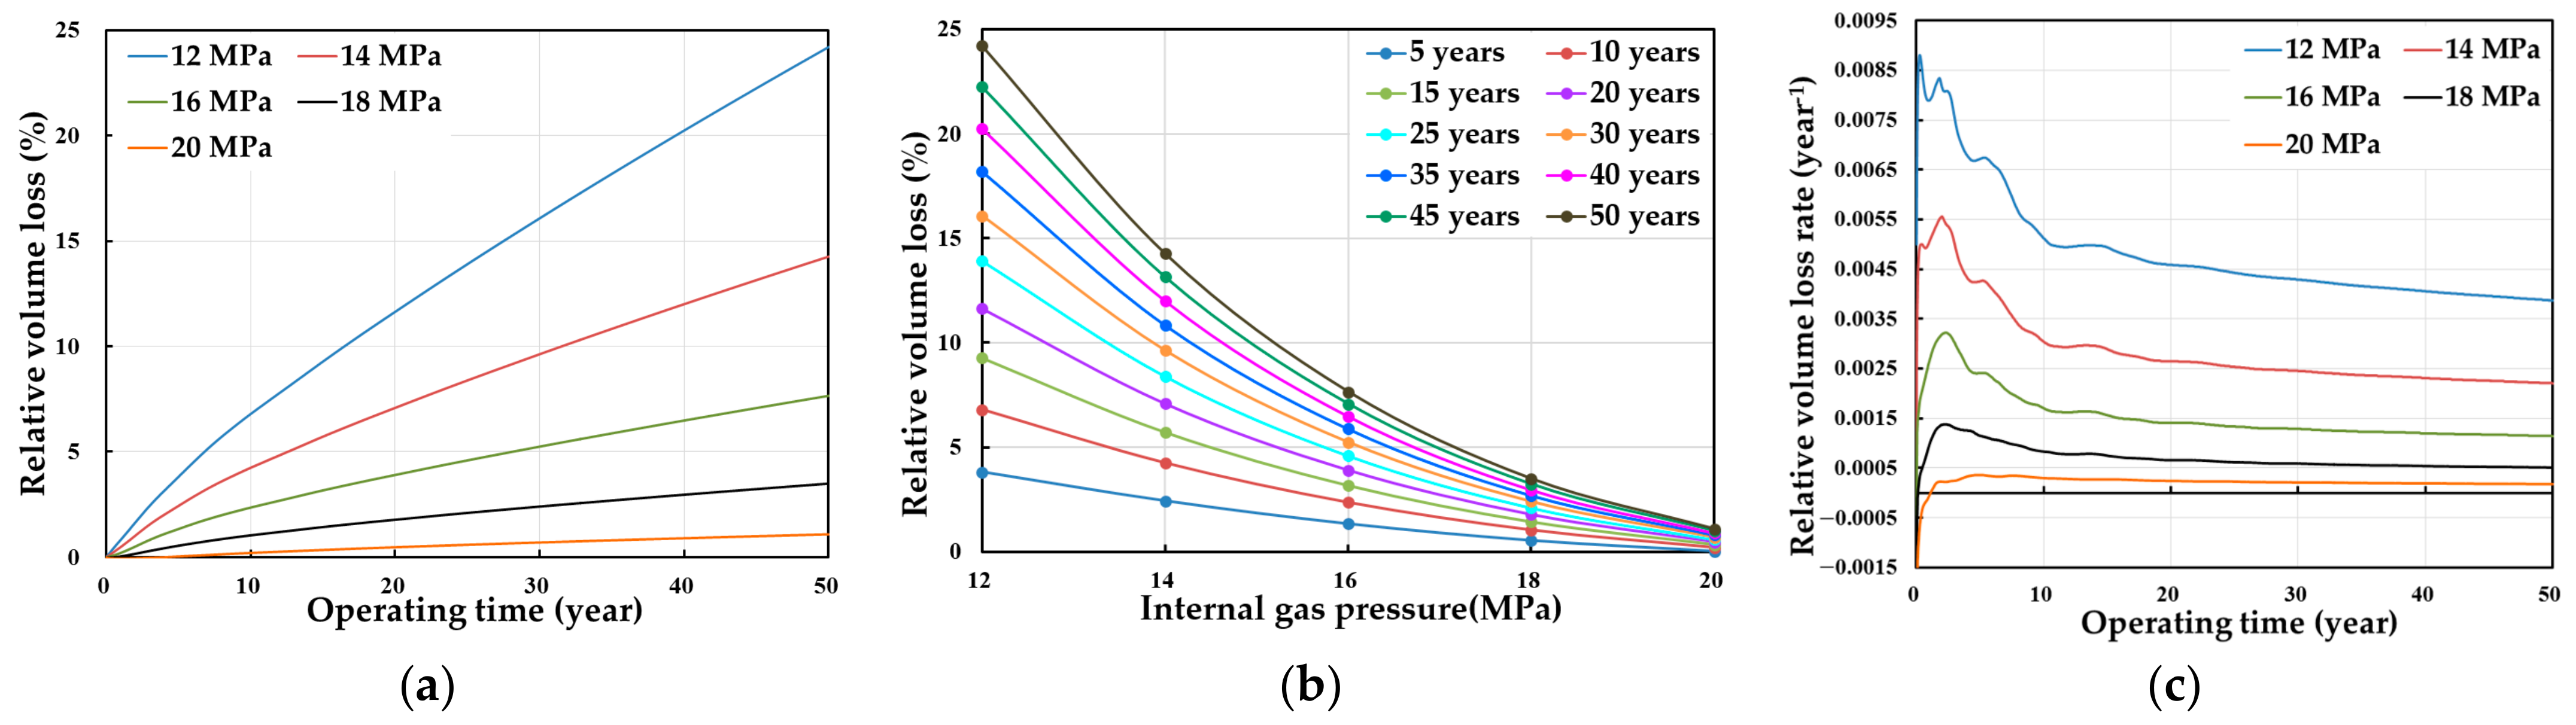
3.2.2. Relative Volume Loss of Horizontal-Well Cavity

The variation curves of cavity volume shrinkage with creep time under different internal pressures are shown in Figure 15. The cavity volume shrinkage under different internal pressures increases with the creep time, but the rate of increase gradually decreases with increasing internal pressure. The curve in Figure 15b is progressively denser from left to right and decreases from left to right with increasing internal pressure. From Figure 15c, it can be seen that the rate of change of the volume shrinkage is gradually decreasing and decreases from bottom to top with the increase in the internal pressure. The volume shrinkage of the cavity decreases as the pressure increases and the cavity volume tends to stabilise. The volume shrinkage of the cavity is less affected by the creep time when the internal pressure is higher than 14 MPa.

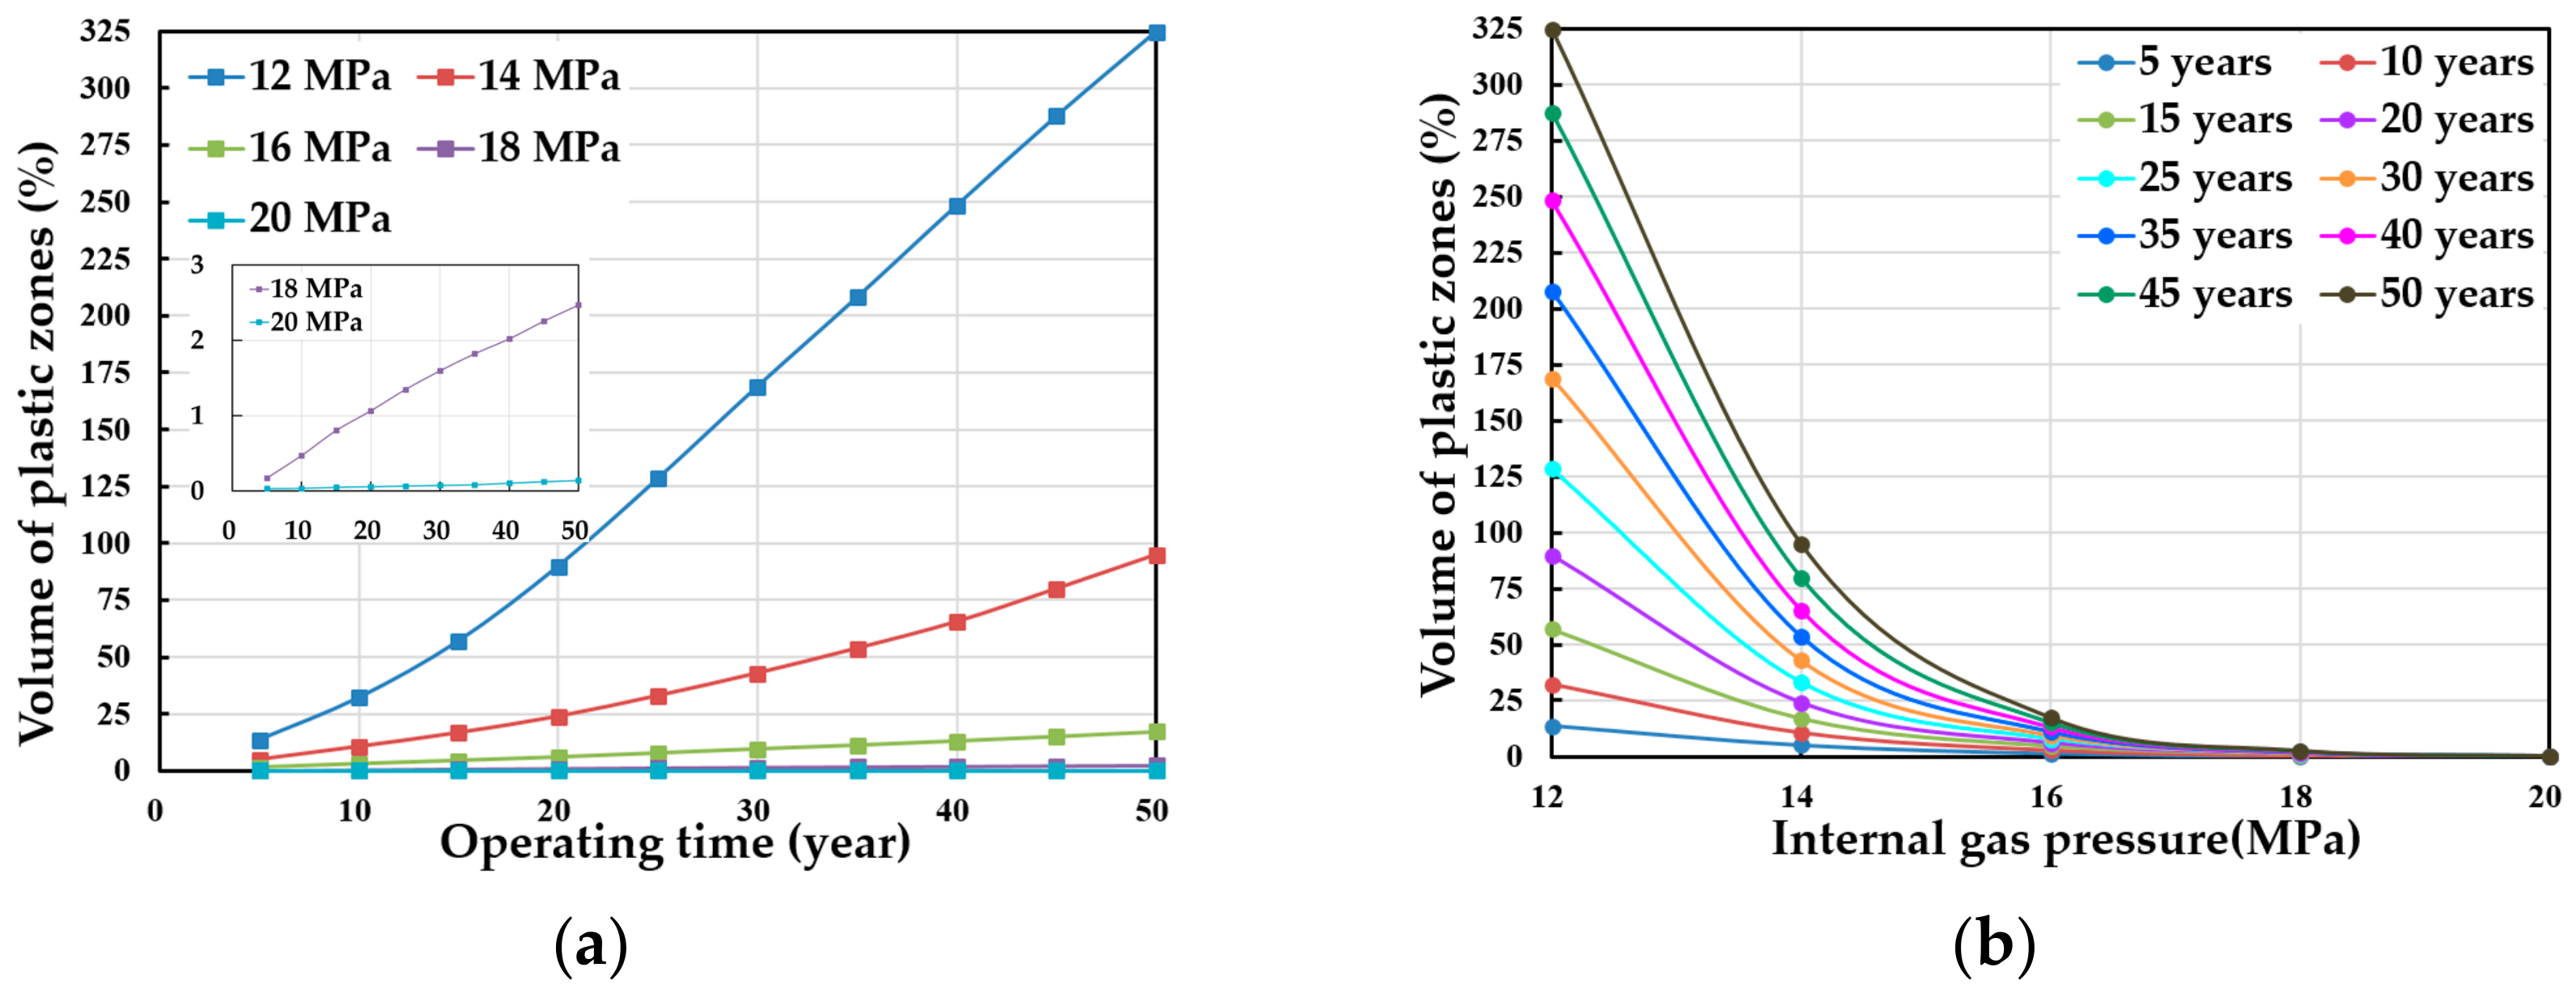
3.2.3. Plastic Zone Volume of Horizontal-Well Cavity
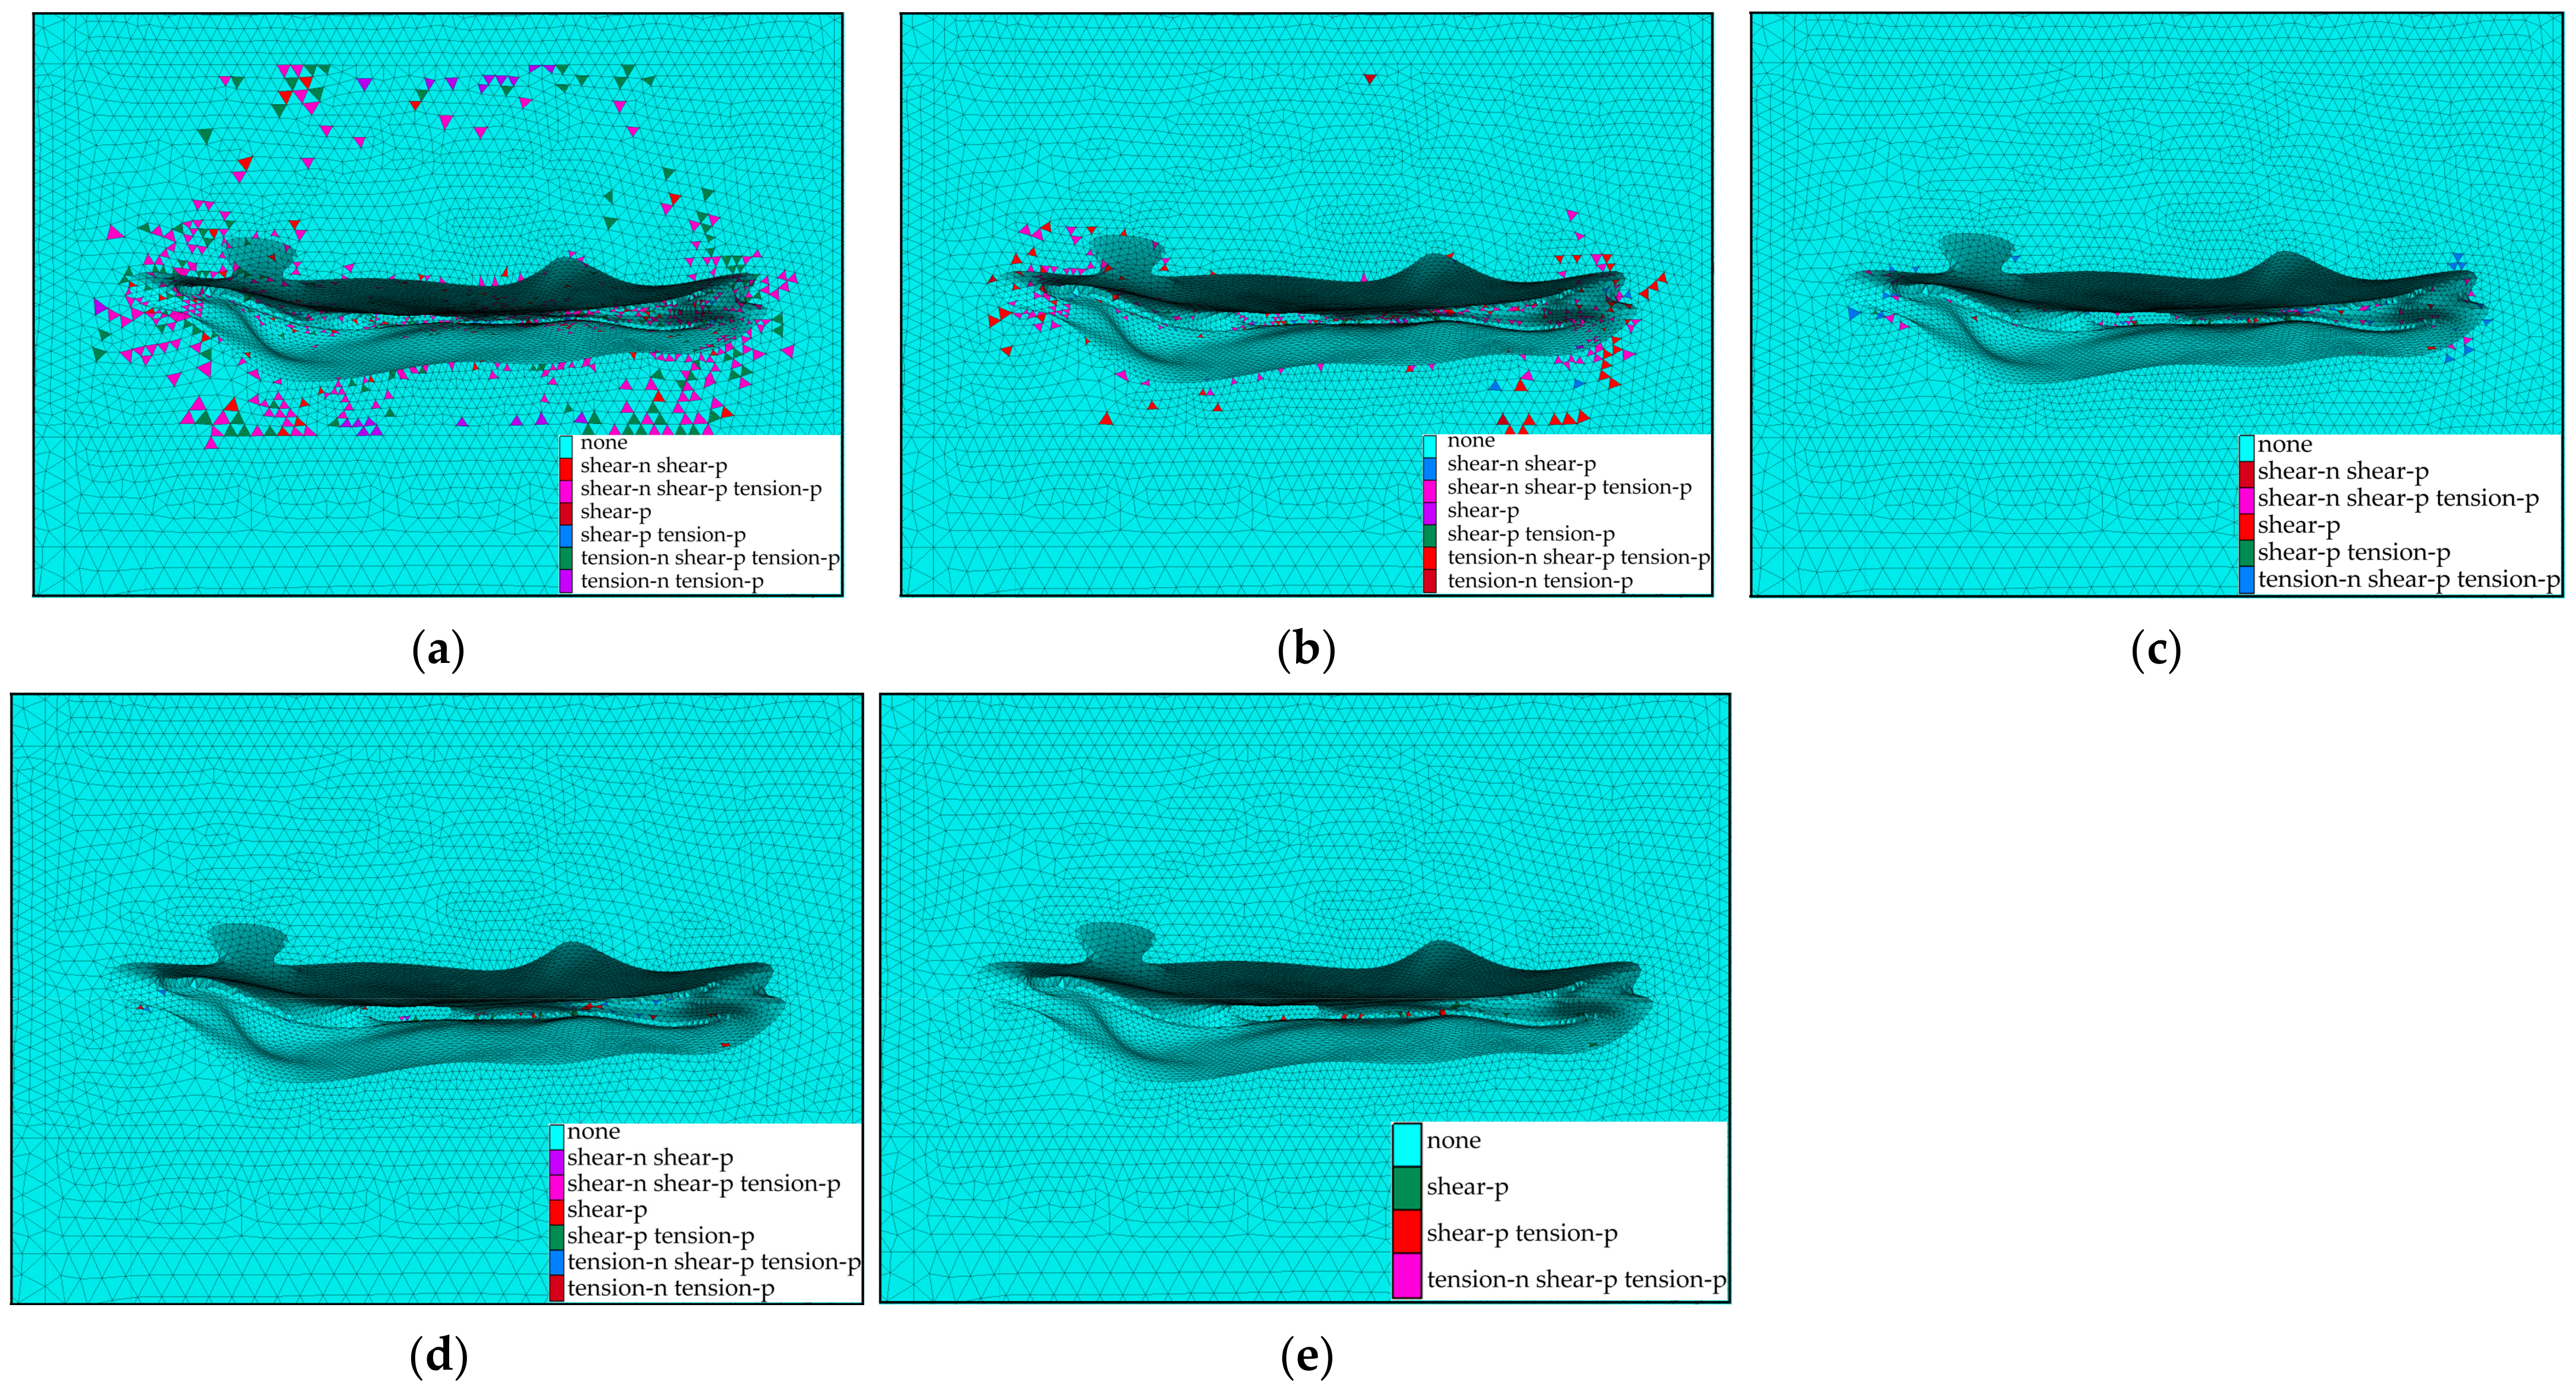
Figure 16 shows the variation curves of the volume of the plastic zone around the cavity with creep time at different internal pressures. The volume of the plastic zone of the cavity at different internal pressures increases with increasing creep time, but the growth rate of the volume of the plastic zone at different internal pressures is different. The volume of the plastic zone is closer at short creep times, with increasing creep time the influence of the internal pressure increases significantly. The volume of the plastic zone in the horizontal-well cavity creeping for 50 years under the condition of the internal pressure of 12 MPa reaches 324.76%, but with the increase of the internal pressure, the volume of the plastic zone decreases sharply. When the internal pressure is 14 MPa and 16 MPa, the maximum value of the 50-year creep of the volume of the plastic zone is 94.80% and 17.22%, respectively. The volume of the plastic zone also increases with time at internal pressures of 18 MPa and 20 MPa, but the changes are very small; the maximum values of the volume of the plastic zone at internal pressures of 18 MPa and 20 MPa are 2.47% and 0.14%, respectively.
The distribution of the plastic zone around the cavity under different operating pressures is shown in Figure 17. When the internal pressure is 12 MPa, the distribution of the plastic zone is the greatest, which is mainly around the cavity waist and the top and bottom plates. When the internal pressure is 14 MPa, the plastic zone is mainly distributed around the cavity waist. When the internal pressure is 18 or 20 MPa, the plastic zone is mainly distributed in the discontinuous transition position of the inner portion of the cavity waist, and the distribution area of the plastic zone is very small. As the internal pressure increases, the distribution area of the plastic zone around the cavity is significantly reduced. Increasing the cavity operating pressure is conducive to reducing plastic damage and improving the stability of the cavity.

4. Discussion

In the process of cavity leaching and dissolution, the injection of water has a certain direction, so the influence of injected fresh water on the concentration distribution has a large inhomogeneity, and the local solute transfer effect is obvious [33]. Since the height of the horizontal-well cavity is much smaller than the length, the dissolution process often leads to the phenomenon of asymmetry in the shape of the cavity on both sides of the horizontal-well cavity [34]. The upper wall of the cavity also undergoes the phenomenon of uneven expansion, which makes the subsequent sonar measurement of the cavity more difficult. Influenced by the asymmetric shape of the horizontal-well cavity, the control of the nitrogen cushion is also different from the control of the nitrogen cushion for single-well cavity construction, and the amount and time of nitrogen injection also need to be controlled in stages. In the early stage of the low-volume horizontal-well cavity and in the late stage of the high-volume horizontal-well cavity, the injection ports located at different positions have different effects on the concentration distribution in each region of the horizontal well cavity. At a fixed flow rate, the relative influence of freshwater injection (relative to the total cavity volume) decreases with increasing cavity volume, while the gravitational influence of the concentration gradient within the cavity increases [35]. Although the design of horizontal-well cavities differs in many aspects from that of single-well cavities in many ways, the key to controlling the shape of the cavity is still largely influenced by the concentration distribution [36]. Although the effective volume of a horizontal-well cavity natural gas storage is larger, the control of a horizontal-well cavity involves more factors [17,22], so the economics, construction efficiency and long-term stability of horizontal-well natural gas storage must also be considered when designing cavity construction parameters [18,37].
In the study of horizontal-well cavity leaching in salt rock, the relative distance and relative angle between the cavity wall surface and the injection port change as the injection port is gradually set back and the cavity expands by dissolution. Therefore, the influence of the position of the water injection port and the water injection flow rate on the dissolution rate of the cavity wall surface in each part of the cavity also changes dynamically. Since the volume of a horizontal-well cavity is different at different dissolution stages, the influence of the position of the water injection port and the water injection flow rate of the horizontal-well cavity, the concentration stratification of the brine in the horizontal-well cavity, and the influence of the position of the water inlet and outlet ports on the solute transport are the focus of experimental research. The morphological design of the horizontal-well cavity shape that is compatible with geological conditions, the development and practical validation of horizontal-well cavity leaching simulation software based on the dissolution law of a horizontal-well cavity, the cavity measurement technology of horizontal-well cavities with a large lateral span, and the repair and reconstruction of deformed cavities are all engineering challenges that need to be explored urgently.

5. Conclusions

The conclusions of the study on the construction and stability of horizontal-well cavity natural gas storage in this research are as follows: (1) the distance between the inner edge of the cavity and the injection port affects the distribution of flow and concentration fields in the cavity, causing the region near the injection port to dissolve faster. (2) The smaller the cavity volume and the closer the well spacing, the more the brine discharge concentration is affected by the flow rate. (3) The brine discharge concentration increased significantly with increasing well spacing, but the effect of increasing brine discharge concentration due to increasing well spacing gradually decreased with increasing cavity volume. (4) Due to the large lateral span of the horizontal wells, in the process of dissolution, the liquid level exhibits the phenomenon of not being horizontal and the phenomenon of the non-connection of air pressure between two wells. The dissolution and enlargement of the cavity, the evolution of the air pressure, the position of the injection port and the position of the brine discharge well all affect the movement and distribution of the liquid level position. (5) A high gas pressure reduces the overall displacement value, the volume shrinkage and the plasticity zone while also affecting the uneven transition zone of the cavity cross-section. To ensure the stability of a horizontal-well natural gas cavity storage in long-term operations, it is recommended for the internal pressure of the cavity to be higher than 14 MPa.

Author Contributions

Conceptualization, methodology, writing—original draft preparation, D.L.; formal analysis, funding acquisition, J.C.; writing—review and editing, F.W.; validation, funding acquisition, D.J.; software, project administration, W.L.; data curation, B.D.; investigation, X.L.; visualization, funding acquisition, Y.K.; resources, funding acquisition, Y.H. All authors have read and agreed to the published version of the manuscript.

Funding

This research was funded by the National Natural Science Foundation of China (Grant Numbers 52022014, 51834003, 52204088) and the China Postdoctoral Science Foundation (Grant Numbers 2023M730427).

Data Availability Statement

Data are contained within the article.

Conflicts of Interest

The authors declare no conflict of interest.

References

  1. Ahmed, D.S.; El-Hiti, G.A.; Yousif, E.; Hameed, A.S.; Abdalla, M. New Eco-Friendly Phosphorus Organic Polymers as Gas Storage Media. Polymers 2017, 9, 336. [Google Scholar] [CrossRef]
  2. Hadi, A.G.; Jawad, K.; Yousif, E.; El-Hiti, G.A.; Alotaibi, M.H.; Ahmed, D.S. Synthesis of Telmisartan Organotin(IV) Complexes and their use as Carbon Dioxide Capture Media. Molecules 2019, 24, 1631. [Google Scholar] [CrossRef]
  3. Capros, P.; Zazias, G.; Evangelopoulou, S.; Kannavou, M.; Fotiou, T.; Siskos, P.; De Vita, A.; Sakellaris, K. Energy-system modelling of the EU strategy towards climate-neutrality. Energy Policy 2019, 134, 110960. [Google Scholar] [CrossRef]
  4. Rodrigues, R.; Pietzcker, R.; Fragkos, P.; Price, J.; McDowall, W.; Siskos, P.; Fotiou, T.; Luderer, G.; Capros, P. Narrative-driven alternative roads to achieve mid-century CO2 net neutrality in Europe. Energy 2022, 239, 121908. [Google Scholar] [CrossRef]
  5. Wang, T.; Yan, X.; Yang, H.; Yang, X.; Jiang, T.; Zhao, S. A new shape design method of salt cavern used as underground gas storage. Appl. Energy 2013, 104, 50–61. [Google Scholar] [CrossRef]
  6. Yang, C.; Wang, T. Advance in deep underground energy storage. Chin. J. Rock Mech. Eng. 2022, 41, 1729–1759. [Google Scholar]
  7. Li, Z.; Suo, J.; Fan, J.; Fourmeau, M.; Jiang, D.; Nelias, D. Damage evolution of rock salt under multilevel amplitude creep–fatigue loading with acoustic emission monitoring. Int. J. Rock Mech. Min. Sci. 2023, 164, 105346. [Google Scholar] [CrossRef]
  8. Malyukov, V.P.; Shepilev, A.A. Innovative Technologies for Construction of Horizontal and Double-Deck Underground Tanks in Rock Salt. In Processes in GeoMedia—Volume IV; Springer Geology; Chaplina, T., Ed.; Springer: Cham, Switzerland, 2022. [Google Scholar]
  9. Shi, X.; Chen, Q.; Ma, H.; Li, Y.; Wang, T.; Zhang, C. Geomechanical investigation for abandoned salt caverns used for solid waste disposal. Bull. Eng. Geol. Environ. 2021, 80, 1205–1218. [Google Scholar] [CrossRef]
  10. Wang, J.; Wang, N.; Xu, K.; Xia, J. Calculation method for effective cavity volume of salt cavern gas storage. Oil Gas Storage Transp. 2021, 40, 909–913. [Google Scholar]
  11. Yu, P. An optimization mass-balance method for calculating the leaching volume of salt-cavern underground gas storage. Petrochem. Ind. Appl. 2020, 39, 4. [Google Scholar]
  12. Jiang, D.; Wang, Y.; Liu, W.; Li, L.; Qiao, W.; Chen, J.; Li, D.; Li, Z.; Fan, J. Construction simulation of large-spacing-two-well salt cavern with gas cushion and stability evaluation of cavern for gas storage. J. Energy Storage 2022, 48, 103932. [Google Scholar] [CrossRef]
  13. Jiang, D.; Li, Z.; Liu, W.; Ban, F.; Chen, J.; Wang, Y.; Fan, J. Construction simulating and controlling of the two-well-vertical(TWV) salt caverns with gas cushion. J. Nat. Gas Sci. Eng. 2021, 96, 104291. [Google Scholar] [CrossRef]
  14. Wang, T.; Yang, C.; Li, J.; Li, J.; Shi, X.; Ma, H. Failure Analysis of Overhanging Blocks in the Walls of a Gas Storage Salt Cavern: A Case Study. Rock Mech. Rock Eng. 2016, 50, 125–137. [Google Scholar] [CrossRef]
  15. Zhang, Y.; Ma, H.; Shi, X.; Yin, H.; Zhang, S. Position design of the casing shoe of an abandoned horizontal salt cavern to be used for gas storage. Energy Sources Part A Recovery Util. Environ. Eff. 2019, 45, 2651–2665. [Google Scholar] [CrossRef]
  16. Gronefeld, P.; Pape, T. Simulation of Horizontal Solution Mining Processes. In Proceedings of the Solution Mining Research Institute Spring Meeting, Hannover, Germany, 25 September–1 October 1994. [Google Scholar]
  17. Zhang, G.; Zhang, H.; Liu, Y.; Wang, T.; Wang, Z. Surrounding rock stability of horizontal cavern reconstructed for gas storage. J. Energy Storage 2023, 59, 106534. [Google Scholar] [CrossRef]
  18. Wang, J.; Wang, X.; He, M.; Song, Z.; Feng, S.; Liu, X.; Zhang, Y. Long-term stability analysis and evaluation of horizontal salt cavern gas storage. J. Energy Storage 2023, 66, 107413. [Google Scholar] [CrossRef]
  19. Yuan, G.; Wan, J.; Li, J.; Li, G.; Xia, Y.; Ban, F.; Zhang, H.; Jurado, M.J.; Peng, T.; Liu, W. Stability analysis of a typical two-well-horizontal saddle-shaped salt cavern. J. Energy Storage 2021, 40, 102763. [Google Scholar] [CrossRef]
  20. Zhang, G.; Wang, Z.; Liu, J.; Li, Y.; Cui, Z.; Zhang, H.; Wang, H.; Sui, L. Stability of the bedded key roof above abandoned horizontal salt cavern used for underground gas storage. Bull. Eng. Geol. Environ. 2020, 79, 4205–4219. [Google Scholar] [CrossRef]
  21. Li, P.; Li, Y.; Shi, X.; Zhao, A.; Hao, S.; Gong, X.; Jiang, S.; Liu, Y. Stability analysis of U-shaped horizontal salt cavern for underground natural gas storage. J. Energy Storage 2021, 38, 102541. [Google Scholar] [CrossRef]
  22. Xing, W.; Zhao, J.; Hou, Z.; Were, P.; Li, M.; Wang, G. Horizontal natural gas caverns in thin-bedded rock salt formations. Environ. Earth Sci. 2015, 73, 6973–6985. [Google Scholar] [CrossRef]
  23. Cristescu, N.D.; Paraschiv, I. The optimal shape of rectangular-like caverns. Int. J. Rock Mech. Min. Sci. Geomech. Abstr. 1995, 32, 285–300. [Google Scholar] [CrossRef]
  24. Xiao, N.; Liang, W.; Yu, Y.; Zhang, S.; Li, L. Shape prediction and parameter optimization of single-well retreating horizontal salt cavern for energy storage. J. Energy Storage 2023, 59, 106557. [Google Scholar] [CrossRef]
  25. Peng, T.; Wan, J.; Liu, W.; Li, J.; Xia, Y.; Yuan, G.; Jurado, M.J.; Fu, P.; He, Y.; Liu, H. Choice of hydrogen energy storage in salt caverns and horizontal cavern construction technology. J. Energy Storage 2023, 60, 106489. [Google Scholar] [CrossRef]
  26. Jinlong, L.; Wenjie, X.; Jianjing, Z.; Wei, L.; Xilin, S.; Chunhe, Y. Modeling the mining of energy storage salt caverns using a structural dynamic mesh. Energy 2019, 193, 116730. [Google Scholar] [CrossRef]
  27. Li, J.; Zhang, N.; Xu, W.; Naumov, D.; Fischer, T.; Chen, Y.; Zhuang, D.; Nagel, T. The influence of cavern length on deformation and barrier integrity around horizontal energy storage salt caverns. Energy 2022, 244, 123148. [Google Scholar] [CrossRef]
  28. Yang, J.; Li, H.; Yang, C.; Li, Y.; Wang, T.; Shi, X.; Han, Y. Physical simulation of flow field and construction process of horizontal salt cavern for natural gas storage. J. Nat. Gas Sci. Eng. 2020, 82, 103527. [Google Scholar] [CrossRef]
  29. Wang, J.; An, G.; Wang, W.; Jia, J.; Liu, C.; Miao, S.; Wang, D.; Chen, C. Solution-mining-under-nitrogen technology for salt-cavern gas storage and field test. Oil Gas Storage Transp. 2021, 40, 802–808. [Google Scholar]
  30. Li, J.; Shi, X.; Yang, C.; Li, Y.; Wang, T.; Ma, H.; Shi, H.; Li, J.; Liu, J. Repair of irregularly shaped salt cavern gas storage by re-leaching under gas blanket. J. Nat. Gas Sci. Eng. 2017, 45, 848–859. [Google Scholar] [CrossRef]
  31. Liu, W.; Jiang, D.; Chen, J.; Daemen JJ, K.; Tang, K.; Wu, F. Comprehensive feasibility study of two-well-horizontal caverns for natural gas storage in thinly-bedded salt rocks in China. Energy 2018, 143, 1006–1019. [Google Scholar] [CrossRef]
  32. Li, J.L.; Yang, C.H.; Shi, X.L.; Xu, W.J.; Li, Y.P.; Daemen, J.J.K. Construction modeling and shape prediction of horizontal salt caverns for gas/oil storage in bedded salt. J. Petrol. Sci. Eng. 2020, 190, 107058. [Google Scholar] [CrossRef]
  33. Malyukov, V. Studies of the Construction of Horizontal Underground Workings-Tanks Under the Impact of Solution on Rock Salt. In PMMEEP 2022: Physical and Mathematical Modeling of Earth and Environment Processes—2022; Springer: Berlin/Heidelberg, Germany, 2023; pp. 387–393. [Google Scholar]
  34. Wan, J. Influence of tubing/oil-blanket lifting on construction and geometries of two-well-horizontal salt caverns. Tunn. Undergr. Space Technol. 2020, 108, 103688. [Google Scholar] [CrossRef]
  35. Saberian, A. A Preliminary Model Horizontal Well Leaching; SMRI Library: San Antonio, TX, USA, 1995. [Google Scholar]
  36. Wang, J.; Wang, Z.; Zeng, Q.; Ding, G.; Li, K.; Wanyan, Q.; Wang, Y. Simulation of Flow Field of Solution Mining Salt Cavities for Underground Gas Storage. J. Energy Resour. Technol. 2022, 145, 022001. [Google Scholar] [CrossRef]
  37. Li, Q.; Ning, Z.; Liu, J.; Xu, W.; Zhan, L.; Liu, J.; Chen, Y.; Shi, X.; Chen, X.; Li, J. Stability and economic evaluation of multi-step horizontal salt caverns with different step distances in bedded salt formations. J. Energy Storage 2023, 57, 106192. [Google Scholar] [CrossRef]
Figure 1. Schematic diagram of test platform and rubber hose connections.
Energies 16 07877 g001
Figure 2. Cavity expansion diagram for horizontal-well cavity leaching test with nitrogen cushion.
Energies 16 07877 g002
Figure 3. Variation curves of brine discharge concentration during horizontal-well cavity leaching test with nitrogen cushion. The red line represents the concentration level of 290 g/L.
Energies 16 07877 g003
Figure 4. Paraffin models of horizontal-well cavity created with nitrogen cushion: (a) front view, (b) rear view.
Energies 16 07877 g004
Figure 5. Geological model of the horizontal-well cavity natural gas storage.
Energies 16 07877 g005
Figure 6. Location of displacement recording points for the horizontal-well cavity created with nitrogen cushion: (a) front view, (b) rear view, (c) top view.
Energies 16 07877 g006
Figure 7. Cloud map of the displacement in the X-direction around the perimeter of the horizontal-well cavity created with nitrogen cushion (50 years): (a) p = 12 MPa; (b) p = 14 MPa; (c) p = 16 MPa; (d) p = 18 MPa; (e) p = 20 MPa.
Energies 16 07877 g007
Figure 8. Maximum X-displacement of the cavity perimeter of the horizontal-well cavity created with nitrogen cushion (50 years).
Energies 16 07877 g008
Figure 9. Logging points 1~8X displacement curves of the horizontal-well cavity created with nitrogen cushion: (a) 1X; (b) 2X; (c) 3X; (d) 4X; (e) 5X; (f) 6X; (g) 7X; (h) 8X.
Energies 16 07877 g009aEnergies 16 07877 g009b
Figure 10. Cloud map of the displacement in the Y-direction around the perimeter of the horizontal-well cavity created with nitrogen cushion (50 years): (a) p = 12 MPa; (b) p = 14 MPa; (c) p = 16 MPa; (d) p = 18 MPa; (e) p = 20 MPa.
Energies 16 07877 g010aEnergies 16 07877 g010b
Figure 11. Y-displacement of the cavity perimeter of the horizontal-well cavity created with nitrogen cushion (50 years): (a) Ymax; (b) 4Y; (c) 5Y.
Energies 16 07877 g011
Figure 12. Cloud map of the displacement in the Z-direction around the perimeter of the horizontal-well cavity created with nitrogen cushion (50 years): (a) p = 12 MPa; (b) p = 14 MPa; (c) p = 16 MPa; (d) p = 18 MPa; (e) p = 20 MPa.
Energies 16 07877 g012aEnergies 16 07877 g012b
Figure 13. Maximum Z-displacement of the cavity perimeter of the horizontal-well cavity created with nitrogen cushion (50 years).
Energies 16 07877 g013
Figure 14. Logging points 1–8Z displacement curves of the horizontal-well cavity created with nitrogen cushion. (a) 1Z; (b) 3Z; (c) 6Z; (d) 8Z; (e) 2Z; (f) 4Z; (g) 5Z; (h) 7Z.
Energies 16 07877 g014
Figure 15. Horizontal-well cavity created with nitrogen cushion: (a) relative volume loss versus time curves; (b) relative volume loss versus internal pressure curves; (c) RVL rate versus time curves.
Energies 16 07877 g015
Figure 16. Horizontal-well cavity created with nitrogen cushion: (a) volume of plastic zone versus time curves; (b) volume of plastic zone versus internal pressure curves.
Energies 16 07877 g016
Figure 17. Distribution of plastic zones around horizontal-well cavity created with nitrogen cushion: (a) p = 12 MPa; (b) p = 14 MPa; (c) p = 16 MPa; (d) p = 18 MPa; (e) p = 20 MPa.
Energies 16 07877 g017
Table 1. Parameters’ dimensions.
ParametersDimension (Unit)ParametersDimension (Unit)
lLcML−3
TTTΘ
ρML−3qL3T−1
ωML−2T−1
Table 2. Relevant similarity ratios in the cavity leaching test.
ParametersCavity Diameter
/m
Density of Salt Rock/kg·m−3Dissolution Rate of the Brine/g·cm−2·h−1Mining Time/hBrine
Concentration/g·L−1
Flow Rate/
mL·min−1
Prototype12521763.68--50 m3/h
Model0.2521171.42--10 mL/min
Similarity Ratio50012.591500183,333
Table 3. Tubes’ diameter in horizontal-well cavity leaching tests.
TubesInner
Diameter (mm)
Outer
Diameter (mm)
Wall Thickness (mm)Tube Length (mm)Notes
Casing560.560Fixed with volcanic clay and AB adhesive at the upper end of the slot on both sides for inserting the injection tube and drainage tube
Stainless Tube—Nitrogen Injection Pipe3.640.2130Fixed with volcanic mud and AB adhesive on the upper end of the slot on both sides
Stainless Pipe-Drainage Pipe3.640.2240Inserted into the casing at the right, straight-well end and wrapped with waterproof tape on the outer layer
Rubber Hose 1#351-Water injection tube inserted into the casing in the inclined well, sealing tube at the upper end of the nitrogen injection tube
Rubber Hose 2#4616Wrapped around the outside of the casing to seal the wellhead on both sides
Rubber Hose 3#482-Externally connected to the flow meter and indirectly connected to the tap
Rubber Hose 4#791-Externally connected to the water tap and connected to rubber hose 4#
Table 4. Phase division of the cavity leaching test with nitrogen cushion.
StageDuration (h)Flow Rate (mL/min)Wellhead Distance (mm)
1335
2365
3395
43335
53635
63935
73365
83665
93965
103395
1133125
1236125
1339125
141012125
152812155
16712155
171015155
Table 5. Material setting parameters for hydrostatic calculation.
LithologyModulus of Elasticity (GPa)Poisson’s
Ratio
Cohesive Force (MPa)Internal Friction Angle (°)Tensile Strength (MPa)
Mudstone100.272.5351.5
Rock salt150.31.7537.51.25
Disclaimer/Publisher’s Note: The statements, opinions and data contained in all publications are solely those of the individual author(s) and contributor(s) and not of MDPI and/or the editor(s). MDPI and/or the editor(s) disclaim responsibility for any injury to people or property resulting from any ideas, methods, instructions or products referred to in the content.

