1. Introduction
During operation, structures and machines must function correctly to ensure efficiency and process safety. However, problems such as inadequate maintenance, accidents, or natural disasters can compromise these systems, leading to financial losses or even catastrophes that endanger the environment and operators. To ensure the efficient and safe operation of these systems, engineers work tirelessly to create and improve monitoring and maintenance techniques. As an example, there is Structural Health Monitoring (SHM), defined by [
1] as the process of implementing a damage identification strategy for engineering systems, which has been used in recent decades to improve lifetime and safety. According to [
2], SHM can be divided into damage detection, prognosis, and risk assessment, the first step being the one that collects the system responses over extended periods, normalizes the data to analysis, extracts damage sensitive features, and implements a robust method for damage detection.
There are many techniques for applying SHM to machines and structures. Among them is the use of the system’s modal parameters as damage sensitive features, since changes in the structure due to faults or failures usually alter the system’s modal parameters. The modal parameters can be extracted using only the measured outputs of the system by a modal testing known as Operational Modal Analysis (OMA). OMA’s premise is that the environmental loads acting upon the system (such as wind, vehicle traffic, and the operation of machines) excite it with an approximate white noise signal. Therefore, the system does not need to be excited by specific equipment and does not need to be taken out of operation to enable modal parameter identification. Since the idea of SHM involves the constant monitoring of the structure, OMA becomes an alternative to monitoring while in operation.
In the past decades, OMA has been successfully applied to civil structures, such as bridges, buildings, and wind turbines. Its application in rotating machines is more recent and still in development because these systems are more complex, making it more difficult to apply OMA. However, the interest in extracting modal parameters of rotating machines via OMA has been constant and growing.
Regarding the challenges of applying OMA to rotating machines, it is important to mention that, depending on the installation location, some rotating machines may not be excited with a white noise signal and can be subjected to periodic excitations arising from their operation or from the operation of machines in their surroundings. All these conditions conflict with OMA’s main premise, making the application of OMA to rotating machines challenging. The presence of periodic excitations imposed by rotating parts can pose challenges to the identification, either by masking modes or by being mistaken for them. This subject has already been addressed by many authors, who proposed techniques to identify the modal parameters even in the presence of harmonic excitation, such as the work presented by [
3]. However, research carried out by [
4] demonstrated that the white noise excitation is determinant in the identification of the rotating machines’ modal parameters through OMA, an identification that is impossible in cases when, for example, the machine is operating without sufficient white noise excitation.
Since the excitation conditions are not always adequate for extracting modal parameters from rotating machines, continuous monitoring systems based on OMA may not always be effective. In cases where the excitation condition is not similar to a white noise excitation, modal parameters that do not describe the physics of the system will be identified, as will identified changes in modal parameters be mistaken for a structural change or a fault in the system, giving a false alarm. In addition to causing false alarms, leading to unnecessary downtime and maintenance, these monitoring systems can fail to alert when the structure is in fact compromised, bringing several risks to the machine’s operation. Furthermore, field tests can also be impacted by the presence of inappropriate excitation conditions. The authors were in contact with engineers who apply OMA’s techniques to rotating machines in operation. These engineers reported that they would often go to the field and collect a series of measurements to take back to the office and apply OMA, but were frequently unable to extract the modal parameters of interest because the excitation conditions, and therefore the collected vibration signals, were inadequate for OMA. In these situations, they would have to go back to the field and collect another series of measurements to apply OMA once again.
In addition to promoting unnecessary expense and wasted time, these circumstances could generate the idea that OMA is not suitable for extracting the modal parameters of rotating machines. However, it was demonstrated by [
4] that OMA is a promising tool when the excitation conditions are adequate, extracting values very close to those obtained with well-established Experimental Modal Analysis (EMA) methods, and having the advantages of dismissing the use of excitation equipment, not taking the machine out of operation, reducing costs, and enabling continuous monitoring. More recent studies carried out by [
5] showed that even the turbulent gas flow within the seals of a turbomachine can be used to excite the system and identify the modal parameters via OMA, demonstrating OMA’s potential for condition monitoring. Moreover, in [
6] it was verified that a hybrid approach based on both OMA and EMA was able to diagnose a vibration problem in a large rotating machine used in the power generation industry. It is important to highlight that OMA was used to identify that a resonance frequency was causing the problem. EMA, on the other hand, was unable to identify the problem, most likely because of the insufficient input excitation when the system was out of operation, and was used to confirm that the problem was coming from the foundation rather than the machine itself.
The automation of OMA techniques has also become a relevant and very active field of research since 2005 [
7]. In this context, machine learning techniques were used to solve challenges of automation, with emphasis on the works of [
8,
9], who used unsupervised learning to automatically interpret the results of the Stochastic Subspace Identification (SSI) technique. More recently, the matter has been addressed by [
10,
11,
12,
13,
14,
15,
16,
17,
18], and existing approaches were already in use in [
19,
20] for condition monitoring of wind turbines, highlighting the relevance of the subject to current research.
Seeking to avoid problems with inadequate excitation conditions and considering the promising application of machine learning to overcome the challenges of OMA, a methodology that classifies vibration signals as adequate or inadequate for extracting modal parameters of rotating machines through OMA is proposed based on the K-means clustering algorithm. The purpose and main challenge addressed by this research is to provide an easy-to-adjust and easy-to-use tool with low computational cost that reveals the quality of measurements in terms of the ability to extract modal parameters via OMA. This obviates the need to apply OMA to find out whether accurate modal parameters can be extracted from the collected vibration signals. To the authors’ knowledge, there is no other research that addresses this subject. The contribution of such a tool is to make monitoring systems more reliable and enable the evaluation of measurements during field tests.
The methodology was inspired by studies that use statistical features to identify faults in rotating machines. In [
21], statistical features were extracted from the vibration signals of a rotating machine with faults in the rolling bearing. The authors found that a certain combination of features enabled the identification of faults through clustering techniques, achieving up to 100% accuracy. More recently, similar studies were carried out by [
22]. Since it was proved that statistical features can provide important information about the health state of rotating machines, the idea behind this research is to evaluate whether there are combinations of these features that provide information regarding OMA. Therefore, the methodology proposed in this paper evaluates the vibration signals in terms of statistical features (such as the ones employed by [
21]) in the context of OMA. Since these features are easy to extract and the computational cost to extract them is lower than the computational cost for OMA, they meet the aforementioned requirements for this methodology. Moreover, the results are easy to interpret, making it possible to apply and obtain information about the measurements in the field. Since related works were not applied in the context of OMA, the results obtained with the methodology cannot be directly compared with others in the literature. However, the accuracy during a testing stage is evaluated, just as performed by [
21].
To test the proposed methodology, OMA was performed using the Stochastic Subspace Identification (SSI) technique and an automatic identification algorithm was employed to automatically interpret the stabilization diagram obtained by the SSI technique and to identify the global modes of the system under analysis. A dataset with the response measurements of a test rig with a rotor supported by hydrodynamic bearings, obtained using different operating and excitation conditions, was employed to test the algorithm.
2. Materials and Methods
From systems under operational conditions, operational modal analysis extracts the modal parameters that can be used to evaluate the system’s health condition because faults and failures lead to changes in the modal parameters. Experimental Modal Analysis (EMA) is a traditional and accurate method to extract these parameters from systems, based on known inputs and outputs of the system. OMA, on the other hand, is more recent and is based only on the outputs of the system, working if the unknown input is similar to white noise. OMA has the advantages of not taking the system out of operation, not requiring highly controlled excitation conditions, reducing costs, taking modal parameters during operation, and enabling constant monitoring. As mentioned in the introduction, the automation of OMA has been a subject of interest in the past few decades. To meet the current trends, this research applied the automated version of OMA proposed by [
15] that is briefly presented in
Section 2.1.
In the context of this research, EMA was applied to the system, which provided reference values for the modal parameters of the system, as will be presented in
Section 2.2. OMA, on the other hand, was applied to a set of measurements taken under different conditions that simulate the real operating conditions of a rotating machine, as will also be presented in
Section 2.2. If the simulated excitation condition is adequate for OMA, the modal parameters extracted would be close to the EMA reference. Therefore, the modal parameters extracted from OMA were compared to the EMA reference. This evaluation was performed for all signals presented in
Section 2.2, in a way that it was possible to classify each signal, and therefore the excitation condition, as adequate or inadequate for OMA. The results of this comparison were used to evaluate the features that could provide the same information without the application of OMA, as will be presented in
Section 3.
The idea behind the proposed methodology is to extract statistical features, such as mean value, RMS, and kurtosis, from vibration signals based on known equations, and then use them as entry values in the K-means clustering technique, a simple and well-established machine learning technique, to classify the signals. The methodology does not propose any modification to the K-means technique or to the feature extraction. A brief explanation of the K-means clustering technique is presented in
Section 2.3 and the equations for the statistical feature extraction can be found in [
21].
2.1. Automatic Algorithm
An algorithm that automatically extracts global modes from the stabilization diagram of a signal was developed [
15]. Each step of this algorithm was chosen considering the different characteristics of rotating machines, such as the presence of harmonics, outliers, the gyroscopic effect, and the complexity of the mode shapes. Its effectiveness was proved by its application to the same dataset used in this paper. In summary, the automatic identification algorithm was divided into the following steps:
Create the stabilization diagram using SSI and classify each pole based on stabilization criteria (frequency deviation, damping factor deviation, and MAC). Further explanations about the SSI method can be found in [
23].
Clear the stabilization diagram based on damping factors and complex conjugated pairs.
Group poles representing the same mode with agglomerative hierarchical clustering, manually selecting the limit for the similarity measure.
Remove from each cluster poles of repeated orders, so that only one pole of this order remains.
Eliminate small clusters, which generally represent clusters of spurious poles.
Perform an outlier detection based on the boxplot method.
Describe the global modes by the clusters’ mean frequency, mean damping, and mean mode shape.
2.2. Description of Dataset
The data set used in this work was taken from a test rig with a rotor supported by hydrodynamic bearings, displayed in
Figure 1.
The system basically comprises a rotating steel shaft (15 mm in diameter and 719 mm in length) supported by two hydrodynamic bearings (31 mm diameter, 18 mm length, 90 µm of radial clearance, using ISO VG32 oil at ambient temperature as the working fluid) connected to an electric motor through a flexible coupling. In addition, the system has a hard disk and an electromagnetic actuator. The experiments were carried out with the rotor operating at an angular frequency of 75 Hz. The natural frequencies of interest were in the frequency range of 0 to 300 Hz. Therefore, the sampling frequency was chosen to be at least 3 times the Nyquist frequency (600 Hz). Four Brüel & Kjær™ type 4384 accelerometers, installed in both bearings (two accelerometers for each bearing), were used to collect the vibrations in the Y and Z directions. Moreover, two filters were used, one for removing the static gain and the other as an anti-aliasing low-pass analog filter.
As already mentioned, rotating machines can be subjected to different types of excitation conditions that can facilitate or hinder the application of OMA. Hence, more than one test condition was used, with variation of inputs, excitation directions, sampling frequencies, and periods of time, resulting in the tests displayed in
Table 1. Altogether, 106 measurements were collected.
An EMA analysis was also carried out to determine the modal parameters of the analyzed rotor, so that their correct values were known for further validation of the OMA’s results. Five measurements were collected to compute mean values and diminish random errors. The results are displayed in
Table 2. It is important to emphasize that the motion of a rotor is composed of two rotations: the rotor spin, that is its rotation around itself; and the rotor precession, that is the rotation of the deflected shaft around its undeflected configuration. The precession motion has two components: the forward one, which occurs in the same direction as the rotor spin; and the backward one, which occurs in the opposite direction of the rotor spin. Each precession motion is related to a mode of the system, the forward and backward modes, which vary with the rotating frequency of the rotor. The EMA tests were carried out at the rotating frequency of 75 Hz, yielding two pairs of forward and backward modes. The electricity supply frequency was 60 Hz, so that the modes identified around 50 Hz are not related to the electricity supply. Moreover, the identified damping ratios were higher than would be expected for harmonic frequencies, which have much lower damping ratios.
2.3. K-Means Clustering
Machine learning is the ability of artificial intelligence to acquire knowledge by extracting patterns from raw data [
24], unsupervised learning being one of its segments. The data input space is structured in such a way that a certain pattern occurs more often than others and the aim of unsupervised learning is to find these regularities [
25]. This task can be accomplished by clustering techniques, whose goal, considering a set of
unlabeled
-dimensional samples
, is to group similar samples forming clusters.
One of the most popular clustering algorithms is K-means, which is explained here based on [
26]. The objective of K-means is to separate the set of samples
into
clusters, assuming the value of
is given. One can see the cluster as a group of samples whose distances from each other are small compared to the distances in relation to samples from other clusters. It is formalized by introducing a set of
-dimensional vectors
, where
,
being a prototype associated with the
th cluster and representing its center, so that the quadratic sum of the distances of each sample to its nearest
vector is minimal.
For each sample
, a set of binary indicator variables
is introduced, describing to which of the
clusters the sample
was assigned, so that if sample
is assigned to cluster
, then
and
. Therefore, it is possible to define an objective function, given by Equation (1), which represents the quadratic sum of the distances from each sample to the prototype
assigned to it.
The goal is to find values for and to minimize , which can be accomplished through an iterative method in which each iteration involves two stages corresponding to successive optimizations with respect to and . This two-stage optimization is then repeated until convergence or until the maximum number of iterations is reached.
Ref. [
26] highlights that the convergence of the algorithm is guaranteed because at each iteration the value of the objective function is reduced but can converge to a local minimum instead of a global minimum. Ref. [
27] points out that the K-means++ algorithm was proposed, introducing a smarter initialization step that tends to initialize centroids far from each other. Ref. [
27] claims that this improvement made the K-means algorithm far less likely to converge to a suboptimal solution.
2.4. Preprocessing
Initial tests showed that the use of signals with transient regime or with different sampling frequencies is not adequate for the method to be proposed. Therefore, a preprocessing stage was used to standardize the data and ensure that the acquisition process would not influence the results.
First, the transient regime of the signals was removed. In view of the data standardization and aiming to increase the amount of data, the resulting steady-state measurements were divided so that they all had a length of 100 s, resulting in 196 measurements.
The parameters of the SSI and automatic identification algorithms were also standardized. Regarding the SSI method, the number of row blocks and the maximum order of the stabilization diagram were fixed at a default value of 100. Regarding the automatic identification algorithm, the stabilization limits were 0.2% for the frequency variation, 2% for the damping ratio variation and 95% for the minimum MAC value; the damping ratio limit was and the limit for the similarity measure was 0.01.
The automatic identification algorithm identified representative modal parameters for most of the measurements. Measurements that were classified as inadequate had at least one of the following results:
Non-identification of one of the rotor’s modes;
Frequencies of the rotor’s modal parameters outside the ranges to the first mode and to the second mode;
Damping factors identified outside a variation limit of 33.3% in relation to the references of
Table 2.
The measurements from which it was not possible to extract representative modal parameters for the rotor’s modes were obtained through tests 2 and 4 and partially through tests 3 and 8. Thus, 23 measurements were labeled as not adequate to the extraction of the rotor’s modal parameters, while the others (173 measurements) were labeled as adequate.
2.5. Proposed Methodology
This section presents the algorithm that uses K-means to identify features that provide information about the quality of measurements regarding the ability to extract the rotor’s modal parameters through OMA.
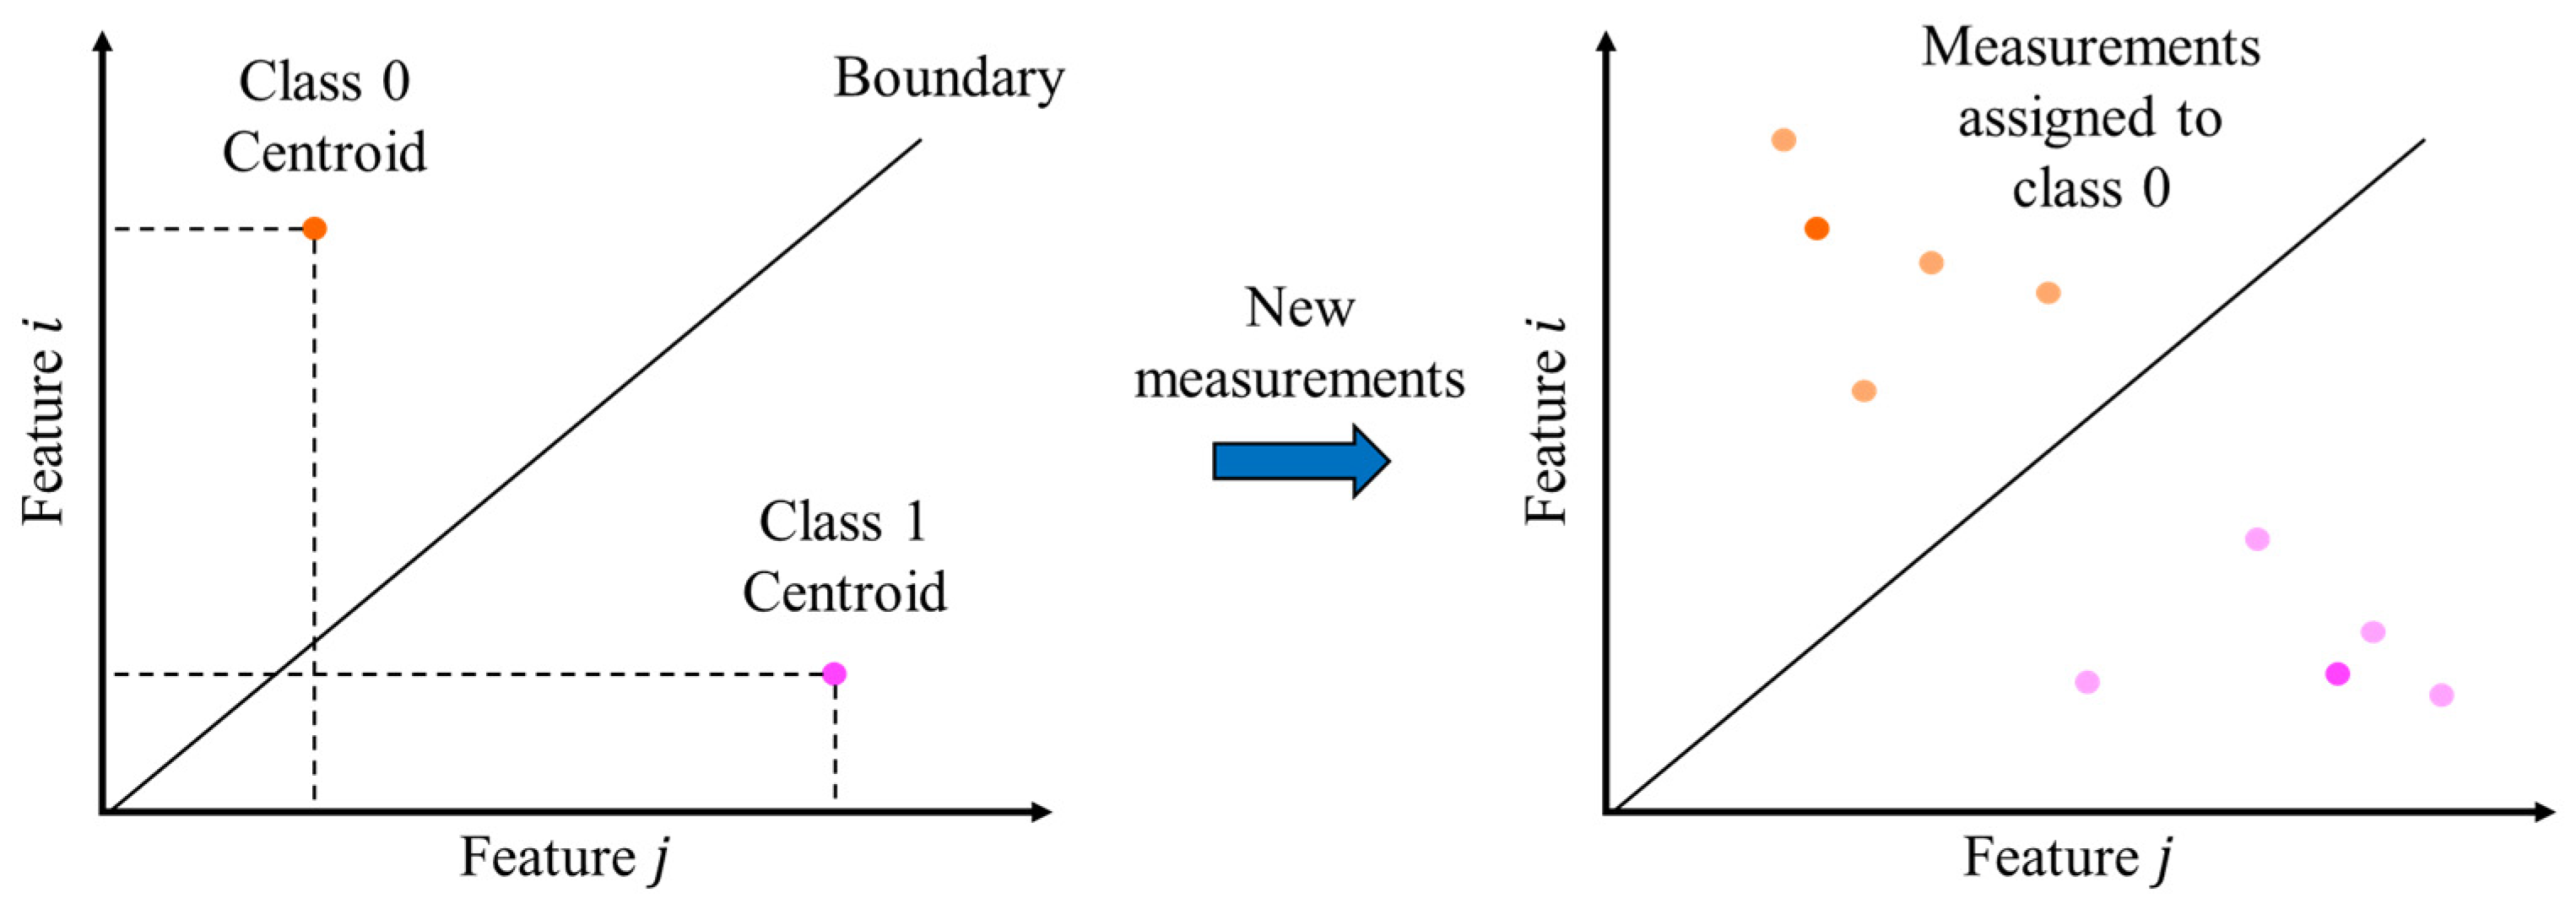
Figure 2 illustrates the expected results. From a given subset of features (represented in
Figure 2 by attributes
and
, although a subset with different number of elements is also possible), the purpose is to determine the centroids of classes 1 and 0, which respectively represent signals from which the extraction of the rotor’s modal parameters through OMA is possible and signals from which the extraction is not possible, so that a new measurement can be correctly assigned to any of these classes from the Euclidean distance between the centroids’ features and the features of the signal that represents the measurement. The boundary illustrated in
Figure 2 represents the points equidistant from the two centroids. Therefore, new measurements that fell to the class 1 side of the boundary (pink dots) are classified as adequate to extract the rotor’s modal parameters and the measurements that fell to the class 0 side of the boundary (orange dots) are classified as not adequate to extract the rotor’s modal parameters.
3. Results
The proposed methodology was divided into 5 steps, which are further explained.
3.1. Select and Extract Features from the Vibration Signals
Since clustering methods are based on a set of unlabeled samples to cluster similar samples, the purpose of this step is to perform a literature review that assembles characteristic features of vibration signals from rotating machines and applies them into the tests from
Table 1 to extract these features from the vibration signals under study.
3.2. Split Data into Training and Testing
The samples are divided into training and testing datasets to enable the validation of results. While the training dataset is used to cluster the data considering various combinations of features and select the most adequate combinations to define the centroids of each class (adequate and not adequate to extract the rotor’s modal parameters), the testing dataset is used to verify if new signals (that were not used to define the centroids) can be assigned to these classes based on the obtained centroids.
3.3. Apply K-Means Clustering to the Training Dataset
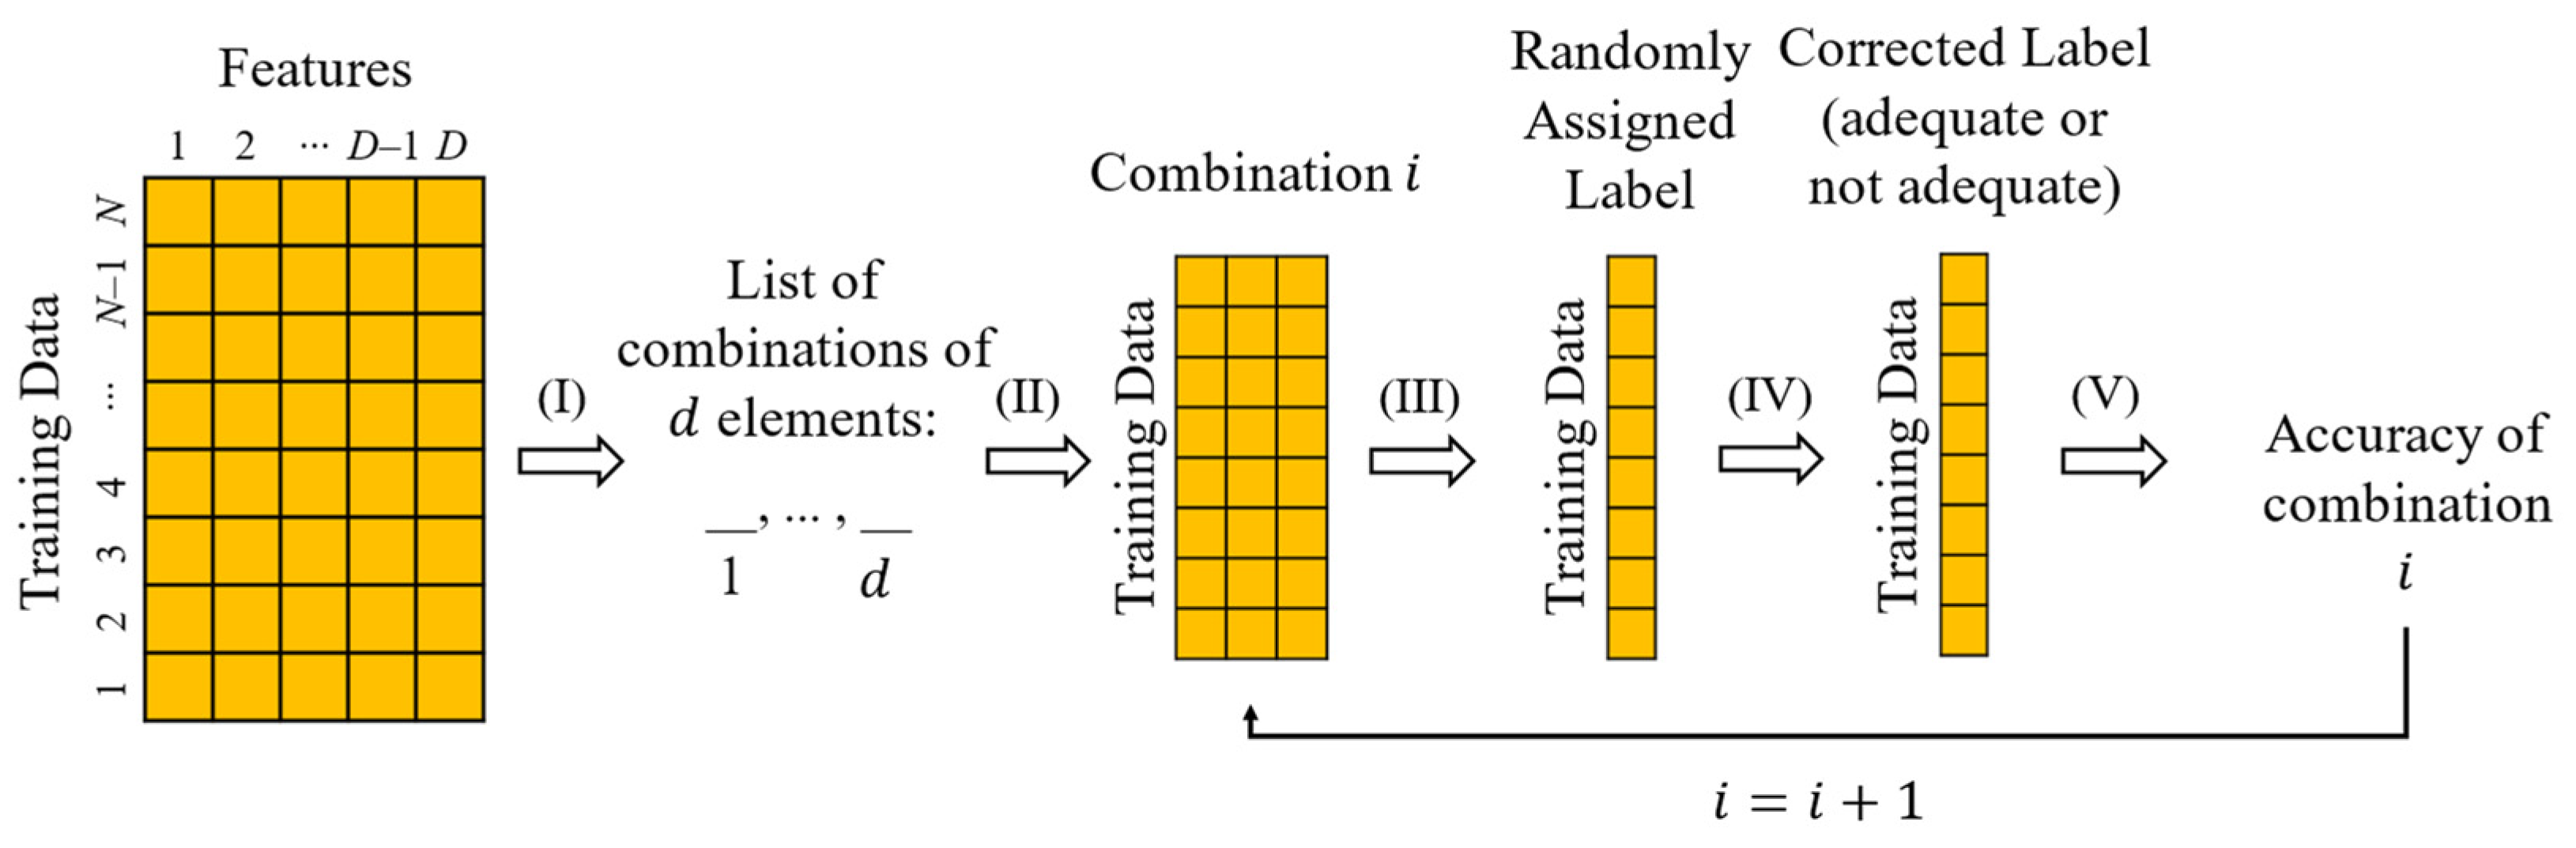
K-means is applied to the training data, taking as input various combinations of the selected features. The accuracy is then computed based on the labels already defined for each vibration measurement.
Figure 3 presents a flowchart that illustrates the methodology. The first matrix represents the training data, described through
features previously selected and extracted from the vibration measurements. The first step of this methodology (
) is to create a list of subsets of features, generated from combinations without repetition of
elements of the feature set. The number of elements in the combinations (
) can range from 1 to
; however, a maximum limit is established since the use of high-dimension input spaces increases the computational cost of clustering and can lead to problems such as information redundancy. The next step (
) is to describe the training data with features of the first subset of the obtained list. Then, the clustering is performed with the training data described by the subset features. K-means is used with the known number of clusters (2). It is worth mentioning that the clustering does not classify the data, that is, no cluster receives specific labels, but applies numerical labels whose sequence is based on the centroid initialization. In addition to the numerical labels obtained with K-means, the original labels of the data are also known, which makes it possible to organize the confusion matrix, of size
, in which
represents the number of classes in the dataset. In this matrix, an element in the position (
,
) represents the number of samples from class
that were assigned to the cluster
. In order to find the relation between the numerical and the original labels that maximizes the clustering accuracy, a procedure that reorganizes the confusion matrix is performed so that the sum of the principal diagonal components is maximized. In step (
), the centroid-based labels are replaced by the original ones. Finally, the accuracy is computed by dividing the sum of the principal diagonal components by the total number of samples. Steps (
) to (
) are repeated until the accuracy of all subsets of the list has been computed. This methodology can be repeated for several numbers of elements in the combinations.
3.4. Select the Most Accurate Feature Combinations
Here, the feature subsets that led to the highest accuracies in the previous step are selected. For each of them, the centroids obtained through K-means and described by a d-dimensional vector, in which d represents the number of elements in the subset, are stored for the next step.
3.5. Test the Centroids with the Testing Data
With the testing data and for each subset of feature selected in the previous step, the test samples are defined by a d-dimensional vector. The distances between each sample and the centroids of classes 0 and 1 are computed based on the Euclidian distance, and each sample is assigned to the nearest class. Moreover, the accuracy of each subset is computed by dividing the number of test samples assigned to the correct class by the total number of test samples.
3.6. Algorithm’s Results
The proposed algorithm is applied to a dataset with the response measurements of a test rig with a rotor supported by hydrodynamic bearings. All algorithms and OMA methods were implemented in Python™ 3.8.5.
As already mentioned, an extensive bibliographic review (see [
21] for more details) showed that several authors employed statistical features of vibration signals in the time and frequency domains to characterize the degradation process of rotating machines and identify faults using clustering algorithms. The review showed that the main statistical features comprised 12 time-domain (TF) and 9 frequency-domain (FF) features:
Mean (TF1);
Standard deviation (TF2);
Root Mean Square—RMS (TF3);
Peak value (TF4);
Skewness (TF5);
Kurtosis (TF6);
Crest factor (TF7);
Clearance factor or latitude factor (TF8);
Shape factor (TF9);
Impulse factor (TF10);
Upper bound value of histogram (TF11);
Lower bound value of histogram (TF12);
Mean frequency (FF1);
Frequency center (FF2);
RMS frequency (FF3);
Standard deviation frequency (FF4);
Average frequency (FF5);
Stabilization factor of wave shape (FF6);
Coefficient of variability (FF7);
Frequency domain skewness (FF8);
Frequency domain kurtosis (FF9).
Considering the ease of extracting these features and their capacity to carry the most varied information about the machine, it was decided to use them in investigations to determine which subset of features can provide information about the quality of measurements.
As mentioned, the number of measurements available for the study is 196, of which 173 are classified as adequate to extract the rotor’s modal parameters (label 1) and 23 as not adequate (label 0).
For each measurement, four vibration signals were available: the vibration signals in the Y and Z directions for bearings 1 and 2. To characterize each measurement as a single sample of maximum dimension 21, the Singular Value Decomposition (SVD) was applied to the four vibration signals so that each measurement would be described by only one vibration signal (the most significant from the decomposition). Next, the features were extracted from each vibration signal obtained though SVD.
In addition, it is worth noting that the spectrum (one-sided) of these signals has frequencies of up to 1024 Hz. Since the frequencies of interest are in much lower frequency ranges, the frequency domain features were extracted considering the spectrum up to the frequency of 400 Hz.
With the 21 features, it was possible to describe each sample as a vector of dimension 21. These samples were divided into two groups: the training and the testing datasets, covering respectively 70% and 30% of the samples. Although the assignment was performed randomly, the proportion between the labels 1 and 0 remained between the training and testing groups. Thus, the number of training samples was 137, with 16 samples labeled as not adequate, while the number of testing samples was 59, with 7 samples labeled as not adequate.
Having the training and testing data, the methodology followed to determine the subsets of features to be evaluated. For that, combinations without repetition of the 21 features were created. The number of elements in these combinations ranged from 1 to 3. The maximum value of 3 was chosen because it was found to be sufficient to achieve good results, preserving the low dimensionality of the input space, reducing computational cost, and avoiding information redundancy problems when compared to combinations with greater number of elements. Subsets containing all 21 features, all features in the time domain, and all features in the frequency domain were also added to the list.
Table 3 presents the obtained list, where each feature combination in parenthesis represents one subset.
Clustering was applied to the signals considering each subset in
Table 3. The K-means++ algorithm was employed with the known number of clusters (2). Since the centroid initialization influences the results of the algorithm, the clustering was performed 100 times for each feature subset. For each subset and each repetition, the confusion matrix was organized, the relation between numerical and original labels was found, each sample was once again labeled according to the classes 0 and 1 under study, and the accuracy was computed. The centroids in each repetition and the mean and standard deviations of the accuracies were obtained.
Table 4 presents the features subsets with the best results, that is, the ones that achieved mean accuracies above 99%, which is a high value for accuracy. For most cases, the accuracy was 99.27%, indicating that only one vibration signal was misclassified.
From
Table 4, one can see that seven of the eight subsets had zero standard deviation, indicating that, for all repetitions, the clustering results were the same. For the eighth subset, the standard deviation was 0.16% because in five of the repetitions the obtained accuracy was 98.54%, while in the others it was 99.27%. Additionally, it was verified that for the first seven subsets the same centroid was obtained in each of the 100 repetitions, while for the eighth subset different centroids were obtained in 10 of the 100 repetitions.
Therefore, the precision observed in the first seven subsets makes them the most adequate ones to carry information about the quality of measurements regarding the application of OMA. To synthesize the results of the test step, only the subsets with the greatest diversity with respect to features and number of elements are evaluated: subsets 1, 2, 5, and 7. Subset 1 was chosen because it presents a different number of elements, while subsets 2, 5, and 7 were chosen because they present the greater diversity of features.
Defining these feature subsets from the training dataset, composed of 137 vibration signals collected at the rotating frequency of 75 Hz, of which 16 were labeled as not adequate for OMA, the next step was to classify the testing data considering the obtained centroids. The number of testing vibration signals collected at the rotating frequency of 75 Hz was 59, with seven samples labeled as not adequate. Since the centroids of the 100 repetitions of each subset were the same, no extra step was required to choose the best centroid. The centroids of the best subsets were then employed to classify the testing data.
Figure 4 displays the feature space graphs of each subset. Each graph presents the centroids of the subset and the testing data, identified with the original labels through the data format (diamonds for samples belonging to class 0 and circles for samples belonging to class 1) and with the labels assigned through the centroid analysis through the color (orange for samples assigned to class 0 and pink to samples assigned to class 1). One can verify that subsets 1 and 2 correctly classified all test samples, reaching 100% accuracy and indicating that all 59 vibration signals from the testing dataset were correctly classified as adequate or not adequate for OMA. The subsets 5 and 7, on the other hand, classified one of the samples from class 1 (adequate) as belonging to class 0 (not adequate), reaching 98.31% accuracy.
These results indicate that, if the subsets of features TF1 (mean), TF3 (RMS), TF5 (skewness), and TF6 (kurtosis) are extracted from vibration signals and compared with the reference values of the centroids, they can be successfully classified as adequate or not adequate for OMA. If they are classified as not adequate, this is an indication that the excitation condition is not adequate for modal parameter extraction via OMA, and new measurements are needed with excitation conditions that are more similar to white noise excitation, which can be achieved through complementary excitation, such as tapping. If measurements are classified as adequate, OMA results will be reliable. Moreover, the fact that the methodology was able to achieve 100% accuracy in the test stage indicates that the methodology is indeed a promising tool.
4. Conclusions
In this paper, a new method that combines a machine learning algorithm with OMA is proposed to enable the monitoring of rotating machines. This method consists of a novel algorithm based on K-means and developed with the purpose of classifying vibration signals with respect to OMA. For OMA, white noise inputs lead to accurate extraction of modal parameters. However, this excitation condition is not easy to attain for rotating machines and, in the case of an inadequate excitation condition, the modal parameters identified by OMA can be inaccurate. Therefore, this research investigates the applicability of K-means as a pre-stage of OMA to differentiate adequate from inadequate excitations and prevent the inaccurate extraction of modal parameters. The algorithm was applied to vibration signals of a test rig with a rotor supported by hydrodynamic bearings, generated under different excitation conditions, such as white noise, blue noise, pink noise, and tapping.
To develop the method that classifies vibration signals as adequate or not adequate for the extraction of modal parameters, the system under analysis was investigated via traditional EMA analysis, and reference values were extracted for the modal parameters. An OMA algorithm that automatically extracts modal parameters of measurements was also employed. Comparing the automatic algorithm’s results with the reference values from EMA, each measurement was labeled as adequate or not adequate for the extraction of parameters. Based on this classification and on the vibration signals taken under different excitation conditions, the proposed methodology was developed.
A literature review was carried out to gather features that comprise information about the vibration signals, resulting in a set of statistical features in the time and frequency domains. From the K-means algorithm and a training dataset, it was possible to determine subsets, that is, combinations of features, that comprised information about the quality of the measurements. From them, it was possible to determine the centroids of the two desired classes, adequate and not adequate, to extract modal parameters. The subsets’ centroids were evaluated using a testing dataset and it was proved that most of them were indeed able to correctly separate the data between the two classes, achieving up to 100% accuracy.
One of the limitations of the proposed methodology is the fact that it needs an initial dataset of vibration signals of the machine in operation, with both adequate and inadequate measurements for OMA. This is required to find the K-means centroids of the two desired classes. The more data in different operating and excitation conditions, the better it is for the proposed methodology. However, depending on the machine, these data can be difficult to obtain.
Nevertheless, the results proved that the method can evaluate vibration signals from rotating machines regarding the ability to extract the rotor’s modal parameters via OMA. The method can also be expanded to other systems, becoming a promising tool to verify whether the excitation conditions are adequate for the extraction of modal parameters, improving continuous monitoring systems based on OMA, and enabling field evaluations of not only rotating machines but also other complex dynamic systems.


