Article

Adsorption/Desorption Performances of Simulated Radioactive Nuclide Cs+ on the Zeolite-Rich Geopolymer from the Hydrothermal Synthesis of Fly Ash

1
Shock and Vibration of Engineering Materials and Structures Key Laboratory of Sichuan Province, Southwest University of Science and Technology, Mianyang 621010, China
2
School of Civil Engineering and Architecture, Southwest University of Science and Technology, Mianyang 621010, China
3
School of Materials and Chemistry, Southwest University of Science and Technology, Mianyang 621010, China
4
Sino Shaanxi Nuclear Industry Group, Xi’an 710100, China
*
Author to whom correspondence should be addressed.
Energies 2023, 16(23), 7815; https://doi.org/10.3390/en16237815
Submission received: 11 October 2023 / Revised: 17 November 2023 / Accepted: 24 November 2023 / Published: 28 November 2023
(This article belongs to the Topic Advances in Oil and Gas Wellbore Integrity)

Abstract

:
The operation of nuclear power plants generates a large amount of low- and intermediate-level radioactive waste liquid. Zeolite-rich geopolymers, which are synthesized under hydrothermal conditions from industrial waste fly ash, can effectively immobilize radioactive nuclides. In this study, the synthesis law of zeolite-rich geopolymers and the adsorption/desorption performances of radioactive nuclide Cs+ were researched using XRD, SEM and ICP. The results show that the increase in curing temperatures and NaOH concentrations leads to the transformation of Y-type zeolite to chabazite and cancrinite at low NaNO3 concentrations. However, at high NaNO3 concentrations, NaOH above 2 M has no obvious effect on the phase transformation of the main zeolite of chabazite and cancrinite. In the adsorption and desorption experiment of Cs+ on the chabazite/garronite-rich geopolymer, it was found that the adsorption of Cs+ in the low initial concentration range is more suitable for the Freundlich equation, while the Langmuir equation fits in the adsorption process at the high initial concentration range. Moreover, the desorption kinetics of Cs+ are in good agreement with the pseudo-second-order rate equation. Thus, the adsorption of Cs+ on chabazite/garronite-rich geopolymers is controlled by both physical and chemical reactions, while desorption is a chemical process.

1. Introduction

With the rapid growth of global energy demands, nuclear energy is considered a clean and reliable energy source in the world [1]. Subsequently, a large amount of radioactive waste liquid will be generated. 137Cs is one of the most important fission products of low- and intermediate-level radioactive waste liquid (LILW) due to its short half-life (t1/2 = 30.2 a) and high yield. Compared with 90Sr, 137Cs is an alkali metal element, and its high solubility in water gives it strong fluidity [2]. Geopolymers are often used to solidify radionuclide ions, which are usually prepared from fly ash activated by alkaline, sometimes called alkali-activated materials [3]. The radionuclide ions are solidified in the geopolymer in the form of physical adsorption or chemical bonding [4]. Geopolymers are superior to Portland cement in mechanical strength, acid/salt resistance, and thermal stability; they are conducive to the sustainable development of the construction industry and also have a great application prospect in the solidification of hazardous wastes [5]. Furthermore, a large amount of fly ash will be produced every year in the world [6], and geopolymers prepared from fly ash do not need to emit CO2, which alleviates some of the greenhouse effect [7,8]. Thus, the utilization of fly ash is also of great significance for the disposal of LILW [9].
At present, there are many technologies to produce zeolite, such as precipitation, hydrothermal, microwave, and sol–gel synthesis [10,11]. On the basis of traditional alkali melting–hydrothermal synthesis of zeolites, the steps of the calcination activation pretreatment of fly ash, water-soluble desiliconization, alkali-soluble aluminosilicate, filtration, and other steps to synthesize various types of high-purity zeolite products have emerged. Many researchers [12,13,14] have investigated the effects of preparation methods on the synthesis of fly-ash-based geopolymers and discussed the effects of preparation conditions such as the alkalinity, liquid/solid ratio, and crystallization time on the synthesis products. He et al. [5] systematically studied the effect of hydrothermal treatment parameters on the phase composition and microstructure of hydrothermal products of the amorphous sodium-based geopolymer (NaGP), and they concluded that the best hydrothermal method for preparing NaGP was treated with a 1M NaOH solution at 160 °C for 6 h. The products of fly-ash-based geopolymers are various, with different raw materials and curing conditions. Wang et al. [15] and Wdowin et al. [16] found that the products of geopolymers include amorphous geopolymer gel and zeolite N (C)-A-S-H, NaA-X zeolite, NaP zeolite, NaP1 zeolite, cesium garnet, A zeolite, and so on.
Lei et al. [17] investigated the adsorption characteristics of zeolite microspheres in metakaolin/slag-based geopolymers for Cs+ and Sr2+, and the results showed that the adsorption kinetic process of Cs+ and Sr2+ on zeolite microspheres was in good agreement with the pseudo-second-order kinetic equation. Lee et al. [18] prepared fly ash/slag-based mesoporous geopolymers using the hydrothermal method, and the results showed that when the initial concentration of Cs+ was 100 mg/L, the maximum adsorption capacity of mesoporous geopolymers was 15.24 mg/g. Hui et al. [19] prepared 4A zeolite from fly ash and investigated the adsorption kinetics of different metal ions on fly-ash-based 4A zeolite using pseudo-first-order and pseudo-second-order kinetic equations; it was found that the pseudo-first-order model fits in Ni2+ well, and the pseudo-second-order model fits in Co2+ and Cr3+ well.
Large-volume geopolymer solidified matrices have been used in the treatment of LILW with high levels of alkali (NaOH) and salts (NaNO3), while the high center temperature of the matrices has prompted the generation of many crystal products. However, the transformation law of the fly-ash-based geopolymer products formed under different curing temperatures and sodium salt concentrations is under researched, and the adsorption/desorption mechanism of the simulated nuclide Cs+ is not clear. This study aims to clarify the relationship between the nuclides and a single phase of fly-ash-based geopolymers. The influence of the curing temperature, NaOH concentrations, and NaNO3 concentrations on the transformation of fly-ash-based geopolymer products in the system was explored. Moreover, the isothermal adsorption characteristics and desorption kinetics of Cs+ by the main zeolites were studied. The Langmuir and Freundlich isotherm adsorption equations were used for the fitting analysis, while the pseudo-first-order and pseudo-second-order kinetic models were used to fit the desorption test data.

2. Materials and Methods

2.1. Materials

Fly ash, mainly composed of SiO2 and Al2O3, was used as the raw material for the synthesis of zeolite materials [20]. The oxide composition of fly ash (wt.%) was analyzed by an X-ray fluorescence spectrometer, and the results are listed in Table 1. The D50 of the fly ash was 18.75 µm, determined by a laser particle analyzer (Mastersizer2000, Malvern, UK). The fly ash used in this study was obtained from the Jiangyou Power Station, China. The analytically pure reagents, such as CsCl, NaOH, NaNO3, etc., are all from Kelong Chemical Co., Ltd., Chengdu, China. The Cs+ solution used in the experiment refers to the CsCl solution, and its concentration refers to the concentration (mg/L) of the cesium element in the solution.

2.2. Sample Preparation Methods

A fly-ash-based geopolymer was prepared using the hydrothermal synthesis method. Fly ash was fixed at 5 g, and the water/fly ash ratio was 8. The mass concentrations of NaNO3 solution (100~500 g/L), NaOH molar concentrations (0.66~8 M), and curing temperatures (60~150 °C) were varied to prepare the fly-ash-based geopolymer. The curing time was constant at 24 h. The specific design ratios are shown in Table 2 and Table 3.

2.3. Isothermal Adsorption Experiment

The initial concentration of the adsorbent is a key parameter that determines the final adsorption behavior of the adsorbent, and the concentration gradient between the adsorbent surface and the adsorbate solution controls the mass transfer rate [18]. Thus, a 50 mL CsCl solution with mass concentrations of 50, 100, 150, 200, 300, 400, 500, 600, and 800 mg/L (Cs+) was added with 0.2 g products after washing and drying in several centrifuge tubes and then shaken in a constant temperature shaker (300 r/min) for 6 h. The supernatant was filtered with a 0.45 um needle filter, and the mass concentration of the remaining Cs+ was detected to calculate the adsorption rate (Equation (1)) and adsorption capacity (Equation (2)) [21]. The adsorbed product was dried for further tests.
R = C 0 C e C 0 × 100
Q e = C 0 C e m × V
where R is the adsorption rate, %; C0 is the initial mass concentration of Cs+, mg/L; Ce is the residual mass concentration of Cs+, mg/L; Qe is the equilibrium adsorption capacity, mg/g; m is the amount of the products added, g; V is the volume of Cs+ solution, L.

2.4. Desorption Kinetics Test

A total of 0.2 g of the test products was added in multiple centrifuge tubes, then 50 mL of the Cs+ solution with a mass concentration of 150 mg/L was added. The tubes were placed in a constant temperature oscillation box (300 r/min) to conduct an oscillation adsorption for 6 h, and finally, they were moved to a centrifuge. The remaining solid samples in the centrifuge tube were washed with deionized water to remove non-specifically adsorbed metal ions on the products, and then they were placed in a new centrifuge tube. A total of 50 mL of a hydrochloric acid solution (pH = 1) was added in the centrifugal tube as the eluate, and the tubes were put into a constant temperature oscillation box (300 r/min). At different times (5, 10, 15, 30, 45, and 60 min), the centrifuge tube was taken out, and the supernatant was filtered with a 0.45 μm needle filter. The remaining Cs+ concentration was detected to calculate the desorption capacity Qj (Equation (3)) and desorption rate Rj (Equation (4)), and the results were used to fit the subsequent desorption kinetic curve.
Q j = C j e V j / m
R j = Q j Q e × 100
where Rj is the desorption rate, %; Qe is the equilibrium adsorption capacity in 150 mg/L Cs+ solution, mg/g; m is the additional amount of the products, g; Qj is the desorption capacity of Cs+ from the products, mg/g; Cje is the desorption equilibrium mass concentration of Cs+, mg/L; Vj is the volume of desorption solution, L.

2.5. Characterization

The composition of oxides in fly ash was determined by X-ray Fluorescence (XRF) (Axios, PANalytical, Almelo, The Netherlands). The products of fly-ash-based geopolymers were detected by X-ray Diffractometry (XRD) (Smartlab, Rigaku, Tokyo, Japan) from 5º to 80º of 2θ with a rate of 20°/min using Cu K radiation. The morphology of fly-ash-based geopolymers was analyzed by Scanning Electron Microscope (SEM) (TM4000, Hitachi, Tokyo, Japan), and the surfaces of the fly-ash-based geopolymers were sprayed with a gold conductive layer and pasted onto conductive double-sided tape. The Fourier Transform Infrared Spectrometer (FTIR) (IS5, Thermo Fisher Scientific, Waltham, MA, USA) was used to detect the evolution of the H–O, Si–O–T (T = Si and Al), N–O, and C–O bond, and the fly-ash-based geopolymers were soaked in anhydrous ethanol and then dried. Subsequently, the dried fly-ash-based zeolite was mixed with KBr crystal and ground into a powder, which was then compressed in a mold (12–14 MPa) for 15 s to form an FTIR sample. The concentration of Cs+ was detected by an Atomic Absorption Spectrometer (AAS) (AA700, PerkinElmer, Waltham, MA, USA).

3. Results and Discussion

3.1. Products Analysis

3.1.1. XRD

The XRD diffraction patterns of the products of the fly-ash-based geopolymers synthesized based on Table 2 and Table 3 are shown in Figure 1 and Figure 2. It can be seen from Figure 1a that in the system with the NaNO3 concentration of 100 g/L and NaOH concentration of 2 M, the diffraction peaks of the Y-type zeolite (PDF # 89-1629) and chabazite (PDF # 44-0248) appear, while the diffraction peak intensity of chabazite is rather low. At the same time, the diffraction peaks of faujasite (PDF # 28-1036) are observed. With the increase in NaOH concentrations (4~8 M), the diffraction peaks of faujasite increase, and the diffraction peaks of cancrinite (PDF # 46-1332) also occur, while the characteristic peaks of cancrinite become stronger and stronger. It can be seen from Figure 1b that in the system with a NaNO3 concentration of 300 g/L and a low NaOH concentration (0.66 M), a small number of diffraction peaks of chabazite emerge, but the intensity of the diffraction peaks is low. As the NaOH concentrations varied from 2 M to 8 M, the diffraction peaks of SiO2 (PDF # 85-0796) show a decreasing trend. The crystal phase types in the fly-ash-based geopolymer products increase obviously, and the diffraction peaks of cancrinite and chabazite rise. Indeed, the characteristic peak of NaNO3 (PDF # 72-0025) with a high diffraction peak intensity also appear, which indicates that there is too much unreacted NaNO3 in the system. It can be seen from Figure 1c that in the system with the NaNO3 concentration of 500 g/L, the diffraction peak of SiO2 has disappeared, and the main phase is NaNO3. Meanwhile, the diffraction peaks of cancrinite, chabazite, and faujasite zeolites still exist in the system, indicating that high NaNO3 concentrations have no inhibition effect on the growth of zeolites. However, chabazite is more suitable for growth in high NaNO3 (300~500 g/L) environments compared with cancrinite. When NaOH concentrations are in the range of 6~8 M, an increase in NaNO3 will promote the transformation of cancrinite into chabazite.
In the following experiment, the concentration of the NaOH solution in the system was controlled at 2 M as no obvious zeolite formed at 0.66 M, and the NaNO3 concentration was set as 100 g/L, which is near to the normal concentration of NaNO3 in the LILW. The phase transformation of alkali-activated fly-ash-based geopolymer products at different curing temperatures from 60 °C to 150 °C was studied. High curing temperatures are another key parameter affecting hydrothermal conversion that promote the grains to crystallize and grow during hydrothermal treatment [5]. From the analysis of Figure 2, it can be seen that there is an obvious crystallization peak of silica near 2θ = 26.5° in the sample after the curing treatment of low temperatures (60 °C), while no characteristic diffraction peaks of other crystal phases are found, which indicates that no crystal phase emerges under this condition. When the curing temperature rises to 90 ℃, the diffraction peaks of silica decrease obviously, and the characteristic diffraction peak of Y-type zeolites occurs. However, the crystallinity is low, and there are still unreacted mullite and silica. When the temperature reaches 120 °C, the characteristic diffraction peaks of Y-type zeolites in the product are weakened, and the characteristic diffraction peaks of chabazite and garronite (PDF # 39-1374) appear. However, the crystallinity of chabazite is not high, and the silica diffraction peaks weaken. This indicates that a curing temperature of 120 °C is beneficial to the crystal growth and transformation into chabazite and garronite, but the reaction under hydrothermal conditions is still incomplete. The weakening of the characteristic diffraction peak of silica was caused by the dissolution of silica by a high concentration of the NaOH solution [2]. By further increasing the curing temperature to 150 °C, the characteristic diffraction peaks of cancrinite emerge, and the crystallinity is high. Moreover, the characteristic diffraction peaks of silica disappear. Thus, it can be concluded that the increase in temperature is beneficial to the crystallization and phase transformation of zeolites. Also, Palomo et al. [22] reported the promoting effect of high temperatures on the formation of the zeolite phase. Zheng et al. [23] studied the effect of curing temperatures on the evolution of the crystalline phase of geopolymers, and the results showed that a relatively high curing temperature (>60 °C) was a necessary condition for the phase transition of fly-ash-based geopolymers.

3.1.2. SEM

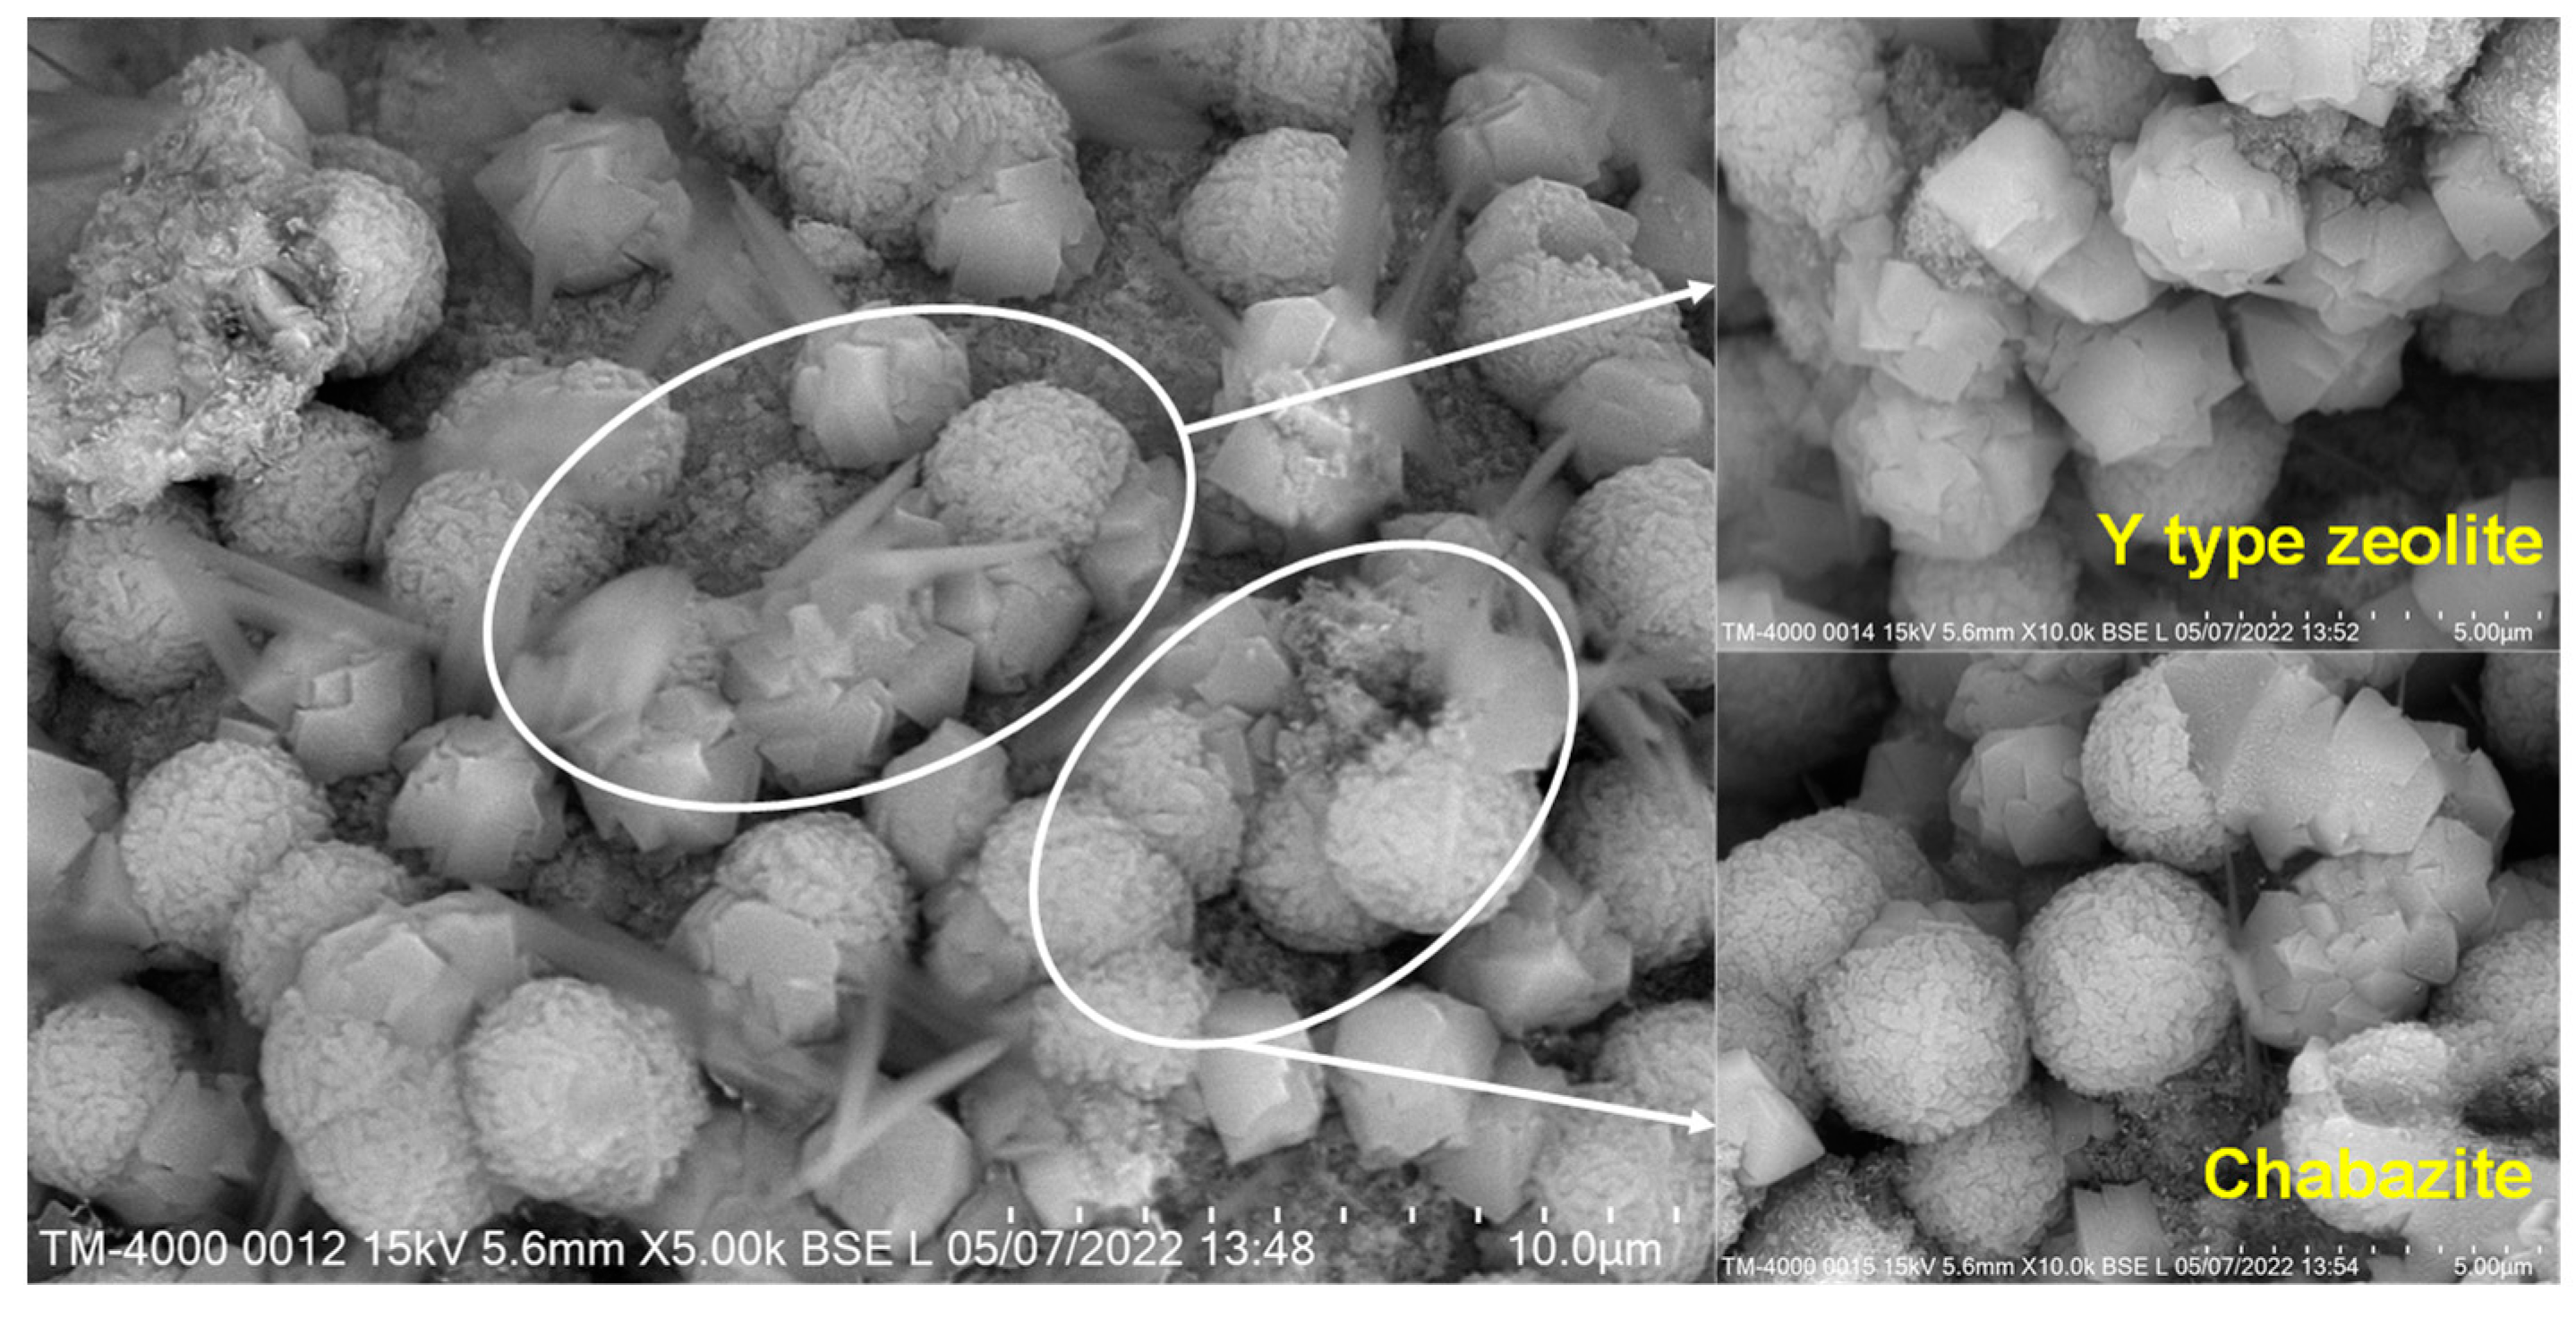
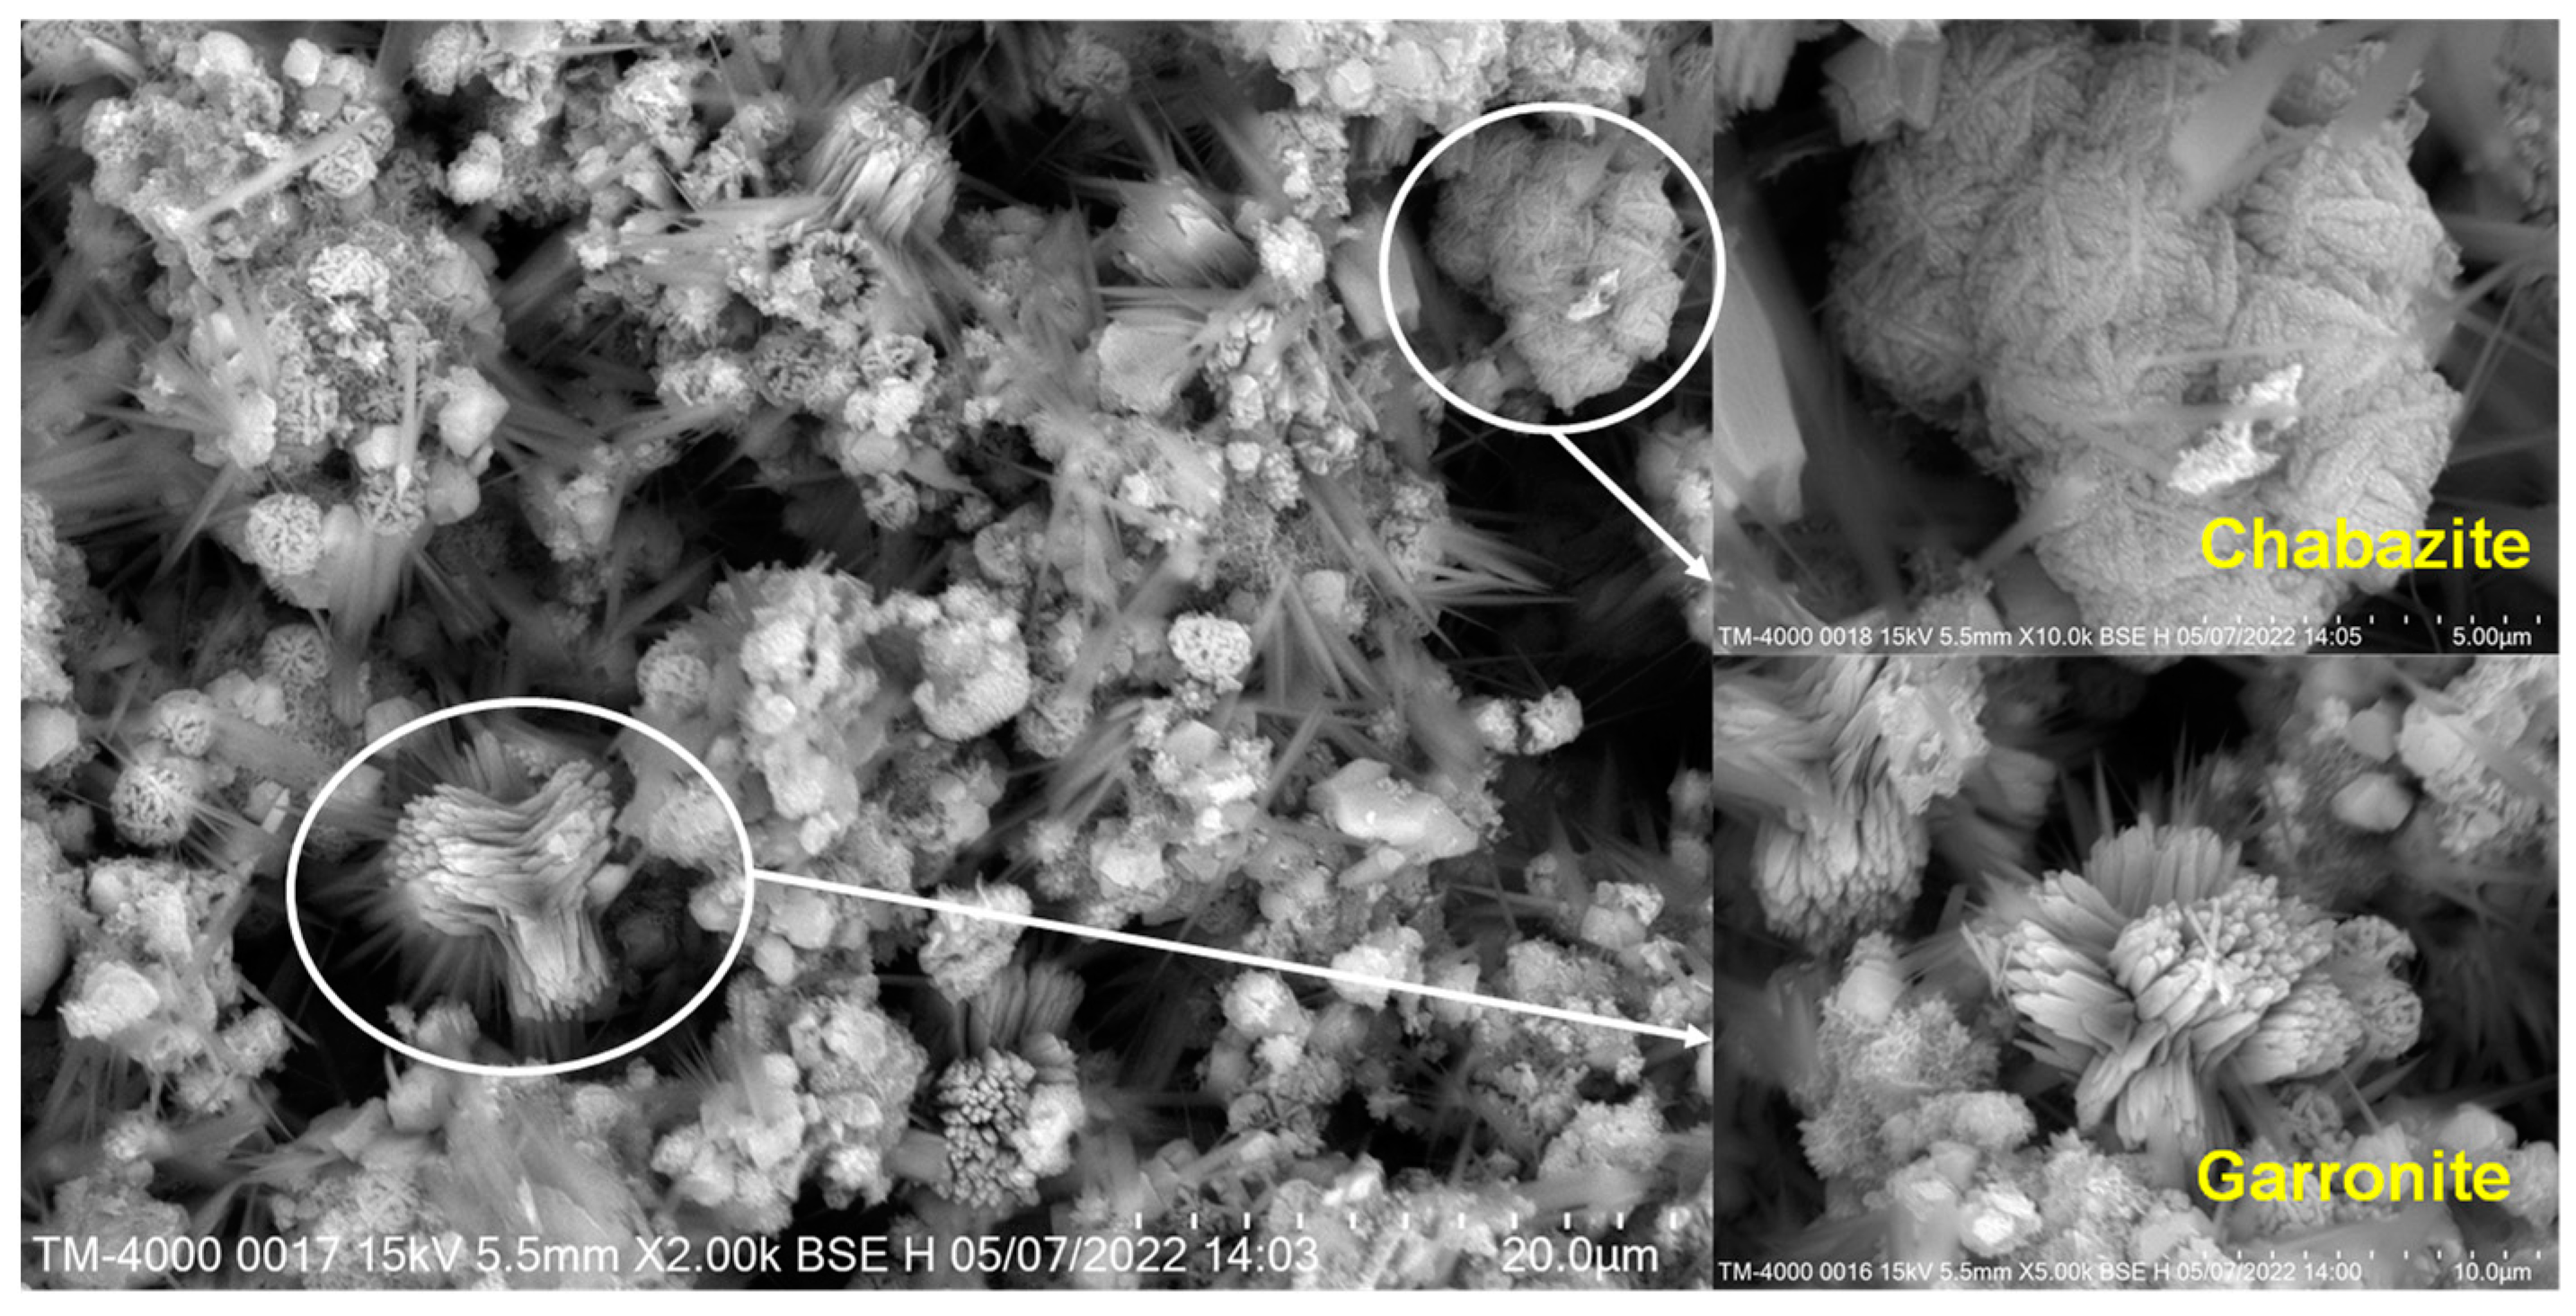
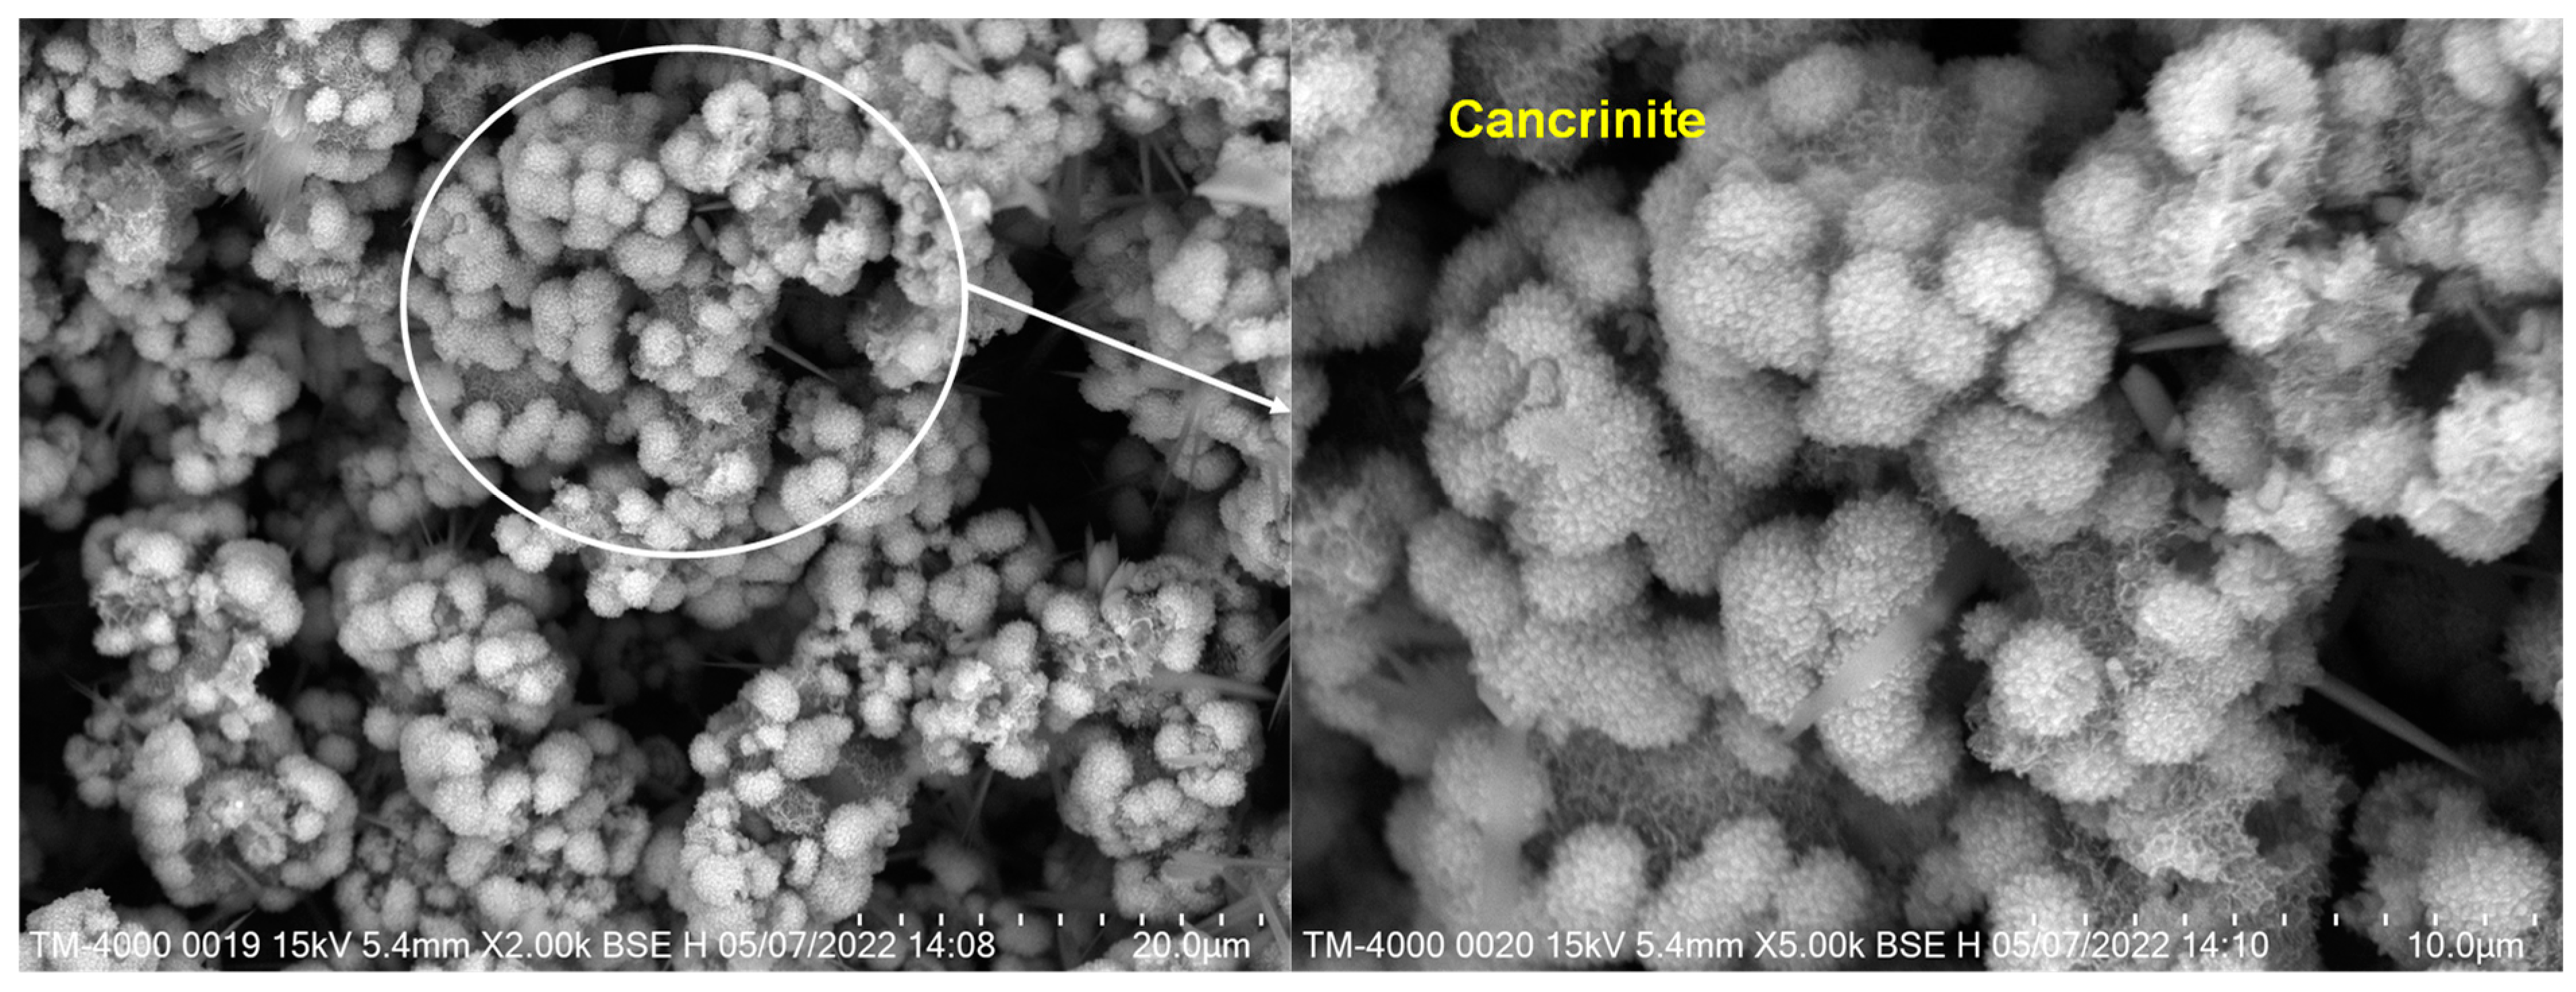
XRD diffraction pattern analysis has roughly determined the zeolite generated at the NaOH concentration of 2 M and NaNO3 concentration of 100 g/L, as Y-type zeolite, chabazite/garronite, and cancrinite have been obtained at the curing temperatures of 90 °C, 120 °C, and 150 °C, respectively. Figure 3, Figure 4 and Figure 5 are the SEM images of the fly-ash-based geopolymer products prepared by the above three conditions.
In Figure 3, it can be seen that the fly-ash-based geopolymer has a polyhedron-shaped product under the NaOH concentration of 2 M and 100 g/L of NaNO3 at the curing temperature of 90 °C, which is the characteristic morphology of Y-type zeolites [24]. The particle size and shape of Y-type zeolites are relatively uniform. Indeed, it can also be observed that the surface presents a wrinkled spherical particle, which is the characteristic morphology of the chabazite. Moreover, the spherical particles are larger than the polyhedron-shaped particles. At the same time, dissolved and broken spherical particles can be observed. Combined with the results of XRD, it can be concluded that Y-type zeolites and chabazite were formed in the alkali-activated fly-ash-based geopolymer products under this condition. From Figure 4, it can be seen that the fly-ash-based geopolymer has well-crystallized particles under a NaOH concentration of 2 M and a NaNO3 concentration of 100 g/L at a curing temperature of 120 °C. Most of the particles are regularly spherical, and the surface has obvious folds. The particle size is small, but the size is uniform, and the typical chabazite crystal shows an aggregation growth morphology [25]. There is also a small part of the particles with a cross-shaped columnar structure, which is larger than chabazite. The well-crystallized phase indicates that new crystals have been generated, and it is also proven that the fly ash in the raw material is fully involved in the reaction. Combined with the XRD results, it was determined that chabazite and garronite were formed under this condition. From Figure 5, it can be seen that the fly-ash-based geopolymer has thorny spherical particles under the NaOH concentration of 2 M and NaNO3 concentration of 100 g/L at the curing temperature of 150 °C, which are the characteristic morphology of cancrinite. The particle size is uniform, the crystallization is good, and the small irregular particles are grown around the spherical particles. Thus, it can be concluded that the alkali-activated fly-ash-based geopolymer generates cancrinite under this condition. Above all, the fly-ash-based geopolymer product of chabazite and garronite formed at 120 °C (sample T120: chabazite/garronite-rich geopolymers) was selected for the subsequent isothermal adsorption test and desorption kinetic test to explore the adsorption and desorption characteristics of Cs+, as the main crystal phases of chabazite and garronite obtained excellent directional adsorption ability to Cs+ [26,27].

3.1.3. FTIR

Figure 6 shows the FTIR results of T120 products before and after the adsorption of Cs+. The sharp absorption peak at 462.76 cm−1 belongs to the internal bending vibration of the silicon aluminum oxide tetrahedron, while its symmetrical tensile vibration is at 572.99 cm−1 [24]. The absorption peak near 1635.74 cm−1 is generated by the stretching and bending vibrations of O–H and H–O–H. As the hydration of fly-ash-based geopolymer was terminated by soaking in absolute ethanol and the test product was dried sufficiently to eliminate the influence of free water on the absorption peak, the wider peaks in these two places are related to the hydration gel generated during the reaction process, such as N–A–S–H gel. The absorption peak at 1423.67 cm−1 is caused by the asymmetric stretching vibration of O–C–O [28,29]. An amount of 1384.70 cm−1 is the stretching vibration of N–O, and the source of nitrogen in the experiment is only NaNO3. It can be concluded that there is still unreacted NaNO3 in the fly-ash-based geopolymer under the condition of alkali excitation [25], which is consistent with the phenomenon that a strong NaNO3 diffraction peak is found in the XRD pattern of the fly-ash-based geopolymer products generated at high concentrations of NaNO3. The small peak at 685.61 cm−1 is the bending vibration of T–O–T (T = Si, Al). Corresponding to the Si-O bond at 995.97 cm−1, it can be inferred that the T120 products contain a small amount of cancrinite [30]. The infrared spectra of chabazite/garronite-rich geopolymers before and after adsorption show no obvious change in the peak. No evidence has shown the chemical bond fracture and new bond formation in the adsorption process of nuclide Cs+ on the products; therefore, it can be deduced that the adsorption of Cs on chabazite/garronite-rich geopolymer is physical adsorption.

3.2. Adsorption Performances

3.2.1. Adsorption Capacity and Adsorption Rate

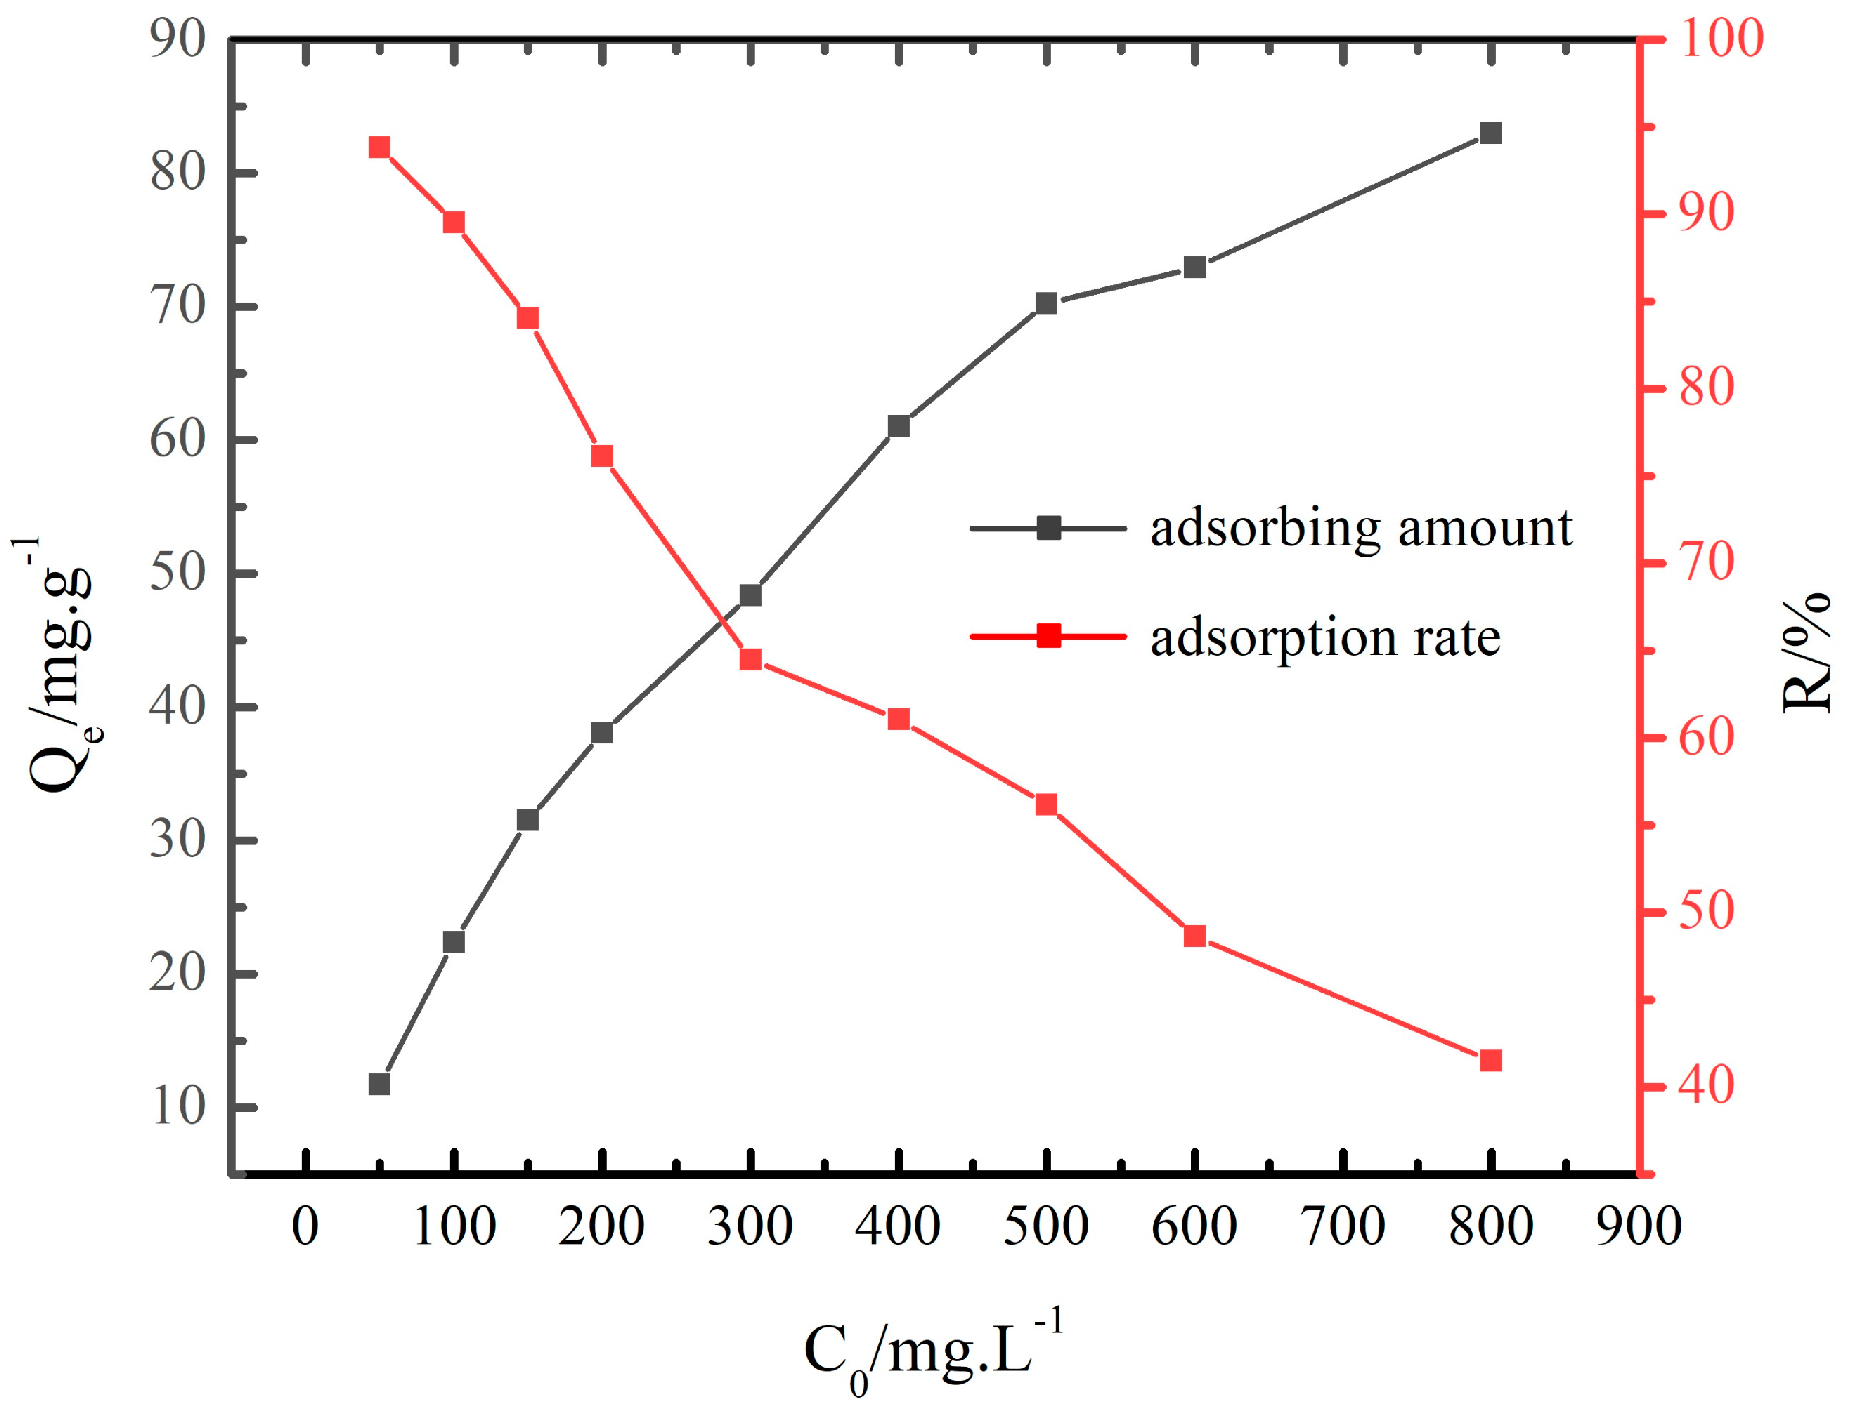
Figure 7 outlines the adsorption rate curves of T120 products with different initial concentrations of the Cs+ solution, and the adsorption time is 6 h. From Figure 7, it can be seen that as the concentration of Cs+ in the system varies from 50 mg/L to 800 mg/L, the adsorption capacity of chabazite/garronite-rich geopolymers to Cs+ increases from 11.73 mg/g to 82.95 mg/g. The increasing initial mass concentration of Cs+ elevates the ion concentration in the unit volume solution and extends the contact time between the adsorbate and the adsorbent to a certain extent. From Figure 7, it can also be seen that the adsorption rate of Cs+ by chabazite/garronite-rich geopolymers decreases with the increase in the initial concentration of Cs+, and the adsorption rate of Cs+ by chabazite/garronite-rich geopolymers decreases from 93.80% to 41.48%. When the concentration of Cs+ is 50 mg/L, the adsorption removal rate of Cs+ by chabazite/garronite-rich geopolymers is the highest at 93.80%.

3.2.2. Adsorption Isotherm Model

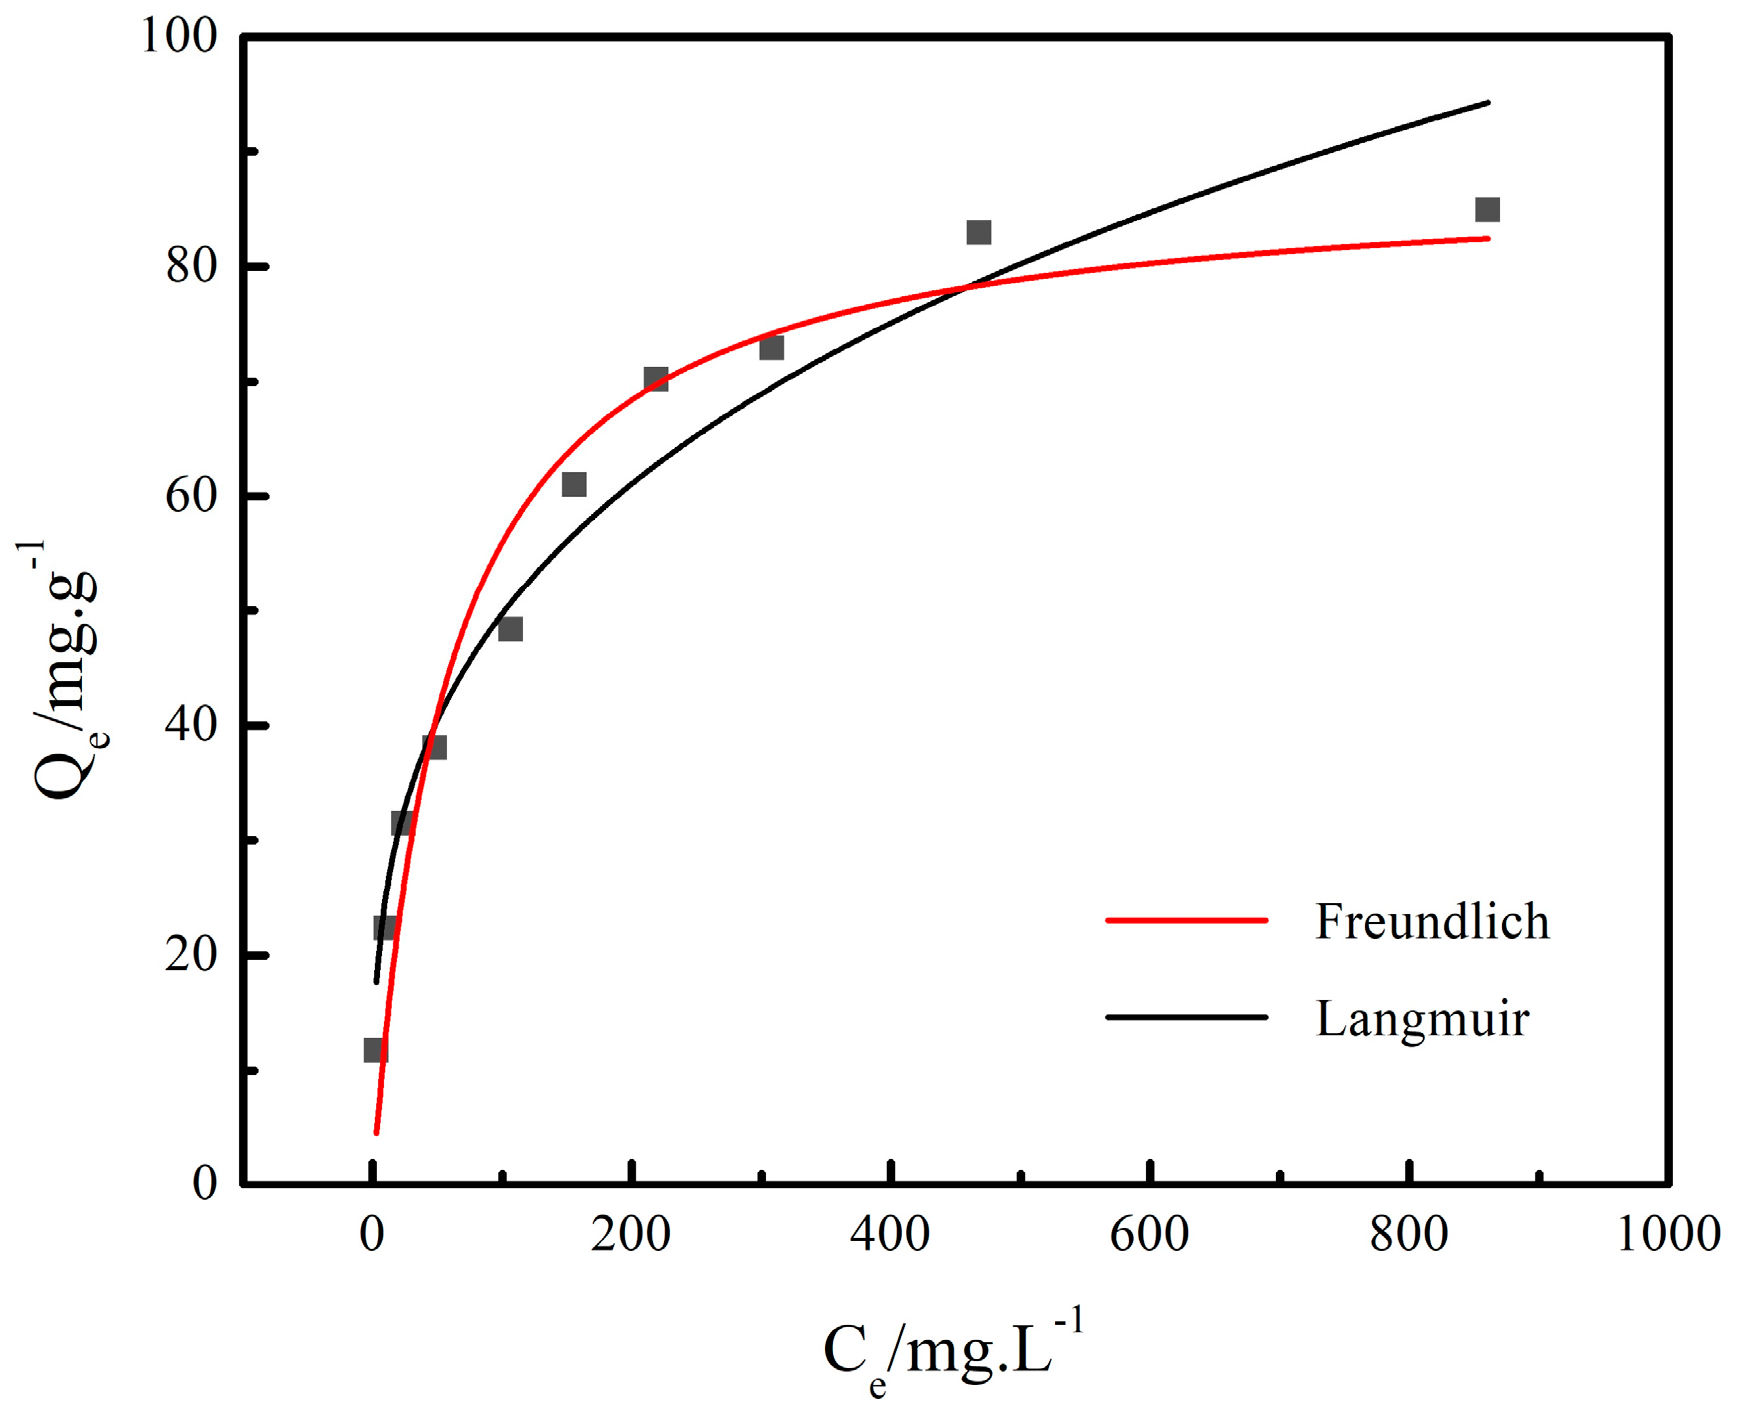
The adsorption data were analyzed, and the fitting parameters were obtained to infer the adsorption reaction mechanism. For the adsorption of heavy metals in a solution, the Langmuir isothermal adsorption model [31] and the Freundlich isothermal adsorption model [32] were used to fit the experimental data. The Langmuir equation is a model based on monolayer adsorption (chemical adsorption), while the Freundlich equation is suitable for describing the adsorption process of uneven surfaces (physical adsorption). Figure 8 demonstrates the Langmuir and Freundlich isothermal adsorption equation fitting curve of Cs+ on chabazite/garronite-rich geopolymers. The fitting parameters of Langmuir and Freundlich’s isothermal adsorption equations of Cs+ on the chabazite/garronite-rich geopolymer are shown in Table 4.
According to the fitting parameters of the isothermal adsorption curve, the isothermal adsorption curve of Cs+ is fitted well with the Freundlich equation and Langmuir equation, both of which are suitable for describing the isothermal adsorption behavior of Cs+ on the chabazite/garronite-rich geopolymer. It indicates that the adsorption of Cs+ on the chabazite/garronite-rich geopolymer is dominated by monolayer adsorption and the adsorption of uneven surfaces at the same time. Moreover, the isothermal adsorption fitting curve shows that the isothermal adsorption data of Cs+ in the low initial concentration range (Co at 50~300 mg/L) are more suitable for the Freundlich equation, while the Langmuir equation fits the adsorption data at the high initial concentration range (Co at 400~800 mg/L). When the residue concentration of Cs+ is in the range of 50~800 mg/L, the maximum theoretical equilibrium adsorption capacity of chabazite/garronite-rich geopolymers to Cs+ is 87.91 mg/g. The calculated separation coefficients (KL) using the Langmuir model fall within the range of 0–1, and the anisotropy coefficients (n) obtained from the Freundlich model are all greater than 1. These coefficients imply that the adsorption of Cs+ from aqueous solutions by fly-ash-based zeolites is the favorable equilibrium adsorption region [33].

3.3. Desorption Performances

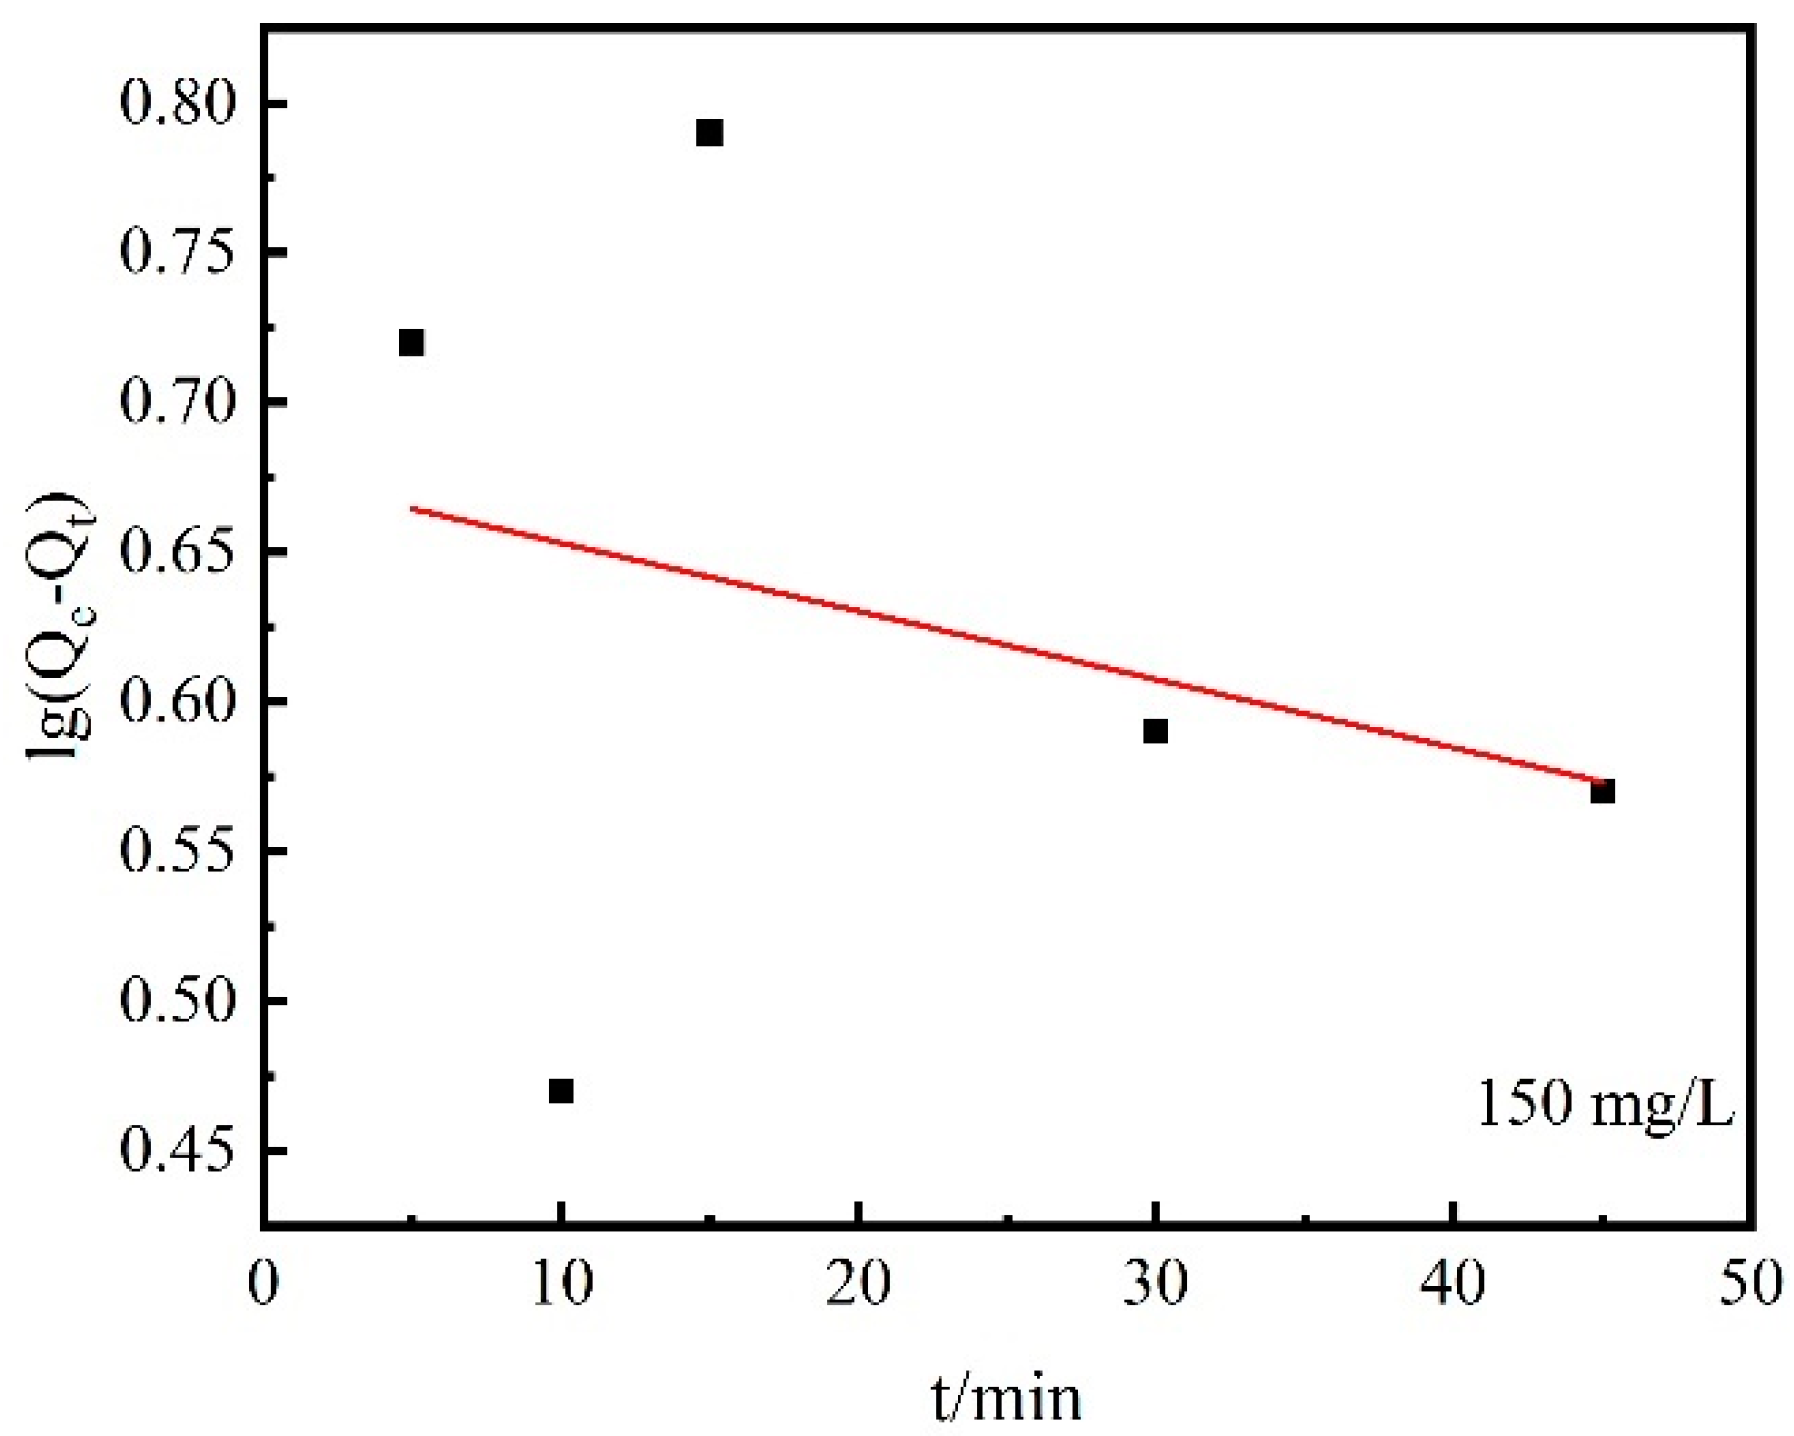
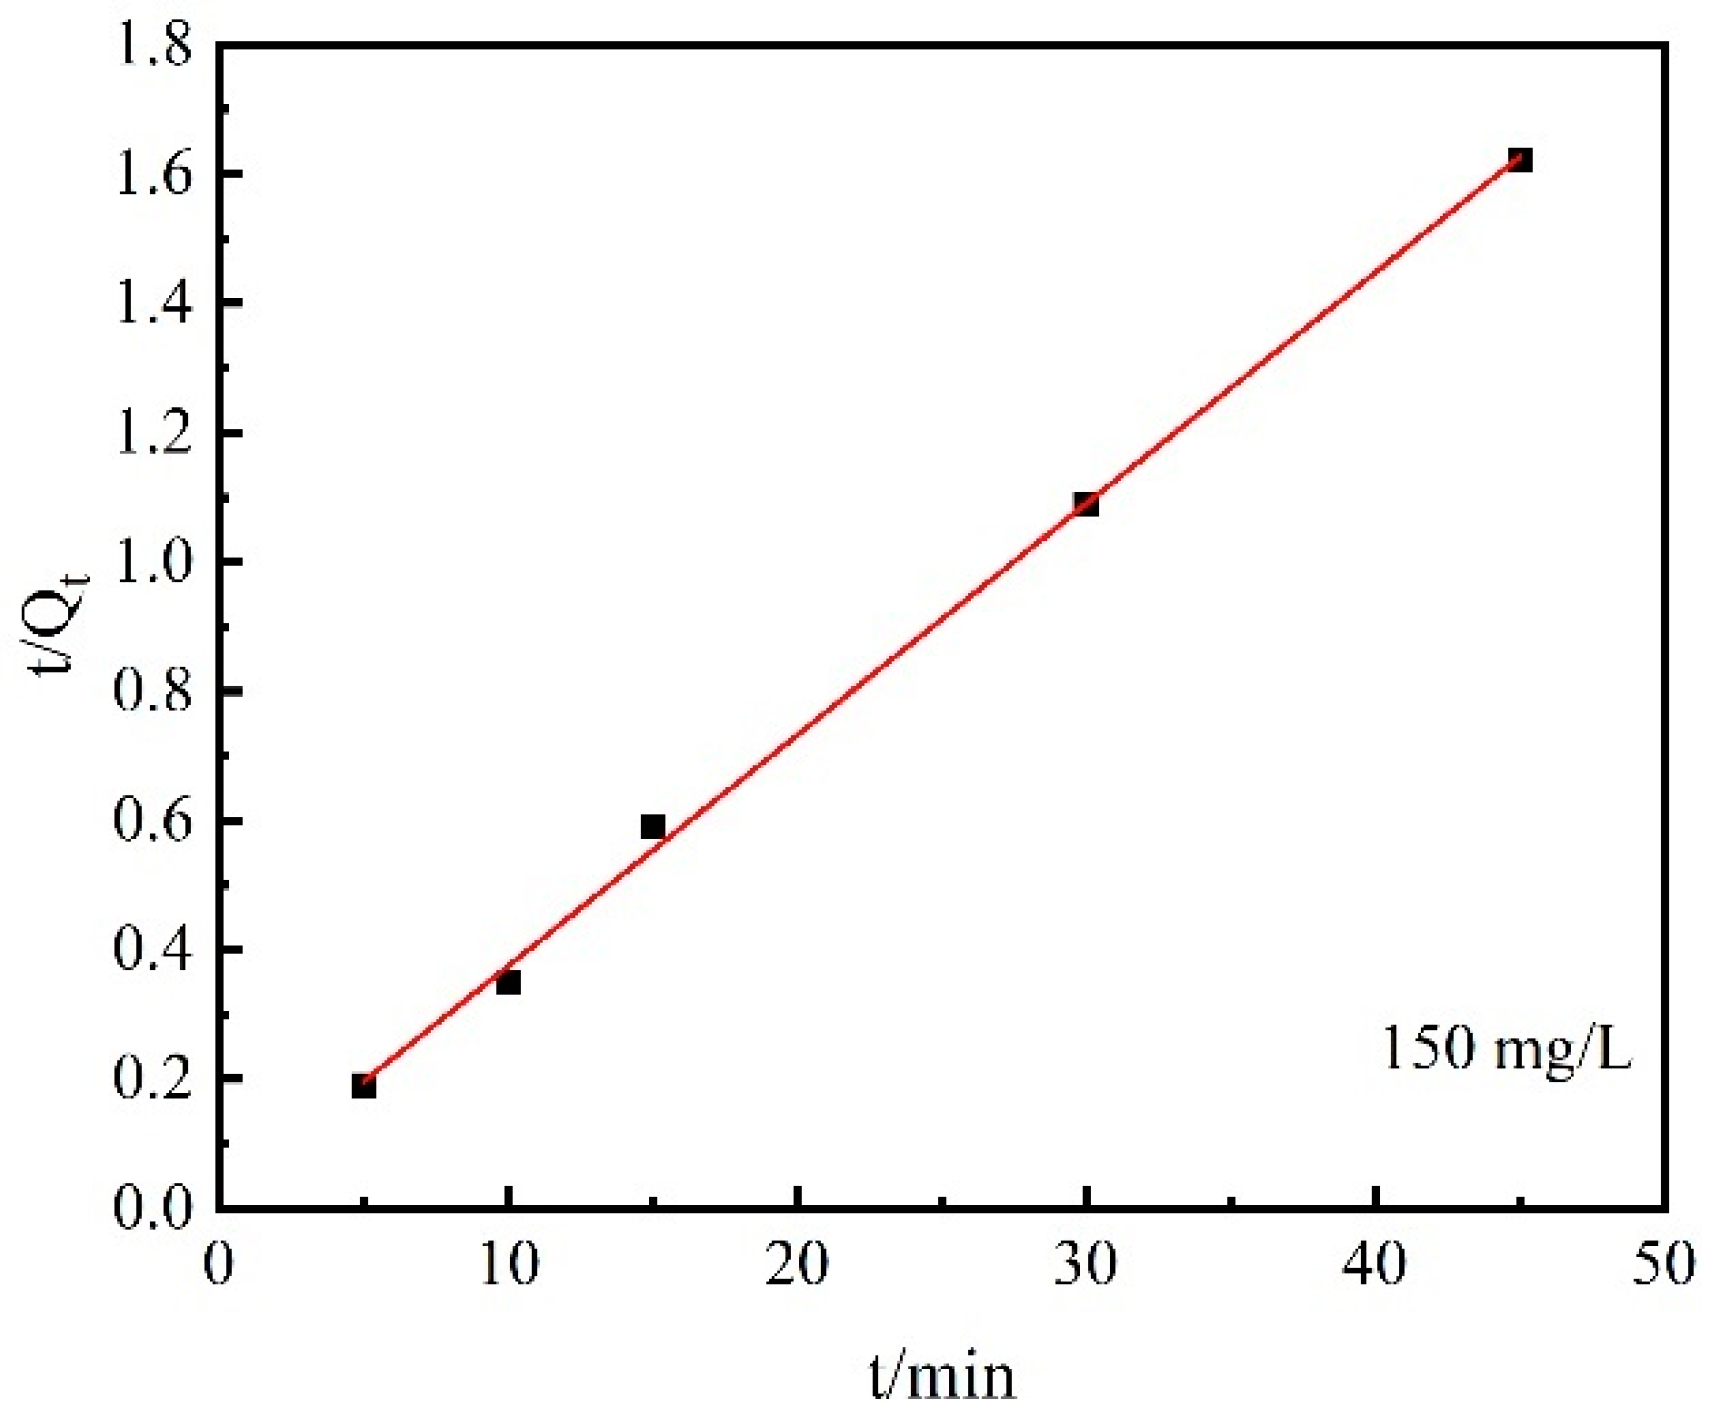
In the desorption test of Cs+, a hydrochloric acid solution with a pH = 1 was used as the eluent, and the mass percentage of concentrated hydrochloric acid was 37%. Table 5 highlights the desorption capacity and desorption rate of Cs+ on the T120 products at different desorption times under the condition of 25 °C. The initial concentration of Cs+ is selected as 150 mg/L (to ensure sufficient adsorption and low concentrations, as the Cs+ in real LILW is rather low). It can be seen from the adsorption isotherm curves in Figure 7 that the equilibrium adsorption capacity of chabazite/garronite-rich geopolymers at 150 mg/L Cs+ solution is 31.51 mg/g. However, Table 5 shows that when the desorption time is 60 min, the desorption capacity of Cs+ (32.06 mg/g) in the solution after desorption is greater than the equilibrium adsorption capacity of 31.51 mg/g. This result may be caused by a deviation during the dilution process of the test samples. Therefore, the pseudo-first-order and pseudo-second-order kinetic fittings were performed using the desorption data of the (5~45 min) time period. Table 6 outlines the fitting parameters of the pseudo-first-order and pseudo-second-order kinetic models [34,35]. Figure 9 and Figure 10 outline the pseudo-first-order and pseudo-second-order kinetic fitting curves at the time period of 5~45 min, respectively.
From the fitting parameters of Table 6, it can be seen that the desorption data of Cs+ on the chabazite/garronite-rich geopolymers after saturated adsorption at 150 mg/L have a good correlation with the pseudo-second-order kinetic equation during the desorption period of 5~45 min. The correlation is 0.99, and the pseudo-second-order desorption rate is 7.48 × 10⁻² mg/(g·min−1). The theoretical equilibrium desorption capacity during the 5–45 min period is 27.96 mg/g, which is close to the desorption capacity of 27.81 mg/g at 45 min, and the relative error is 0.55%. Combined with the adsorption model mentioned above, it can be inferred that the adsorption and desorption processes of Cs+ on chabazite/garronite-rich geopolymers are mainly chemical processes [36,37].

4. Conclusions

The products of fly-ash-based geopolymers and the adsorption performance of the products to the simulated radionuclide Cs+ were controlled by NaNO3 concentrations, NaOH concentrations, and curing temperatures. Specific findings from this work include the following:
(1)
In the low NaNO3 system (100 g/L), an increase in the NaOH concentration from 0.66 M to 2 M promoted the formation of Y-type zeolites and chabazite, while an increase in the NaOH concentration from 2 M to 8 M led to the transformation of zeolites into cancrinite. In the high NaNO3 (300~500 g/L) system, the increase in NaOH concentrations above 2 M had no obvious effect on the product transformation, and the products were mainly cancrinite and chabazite.
(2)
In the low NaNO3 system (100 g/L) with NaOH concentrations of 2 M, Y-type zeolite was formed at 90 °C. With the increase in curing temperatures (90~150 °C), the Y-type zeolite was firstly transformed into garronite and chabazite, and then cancrinite at last. It can be concluded that NaNO3 concentrations, NaOH concentrations, and curing temperatures all promote the crystallization of cancrinite and chabazite.
(3)
At the NaNO3 concentration of 100 g/L and 120 °C, the adsorption capacity of Cs+ decreased with the increase in the initial concentration of Cs+, and the adsorption rate of Cs+ increased with the increase in the initial concentration of Cs+ initial. The adsorption of Cs+ in the low initial concentration range was more suitable for the Freundlich equation, while the Langmuir equation fit the adsorption process at the high initial concentration range. The adsorption of Cs+ on the chabazite/garronite-rich geopolymer was dominated by physical and chemical adsorption at the same time.
(4)
In the range of 5~45 min, the desorption kinetic process of Cs+ on the chabazite/garronite-rich geopolymer was in good agreement with the pseudo-second-order equation. Indeed, the desorption of Cs+ on the chabazite/garronite-rich geopolymer was a chemical desorption.

Author Contributions

Conceptualization, Z.Z. and Y.L.; Methodology, Z.Z.; Software, J.Y.; Formal analysis, Z.Z.; Investigation, M.C.; Resources, J.Y., M.C. and K.Y.; Data curation, M.C. and H.S.; Writing—original draft, Z.Z.; Writing—review & editing, J.Y., K.Y. and H.S.; Supervision, X.M. and Y.L. All authors have read and agreed to the published version of the manuscript.

Funding

This work was supported by the Scientific Research Fund of Southwest University of Science and Technology (No. 21zx7124) and the Natural Science Basic Research Program of Shaanxi (Program No. 2022JQ-897).

Data Availability Statement

Data are contained within the article.

Acknowledgments

The authors gratefully acknowledge the School of Civil Engineering and Architecture, School of Materials and Chemistry (Southwest University of Science and Technology) for providing their facilities to carry out this work.

Conflicts of Interest

Author Kui Yang was employed by the company Sino Shaanxi Nuclear Industry Group. The remaining authors declare that the research was conducted in the absence of any commercial or financial relationships that could be construed as a potential conflict of interest.

References

  1. Kosowski, P.; Kosowska, K.; Janiga, D. Primary Energy Consumption Patterns in Selected European Countries from 1990 to 2021: A Cluster Analysis Approach. Energies 2023, 16, 6941. [Google Scholar] [CrossRef]
  2. Fernandez-Jimenez, A.; Macphee, D.; Lachowski, E.; Palomo, A. Immobilization of cesium in alkaline activated fly ash matrix. J. Nucl. Mater. 2005, 346, 185–193. [Google Scholar] [CrossRef]
  3. Fu, S.; He, P.; Wang, M.; Cui, J.; Wang, M.; Duan, X.; Yang, Z.; Jia, D.; Zhou, Y. Hydrothermal synthesis of pollucite from metakaolin-based geopolymer for hazardous wastes storage. J. Clean. Prod. 2019, 248, 119240. [Google Scholar] [CrossRef]
  4. Tyupina, E.A.; Kozlov, P.P.; Krupskaya, V.V. Application of Cement-Based Materials as a Component of an Engineered Barrier System at Geological Disposal Facilities for Radioactive Waste—A Review. Energies 2023, 16, 605. [Google Scholar] [CrossRef]
  5. He, P.; Wang, Q.; Fu, S.; Wang, M.; Zhao, S.; Liu, X.; Jiang, Y.; Jia, D.; Zhou, Y. Hydrothermal transformation of geopolymers to bulk zeolite structures for efficient hazardous elements adsorption. Sci. Total. Environ. 2021, 767, 144973. [Google Scholar] [CrossRef]
  6. Wang, C.F.; Li, J.S.; Wang, L.J.; Sun, X.Y. Influence of NaOH concentrations on synthesis of pure-form zeolite A from fly ash using two-stage method. J. Hazard. Mater. 2008, 155, 58–64. [Google Scholar] [CrossRef]
  7. Khalid, H.R.; Lee, N.K.; Park, S.M.; Abbas, N.; Lee, H.K. Synthesis of geopolymer-supported zeolites via robust one-step method and their adsorption potential. J. Hazard. Mater. 2018, 353, 522–533. [Google Scholar] [CrossRef]
  8. Huseien, G.F.; Mirza, J.; Ismail, M.; Ghoshal, S.; Hussein, A.A. Geopolymer mortars as sustainable repair material: A comprehensive review. Renew. Sustain. Energy Rev. 2017, 80, 54–74. [Google Scholar] [CrossRef]
  9. Zhao, X.; Liu, C.; Zuo, L.; Wang, L.; Zhu, Q.; Liu, Y.; Zhou, B. Synthesis and characterization of fly ash geopolymer paste for goaf backfill: Reuse of soda residue. J. Clean. Prod. 2020, 260, 121045. [Google Scholar] [CrossRef]
  10. Yarusova, S.; Shichalin, O.; Belov, A.; Azon, S.; Buravlev, I.Y.; Golub, A.; Mayorov, V.Y.; Gerasimenko, A.; Papynov, E.; Ivanets, A.; et al. Synthesis of amorphous KAlSi3O8 for cesium radionuclide immobilization into solid matrices using spark plasma sintering technique. Ceram. Int. 2021, 48, 3808–3817. [Google Scholar] [CrossRef]
  11. Shichalin, O.; Papynov, E.; Nepomnyushchaya, V.; Ivanets, A.; Belov, A.; Dran’kov, A.; Yarusova, S.; Buravlev, I.; Tarabanova, A.; Fedorets, A.; et al. Hydrothermal synthesis and spark plasma sintering of NaY zeolite as solid-state matrices for cesium-137 immobilization. J. Eur. Ceram. Soc. 2022, 42, 3004–3014. [Google Scholar] [CrossRef]
  12. Penilla, R.P.; Bustos, A.G.; Elizalde, S.G. Immobilization of Cs, Cd, Pb and Cr by synthetic zeolites from Spanish low-calcium coal fly ash. Fuel 2006, 85, 823–832. [Google Scholar] [CrossRef]
  13. Cardoso, A.M.; Paprocki, A.; Ferret, L.S.; Azevedo, C.M.; Pires, M. Synthesis of zeolite Na-P1 under mild conditions using Brazilian coal fly ash and its application in wastewater treatment. Fuel 2015, 139, 59–67. [Google Scholar] [CrossRef]
  14. Wu, D.; Sui, Y.; Chen, X.; He, S.; Wang, X.; Kong, H. Changes of mineralogical–chemical composition, cation exchange capacity, and phosphate immobilization capacity during the hydrothermal conversion process of coal fly ash into zeolite. Fuel 2008, 87, 2194–2200. [Google Scholar] [CrossRef]
  15. Wang, Y.; Han, F.; Mu, J. Solidification/stabilization mechanism of Pb (II), Cd (II), Mn (II) and Cr (III) in fly ash based geopolymers. Constr. Build. Mater. 2018, 160, 818–827. [Google Scholar] [CrossRef]
  16. Wdowin, M.; Wiatros-Motyka, M.M.; Panek, R.; Stevens, L.A.; Franus, W.; Snape, C.E. Experimental study of mercury removal from exhaust gases. Fuel 2014, 128, 451–457. [Google Scholar] [CrossRef]
  17. Lei, H.; Muhammad, Y.; Wang, K.; Yi, M.; He, C.; Wei, Y.; Fujita, T. Facile fabrication of metakaolin/slag-based zeolite microspheres (M/SZMs) geopolymer for the efficient remediation of Cs+ and Sr2+ from aqueous media. J. Hazard. Mater. 2021, 406, 124292. [Google Scholar] [CrossRef]
  18. Lee, N.K.; Khalid, H.R.; Lee, H.K. Adsorption characteristics of cesium onto mesoporous geopolymers containing nano-crystalline zeolites. Microporous Mesoporous Mater. 2017, 242, 238–244. [Google Scholar] [CrossRef]
  19. Hui, K.S.; Chao CY, H.; Kot, S.C. Removal of mixed heavy metal ions in wastewater by zeolite 4A and residual products from recycled coal fly ash. J. Hazard. Mater. 2005, 127, 89–101. [Google Scholar] [CrossRef]
  20. Querol, X.; Moreno, N.; Umaña, J.C.; Alastuey, A.; Hernández, E.; López-Soler, A.; Plana, F. Synthesis of zeolites from coal fly ash: An overview. Int. J. Coal Geol. 2002, 50, 413–423. [Google Scholar] [CrossRef]
  21. Kumar, M.M.; Jena, H. Direct single-step synthesis of phase pure zeolite Na-P1, hydroxy sodalite and analcime from coal fly ash and assessment of their Cs+ and Sr2+ removal efficiencies. Microporous Mesoporous Mater. 2022, 333, 111738. [Google Scholar] [CrossRef]
  22. Palomo, Á.; Alonso, S.; Fernandez-Jiménez, A.; Sobrados, I.; Sanz, J. Alkaline Activation of Fly Ashes: NMR Study of the Reaction Products. J. Am. Ceram. Soc. 2004, 87, 1141–1145. [Google Scholar] [CrossRef]
  23. Zheng, Z.; Ma, X.; Zhang, Z.; Li, Y. In-situ transition of amorphous gels to Na-P1 zeolite in geopolymer: Mechanical and adsorption properties. Constr. Build. Mater. 2019, 202, 851–860. [Google Scholar] [CrossRef]
  24. Ren, X.; Liu, S.; Qu, R.; Xiao, L.; Hu, P.; Song, H.; Wu, W.; Zheng, C.; Wu, X.; Gao, X. Synthesis and characterization of single-phase submicron zeolite Y from coal fly ash and its potential application for acetone adsorption. Microporous Mesoporous Mater. 2019, 295, 109940. [Google Scholar] [CrossRef]
  25. Zheng, Z.; Li, Y.; Sun, H.; Zhang, Z.; Ma, X. Coupling effect of NaOH and NaNO3 on the solidified fly ash-cement matrices containing Cs+: Reaction products, microstructure and leachability. J. Nucl. Mater. 2020, 539, 152252. [Google Scholar] [CrossRef]
  26. Aono, H.; Takeuchi, Y.; Itagaki, Y.; Johan, E. Synthesis of chabazite and merlinoite for Cs+ adsorption and immobilization properties by heat-treatment. Solid State Sci. 2019, 100, 106094. [Google Scholar] [CrossRef]
  27. Munthali, M.W.; Johan, E.; Aono, H.; Matsue, N. Cs+ and Sr2+ adsorption selectivity of zeolites in relation to radioactive decontamination. J. Asian Ceram. Soc. 2015, 3, 245–250. [Google Scholar] [CrossRef]
  28. Perná, I.; Šupová, M.; Hanzlíček, T.; Špaldoňová, A. The synthesis and characterization of geopolymers based on metakaolin and high LOI straw ash. Constr. Build. Mater. 2019, 228, 116765. [Google Scholar] [CrossRef]
  29. Chen, Z.; Li, J.S.; Zhan, B.J.; Sharma, U.; Poon, C.S. Compressive strength and microstructural properties of dry-mixed geopolymer pastes synthesized from GGBS and sewage sludge ash. Constr. Build. Mater. 2018, 182, 597–607. [Google Scholar] [CrossRef]
  30. Liu, Y.; Yan, C.; Zhao, J.; Zhang, Z.; Wang, H.; Zhou, S.; Wu, L. Synthesis of zeolite P1 from fly ash under solvent-free conditions for ammonium removal from water. J. Clean. Prod. 2018, 202, 11–22. [Google Scholar] [CrossRef]
  31. Guo, X.; Wang, J. Comparison of linearization methods for modeling the Langmuir adsorption isotherm. J. Mol. Liq. 2019, 296, 111850. [Google Scholar] [CrossRef]
  32. Majd, M.M.; Kordzadeh-Kermani, V.; Ghalandari, V.; Askari, A.; Sillanpää, M. Adsorption isotherm models: A comprehensive and systematic review (2010−2020). Sci. Total. Environ. 2021, 812, 151334. [Google Scholar] [CrossRef] [PubMed]
  33. Xiang, Y.; Hou, L.; Liu, J.; Li, J.; Lu, Z.; Niu, Y. Adsorption and enrichment of simulated 137Cs in geopolymer foams. J. Environ. Chem. Eng. 2021, 9, 105733. [Google Scholar] [CrossRef]
  34. Allaoui, M.; Berradi, M.; Bensalah, J.; Es-Sahbany, H.; Dagdag, O.; Ibn Ahmed, S. Study of the adsorption of nickel ions on the sea shells of Mehdia: Kinetic and thermodynamic study and mathematical modelling of experimental data. Mater. Today Proc. 2021, 45, 7494–7500. [Google Scholar] [CrossRef]
  35. Jin, H.; Zhang, Y.; Wang, Q.; Chang, Q.; Li, C. Rapid removal of methylene blue and nickel ions and adsorption/desorption mechanism based on geopolymer adsorbent. Colloid Interface Sci. Commun. 2021, 45, 100551. [Google Scholar] [CrossRef]
  36. Deng, H.; Li, Y.; Huang, Y.; Ma, X.; Wu, L.; Cheng, T. An efficient composite ion exchanger of silica matrix impregnated with ammonium molybdophosphate for cesium uptake from aqueous solution. Chem. Eng. J. 2016, 286, 25–35. [Google Scholar] [CrossRef]
  37. Deng, H.; Li, Y.; Wu, L.; Ma, X. The novel composite mechanism of ammonium molybdophosphate loaded on silica matrix and its ion exchange breakthrough curves for cesium. J. Hazard. Mater. 2017, 324, 348–356. [Google Scholar] [CrossRef]
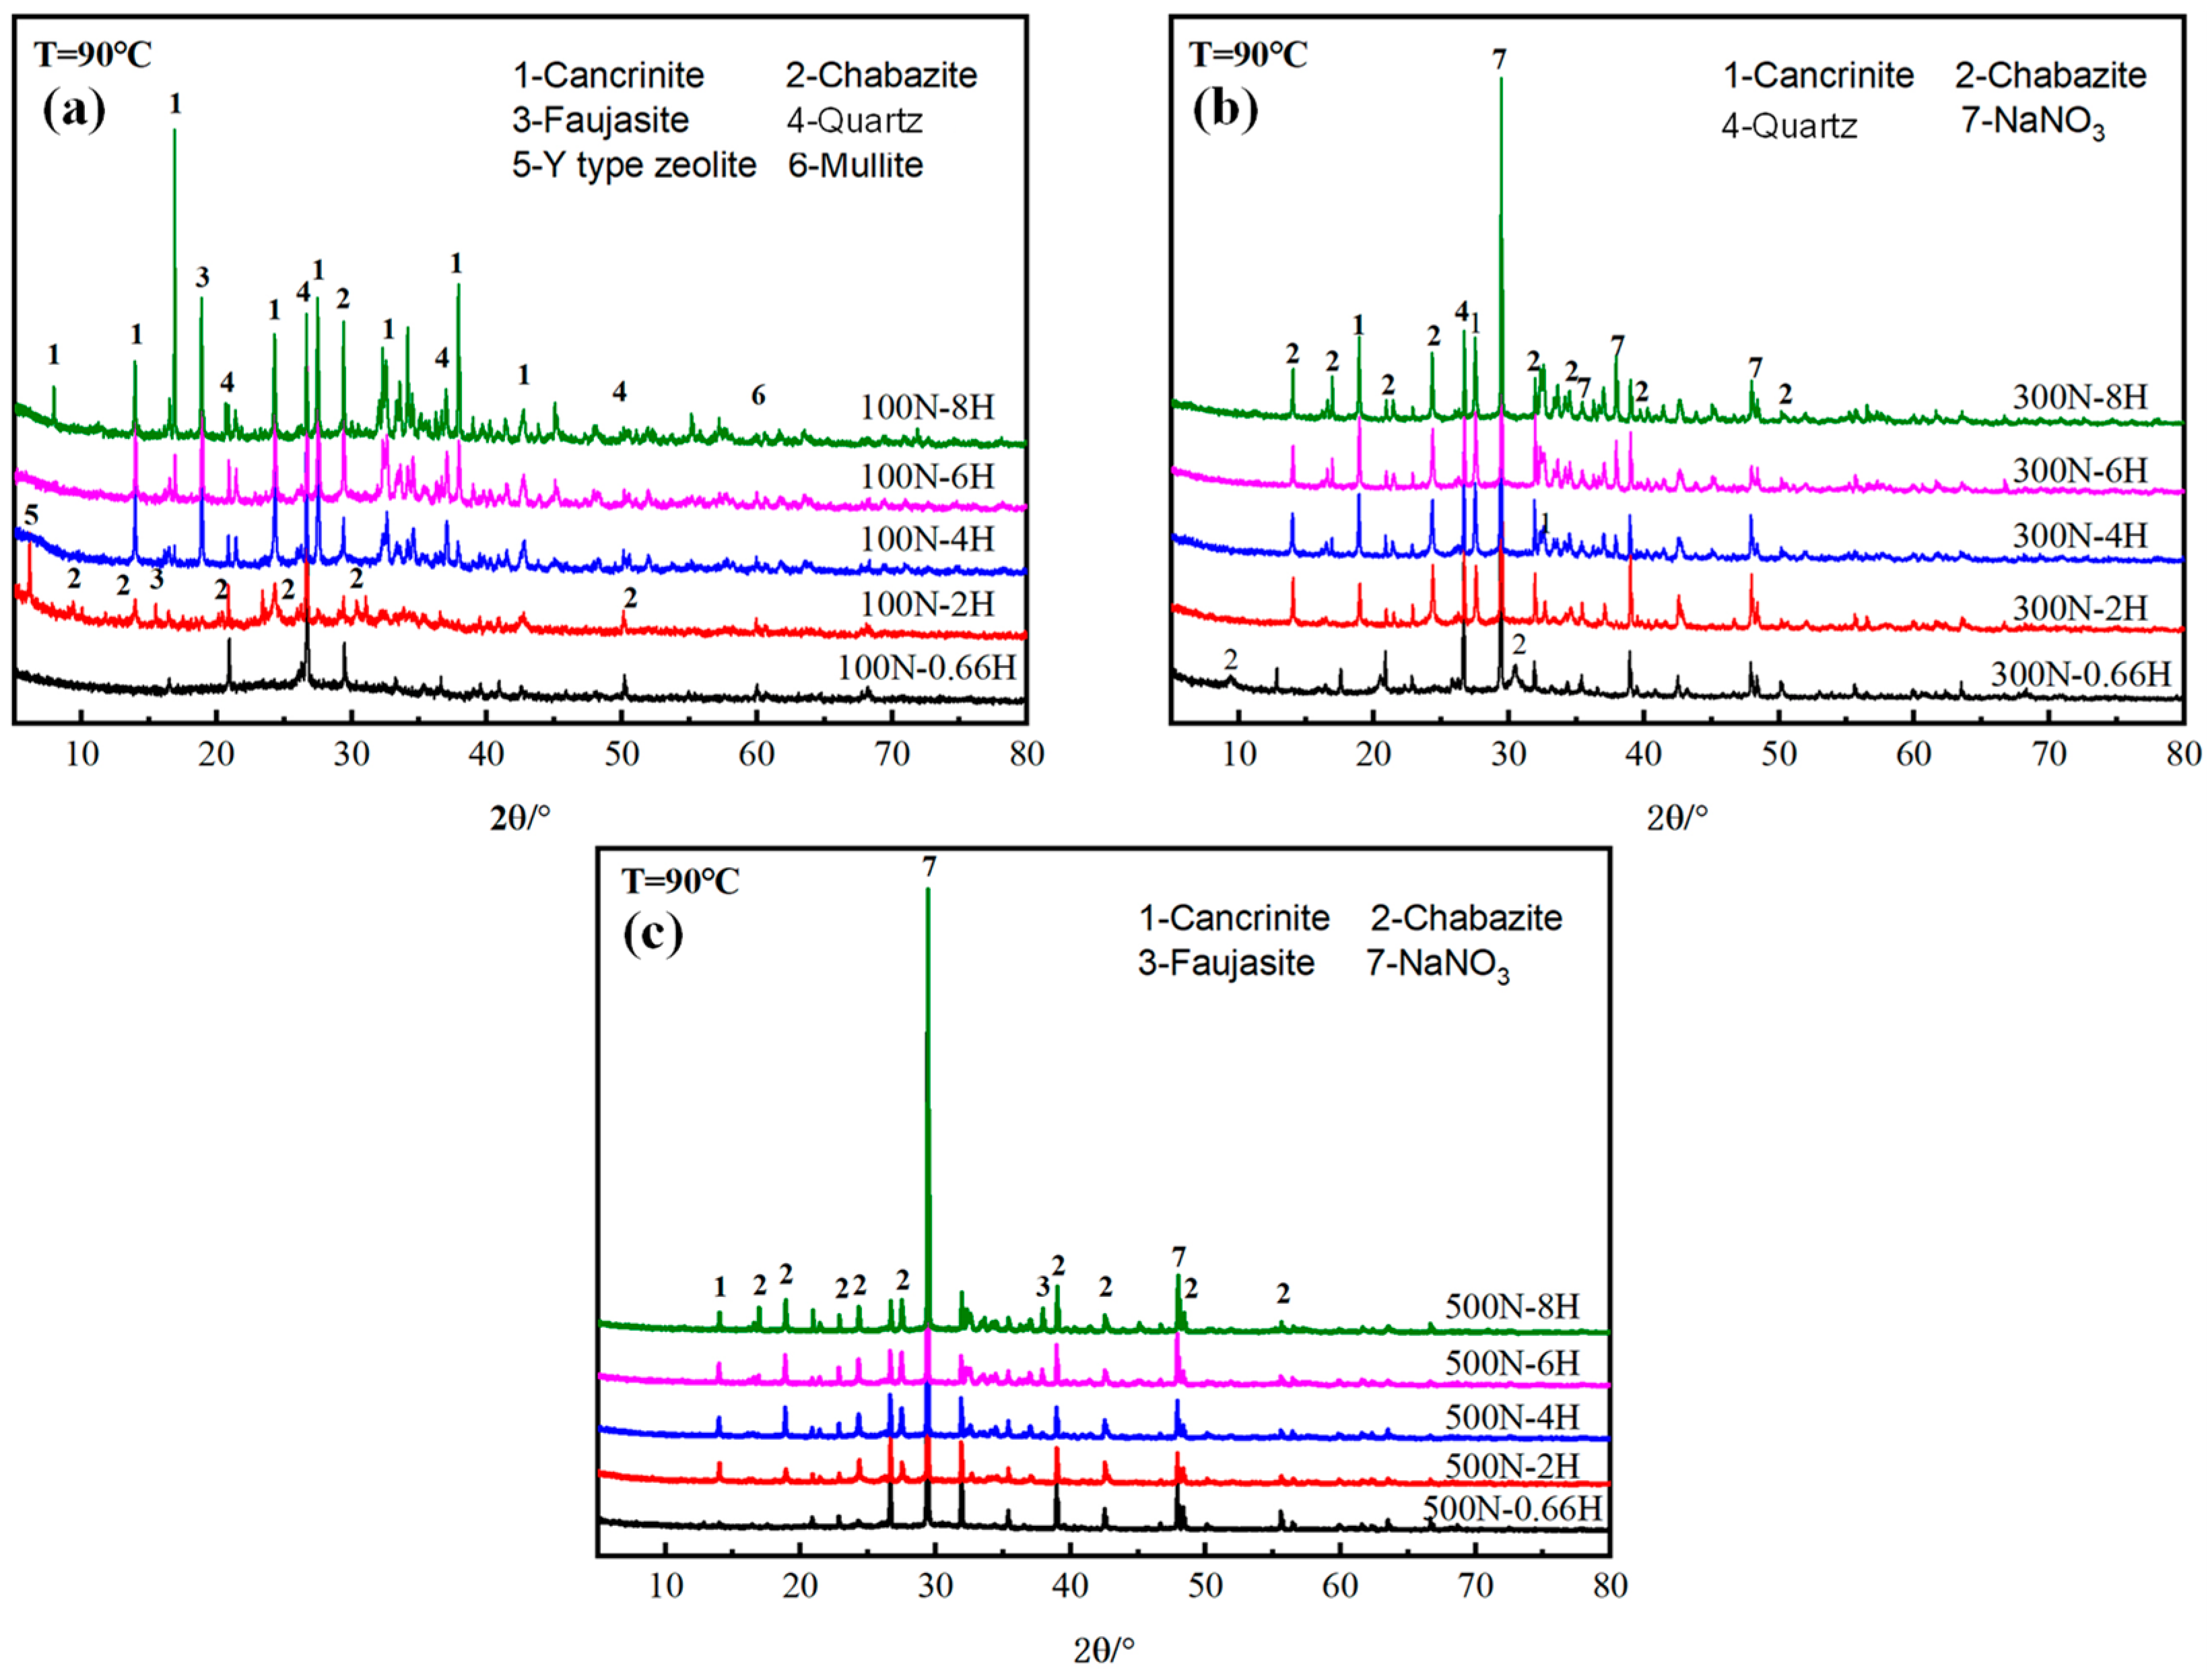
Figure 1. XRD patterns of products with different NaOH contents at different NaNO3 concentrations: (a) 100 g/L NaNO3; (b) 300 g/L NaNO3; (c) 500 g/L NaNO3.
Energies 16 07815 g001
Figure 2. XRD patterns of products 100N-2H at different curing temperatures.
Energies 16 07815 g002
Figure 3. SEM diagrams of product 100N-2H-90°C.
Energies 16 07815 g003
Figure 4. SEM diagrams of product 100N-2H-120°C.
Energies 16 07815 g004
Figure 5. SEM diagrams of product 100N-2H-150°C.
Energies 16 07815 g005
Figure 6. FTIR spectra of T120 products before and after adsorption of Cs+.
Energies 16 07815 g006
Figure 7. Adsorption rate of Cs+ on T120 products with different initial concentrations.
Energies 16 07815 g007
Figure 8. The fitting curves of isothermal adsorption of Cs+ on T120 products.
Energies 16 07815 g008
Figure 9. The fitting diagram of pseudo-first-order kinetic model to the desorption of Cs+ from T120 products.
Energies 16 07815 g009
Figure 10. The fitting diagram of pseudo-second-order kinetic model to the desorption of Cs+ from T120 products.
Energies 16 07815 g010
Table 1. Oxide composition of fly ash.
Oxide CompositionSiO2Al2O3CaOFe2O3K2OMgOOther
Content (%)59.7921.995.555.133.211.352.98
Table 2. Design ratios with different NaOH concentrations and different NaNO3 concentrations.
60 °C Water Bath for 8 h; Curing at 90 °C for 24 h
Sample NumberNaNO3 (g/L)NaNO3 (g)W/FNaOH (g)Fly Ash (g)
100N-0.66H1004.1581.065
100N-2H1004.1583.235
100N-4H1004.1586.455
100N-6H1004.1589.685
100N-8H1004.15812.905
300N-0.66H30013.5581.065
300N-2H30013.5583.235
300N-4H30013.5586.455
300N-6H30013.5589.685
300N-8H30013.55812.905
500N-0.66H50024.9081.065
500N-2H50024.9083.235
500N-4H50024.9086.455
500N-6H50024.9089.685
500N-8H50024.90812.905
Notes: N means NaNO3 solution concentration, and H means NaOH molar concentration.
Table 3. The ratios of sample 100N-2H at different curing temperatures.
Stirring in Water Bath at 60 °C for 8 h, Curing at Different Temperatures for 24 h
Sample NumberNaNO3 (g/L)NaNO3/gW/FNaOH/gFly Ash/g
100N-2H-60 °C1004.1583.235
100N-2H-90 °C1004.1583.235
100N-2H-120 °C1004.1583.235
100N-2H-150 °C1004.1583.235
Table 4. Isothermal adsorption equation and fitting parameters of Cs+ on T120 products (25 °C).
LangmuirFreundlich
Qm (mg/g)KLR2nKF (mg/g)R2
T12087.911.75 × 10−20.953.3612.640.96
Table 5. Desorption rate and amount of Cs+ from T120 products at different desorption times.
Desorption Time (min)51015304560
Desorption rate (%)83.38 90.63 80.52 87.73 88.25 101.74
Desorption capacity (mg/g)26.28 28.5625.38 27.65 27.8132.06
Table 6. Desorption kinetic equation and fitting parameters of Cs+ from T120 products.
Kinetic EquationDesorption Kinetic EquationDesorption RateTheoretical Equilibrium Desorption Capacity/mg·g−1R2
Pseudo-first-orderlg(Qe − Qt) = 0.68 − 2.28 × 10⁻³ t5.25 × 10−3 min−14.740.09
Pseudo-second-ordert/Qt =1.71 × 10⁻² + 3.576 × 10⁻² t7.48 × 10−2 mg/(g·min−1)27.960.99
Disclaimer/Publisher’s Note: The statements, opinions and data contained in all publications are solely those of the individual author(s) and contributor(s) and not of MDPI and/or the editor(s). MDPI and/or the editor(s) disclaim responsibility for any injury to people or property resulting from any ideas, methods, instructions or products referred to in the content.