

A Predictive Model for Hydrate Formation Conditions in Alcohol-Containing Systems Based on the Cubic-Plus-Association State Equation


Abstract
:1. Introduction
2. Thermodynamic Model
2.1. P-P Hydrate Model
2.2. CPA EoS
2.3. Alcohol-Water Molecule Association Model
3. Regression of Binary Interaction Coefficients for Alcohol-Water-Gas
4. Results and Discussion
4.1. Prediction of Component Fractions in Methane-Alcohol-Water Systems
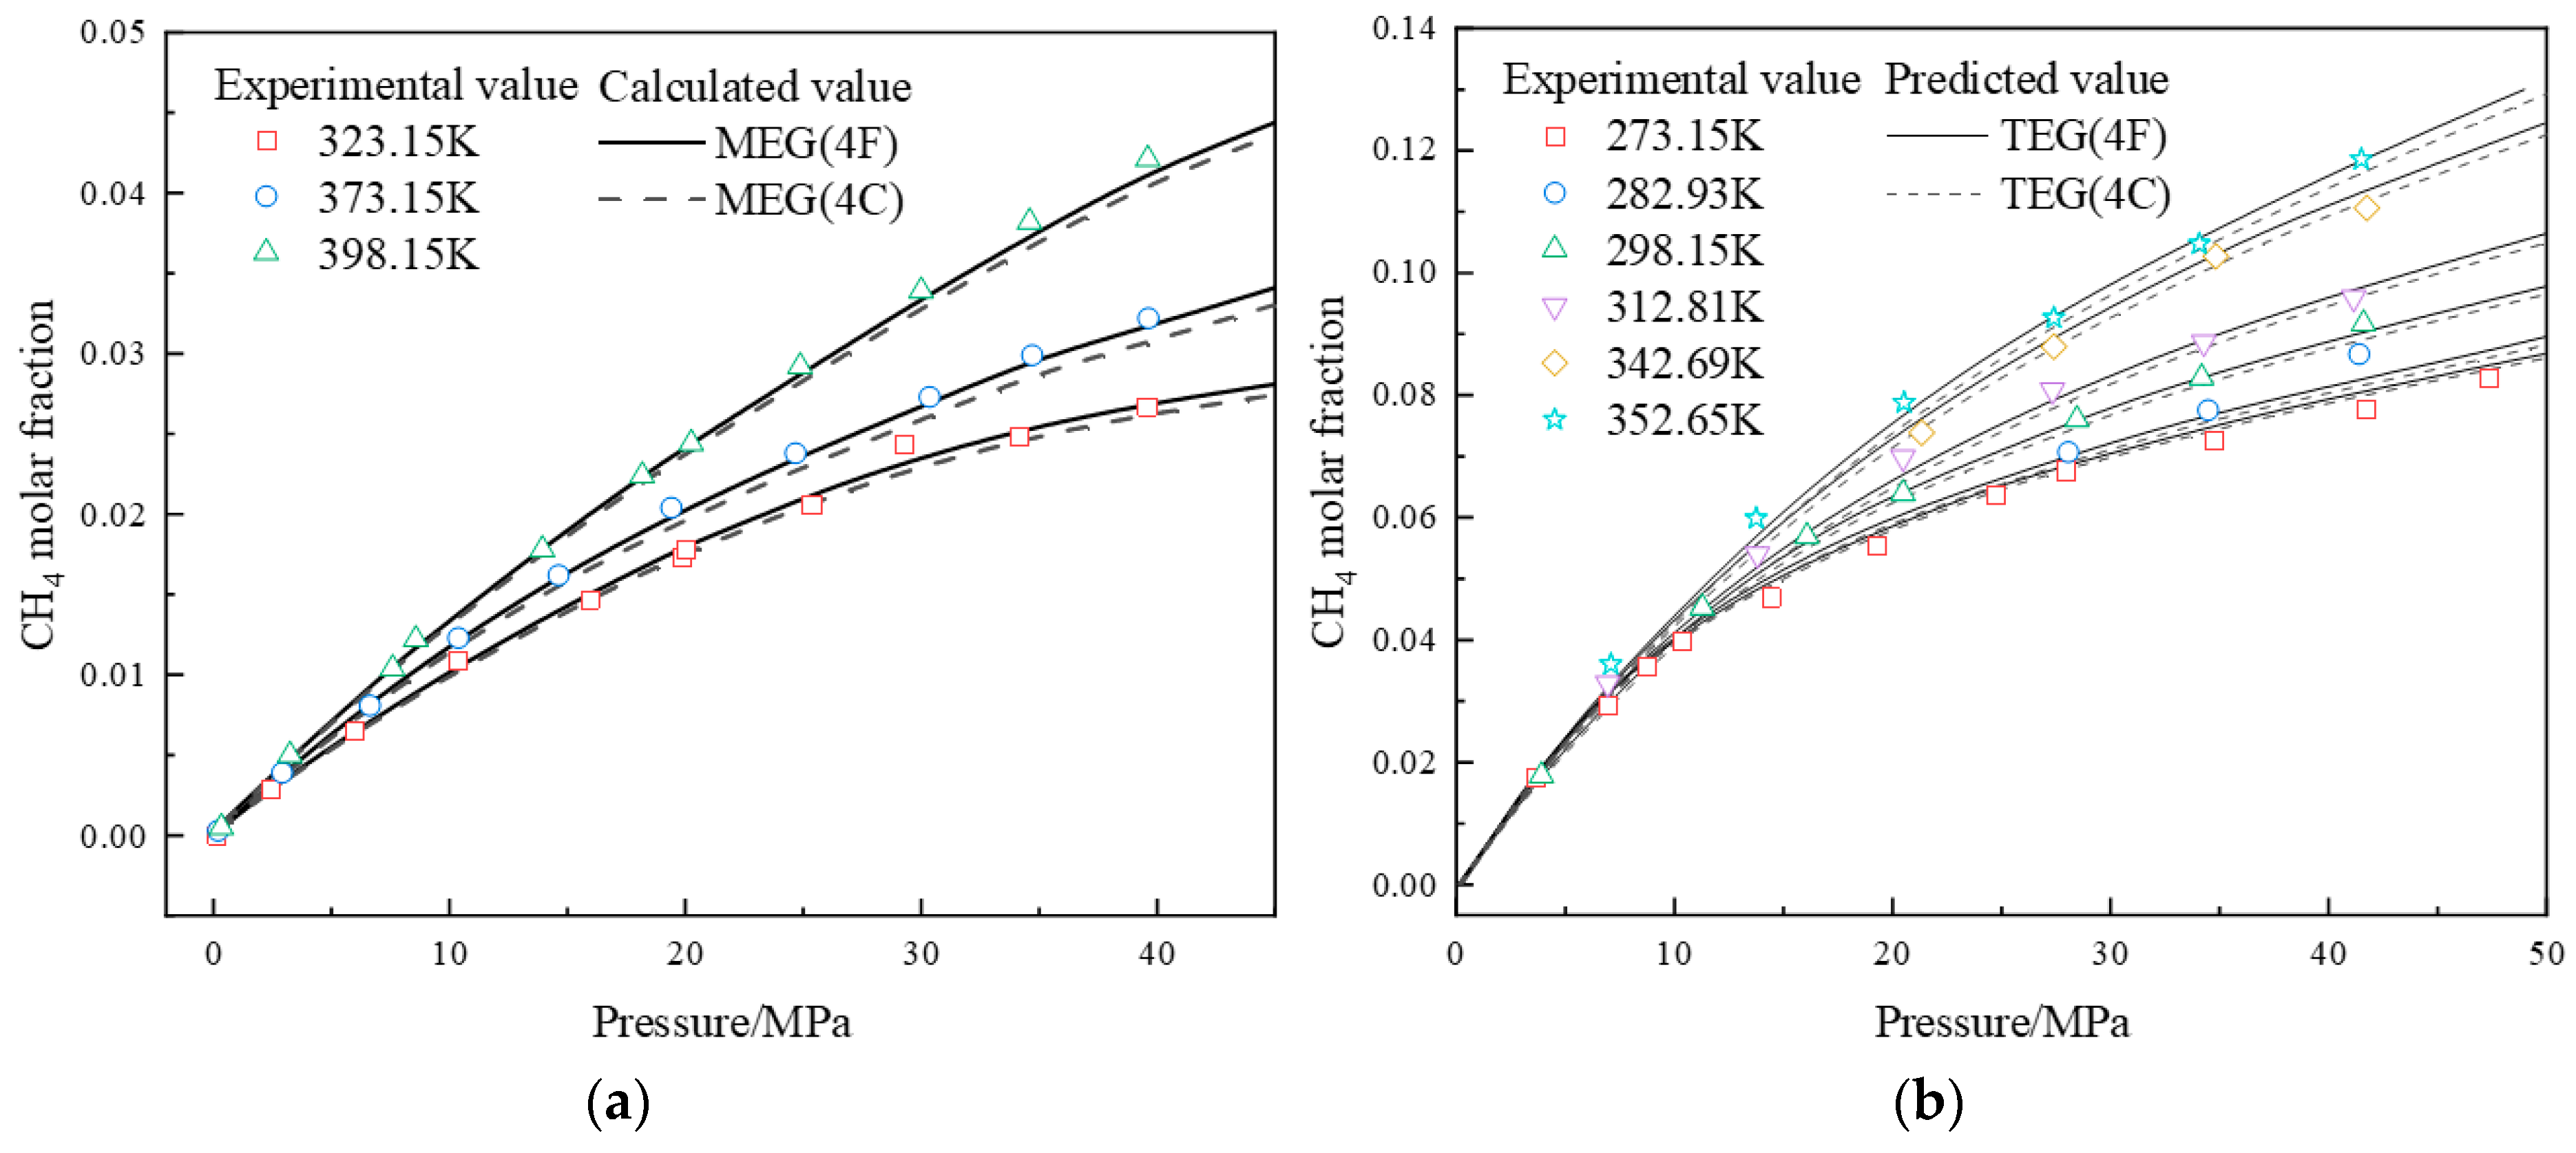
4.1.1. Prediction of Component Fractions in Methane-Alcohol/Water Binary Systems
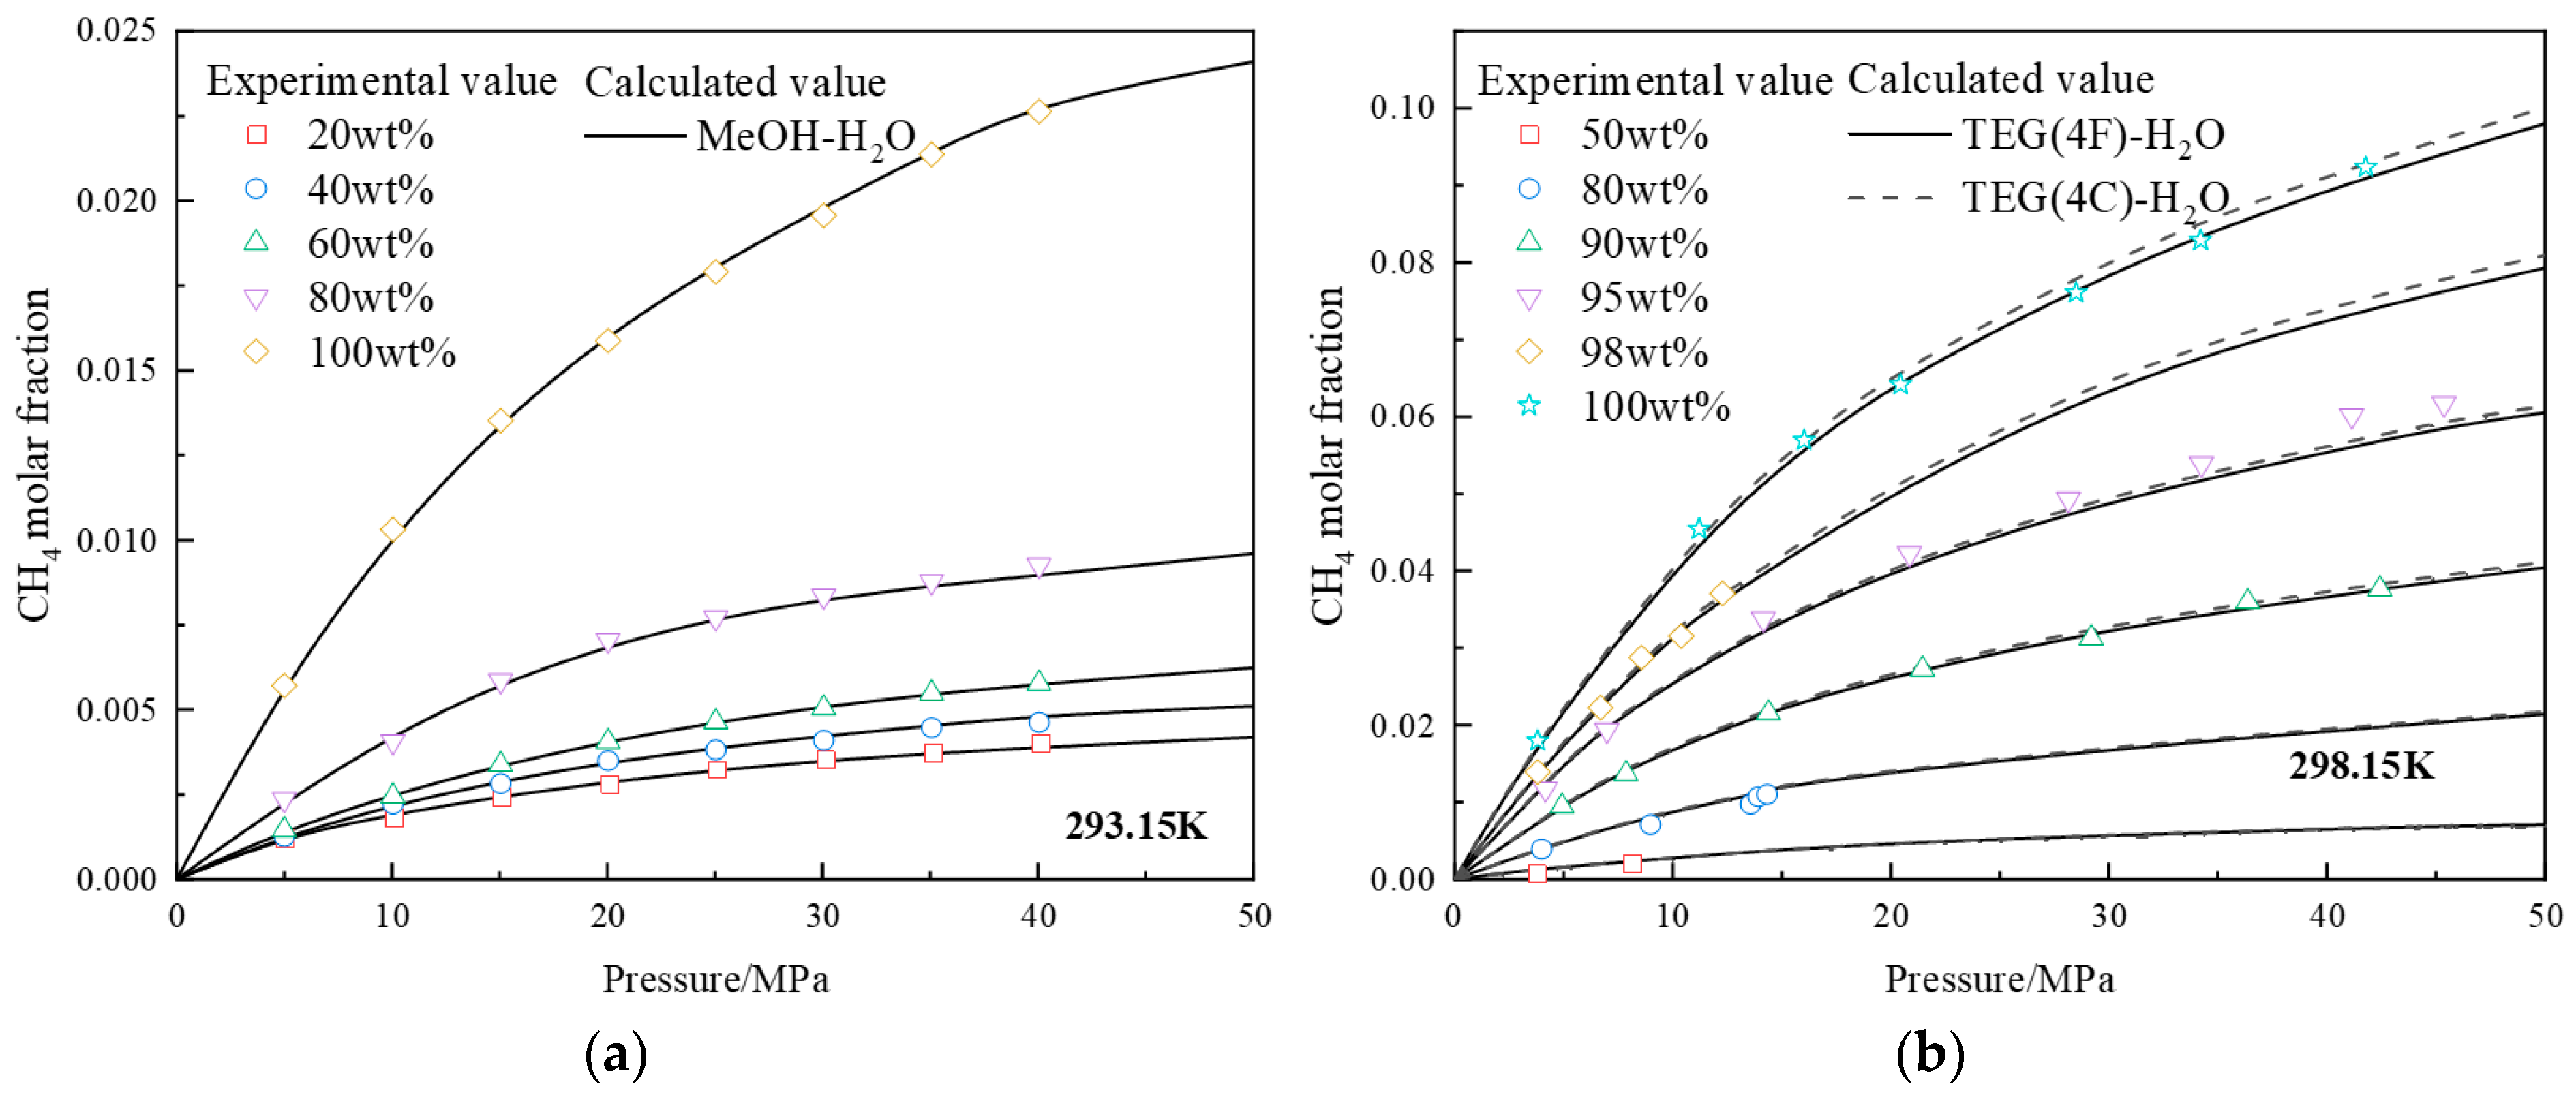
4.1.2. Prediction of Component Fractions in Methane-Alcohol-Water Ternary Systems
4.2. Prediction of Gas-Hydrate Formation Conditions in Gas-Alcohol-Water Systems
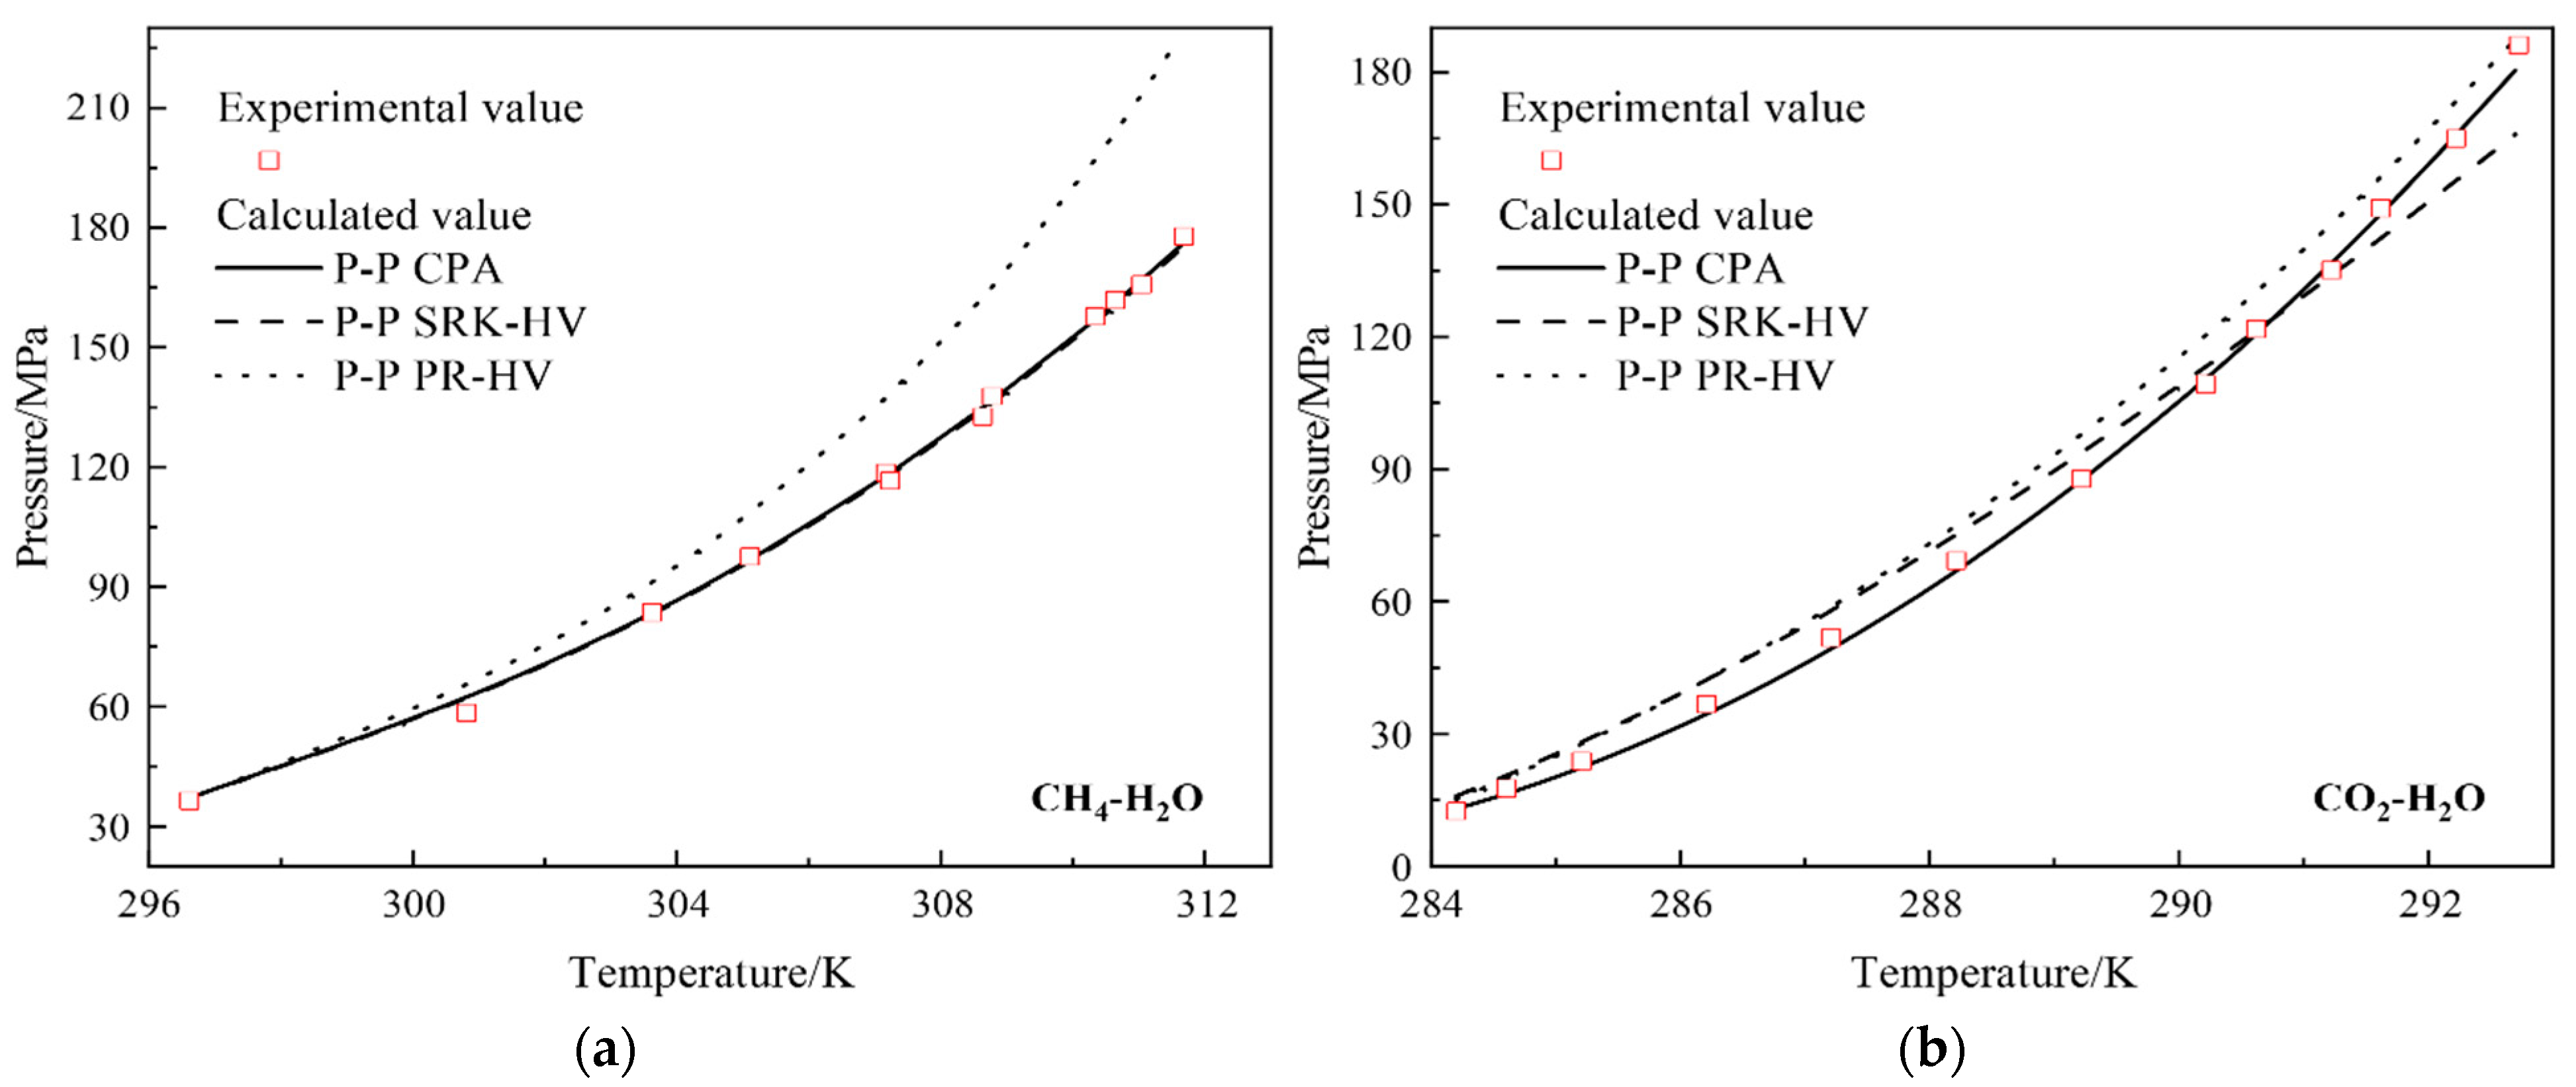
4.2.1. Prediction of Gas-Hydrate Formation Conditions in Gas-Water Binary Systems
4.2.2. Prediction of Gas-Hydrate Formation Conditions in Gas-Alcohol-Water Ternary Systems
5. Conclusions
- This new model takes into account the impact of molecular association on the vapor-liquid equilibrium and hydrate phase equilibrium and successfully describes the influence of molecular association on hydrate formation conditions;
- The proposed model is validated using experimental data in multi-component systems, including alcohol-water, methane-alcohol/water, and methane-alcohol-water, within a temperature range of 273.15 to 444.26 K and a pressure range of 0.1 to 106.6 MPa. With an average relative error ranging from 1.17% to 6.42%, this indicates that the model exhibits high precision in predicting the methane component’s mole fraction in the liquid phase. Furthermore, the 4F association model for MEG and TEG exhibits higher prediction accuracy;
- In alcohol-containing systems, the SRK-HV and PR-HV models exhibit an average relative deviation in predicting hydrate formation conditions ranging from 4.32% to 9.80% and 3.9% to 9.34%. In contrast, the proposed model demonstrates a noticeable enhancement in accuracy, with an average relative deviation of 1.93% to 4.78%, which can effectively predict the hydrate formation conditions in alcohol-containing systems;
- In alcohol-containing systems, the proposed model demonstrates superior computational performance under most conditions. However, for conditions with high alcohol concentrations or pressure, significant errors persist. Enhancing the model’s applicability in these conditions will be a primary focus of our future work. In addition, comparing the computational times of the various different models may be more beneficial for readers to balance accuracy and computational speed. In future studies, if we encounter more complex models or larger-scale computations, we will certainly include a comparison of computational times to provide a more comprehensive perspective.
Author Contributions
Funding
Data Availability Statement
Conflicts of Interest
References
- Platteeuw, J.C.; van der Waals, J.H. Thermodynamic properties of gas hydrates. Mol. Phys. 1958, 1, 91–96. [Google Scholar] [CrossRef]
- Parrish, W.R.; Prausnitz, J.M. Dissociation Pressures of Gas Hydrates Formed by Gas Mixtures. Ind. Eng. Chem. Process Des. Dev. 1972, 11, 26–35. [Google Scholar] [CrossRef]
- Seif, M.; Kamran-Pirzaman, A.; Mohammadi, A.H. Phase equilibria of clathrate hydrates in CO2/CH4 + (1-propanol/2-propanol) + water systems: Experimental measurements and thermodynamic modeling. J. Chem. Thermodyn. 2018, 118, 58–66. [Google Scholar] [CrossRef]
- Jia, W.; Song, S.; Li, C.; Wu, X.; Yang, F.; Zhang, Y.; Wang, B. Simulation of multiphase behavior in supercritical CO2–heavy oil–water sludge extraction systems using Cubic-Plus-Association Equation of State. J. Supercrit. Fluid 2023, 200, 106001. [Google Scholar] [CrossRef]
- Jia, W.; Yang, F.; Li, C.; Huang, T.; Song, S. A unified thermodynamic framework to compute the hydrate formation conditions of acidic gas/water/alcohol/electrolyte mixtures up to 186.2 MPa. Energy 2021, 230, 120735. [Google Scholar] [CrossRef]
- Masoudi, R.; Tohidi, B.; Anderson, R.; Burgass, R.W.; Yang, J. Experimental measurement and thermodynamic modelling of clathrate hydrate equilibria and salt solubility in aqueous ethylene glycol and electrolyte solutions. Fluid Phase Equilibria 2004, 219, 157–163. [Google Scholar] [CrossRef]
- Delavar, H.; Haghtalab, A. Thermodynamic modeling of gas hydrate formation conditions in the presence of organic inhibitors, salts and their mixtures using UNIQUAC model. Fluid Phase Equilibria 2015, 394, 101–117. [Google Scholar] [CrossRef]
- Kontogeorgis, G.M.; Voutsas, E.C.; Yakoumis, I.V.; Tassios, D.P. An Equation of State for Associating Fluids. Ind. Eng. Chem. Res. 1996, 35, 4310–4318. [Google Scholar] [CrossRef]
- Huang, S.H.; Radosz, M. Equation of state for small, large, polydisperse, and associating molecules. Ind. Eng. Chem. Res. 1990, 29, 2284–2294. [Google Scholar] [CrossRef]
- Kruger, F.; Kontogeorgis, G.M.; von Solms, N. New association schemes for mono-ethylene glycol: Cubic-Plus-Association parameterization and uncertainty analysis. Fluid Phase Equilibria 2018, 458, 211–233. [Google Scholar] [CrossRef]
- Qvistgaard, D.; Kruger, F.; Liang, X.; Kontogeorgis, G.M.; von Solms, N. New association schemes for tri-ethylene glycol: Cubic-Plus-Association parameterization and uncertainty analysis. Fluid Phase Equilibria 2022, 551, 113254. [Google Scholar] [CrossRef]
- Voutsas, E.C.; Kontogeorgis, G.M.; Yakoumis, I.V.; Tassios, D.P. Correlation of liquid-liquid equilibria for alcoholhydrocarbon mixtures using the CPA equation of state. Fluid Phase Equilibria 1997, 132, 61–75. [Google Scholar] [CrossRef]
- Jia, W.; Yang, F.; Wu, X.; Li, C.; Wang, Y. Predictions on temperatures of high-pressure gas/water/MEG mixtures flowing through wellhead chokes. J. Nat. Gas Sci. Eng. 2020, 74, 103108. [Google Scholar] [CrossRef]
- Britt, H.I.; Luecke, R.H. The Estimation of Parameters in Nonlinear, Implicit Models. Technometrics 1973, 15, 233–247. [Google Scholar] [CrossRef]
- Coutinho, J.A.P.; Kontogeorgis, G.M.; Stenby, E.H. Binary interaction parameters for nonpolar systems with cubic equations of state: A theoretical approach 1. CO2/hydrocarbons using SRK equation of state. Fluid Phase Equilibria 1994, 102, 31–60. [Google Scholar] [CrossRef]
- Khalfaoui, B.; Meniai, A.H.; Borja, R. Thermodynamic properties of water + normal alcohols and vapor-liquid equilibria for binary systems of methanol or 2-propanol with water. Fluid Phase Equilibria 1997, 127, 181–190. [Google Scholar] [CrossRef]
- Kurihara, K.; Minoura, T.; Takeda, K.; Kojima, K. Isothermal Vapor-Liquid Equilibria for Methanol + Ethanol + Water, Methanol + Water, and Ethanol + Water. J. Chem. Eng. Data 1995, 40, 679–684. [Google Scholar] [CrossRef]
- Chouireb, N.; Crespo, E.A.; Pereira, L.M.C.; Tafat-Igoudjilene, O.; Vega, L.F.; Coutinho, J.A.P.; Carvalho, P.J. Measurement and Modeling of Isobaric Vapor–Liquid Equilibrium of Water + Glycols. J. Chem. Eng. Data 2018, 63, 2394–2401. [Google Scholar] [CrossRef]
- Brunner, E.; Hültenschmidt, W.; Schlichthärle, G. Fluid mixtures at high pressures IV. Isothermal phase equilibria in binary mixtures consisting of (methanol + hydrogen or nitrogen or methane or carbon monoxide or carbon dioxide). J. Chem. Thermodyn. 1987, 19, 273–291. [Google Scholar] [CrossRef]
- Wang, L.-K.; Chen, G.-J.; Han, G.-H.; Guo, X.-Q.; Guo, T.-M. Experimental study on the solubility of natural gas components in water with or without hydrate inhibitor. Fluid Phase Equilibria 2003, 207, 143–154. [Google Scholar] [CrossRef]
- Zheng, D.-Q.; Ma, W.-D.; Wei, R.; Guo, T.-M. Solubility study of methane, carbon dioxide and nitrogen in ethylene glycol at elevated temperatures and pressures. Fluid Phase Equilibria 1999, 155, 277–286. [Google Scholar] [CrossRef]
- Folas, G.K.; Berg, O.J.; Solbraa, E.; Fredheim, A.O.; Kontogeorgis, G.M.; Michelsen, M.L.; Stenby, E.H. High-pressure vapor–liquid equilibria of systems containing ethylene glycol, water and methane: Experimental measurements and modeling. Fluid Phase Equilibria 2007, 251, 52–58. [Google Scholar] [CrossRef]
- Yokoyama, C.; Wakana, S.; Kaminishi, G.; Takahashi, S. Vapor-liquid equilibria in the methane-diethylene glycol-water system at 298.15 and 323.15 K. J. Chem. Eng. Data 1988, 33, 274–276. [Google Scholar] [CrossRef]
- Jou, F.Y.; Deshmukh, R.D.; Otto, F.D.; Mather, A.E. Vaporliquid equilibria for acid gases and lower alkanes in triethylene glycol. Fluid Phase Equilibria 1987, 36, 121–140. [Google Scholar] [CrossRef]
- de Oliveira Cavalcanti Filho, V.; Chapoy, A.; Burgass, R. Phase Behavior in Natural Gas + Glycol Systems, Part 1: Tri(ethylene glycol) (TEG) and Its Aqueous Solutions. J. Chem. Eng. Data 2021, 66, 4075–4093. [Google Scholar] [CrossRef]
- Culberson, O.L.; McKetta, J.J., Jr. Phase Equilibria in Hydrocarbon-Water Systems III—The Solubility of Methane in Water at Pressures to 10,000 PSIA. J. Pet. Technol. 1951, 3, 223–226. [Google Scholar] [CrossRef]
- Chapoy, A.; Mohammadi, A.H.; Richon, D.; Tohidi, B. Gas solubility measurement and modeling for methane–water and methane–ethane–n-butane–water systems at low temperature conditions. Fluid Phase Equilibria 2004, 220, 113–121. [Google Scholar] [CrossRef]
- Nakano, S.; Moritoki, M.; Ohgaki, K. High-Pressure Phase Equilibrium and Raman Microprobe Spectroscopic Studies on the Methane Hydrate System. J. Chem. Eng. Data 1999, 44, 254–257. [Google Scholar] [CrossRef]
- Dyadin, Y.A.; Aladko, E.Y.; Larionov, E.G. Decomposition of methane hydrates up to 15 kbar. Mendeleev Commun. 1997, 7, 34–35. [Google Scholar] [CrossRef]
- Takenouchi, S.; Kennedy, G.C. The solubility of carbon dioxide in NaCl solutions at high temperatures and pressures. Am. J. Sci. 1965, 263, 445–454. [Google Scholar] [CrossRef]
- Javanmardi, J.; Babaee, S.; Eslamimanesh, A.; Mohammadi, A.H. Experimental Measurements and Predictions of Gas Hydrate Dissociation Conditions in the Presence of Methanol and Ethane-1,2-diol Aqueous Solutions. J. Chem. Eng. Data 2012, 57, 1474–1479. [Google Scholar] [CrossRef]
- Haghighi, H.; Chapoy, A.; Burgess, R.; Mazloum, S.; Tohidi, B. Phase equilibria for petroleum reservoir fluids containing water and aqueous methanol solutions: Experimental measurements and modelling using the CPA equation of state. Fluid Phase Equilibria 2009, 278, 109–116. [Google Scholar] [CrossRef]
- Mohammadi, A.H.; Richon, D. Gas Hydrate Phase Equilibrium in the Presence of Ethylene Glycol or Methanol Aqueous Solution. Ind. Eng. Chem. Res. 2010, 49, 8865–8869. [Google Scholar] [CrossRef]
- Mohammadi, A.H.; Richon, D. Phase Equilibria of Propane and Ethane Simple Hydrates in the Presence of Methanol or Ethylene Glycol Aqueous Solutions. Ind. Eng. Chem. Res. 2012, 51, 2804–2807. [Google Scholar] [CrossRef]
- Mohammadi, A.H.; Richon, D. Gas Hydrate Phase Equilibrium in Methane + Ethylene Glycol, Diethylene Glycol, or Triethylene Glycol + Water System. J. Chem. Eng. Data 2011, 56, 4544–4548. [Google Scholar] [CrossRef]
- Robinson, D.B. Hydrate Formation And Inhibition In Gas Or Gas Condensate Streams. J. Can. Pet. Technol. 1986, 25. [Google Scholar] [CrossRef]
- Afzal, W.; Mohammadi, A.H.; Richon, D. Experimental Measurements and Predictions of Dissociation Conditions for Methane, Ethane, Propane, and Carbon Dioxide Simple Hydrates in the Presence of Diethylene Glycol Aqueous Solutions. J. Chem. Eng. Data 2008, 53, 663–666. [Google Scholar] [CrossRef]
- Mahmoodaghdam, E.; Bishnoi, P.R. Equilibrium Data for Methane, Ethane, and Propane Incipient Hydrate Formation in Aqueous Solutions of Ethylene Glycol and Diethylene Glycol. J. Chem. Eng. Data 2002, 47, 278–281. [Google Scholar] [CrossRef]
- Ross, M.J.; Toczylkin, L.S. Hydrate dissociation pressures for methane or ethane in the presence of aqueous solutions of triethylene glycol. J. Chem. Eng. Data 1992, 37, 488–491. [Google Scholar] [CrossRef]


| Substance | H2O | MEG | MeOH |
|---|---|---|---|
| Association model | 4C | 4C | 2B |
| Schematic of association form |  | 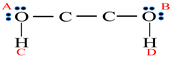 |  |
| Association Model | 4C | 3C | 4E | 4F |
|---|---|---|---|---|
| Schematic of association form | 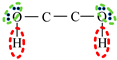 * * |  * * | 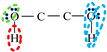 * * | 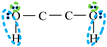 * * |
 is bipolar site;
  is positive site;
  is negative site.
| Association Model | 4C | 5C | 6D |
|---|---|---|---|
| Schematic of association form |  * * |  * * |  * * |
| Association model | 4F | 5F | 6F |
| Schematic of association form | 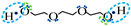 * * |  * * |  * * |
 is bipolar site;
  is positive site;
  is negative site.
| Substance | H2O | MeOH | MEG | DEG | TEG |
|---|---|---|---|---|---|
| Association model | 4C | 2B | 4F | 4C | 4F |
| Substance 1 | Substance 2 | kij = A + BT | T/K | P/kPa | ARD(P)% | Nd | References | |
|---|---|---|---|---|---|---|---|---|
| A | B × 104/k−1 | |||||||
| MeOH | H2O | −0.542 | 15 | 323.15~373.15 | 30~101.3 | 0.51 | 38 | [16,17] |
| MEG a,* | −0.231 | 3.5 | 353.64~410.95 | 50~100 | 1.35 | 23 | [18] | |
| MEG b,* | −0.129 | 2.6 | 1.17 | |||||
| DEG | −0.172 | 1.7 | 353.64~429.60 | 50~100 | 1.21 | 25 | [18] | |
| TEG a,* | −0.292 | 2.2 | 355.65~420.64 | 50~100 | 2.25 | 26 | [18] | |
| TEG b,* | −0.251 | 1.3 | 1.75 | |||||
| Substance 1 | Substance 2 | kij = A + BT | T/K | P/kPa | ARD(P)% | Nd | References | |
|---|---|---|---|---|---|---|---|---|
| A | B × 104/k−1 | |||||||
| MeOH | CH4 | 0.0487 | 1.8 | 283.15~373.15 | 3~105.1 | 0.79 | 33 | [19,20] |
| MEG a,* | 0.0498 | 3 | 278.15~398.15 | 0.2~39.62 | 1.61 | 44 | [21,22] | |
| MEG b,* | 0.0512 | 2.7 | 1.37 | |||||
| DEG | 0.1277 | 1.2 | 298.15~323.15 | 3.0~8.0 | 1.54 | 48 | [23] | |
| TEG a,* | 0.1922 | −0.9 | 273.15~398.15 | 0.1~41.41 | 1.88 | 39 | [24,25] | |
| TEG b,* | 0.1782 | −0.6 | 1.57 | |||||
| H2O | 0.5985 | 21 | 275.3~444.26 | 0.97~68.91 | 0.73 | 37 | [26,27] | |
| Multi- Component System | T/K | P/MPa | ARD(x1)/% | Nd | References |
|---|---|---|---|---|---|
| CH4(1)-MeOH(2) | 298.15~373.15 | 5.45~106.6 | 4.27 | 28 | [19] |
| 283.15~303.15 | 5.05~40.05 | 5.02 | 24 | [20] | |
| CH4(1)-MEG(2) | 323.15~398.15 | 0.2~39.62 | 4.66 a,*/3.16 b,* | 31 | [21] |
| 283.29~323.45 | 5~10.08 | 5.77 a,*/5.42 b,* | 6 | [22] | |
| CH4(1)-DEG(2) | 298.15~323.15 | 3~8 | 6.54 | 6 | [23] |
| CH4(1)-TEG(2) | 298.15~398.15 | 0.1~20.20 | 4.39 a,*/4.02 b,* | 50 | [24] |
| 273.15~352.65 | 3.6~47.21 | 4.45 a,*/4.11 b,* | 40 | [25] | |
| CH4(1)-H2O(2) | 298.15~444.26 | 2.22~68.91 | 5.57 | 73 | [26] |
| 275.11~313.11 | 0.973~18.00 | 6.42 | 16 | [27] |
| System | T/K | P/MPa | Nd | ARD(P)% | References | ||
|---|---|---|---|---|---|---|---|
| SRK-HV | CPA | PR-HV | |||||
| CH4-H2O | 296.6~311.6 | 37~178 | 12 | 1.4 | 1.3 | 17 | [28,29] |
| CO2-H2O | 284.2~292.7 | 13~186 | 13 | 8.65 | 5.33 | 8.82 | [30] |
| Alcohol Type | Concentration/wt% | T/K | P/MPa | Nd | ARD(P)% | References | ||
|---|---|---|---|---|---|---|---|---|
| SRK-HV | CPA | PR-HV | ||||||
| MeOH | 6–65 | 234.5–287.05 | 2.59–33.92 | 34 | 9.34 | 4.78 | 9.80 | [31,32,33] |
| MEG | 10–65 | 247.4–287.1 | 2.42–16.38 | 32 | 3.90 | 1.93 | 5.49 | [34,35,36] |
| DEG | 6.6–50 | 265–283.2 | 2.35–14.50 | 34 | 5.16 | 2.91 | 4.31 | [35,37,38] |
| TEG | 10–50 | 266.3–293.0 | 3.17–39.87 | 32 | 4.16 | 1.96 | 5.62 | [35,39] |
Disclaimer/Publisher’s Note: The statements, opinions and data contained in all publications are solely those of the individual author(s) and contributor(s) and not of MDPI and/or the editor(s). MDPI and/or the editor(s) disclaim responsibility for any injury to people or property resulting from any ideas, methods, instructions or products referred to in the content. |
© 2023 by the authors. Licensee MDPI, Basel, Switzerland. This article is an open access article distributed under the terms and conditions of the Creative Commons Attribution (CC BY) license (https://creativecommons.org/licenses/by/4.0/).
Share and Cite
Wang, Y.; Li, Z.; Zhi, S.; Yang, Q.; Li, C.; Jia, W. A Predictive Model for Hydrate Formation Conditions in Alcohol-Containing Systems Based on the Cubic-Plus-Association State Equation. Energies 2023, 16, 7728. https://doi.org/10.3390/en16237728
Wang Y, Li Z, Zhi S, Yang Q, Li C, Jia W. A Predictive Model for Hydrate Formation Conditions in Alcohol-Containing Systems Based on the Cubic-Plus-Association State Equation. Energies. 2023; 16(23):7728. https://doi.org/10.3390/en16237728
Chicago/Turabian StyleWang, Yubin, Ziyuan Li, Shujie Zhi, Qi Yang, Changjun Li, and Wenlong Jia. 2023. "A Predictive Model for Hydrate Formation Conditions in Alcohol-Containing Systems Based on the Cubic-Plus-Association State Equation" Energies 16, no. 23: 7728. https://doi.org/10.3390/en16237728
APA StyleWang, Y., Li, Z., Zhi, S., Yang, Q., Li, C., & Jia, W. (2023). A Predictive Model for Hydrate Formation Conditions in Alcohol-Containing Systems Based on the Cubic-Plus-Association State Equation. Energies, 16(23), 7728. https://doi.org/10.3390/en16237728