1. Introduction
Nuclear power plants typically necessitate significant cooling water to regulate the temperature of essential nuclear equipment. The Essential Service Water Pump (SEC pump) is a critical component responsible for providing cooling water. SEC pumps mainly function to draw cooling water from the source, such as rivers, oceans, or cooling towers, into the inner workings of the nuclear island and transfer it to the ultimate heat sink. Ultimate heat sinks are heat exchangers that transfer heat generated by nuclear reactors and other equipment to cooling water, ensuring proper operation and safety. The operational reliability of these sinks is crucial to the safety of the entire circulating water system and nuclear island, making it essential to diagnose and address any faults.
Vibration signal analysis is a prevalent diagnostic approach for centrifugal pumps within the realm of rotary machinery [
1]. It is important to distinguish between traditional statistical methods and machine learning (ML) algorithms. It is essential to be mindful of these differences when choosing the most effective diagnostic method. Traditional statistical methods, such as frequency domain analysis and time-frequency statistics analysis [
2]. Statistical methods, including frequency domain analysis and time-frequency statistics analysis, are employed to describe the amplitude distribution of vibration signals. In contrast, deep learning techniques, often exemplified by convolutional neural networks, have gained substantial attention in the domain of fault diagnosis in rotary machinery [
3]. The key distinction lies in the fact that while statistical methods aim to identify patterns within the data, ML algorithms, such as convolutional neural networks, autonomously learn feature representations from the raw data to identify fault conditions in centrifugal pumps by analyzing vibration signals [
4]. Whereas traditional machine learning methods emphasize the statistical attributes of signals, deep learning techniques autonomously acquire feature representations using neural network models.
Since the vibration signal in the SEC pump is a non-stationary vibration signal, the dynamic characteristics of the subject cannot be well captured by traditional time or frequency-domain methods. Many scholars have proposed numerous research methods, such as using empirical mode decomposition (EMD) or continuous wavelet transform (CWT) to capture the local frequency domain characteristics of the signal. The support vector machine (SVM) is a machine learning method first proposed by Vapnik and developed based on statistical learning theory. SVM is primarily utilized in tackling issues like classification, regression, and anomaly detection. What sets SVM apart from deep learning technology is its unique quality of not necessitating massive training datasets yet delivering robust generalization capacity with restricted data. This feature makes SVM very suitable for the engineering field, especially when equipment failure data sets are limited. Su, Z.Q. et al. [
5] aimed at multi-fault diagnosis of rotating machinery based on the classification models of orthogonal supervised linear local tangent space alignment (OSLLTSA) and least squares support vector machine (LS-SVM), extracted the features of bearing vibration signals using empirical mode decomposition (EMD), and used OSLLTSA to reduce dimensions. The overall success rate of the algorithm is high. In terms of fault diagnosis of centrifugal pumps, SVM is better used under small sample conditions [
6]. Altobi et al. [
7] used neural networks and support vector machines with different training methods to classify the fault situation of centrifugal pumps and extracted features using continuous wavelet transform (CWT). The results indicate that under certain conditions, neural networks exhibit better performance, while support vector machines perform better under other conditions. Gao Y.J. [
8] utilized wavelet packet decomposition and wavelet coefficient residual analysis methods for diagnosing hydraulic pumps. They analyzed short sequences of pump discharge pressure signals to determine whether the pump was in normal working condition. Kumar et al. [
9] proposed the use of a genetic algorithm (GA) combined with a support vector machine (SVM) to identify centrifugal pump faults in response to their operation and potential faults. The new model reduced training time and improved efficiency, achieving an overall recognition effect of 96.7%. In their study of the impact of different wavelet clusters on overall diagnostic accuracy, M.V. et al. [
10] optimized the optimal wavelet cluster to improve diagnostic accuracy. Zhang J.W. et al. [
11] employed adaptive WPT–SVM with discrete and continuous PSO algorithms to develop a parameter-free model for quantitative NIR spectral data analysis, demonstrating enhanced robustness and reliability. In the field of fault diagnosis for horizontal centrifugal pumps, J.S.R. et al. [
12] employed motor current and pump vibration signals for monitoring. They utilized wavelet packet transform (WPT) for signal preprocessing and applied a multiclass support vector machine algorithm (MSVM) for fault classification.
While extensive research conducted by both domestic and international scholars has addressed common pump operation faults such as blade damage, ring wear [
13], misalignment [
14], etc. These studies have primarily focused on distinguishing between two states: a normal state (a non-fault condition) and the presence of a single fault. However, research differentiating between multiple fault conditions has been relatively limited. Most previous studies have focused on horizontal centrifugal pumps, whereas SEC pumps exhibit a distinct vertical structure and feature a separate motor bracket and pump bracket in their overall design, resulting in unique vibration characteristics. As a result, specific efforts are required to collect fault data and develop diagnostic algorithms that are specifically tailored to SEC pumps.
In this study, our main goal is to replicate the operational conditions of SEC pumps in actual operating conditions and develop a model of their possible malfunctions. We present a fault diagnosis strategy for SEC pumps that takes advantage of the wavelet packet transform and support vector machine (WPT–SVM). This approach trains the SVM model by gathering vibration acceleration signals from the pump body in multiple directions, extracting principal component coefficients, reconstructing a new signal using the wavelet packet transform, and finally calculating frequency domain characteristics to create an optimal classification model. Noteworthy outcomes from our research exhibit a substantial surge in fault diagnosis accuracy, along with a noteworthy improvement in the model’s generalization capacity.
2. Basic Theory of Diagnosis
2.1. Continuous Wavelet Decomposition (CWD)
Continuous wavelet decomposition is a valuable tool for signal processing and data analysis. It decomposes signals into wavelet components of various frequencies and scales, which allows for a sub-division of local signal features while maintaining important time and frequency information [
15]. Compared with traditional time-domain and frequency-domain features, wavelet decomposition is more sensitive to non-stationary signals and focuses more on local time-frequency features of the signal. The features extracted from wavelet clusters are composed of two dimensions (scale and translation), different from the feature values obtained by the Fourier transform. Hence, their restrictions are comparatively lesser.
For a given signal
and the mother wavelet function
, continuous wavelet transform performs continuous wavelet transform on the signal
at different scales
a and translation parameters
b, resulting in a set of wavelet coefficients
containing the features of the signal
:
The wavelet transform method is employed to process non-stationary signals. It involves decomposing the low-frequency component of the signal to determine the wavelet threshold, which is subsequently utilized for the reconstruction and denoising of the original non-stationary signal. In the commonly used process of wavelet threshold denoising, it is imperative to thoroughly contemplate which wavelet basis, threshold value, and threshold function are chosen.
2.2. Wavelet Packet Transform (WPT)
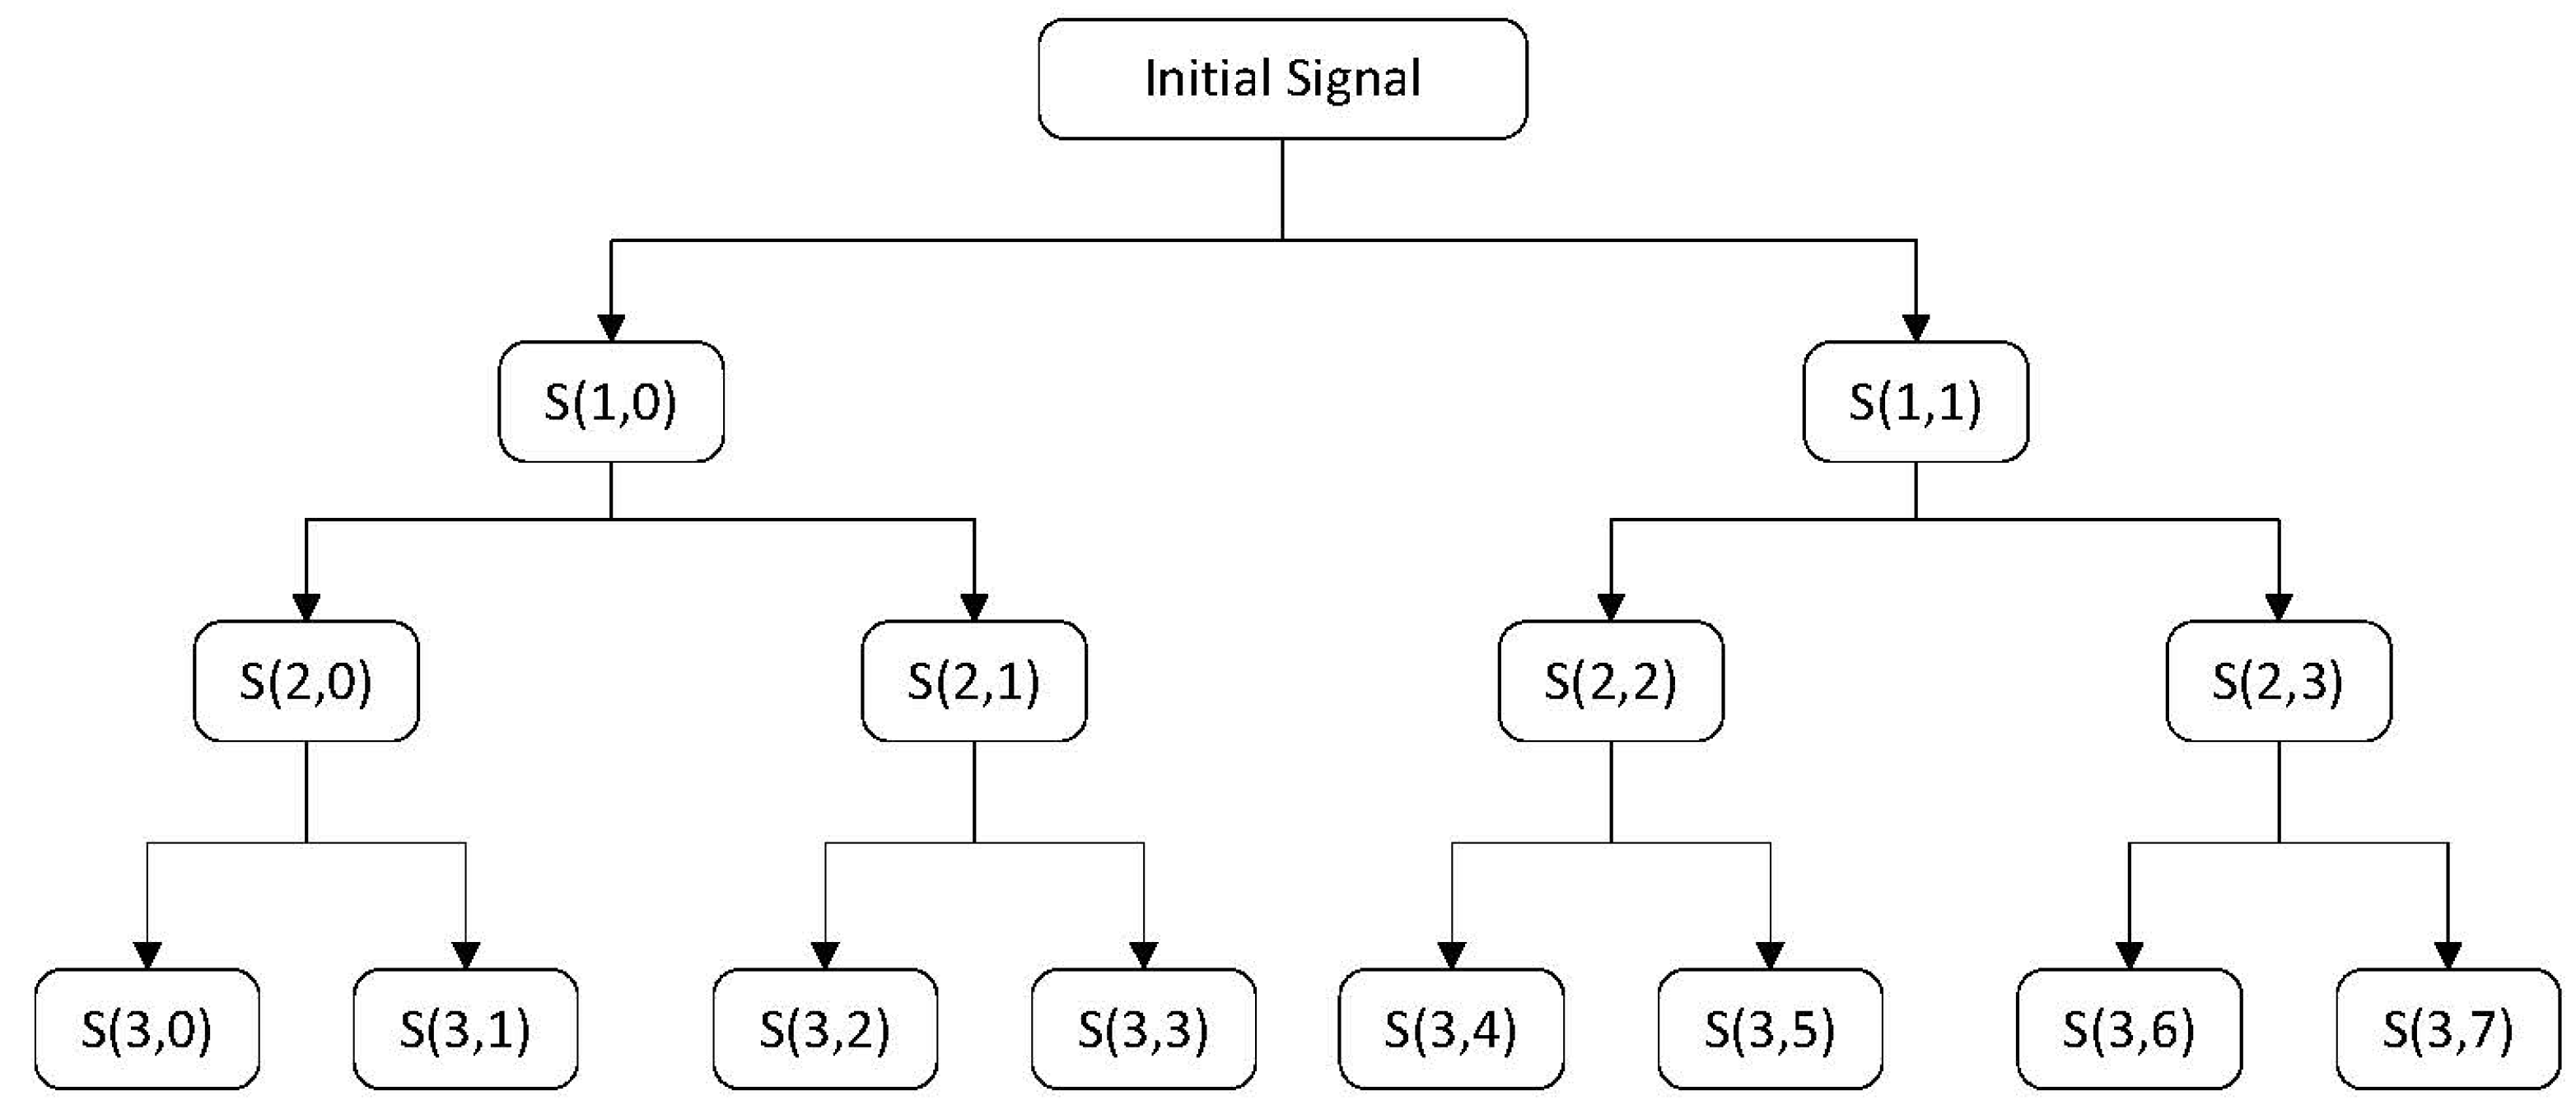
As an optimized processing method of the wavelet transform, wavelet packet decomposition dissects non-stationary signals more precisely, dividing the entire time-frequency surface into smaller segments and analyzing the high-frequency part of the signal at a larger scale resolution, thus improving the overall time-frequency resolution.
The schematic diagram for three-layer wavelet packet decomposition is shown in
Figure 1. Not only the low-frequency part of the original signal
is decomposed, but the high-frequency part is analyzed without redundancy or omission, thereby improving the overall time-frequency resolution. Thus, the original signal is decomposed into
sub-bands after
N the layer wavelet packet transform [
16], with each sub-band corresponding to its specific frequency domain signal. Therefore, the original signal
can be described as:
where
is the wavelet packet coefficient corresponding to node
i on the N-th layer wavelet packet decomposition tree, and the wavelet packet coefficient of each layer is expressed as:
where
represents the wavelet packet coefficient on the corresponding node of the corresponding wavelet packet decomposition tree, and it is reconstructed by the wavelet packet function
;
is a wavelet packet function with scale index
N, position index
k, and frequency index
i.
2.3. Support Vector Machine (SVM)
The support vector machine (SVM) is a machine learning algorithm commonly utilized for the classification and regression analysis of multiple states. Due to its efficient handling of high-dimensional data and robust classification capabilities, particularly in scenarios involving limited sample data, SVM is extensively applied in the classification of various fault states in rotary machinery.
The fundamental concept behind SVM involves the identification of a hyperplane within the feature space to effectively separate different types of state data [
17]. The objective is to maximize the margin between this hyperplane and the data points, thereby achieving robust classification.
Support vector machines (SVMs) excel at efficiently handling high-dimensional data while showcasing robust generalization abilities that effectively counteract the risk of overfitting. The versatility of their performance under different circumstances is additionally emphasized by their capacity to utilize multiple kernel functions, thus enabling them to expertly tackle non-linear issues.
In its initial application, the SVM classification algorithm was primarily designed for binary classification tasks. However, as requirements evolved, a need arose for constructing multi-classifiers. The fundamental concept behind this is to create multi-classifiers by combining multiple binary classifiers. Typically, the process can be categorized into two strategies: ‘one-to-one’ and ‘one-vs-all’. In this context, the ‘one-to-one’ strategy is introduced, where the goal is to classify data into K different categories:
- (1)
Train K(K−1)/2 dichotomous SVM models
For K different categories, labeled from 1 to K, for each pair of category data subsets, a binary SVM model is trained and sequentially minimized. By introducing a loss function, a hyperplane is found that separates the data and maximizes the interval between categories, and the norm of the hyperplane normal vector is minimized as the optimal hyperplane selection criterion, which is . Secondly, constraint conditions are introduced to ensure that data points can be correctly classified, and the principal hyperplane is applied to each data point , where is the data point, is the corresponding label. The corresponding constraint condition indicates that the corresponding data points are correctly classified, and the corresponding plane weights are saved for each subset of datasets and bias ;
- (2)
Predict the score
For the overall data point
to be classified, calculate the model classification score
:
For each category
, the total score for that category is calculated separately as the total score
for the data point
:
Finally, the maximum score is selected as the classification result.
3. Research Method
This study describes a machine learning-based approach to classifying centrifugal SEC pump states, specifically the model training method based on WPT–SVM, and compares it to the method of fault classification using wavelet packet transform with an artificial neural network [
18] (WPT–ANN). The main objective is to enhance the accuracy of diagnosing and distinguishing the normal state and six kinds of faults, namely misalignment, blade damage, ring wear, base instability, shaft bending, and mass eccentricity. The study is divided into four main stages: signal acquisition, signal denoising, feature extraction, model training, and diagnosis. During the feature extraction phase for the SEC pump, we utilized the wavelet packet transform (WPT) to break down and extract signals that have undergone denoising. This procedure results in six sub-wavelet components, where their energy proportions are the determining factors, and then a new signal is reconstructed using those six components. Subsequently, we computed twelve frequency features of the reconstructed signal, including the mean frequency and frequency kurtosis et al. These features form the feature matrix for SVM or ANN. SVM with an RBF kernel was used for the training and validation processes. For comparison, we utilize a three-layer artificial neural network (ANN) comprising input, hidden, and output layers. The input layer receives feature vectors while the hidden layer learns an abstract representation of these features, and finally, the output layer makes diagnostic decisions. To minimize the error function, we trained the ANN network with the backpropagation algorithm. Please refer to
Figure 2 for a detailed representation of the diagnostic workflow. To effectively diagnose faults in a vertical SEC pump, the initial step involves capturing the pump’s operational data under various conditions and establishing a comprehensive sample dataset. This dataset is then divided into training and testing sets for a multi-classification fault detection model. The subsequent stages include signal processing and diagnostic procedures, as outlined below:
Collect the dual-channel vibration signal data from the SEC pump. By arranging vibration acceleration sensors near the bearing body, the original vibration signals are collected. Seven different operating conditions (including normal state, blade breakage, seal ring clearance, bench instability, shaft bending, misalignment, and mass eccentricity) are set, and it is necessary to ensure consistent sampling rates and time intervals between collected signals to maintain sample consistency. The collected dataset is effectively split by random division into training and testing sets placed in an 80:20 proportion;
CWT noise reduction is used because the acquired signal may contain noise from sensors, the environment, and water flow within the pump circuit. These noises typically exhibit periodicity, frequency diversity, and non-Gaussian properties. The wavelet threshold denoising method is employed by transforming the original signal into the wavelet domain, decomposing it into wavelet coefficients of varying scales and frequencies, and then reconstructing the wavelet coefficients to the time domain post-threshold processing. This leads to the acquisition of the signal composition data set after noise reduction;
For each sample in the previously processed dataset, feature extraction is carried out, the signal sample undergoes decomposition through four layers of wavelet packets, and energy values for each wavelet packet coefficient in the fourth layer are computed. Wavelet coefficients from six levels, specifically C1, C2, C8, C10, C11, and C15, are extracted, and the signal derived from these coefficients is reconstructed. The signal that has been reconstructed undergoes feature extraction in the frequency domain, where eigenvalues are calculated for parameters such as the frequency domain mean, frequency domain kurtosis, and others. These calculations produce a twelve-dimensional feature matrix, which is then normalized to construct the dataset’s feature matrix;
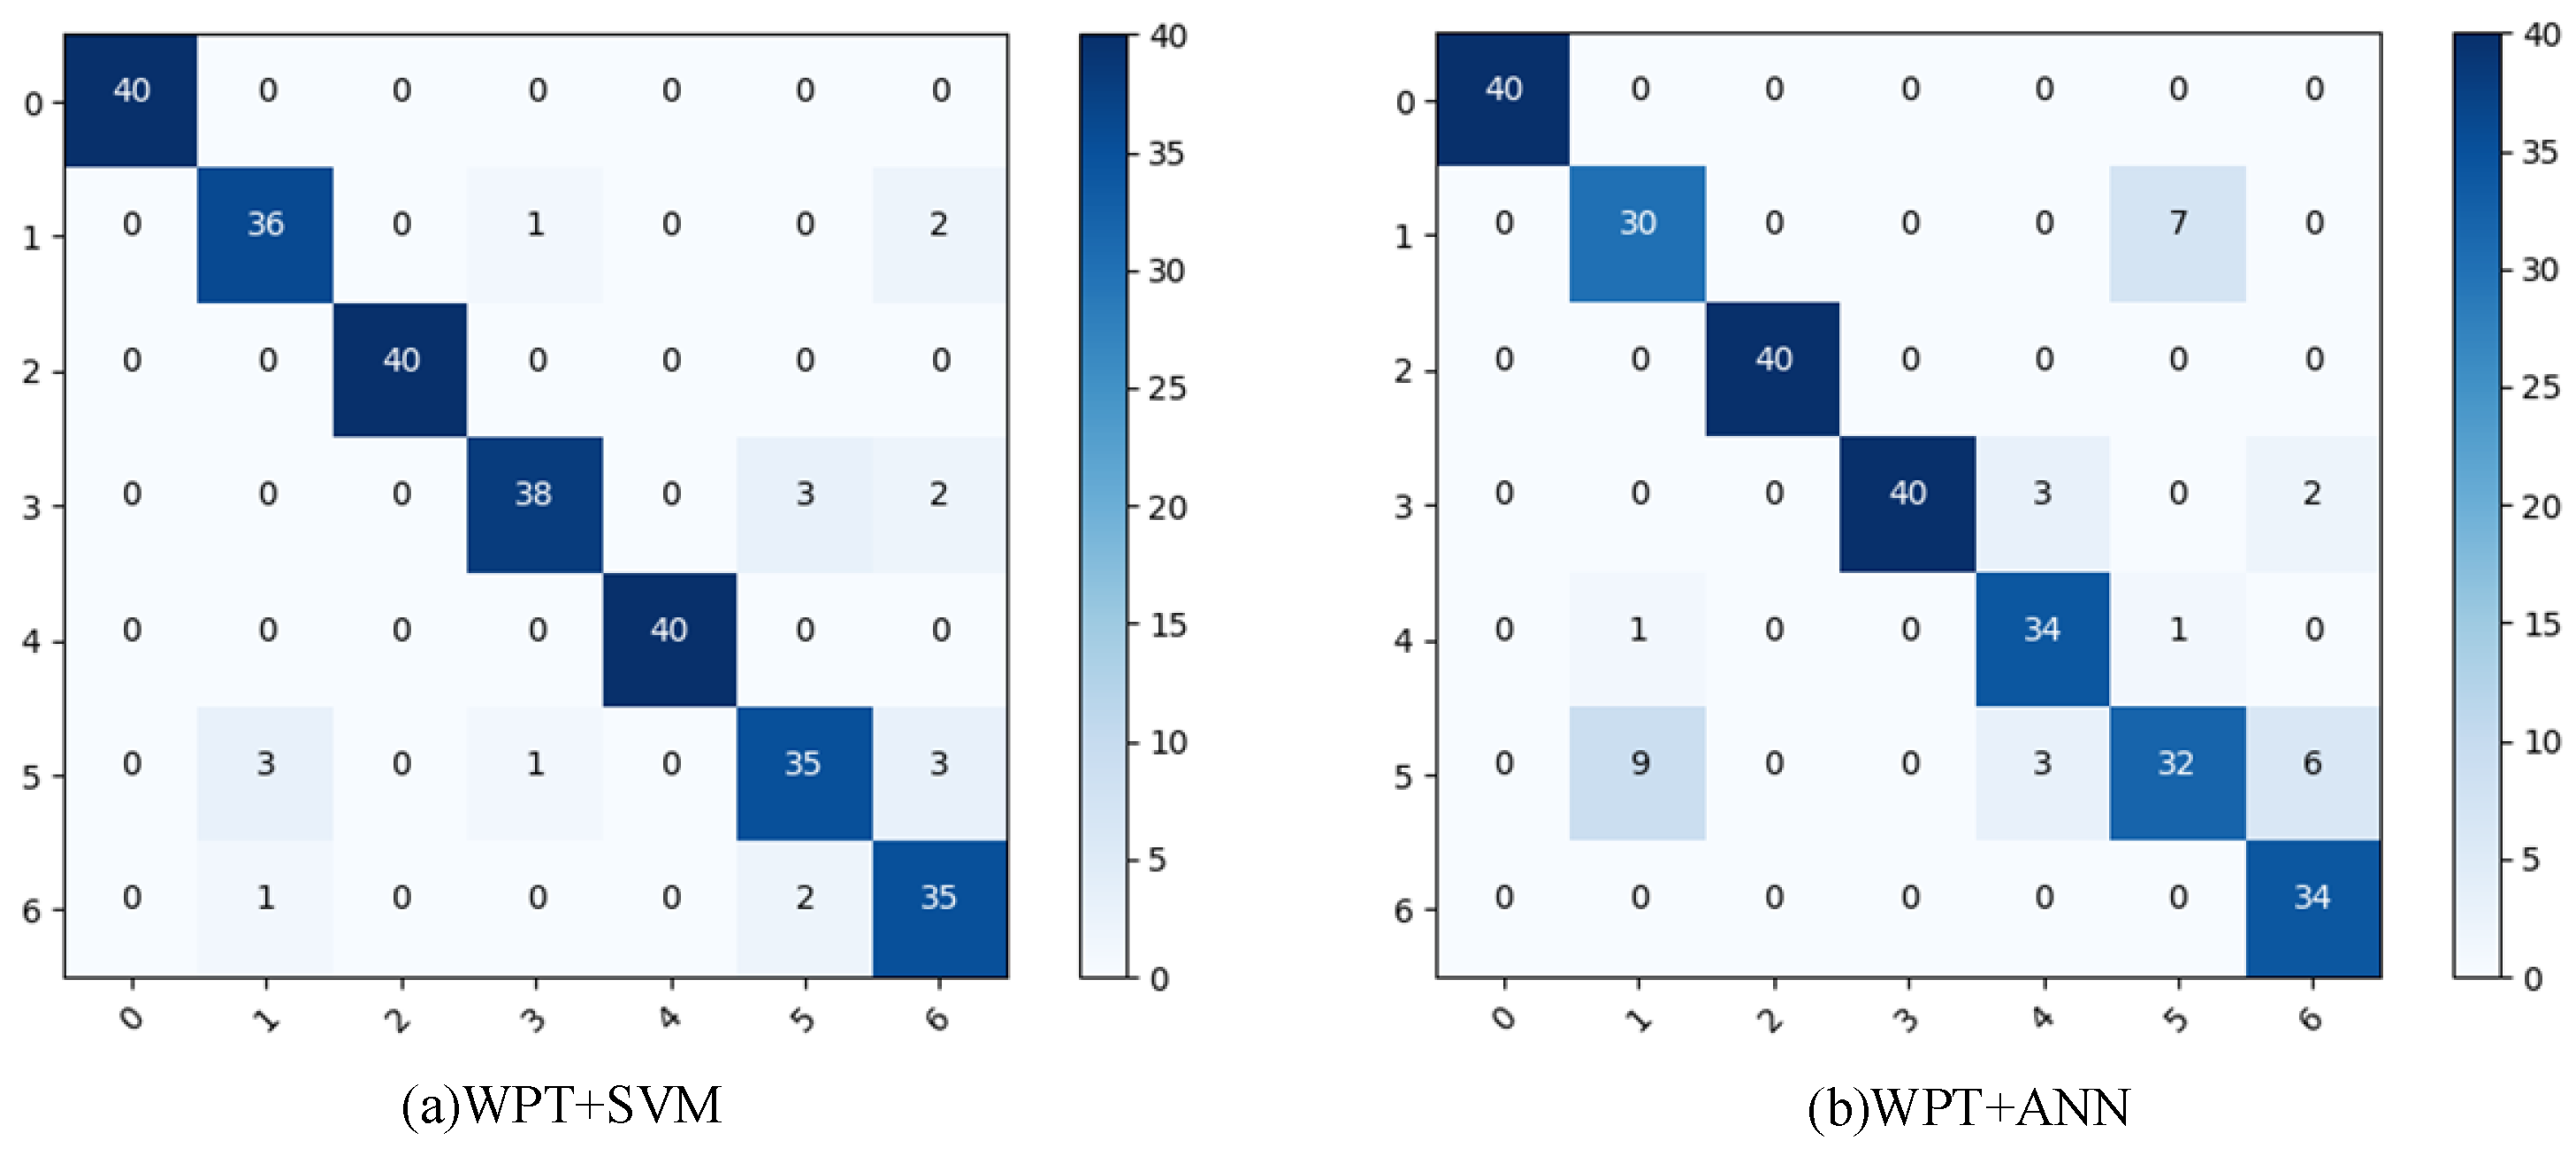
Using the training set, a multiclass support vector machine (SVM) model is developed for precise fault diagnosis in SEC pumps under various operating conditions. Our objective is to thoroughly validate the model’s accuracy and reliability to ensure its effectiveness in real-world applications involving complex engineering systems. To assess the model’s robustness and efficiency, a ten-fold cross-validation method is employed to obtain accurate information for the model. Additionally, the confusion matrix is used as an assessment tool to illustrate the model’s classification results. This matrix allows us to understand the precise distribution of accurate, false positive, true negative, and false negative examples in each category, facilitating a comprehensive analysis of the model’s efficacy.
4. Experimental Bench Construction
In the research method, this paper accurately identifies a total of six faults and one normal situation on the same set of experimental benches. The fault content includes misalignment, blade damage, ring wear, base instability, shaft bending, and mass eccentricity.
Differing from the common vertical pump structure, the motor bracket and pump body bracket of the SEC pump are not integrated. Therefore, during the construction of the experimental bench, separate designs are required for both brackets.
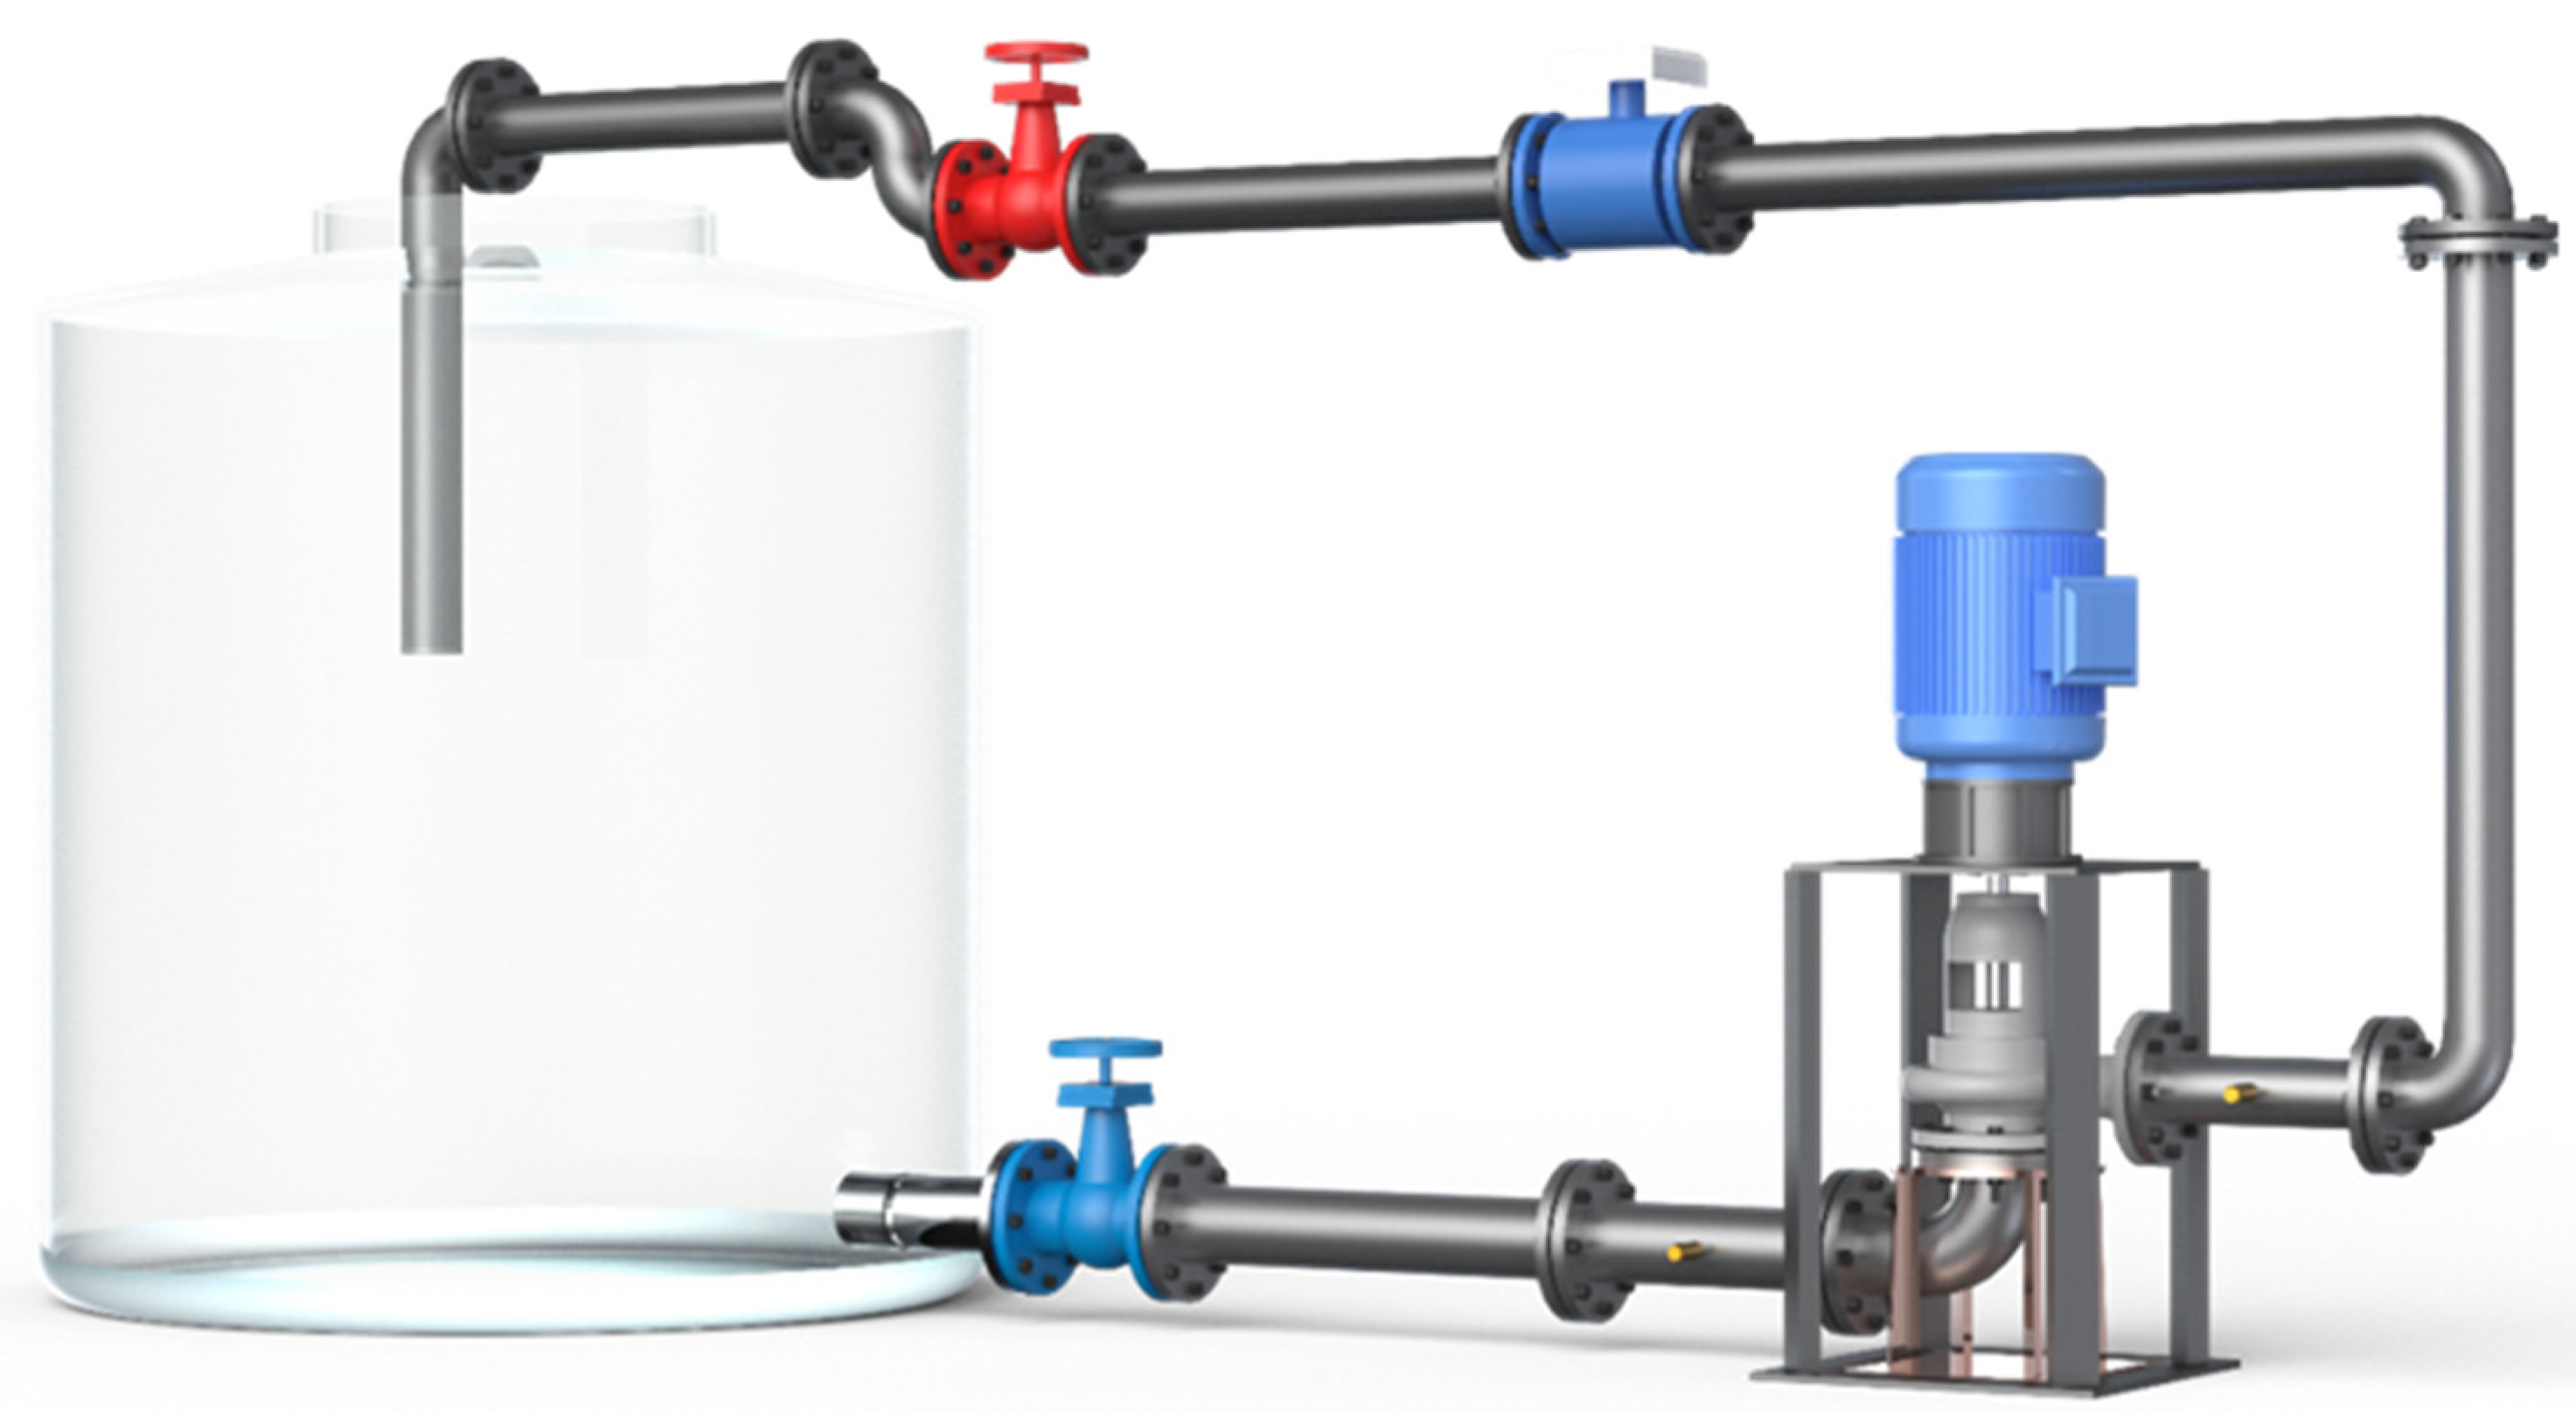
An experimental bench featuring a closed vertical pump has been constructed. The primary equipment includes an electromagnetic flow meter, a three-phase asynchronous motor, a vertical centrifugal pump, a high-frequency pressure pulsation sensor, a high-frequency vibration sensor, and other necessary instruments. To achieve different flow points, the outlet valve is adjusted to control the overall flow rate during the experiment. The overall experimental setup diagram is shown in
Figure 3.
The system consists of four primary components: the pump body and piping, the electrical cabinet and motor, sensors, and a data acquisition system with a supervisory computer system. One motor drives the pump system, which is a three-phase asynchronous motor rated at 380 V, 2 poles, and 15 kW.
To comprehensively collect pump vibration signals, piezoelectric vibration acceleration sensors are strategically placed at multiple locations on the pump and bearing housing, with specific parameters outlined in
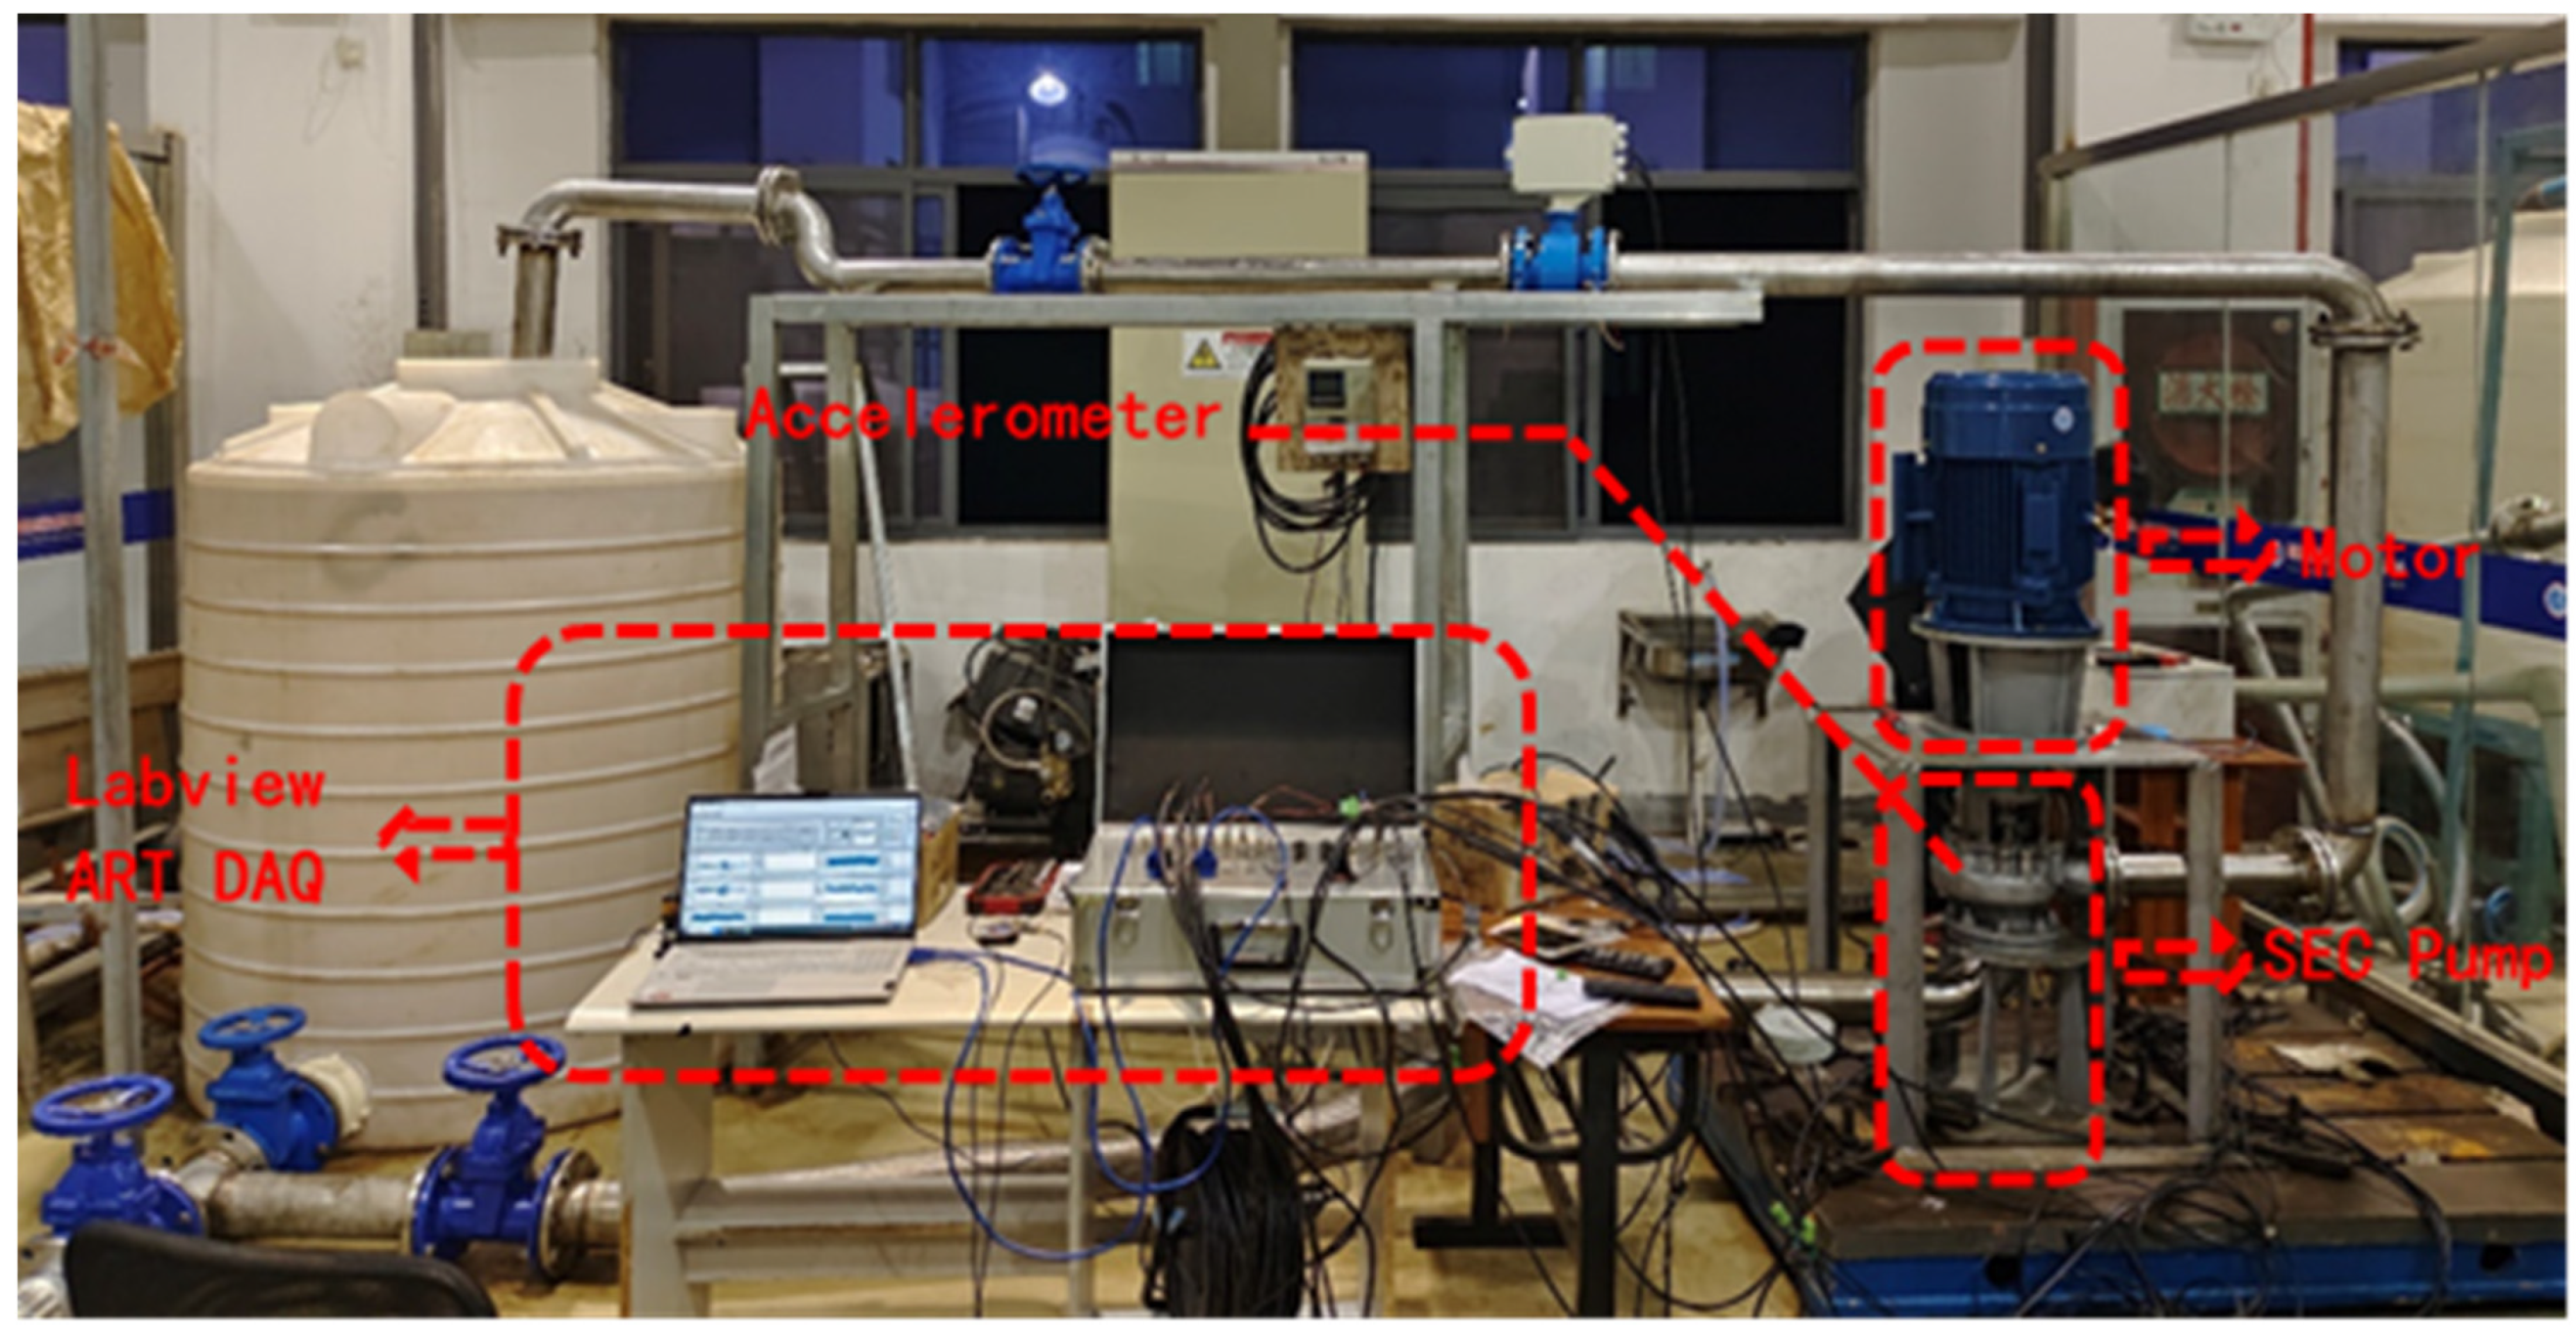
Table 1. Signal data is collected using an ART data acquisition card (USB8814) and gathered through a supervisory computer system built with LabVIEW. The construction of the actual experimental bench and data collection are illustrated in
Figure 4.
To acquire signals from the six fault states, the shaft and impeller underwent different machining methods to operate the pump in faulty conditions:
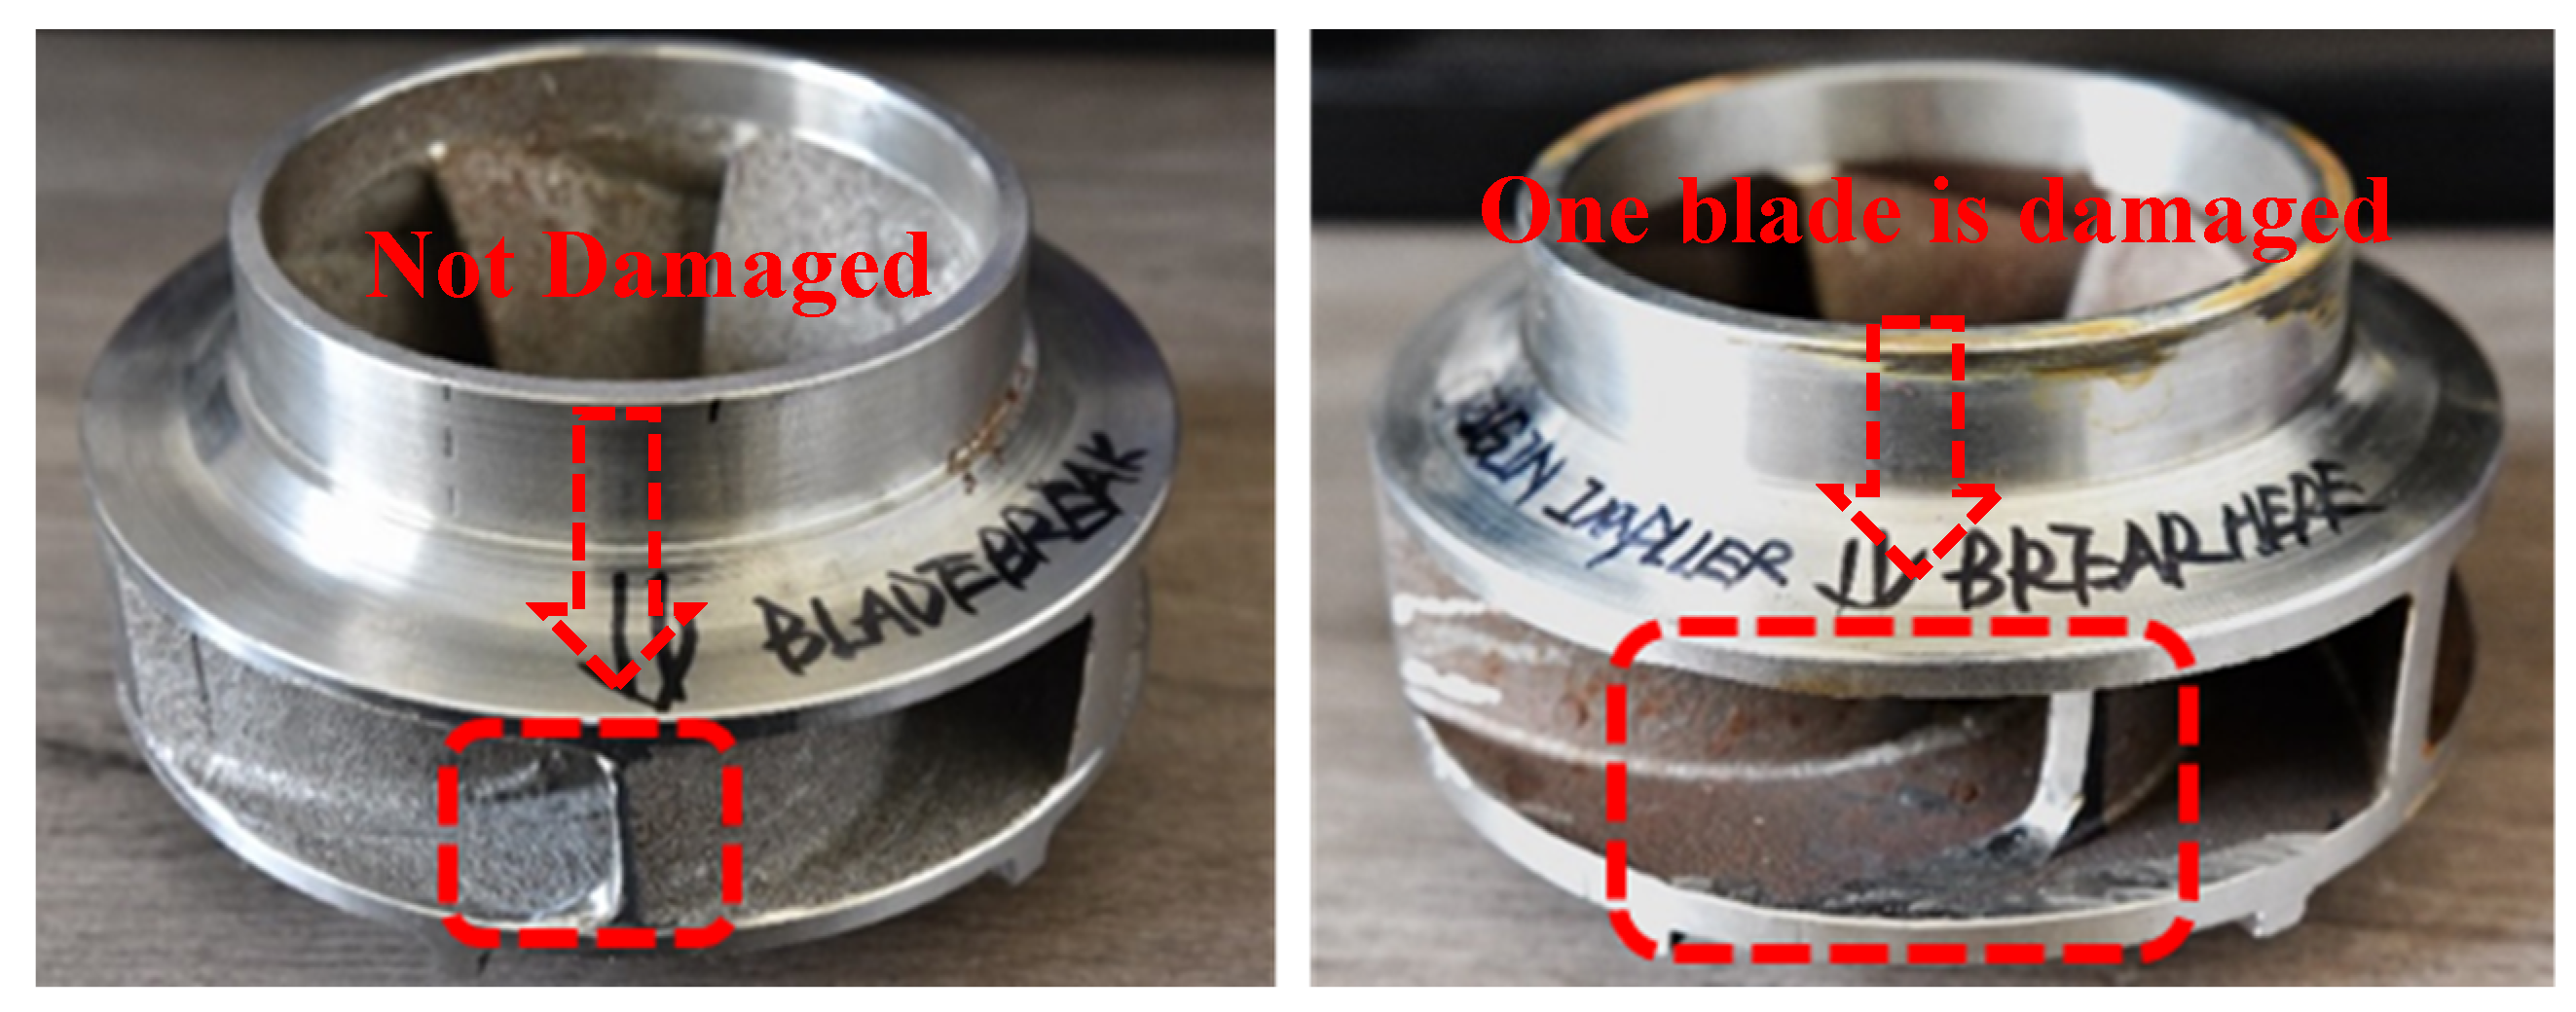
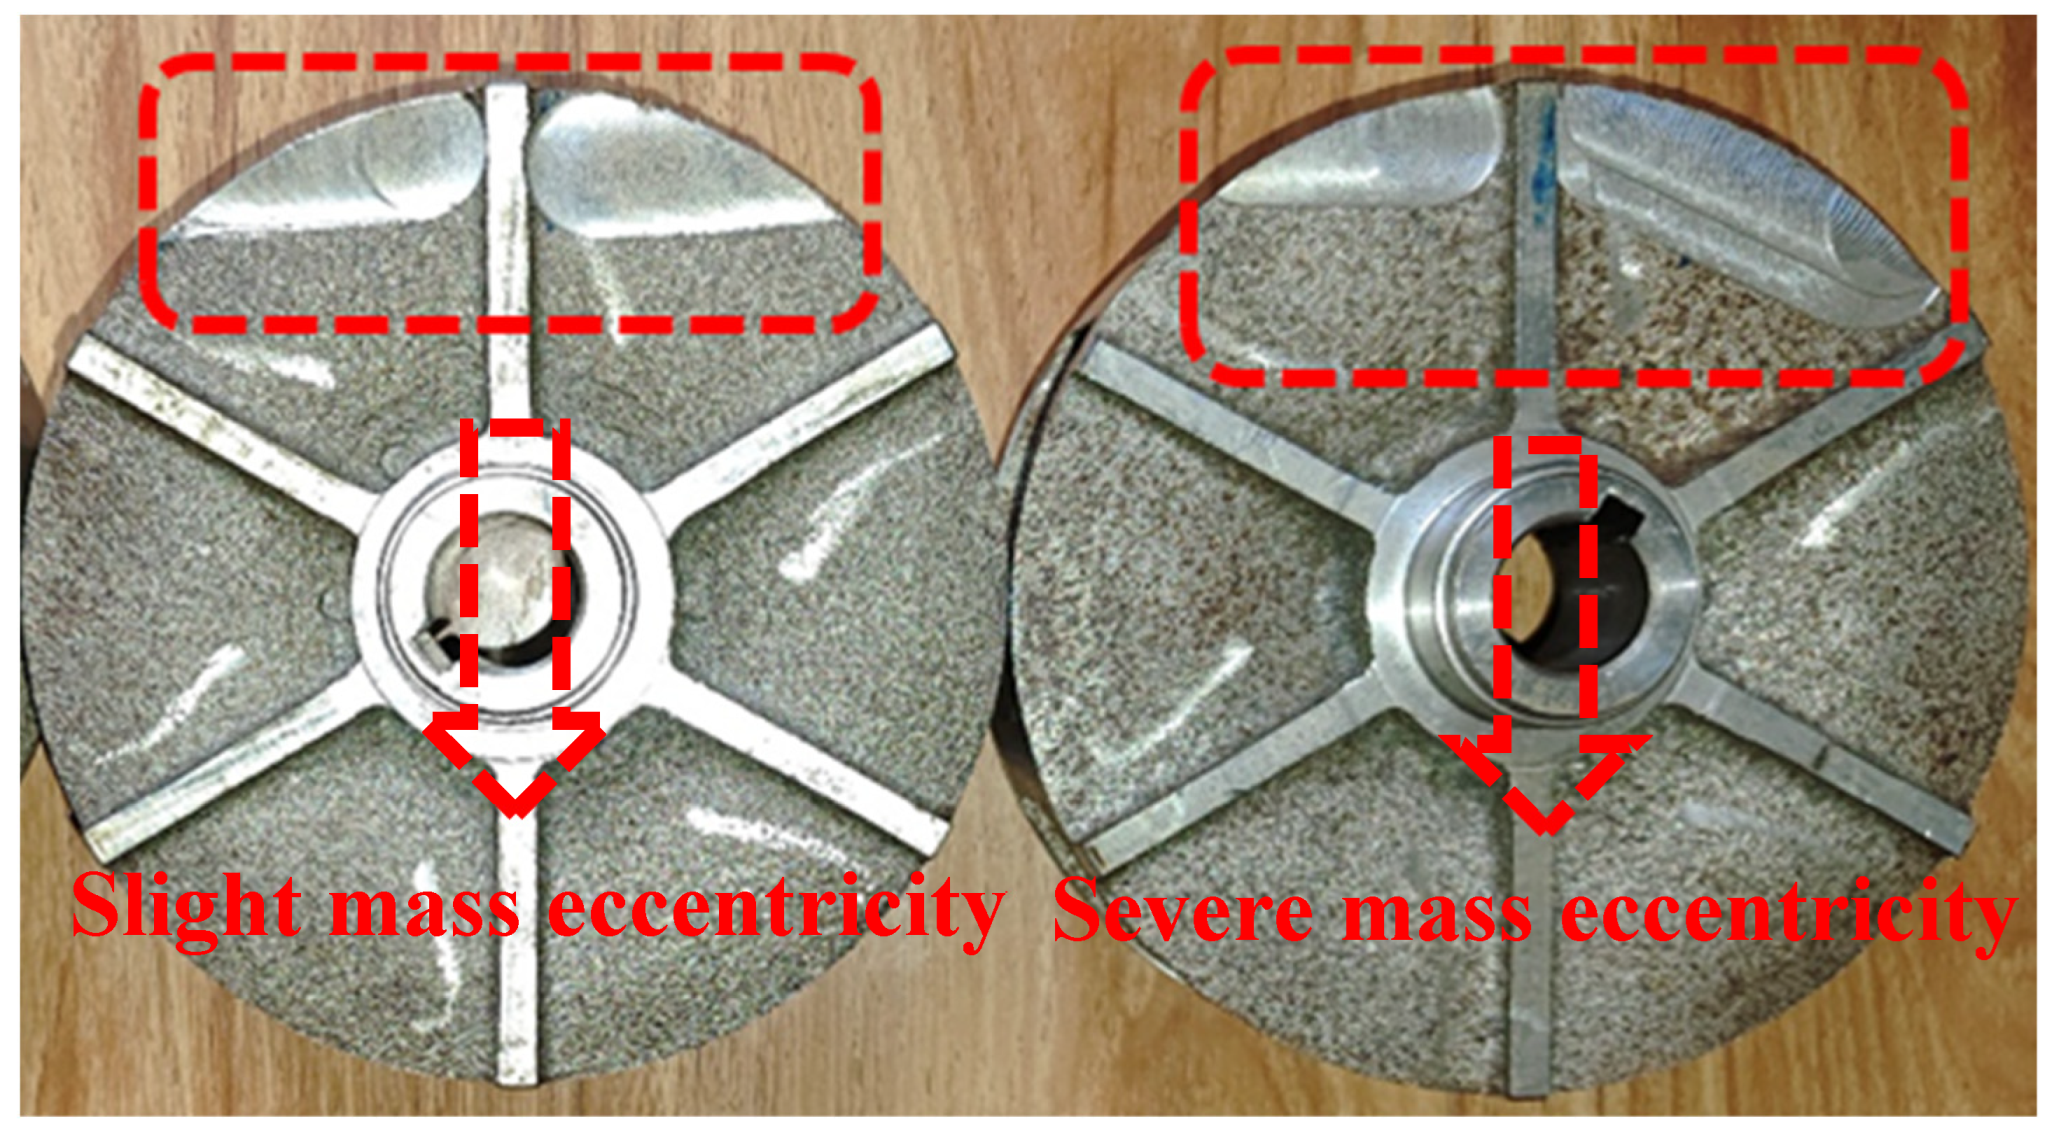
Blade breakage: By altering the degree of cuts made to the outlet side blades of the impeller, the blade’s level of damage can be determined.
Figure 5 displays a slightly damaged impeller on the left and a severely damaged one on the right;
Ring wear: To acquire the ring wear fault signal, the front ring of the impeller is machined by turning, increasing the original ring clearance from 0.5 mm to 2 mm. Ring wear leads to a significant deterioration in the performance of the SEC pump;
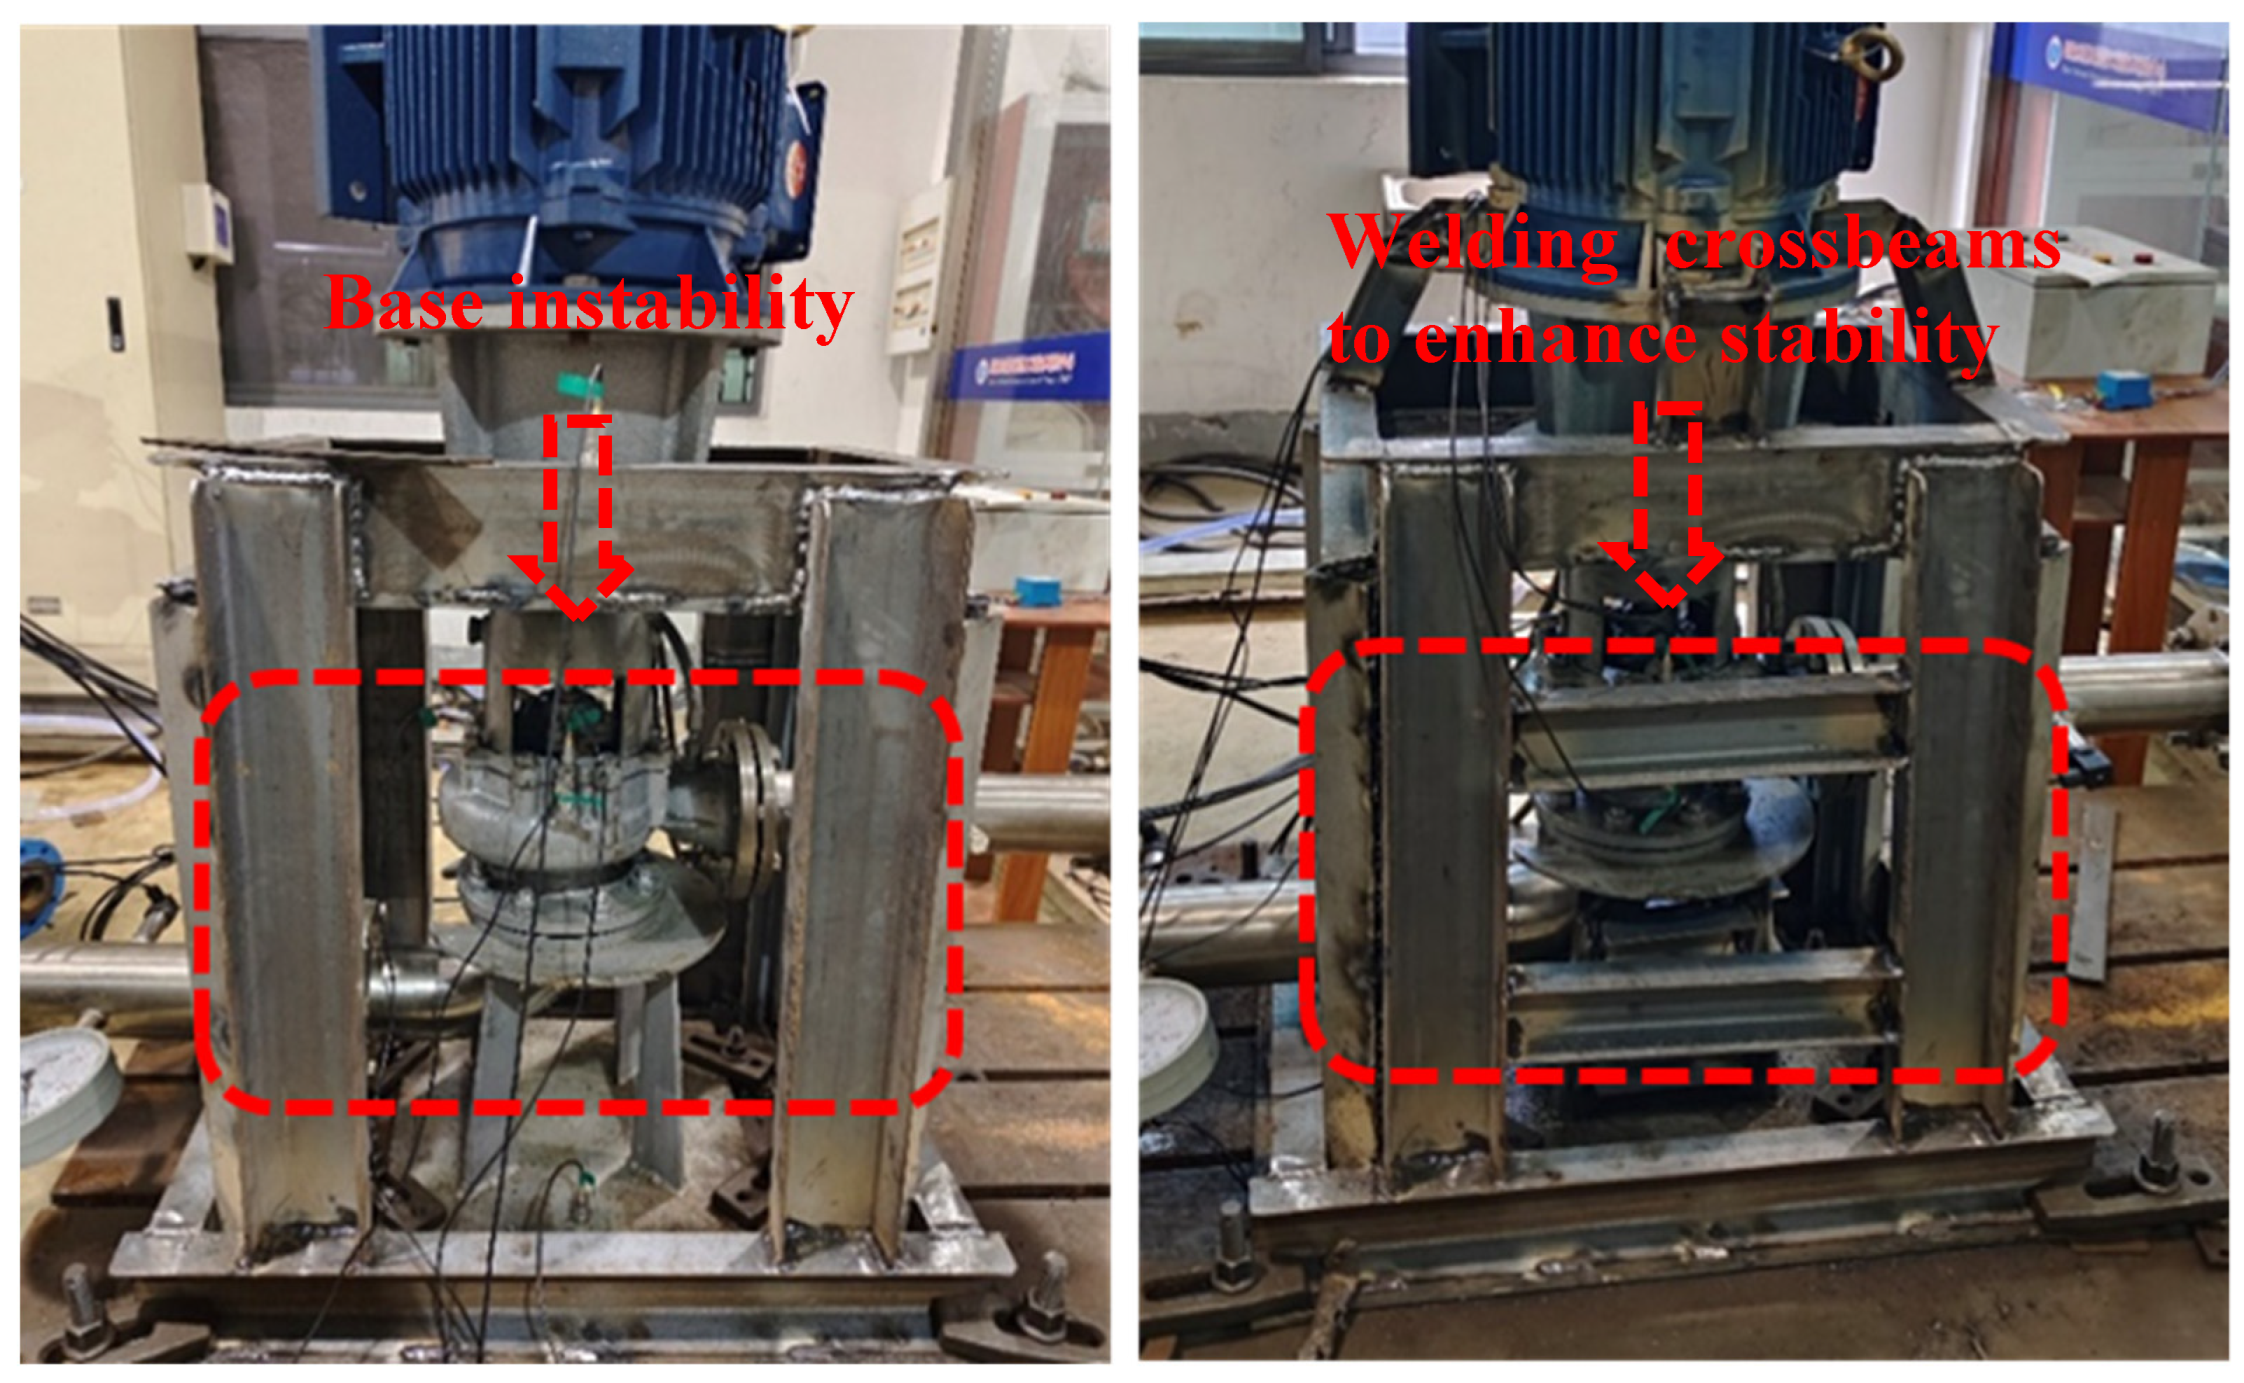
Base instability: To address the instability of the bench, structural modifications are made, as displayed in
Figure 6. On the left side, a bench with an unstable configuration is depicted, whereas the right side shows increased overall bench stability achieved by adding welded steel components, which enhance and stabilize the bench;
Shaft bending: by bending the shaft, a certain arc of bending is achieved;
Misalignment: It is possible to cause misalignment faults on the experimental bench easily. The motor bracket and pump body bracket are designed to be separated. As a result, it is only necessary to install the two brackets in a staggered manner. This installation method can result in varying degrees of misalignment faults at the motor and shaft coupling;
Mass eccentricity: by milling the back of the impeller cover to varying degrees, the mass of the impeller is unbalanced, and the amount of unbalance is measured each time on the dynamic balancer, as shown in
Figure 7.
The parameters of the piezoelectric acceleration sensor used in the experiment are shown in
Table 1. The sampling rate of the acquisition card is set to 10240 Hz, the working speed of the SEC pump is 2970 r/min, the working flow rate is 90 m
3/h, the working head is 15 m, and the number of blades is six.
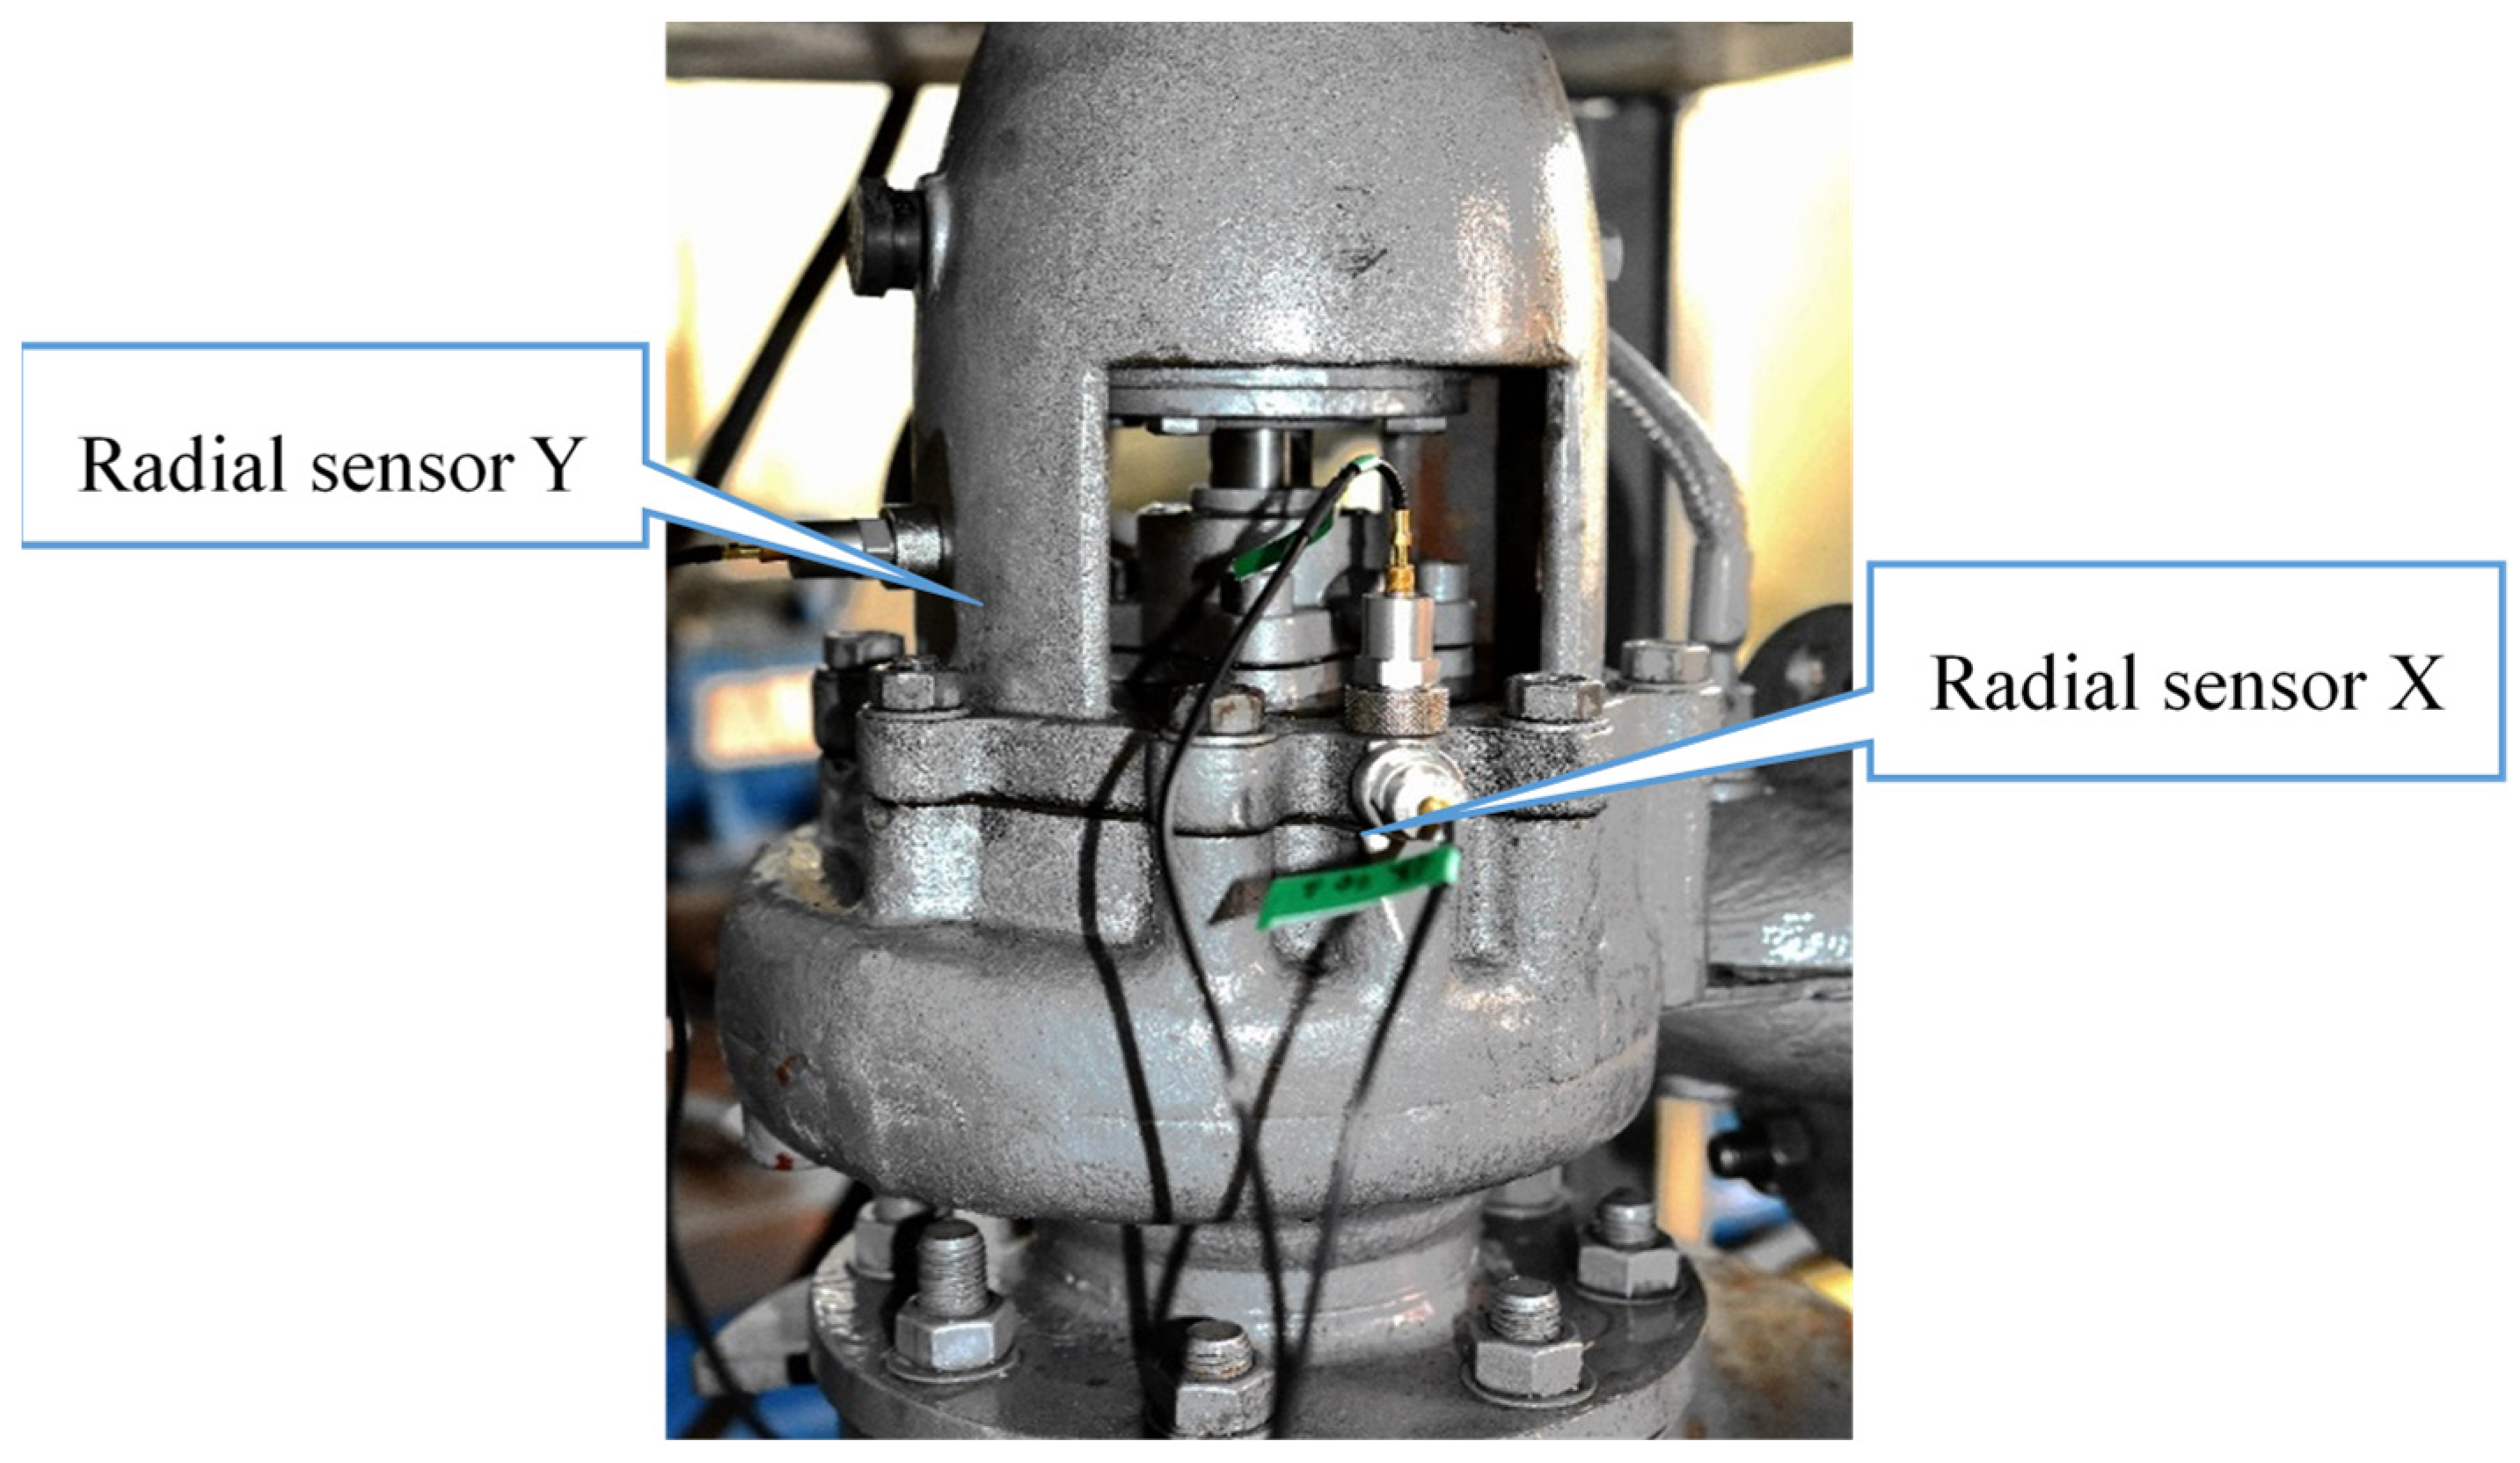
The accelerometer is installed at two measurement points: the radial and axial positions of the SEC pump bearing body. The locations of these positions are illustrated in
Figure 8. The experimental data is collected using the ART Company acquisition card USB8814. The motor is initiated during the testing cycle with the outlet valve adjusted to regulate the flow rate. The maximum flow rate achieved in the actual experiment is 1.15 times the rated flow value, and fourteen operational conditions are identified. From the maximum flow point, the valve opening is gradually decreased, and the controlled flow rate is gradually lowered to 0 m
3/h. Collect data for 10 s at each operational point with a sampling rate of 10,240 Hz for a total of 102,400 acquisition points per channel. Gather information on flow, inlet, and outlet pressure, two vibration signals, motor input current, and voltage.
5. Data Analysis and Feature Extraction
In the study’s scope, which covers seven unique states, two radial vibrations in both the X and Y directions were recorded for each state, resulting in a total of fourteen datasets. Subsequent data analysis and model validation were performed on the gathered signals. It is important to note that, in adherence to Nyquist’s theorem, the maximum effective frequency was found to be 5120 Hz, considering a sampling rate of 10,240 Hz. During a 10 s window for data acquisition, a total of 102,400 sampling points were collected and divided into 100 segments, each containing 1024 sampling points.
This precise data collection approach resulted in seven distinct states. Each state consisted of 200 samples, which were split into training and testing sets with an 80:20 ratio for effective model training and validation.
Table 2 provides precise details on this dataset partitioning.
In the extensive frequency domain, the frequency-domain characteristics associated with various fault states only occupy a specific portion of the overall frequency spectrum, with minimal discernible variation in the remaining frequency ranges. Hence, the identification of the primary feature frequency bands plays a pivotal role in effectively extracting fault-related frequency domain information. To facilitate this, the utilization of wavelet packet transform (WPT) proves invaluable, as it offers a straightforward approach to partitioning the entire frequency band range into multiple sub-bands. This method enhances our capability to isolate and analyze the specific frequency bands that are closely linked to fault conditions.
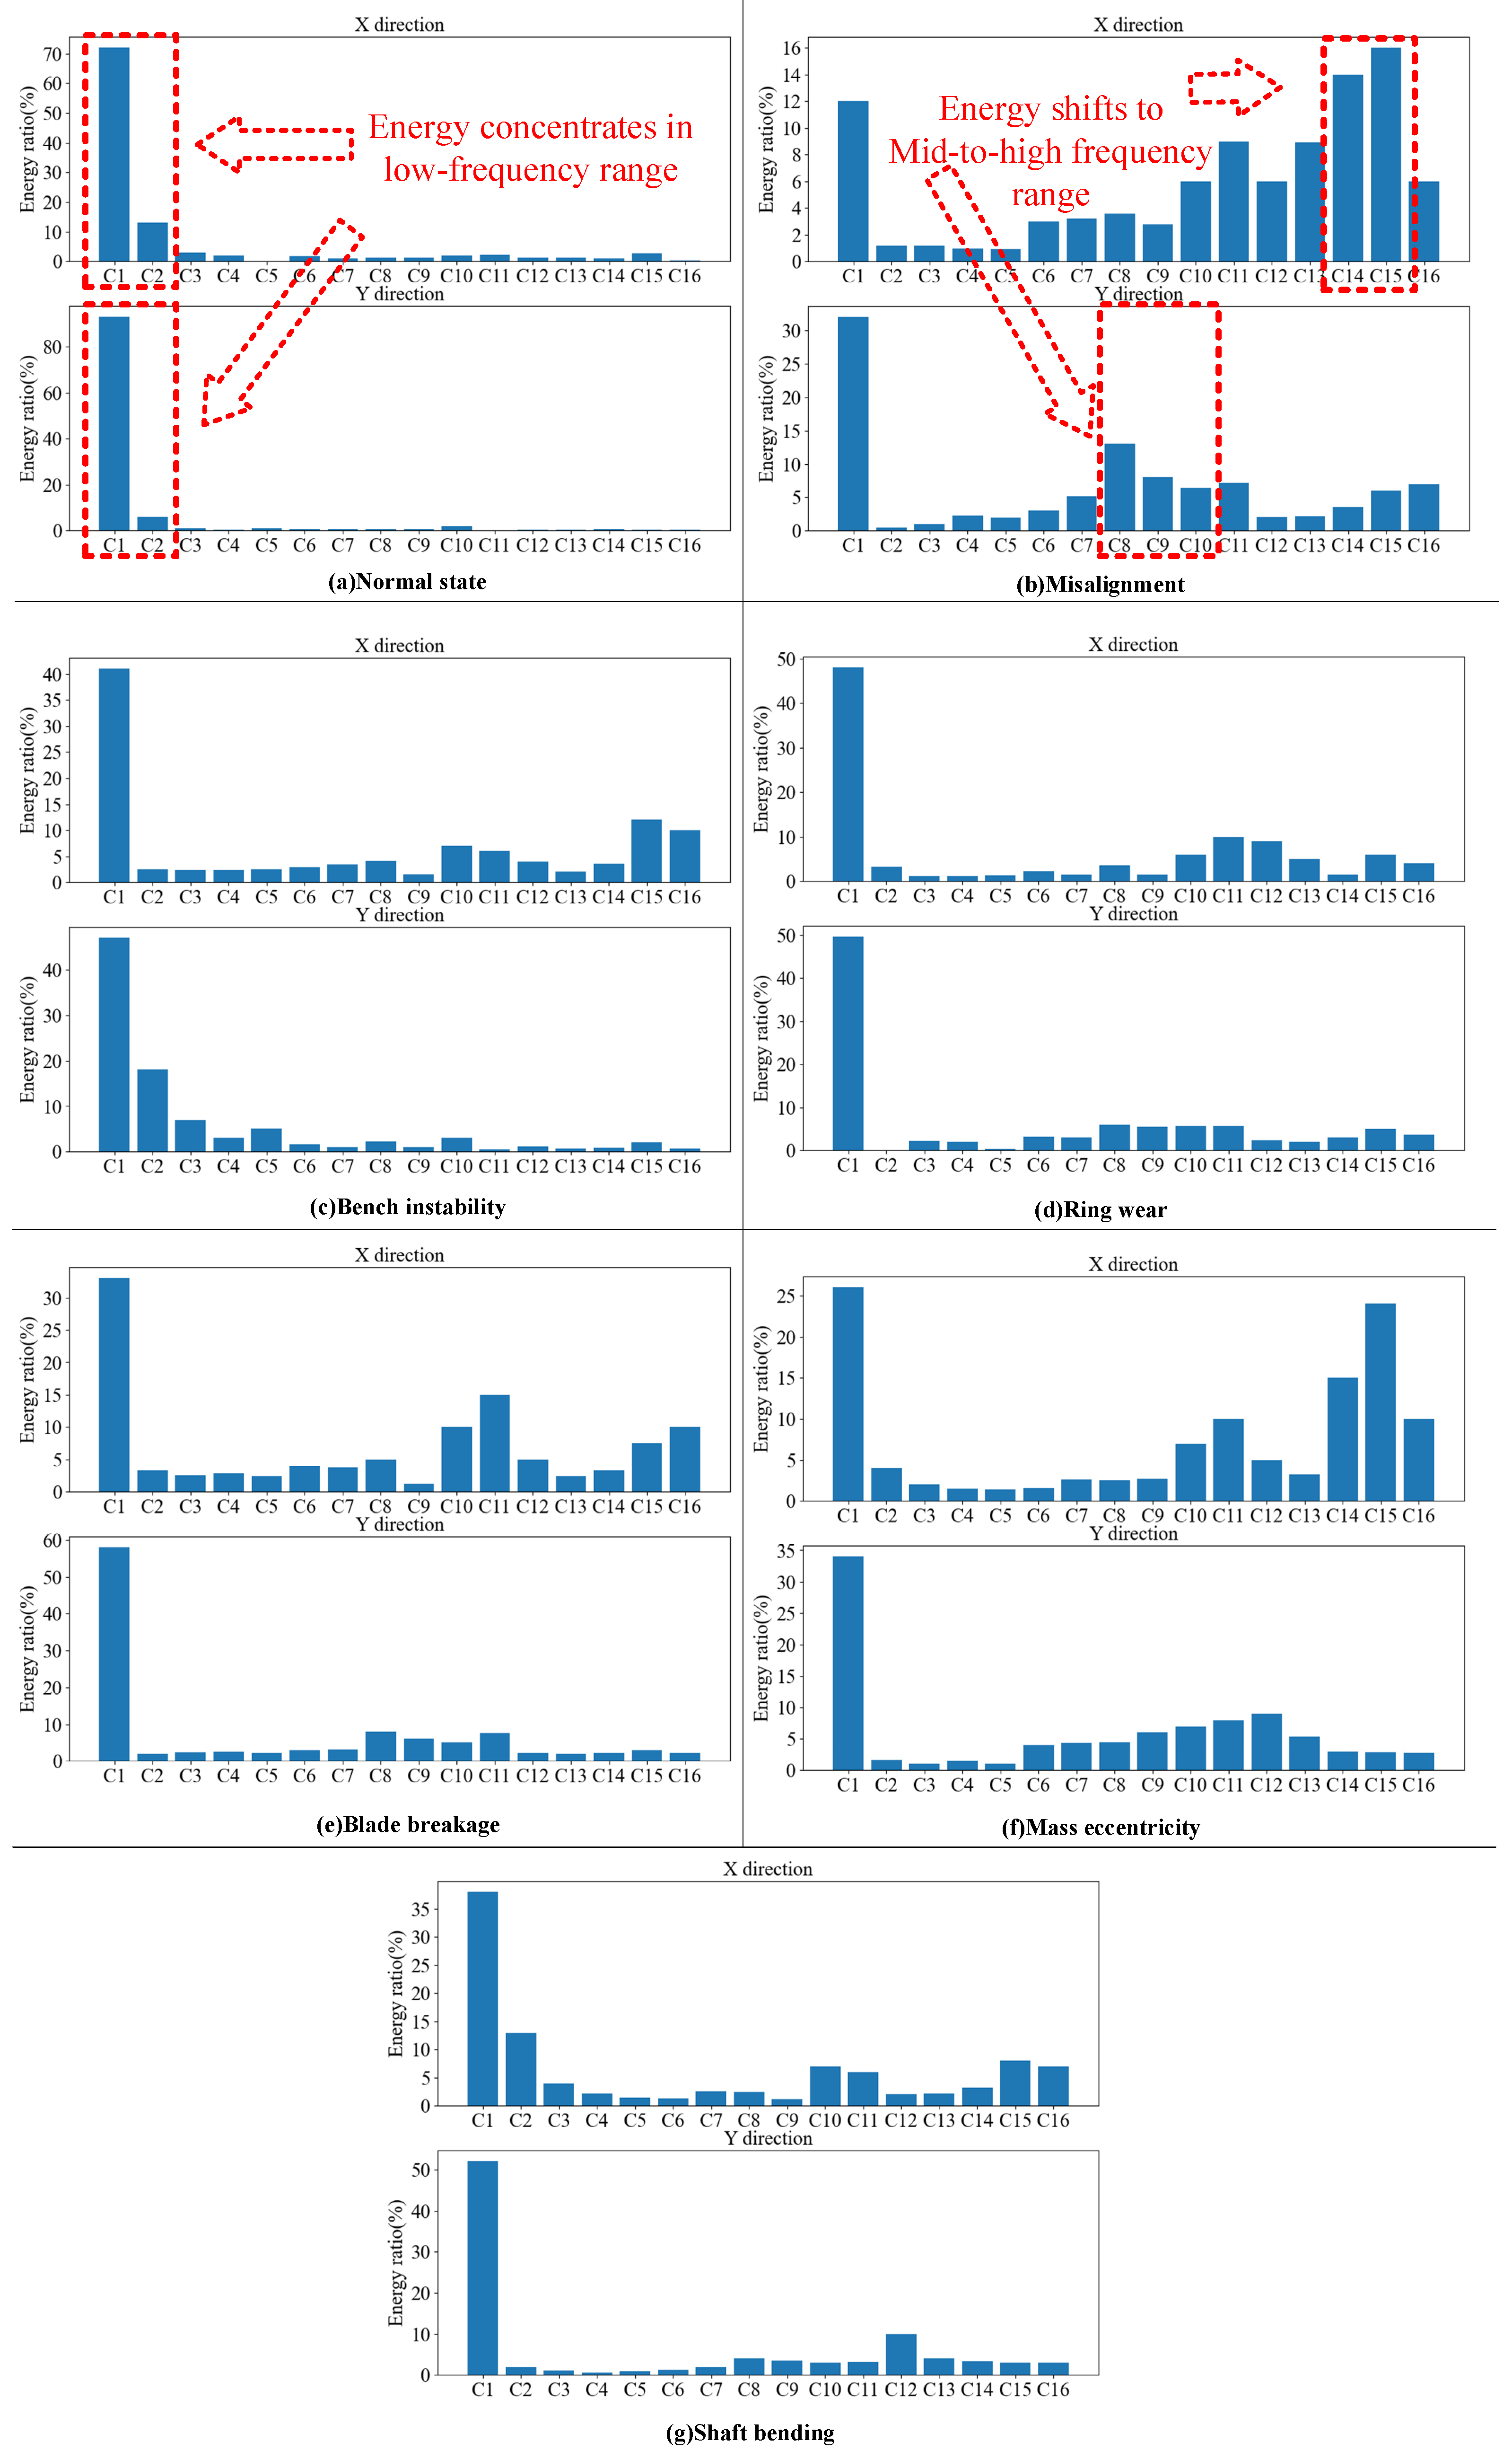
At a fundamental frequency of 50 Hz, and with six blades on the SEC pump, the blade frequency is 300 Hz. Using a four-level wavelet packet transform, each sample signal is decomposed into sixteen sub-bands, with the lowest-frequency band ranging from 0 to 320 Hz. This band encompasses the fundamental frequency of 50 Hz, its harmonics, and the blade-passing frequency of 300 Hz. By analyzing multiple coefficient bands of the wavelet packet decomposition, the wavelet packet energy spectrum of each segment was extracted. The following is an example of a wavelet packet energy spectrum in seven states. It can be observed from
Figure 9 that in the radial direction, the energy is mainly concentrated in the low-frequency region. When a fault occurs, the proportion of energy in the low-frequency and high-frequency bands increases, but the main energy remains in the low-frequency band. In most cases, the signal’s primary energy is concentrated in the low-frequency range, while the energy contribution in the low-mid sub-bands is relatively low. However, there is a slight increase in energy contribution in the mid- and mid-high-frequency sub-bands when faults occur. Therefore, the sub-band reconstructed signals from the low-frequency, mid-frequency, mid-high-frequency, and high-frequency ranges should be extracted.
To select the appropriate sub-bands for signal reconstruction, six sub-bands from the three mentioned frequency ranges are chosen: C1–C3, C8–C12, and C13–C16. These sub-bands are reconstructed into a new signal and utilized for both model training and validation. After comparative analysis, it can be noticed that the model’s performance is optimal when using the reconstructed signals from sub-bands C1, C2, C8, C10, C11, and C15.
After the six layers of wavelet coefficients of C1, C2, C8, C10, C11, and C15 are extracted and reconstructed into a new signal, the 12 frequency domain eigenvalues of the reconstructed signal are computed. The 12 frequency domain features extracted are shown in
Table 3.
Initially, the time-domain signal undergoes a transformation into the frequency-domain signal using the Discrete Fourier Transform. Here, ‘’ represents the spectrum of the input data ‘ at a specific frequency line, where ‘’ ranges from 1 to . In this context, ‘’ denotes the number of spectral lines, and ‘’ signifies the frequency value associated with each spectrum line. To assess the efficacy of fault classification, this study employs evaluation indicators such as accuracy, 10-fold cross-validation, and confusion matrix. To compare the proposed approach’s effectiveness, a three-layer ANN is applied for diagnosis. We analyze the accuracy, 10-fold cross-validation effect, and confusion matrix of various methods while ensuring consistency in the frequency domain feature values used in this paper.
6. Results Analysis
Table 4 displays the outcomes of the ten-fold cross-validation that was executed for the WPT–ANN method and the WPT–SVM method proposed in this study. Initially, when analyzing the individual accuracy data, it is evident that both techniques exhibit impressive accuracy in identifying multiple faults within SEC pumps. The diagnoses exhibit a stable consistency in results, suggesting that both methods maintain stability across various test folds. Notably, the WPT–SVM method demonstrates greater accuracy compared to the WPT–ANN method. Additionally, utilizing ANOVA analysis reveals that there is minimal divergence between the diagnostic outcomes of the WPT–SVM methods, indicating high consistency. The WPT–SVM approach demonstrated a superior average precision rate of 94%, resulting in a 5% increase compared to the WPT–ANN method. The precision and stability of the WPT–SVM approach for diagnosing multi-class faults in SEC pumps are highlighted here, making it a more viable option. Moreover, the WPT–SVM approach shows improved performance and less variation in diagnosing multiple fault states in SEC pumps, as seen in the combined error analysis, ANOVA, and average performance metrics.
Figure 10 displays the confusion matrix plots for the two diagnostic methods, indicating the misclassification of fault state one (blade breakage) and fault state five (misalignment) when using WPT–ANN. The results suggest that the WPT–SVM method achieves higher accuracy based on the metrics of accuracy, recall, and F1.
The reasons why there is a discrepancy in the performance between the two machine learning techniques with identical feature matrices are stated below:
SVM, as a non-linear classifier, excels in multi-category fault classification tasks due to its kernel function’s ability to identify intricate non-linear relationships in the data. On the other hand, the effectiveness of ANN significantly relies on the selection of network architecture and the tuning of its parameters. For an artificial neural network (ANN) to effectively perform in multi-category fault classification problems, there needs to be a concerted effort to meticulously design the network architecture and carry out extensive parameter tuning to meet the distinct requirements of various fault modes. This is further simplified with the nonlinear modeling capability of support vector machines (SVM), which allows for easily managing the dissimilarities between different fault modes without the necessity for complex network setups;
SVM possesses a significant interval classification feature, leading to the creation of clear decision boundaries that can prevent overfitting. This feature proves advantageous for small sample data, which tends to result in model overfitting. In contrast, ANNs may necessitate larger datasets when dealing with small samples to sidestep overfitting and achieve generalization performance. In contrast, support vector machines (SVM) demonstrate superior performance on limited data samples due to their ability to produce stable and consistent boundaries, which minimizes the risk of overfitting. As a result, SVMs can provide reliable diagnostic accuracy even with restricted data access.
7. Conclusions
In this study, the wavelet packet transform (WPT) was utilized to decompose the vibration acceleration signal of the SEC pump and extract the sub-waves with high energy proportions. Afterwards, features from these sub-waves were extracted in the frequency-domain and then classified by SVM. The results demonstrate the superior performance of the proposed method in classifying multiple fault states on the SEC pump compared to the method using WPT–ANN. The following summarizes the main findings:
Faults like misalignment and blade breakage significantly alter the frequency domain characteristics of vibration signals in SEC pumps. In the beginning, the signal energy is primarily concentrated in the low-frequency range. However, as faults worsen, energy shifts to the mid-frequency and high-frequency regions;
Ultimately, this study reveals an energy distribution pattern where low-frequency components dominate and high-frequency components support them. The primary energy components are effectively extracted through wavelet packet decomposition, summarizing the distinctive features of SEC pumps. Notably, signal extraction and organization into six sub-bands (C1, C2, C8, C10, C11, and C15) demonstrate strong representation;
Two different machine learning methods, SVM and ANN, exhibit variations when trained with the same feature matrix. The WPT–SVM approach introduced in this research attains 94% precision, surpassing the 89% accuracy of WPT–ANN.
