1. Introduction
This study focuses on repurposing closed coal mines by deploying emerging renewable energy and circular economy technologies to help develop a renewable-based energy sector, promote sustainable local economic growth, and maximise the number of new and quality jobs. This is perfectly aligned with the European Green Deal policies [
1] regarding the supply of clean, affordable, and secure energy, as well as mobilising the industry for a clean and circular economy. It is suggested that policymakers support the acceleration of the energy transition by deploying renewable energy, encouraging policies that establish the appropriate environment for the extensive penetration of renewables, and balancing the national urban structure to strengthen self-sustained urban development and guarantee a sustainable future [
2].
According to Keenan and Holcombe [
3], repurposing utilises elements of the mining infrastructure (such as mine housing and roads) and landscape aspects (such as mine voids and waste heaps) for alternative post-closure activities. These activities may assist in transitioning the local economy, mitigating the loss of mines by establishing new forms of attachment to the region. Under such conditions, the development and deployment of advanced carbon-saving technologies in the EU makes more sense than relocating to developing countries [
4]. On the other hand, although the decentralisation of energy systems always implies new opportunities and opportunity costs, the beneficiaries of these policies are the former coal regions, where local units of prosumers are conceived as being polycentric governance actors of common-pool resources [
5].
Working in this direction, Menendez et al. [
6] explored the use of abandoned mines for underground pumped hydroelectric energy storage, compressed air energy storage plants, and geothermal applications. They presented a case study in which these three uses are combined in just one mine. Madlener and Specht [
7] analysed the concept of underground pumped-storage hydropower plants in closed-down underground hard coal mines in Germany. They concluded that, under favourable conditions, this seems both technically feasible and economically reasonable. Other authors explored mining waste as a raw material resource, as a solution to the limited metal supply, for filling in the knowledge gaps for tailings valorisation [
8], with the possibility of benefiting from methane emissions [
9,
10,
11].
To achieve this goal and to justify the business model choice, a multicriteria assessment [
12,
13,
14] was developed based on previously assessed relevant scenarios and micro-scenarios. Here, a scenario is understood to be a standalone technology or a combination of technologies that provides a complete solution for the repurposing of closed coal mines to build a business model for the specific area. Furthermore, a micro-scenario is understood to be a complementary solution that should be used in combination with other scenarios or micro-scenarios to create a comprehensive business model.
The scenarios and micro-scenarios were evaluated against the European Green Deal policies using assessment criteria that were the result of interactions between researchers, industry experts, and stakeholders in the planning process. This is because, in most cases, empirical analyses of environmental innovations relied on surveys that allowed for the inclusion of many explanatory variables, such as different policy instruments or the influence of pressure groups [
15]. These assessment criteria were selected to grasp priorities in relation to their contribution to the climate-neutral economy transition, their lead on reductions in greenhouse gas emissions going below the relevant benchmarks, and their contribution to the generation of jobs and economic growth and embodying them in the subsequent processes.
However, to have a global vision of the problem, additional technical variables, which were not specifically considered under the European Green Deal policies and are needed to properly assess the technological alternatives, were also analysed within the assessment approach. To select the specific scenario to be developed, we also took into account the following: variables that characterise end-of-life coal mine environments [
16]; the technology readiness level (TRL) [
17] that allows for more effective assessment and better communication on the maturity of new technologies; the European taxonomy [
18], a classification system establishing a list of environmentally sustainable economic activities, significant in helping the EU scale up sustainable investment and implement the European Green Deal; synergistic potential [
19], guaranteeing a sustainable and combined use of assets otherwise overlooked in the high-velocity environments of phasing-out processes; the circular economy [
20,
21,
22,
23], which keeps materials, products, and services in circulation for as long as possible; and sector coupling [
24,
25]. Which involves the increased integration of energy end use and supply sectors, improving the efficiency and flexibility of the energy system, as well as its reliability and adequacy, while reducing the costs of decarbonisation.
In the first stage, technical variables characterising end-of-life coal mine environments were determined, where they were related to implementing business models relying on energy based on renewable resources that contribute to the circular economy or energy storage in closed coal mines. The technical variables were evaluated using the structural analysis method [
26]. The set of technical variables for the structural analysis was obtained via consensus, applying the Delphi method.
In the second stage, a specific analysis was developed to identify technical variables for scenario development, mainly via a combination of results from the structural analysis.
In the third stage, the identification of potential scenarios that could be implanted as business models in end-of-life coal mines was performed using morphological analysis. The obtained scenarios were then evaluated using a multicriteria analysis.
In the last stage, justifying and assessing the business model’s choice with specifying outputs and result indicators was carried out.
The Delphi method was applied in all stages. There were 40 experts from 4 countries who took part in the Delphi surveys. In the group participating in the study, 22 experts were from Poland, 7 were from Germany, 6 were from Greece, and 5 were from Spain. The experts represented research and scientific institutions (80%) and the coal mining and energy industry (20%). The range of years of experience in coal-mining-related activities was from 10 to over 35 years.
In the procedures of group assessment carried out by the experts, their competences were assessed according to Formula (1) [
27].
where:
Kk is an indicator of an expert’s competence, whose value ranges from 0.3 (the lowest competence) to 1.0 (the highest competence).
Kz is the factor determining the degree of knowledge held by the expert assessing the problem, wherein the degree of knowledge of the issues is expressed in points ranging from 0.1 to 1.0.
Ka is the coefficient of argumentation and consists of three sources of argumentation: theoretical analysis (argumentation degree from 0.1 to 0.3), experience (argumentation degree from 0.2 to 0.5, and intuition (argumentation degree 0.2). In total, value Ka = 1 corresponds to a high coefficient of argumentation.
The experts’ competence calculated as Kk ranged from 0.6 to 1.0.
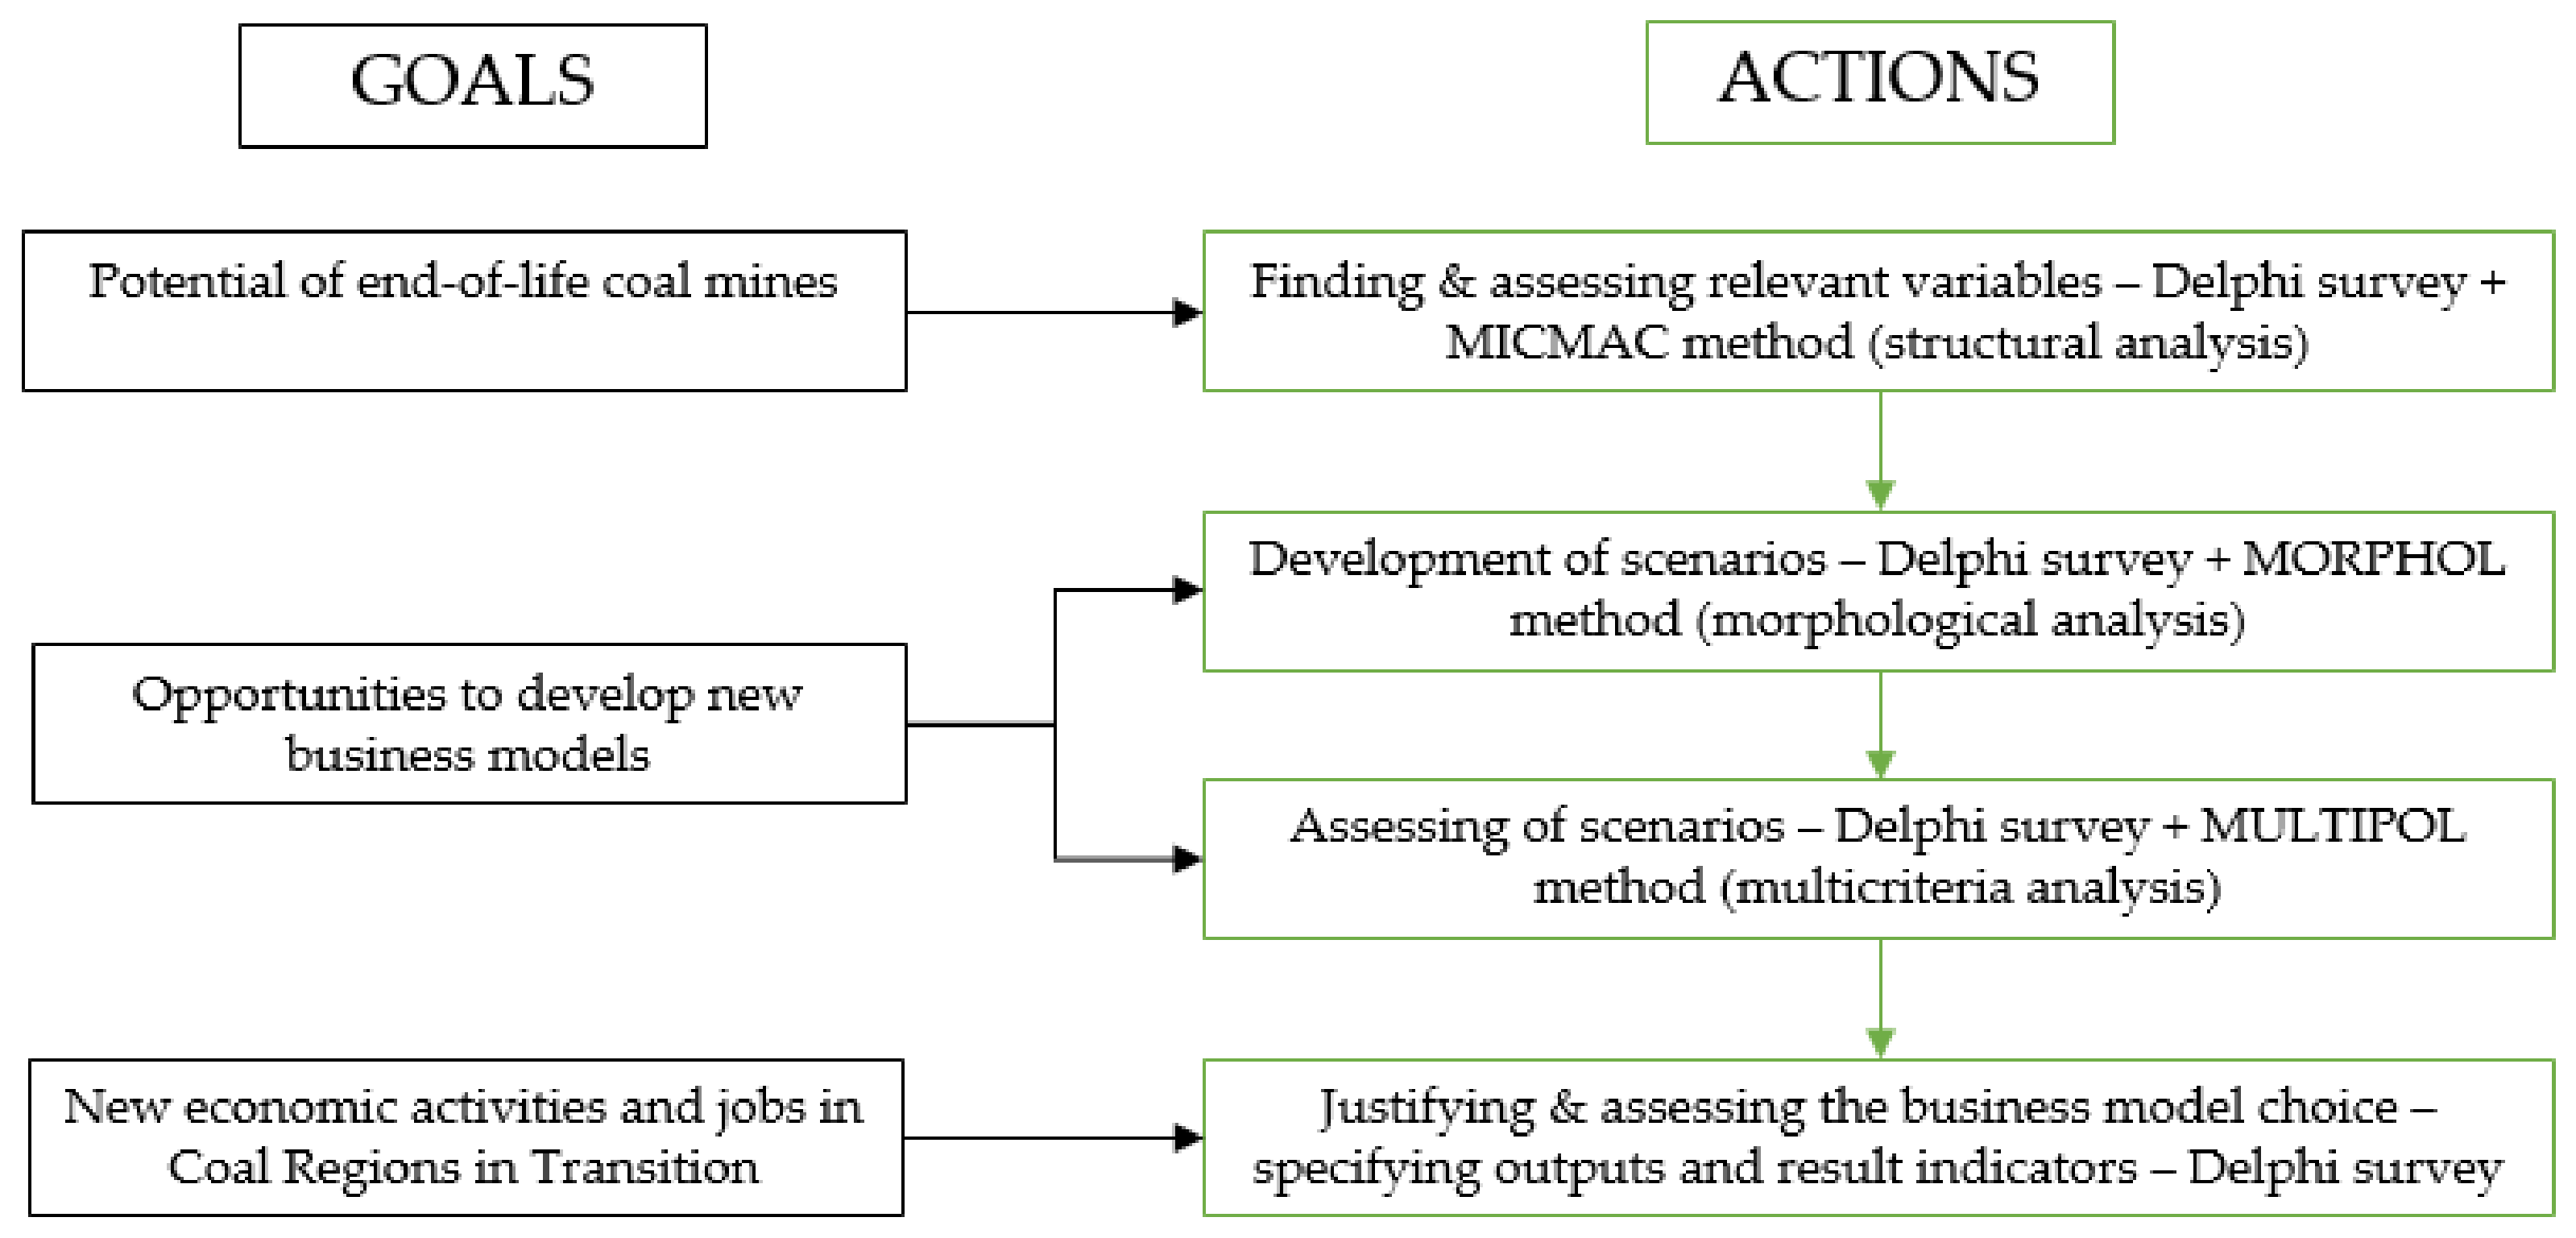
Figure 1 shows a scheme of the performed and presented actions in the paper, as well as the obtained goals.
2. Materials and Methods
2.1. Structural Analysis
Structural analysis is a tool that structures the pooling of ideas. This form of analysis describes a system using a matrix, which combines the constituent components of the system. This method identifies technical variables that are both influential and dependent: those that are essential to the evolution of the system. Structural analysis was carried out by experts from the field under study.
The different phases of the method are as follows: listing the technical variables, describing the relationship between technical variables, and identifying the key variables.
In order to perform a structural analysis of this complex system and correctly identify interactions between technical variables, the “cross-impact matrix multiplication applied to classification” approach was used using the MICMAC software v. 6.1.2 based on the Godet and Bourse method [
28,
29].
Structural analysis is a method of organising and analysing sets involving a large number of technical variables that interact with each other. The analysed technical variables may be seemingly unrelated to each other (direct influences), but the use of the MICMAC method makes it possible to determine their mutual influences and the relationship between them (indirect influences). The essence of the method is to assess the influence of each technical variable on the others, assuming that the influence of technical variable “n” on technical variable “m” may be different from the influence of technical variable “m” on technical variable “n”.
The responses must be qualitative. For each pair of technical variables, the following questions were asked: is there a relationship of direct influence between technical variable “
n” and technical variable “
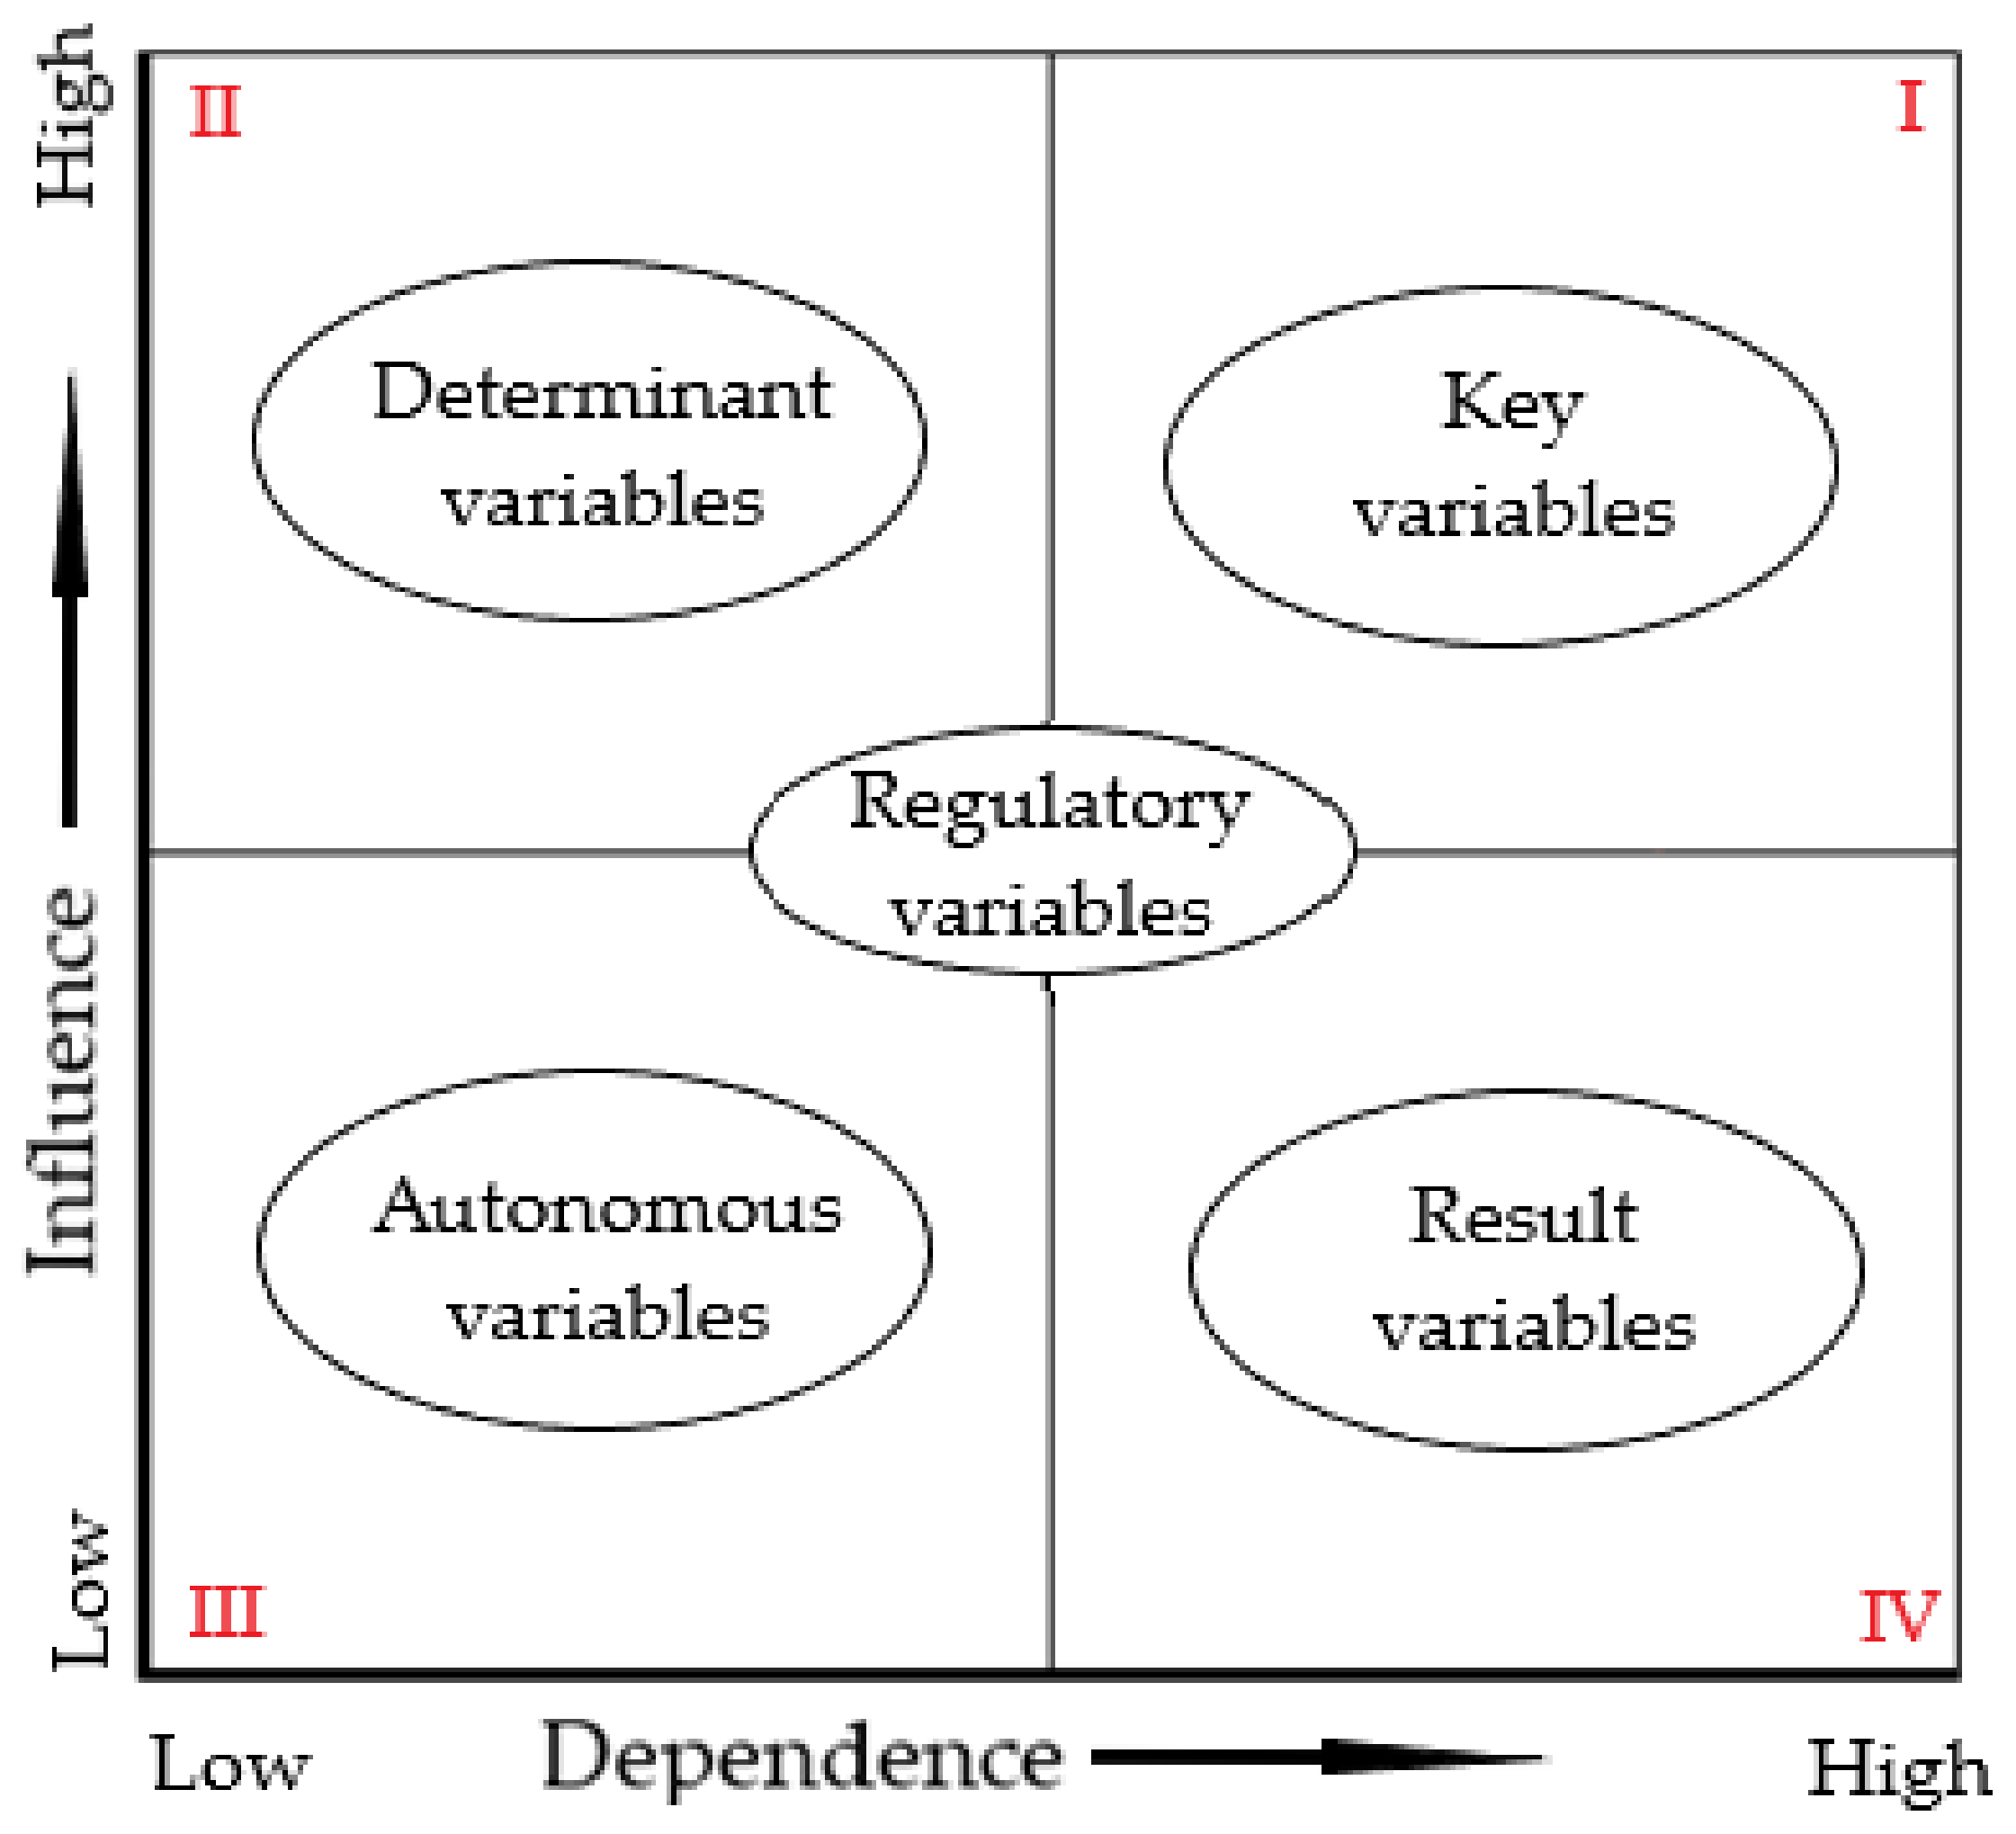
m”? If there is not, one puts value 0. If there is, one must ask whether this relationship of direct influence is low (value 1), medium (value 2), or high (value 3). Two methods of structural analysis were used: the direct method, which estimates the overall direct influence and dependence (the direct dependence of a variable in the system directly from the matrix of direct influence), and the indirect method, which estimates the overall influence and dependence of a variable using other system technical variables (matrix of indirect influence). Comparing the results of the direct and indirect methods confirms the importance of certain variables and reveals some variables that, due to their indirect effects, play a dominant role (and that the direct classification did not allow to be revealed). Therefore, the usage of structural analysis makes it possible to compare the hierarchy of technical variables in different classifications, obtain a range of relevant information on them, and identify key variables in the system. The location of the groups of technical variables is shown in
Figure 2 [
29].
Figure 2 shows groups of technical variables that are characterised by different potential and importance.
The key variables are located in the first quadrant (in the upper-right corner) and are characterised by the highest dependence, as well as the highest influence, on others. They are technical variables of high sensitivity and can be viewed as being responsive to the challenges of the system.
Determinant variables are situated in the second quadrant (upper-left) and are characterised by high influence and a limited/low dependence or relationship. Depending on their evolution, they can become brakes or drivers of the system.
Autonomous variables are situated in the third quadrant (bottom-left), not affecting the system (low dependences and low influences). They correspond to past trends or inertia of the system or are disconnected from it.
The result variables are situated in the fourth quadrant (bottom-right). These variables have a not-so-great influence on other variables but are highly dependent on them. They could be descriptive indicators of the system.
Regulatory variables are situated in the central area and are characterised by medium influences and dependences. They become the key to achieving compliance with the key variables. They determine the excellent functioning of the system under normal conditions.
2.2. Morphological Analysis
Morphological analysis can be useful in firing the imagination, helping to identify new products or previously unknown procedures, and sweeping the field of possible scenarios. The issue of choosing dimensions and key variables and their order, plus the relevant alternatives, is a determining one for the pertinence, coherence, plausibility, and transparency of the scenarios. The dimensions may be identified using the results of the structural analysis (MICMAC) to identify key variables.
The assessment of the selected scenarios was carried out using morphological analysis [
30] as the best method to explore the possible recombination of elements that make up the structural analysis. This method is mainly used for constructing scenarios, but it is equally suitable for forecasting the development of technology and the creation of potentially new products or services. For this purpose, the MORPHOL software v 5.1.2 was used. Starting from the structural analysis, it was necessary to include a selection of the technical variables that will be used for scenario development with morphological analysis. It is interesting not to select many variables from each group so that the field of possibilities or “morphological space” does not become huge and impossible to handle.
Thus, an analysis was developed to identify technical variables for scenario development from the structural analysis. Second, each technical variable’s development alternatives were selected and justified for a working horizon. Third, morphological analysis was used to evaluate possible recombination of the elements comprised in the investigated system. However, although the morphological analysis produced a relatively large number of scenarios, it was necessary to develop a brainstorming session to avoid leaving out specific combinations that did not appear during the analysis.
The result of this work was the “scenario space”, characterised by all the feasible combinations of system components. It was constructed based first on the key variables that were considered, as they have a strong influence and strong dependence on the rest of the variables. Second, determinant variables characterised by high influence and low dependence were considered. Finally, result variables that have a low influence on the others but a high dependence from others were considered.
Finally, the scenarios obtained from the morphological analysis were arranged and transformed into a list of relevant business models after eliminating some feasible scenarios to be developed without achieving any essential synergies from the end-of-life coal mines.
2.3. Justification Approach
Scenario and micro-scenario options from end-of-life coal mines in the process of phasing out were evaluated using multicriteria assessment and the MULTIPOL tool v.4.0 [
31].
MULTIPOL (an acronym for MULTIcriteria and POLicy) is one of the most straightforward existing multicriteria applications, but by no means is it the least useful. It is based on evaluating actions using a weighted average, similar to evaluating students in a class calculated according to coefficients per subject. Classic multicriteria approaches are used in MULTIPOL: census possible scenarios, analyse consequences, elaborate on criteria, evaluate scenarios, define policies, and sort scenarios. Hence, every scenario is evaluated, considering each criterion with a simple scale. Evaluation is possible via either questionnaires or meetings with experts, where a consensus is necessary.
Furthermore, scenario evaluation is not uniform in that different contexts related to the objective are also considered. One of these contexts is a policy: a set of weights tuned to the criteria. These weights represent different value systems for decision-makers, diverse strategies, multiple scenarios, and assessments, including possible changes in the time horizon. For each policy adopted, experts assign an appropriate weight based on the assumed criteria.
For each policy, an average score is assigned to the scenarios and a table of classification profiles is created in comparison with the policy scenarios. An assessment of the risks associated with uncertainty or incompatible alternatives is obtained using a scenario classification map based on the mean values and standard deviations of the results obtained for each policy. Policies have been selected that assume the fact that climate change coupled with ongoing environmental degradation are existential threats to Europe and the world, and that should be addressed in terms of scenarios and micro-scenarios. The European Green Deal, developed for this purpose, will transform the EU into a modern, renewable-resource-based, competitive economy.
Then, evaluation criteria emanated from the study’s goal and objectives. Defining criteria resulted from interactions between researchers, external experts, and the stakeholders in the participatory planning process, aiming at grasping priorities and embodying them in the subsequent processes.
The evaluation of scenarios and micro-scenarios related to policies was developed using these inputs. However, although the justification approach was initially based on evaluating scenarios/micro-scenarios related to EU policies, other relevant aspects were considered: the synergistic potential, technology readiness level (TRL), circular economy, European taxonomy, technical criteria, and sector coupling.
2.4. Analysing Alternative Options
Finally, result indicators were selected to analyse the alternative options derived from the justification approach, considering the targets set by the European Green Deal and related taxonomy and the regional policy indicators for the Just Transition Fund [
32].
3. Variables
Before proceeding with the structural analysis, technical variables were identified, analysed, and reduced according to their representability. All technical variables adopted relate to both technical characteristics (e.g., heap soil characteristics, fly ash characteristics, and water temperature) and evaluation criteria (e.g., level of competitiveness or size of costs) that are related to renewable energy technologies combined with energy storage and a circular economy. The technical variables in these systems were defined based on the knowledge and results gained from the literature review, experts’ knowledge, and stakeholders.
The result of the first phase was an unsorted, comprehensive list of technical variables. The difficulty was in finding a consensus, not only on the meaning of the technical variables, but even in determining which aspects should be formalised as technical variables and which should not. A detailed clarification of the technical variables was therefore necessary to enable a better perception of the relationships between the variables in the later phases of the analysis. A homogeneous list of 70 technical variables of the system was obtained as a consensus. The technical variables were analysed into four groups: the “Power plant” group, the “Mining surface” group, the “Mining underground” group, and the “Global” group.
There were 38 technical variables from the “Power plant” group subjected to structural analysis. As a result of direct and indirect analyses, nine technical variables were defined as key variables: available space for new technologies/projects, land use restrictions (power plants), the character of the local area, electro-intensive industries, proximity to industries, neighbourhood and proximity to the nearest urban/industry, access/proximity to road infrastructure, access/proximity to railway infrastructure, and constant energy consumption industries.
Then, 16 technical variables from the “Mining surface” group were subjected to structural analysis. As a result of direct and indirect analyses, eight technical variables were defined as key variables: the geotechnical stability of waste heaps, geometry of the waste heaps, area of the waste heaps, height of the waste heaps, angle of slopes of the waste heaps, fire hazards at the waste heap, status of reclamation of the waste heap, and land use restrictions (mine).
Furthermore, 16 technical variables from the “Mining underground” group were subjected to structural analysis. As a result of direct and indirect analyses, two technical variables were defined as key variables: the volume of pumped water and the flooding status of the mine.
Finally, 69 technical variables from the “Global” group were subjected to structural analysis. As a result of direct and indirect analyses, eight technical variables were defined as key variables: access/proximity to railway infrastructure, available space for new technologies/projects, land use restrictions (power plant), the character of the local area, neighbourhood and proximity to the nearest urban/industry, access/proximity to road infrastructure, proximity to industries, and electro-intensive industries.
Due to the similarity of some of the analysed technical variables related to the mining surface, technical variables including the height of the waste heap, angle of slopes of the waste heap, and geometry of the waste heap were combined into the geometry of the waste heaps. The power plant variables character of the local area, neighbourhood and proximity to the nearest urban/industry, and proximity to industries were combined into character of the local area/proximity to industry. Finally, the power plant variables access/proximity to road infrastructure and access/proximity to railway infrastructure were combined into access/proximity to transport infrastructure, resulting in a total of 22 variables.
4. Discussion
4.1. Assessment of Relevant Scenarios
A specific analysis was developed to identify technical variables for scenario development. This was mainly via a combination of results from the structural analysis, firstly prioritising key variables, followed by determinant variables. Result variables with a low influence on the others but high dependence are often descriptive indicators of the system’s evolution and were discarded because of this fact. The result of this analysis is presented in
Table 1.
The next step was to consider the different alternatives for each technical variable.
Table 2 presents the list of alternatives for each technical variable, extended with an “indifferent” option for each variable in case none of the alternatives are specifically needed. Combining the different alternatives for each analysed variable allows the computing of 100,000 possible scenarios.
The development of scenarios is the next step in the morphological analysis process and corresponds to the development alternatives for the selected working horizon of the technical variables. Some micro-scenarios that can partially address some objectives were described after the global scenarios. Their application will depend on the specific needs or wills of the coal regions interested in exploring these possibilities, and they can always complement more specific scenarios.
Although the results of the morphological analysis resulted in a relatively large number of scenarios, it was necessary to develop brainstorming sessions. This was due to the need not to leave out specific combinations of variables that did not emerge during the analysis due to time constraints. Ultimately, this related to the decision regarding whether to go with a typical scenario or a micro-scenario, which was sometimes difficult and required a consensus to be reached.
The list of scenarios and micro-scenarios obtained using the morphological analysis was arranged and transformed into final lists (
Table 3 and
Table 4). This was carried out after eliminating some scenarios and micro-scenarios that, in most of the cases, were feasible to be developed without achieving any essential synergies from the end-of-life coal mines.
4.2. Scenario Assessment
First, policies were selected, considering that climate change and environmental degradation threatens Europe and the world. The European Green Deal will transform the EU into a modern, renewable-resource-based, and competitive economy to meet these challenges by providing the three policies shown in
Table 5.
Seven assessment criteria were then selected based on the goals and objectives of the study. The development of the criteria resulted from the interaction between the researchers, external experts, and stakeholders in a participatory process, where the main aspect was to both grasp the priorities and include them in subsequent processes. The list of assessment criteria is presented in
Table 6.
Every relevant scenario and policy was evaluated against the selected criteria. Thus, it was possible to obtain the scores of scenarios related to the policies (
Table 7).
As with the scenarios, every relevant micro-scenario and policy was evaluated against the selected criteria. Thus, it was possible to obtain the scores of the micro-scenarios related to the policies (
Table 8).
However, to obtain a global vision of the problem, additional criteria that were not specifically considered under the European Green Deal policies and that are needed to properly assess the technological alternatives were also analysed within the assessment approach:
Evaluating scenarios/micro-scenarios related to the technical variables presented in
Table 1 was also considered as an input for justifying the choices.
- b.
Technology readiness level (TRL)
Another criterion considered was each specific scenario’s technology readiness level (TRL) [
17].
According to this criterion, small modular reactors (SMRs) were no longer considered in the analysis due to their low TRL, as only a small number of pilots are being developed worldwide at present.
- c.
European taxonomy
The European taxonomy [
18] has also been identified as a rather important factor in justifying the selected scenarios. It is imperative that investments be redirected to sustainable projects and activities in order to achieve the EU’s energy and climate goals for 2030, as well as those of the European Green Deal.
- d.
Synergistic potential
To justify the business model’s choice, the synergistic potential of the different scenarios was also considered as a crucial analysis criterion [
19,
20].
- e.
Circular economy
The circular economy was considered in the assessment [
21,
22,
23].
- f.
Sector coupling
Finally, sector coupling involves the increased integration of energy end use and supply sectors, improving the flexibility and efficiency of the energy system as well as its adequacy and reliability [
24,
25].
4.3. Business Model Choice
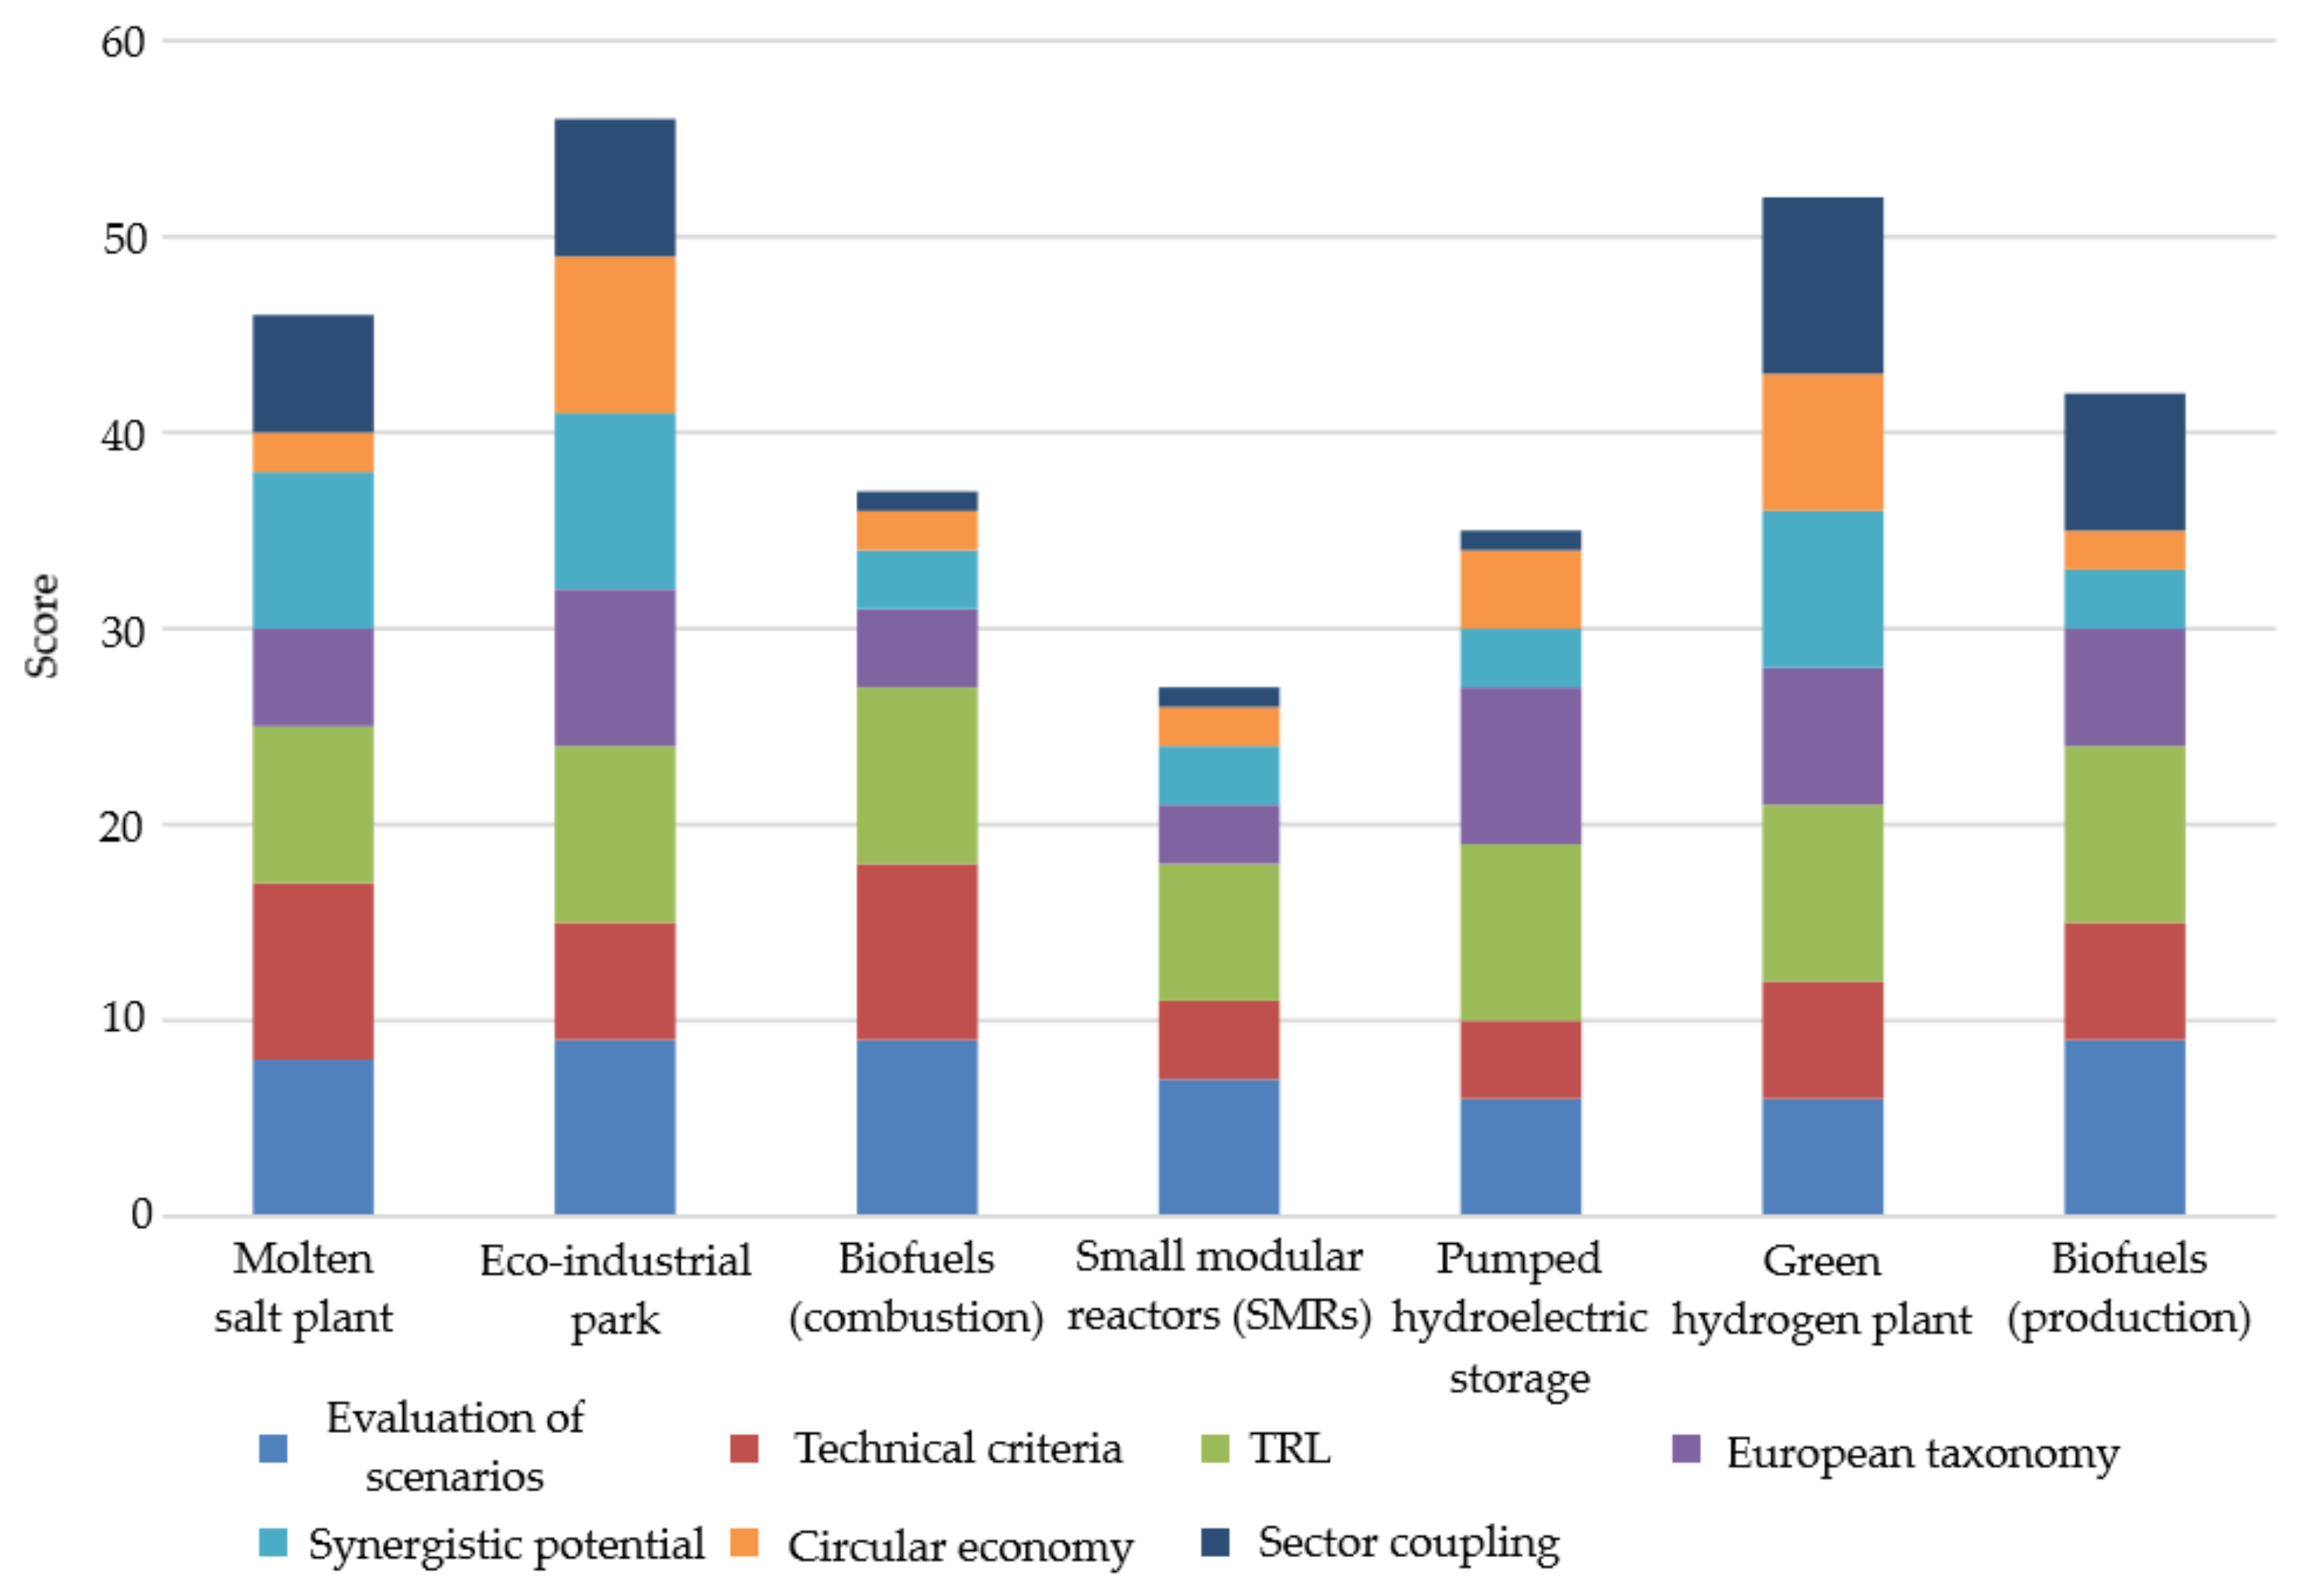
Although the evaluation of scenarios/micro-scenarios related to policies was first considered to justify the business model choice, linear scoring was given to the different aspects, following a detailed analysis of each scenario/micro-scenario.
According to the aspects analysed within the scenario evaluation, eco-industrial parks are the most appropriate and exciting scenario choice to be selected, according to the scoring given to the different aspects, following the previous explanations (
Figure 3).
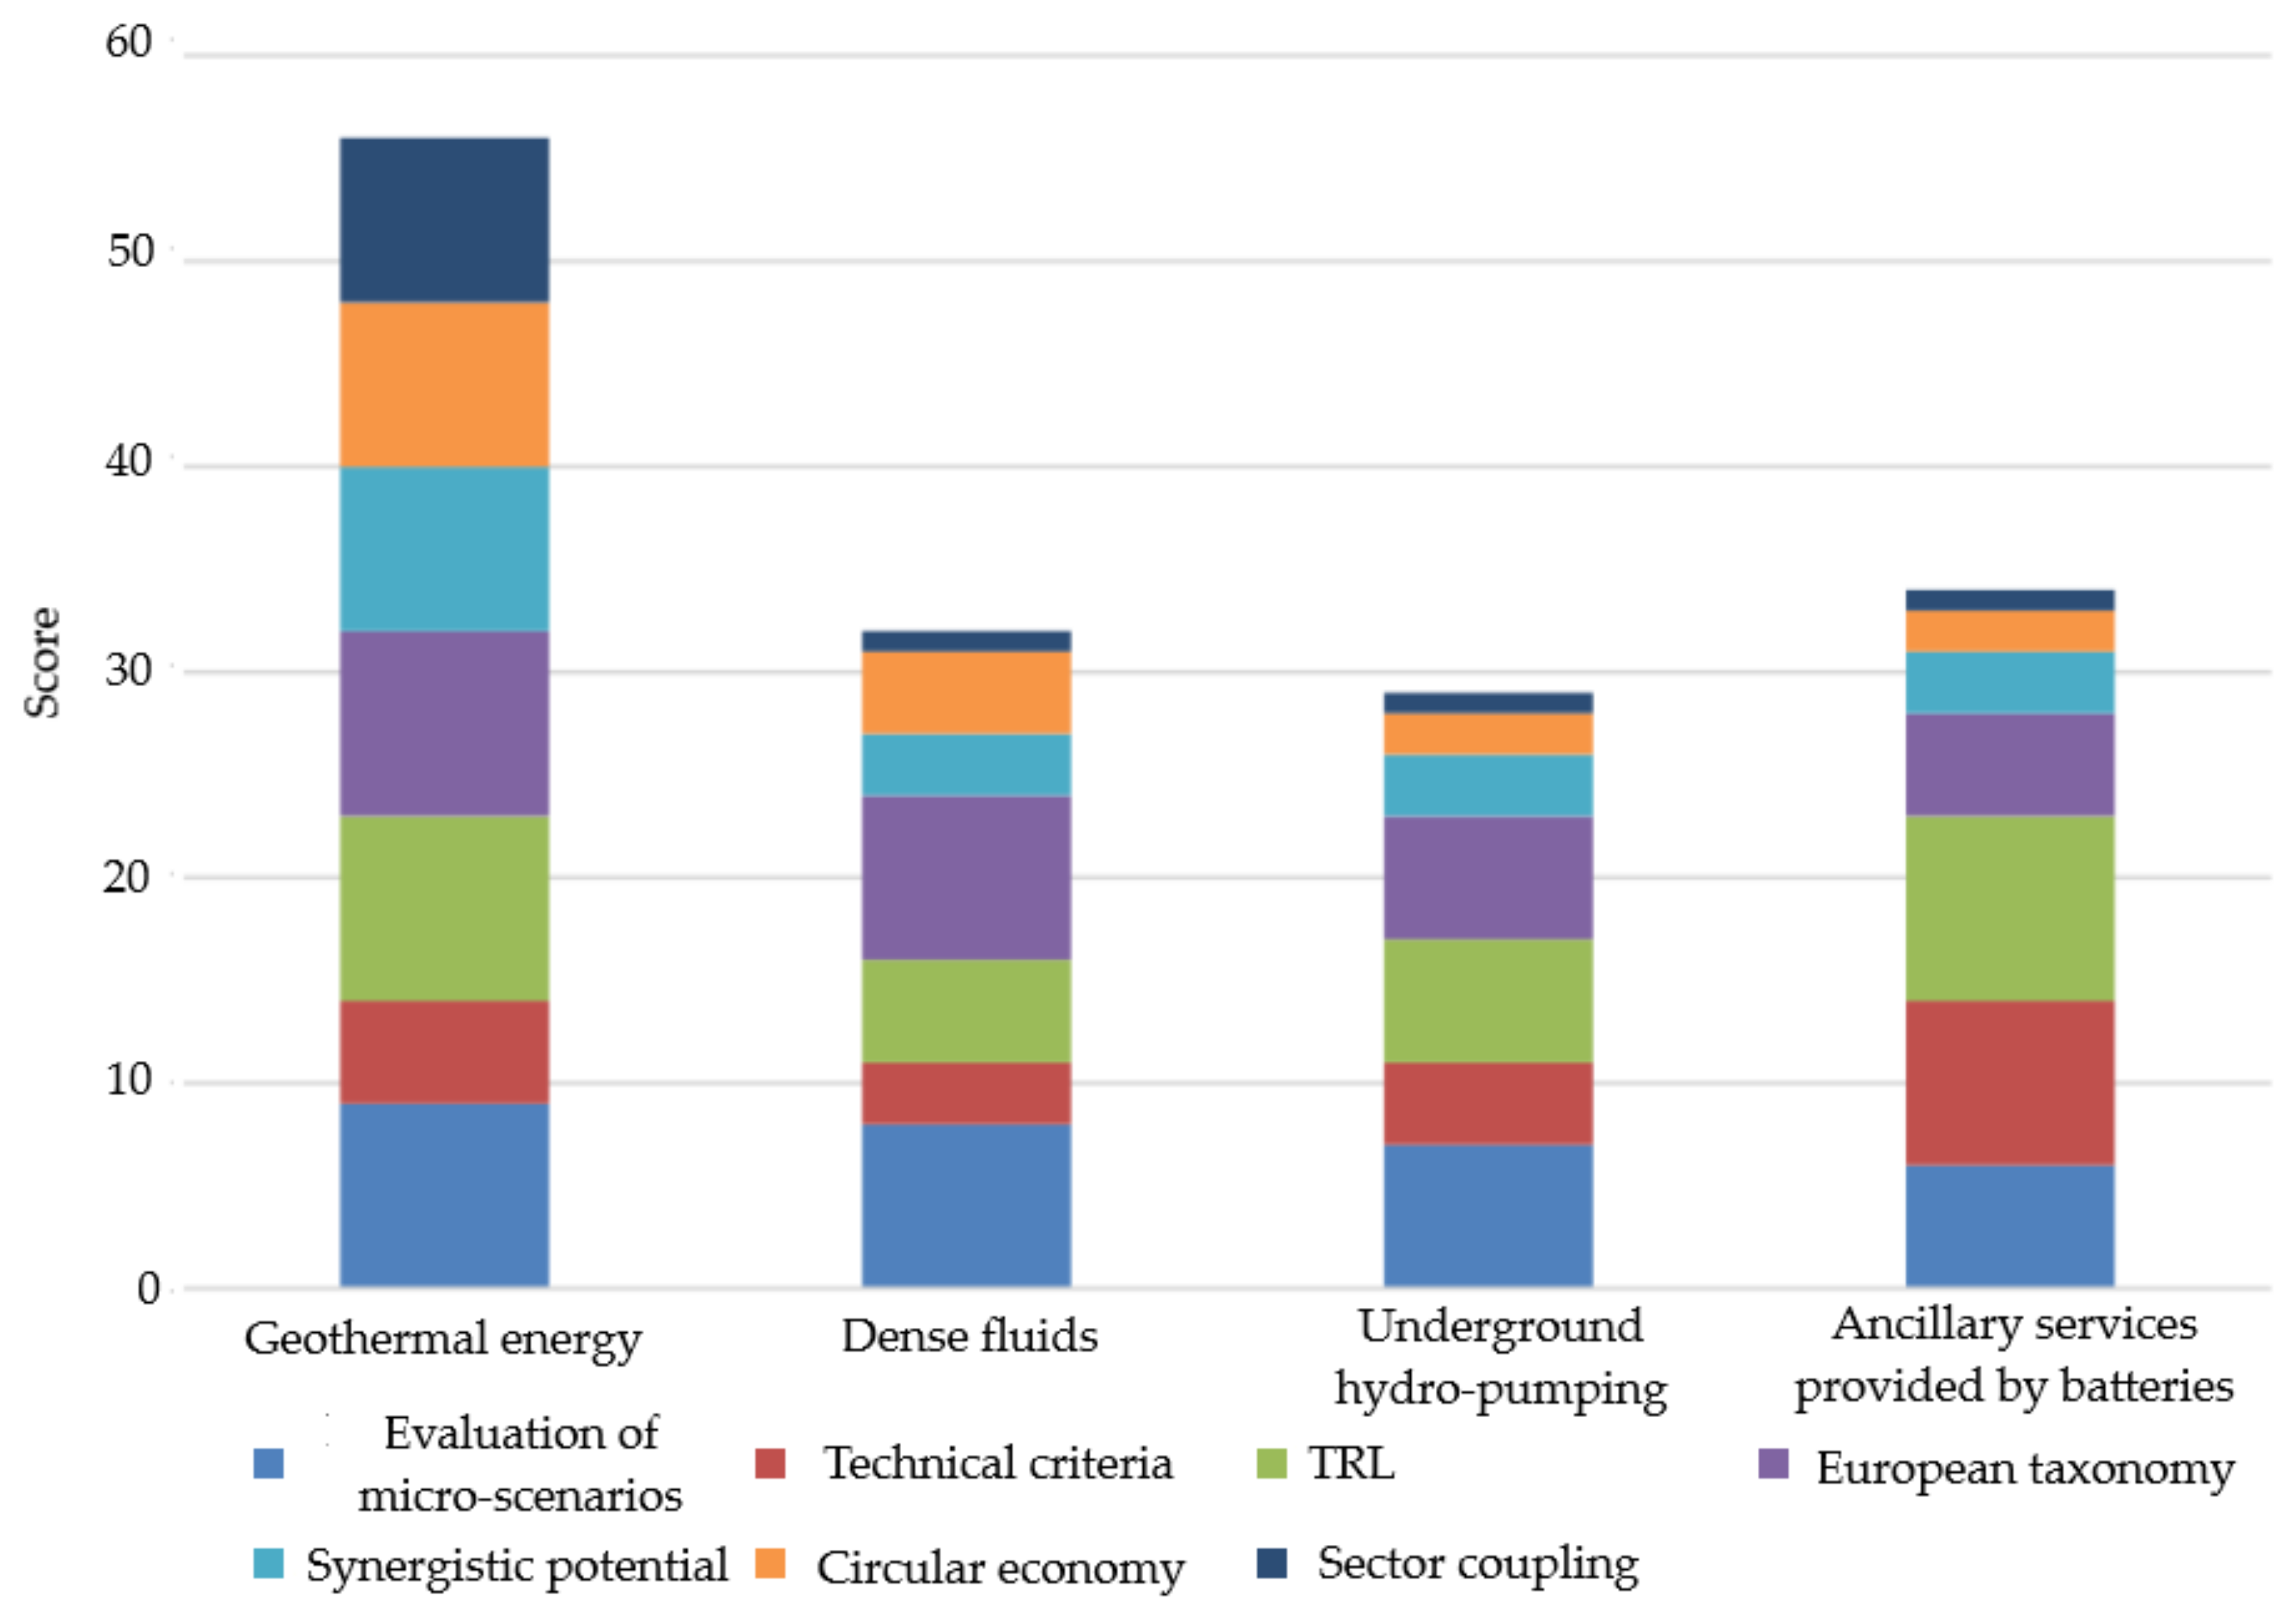
Undergoing a similar scoring process according to the aspects considered within the evaluation approach,
Figure 4 presents the micro-scenario classification. Geothermal energy is the most appropriate and exciting micro-scenario choice to be selected. However, although batteries are situated far below geothermal energy, they should be considered for energy storage, as they are the first technology in this area. Batteries are closely followed by the two pumping technologies: dense fluids and hydro pumping, with lower TRLs in both cases. As pumping technologies increase their TRLs in the future, they will probably surpass batteries, and the scenario may radically change.
Accordingly, the most optimal business model refers to eco-industrial parks as an integrated alternative to sustainable energy generation technologies and the creation of a circular economy [
37]. The main goal of eco-industrial parks is to reduce waste and pollution by promoting short-distance transportation and optimising the transfer of materials and energy within the industrial park. This scenario obtained the second average in the scenario evaluation, with high TRLs of the technologies involved (e.g., photovoltaic and geothermal), no problematic requirements for the European taxonomy, an exciting contribution to the circular economy, and a high level of sector coupling.
Sustainable energy generation technologies that could be considered within eco-industrial parks comprise wind energy production and solar energy production connected with energy storage and/or geothermal energy. These could be used to provide cooling and/or heating to the enterprises or companies participating in the eco-industrial park, thus constituting or simultaneously developing a virtual power plant.
However, an eco-industrial park with a virtual power plant should be supported by tax breaks, other financial privileges, and other benefits to boost and diversify the economy of the post-mining area. This would attract external investment due to tax exemptions for businesses, access to preferential credits from National authorities, the European Bank for Reconstruction and Development, the European Investment Bank, local business support institutions, and others.
4.4. Business Model Result from Indicators
According to their high TRL, eco-industrial parks with virtual power plants may be complemented by a green hydrogen plant, provided that specific economic subventions are obtained to achieve balanced financial results. Other alternatives that should be considered according to the business model choice justification for scenarios and micro-scenarios are molten salt plants, batteries, or biofuels.
Result indicators were selected considering the targets set by the European Green Deal and related taxonomy and the regional policy indicators for the Just Transition Fund [
32], and these are presented in
Table 9, together with the final values achieved.
The following scale was adopted for the evaluation of result indicators for the business models:
Two rounds of a Delphi survey were held with experts from the Central Mining Institute, National Research Institute (GIG-PIB), Poland; Polish Power Plants Association (TGPE), Poland; Hulleras del Norte S.A. (HUNOSA), Spain; Technische Hochschule Georg Agricola University (THGA), Germany; the University of Oviedo (UNIOVI), Spain; and the Centre for Research and Technology—Hellas (CERTH), Greece.
The results for the “full-time employment creation” indicator from the first Delphi survey are shown in
Table 10. The results obtained in the second Delphi survey that deviated from the average are highlighted in yellow.
The final results in
Table 9 show that the business model with the highest score is the scenario of an eco-industrial park (with a virtual power plant) plus the scenario of a green hydrogen plant. However, site-specific requirements may differ due to the “weighting” of technology for individual locations.
Based on all of the aspects that were considered, eco-industrial parks with a virtual power plant are the most suitable and exciting business model choice, according to the scores given to the various aspects. The scenario refers to an integrated alternative for sustainable energy generation technologies and circular economy contributions at closed coal mines. The main objective of this scenario is to reduce waste and pollution by promoting short-distance transport and optimising materials and energy flows. Sustainable energy-generation technologies comprise renewable energy production with their storage, and the production of geothermal energy to provide energy and/or heat to the companies/industries in the eco-industrial park.
According to their high TRL, eco-industrial parks with a virtual power plant may be complemented with the production of hydrogen, provided that specific economic subventions are obtained to achieve balanced financial results. Another possibility is combining them with a molten salt plant as a storage option that may complement geothermal energy production. This should be supported by tax breaks and easily accessible credit to boost and diversify the economy in the area, attracting external investment via tax exemptions for businesses, and access to preferential loans from national authorities, the European Investment Bank, the European Bank for Reconstruction and Development, local business assistance institutions, and others.
5. Results
To determine the economic diversification potential, the likely commercial viability and the added value of the eco-industrial parks (with virtual power plants [
40]), a pre-feasibility study (including CapEx, OpEx, cash flows, and expected financial outcomes) was developed with the following characteristics:
A photovoltaic installation in a 50 ha coal mine waste heap area with an installed capacity of 1 MW/ha, thus totalising 50 MW [
34].
Unconventional hydro-pumped storage, calculated to cover half of the daytime energy production by photovoltaic means (with a 10% safety margin), with around half of the daytime hourly energy production occurring in twice the time, resulting in an installed capacity of 200 MWh and power of 10 MW.
A geothermal energy generation plant of 4 MW, producing 5000 MWh of heating and 2000 MWh of cooling per year.
A green hydrogen plant with PEM technology electrolysers of 2.5 MWe (megawatt electrical).
An eco-industrial park of 100,000 m2 will be developed in liberated areas that are not in waste heap areas.
Table 11 presents the basic photovoltaic parameters for a 50 ha coal mine waste heap area with an installed capacity of 1 MW/ha and a capacity factor of 30%. This corresponds to the percentage of time that the installation is used per year, with 50% of the energy to be stored and the rest to be sold.
The unconventional hydro-pumped energy storage method using dense fluids (proposed in the GreenJOBS RFCS project) has two newness values, compared to what has been already proposed at worldwide levels. Firstly, it can be implemented in flooded, closed coal mines, which has eliminated the costs associated with pumping mine water in general and the water used for geo-thermal energy production, in particular. It is not easy to implement, and is not even feasible with alternative methods of energy storage such as the gravitricity method. Secondly, the use of dense fluids allows the provision of density differentials between the fluids, and the greater the difference, the more efficient the system will be. On the other hand, the deep infrastructure (mining working and excavations) of underground coal mines makes them very suitable for designing a system to satisfy the output requirements: large height differentials between the surface and deep underground galleries/workings that eliminate the need for a bottom pressure vessel, with a relatively stable pressure, due to the thickness of the overburden.
For these reasons, the pre-feasibility study will consider this technology, while batteries will only be considered as a backup for the whole system.
Table 12 presents the unconventional hydro-pumped storage parameters calculated to cover the daytime energy storage (with an added 10% safety margin). These parameters include around half of the daytime hourly production of energy in twice the time (approximately 16 h), resulting in an installed capacity of 200 MWh and power of 10 MW.
Although unconventional pumped hydro storage can perform rapid ramping, avoiding photovoltaic curtailment and loss of load, it needs several minutes to respond to signals.
Thus, batteries should be used, but only for short periods. Batteries have proven to be remarkably rapid in responding to signals (from sub-seconds to seconds), with costs declining notably while technical parameters such as degradation rates and energy density keep improving. Consequently, they will play a vital role in the flexibility of the energy storage system.
High-power batteries would be used for short periods, with an estimated investment of 1.5 MEUR for an installed energy capacity of 200 MWh and power of 2 MW, and an annual expenditure of approximately 0.05 MEUR. This information was obtained from the Pacific Northwest National Laboratory [
41].
Table 13 presents the cash flows for the time period of the first 3 years, using constant 2022 euros, an annual depreciation of 5%, and a working capital of approximately 9% of the operating revenues.
Taking into account an 8% capital cost, the expected financial outcomes for period of 25 years will be:
Regarding geothermal energy,
Table 14 presents the parameters for a 4 MW geothermal energy plant producing 5000 MWh of heating and 2000 MWh of cooling per year. Hulleras el Norte, S.A. (HUNOSA) facilitated most of the data.
Table 15 presents the cash flows for the first three years, using constant 2022 euros, an annual depreciation of 5%, and a working capital of approximately 9% of the operating revenues.
Finally, considering an approximate 8% capital cost, the expected financial outcomes for 20 years will be:
The green hydrogen plant will be designed with 2.5 MWe of electrical power dedicated to hydrogen generation; the electrolyser will allow a nominal flow rate of 500 Nm3 H2/h (0.012 kg H2/s = 1036.8 kg H2/day). The purity of the H2 generated will be 99.998%, and the operating range will be between 5 and 125% of the nominal H2 flow rate.
The hydrogen produced will be sold to electro-intensive-power industries or companies nearby.
Table 16 presents the green hydrogen plant parameters.
Table 17 presents the cash flows for the period of the first 3 years, using constant 2022 euros, an annual mean depreciation of 6.7%, and a working capital of approximately 9% of the operating revenues.
Considering the 8% cost of capital, the financial results expected in 15 years will be as follows:
Thus, the investment is not feasible unless a specific subvention is obtained for developing the green hydrogen plant, such as a 50% subvention of the total investment, which aligns with big ticket projects within the Research Fund for Coal and Steel (RFCS) [
42]; so, taking into account a subvention of 2.5 MEUR, the new expected financial outcomes will be:
Finally, developing a business park to attract industry is timely, and it can take at least 4 years, and this has a financial cost associated with the planning and execution of the work. A typical industrial park of 100,000 m
2 will have 10% of the area for green space and 30% for roads and general facilities if its overall shape is not complicated.
Table 18 presents the eco-industrial plant deployment parameters.
Table 19 presents the cash flows for all years of the investment, using constant 2022 euros.
Finally, considering an 8% capital cost and assuming that the coal mine company owns the land, the expected financial outcomes will be:
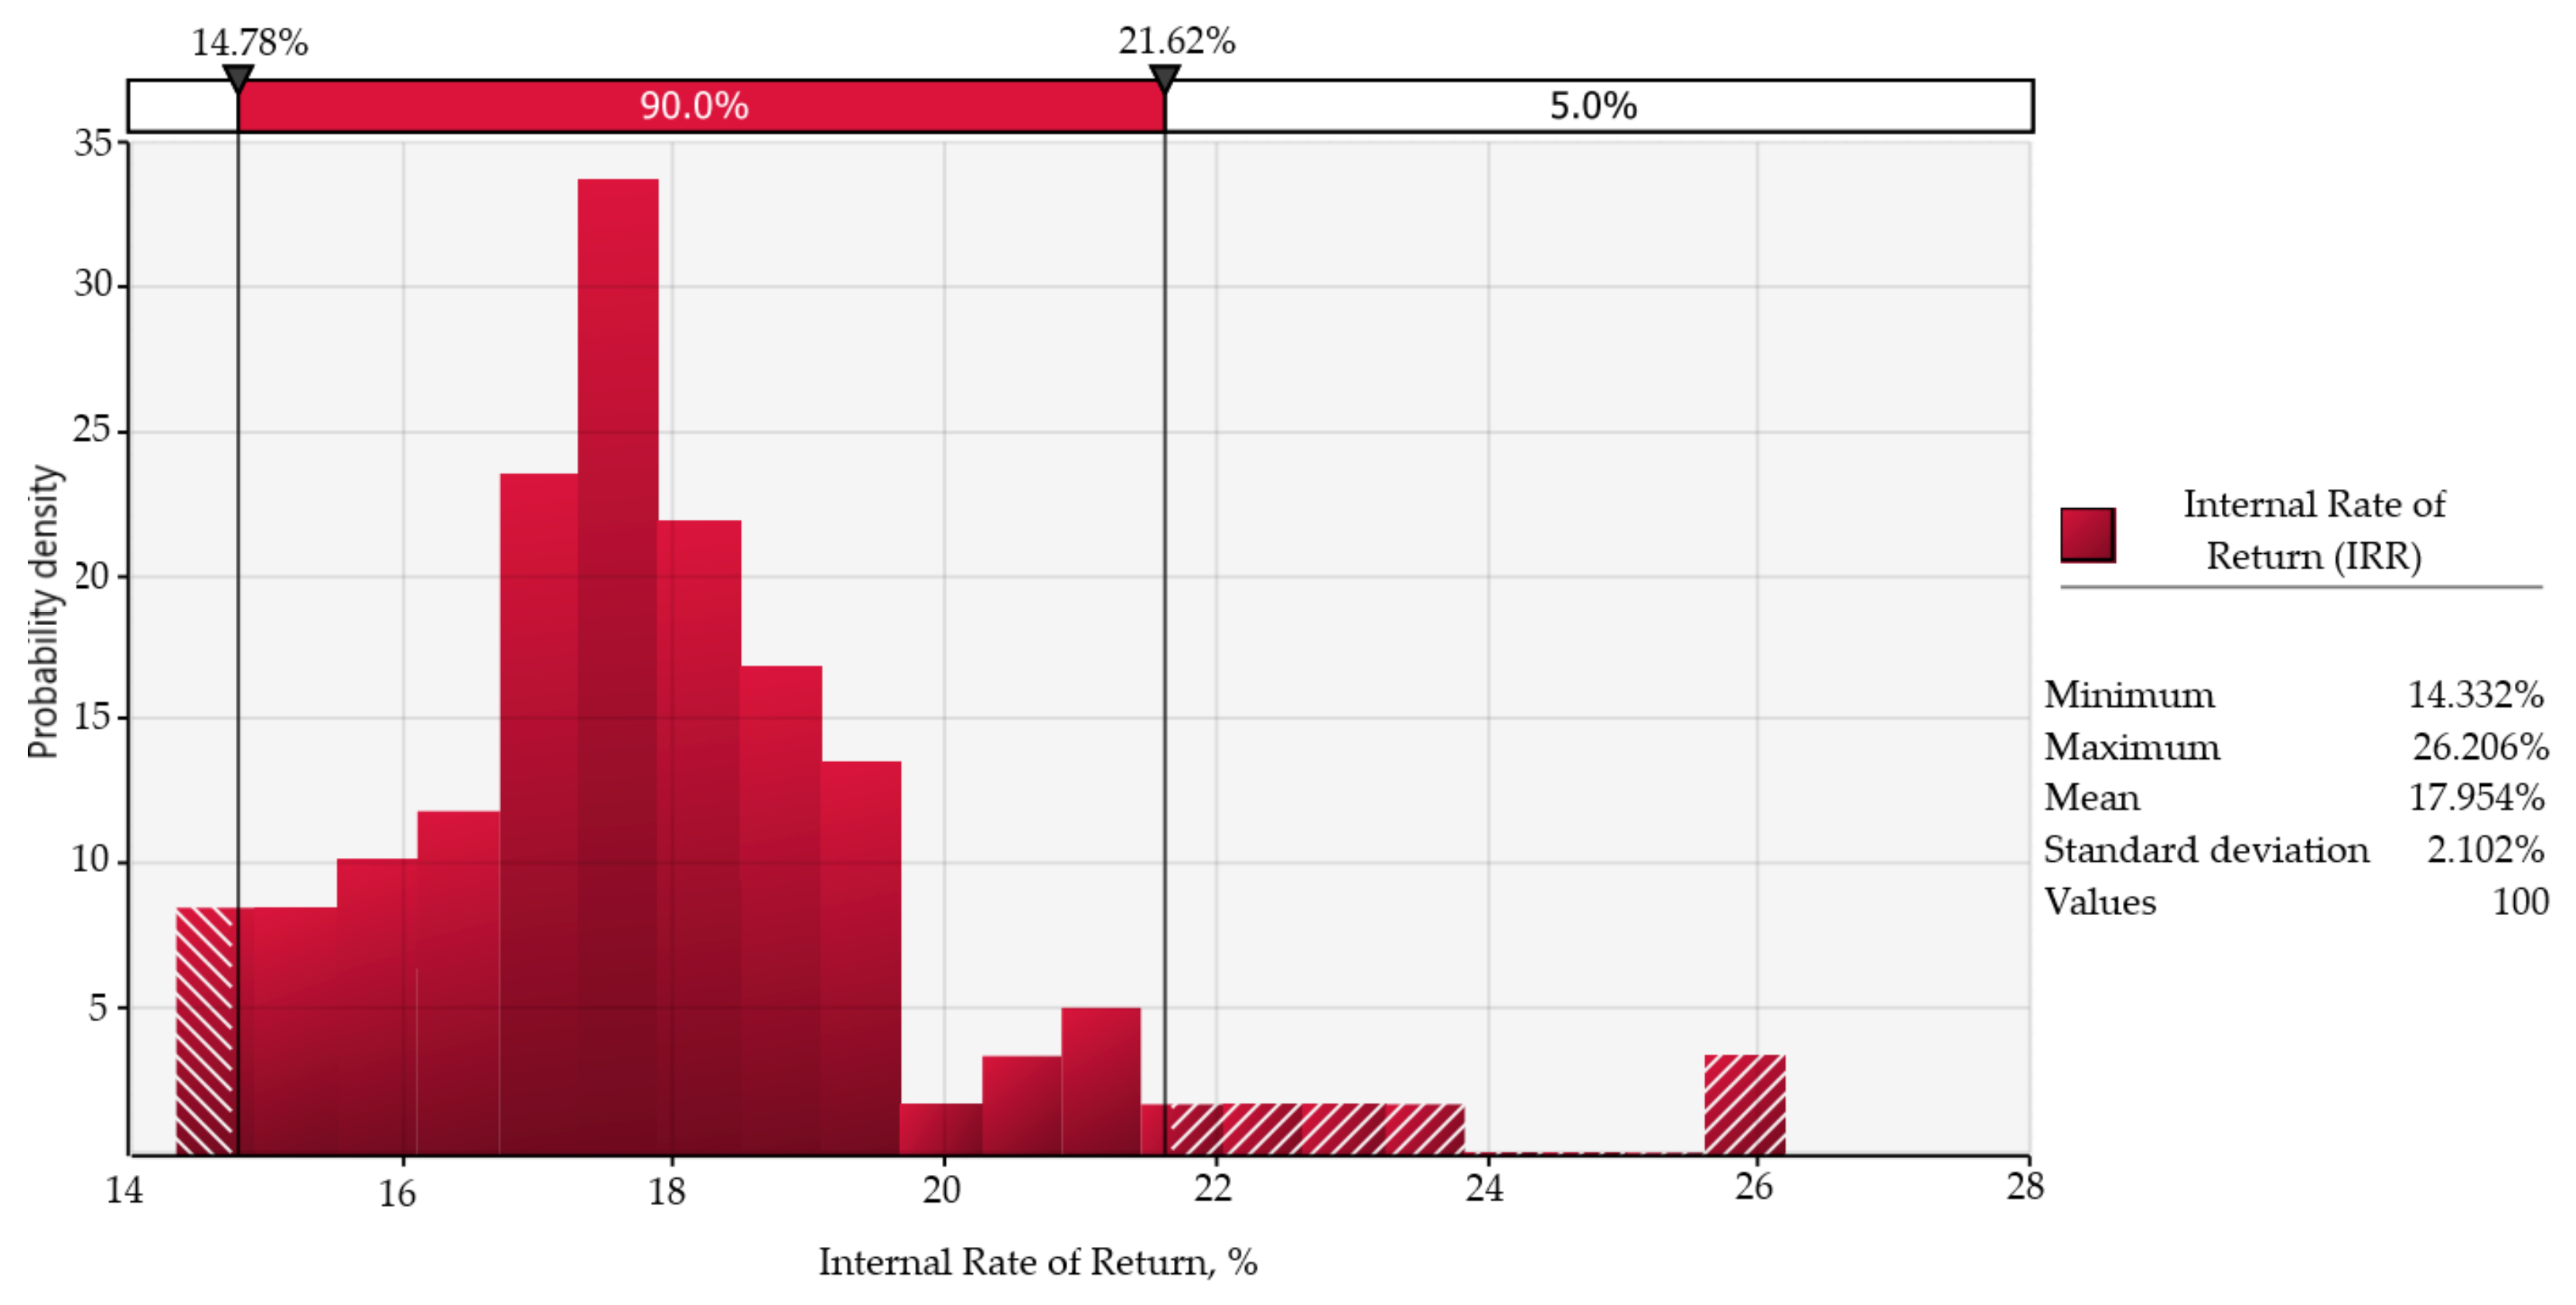
The last step of the assessment of economic impact was the uncertainty and sensitivity analysis of its variables. Sensitivity analysis involves studying how model input uncertainty can be apportioned to different sources of uncertainty in model inputs. It indicates exactly how much the IRR or NPV will change in response to a given change in a single input variable, with the others held constant. A Monte Carlo simulation was used to conduct an uncertainty analysis of the critical variables.
The programme used to carry out the sensitivity and uncertainty analysis was @RISK v7.5 from Palisade Corporation (Ithaca, NY, USA).
Figure 5 presents the internal rate of return (IRR) distribution after the Monte Carlo analysis of the virtual power plant. The mean of 17.95% was sensitively higher than the calculated 16%. Thus, the calculated IRR can be considered robust; the same was true for the NPV.
6. Conclusions
This paper presents a methodology to select the most exciting business models based on renewable energy and circular economy technologies within end-of-life coal mines to help develop a renewable-based-energy sector, promote sustainable local economic growth, and maximise the number of green and quality jobs.
This research’s most significant added value is the methodology developed to assess scenarios and micro-scenarios for end-of-life coal mines. The final results developed with this methodology have been carried out according to the experts’ knowledge and experience and are not site-specific. The developed methodology is an essential tool for assessing the potential of specific decommissioned mining plants. Each of the parameters of the analysed system is of significant importance and may influence the final results of the study and, above all, the selection of the most optimal technology.
To achieve this goal, first, a structural analysis was developed to select the technical variables that better identify this complex system and correctly identify interactions between technical variables. The structural analysis confirmed the importance of certain technical variables and revealed some technical variables that, due to their indirect effects, play a dominant role. This made it possible to compare the hierarchy of the technical variables in different classifications, and a range of relevant information was obtained, identifying the key variables of the system.
Second, a morphological analysis allowed the scenario space to be constructed, as it is the best method to explore the possible recombination of elements that make up the structural analysis. The scenario space was characterised by all the feasible combinations of system components. The scenarios obtained from this analysis were arranged and transformed into a list of relevant business models after eliminating some feasible scenarios to be developed without achieving any essential synergies from the end-of-life coal mines.
Third, a multicriteria assessment was developed to achieve this goal, based on the previously assessed relevant scenarios, considering the European Green Deal policies, technical variables that characterise end-of-life coal mine environments, the technology readiness level, the European taxonomy, synergistic potential, contributions to the circular economy, and sector coupling. Scenario and micro-scenario options from end-of-life coal mines in the process of phasing out were evaluated, assigning an average score for each policy. A table of classification profiles was created in comparison with the policy scenarios. Also, an assessment of the risks associated with uncertainty or incompatible alternatives was obtained using a scenario classification map based on the mean values and standard deviations of the results obtained for each policy.
Finally, result indicators were selected to analyse the alternative options derived from the justification approach, considering the targets set by the European Green Deal and related taxonomy and the regional policy indicators for the Just Transition Fund. While considering a portfolio of solutions (business models), none should be rejected, despite the results obtained being different for individual technologies. The site-specific requirements may differ due to the “weighting” of technology for individual locations.
The main initiative that can stimulate the regional economy, making it easier to maintain employment, is an eco-industrial park with a virtual power plant.
Eco-industrial parks (with virtual power plants) could be integrated and provide an attractive alternative for the generation of sustainable energy from renewable sources, innovative energy storage technologies, circular economy contributions, and synergies, producing the different types of goods needed for an industrial and social transition in the EU.
The transformation of coal mines into eco-industrial parks with sustainable energy could help mitigate climate change and reduce the unemployment created by the closure of coal mines. Economic impact assessments should then be developed to select the most attractive business models to fight against this situation.
However, “eco-industrial park” business plans must be supported with financial privileges, tax breaks, and other benefits to boost and diversify the area’s economy and growth of employment, attracting external investment. However, is that not the aim of the Just Transition Fund?
If these areas are to be developed according to business models, pre-investment preparations should be carried out. Specifically, a pre-feasibility study and a preliminary implementation plan should be developed for each case.
Nevertheless, it is envisaged that, according to the results of the evaluation of the direct result indicators presented in this research, preference should be given to eco-industrial parks (with a virtual power plant) plus a green hydrogen plant, followed by the molten salt plants. The other scenarios received similar scores and should be considered a complementary range of solutions for further analysis.
Regarding the results of the feasibility study, the financial outcomes of a virtual power plant are good, with an IRR of 16%. In addition, the sensitivity and uncertainty analysis demonstrate that the estimated figures are robust. The financial outcomes of the geothermal energy deployment are also positive. However, the IRR reduces to 13%, but in the case of a green hydrogen plant, the financial outcomes are adverse, and the investment is not feasible unless a specific subvention is obtained for its development. A 50% subvention aligning with big ticket projects within the Research Fund for Coal and Steel (RFCS) changes a green hydrogen plant into a desirable investment.
Addressing the limits of our research while considering a portfolio of business models, and although the results obtained are different for individual technologies, none should be rejected. The site-specific requirements may differ due to the “weighting” of technology for individual locations. The research started with the POTENTIALS RFCS project, which has already finished. It is currently being continued with the GreenJOBS RFCS project by developing two forward-facing business plans: a plan for a “virtual power plant” where the energy produced from renewable sources will be used to power electro-intensive industries and/or companies with constant energy consumption located close to coal mines, such as non-ferrous metal factories or data centres, or eventually sold to the grid; and a plan for a “green hydrogen plant”, where hydrogen (H2) will be produced by the electrolysis of water from the mine, and electricity produced from renewable sources. Further developments, such as the MINE-TO-H2 big ticket RFCS project, will use this last business plan to build a pilot project addressing the repurposing of a former coal mine into a 2.5 MW green hydrogen plant, scalable up to 5 MW, where green hydrogen for the passenger road transport sector will be produced using circular economy actions, such as using mine water for the electrolysis and electricity from a photovoltaic installation located in a former open-pit coal mine.
Thus, these RFCS projects represent the starting path for future research developments as well as outlining fundamental policy prescriptions in the form of possible roadmaps for updating territorial Just Transition plans. These are crucial for addressing evolving challenges and maintaining effectiveness in guiding the Just Transition process in former coal mining regions, providing valuable insights for embarking on these transition journeys. They demonstrate the significance of comprehensive strategies, stakeholder engagement, and the integration of economic, social, and environmental considerations in achieving a successful Just Transition. The aim is to complement or correct the different operations envisaged to propose initiatives that stimulate the regional economy, making it easier to maintain employment.


 ,
, 
