Article

Cluster Analysis and Macroeconomic Indicators and Their Effects on the Evolution of the Use of Clean Energies

by
Karime Chahuán-Jiménez
1,†,
Rolando Rubilar-Torrealba
2,*,†,
Hanns de la Fuente-Mella
3,† and
Valeska V. Geldres-Weiss
2,†
1
Escuela de Auditoría, Centro de Investigación en Negocios y Gestión Empresarial, Universidad de Valparaíso, Valparaíso 2362735, Chile
2
Departamento de Administración y Economía, Facultad de Ciencias Jurídicas y Empresariales, Universidad de La Frontera, Temuco 4811230, Chile
3
Instituto de Estadística, Facultad de Ciencias, Pontificia Universidad Católica de Valparaíso, Valparaíso 2340031, Chile
*
Author to whom correspondence should be addressed.
These authors contributed equally to this work.
Energies 2023, 16(22), 7561; https://doi.org/10.3390/en16227561
Submission received: 30 August 2023 / Revised: 25 September 2023 / Accepted: 29 September 2023 / Published: 14 November 2023
(This article belongs to the Collection Energy Transition towards Carbon Neutrality)

Abstract

:
The aim of this research is to relate clean energies, CO 2 emissions, and economic variables. Relationships can be generated that characterize countries that manage to relate the use of clean energy with GDP, economic openness, and economic growth. We employ a quantitative methodology that utilizes clustering techniques to identify distinct groups of countries based on their susceptibility to climate change impacts. Subsequently, we employ a generalized linear model approach to estimate the investment behaviors of these country groups in alternative energy sources in relation to CO 2 emissions and macroeconomic variables. The clusters reveal that the countries grouped in each cluster exhibit significantly distinct behaviors among the clusters. This differentiation is grounded in the countries under analysis, showing the evolution of the countries in terms of the use of clean energy and the emission of CO 2 in relation to macroeconomic variables. According to the conducted research, there are different groups with differentiated behavior in terms of energy consumption and CO 2 emissions, which implies the implementation of policies consistent with the development characteristics of the countries and how they cope with climate risk. Moreover, as a result of this research, a recommendation for policy makers could be that sustainable and clean development countries are based in three different sustainability dimensions: environmental, economic, and social.

1. Introduction

As per [1], the implementation of energy and environmental policies aims to contribute to economic growth [2] while ensuring a country’s cleanliness and environmental preservation. Their research establishes that the adoption of these policies has led to a substantial surge in per capita energy consumption, reaching elevated levels by international standards, attributed to the prevailing industrial structure. Nevertheless, noteworthy advancements have been observed in energy efficiency as well as carbon emissions (both per capita and per gross domestic product (GDP) unit), as outlined in [3,4,5]. Furthermore, production and trade activities consume extensive resources, exerting adverse influences on ecological quality. According to [6], clean energies play a significant role in mitigating environmental pollution over both short and long timeframes. Furthermore, production and trade activities consume extensive resources, exerting adverse influences on ecological quality.
Focusing on GDP as a contributor to environmental degradation, the theory of the environmental Kuznets curve (hereinafter EKC) explains that contamination intensifies during the preliminary stages of economic expansion until it hits a tipping point, where pollution decreases as income per capita rises. Another way to understand the explanatory variables behind environmental impacts is by using the STIRPAT model. The STIRPAT model is used with two main purposes: first, to predict environmental impacts based on key driving forces; and second, to estimate causal effects between the driving forces. One of the strengths of the STIRPAT model is that it does not assume a causal linkage between the drivers that lead to the impact. The STIRPAT model encourages consideration of cultural, institutional, and political factors as drivers of environmental impacts. Furthermore, population and affluence can be broken down into forms that have more social meaning. However, the full potential of the STIRPAT model and its value for unraveling and better understanding the technology variable is not fully understood since no comprehensive literature review is available [7,8].
The relationship among economic growth, total energy, and the consumption of non-renewable energy sources is positively correlated, as indicated by [9,10], and exhibits a non-linear nature, as emphasized by [11]. Furthermore, the conducted research suggests that while developed nations can adopt energy efficiency policies without compromising growth momentum and environmental preservation, the same methods might not be advisable for developing nations. In the case of the latter, according to [12], it might be more preferable for these countries to prioritize economic growth initially and address environmental concerns subsequently [13,14]. Additionally, the long-term elasticity of GDP growth concerning non-renewable energy consumption has been shown to be interdependent.
Through the emission of CO 2 and when aiming to minimize it, according to [15], over half of the investments in fossil fuels within the cost-minimization scenario are replaced by investments in nuclear capacity. Additionally, making similar investments in nuclear capacity under the scenarios of maximizing employment and maximizing GDP also leads to relatively substantial investments in fossil fuels, accompanied by significantly reduced investments in renewable energies. Moreover, as presented by [16], a unidirectional causal relationship exists among fossil fuel consumption, trade openness, carbon emissions, natural gas, and economic growth. These variables are considered in this investigation. According to [17], the estimated long-term elasticities of economic growth and carbon emissions indicate that both clean and non-clean energy consumption significantly impact economic growth, whereas carbon emission impedes it. The same authors’ results further reveal that economic growth, non-clean energy consumption, and the interaction between trade openness and non-clean energy consumption drive carbon dioxide emissions [18]. However, clean energy consumption has been observed to reduce carbon emissions. In the work of [19], they identify bidirectional causality between energy production and carbon dioxide emissions in the long-term trajectory. Additionally, the findings of [20] indicate that non-renewable energy deployment could be facilitated through economic development, carbon emission, financial development, and human capital.
According to [21], a significant challenge arises from the fact that economic growth exhibits a negative correlation with environmental quality, as the global economy heavily relies on fossil fuels to operate [22]. Furthermore, research conducted by [23,24,25] has yielded the following insights: (i) A cyclical relationship between CO 2 emissions and per capita GDP [26] is unveiled. This suggests that during the ascending phase of economic cycles, both economic growth [27] and CO 2 emissions increase. However, the latter can be forecast by utilizing GDP as a predictive indicator on a 1- to 2-year scale. (ii) Bidirectional causality exists over time between CO 2 emissions and per capita GDP. Furthermore, in line with the assertions of [28], real GDP and the energy growth rate exhibit a significant positive correlation while displaying an insignificant negative correlation with CO 2 emissions. This implies that CO 2 emissions cannot be curbed without having a detrimental impact on economic growth. Additionally, the results underscore the need to swiftly adopt alternative sources of clean energy to effectively mitigate CO 2 emissions without affecting economic growth.
Both GDP and per capita energy consumption, as evidenced by [29], exhibit a significant positive influence on the direct growth of residential energy consumption. Consequently, the national economy should foster healthy and sustainable growth to provide an economically conducive environment for energy transition. Simultaneously, residential consumption patterns should adopt more ecologically friendly practices to encourage the utilization of clean energy sources. This contrasts with the assertions of [30], which indicates that energy use exacerbates the ecological footprint. Moreover, real per capita GDP displays an inverted U-shaped relationship with the ecological footprint in oil-exporting countries and across the sample as a whole.
According to [17], despite the increased consumption of clean energy, a domestic demand persists for polluting energy sources. The preference for consuming these polluting energy sources necessitates both governmental intervention and further research efforts.
The use of electricity that is considered clean energy stands as a pivotal input for socio-economic development, and its demand is projected to increase rapidly across the globe, particularly in developing countries [31]. Additionally, this energy should be generated by clean resources, such as solar, water, etc.
In accordance with [32], the advantages of relying on natural resources in an advanced economy lie in the substantial capacity and political willingness to deploy relatively environmentally benign technologies.
Furthermore, the study by [33] and its empirical findings, linking the variables of real GDP, financial development, and total electricity consumption, establish a causality that runs from real GDP to total electricity consumption, and from financial development to real GDP. Additionally, [34] indicates that the correlation between the cyclicality of clean energy consumption and per capita GDP is more intricate across different groups of countries. As stated by [35], energy consumption has a negative impact on GDP for the global aggregate as well as for developing countries, but not for developed nations.
Research conducted by [36] identifies a positive relationship between financial market development and CO 2 emissions, particularly in cases where countries are undergoing low economic growth. This implies that the effect of financial market development does not exhibit a “boycott” relationship with CO 2 emissions when countries are experiencing lower levels of economic development, as highlighted by [37]. In this study, we also establish a correlation between the development of small and medium-sized enterprises (SMEs) and CO 2 emissions among OECD countries.
Taking into consideration the variable of trade openness, the authors of [38] found that foreign direct investment, trade openness [39], and carbon emissions decrease energy demand. Economic growth and clean energies have a positive impact on energy consumption. In the work of [13], economic growth and energy consumption were shown to increase CO 2 emissions, whereas financial development and trade openness mitigated them. Additionally, according to [14], trade openness raises CO 2 emissions, while urbanization leads to their reduction. According to [40], there is a statistically significant negative relationship between CO 2 emissions and both trade openness and economic growth.
As an example, research carried out in China by [41] showed that residential CO 2 emissions exhibit regional characteristics, and the effects of urbanization, energy intensity, and price elasticities vary across the three regions. Per capita GDP is a key factor that positively influences total residential CO 2 emissions [42]. The research findings of [14] support the argument that trade openness increases CO 2 emissions, while urbanization decreases them. This holds true for the countries under study, which are grouped within the G7. Furthermore, Ref. [43] identified reciprocal causality between renewable energy and CO 2 emissions in Romania and Slovakia, and unilateral causality between real per capita GDP and renewable energy in the Czech Republic, Romania, and Slovenia.
In the case of Brazil, according to [44], both pollutant emissions and trade openness have positive effects within the economic growth model [45]. According to [46], bidirectional causality exists from carbon dioxide emissions from cement production to trade openness.
In the context of the research findings presented by [47], trade openness is indeed identified as a cause of environmental degradation among the BRICS nations. Through the reduction in corruption, improvement in political stability, bureaucratic accountability, and enhanced law and order, it is established that “institutional quality” positively contributes to environmental sustainability [48]. The authors of [49] demonstrate through their results that both green trade and economic complexity individually have beneficial effects on the environment.
The relationships between the variables have been identified by different authors, indicating that there is a relationship between clean energies and macroeconomic variables. However, the linkage of these variables with different countries is not presented in their research. For this reason, we present a grouping according to the variables under study and their relationships.
According to cluster analysis, it is possible to identify four clusters: group 1 includes countries with low susceptibility to the effects of climate change, group 2 is composed of nations with a moderate-to-low risk profile, group 3 comprises countries facing a moderate-to-high level of risk, and group 4 encompasses nations facing high susceptibility to the effects of climate change.
Given the macroeconomic variables mentioned in the literature, the purpose of this research is to analyze and understand the interrelationships and effects of these variables on various aspects, such as economic growth, energy consumption, carbon emissions, trade openness, and environmental sustainability. The relationship between clean energy, CO 2 emissions, and macroeconomic variables will allow linking through clusters, and organization of the different countries according to the use of clean energy and CO 2 emissions. Therefore, the relationships between these variables could generate a new classification or grouping of countries, relating sustainable development with economic development.

2. Materials and Methods

The countries assessed for their vulnerability to climate change effects may exhibit diverse patterns in their energy investment policies. An essential aspect of this research is the quantitative assessment of these variations, providing insight into the distinctive strategies adopted by each country and their level of concern regarding perceived climate change risks. We used data from 175 countries with available information on the level of climate risk and variables in respect of alternative energy use to measure the behavior of different groups of countries in relation to the effect of global climate change. The CO 2 data and the other data used in the research were obtained from the official World Bank website: https://data.worldbank.org/ (accessed on 15 August 2023).
Figure 1 shows the total global CO 2 emissions. We can see that global CO 2 emissions have grown very strongly since the 2000s from 4 metric tons per capita to 4.75, stabilizing at this level in the mid-2010s. Since the Kyoto Protocol in 1997, emissions policies have been established and each participating country has implemented public policies according to its own development characteristics and economic objectives. To these, we can add the sustainable development initiatives promoted by the United Nations, which imply changes in public policies aimed at more sustainable energy systems over time.
Table 1 contains the main descriptive statistics of the variables used in the research, showing high variability in the data, which implies heterogeneous behavior of the countries within the sample. The research variables are alternative energy use, gross domestic product, CO 2 , CO 2 per capita, energy use per capita, energy use per USD 1000, proportion of urban population, imports, and exports.
Figure 2 shows an analysis of the main variables of the study, with the information being generated by the authors from the information obtained from the World Bank databases. Figure 2 shows in the upper triangle the correlations between the relevant variables under study, GDP, CO 2 , imports, exports, energy use per capita, alternative energy use, proportion of people in urban areas, and total energy use as kilogram oil equivalents, showing a measure of the linear relationship between the study variables. The scatter plots are displayed in the lower triangular part, allowing the linear and non-linear relationships between variables to be observed. In addition, a histogram of the respective variables is plotted on the diagonal, showing the distribution of the variables and providing information about their stochastic behavior.
The information contained in Figure 2 shows a strong correlation between some study variables such as GDP and CO 2 , which is to be expected given that economic growth implies higher energy use, which should have a positive impact on CO 2 emissions to the environment. We can also observe a high correlation between import and export variables, which is an indicator that is related to the levels of trade openness that the countries in the sample under study have. Although one of the variables could be omitted for technical reasons of multicollinearity, it is preferred in this case to keep both variables to carry out an analysis of the relationship with the international trade of the countries. Another element that has a high correlation is the relationship between energy per capita and the proportion of the urban population; with higher levels of urbanization, higher energy levels are required, and therefore, public policies must be able to cover this growing demand.
In this research, we employ a quantitative methodology that utilizes clustering techniques to identify distinct groups of countries based on their susceptibility to climate change impacts. Subsequently, we employ general linear modeling approaches to estimate the investment behaviors of these country groups in alternative energy sources. This approach enables us to gain a nuanced understanding of how countries make decisions regarding their energy investments in relation to their perceived risks of climate change effects.

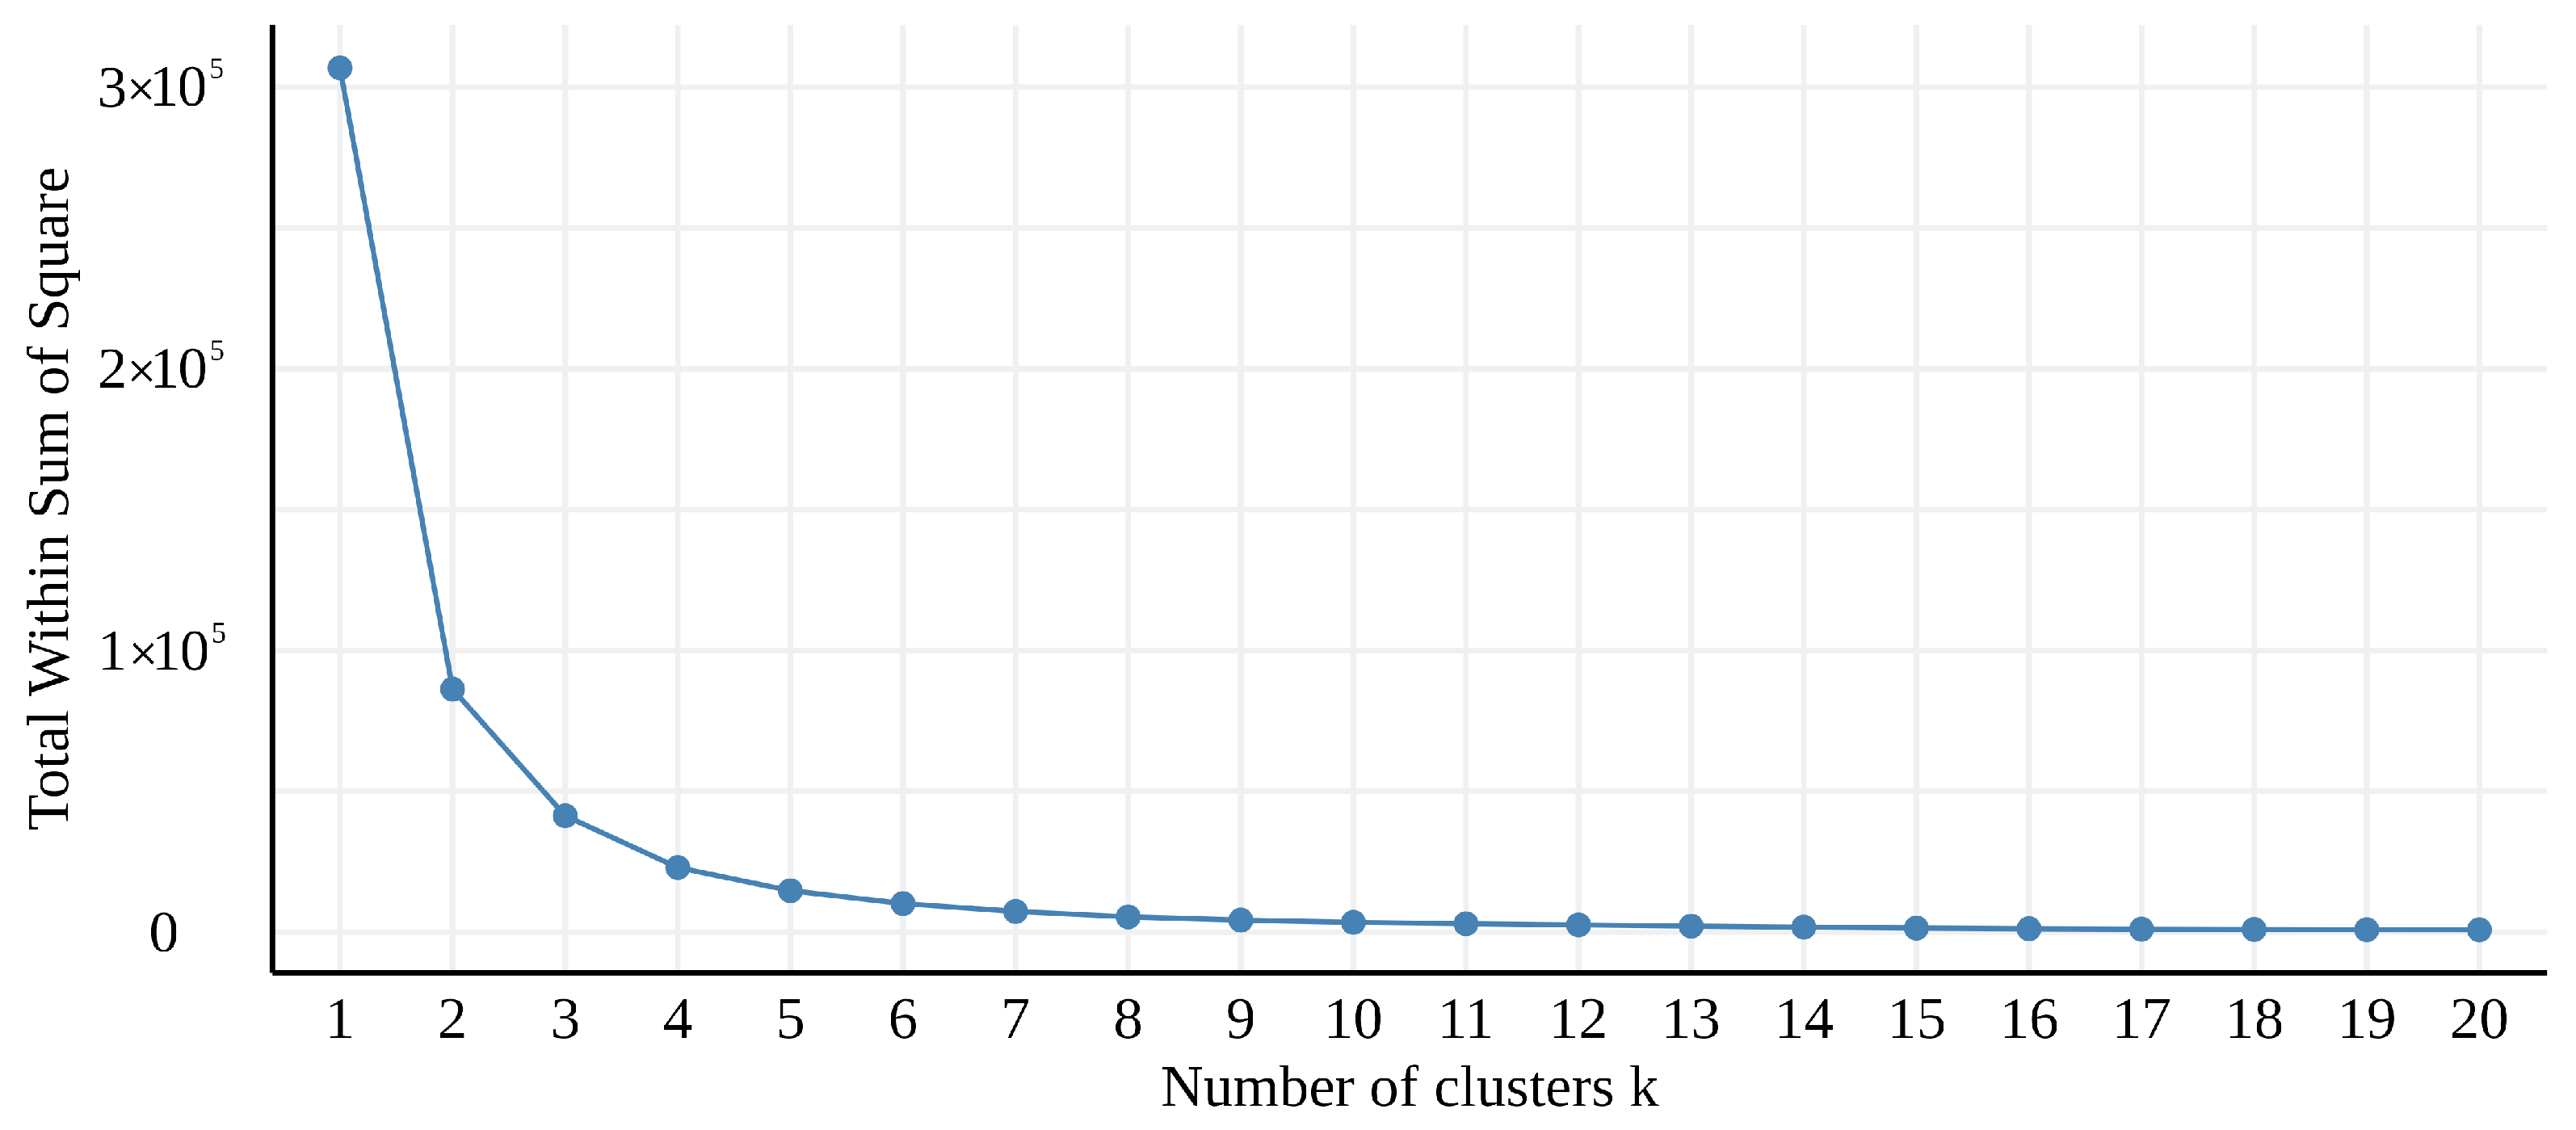
2.1. K-Means Clustering Algorithm

The first element that we develop is the classification of different countries by means of an unsupervised methodology, finding patterns in clustering without the intervention of researchers, which allows us to classify countries into a particular group based on objective criteria. For the classification of countries, we use the global climate risk index (CRI) [50], using the observed losses for the period 2000 to 2019 as a reference. This index corresponds to the analysis of 175 countries and considers the average deaths in the period of analysis, the sample rate per 100,000 inhabitants, and economic losses suffered in this period.
For a dataset C R I = c r i 1 , c r i 2 , c r i N , c r i n R , we define k-means clustering algorithm dependents on a set of centroids m 1 , m 2 , , m M and a subset C k C , which contains c r i i as
arg min C i = 1 N k = 1 M I ( c r i i C k ) | | x i m k | | 2 ,
where I ( C R I ) = 1 if C R I is true and 0 if not. In particular, we employ the k-means algorithm to determine the number of states present in the experimental data obtained in this research [51,52]. Figure 3 corresponds to the quadratic error depending on the number of clusters, where we can observe that as the grouping levels increase, the quadratic error decreases, which makes it necessary to introduce a criterion by which to define the optimal number of clusters and carry out an analysis of each one of them.
One of the criteria used for the determination of the cluster number is the elbow method [53], where the selection of the number implies the arrival at a plateau. In this sense, the number of clusters where flattening is observed corresponds to 4, and therefore four different groups are observed on which differentiated analyses can be carried out. With this information, we can define the countries that belong to each cluster shown in Table 2 and perform an independent analysis of them. This analysis strategy allows us to observe the behavior of the countries according to their characteristics in the face of climate risk, an important assumption being that the behavior of each cluster is different and independent of other clusters. In this conceptualizing, Cluster 1 encompasses countries with low susceptibility to the impacts of climate change, while Cluster 2 is composed of nations exhibiting a moderate-to-low risk profile. Cluster 3 comprises countries facing a moderate-to-high level of risk, and Cluster 4 encapsulates nations with high susceptibility to the effects of climate change.

2.2. Estimation Models

For the estimation of alternative energy use, we use the generalized linear model (GLM) approach [54,55]; because the data represent proportions, traditional linear model estimation methods are unsuitable for this task. Instead, estimation models based on binomial distributions are a viable alternative. This model fits the linear model of the dependent variable with a vector of covariates X, defined as
g E ( y ) = X T β , y F ,
where g ( · ) corresponds to the logit link function, and F corresponds to a binomial distribution family; β = β 1 , β 2 , β 3 , β 4 , β 5 , β 6 , β 7 , β 8 , β 9 , β 10 corresponds to the vector of parameters of the independent variables. Specifically, we define the model with the following variables.
  • Y i , t , c corresponds to alternative and nuclear energy (% of total energy use) in country i, in year t, from cluster c. This variable corresponds to an approximation of public policies oriented towards the use of energies that have more environmentally sustainable characteristics and that can have an effect on the control of the effects of climate change.
  • G D P i , t , c corresponds to gross domestic product (constant 2015 USD) in country i, in year t, from cluster c. GDP allows for a scaling of the size of the economy and its potential impact on variables related to environmental impact.
  • G D P g r o w t h i , t , c corresponds to the growth of the gross domestic product (annual %) in country i, in year t, from cluster c. GDP growth can be used to measure the dynamics of the impact of country variables on the environmental impact.
  • C O 2 i , t , c corresponds to the amount of C O 2 emitted into the environment (kt) in country i, in year t, from cluster c. This corresponds to the scale effect of emissions, which is related to the size and production technologies of the country.
  • C O 2 p c i , t , c corresponds to the amount of C O 2 per capita emitted into the environment (metric tons per capita) in country i, in year t, from cluster c. This variable corresponds to the intensity of the use of polluting technologies in the country’s production.
  • E n e r g i e _ p c i , t , c corresponds to the equivalent in kilograms of oil used in energy consumption per capita in country i, in year t, from cluster c. This variable allows us to understand the amount of energy consumption in the respective economy.
  • E n e r g i e i , t , c corresponds to the equivalent in kilograms of oil of energy consumption per USD 1000 GDP in country i, in year t, from cluster c. This variable allows us to understand the amount of energy consumption in the respective economy.
  • U r b a n i , t , c corresponds to the urban population (% of total population) in country i, in year t, from cluster c, which affects the need for energy use resulting in the use of polluting energies to supply that need.
  • I m p o r t s i , t , c corresponds to imports of goods and services (% of GDP) in country i, in year t, from cluster c, which indicates the country’s relationship with other countries to supply its consumption needs.
  • E x p o r t s i , t , c corresponds to exports of goods and services (% of GDP) in country i, in year t, from cluster c, which indicates the country’s relationship with other countries to supply products that are created within its borders.
  • Alt_En_lagi,t,c corresponds to the measured lag of the previous period of alternative and nuclear energy (% of total energy use) in country i, in year t, from cluster c. The lag allows us to understand that public measures or policies are characterized by long-term investments and the marginal effects of the period are what we can measure when considering this variable.

3. Results

In this section, we present the results of the econometric estimations for each of the four clusters. The four models consider all the explanatory variables defined in the previous section. Table 3 shows the results of the regression analysis estimations.
We can observe that the GDP variables in Cluster 1, Cluster 2, and Cluster 3 are significant, with a negative sign, while in Cluster 4 the variable is non-significant. The sign of these variables implies that a larger size of the economy has a negative impact on the proportion of alternative energies. In the case of the GDP growth variable, they are significant in the case of Cluster 3, with a negative sign. This allows us to deduce that the larger economies and the growth of the economies are essentially based on polluting energies.
When looking at the CO 2 level variables, we can observe significant results for Cluster 2 and Cluster 3, showing that the total emission level has a positive impact on the use of alternative energies. However, when looking at the CO 2 per capita variable for all clusters, we observe significant results with negative signs. This shows that the higher level of generation of polluting gases is at the expense of the proportion of non-polluting energies; however, a scale effect can be observed as the countries with the highest generation also seek alternative generation.
If we look at the energy use per capita, all clusters are positive and significant. In the case of total energy generated, Cluster 1, Cluster 2, and Cluster 3 are significant and negative. The higher level of energy use increases the level of use of alternative energies, with countries in search of higher-generation alternatives, and we can also observe the scale effect with the opposite sign.
In the case of the variable defining the proportion of the urban population, we observe Cluster 1, Cluster 2, and Cluster 4 as significant, but with different signs, which shows different behavior depending on the cluster. When we interpret imports and exports as the level of trade openness, we observe that in the case of Cluster 2, both variables are significant, and in the case of Cluster 4, the export variable is significant and negative.
Finally, in Table 4, we show the variance inflation factor (VIF), which indicates the multicollinearity effects of the research variables. We can observe serious multicollinearity problems for the variables CO 2 pc and Energie_pc for the Cluster 3 and Cluster 4 models (VIF ≥ 10), which implies a problem in the estimation of the variance of the model parameters. Despite the multicollinearity problem, we decided to keep the problematic variables, understanding that the main effect is a decrease in the significance level and that we can ignore variables that are relevant for the analysis. One element to take into consideration with the VIF analysis is that it is Cluster 3 and Cluster 4 that have this problem, being the country clusters that present the highest level of risk on climate change effects.

4. Discussion

The main contribution of this research is the provision of substantial evidence that countries exhibit distinct behaviors based on how they cope with the impacts of climate change, implying the utilization of divergent policies pertaining to alternative energy adoption and sustainable development.
However, there is a positive effect of the evolution of the countries in terms of the use of energy and the emission of CO 2 in relation to macroeconomic variables. Thus, there are different groups of countries with differentiated behavior in terms of energy consumption and CO 2 emissions, which implies the implementation of policies consistent with their development characteristics.
In accordance with the authors of [9], who posit a connection between economic growth and non-renewable energy consumption, as is also evidenced in this study, the clusters indicate that the scale of the economy is linked to the repercussions of non-renewable energy utilization. Hence, it becomes imperative to prioritize policies that advocate for the adoption of renewable energy sources, thereby aligning economic growth with a sustainable development agenda aimed at carbon emission reduction.
Regarding the utilization of increased energy linked to economic growth, this is shown by [16], where a relationship exists between economic openness, economic growth, and carbon emissions. However, this relationship is not uniform across all clusters. Strong evidence supports this connection for one particular cluster (Cluster 2, corresponding to countries with a low-to-medium climate change risk).
According to [17], both GDP and per capita energy consumption exhibit a substantial positive influence on the direct growth of residential energy consumption. This contrasts with the findings of our current investigation, wherein the utilization of alternative energy sources exhibits an opposite relationship to GDP; this demonstrates a significant negative influence on alternative energy usage. Both these observations lead us to infer that the energy growth trajectory across different countries is intertwined with the utilization of polluting energy sources.
The research results show that improvements in economic performance and public acceptance could be the key triggers to encourage stakeholders in respect of sustainable and clean development. The outcomes serve as a reference by which to enhance the overall decision-making process of industry stakeholders. Governments could adopt the recommendations to design policies and incentives that encourage the adoption of clean energy in real industry operation to spur economic development, without neglecting environmental well-being and jeopardizing social and economic benefits. Another way to provide recommendations for government policy making could be through investment-based policies delivered by governments, which may be more effective than production-based policies. However, the two could complement each other in order to form a welcoming and sustainable renewable energy microgrid market, which is not only relevant in economies based on the growth of GDP.

5. Conclusions

The research results confirm the existence of a dependence of CO 2 emissions on macroeconomic indicators such as gross domestic product, exports, imports, and different alternative uses of energy. The conclusions of this study are as follows: the higher the GDP growth of the countries in the sample, the lower their use of alternative energies. The greater the amount of CO 2 emitted into the environment, the more alternative energies used by countries in the sample. The more CO 2 per capita emitted into the environment, the lower the use of alternative energies by the countries in the sample. Finally, the greater the number of import levels for the countries in the sample, the lower the use of alternative energy. Based on the associated cluster and the level of climate change risk, the macroeconomic behavior varies.
Our findings have significant implications for academics, policymakers, and investors. Many of the countries considered in this research are rich in renewable resources. Therefore, government policymakers should encourage investors to promote the use of alternative energies. Wind, solar, or other potential renewable energy sources should be considered priorities for electricity generation.
Additionally, and from the perspective of decision-making policies at the governmental level, the governments of many countries are making efforts to reduce CO 2 emissions through regulatory measures. Environmental pollution from CO 2 emissions is not only an environmental problem, but also an economic one, as discussed and presented in this research.
Regarding limitations and future directions, it should be noted that other variables also affect the level of CO 2 emissions and alternative energy use; these were not taken into account in this research. As such, for the purposes of further research, it would be worth considering a larger dataset comprising not only macroeconomic indicators, but also social indicators, sustainability, community implications, technological, and other determinants. This would enable the identification of a multifactorial set of the most influential determinants and the development of tools for effective public and private decision making in the field of solving environmental problems related to CO 2 emissions and the impact on the use of alternative energies. In methodological terms, in future research and as a way to integrate both elements used in this research, it is proposed to use clusterwise regression as a way to build cluster datasets, where the countries’ clusters are characterized by their specific regression coefficients in a linear regression model.

Author Contributions

Data curation, H.d.l.F.-M., K.C.-J., V.V.G.-W. and R.R.-T.; formal analysis H.d.l.F.-M., K.C.-J., V.V.G.-W. and R.R.-T.; investigation, H.d.l.F.-M., K.C.-J., V.V.G.-W. and R.R.-T.; methodology, H.d.l.F.-M., K.C.-J. and R.R.-T.; writing—original draft, H.d.l.F.-M., K.C.-J., V.V.G.-W. and R.R.-T.; writing—review and editing, H.d.l.F.-M., K.C.-J., V.V.G.-W. and R.R.-T. All authors have read and agreed to the published version of the manuscript.

Funding

H. de la Fuente-Mella was partially supported by Grant FONDECYT REGULAR, 1230881, Agencia Nacional de Investigación y Desarrollo, Chile.

Data Availability Statement

The data used to support the findings of this study are available from the corresponding author upon request.

Conflicts of Interest

The authors declare no conflict of interest.

References

  1. Chang, Y. Energy and environmental policy. Singap. Econ. Rev. 2015, 60, 1550039. [Google Scholar] [CrossRef]
  2. Ali, A.; Radulescu, M.; Lorente, D.B.; Hoang, V.N.V. An analysis of the impact of clean and non-clean energy consumption on economic growth and carbon emission: Evidence from PIMC countries. Environ. Sci. Pollut. Res. 2022, 29, 51442–51455. [Google Scholar]
  3. Bölük, G.; Mert, M. The renewable energy, growth and environmental Kuznets curve in Turkey: An ARDL approach. Renew. Sustain. Energy Rev. 2015, 52, 587–595. [Google Scholar]
  4. de Carvalho, A.L.; Antunes, C.H.; Freire, F.; Henriques, C.O. A multi-objective interactive approach to assess economic-energy-environment trade-offs in Brazil. Renew. Sustain. Energy Rev. 2016, 54, 1429–1442. [Google Scholar]
  5. Ghorbal, S.; Soltani, L.; Ben Youssef, S. Patents, fossil fuels, foreign direct investment, and carbon dioxide emissions in South Korea. Environ. Dev. Sustain. 2022, 1–17. [Google Scholar] [CrossRef]
  6. Wang, W.; Rehman, M.A.; Fahad, S. The dynamic influence of renewable energy, trade openness, and industrialization on the sustainable environment in G-7 economies. Renew. Energy 2022, 198, 484–491. [Google Scholar]
  7. Vélez-Henao, J.A.; Vivanco, D.F.; Hernández-Riveros, J.A. Technological change and the rebound effect in the STIRPAT model: A critical view. Energy Policy 2019, 129, 1372–1381. [Google Scholar]
  8. Jiang, Y.; Batool, Z.; Raza, S.M.F.; Haseeb, M.; Ali, S.; Zain Ul Abidin, S. Analyzing the asymmetric effect of renewable energy consumption on environment in STIRPAT-Kaya-EKC framework: A NARDL approach for China. Int. J. Environ. Res. Public Health 2022, 19, 7100. [Google Scholar]
  9. Singh, K.; Vashishtha, S. Relationship trend of energy consumption and economic growth studies: A global examination based on bibliometric and visualization analysis. Int. J. Energy Sect. Manag. 2023, 17, 310–332. [Google Scholar]
  10. Zhang, X.; Wu, L.; Zhang, R.; Deng, S.; Zhang, Y.; Wu, J.; Li, Y.; Lin, L.; Li, L.; Wang, Y.; et al. Evaluating the relationships among economic growth, energy consumption, air emissions and air environmental protection investment in China. Renew. Sustain. Energy Rev. 2013, 18, 259–270. [Google Scholar]
  11. Husnain, M.I.U.; Beyene, S.D.; Aruga, K. Investigating the energy-environmental Kuznets curve under panel quantile regression: A global perspective. Environ. Sci. Pollut. Res. 2023, 30, 20527–20546. [Google Scholar]
  12. Menegaki, A.N. On energy consumption and GDP studies; A meta-analysis of the last two decades. Renew. Sustain. Energy Rev. 2014, 29, 31–36. [Google Scholar]
  13. Shahbaz, M.; Hye, Q.M.A.; Tiwari, A.K.; Leitão, N.C. Economic growth, energy consumption, financial development, international trade and CO2 emissions in Indonesia. Renew. Sustain. Energy Rev. 2013, 25, 109–121. [Google Scholar]
  14. Li, B.; Haneklaus, N. Reducing CO2 emissions in G7 countries: The role of clean energy consumption, trade openness and urbanization. Energy Rep. 2022, 8, 704–713. [Google Scholar] [CrossRef]
  15. Selçuklu, S.B.; Rodgers, M.D.; Movlyanov, A. Economically and environmentally sustainable long-term power system expansion. Comput. Ind. Eng. 2022, 164, 107892. [Google Scholar] [CrossRef]
  16. Kaur, J.; Singh, K.; Chaudhary, R.; Vashishtha, S. How economic growth, sustainable energy and carbon emission impact each other? New insights from India using ARDL approach. OPEC Energy Rev. 2023, 47, 216–238. [Google Scholar]
  17. Mamidi, V.; Marisetty, V.B.; Thomas, E.N. Clean energy transition and intertemporal socio-economic development: Evidence from an emerging market. Energy Econ. 2021, 101, 105392. [Google Scholar] [CrossRef]
  18. Agyeman, F.O.; Kedjanyi, E.A.G.; Sampene, A.A.; Dapaah, M.F.; Monto, A.R.; Buabeng, P.; Samekong, G.C.G. Exploring the nexus link of environmental technology innovation, urbanization, financial development, and energy consumption on environmental pollution: Evidence from 27 emerging economies. Heliyon 2023. [Google Scholar] [CrossRef]
  19. Danish; Zhang, B.; Wang, Z.; Wang, B. Energy production, economic growth and CO2 emission: Evidence from Pakistan. Nat. Hazards 2018, 90, 27–50. [Google Scholar]
  20. Wiredu, J.; Yang, Q.; Inuwa, U.L.; Sampene, A.K. Energy transition in Africa: The role of human capital, financial development, economic development, and carbon emissions. Environ. Sci. Policy 2023, 146, 24–36. [Google Scholar]
  21. Aluwani, T. Agricultural Economic Growth, Renewable Energy Supply and CO2 Emissions Nexus. Economies 2023, 11, 85. [Google Scholar]
  22. AlKhars, M.A.; Alwahaishi, S.; Fallatah, M.R.; Kayal, A. A literature review of the Environmental Kuznets Curve in GCC for 2010–2020. Environ. Sustain. Indic. 2022, 14, 100181. [Google Scholar]
  23. Khalfaoui, R.; Tiwari, A.K.; Khalid, U.; Shahbaz, M. Nexus between carbon dioxide emissions and economic growth in G7 countries: Fresh insights via wavelet coherence analysis. J. Environ. Plan. Manag. 2023, 66, 31–66. [Google Scholar] [CrossRef]
  24. Khan, S.A.R.; Zaman, K.; Zhang, Y. The relationship between energy-resource depletion, climate change, health resources and the environmental Kuznets curve: Evidence from the panel of selected developed countries. Renew. Sustain. Energy Rev. 2016, 62, 468–477. [Google Scholar]
  25. Moriarty, P.; Honnery, D. Are Energy Reductions Compatible with Economic Growth? Sustainability 2023, 15, 8043. [Google Scholar]
  26. Basu, S.; Roy, M.; Pal, P. Exploring the impact of economic growth, trade openness and urbanization with evidence from a large developing economy of India towards a sustainable and practical energy policy. Clean Technol. Environ. Policy 2020, 22, 877–891. [Google Scholar]
  27. Chahuán-Jiménez, K.; Rubilar-Torrealba, R.; Fuente-Mella, H.D.L. Market openness and its relationship to connecting markets due to COVID-19. Sustainability 2021, 13, 10964. [Google Scholar] [CrossRef]
  28. Chiu, C.L.; Chang, T.H. What proportion of renewable energy supplies is needed to initially mitigate CO2 emissions in OECD member countries? Renew. Sustain. Energy Rev. 2009, 13, 1669–1674. [Google Scholar]
  29. Sun, Y.; Jia, J.; Ju, M.; Chen, C. Spatiotemporal Dynamics of Direct Carbon Emission and Policy Implication of Energy Transition for China’s Residential Consumption Sector by the Methods of Social Network Analysis and Geographically Weighted Regression. Land 2022, 11, 1039. [Google Scholar] [CrossRef]
  30. Charfeddine, L.; Mrabet, Z. The impact of economic development and social-political factors on ecological footprint: A panel data analysis for 15 MENA countries. Renew. Sustain. Energy Rev. 2017, 76, 138–154. [Google Scholar]
  31. Diawuo, F.A.; Pina, A.; Baptista, P.C.; Silva, C.A. Energy efficiency deployment: A pathway to sustainable electrification in Ghana. J. Clean. Prod. 2018, 186, 544–557. [Google Scholar]
  32. Fæhn, T.; Bruvoll, A. Richer and cleaner—At others’ expense? Resour. Energy Econ. 2009, 31, 103–122. [Google Scholar]
  33. Jakovac, P.; Kutnjak, G.; Miljenovic, D. GDP, Electricity Consumption and Financial Development in Croatia: An Empirical Analysis. Montenegrin J. Econ. 2021, 17, 35–43. [Google Scholar] [CrossRef]
  34. Larrea, C. Crisis, estrategias de desarrollo y políticas económicas alternativas. Asedios Impos. 2005, 99. [Google Scholar]
  35. Chen, P.Y.; Chen, S.T.; Hsu, C.S.; Chen, C.C. Modeling the global relationships among economic growth, energy consumption and CO2 emissions. Renew. Sustain. Energy Rev. 2016, 65, 420–431. [Google Scholar]
  36. Li, Z.; Chen, W.T.; Chang, I.C.; Lee, J.M. Analysis of stock market development and CO2 emissions on OECD countries via an empirical model. CLEAN Soil Air Water 2020, 48, 1900360. [Google Scholar] [CrossRef]
  37. Halkos, G.E.; Tzeremes, N.G. The effect of electricity consumption from renewable sources on countries’ economic growth levels: Evidence from advanced, emerging and developing economies. Renew. Sustain. Energy Rev. 2014, 39, 166–173. [Google Scholar] [CrossRef]
  38. Sbia, R.; Shahbaz, M.; Hamdi, H. A contribution of foreign direct investment, clean energy, trade openness, carbon emissions and economic growth to energy demand in UAE. Econ. Model. 2014, 36, 191–197. [Google Scholar] [CrossRef]
  39. Chahuán-Jiménez, K. Correlation between the djsi chile and the financial indices of chilean companies. Int. J. Financ. Stud. 2020, 8, 74. [Google Scholar] [CrossRef]
  40. Udemba, E.N.; Güngör, H.; Bekun, F.V.; Kirikkaleli, D. Economic performance of India amidst high CO2 emissions. Sustain. Prod. Consum. 2021, 27, 52–60. [Google Scholar] [CrossRef]
  41. Miao, L.; Gu, H.; Zhang, X.; Zhen, W.; Wang, M. Factors causing regional differences in China’s residential CO2 emissions—Evidence from provincial data. J. Clean. Prod. 2019, 224, 852–863. [Google Scholar]
  42. Al-Mulali, U.; Sheau-Ting, L. Econometric analysis of trade, exports, imports, energy consumption and CO2 emission in six regions. Renew. Sustain. Energy Rev. 2014, 33, 484–498. [Google Scholar] [CrossRef]
  43. Bayar, Y.; Sasmaz, M.U.; Ozkaya, M.H. Impact of trade and financial globalization on renewable energy in EU transition economies: A bootstrap panel granger causality test. Energies 2020, 14, 19. [Google Scholar] [CrossRef]
  44. Hdom, H.A.; Fuinhas, J.A. Energy production and trade openness: Assessing economic growth, CO2 emissions and the applicability of the cointegration analysis. Energy Strategy Rev. 2020, 30, 100488. [Google Scholar]
  45. Sinha, A.; Shahbaz, M.; Balsalobre, D. Exploring the relationship between energy usage segregation and environmental degradation in N-11 countries. J. Clean. Prod. 2017, 168, 1217–1229. [Google Scholar]
  46. Bekun, F.; Alola, A.; Gyamfi, B.; Kwakwa, P.; Uzuner, G. Econometrics analysis on cement production and environmental quality in European Union countries. Int. J. Environ. Sci. Technol. 2023, 20, 4265–4280. [Google Scholar]
  47. Chhabra, M.; Giri, A.K.; Kumar, A. Do trade openness and institutional quality contribute to carbon emission reduction? Evidence from BRICS countries. Environ. Sci. Pollut. Res. 2023, 30, 50986–51002. [Google Scholar]
  48. Farooq, U.; Tabash, M.I.; Anagreh, S.; Al-Rdaydeh, M.; Habib, S. Economic growth, foreign investment, tourism, and electricity production as determinants of environmental quality: Empirical evidence from GCC region. Environ. Sci. Pollut. Res. 2023, 30, 45768–45780. [Google Scholar]
  49. Lee, C.C.; Olasehinde-Williams, G.; Gyamfi, B.A. The synergistic effect of green trade and economic complexity on sustainable environment: A new perspective on the economic and ecological components of sustainable development. Sustain. Dev. 2023, 31, 976–989. [Google Scholar] [CrossRef]
  50. Eckstein, D.; Künzel, V.; Schäfer, L. The Global Climate Risk Index 2021; Germanwatch: Bonn, Germany, 2021. [Google Scholar]
  51. Likas, A.; Vlassis, N.; Verbeek, J.J. The global k-means clustering algorithm. Pattern Recognit. 2003, 36, 451–461. [Google Scholar] [CrossRef]
  52. Mohamad, I.B.; Usman, D. Standardization and its effects on K-means clustering algorithm. Res. J. Appl. Sci. Eng. Technol. 2013, 6, 3299–3303. [Google Scholar] [CrossRef]
  53. Kodinariya, T.M.; Makwana, P.R. Review on determining number of Cluster in K-Means Clustering. Int. J. 2013, 1, 90–95. [Google Scholar]
  54. McCullagh, P. Generalized Linear Models; Routledge: Oxfordshire, UK, 2019. [Google Scholar]
  55. Nelder, J.A.; Wedderburn, R.W. Generalized linear models. J. R. Stat. Soc. Ser. A Stat. Soc. 1972, 135, 370–384. [Google Scholar] [CrossRef]
Figure 1. CO 2 emissions worldwide, measured in metric tons per capita.
Energies 16 07561 g001
Figure 2. Correlation, scatter plots, and histograms of the main research variables.
Energies 16 07561 g002
Figure 3. Quadratic error as a function of the number of clusters.
Energies 16 07561 g003
Table 1. Main descriptive statistics of the sample.
VariableMeanStd. Dev.MinMax
Alternative energies6.64%10.28%0%71.54%
GDP 2.04 × 10 11 6.80 × 10 11 2.16 × 10 7 1.63 × 10 13
CO 2 122,128.5562,835.10 1.09 × 10 7
CO 2 per capita4.165.49047.65
Energy per capita2220.012598.299.5721,420.63
Energy total per USD 1000145.21109.254.44990.07
Urban population48.11%24.42%2.07%100%
Imports40.23% 25.56%0.02%209.01%
Exports35.07%26.32%0.01%228.99%
Table 2. List of countries and clusters to which they belong. Central African Republic (C.A.R.), Cote d’Ivoire (C. I.), Marshall Islands (M. I.), Trinidad and Tobago (T. and T.), United Arab Emirates (U. A. E.), Antigua and Barbuda (A. and B.), Bosnia and Herzegovina (B. and H.), Dominican Republic (D. R.), New Zealand (N. Z.), Sierra Leone (S. L.), Solomon Islands (S. I.), South Africa (S. A.), St. Vincent and the Grenadines (St. V. and G.), United Kingdom (U. K.), Russian Federation (R. F.), Congo, Dem. Rep. (C. D. R.), North Macedonia (N. M.), Papua New Guinea (P. N. G.), St. Kitts and Nevis (St. K. and N.).
CountryClusterCountryClusterCountryClusterCountryCluster
Armenia1Belgium2St. Lucia2Burkina Faso4
Azerbaijan1B. and H.2St. V. and G.2Canada4
Bahrain1Brazil2Sudan2Chad4
Barbados1Bulgaria2Switzerland2Comoros4
Belarus1Burundi2Tonga2C. D. R.4
Benin1Chile2Uganda2Denmark4
Botswana1China2U. K.2Ecuador4
Brunei1Colombia2Vanuatu2Eritrea4
Cabo Verde1Costa Rica2Yemen2Eswatini4
Cameroon1Czechia2Afghanistan3Georgia4
C. A. R.1Djibouti2Australia3Ghana4
C. I.1D. R.2Bangladesh3Guinea-Bissau4
Cyprus1Ethiopia2Belize3Guyana4
Egypt1Greece2Bolivia3Iran4
Estonia1Honduras2Cambodia3Ireland4
Finland1Hungary2Croatia3Israel4
Gabon1Indonesia2Dominica3Kiribati4
Guinea1Jamaica2El Salvador3Kyrgyz4
Iceland1Japan2Fiji3Lebanon4
Iraq1Kenya2France3Lesotho4
Jordan1Korea, R.2Germany3Lithuania4
Kazakhstan1Lao PDR2Grenada3Luxembourg4
Kuwait1Latvia2Guatemala3Malaysia4
Liberia1Malawi2Haiti3Mali4
Libya1Mauritania2India3Mauritius4
Maldives1Mexico2Italy3Morocco4
Malta1Micronesia2Madagascar3Nigeria4
M. I.1Moldova2Mozambique3N. M.4
Norway1Mongolia2Myanmar3Panama4
Qatar1Namibia2Nepal3P. N. G.4
Seychelles1Netherlands2Oman3Rwanda4
Singapore1N. Z.2Pakistan3Saudi Arabia4
Surinam1Nicaragua2Philippines3Senegal4
Sweden1Niger2Portugal3Slovak4
Timor-Leste1Paraguay2Puerto Rico3South Sudan4
Togo1Peru2R. F.3St. K. and N.4
T. and T.1Poland2Spain3Tanzania4
U. A. E.1Romania2Sri Lanka3Tunisia4
Uzbekistan1Samoa2Thailand3Turkiye4
Venezuela1Serbia2Vietnam3Tuvalu4
Angola2S. L.2Zimbabwe3Ukraine4
A. and B.2Slovenia2Albania4Uruguay4
Argentina2S. I.2Algeria4Zambia4
Austria2S. A.2Bhutan4
Table 3. Model estimation of Cluster 1, Cluster 2, Cluster 3, and Cluster 4.
Cluster 1Cluster 2Cluster 3Cluster 4
GDP−2.58 × 10 12 ***−2.80 × 10 13 ***−9.28 × 10 13 ***8.58 × 10 14
(−4.83)(−3.53)(−10.86)(0.47)
GDPgrowth−1.85 × 10 3 1.48 × 10 3 −7.75 × 10 3 *2.79 × 10 3
(−0.54)(0.58)(−2.44)(1.12)
CO 2 5.73 × 10 7 4.59 × 10 7 ***8.21 × 10 7 ***8.38 × 10 7
(0.40)(5.09)(9.77)(1.92)
CO 2 pc−0.091 **−0.213 ***−0.195 ***−0.298 ***
(−2.67)(−5.64)(−4.94)(−4.65)
Energie_pc0.32 × 10 4 *3.75 × 10 4 ***2.39 × 10 4 **5.24 × 10 4 *
(2.02)(4.48)(2.73)(2.57)
Energie−3.03 × 10 3 ***−1.55 × 10 3 **−2.87 × 10 3 ***0.629 × 10 3
(−5.51)(−3.10)(−8.38)(1.61)
Urban−0.024 **0.009 **−0.0030.018 *
(−2.75)(2.82)(−0.39)(2.50)
Imports1.36 × 10 3 −6.51 × 10 3 ***−1.44 × 10 3 1.34 × 10 3
(0.47)(−3.85)(−0.60)(0.87)
Exports−0.0030.005 ***0.003−0.008 ***
(−0.75)(3.48)(1.25)(−3.59)
Alt_En_lag1.7172.459 *4.621 ***5.388 ***
(1.89)(2.14)(6.79)(12.46)
Constant0.360−4.614 ***−1.315−3.407 ***
(0.61)(−21.27)(−1.84)(−10.36)
N of observations650980590729
t statistics in parentheses. * p < 0.05, ** p < 0.01, *** p < 0.001.
Table 4. Variance inflation factors of the research variables.
VariablesCluster 1Cluster 2Cluster 3Cluster 4
GDP 3.8 5.32 3.22 5.41
GDPgrowth 1.03 1.11 1.18 1.10
CO 2 2.44 5.21 2.10 3.61
CO 2 pc 7.26 12.98 55.79 43.77
Energie_pc 7.44 14.79 63.5 54.32
Energie 1.62 1.62 1.38 2.10
Urban 3.85 2.21 4.16 2.43
Imports 7.26 4.16 4.34 5.30
Exports 9.15 4.53 4.14 6.40
Alt_En_lag 4.45 1.36 5.34 1.91
Disclaimer/Publisher’s Note: The statements, opinions and data contained in all publications are solely those of the individual author(s) and contributor(s) and not of MDPI and/or the editor(s). MDPI and/or the editor(s) disclaim responsibility for any injury to people or property resulting from any ideas, methods, instructions or products referred to in the content.

