Article

Assessment of Co-Gasification Methods for Hydrogen Production from Biomass and Plastic Wastes

by
Jonah M. Williams
1,* and
A. C. (Thanos) Bourtsalas
1,2,*
1
Department of Earth and Environmental Engineering, Columbia University, New York, NY 10027, USA
2
Earth Engineering Center, Columbia University, New York, NY 10027, USA
*
Authors to whom correspondence should be addressed.
Energies 2023, 16(22), 7548; https://doi.org/10.3390/en16227548
Submission received: 21 October 2023 / Revised: 8 November 2023 / Accepted: 10 November 2023 / Published: 13 November 2023
(This article belongs to the Special Issue Techno-Economic Analysis and Optimization for Energy Systems)

Abstract

:
In recent decades, economic development and population growth has been accompanied by the generation of billions of tonnes of solid residues or municipal “wastes”, a substantial portion of which is composed of plastics and biomass materials. Combustion-based waste-to-energy is a viable and mature method of extracting calorific value from these end-of-life post-recyclable materials that are otherwise landfilled. However, alternative thermochemical methods, such as gasification, are becoming attractive due to the ability to synthesize chemical precursors for supply chain recirculation. Due to the infancy of gasification technology deployment, especially in the context of anthropogenic CO2 emission reduction, additional systems engineering studies are necessary. Herein, we conduct an attributional life cycle analysis to elucidate the syngas production and environmental impacts of advanced thermochemical gasification methods for the treatment of biomass and plastic wastes obtained from municipal solid wastes, using a comprehensive thermodynamic process model constructed in AspenTech. Feedstock composition, process parameters, and gasification methods are varied to study the effects on syngas quality, yield, power generation potential, and overall greenhouse gas emissions. Steam-based gasification presents up to 38% reductions in CO2 emissions when compared to conventional thermochemical methods. Using gasifier-active materials, such as metal hydroxides, can also further reduce CO2 emissions, and realizes a capture load of 1.75 tonnes of CO2 per tonne of plastic/stover feedstock. This design alteration has implications for reductions in CAPEX due to the mode of CO2 capture utilized (e.g., solid sorbent vs. liquid SELEXOL). The use of renewable energy to provide a method to generate steam for this process could make the environmental impact of such MSW gasification processes lower by between 60–75% tonnes of CO2 per tonne of H2. Overall, these results can be used to inform the guidance of advanced waste gasification methods as a low-carbon transition towards a circular economy.

1. Introduction

Humanity’s dependence on plastic since the oil boom in the first half of the 20th century has gone hand-in-hand with many of the technological advancements society enjoys today [1]. Although methods of recycling exist to re-purpose waste plastics into virgin materials, a majority of used plastics are either disposed of in a managed fashion (e.g., combustion-based waste to energy or landfilling) or improperly disposed of (open dumping or ocean dumping) [2,3,4]. In the U.S., in 2018 alone, about 35,680K tonnes of plastic were generated and of that amount, 26,970K U.S. tons were landfilled (75.5%) [2]. Globally, the amount landfilled is closer to 350 million tonnes per year, and global plastic production is projected to grow at a rate of about 15 million tonnes per year due to increased industrialization [5,6]. The staggering issue of plastics generation and their longevity has led to the development of recycling programs to offset the usage of virgin polymers. However, not all plastics can be recycled, as their relative complexity, contamination, accessibility, heavy metal content, etc., make it more challenging [5,7,8]. For example, plastic food containers can be challenging to mechanically recycle due to the presence of residual food wastes. This leaves few alternatives for dealing with the issues of growing plastic pollution. Additionally, China recently enacted its “National Sword” policy (2017), decreeing that it will no longer import Western recycling materials [9]. This has severely impacted the global flows of recyclables, and furthers the need for interim technologies to mitigate the sheer volume of plastics that are landfilled. One such method is Waste-to-Energy (WtE) processes, which allow the recovery of calorific value in the form of power and/or fuels from waste streams through combustion, gasification, or pyrolysis [10].
Ciuffi et al. (2020) enumerate many disposal pathways for MSW plastics. The first two, primary and secondary, include mechanical recycling, which is applicable only with pure, point-source separated feedstocks. The tertiary recycling method, WtE, provides a solution for contaminated bulk MSWs that can be continually processed and incinerated [11]. Among the WtE processes listed, gasification shows clear advantages, as a high quality syngas rich in CO/H2 can be recovered (Table 1) [12]. This syngas can then be utilized in heat-recovery operations or as a precursor to downstream fuels and polymer synthesis processes (e.g., Fischer–Tropsch). Although the technology maturity is currently low, gasification facilities for the treatment of MSWs show future promise, especially in the context of a circularized and constrained carbon economy for the production of chemical precursors for supply chain recirculation. Currently, there are many types of gasification reactors and process schemes that can be used generate synthesis gas. For high-carbon feedstocks such as coal or biomass, there is much flexibility in the type of gasifier that can be used. For MSW streams, which usually have a medium gross calorific value, the best type of gasifier to use is likely a moving-bed type, where the waste is pre-pulverized and fluidized in the gasifier with an oxidant. This allows for lower residence times, increased char and tar cracking, higher temperatures, and overall better conversions and volatilization. Gasifiers typically run at elevated temperatures (>1000 °C) and pressures greater than 50 bar to effectively convert the feedstocks. Although H2 and CO are the primary syngas components, CO2 is also produced during gasification along with partially oxidized sulfur species (H2S and COS), chlorides (HCl, Cl), and trace heavy metals. The gasification of MSWs is poised to generate more hazardous metals and species, such as dioxins and chloro-compounds due to the wide variability of the feed based on the addition refuse components found with the plastics in the feed [13,14,15].
The gasifier can be operated in many different oxidant modes such as air-blown, oxygen-blown, steam, and sorbent-based gasification (Figure 1). Air-blown gasifiers are the most widely used, are generally inexpensive relative to the other methods; they have a simplistic reactor design but produce low-value syngas (low LHV) with larger carbon emissions. Oxygen-blown gasifiers produce high-purity syngas with a high LHV with lower pollutant levels; however, a full-scale Air Separation Unit (ASU) is needed to provide the oxidant charge. Steam gasification uses superheated or supercritical steam as the oxidant, which can produce a high hydrogen content in the syngas, increased char and tar cracking, which leads to higher gas yields; however, greater energy needs are necessary as the overall process is endothermic when steam is used [11,16]. Lastly, sorbent-based gasification utilizes catalytically active gasifier bed materials that aid in both feedstock conversion and CO2 sequestration in the form of metal (M) carbonates M(CO3)x [17]. In situ carbon capture is very attractive as it has implications for the cost reduction of syngas cleanup downstream; however, external heat needs to be supplied to the gasifier due to the slightly endothermic nature of the reactions. Additionally, due to the large volumes and reserves of alkaline waste materials that can act as gasifier-active species (e.g., olivine, serpentine, portlandite, etc.), the motivation to run these gasification systems is increasing. Greater hydrogen yields can theoretically be obtained due to the participation of the OH ions in the reaction, as exemplified with the alkaline thermal treatment of portlandite below: [18,19]
Ca(OH)2 + Carbon (C) + H2O → CaCO3 + 2H2
Previous studies have tried to compare different gasification models in the context of either biomass, coal, or petroleum coke gasification, but few examine it in the context of MSWs, especially with an underlying assessment of emissions metrics [20,21,22,23]. Additionally, most do not consider models that combine upstream gasification with downstream gas scrubbing, sulfur removal, and heat recovery units [24,25]. In order to address this need, this study compares these four viable promising gasification methods in the context of MSW treatment and examines the ramifications of each from a comprehensive thermodynamic system engineering perspective. Hydrogen production and purification is carefully examined with respect to these thermochemical conversion cases as an alternative to the most conventional method of producing H2, steam methane reforming (SMR), which is CO2-intense. Due to the growing interest in and the need to reduce anthropogenic CO2 emissions, this model also considers cases with advanced point-source carbon capture systems using commercialized physisorption thermal-swing processes. Materials balances were produced from the AspenTech gasification combined cycle simulations for six individual cases. All cases considered the same general process configuration, where the main difference was the type of feedstock or method of gasification. Overall, this study represents the development and assessment of a complex thermodynamic MSW gasification model, which considers the production of hydrogen while capturing and producing a pure stream of CO2 for utilization or storage.

2. Materials and Methods

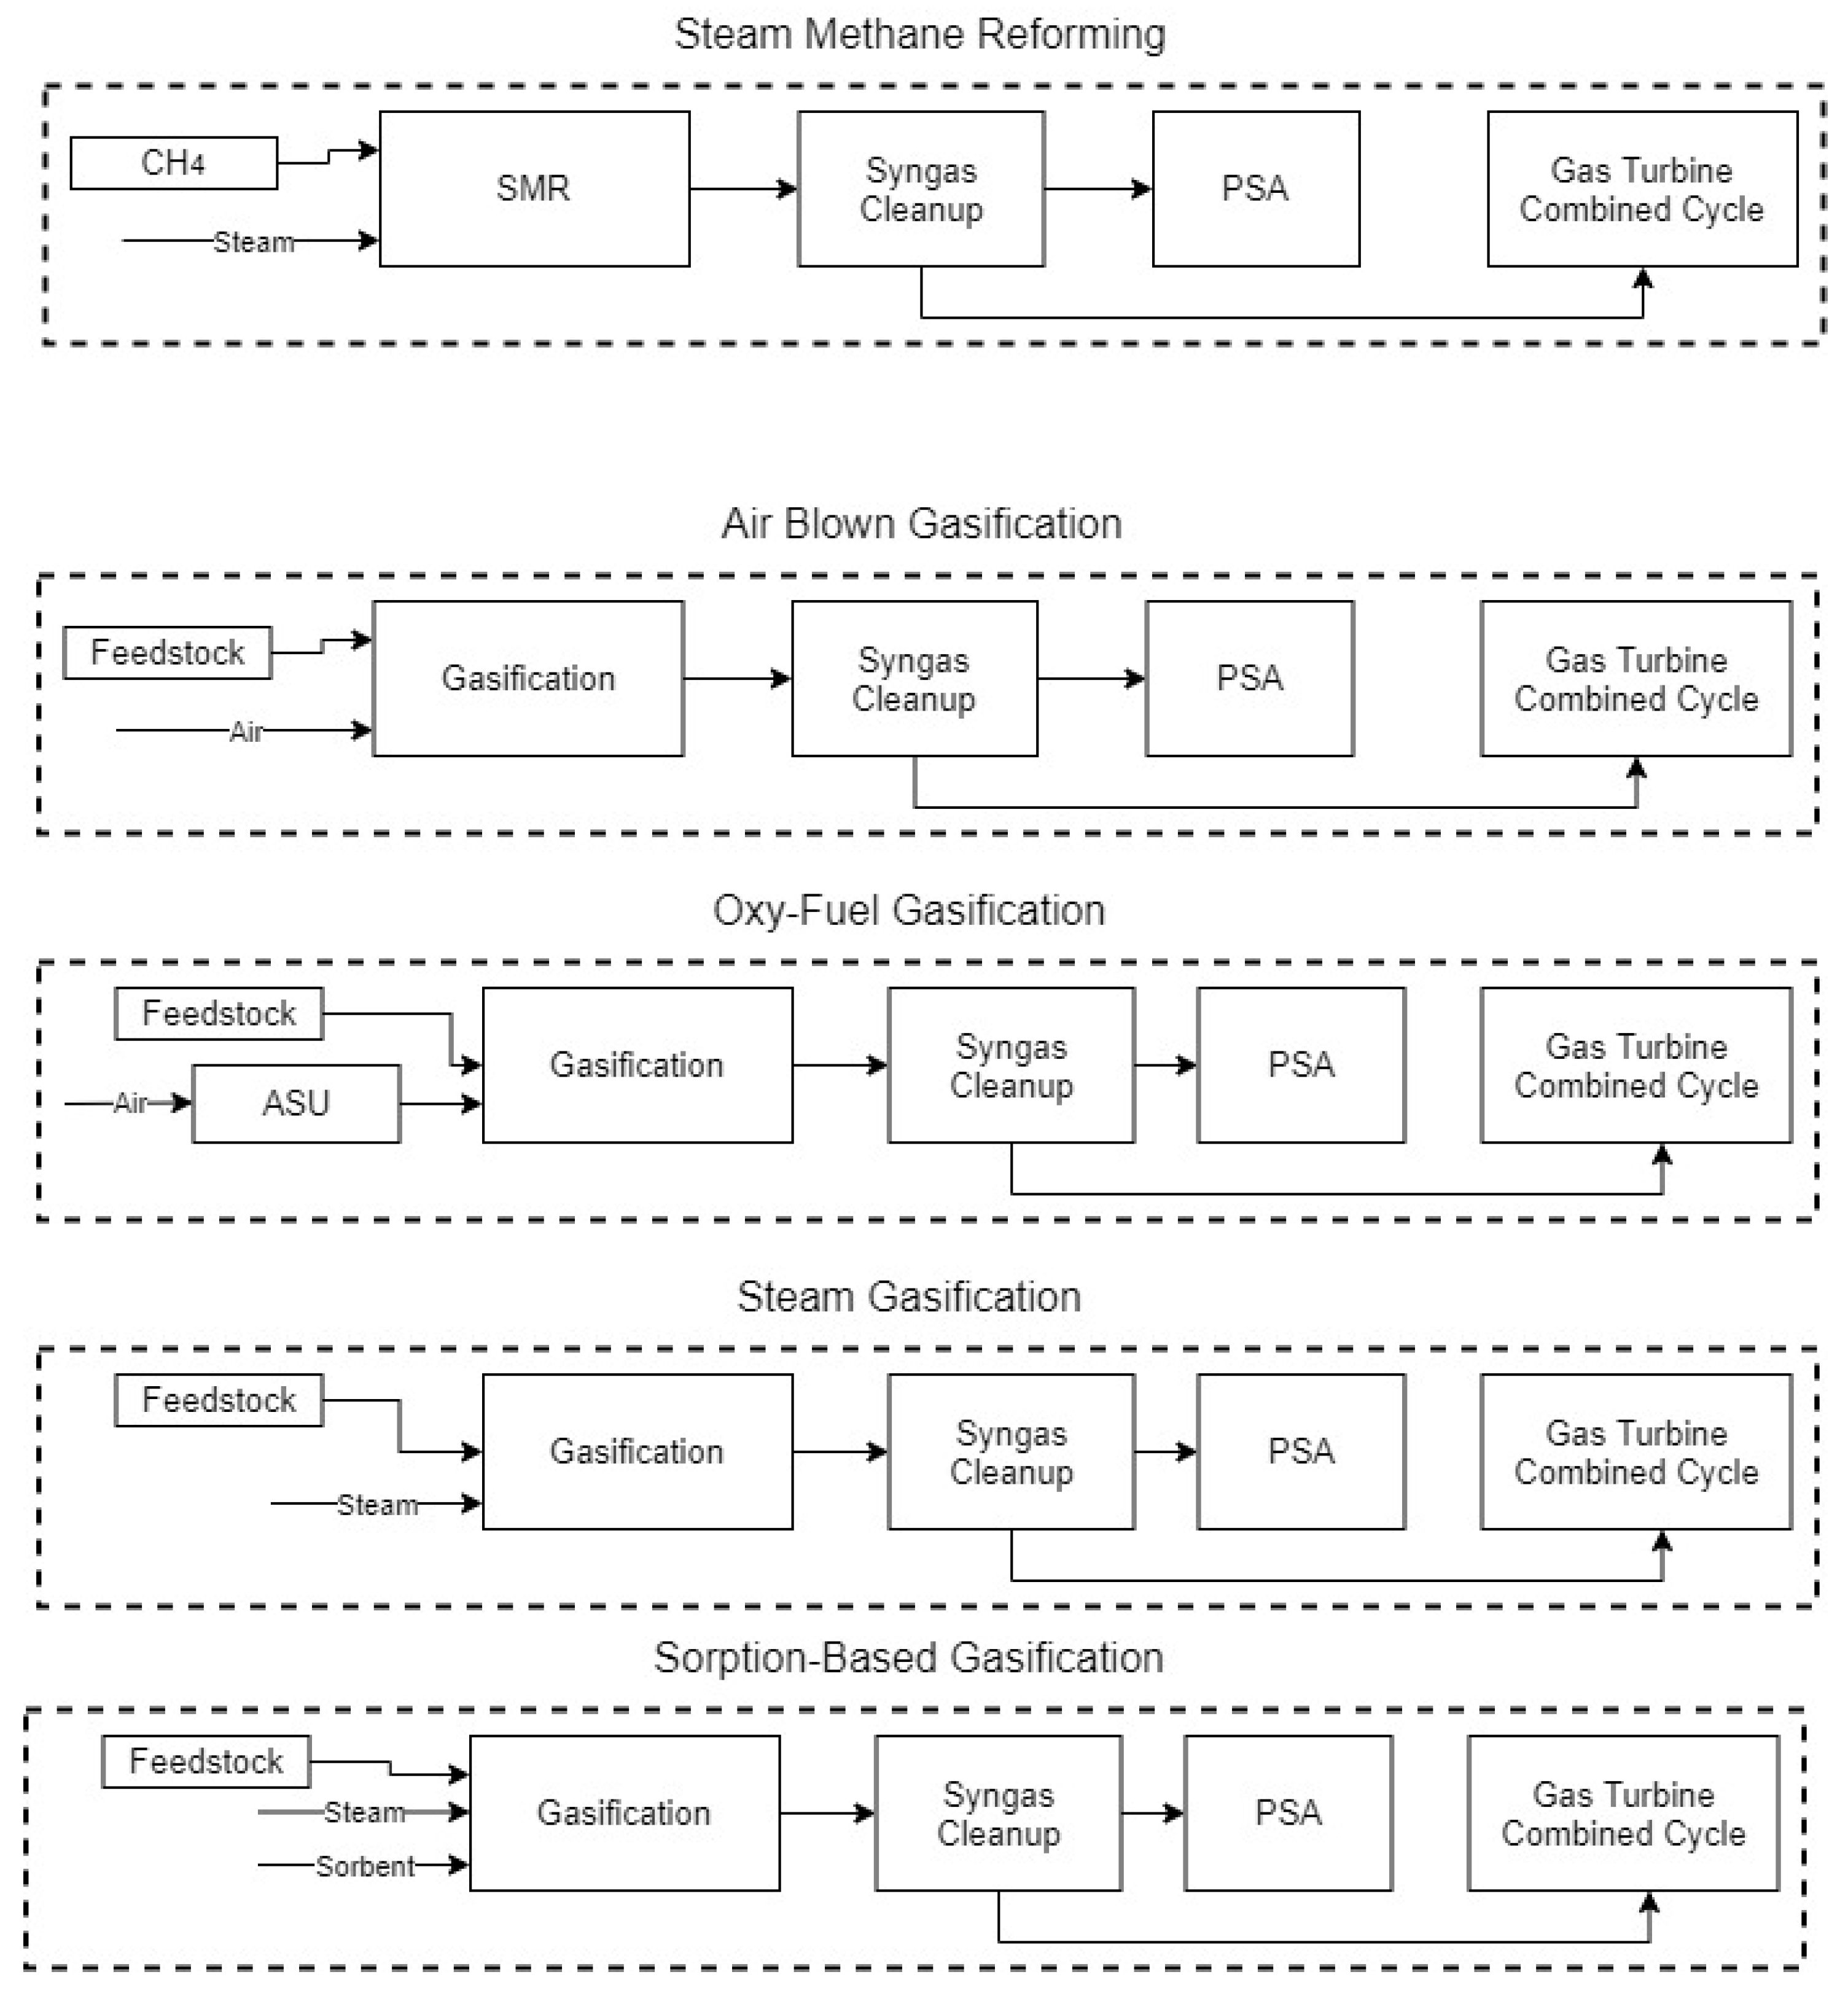
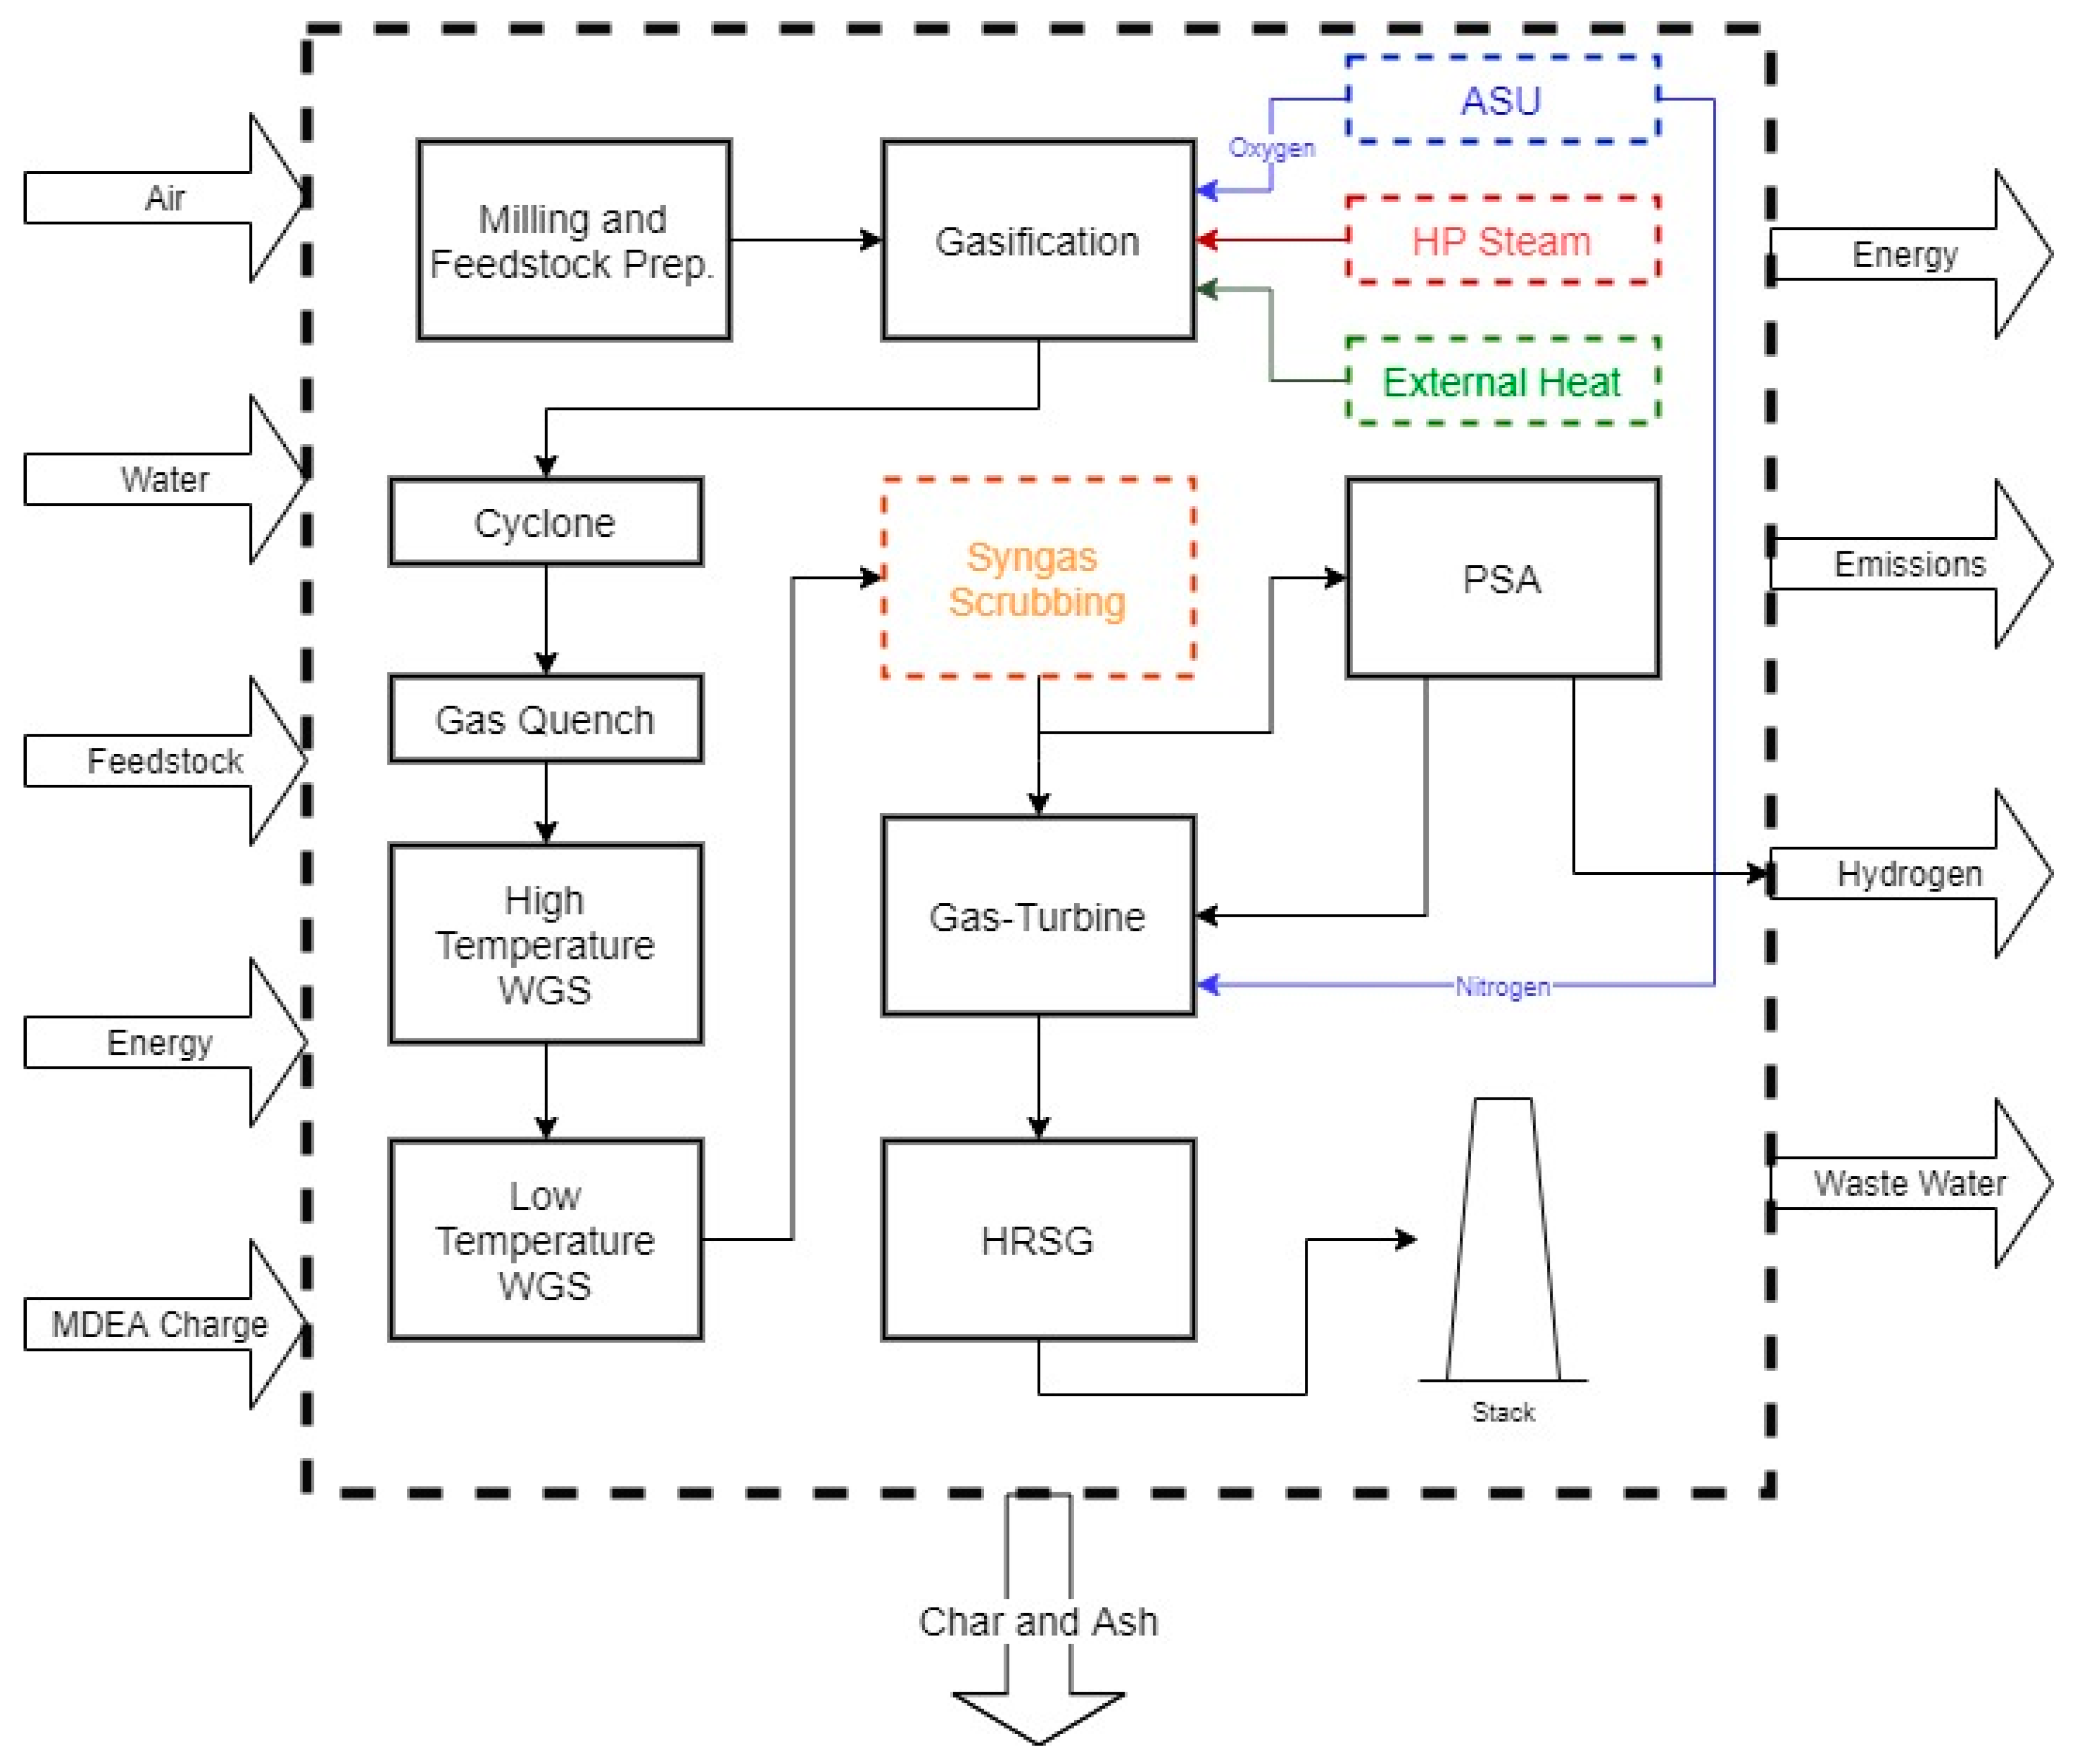
2.1. Block Flow Diagram and Boundary Conditions

An attributional cradle-to-gate Life Cycle Analysis (LCA) was conducted, examining the conversion of raw materials (biomass and MSW-derived plastics) through an integrated gasification combined cycle (IGCC) facility which produces high-purity hydrogen gas and electricity. The hydrogen will be produced via pressure swing absorption of syngas, and the purge/reject gas will be further oxidized in a gas turbine (GC) equipped with a heat recovery steam generator (HRSG).
Figure 2 shows a block flow diagram of the considered process along with the input and exit boundaries. The boundaries of this project include the feedstocks arriving at the gasifier block, and exclude pretreatment and transportation. The raw material inputs are air, water, feedstock (MSW-plastic or biomass), energy (in the form of either electricity or steam), and SELEXOL charge (fresh ethyl ethers of polyethylene glycol) for CO2 capture. The materials exiting the plant are energy, in the form of power, stack emissions, from the gas turbine combined cycle (GTCC) and heat recovery steam generator (HRSG), pure hydrogen, char, and ash from the gasifier, and process waste-water. Although not included in Figure 2, pure hydrogen sulfide gases and pure carbon dioxide gases, to feed either a Claus Unit to make elemental sulfur or to be stored in a saline aquifer, respectively, are also exiting the process. For the purpose of this study, the plant efficacy is determined solely based on hydrogen product value and energy produced.

2.2. Functional Unit

Two different metrics were used to assess the flows at the boundary condition, one being hydrogen produced per metric tonne of feedstock basis and MWh produced per metric tonne of feedstock. The first basis will be useful in comparing the amount of energy produced, hydrogen purified, CO2-captured, etc., per tonne of feedstock when different feedstock slates are compared. Additionally, with the potential to co-gasify plastics and biomass, this metric is important to compare potential synergies between the feedstocks. The second metric will be useful for assessing the functionality of the plant at scale, and will provide plant-wide data relative to power generation, which is an important parameter in the success of WtE facilities.

2.3. Assumptions

There are many assumptions present throughout this comparison and they are used to provide greater support and motivation for the subsequent data. As established by ISO 14040 [26], assumptions allow for less misinterpretation of LCA study results (Table S1).

2.4. Thermodynamic Model of MSW Gasification Combined Cycle

For almost all of the simulation models, the Predictive Soave-Redlich-Kwong (PSRK) property set method from the AspenTech Property Set Database was used. The PSRK method is useful for predicting chemical equilibria for high-pressure gas systems, which is the majority of this process [27,28]. However, to model the liquid–liquid gas equilibria in the SELEXOL process the NRTL-Electrolyte method from the AspenTech Property Set Databased was chosen [29]. These methods were selected to yield the most robust and accurate process model possible. A full process flow diagram (PFD) to showcase the AspenTech model developed is available in Figure S1 and a description to accompany this PFD is present in Supplementary Information Description S3.

2.5. Systems Assessed and Sensitivity Analysis

This study assesses four methods of industrial gasification in the context of both biomass and MSW-derived plastic wastes. The six test cases studied and variations of the thermodynamic model are described below:
Case 1 is a coal-fired oxyfuel plant (benchmark), Case 2 is a methane fired autothermal steam methane reforming plant (benchmark), and Case 3 is an MSW-plastic/corn stover (1:1 ratio by mass) oxyfuel plant. These three cases are almost identical, aside from the different feedstocks utilized. Case 4 is an MSW-plastic/corn stover (1:1 ratio by mass) steam gasification plant, which does not have an ASU but instead uses very high-pressure steam as the oxidant in the gasifier. Case 5 is the same as Case 4, but utilizes a mixture of steam, oxygen, and a sorbent (in this case Ca(OH)2—portlandite) to perform in-situ carbon capture and hydrogen generation. Lastly, Case 6 is an air-blown gasifier which recovered hydrogen from an MSW-plastic/biomass mixture (1:1 ratio by mass), but does not have an ASU nor gas turbine nor gas cleanup process due to the presence of large amounts of nitrogen circulating throughout. The general differences in the gasification islands are highlighted in Figure 1.

2.6. Feedstocks Considered and Heating Values

The feedstock considered for the MSW/Biomass gasification processes was selected from a group of known WtE feedstocks and their associated ultimate analyses (Table S2). A representative mix of corn stover and MSW-derived plastics, in equal mass portions. This was done as a proof-of-concept to simulate ideal conditions for MSW plastics contaminated with biomass wastes (e.g., agricultural) from landfilling. Additionally, since the full ultimate elemental analysis is known for each component, they were ideal candidates for the development of the thermodynamic mode. For the purpose of this analysis, the MSW-derived plastics was considered to be a poly-ethylene derivative. Sub-bituminous coal and a shale-derived natural gas were also considered as reference feedstocks to compare the proposed theoretical process to industrially available gasification processes. Table S3 showcases the different energetic values in Btu/lb for the four feedstocks. Natural gas, due to the abundance of methane, shows the highest heating value while the MSW-derived plastic comes in second due to the assumption that is a poly-ethylene derivative; the energetic value of C-H bonds and relative abundance in the (CH2-CH2)n backbone is quite high. Corn stover, with a heating value of ~7590 Btu/lb, is much lower than the other feedstocks, however quite in line with other lignocellulosic biofuel materials [30]. The low heating value of biomass feedstocks makes them quite challenging in gasification/power-generation activities; generally, more feedstock is needed to produce the same electricity/chemical yields in reference to coal, for example, due to the high water and oxygen content. This can lead to the presence of tars and waxes which can also foul up the gasifier.

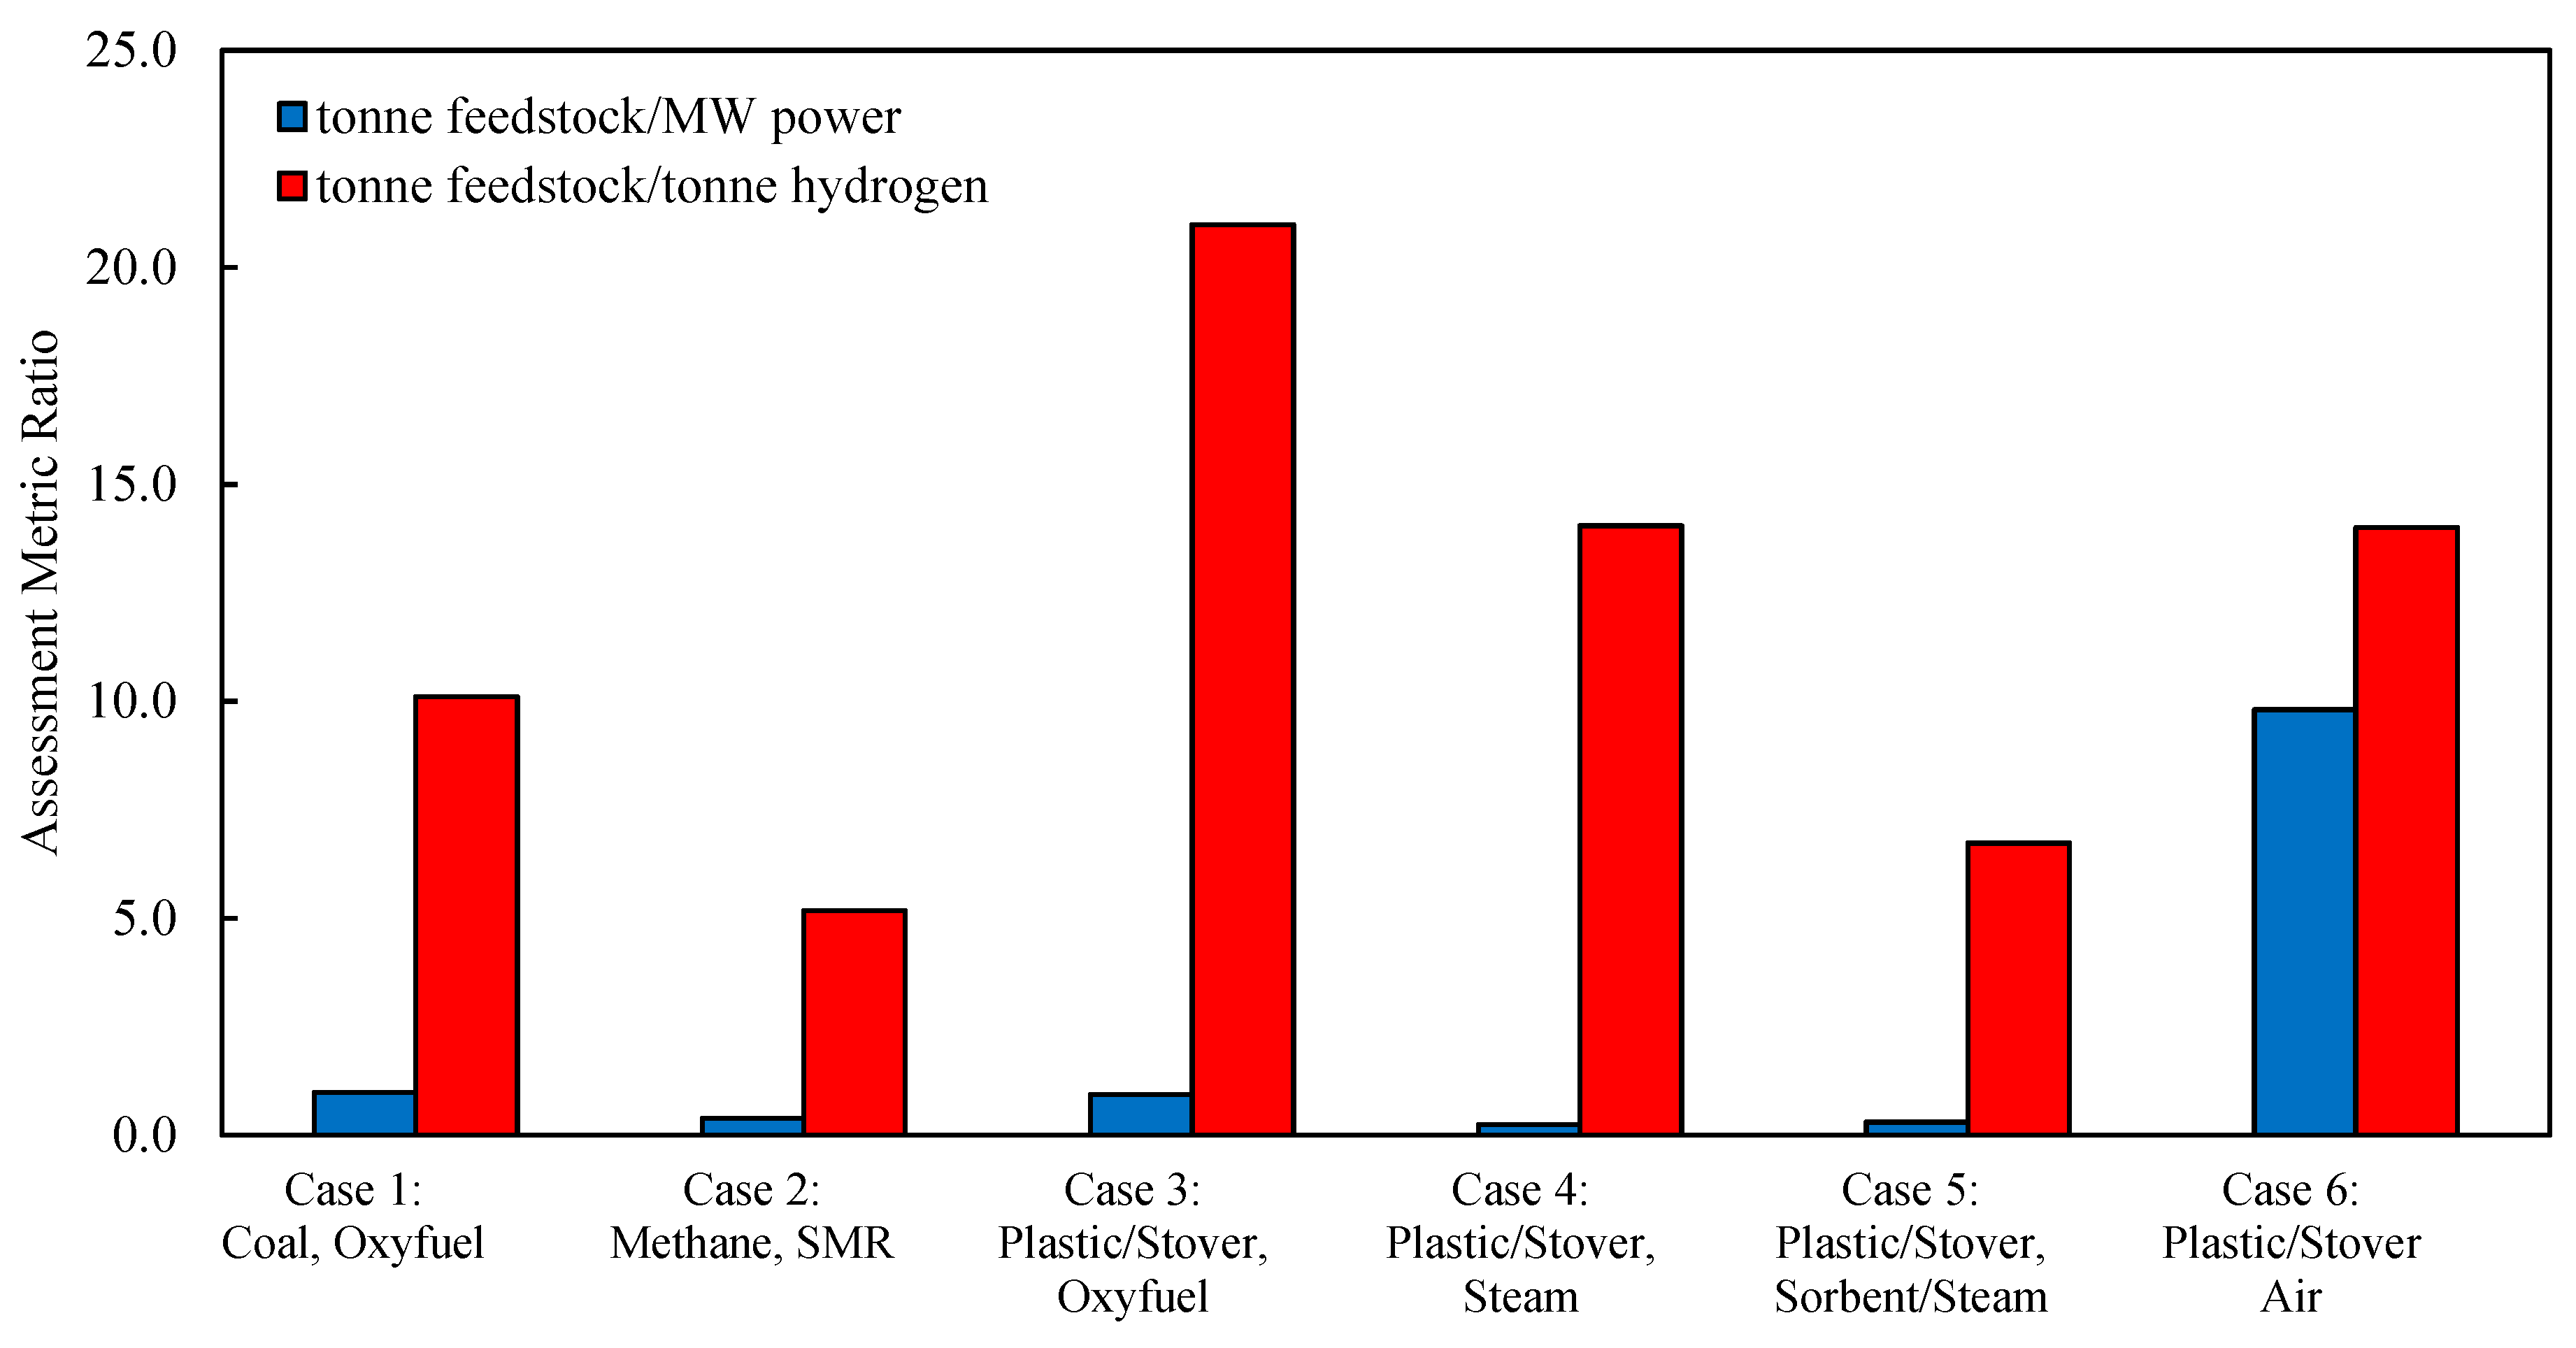
2.7. Indicators Examined

Environmental impact indicators were considered in the assessment of the gasification thermodynamic models developed from AspenTech. The most important metrics considered were carbon dioxide (CO2), nitrogen oxides (e.g., NOx), carbon monoxide (CO), reduced sulfur species (H2S, COS), chloride emissions (Cl), ashes from the gasifier block, and predicted process waste-water (from steam). Each metric is reported in the most salient metric possible. For instance, gaseous emissions, such as NOx, CO, and H2S/COS, were reported according to U.S. powerplant standards (e.g., lbs contaminant per MMBtu fired in turbines). Other metrics were reported as metric tonnes per hour for simplicity.

2.8. Sensitivity to Examine CO2 Reduction Using Renewables to Generate Steam

The use of steam gasification and steam-sorbent gasification (Case 4 and Case 5, respectively) for the disposal and recovery of value from MSW plastics and biomass show potential advantages over oxyfuel and air gasification processes. This is due to the use of water as an oxidant, which allowed for enhanced methanation and greater hydrogen yields per feedstock charge. However, high energy penalties are incurred as a function of the external boiler firing duty needed to vaporize BFW to produce VHP steam to supply to the gasifier. This can hamper the overall CO2 emissions of the process and the energetics, making steam gasification less desirable than oxyfuel gasification. However, if the energy needed to maintain the gasifier temperature of the energy needed to vaporize water into steam for Case 4 and 5 could be sourced by alternative energy systems, the carbon balance of these plants may fall into a more desirable range. A sensitivity analysis was performed to examine the difference in carbon emissions if the energy to charge the gasifier with steam could be sourced from renewables (e.g., solar thermal).

3. Results and Discussion

3.1. Material and Energy Balances

Table 2 shows the overall material balances for the processes examined. Case 2, steam methane reforming (SMR) produces the most hydrogen of all the processes. This is due to the clean nature of the feed which readily reacts with steam to yield H2 much more efficiently than the solid gasification processes. Case 3 (plastic/biomass oxyfuel) is very similar to Case 1 (coal oxyfuel), however the yield of hydrogen is about half. This suggests that due to the lower combined heating value of the fuel, an MSW-cogasification facility needs to input more feedstock per desired unit hydrogen [30]. The biomass and organic fraction of the feed brings down the intrinsic heating value. Plastics, however, boost the calorific value of the feed due to the abundance of C-C and C-H bonds (e.g., LDPE is about 85% carbon by mass) [31]. The potential for the creation of tars and waxes is very prevalent during the gasification of plastics, and thus the gasifier temperature needs to be kept constantly elevated [11]. Case 4 elucidates that using steam as an oxidant can more readily produce hydrogen in an MSW-cogasification facility and unload power requirements from the ASU; however, the energy requirements for producing the steam charge to the gasifier are large. Case 5 showcases that the use of a gasifier bed material, in this case portlandite, can seriously alleviate both carbon dioxide emission and the penalties associated with the physisorption SELEXOL process [32]. Finally, the air gasification shows little merit (Case 6), with low hydrogen yields and high emissions. This further supports a growing consensus that either pure oxygen or steam must be used as a gasifier oxidant to avoid penalties from circulating large amounts of nitrogen.
Energy balances, in terms of the main users and producers, were tabulated to evaluate the efficacy of the plants from a full-scale power generation standpoint. Overall, similar trends as discussed for the material balances exist for the energy balances as well (Table 3). Case 1 and Case 3 are very similar from an energy balance, as expected, showcasing the predictability of oxyfuel fired gasification processes. The ability to generate roughly the same amount of power, but different hydrogen yields, shows that the differences in the energetic value of the feedstocks are most important in the yield of hydrogen. In Case 4 and Case 5, steam gasification and sorption enhanced steam gasification, significantly boosting the yield of net power, almost 4- and 3.2-fold, respectively. This is impressive, but likely due to the large presence of reformation and methanation reactions that are driven by the steam. These reactions are less likely to occur in the presence of oxygen, as partial oxidation will be dominant. However, it should be noted that preparation of the steam to feed the gasifier requires large amounts of energy, almost 1024 MMKcal/h in Case 4 and 512.1 MMKcal/h in Case 5. This is because in the absence of oxygen, steam gasification is mostly endothermic, so the heat for gasification must come from an ancillary boiler. This boiler will likely be fired with natural gas, and thus will incur additional CO2 penalties. However, from an absolute yield Case 4 and Case 5 are the most efficient in terms of power generation.
Another important metric in assessing the efficacy of these gasification processes is the feedstock conversion capacities, expressed in both per tonne of hydrogen produced and per MW of power generated. Figure 3 showcases these LCA metrics for all six of the gasification cases studies. As observed, the process utilizing natural gas SMR to generate hydrogen and power is the most efficient from per tonne of methane utilized and per tonne of hydrogen produced. This is attributed to the energetic value of the feedstocks, with methane being the highest. Similarly, coal oxyfuel gasification (Case 2) and the plastic/stover oxyfuel gasification (Case 3) follow the same trend in tonne feedstock/tonne hydrogen, with Case 3 being the most at about 22 tonnes of feedstock per tonne of hydrogen produced. As seen in Case 4 and Case 5, the use of steam and steam plus a gasifier bed sorbent can actually reduce the required tonnage of feedstock per tonne of hydrogen and tonne of feedstock per MW of power. The use of steam as an oxidant increases the amount of methane and hydrogen relative to the other gases, while oxygen in the gasifier increases the relative amounts of CO due to the partial oxidation. Using a gasifier-bed sorbent brings down the tonne of feedstock required per tonne of hydrogen produced by further increasing the amount of hydrogen through in situ carbon capture. By capturing carbon dioxide that is being generated in the gasifier, the sorbent effectively shifts the equilibria of the water gas shift by removing CO2 in solid form as a carbonate salt, thereby allowing more CO to react with water to yield increased fractions of hydrogen [18]. Thus, the use of bed-active gasifier materials could be an attractive way to further enhance the production of hydrogen from low-calorific-value feedstocks.

3.2. Environmental Impact Assessment

Table 4 shows the environmental impact of the six gasification cycles studied. The major environmental pollutants produced from this site are: carbon dioxide emissions, nitrogen oxide (NOx) emissions from the GTCC, CO emissions from non-combusted material in the GTCC, hydrogen sulfide emissions from the gasification process, chloride emissions from the gasifier, ash emissions (both bottom and fly ash), and process waste-water [33]. Carbon dioxide is produced in both the gasification process and the gas turbine as well. In Cases 4 and 5, where very-high-pressure (VHP) steam is injected into the gasifier, additional CO2 emissions are incurred from a boiler producing the steam. NOx emissions stem from the gas turbine, where nitrogen can itself become oxidized. CO is emitted from incompletely combusted materials in the gas turbine, and has to be controlled as it is poisonous in large quantities. Diluents can be injected into the gas turbine to mitigate NOx emissions by lowering the combustion temperature; however, lowering the combustion temperature will also increase the amount of CO [34]. Thus, the addition of a diluent must be carefully tuned. Chlorides and ash wastes are significant problems in MSW gasification operations, and need to be carefully controlled to prevent the emission of hazardous pollutants. Chlorides must be removed early on in the process to prevent corrosion downstream via chloride-induced corrosion stress cracking [35]. As seen in Table 4, Case 3 (plastic/biomass, oxyfuel) actually generates the least amount of carbon dioxide and correspondingly low amounts of NOx and CO relative to all other scenarios. Due the presence of the ASU, water was only used to make a feedstock slurry in this case, and thus process waste-water requirements are also reduced. Case 4 yields the highest amount of carbon emissions due to the firing of almost 1124 MMKcal/h of VHP steam as an oxidant in the gasifier, higher CO emissions, and large amounts of waste-water produced. The addition of a sorbent, as shown in Case 5, can assist in reducing CO2, CO, Cl, Ash, and waste-water emissions relative to Case 4. Thus, the use of a catalytically active gasifier bed material could help at reducing the emissions profile of steam-based gasification processes, which can also produce more hydrogen.

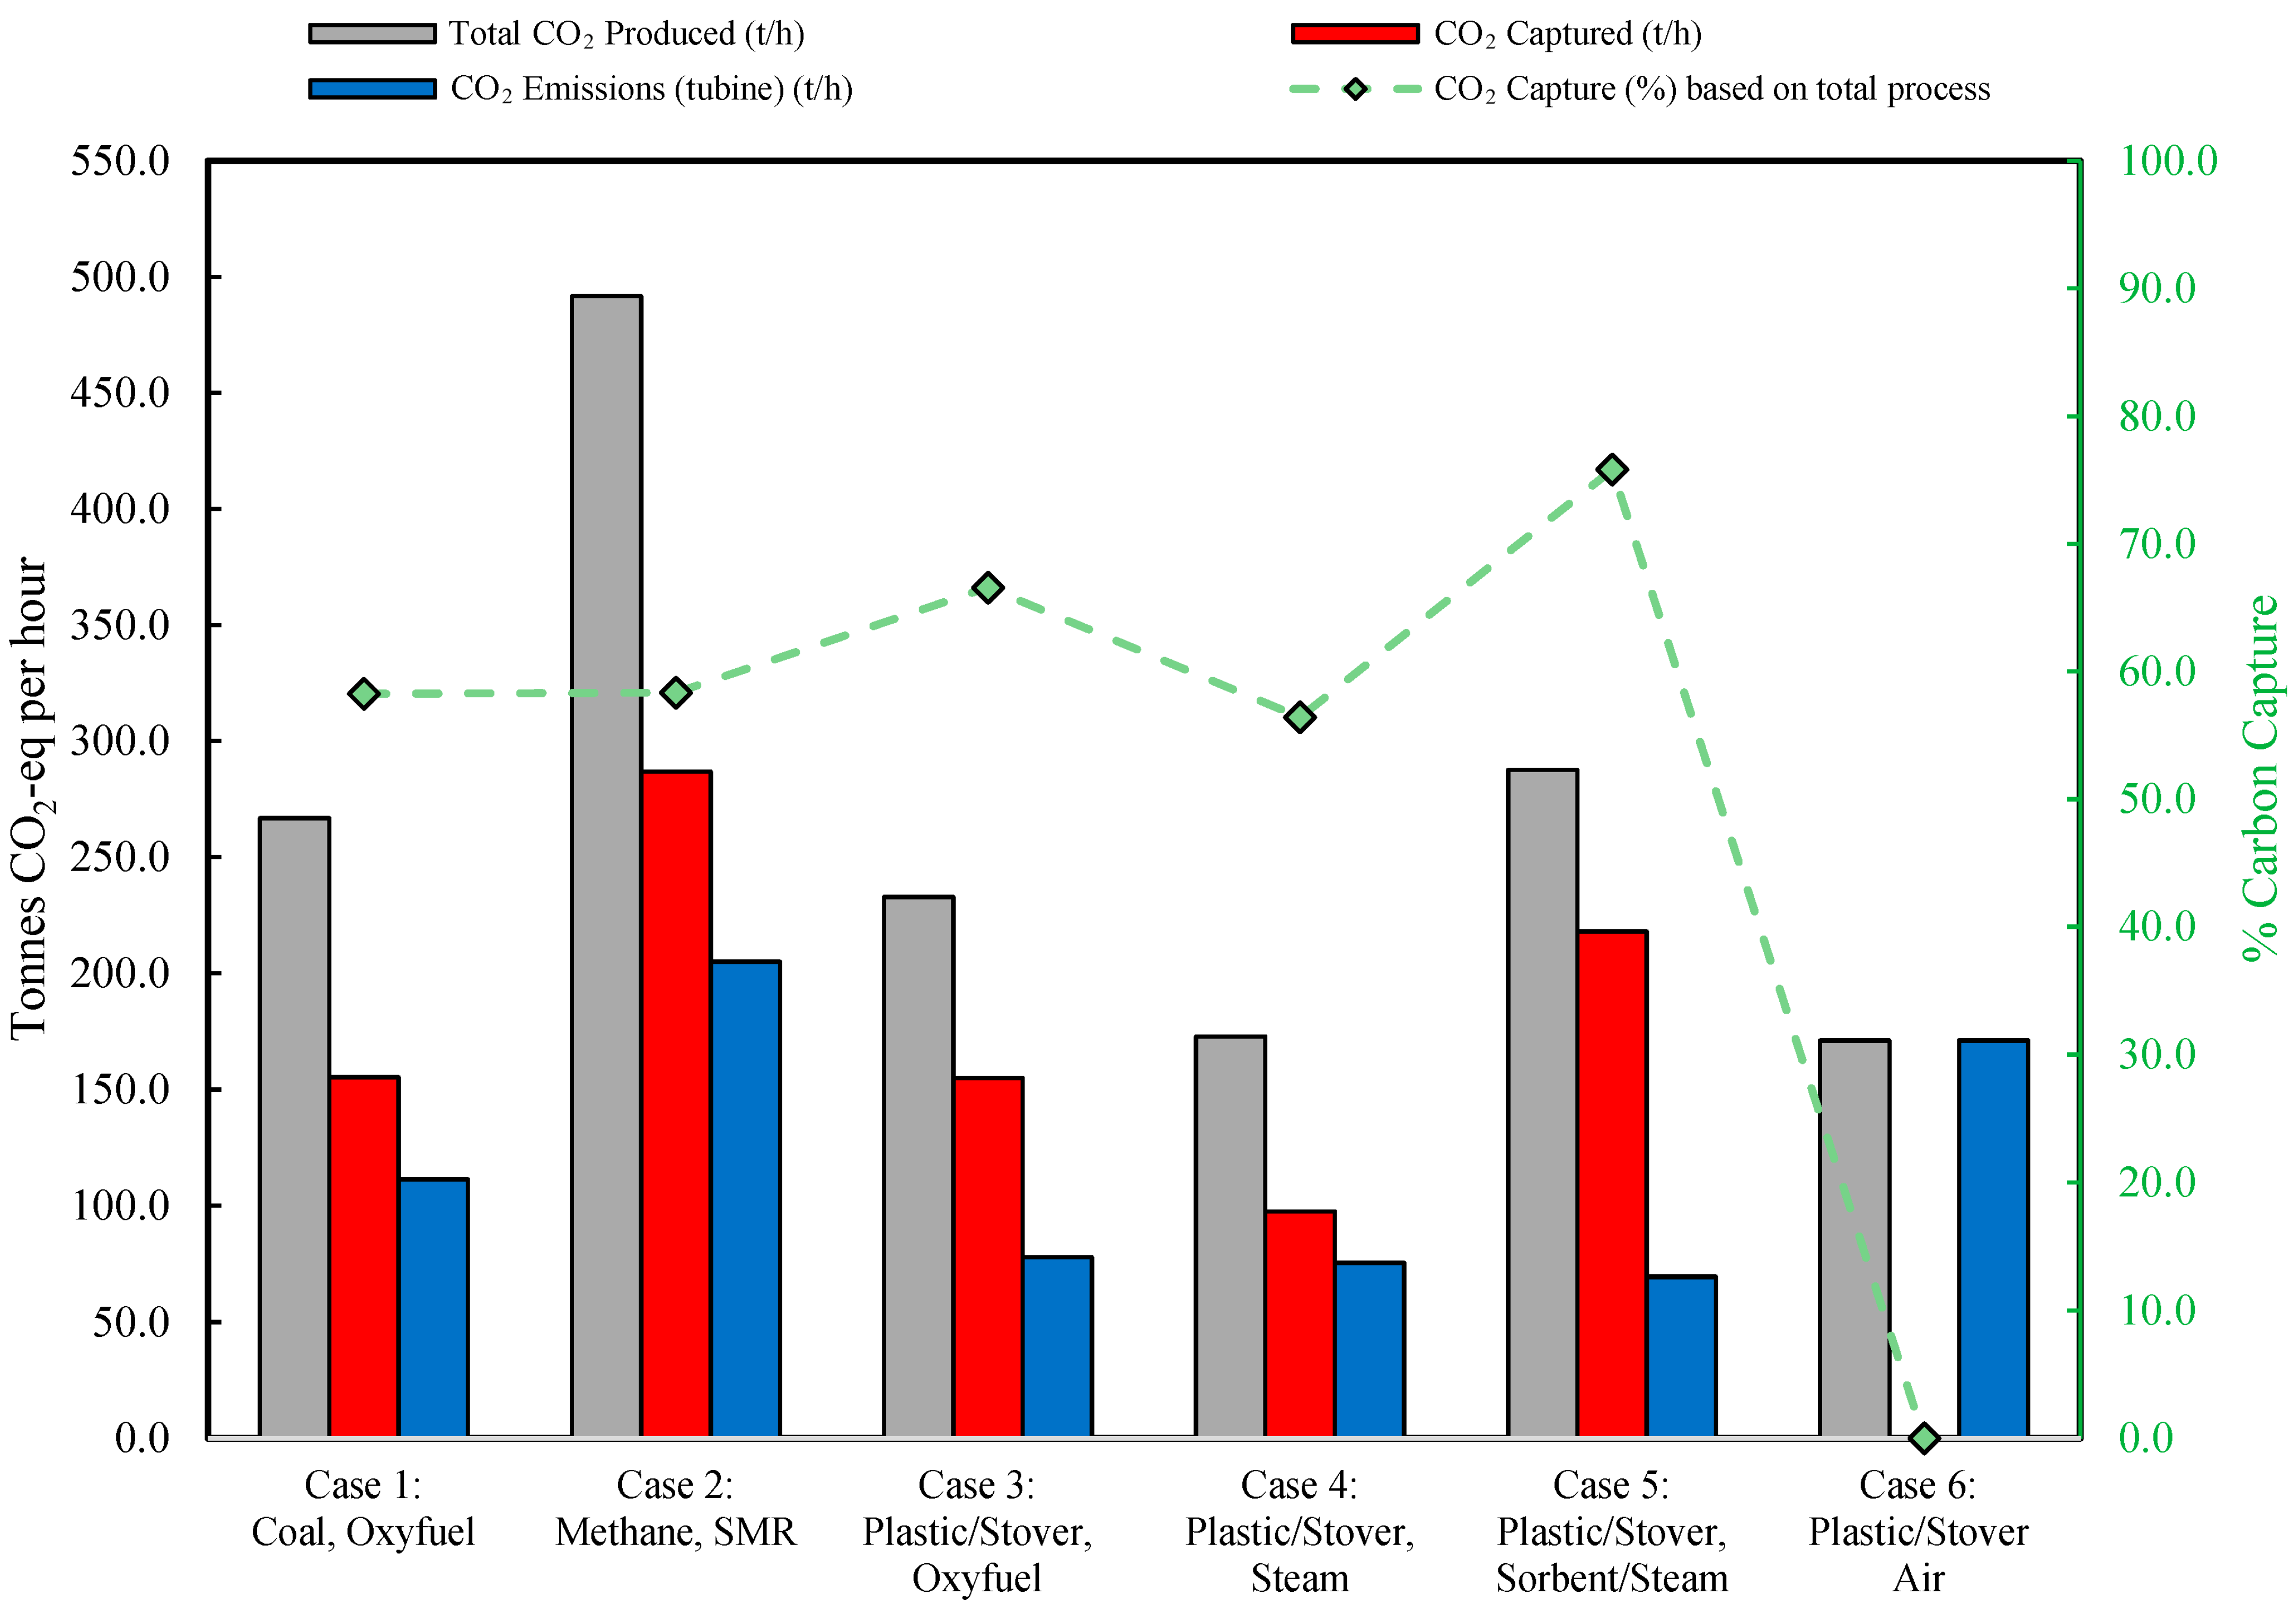
3.3. Emission Potential (CO2-Equivalents)

Overall, it was determined that the air-blown gasification of an MSW plastic/corn stover is the worst from a carbon emission standpoint per tonne of hydrogen produced and MW power (Figure 4). The use of the SELEXOL-based carbon capture process and its advantages can clearly be observed in all other gasification cases relative to Case 6. It should be noted that most of the carbon dioxide emissions for Cases 1–5 used in these LCA metrics come from the HRSG stack, and are generated during the combined cycle. Additional carbon capture systems could be installed for the stack gas; however, for the purpose of this study it was not considered due to the dilute amounts of CO2 present in the flue gas. Cases 1–5 are quite similar in their carbon emissions relative to power generated, however using steam as an oxidant does incur a greater CO2 penalty per MW power and an extreme penalty in terms of tonnes of CO2 per tonne of hydrogen produced. This can be explained by the fact that water is a lesser oxidant in gasification systems. A penalty is incurred in steam gasification because of the large gas firing duties from the auxiliary boilers to supply steam. The chief reactions occurring during steam-based gasification are methanation coupled with water–gas shift, yielding high amounts of methane and hydrogen. The sheer mass of methane allows the significant recovery of energy by firing in the gas turbine, suggesting that from a power perspective, steam gasification could make energetic sense, however from a commodity chemical standpoint, it may not be the best method of recovering value from MSW and biomass. The data suggest that full-scale oxyfuel MSW-plastic/biomass co-gasification facility equipped with a GTCC-HRSG is competitive enough to compete in the range of conventional SMR and coal gasification plants on all emissions LCA metrics as indicated by Figure 4.

Carbon Capture Potential

As a component of the LCA, a full carbon balance was performed to assess the overall environmental greenhouse gas release potential of the various gasification cycles studies herein. Overall, all gasification cases, with the exception of the air-blown gasifier, were tuned such that almost all of the carbon dioxide produced during gasification was captured using the SELEXOL process. Thus, the intrinsic syngas carbon capture efficiency for all cases (except 6) was approximately 100%. In all cases, as a component of the combined cycle process, a gas turbine was operated to fully combust the PSA offgas. As visualized in Figure 5, the carbon capture efficiency for Case 1 (coal, oxyfuel) and Case 2 (autothermal methane reforming) is quite similar, however the overall carbon emissions for Case 2 are the highest of all the processes. The large amount of CO2 released in the autothermal reforming process is due to the highly energetic value of the methane feed, producing a PSA off-gas which is quite rich in methane and CO with a great combustible value. The MSW-plastic/biomass oxyfuel, steam, and steam-sorbent gasification series showed relatively similar total CO2 emissions, suggesting that the PSA off-gas has roughly the same energetic composition to feed the gas turbine. Interestingly, the sorption-enhanced gasification process yielded the highest degree of potential carbon capture due to the presence of the portlandite, which performs in situ capture of CO2 in the gasifier (producing carbonates), yielding a higher-purity hydrogen and methane stream for downstream use. Portlandite or Ca-bearing phases can be sourced from alkaline industrial wastes, such as steel slag, construction and demolition waste, and mine tailings, which could be used as sorbent materials in this process [36,37]. Regeneration of Ca gasifier-bed active materials could be achieved through conventional calcination and slaking cycles (e.g., calcium looping) which would produce pure gaseous CO2 for storage, but this could be energy-intense, require additional unit operations, and require piping and access to CO2 storage wells [38]. The produced calcium carbonates from such a process could be re-used in carbon utilization applications, especially within the context of the built environment. Recent studies have attempted to understand the processes and mechanisms that are the most important in the crystallization of CaCO3 for carbon utilization [39,40] in addition to how these carbonates modify cement hydration [41] and rheology [42] when they are reincorporated as new built environment building blocks. Alternatively, if the carbonate materials are not re-utilized within industrial applications, they can be stored as thermodynamically stable CO2 sinks underground (e.g., reclaimed mines) for deep and permanent sequestration.

3.4. Sensitivity Analysis: Use of Renewable Energy Systems

In order to reduce carbon emissions during the generation of steam for the steam gasification of MSWs, a sensitivity test was conducted to investigate offsets using renewable steam generation methods. One such promising technology is the use of concentrating solar power (CSP) plants to supply thermal energy. These facilities utilize thousands of heliostats and power towers to concentrate solar light to a point source boiler at high-pressure and high-temperature conditions (>60 bar, >550 °C). A comparison between the different emission profiles of Case 4 and Case 5 was tabulated on both a per power basis (Figure 6a) and on a per tonne of hydrogen basis (Figure 6b). Overall, significant reductions in CO2 emissions can be achieved by using CSP to provide heat to the gasifier, especially in Case 4, where no sorbent was utilized in the gasifier itself. The potential hybridization of these steam gasification processes with alternative energy systems may make them more attractive for both near-term and long-term investment prospects.

3.5. Limitations of the Study

While the methodology used in this study provides valuable insights into the conversion of biomass and plastic materials via integrated gasification, several limitations should be noted:
  • Scope Limitation: The attributional cradle-to-gate LCA primarily focuses on the conversion process and excludes pretreatment and transportation of feedstocks. This might not capture the complete environmental footprint of the entire lifecycle.
  • Data Quality and Reliability: Assumptions made throughout the study, as highlighted by ISO 14040, can impact the results. While they are meant to provide clarity, they may also introduce biases or inaccuracies.
  • Thermodynamic Models: The choice of the Predictive Soave–Redlich–Kwong (PSRK) and NRTL-Electrolyte methods for thermodynamic modeling, while robust, may not account for all possible chemical interactions or unforeseen process deviations.
  • Feedstock Representation: The study considers a mix of corn stover and MSW-derived plastics as a representation. The variability in actual feedstock compositions in real-world scenarios might result in different outcomes.
  • Limitation of Indicators: While multiple environmental indicators were assessed, other potential environmental impacts might not have been captured in this study.
  • Scaling Limitations: The results obtained are based on the described process configurations and may not directly scale or apply to different setups or larger industrial scenarios.
  • Sensitivity Analysis: The study assumes that the energy for certain processes could be sourced from renewables. In real-world scenarios, the availability, consistency, and reliability of renewable sources can vary, impacting the outcomes.
  • External Factors: External factors like policy changes, technological advancements, or economic factors that might influence the feasibility and efficiency of the described processes in the future were not considered.
Future research should consider addressing these limitations for a more comprehensive understanding of the gasification process and its environmental impacts.

4. Conclusions

Gasification systems applied to mixture of biomass and MSW-derived plastic wastes comprise a technology that has immense potential. As seen by the carbon and energy balances presented herein, steam gasification is a promising method to dispose of these plastics/biomass feedstocks and yields 75% greater fraction of power per tonne of feedstock and 33% greater fraction of hydrogen per tonne of feedstock as compared to air or oxyfuel gasification. Although steam gasification could be a better gasification pathway, extreme heat penalties are incurred via an auxiliary boiler to supply the steam charge. This decreased the total carbon capture ability of the plant by about 10%. However, sourcing alternative energy resources to supply the gasifier with the steam (e.g., CSP), could become practical in a carbon-constrained world, allowing the hybridization of alternative energy, waste disposal, and commodity chemical production. Lastly, using gasifier active bed materials, such as sorbents like portlandite [Ca(OH)2], can dramatically reduce the need for complicated scrubbing systems (e.g., SELEXOL) and the produced calcium carbonate could be safely stored or reused for carbon utilization efforts. Overall, this study provides a thermodynamic metric assessment of emerging gasification technologies to deal with the growing problem of MSWs, especially those rich in biogenic and plastic fractions. As society moves closer towards the development of circularized commodities economies, these advanced gasification facilities, especially using sorbent materials, become quite attractive.

Supplementary Materials

The following supporting information can be downloaded at: https://www.mdpi.com/article/10.3390/en16227548/s1, Table S1: Assumptions for the gasification LCA presented in this study adhering to the ISO 14040. Table S2: Various WtE feedstocks and their associated elemental ultimate analysis (if known) and corresponding Gross Calorific Value (MJ/kg). Table S3: The estimated feedstock energetic values for the gasifier thermodynamic block based on the aforementioned collected feedstock data from Table S2. Figure S1: Overall Process Flow Diagram (PFD) of the modeled IGCC showing all of the major unit operations and the flow of materials throughout. Refs. [43,44,45,46,47] are cited in the Supplementary Materials.

Author Contributions

J.M.W. and A.C.B. conceptualized and planned this study. A.C.B. performed preliminary research and gathered relevant background information. J.M.W. developed the process model and performed the data collection in addition to constructing and writing the main manuscript. All authors have read and agreed to the published version of the manuscript.

Funding

This research received no external funding.

Data Availability Statement

Data are contained within the article and Supplementary Materials.

Acknowledgments

This work was supported by the Earth Engineering Center (Columbia University, NY, 10027).

Conflicts of Interest

The authors declare that they have no known competing financial interest or personal relationship that could have appeared to influence the work reported herein.

References

  1. Abdel-Shafy, H.I.; Mansour, M.S.M. Solid Waste Issue: Sources, Composition, Disposal, Recycling, and Valorization. Egypt. J. Pet. 2018, 27, 1275–1290. [Google Scholar] [CrossRef]
  2. Plastics: Material-Specific Data|Facts and Figures about Materials, Waste and Recycling|US EPA. Available online: https://www.epa.gov/facts-and-figures-about-materials-waste-and-recycling/plastics-material-specific-data (accessed on 13 April 2021).
  3. Eriksen, M.; Lebreton, L.C.M.; Carson, H.S.; Thiel, M.; Moore, C.J.; Borerro, J.C.; Galgani, F.; Ryan, P.G.; Reisser, J. Plastic Pollution in the World’s Oceans: More than 5 Trillion Plastic Pieces Weighing over 250,000 Tons Afloat at Sea. PLoS ONE 2014, 9, e111913. [Google Scholar] [CrossRef] [PubMed]
  4. Ritchie, H. Plastic Pollution. Available online: https://ourworldindata.org/plastic-pollution (accessed on 13 April 2021).
  5. Geyer, R.; Jambeck, J.R.; Law, K.L. Production, Use, and Fate of All Plastics Ever Made. Sci. Adv. 2017, 3, 5. [Google Scholar] [CrossRef] [PubMed]
  6. Di, J.; Reck, B.K.; Miatto, A.; Graedel, T.E. United States Plastics: Large Flows, Short Lifetimes, and Negligible Recycling. Resour. Conserv. Recycl. 2021, 167, 105440. [Google Scholar] [CrossRef]
  7. Hopewell, J.; Dvorak, R.; Kosior, E. Plastics Recycling: Challenges and Opportunities. Philos. Trans. R. Soc. B Biol. Sci. 2009, 364, 2115–2126. [Google Scholar] [CrossRef] [PubMed]
  8. Nikiema, J.; Asiedu, Z. A Review of the Cost and Effectiveness of Solutions to Address Plastic Pollution. Environ. Sci. Pollut. Res. 2022, 29, 24547–24573. [Google Scholar] [CrossRef] [PubMed]
  9. Wen, Z.; Xie, Y.; Chen, M.; Dinga, C.D. China’s Plastic Import Ban Increases Prospects of Environmental Impact Mitigation of Plastic Waste Trade Flow Worldwide. Nat. Commun. 2021, 12, 425. [Google Scholar] [CrossRef]
  10. Dong, J.; Tang, Y.; Nzihou, A.; Chi, Y.; Weiss-Hortala, E.; Ni, M.; Zhou, Z. Comparison of Waste-to-Energy Technologies of Gasification and Incineration Using Life Cycle Assessment: Case Studies in Finland, France and China. J. Clean. Prod. 2018, 203, 287–300. [Google Scholar] [CrossRef]
  11. Ciuffi, B.; Chiaramonti, D.; Rizzo, A.M.; Frediani, M.; Rosi, L. A Critical Review of SCWG in the Context of Available Gasification Technologies for Plastic Waste. Appl. Sci. 2020, 10, 6307. [Google Scholar] [CrossRef]
  12. Mukherjee, C.; Denney, J.; Mbonimpa, E.G.; Slagley, J.; Bhowmik, R. A Review on Municipal Solid Waste-to-Energy Trends in the USA. Renew. Sustain. Energy Rev. 2020, 119, 109512. [Google Scholar] [CrossRef]
  13. Wender, I. Reactions of Synthesis Gas. Fuel Process. Technol. 1996, 48, 189–297. [Google Scholar] [CrossRef]
  14. Maurstad, O. Integrated Gasification Combined Cycle. 2005. Available online: https://sequestration.mit.edu/pdf/LFEE_2005-002_WP.pdf (accessed on 20 October 2023).
  15. Wall, T.F. Combustion Processes for Carbon Capture. Proc. Combust. Inst. 2007, 31, 31–47. [Google Scholar] [CrossRef]
  16. Communication, S. Effect of Air Separation Unit Integration on Integrated Gasification Combined Cycle Performance and NO Emission Characteristics. Korean J. Chem. Eng. 2007, 24, 368–373. [Google Scholar]
  17. Zhang, K.; Ouassil, N.; Campo, C.A.O.; Rim, G.; Kim, W.J.; Park, A.H.A. Kinetic and Mechanistic Investigation of Catalytic Alkaline Thermal Treatment of Xylan Producing High Purity H2 with In-Situ Carbon Capture. J. Ind. Eng. Chem. 2020, 85, 219–225. [Google Scholar] [CrossRef]
  18. Zhang, K.; Kim, W.J.; Park, A.H.A. Alkaline Thermal Treatment of Seaweed for High-Purity Hydrogen Production with Carbon Capture and Storage Potential. Nat. Commun. 2020, 11, 3783. [Google Scholar] [CrossRef] [PubMed]
  19. Ferguson, T.E.; Park, Y.; Petit, C.; Park, A.H.A. Novel Approach to Hydrogen Production with Suppressed CO x Generation from a Model Biomass Feedstock. In Proceedings of the Energy and Fuels, Philadelphia, PA, USA, 19–23 August 2012; Volume 26, pp. 4486–4496. [Google Scholar]
  20. Al-Zareer, M.; Dincer, I.; Rosen, M.A. Production of Hydrogen-Rich Syngas from Novel Processes for Gasification of Petroleum Cokes and Coals. Int. J. Hydrogen Energy 2020, 45, 11577–11592. [Google Scholar] [CrossRef]
  21. Pauls, J.H.; Mahinpey, N.; Mostafavi, E. Simulation of Air-Steam Gasification of Woody Biomass in a Bubbling Fluidized Bed Using Aspen Plus: A Comprehensive Model Including Pyrolysis, Hydrodynamics and Tar Production. Biomass Bioenergy 2016, 95, 157–166. [Google Scholar] [CrossRef]
  22. Zaman, S.A.; Ghosh, S. A Generic Input–Output Approach in Developing and Optimizing an Aspen plus Steam-Gasification Model for Biomass. Bioresour. Technol. 2021, 337, 125412. [Google Scholar] [CrossRef]
  23. Tian, W.; Yan, F.; Liang, R. Simulation Analysis of Steam Gasification of Petroleum Coke with CaO. Pet. Sci. Technol. 2018, 36, 2170–2183. [Google Scholar] [CrossRef]
  24. Indrawan, N.; Mohammad, S.; Kumar, A.; Huhnke, R.L. Modeling Low Temperature Plasma Gasification of Municipal Solid Waste. Environ. Technol. Innov. 2019, 15, 100412. [Google Scholar] [CrossRef]
  25. Hasanzadeh, R.; Mojaver, P.; Azdast, T.; Chitsaz, A.; Park, C.B. Low-Emission and Energetically Efficient Co-Gasification of Coal by Incorporating Plastic Waste: A Modeling Study. Chemosphere 2022, 299, 134408. [Google Scholar] [CrossRef] [PubMed]
  26. ISO 14040; Environmental Management—Life Cycle Assessment—Principles and Framework. ISO: Geneva, Switzerland, 2006.
  27. Gutiérrez Ortiz, F.J.; Ollero, P.; Serrera, A.; Sanz, A. Thermodynamic Study of the Supercritical Water Reforming of Glycerol. Int. J. Hydrogen Energy 2011, 36, 8994–9013. [Google Scholar] [CrossRef]
  28. Gutiérrez Ortiz, F.J. Biofuel Production from Supercritical Water Gasification of Sustainable Biomass. Energy Convers. Manag. X 2022, 14, 100164. [Google Scholar] [CrossRef]
  29. Dyment, J.; Watanasiri, S. Acid Gas Cleaning Using Amine Solvents: Validation with Experimental and Plant Data; Aspen Technology Inc.: Bedford, MA, USA, 2015; pp. 2–10. [Google Scholar]
  30. Fuels—Higher and Lower Calorific Values. Available online: https://www.engineeringtoolbox.com/fuels-higher-calorific-values-d_169.html (accessed on 31 August 2022).
  31. Kartik, S.; Balsora, H.K.; Sharma, M.; Saptoro, A.; Jain, R.K.; Joshi, J.B.; Sharma, A. Valorization of Plastic Wastes for Production of Fuels and Value-Added Chemicals through Pyrolysis—A Review. Therm. Sci. Eng. Prog. 2022, 32, 101316. [Google Scholar] [CrossRef]
  32. Dai, J.; Whitty, K.J. Chemical Looping Gasification and Sorption Enhanced Gasification of Biomass: A Perspective. Chem. Eng. Process.—Process Intensif. 2022, 174, 108902. [Google Scholar] [CrossRef]
  33. Glarborg, P. Detailed Kinetic Mechanisms of Pollutant Formation in Combustion Processes. Comput. Aided Chem. Eng. 2019, 45, 603–645. [Google Scholar] [CrossRef]
  34. Stiehl, B.; Morales, A.; Genova, T.; Otero, M.; Martin, S.; Yoon, C.; Ahmed, K. Controlling Pollutant Emissions in a High-Pressure Combustor with Fuel-Diluent Blending. Fuel 2022, 317, 123481. [Google Scholar] [CrossRef]
  35. Tsubouchi, N.; Fukuyama, K.; Matsuoka, N.; Mochizuki, Y. Removal of Hydrogen Chloride from Simulated Coal Gasification Fuel Gases Using Honeycomb-Supported Natural Soda Ash. Fuel 2022, 317, 122231. [Google Scholar] [CrossRef]
  36. Rim, G.; Roy, N.; Zhao, D.; Kawashima, S.; Stallworth, P.E.; Greenbaum, S.G.; Park, A.-H.A. CO2 Utilization in Built Environment via the PCO2 Swing Carbonation of Alkaline Solid Wastes with Different Mineralogy. Faraday Discuss. 2021, 230, 187–212. [Google Scholar] [CrossRef]
  37. Zhang, N.; Moment, A. Upcycling Construction and Demolition Waste into Calcium Carbonates: Characterization of Leaching Kinetics and Carbon Mineralization Conditions. ACS Sustain. Chem. Eng. 2023, 11, 866–879. [Google Scholar] [CrossRef]
  38. Bosoaga, A.; Masek, O.; Oakey, J.E. CO2 Capture Technologies for Cement Industry. Energy Procedia 2009, 1, 133–140. [Google Scholar] [CrossRef]
  39. Williams, J.M.; Zhao, D.; Moon, S.; Kawashima, S.; Park, A.-H.A.; Moment, A.J. Stabilization of Pure Vaterite During Carbon Mineralization: Defining Critical Activities, Additive Concentrations, and Gas Flow Conditions for Carbon Utilization. Cryst. Growth Des. 2023, 23, 8103–8115. [Google Scholar] [CrossRef]
  40. Williams, J.M.; Zhao, D.; Zhang, N.; Chin, A.; Kawashima, S.; Moment, A.J. Directed Synthesis of Aragonite through Semi- Continuous Seeded Crystallization Methods for Carbon Utilization. CrystEngComm 2023, 25, 6050–6066. [Google Scholar] [CrossRef]
  41. Zhao, D.; Williams, J.M.; Li, Z.; Park, A.-H.A.; Radlińska, A.; Hou, P.; Kawashima, S. Hydration of Cement Pastes with Calcium Carbonate Polymorphs. Cem. Concr. Res. 2023, 173, 107270. [Google Scholar] [CrossRef]
  42. Zhao, D.; Williams, J.M.; Park, A.H.A.; Kawashima, S. Rheology of Cement Pastes with Calcium Carbonate Polymorphs. Cem. Concr. Res. 2023, 172, 107214. [Google Scholar] [CrossRef]
  43. Mukherjee, S.; Kumar, P.; Hosseini, A.; Yang, A.; Fennell, P. Comparative Assessment of Gasification Based Coal Power Plants with Various CO2 Capture Technologies Producing Electricity and Hydrogen. Energy Fuels 2014, 28, 1028–1040. [Google Scholar] [CrossRef] [PubMed]
  44. Al Lagtah, N.M.A.; Onaizi, S.A.; Albadarin, A.B.; Ghaith, F.A.; Nour, M.I. Techno-Economic Analysis of the Effects of Heat Integration and Different Carbon Capture Technologies on the Performance of Coal-Based IGCC Power Plants. J. Environ. Chem. Eng. 2019, 7, 103471. [Google Scholar] [CrossRef]
  45. Smith, R.W. Steam Turbine Cycles and Cycle Design Optimization: Combined Cycle Power Plants. In Advances in Steam Turbines for Modern Power Plants; Woodhead Publishing: Cambridge, UK, 2017; pp. 57–92. ISBN 9780081003251. [Google Scholar]
  46. Ibrahim, T.K.; Kamil, M.; Awad, O.I.; Rahman, M.M.; Najafi, G.; Basrawi, F.; Abd Alla, A.N.; Mamat, R. The Optimum Performance of the Combined Cycle Power Plant: A Comprehensive Review. Renew. Sustain. Energy Rev. 2017, 79, 459–474. [Google Scholar] [CrossRef]
  47. Cheng, M.; Verma, P.; Yang, Z.; Axelbaum, R.L. Single-Column Cryogenic Air Separation: Enabling Efficient Oxygen Production with Rapid Startup and Low Capital Costs—Application to Low-Carbon Fossil-Fuel Plants. Energy Convers. Manag. 2021, 248, 114773. [Google Scholar] [CrossRef]
Figure 1. Different gasification cases compared in this study, analyzed in the context of hydrogen and power generation capacities compared to the benchmark of SMR.
Energies 16 07548 g001
Figure 2. Block flow diagram (BFD) of the proposed LCA showing the boundary conditions and the inputs/outputs from the plant. Near the gasifier, the ASU, HP Steam, and External heat represent different gasification operation modes. The ASU is only used in the case of oxygen-blown gasification, HP steam to the gasifier is for the case of sorbent-based gasification and steam gasification, and external heat is for sorbent-based gasification.
Energies 16 07548 g002
Figure 3. Feedstock production capacity LCA metric for six gasification cases in terms of tonne of feedstock needed for tonne of hydrogen produced (red) and tonne of feedstock needed per MW of power generated (blue).
Energies 16 07548 g003
Figure 4. Carbon dioxide LCA emission metric for six gasification cases in terms of tonnes of carbon dioxide emitted per tonne of feedstock (green), tonnes of carbon dioxide emitted per tonne of hydrogen produced (red), and tonnes of carbon dioxide emitted per MW of power generated (blue).
Energies 16 07548 g004
Figure 5. Carbon capture potential for the six gasification cycles considered in this study. The chart shows the total carbon emissions produced (grey), the total carbon captured (red), and the carbon emissions from the turbine (blue). On the right axis (in green), the carbon capture efficiency was tabulated for all the processes.
Energies 16 07548 g005
Figure 6. Analysis of using a solar thermal-based power process to produce the steam required for the steam gasification cases, Case 4 and Case 5 in the context of MSW plastic/biomass gasification. Offsetting carbon emissions that are incurred through boiler firing to generate the steam for the gasifier would yield significant benefits from carbon balance standpoint. This figure showcases the reductions (green) versus the base case (black) in tonne of CO2 per MW power (a) and tonne of CO2 per tonne of hydrogen (b) produced.
Energies 16 07548 g006
Table 1. Comparison of the three major thermochemical treatment methods to recovery calorific value from MSW streams.
PyrolysisGasificationCombustion
Air provided to the systemNo airSub stoichiometric airExcess air
FeedstockSource separated plastic materialsSource separated high calorific value materials, e.g., plastics, and paper, and biomassMixed wastes
ProductsLiquid fuels, e.g., oilSyngas (CO and H2)Energy—electricity and/or heat
By ProductsHigh char, unconverted solid will remain
Pollutants in reduced form (H2S, COS)
Char @ low Temp; Vitrified slag @ high Temp
Lower fly ash carries over, compared to combustion
Pollutants in reduced form (H2S, COS)
Bottom ash (inert), fly ash (hazardous)
Pollutants in oxidized form (SOx, NOx, etc.)
Temperature <500 °C700–1200 °C>1100 °C
MaturityNot proven—small scale, ~10
tonne per day
Not proven—failures reported, e.g., Tees Valley in the UK and PyroGenesis in Florida, USAProven and dominant, ~1000 plants worldwide with capacities from 100 tonnes per day up to 5000 tonnes per day.
Flexible and optimized system
Table 2. Material balances for the six gasification cases studied as produced by AspenPlus V9.
OVERALL BALANCE Case 1: Coal, OxyfuelCase 2: Methane, SMRCase 3: Plastic/Stover, Oxyfuel Case 4: Plastic/Stover, SteamCase 5: Plastic/Stover, Sorbent/SteamCase 6: Plastic/StoverAir
FEED
Feedstock (t/h)100100100100100100
Air to ASU/Gasifier (t/h)463.4700477.95.12202.70514
Gas Turbine Air (t/h)297.65503505005600
Cooling Water (t/h)7115.815,105.26939.76961.910,387.8227
HRSG Water Feed (t/h)312.7673317.91247713.4328.7
Gasifier Feed Water (for internal steam demand, t/h)113.430072.061157501.4208
Diluent Water GTCC000216.1540
Portlandite Feed (t/h)0000366.70
SUM840317,428825810,18712,8861378
PRODUCTS
Hydrogen (t/h)9.89319.34.7657.1214.8457.14
CO2 Prod (t/h)155.4286.815597.500
Acid Gas for Claus (t/h)2.6415.012.443.641.8660
Nitrogen Release (t/h)68.64159.774.100.850
HRSG Stack Gas (t/h)680.61072705.5871.9800.4599.5
Process Waste-Water (t/h)57.6106.558997.6471.1215.8
HRSG to Cooling Tower312.7673317.91247713.4328.7
Cooling Water (t/h)7115.815,105.26939.76961.910,387.8227
Calcium Carbonate/Chloride Mass (t/h)0000495.40
SUM840317,428825710,18712,8861378
Table 3. Energy balances for the six gasification processes studied as produced by AspenTech simulation.
SUMMARY Case 1: Coal, OxyfuelCase 2: Methane, SMRCase 3: Plastic/Stover, Oxyfuel Case 4: Plastic/Stover, SteamCase 5: Plastic/Stover, Sorbent/SteamCase 6: Plastic/StoverAir
Gross Total Power Generated (MW)240.7479.9255.3481.2451.684.2
ASU Air/Oxygen/Nitrogen Compressors (MW)91.2136.094.30.049.30.0
Gas Turbine Compressor (MW)39.472.845.766.274.10.0
Carbon Dioxide Flash Compressor (MW)8.415.98.85.80.20.0
SELEXOL Recycle Gas Comp. (MW)0.30.60.40.30.00.0
Gasifier Air Compressor (MW)0.00.00.00.00.074.0
Net Power (MW)101.3254.5106.2408.9327.910.2
Refrigeration Load (MMKcal/h)20.537.916.514.00.020.0
Steam Firing Duty (MMkcal/h)---1024512.10
Table 4. Environmental impact data for the six gasification cases studied in terms of the major pollutants of this process: carbon dioxide emissions, NOx emissions, CO emissions, H2S emissions, Chloride emissions, Ash, and Waste-Water. NOx, CO, and H2S emissions are reported to EPA standards, which is commonly reflected as lbs generated per MMBtu of gasified feedstock.
Environmental Impact ParametersCase 1: Coal, OxyfuelCase 2: Methane, SMRCase 3: Plastic/Stover, OxyfuelCase 4: Plastic/Stover, SteamCase 5: Plastic/Stover, Sorbent/SteamCase 6: Plastic/StoverAir
Gross CO2 emissions (t/h)111.4204.977.8286.8175.3171.2
NOx emisions (lbs/MMBtu fired)0.871.100.470.000.630.00
CO emissions (lbs/MMBtu fired)0.130.340.274.090.359.94
H2S emissions (lbs/MMBtu fired)0.000.000.000.000.000.01
Chloride Emissions (t/h)0.3790.0010.310.310.150.31
Ash Emissions (Bottom + Fly) (t/h)15.40.01548.788.785.988.78
Waste Water Flow (t/h)57.6106.558997.6471.1215.8
Disclaimer/Publisher’s Note: The statements, opinions and data contained in all publications are solely those of the individual author(s) and contributor(s) and not of MDPI and/or the editor(s). MDPI and/or the editor(s) disclaim responsibility for any injury to people or property resulting from any ideas, methods, instructions or products referred to in the content.

