Article

Applying a 2 kW Polymer Membrane Fuel-Cell Stack to Building Hybrid Power Sources for Unmanned Ground Vehicles

1
Faculty of Energy and Fuels, AGH University of Krakow, Av. Mickiewicza 30, 30-059 Krakow, Poland
2
Łukasiewicz Research Network—Industrial Research Institute for Automation and Measurements PIAP, Av. Jerozolimskie 202, 02-486 Warsaw, Poland
3
Faculty of Electrical Engineering, Automatics, Computer Science and Biomedical Engineering, AGH University of Krakow, Av. Mickiewicza 30, 30-059 Krakow, Poland
*
Author to whom correspondence should be addressed.
Energies 2023, 16(22), 7531; https://doi.org/10.3390/en16227531
Submission received: 29 September 2023 / Revised: 4 November 2023 / Accepted: 8 November 2023 / Published: 12 November 2023
(This article belongs to the Special Issue Hydrogen Energy Generation, Storage, Transportation and Utilization)

Abstract

:
The novel constructions of hybrid energy sources using polymer electrolyte fuel cells (PEMFCs), and supercapacitors are developed. Studies on the energy demand and peak electrical power of unmanned ground vehicles (UGVs) weighing up to 100 kg were conducted under various conditions. It was found that the average electrical power required does not exceed ~2 kW under all conditions studied. However, under the dynamic electrical load of the electric drive of mobile robots, the short peak power exceeded 2 kW, and the highest current load was in the range of 80–90 A. The electrical performance of a family of PEMFC stacks built in open-cathode mode was determined. A hydrogen-usage control strategy for power generation, cleaning processes, and humidification was analysed. The integration of a PEMFC stack with a bank of supercapacitors makes it possible to mitigate the voltage dips. These occur periodically at short time intervals as a result of short-circuit operation. In the second construction, the recovery of electrical energy dissipated by a short-circuit unit (SCU) was also demonstrated in the integrated PEMFC stack and supercapacitor bank system. The concept of an energy-efficient, mobile, and environmentally friendly hydrogen charging unit has been proposed. It comprises (i) a hydrogen anion exchange membrane electrolyser, (ii) a photovoltaic installation, (iii) a battery storage, (iv) a hydrogen buffer storage in a buffer tank, (v) a hydrogen compression unit, and (vi) composite tanks.

1. Introduction

Unmanned ground vehicles (UGVs) are a group of mobile robots that operate on land. Nowadays, an increasing number of specialised operations are automatically and autonomously performed by mobile robots in indoor and outdoor environments. These UGVs are used to avoid human intervention in hazardous environments, including chemical, biological, radiological, nuclear, and high-yield explosive (CBRN&E) situations. Mobile robots intended for these services are characterised by high mobility, allowing them to carry out activities on uneven terrain. Teleoperated devices move the operator away from the threat, and a set of interchangeable accessories enables a wide range of applications, such as explosive vapour sensors, CBRN&E sensors, portable X-ray scanners, shotgun mounts with a camera and a collimator sight, glass breakers, other pyrotechnic devices, and multispectral observation systems [1,2].
Current UGVs weighing up to 100 kg are mainly equipped with electric propulsion. Electric-drive systems for moving robots are characterised by high overall electrical efficiency; currently, the highest efficiency for small electric motors is achieved by using machines with permanent magnets. Due to their uncomplicated management system, brushless direct current (BLDC) motors with permanent magnets are often used in electric drives. One of the main advantages of electric drives compared to diesel combustion engines is that they do not emit pollutants into the environment. The main toxic pollutants included in outlet gases from diesel combustion engines can be listed as nitrogen oxides (NOx), carbon oxide (CO), hydrocarbons (HC), sulphur oxides (SOx), and carbon dioxide (CO2) [3,4].
Other advantages of electric propulsion units compared to combustion engines include reducing the noise level and limiting the thermal signature, which makes it challenging to identify the robot during activities and prevents detection and potential destruction. The main challenge for manufacturers of mobile robots for civilian and military applications is extending their operating time. This issue is directly related to elaborating new high-efficiency and cost-effective power sources. The development of new constructions of high-efficiency electrical propulsion units requires intensified work in the field of mathematical modelling, development of variant numerical models using machine-learning technology, construction, and analysis of objects in digital twin technology. These results will be suitable for predicting the electrical profile load and predicting operating time combined with the analysis of data from geospatial information environmental and climatic parameters. Other inherent scopes of developing new energy-effective mobile robots require experimental investigations performed in stationary conditions as well as during the moving of vehicles in real operational conditions [5,6,7,8,9,10].
Electrochemical batteries have historically been the primary power source, but their operating time does not exceed 5–6 h for such a medium-sized UGV platform. The limited operating time of lithium-ion batteries restricts several mobile-robot applications, especially military, firefighting, agriculture, and other special applications. The construction of a hybrid drive unit made of an internal combustion engine combined with an electric motor using electrochemical batteries is one of the possible options for extending the operation time and range. A second possible solution could be the application of fuel-cell technology to construct hybrid electrochemical sources for electric propulsion systems [11,12].
Fuel cells are electrochemical devices that directly convert the chemical energy of fuels into electricity, with hydrogen being the fuel used most often. Among the most well-known types of fuel cells, low-temperature polymer electrolyte fuel cells (PEMFCs) are already used commercially as components of hybrid power sources for supplying electric vehicles, forklifts, and drones [13,14].
The application of solid oxide fuel cells (SOFCs) is also possible in constructing hybrid power sources in electrical propulsions of unmanned ground or aerial vehicles. The main advantage is currently the possibility of using hydrocarbon fuels commonly used in aviation or military applications. Power sources involving SOFC technology are directly integrated with the hydrocarbon fuel reforming system. The product of the reforming process is hydrogen, which supplies the SOFC fuel cells. It is worth noting that, in the future, there is potential for the development of a new generation of environmentally friendly fuels and improved performance and constructions in the field of protonic ceramic fuel cells (PCFCs). In the case of cost-effective PCFC stacks with improved durability and reliability as power sources for small electric propulsion, it will be acceptable for commercial applications [15,16]. Ceramic fuel cells, both SOFCs and PCFCs, have a far greater degree of tolerance to the content of impurities contained in hydrogen gas. This eliminates the need to use high-purity hydrogen, as in the case of PEMFCs [17,18].
The main challenges of the hybrid power source are providing the propulsion system with electrical power according to the required electrical load profile and distributing the energy needed for the power control, measurement and monitoring devices, built-in computers or computing units, and diagnostic sensors used during the mission [19,20]. Meldrum et al. investigated the possibility of applying PEMFCs as the primary electrochemical power sources for small military UGVs and recommended hydrogen-powered proton exchange membrane fuel cells as the most appropriate alternative energy source. The main advantages are associated with the developmental and commercialisation advances, making the PEMFC technology a ‘drop-in plugin’ for immediate use [21,22].
Isorna F. et al. demonstrated the use of UGVs in precision agriculture. It was determined that UGVs with power sources involving PEMFCs have an autonomous system that allows them to follow preprogrammed routes. They are supported by GPS, LIDAR, and a video camera [23].
In the literature, the data for systematic studies of applications for PEMFCs as part of hybrid propulsion units for UGVs are limited. There is a lack of research on integrating dynamic analysis of the electrical power-load profile and understanding the energy demand based on the type of UGV platform. There is also an absence of recommendations for choosing a type of hybrid power source—fuel cells plus batteries or fuel cells plus supercapacitors. However, the BLDC motor-based propulsion system’s electric load profile is characterised by dynamic profile variations of electrical load vs. time. An important issue to be addressed is developing an electrochemical power source with fuel cells that can cover peak electrical current requirements. This is crucial not only from the standpoint of UGV mobility but also for the durability of such a platform. A high current peak required from the power source can lead to the possible destruction of individual polymer electrolyte fuel cells in the PEMFC stack [24,25].
The next critical issue for applying hydrogen PEMFCs is identifying hydrogen sources and storage technology that can ensure longer operation time for the fuel cells. Compressed hydrogen gas can be stored in composite cylinders at pressures of 350–700 bar. Storing hydrogen by compressing it to high pressures is an energy-intensive process, and the lack of dispersed small hydrogen-refuelling points, and the attendant transport and storage, raises many technical and economic issues [26,27]. One of the possibilities for developing mobile hydrogen-refuelling chargers involves supplying hydrogen tanks. A small mobile hydrogen station can be built from renewable energy sources, mainly photovoltaic installations, electrochemical batteries (as electricity storage), and modular hydrogen electrolysers for hydrogen production and energy-efficient devices that allow for an increase in hydrogen pressure to above 300 bar in composite tanks [28,29]. On the other hand, low-pressure hydrogen storage in solid form (mainly reversible hydrogen intermetallic compounds) is also possible for UGVs. The application of such hydrogen storage technology can be limited by its mass and volumetric dimensions and by kinetic phenomena related to hydrogen absorption and desorption processes [30,31].
This paper aims to present results focused on investigations of a tracked mobile robot’s electrical load profile and peak-power electrical load, which are necessary to design an electrically efficient hybrid power source containing a hydrogen-supplied PEMFC stack. Comparative electrical investigations of a PEMFC stack integrated with supercapacitor banks are presented. The research also offers experimental studies on the energy efficiency of green hydrogen production using a photovoltaic installation equipped with battery energy storage, a hydrogen electrolyser, and a compression system to store hydrogen under 350 bar pressure in two composite tanks.

2. Experimental Part

2.1. Description of the Chosen Research Platform, PIAP Patrol

The PIAP Patrol is a medium-sized tracked UGV designed to detect CBRN&E risks and neutralise improvised explosive devices. Thanks to its size and drive system, it can be used for various operations inside buildings and in rugged terrain conditions. The robot’s compact and modular design allows for easy transportation, even in a passenger car. The robot is equipped with a manipulator featuring six degrees of freedom and a gripper with a clamping function, enabling it to be used for observations, transport, and grasping objects weighing up to 22 kg. The manipulator has a reach of 2 m, ensuring a wide range of movement on every plane [32].
Figure 1 shows a photograph of the PIAP Patrol UGV performing an investigation. Basic technical data of the PIAP Patrol is listen in Table 1.

2.2. Preliminary Estimation of the Electrical Load Profile for Tracked UGVs

In mobile robotics, one of the basic metrics for UGVs is mobility. This term includes a set of features that reflects the vehicle’s manoeuvrability and dynamics in various terrain conditions. To meet the desired mobility criteria and requirements for the electrical power of the drive system, recommendations developed by the United States Army are used [34].
Based on the comparison of the technical data recommended in item [34], with existing market solutions, it can be concluded that the range of unit power for vehicles up to 907.18 kg is in the range of 14.91–29.83 kW/ton.
Specific power γ is expressed by mathematic Formula (1)
γ = N S m b + Δ m
where: γ—specific power [kW/ton]; mb—mass of the vehicle base [ton]; Δm—mass of other components installed on the vehicle base [kg]; and NS—mechanical propulsion power [kW].
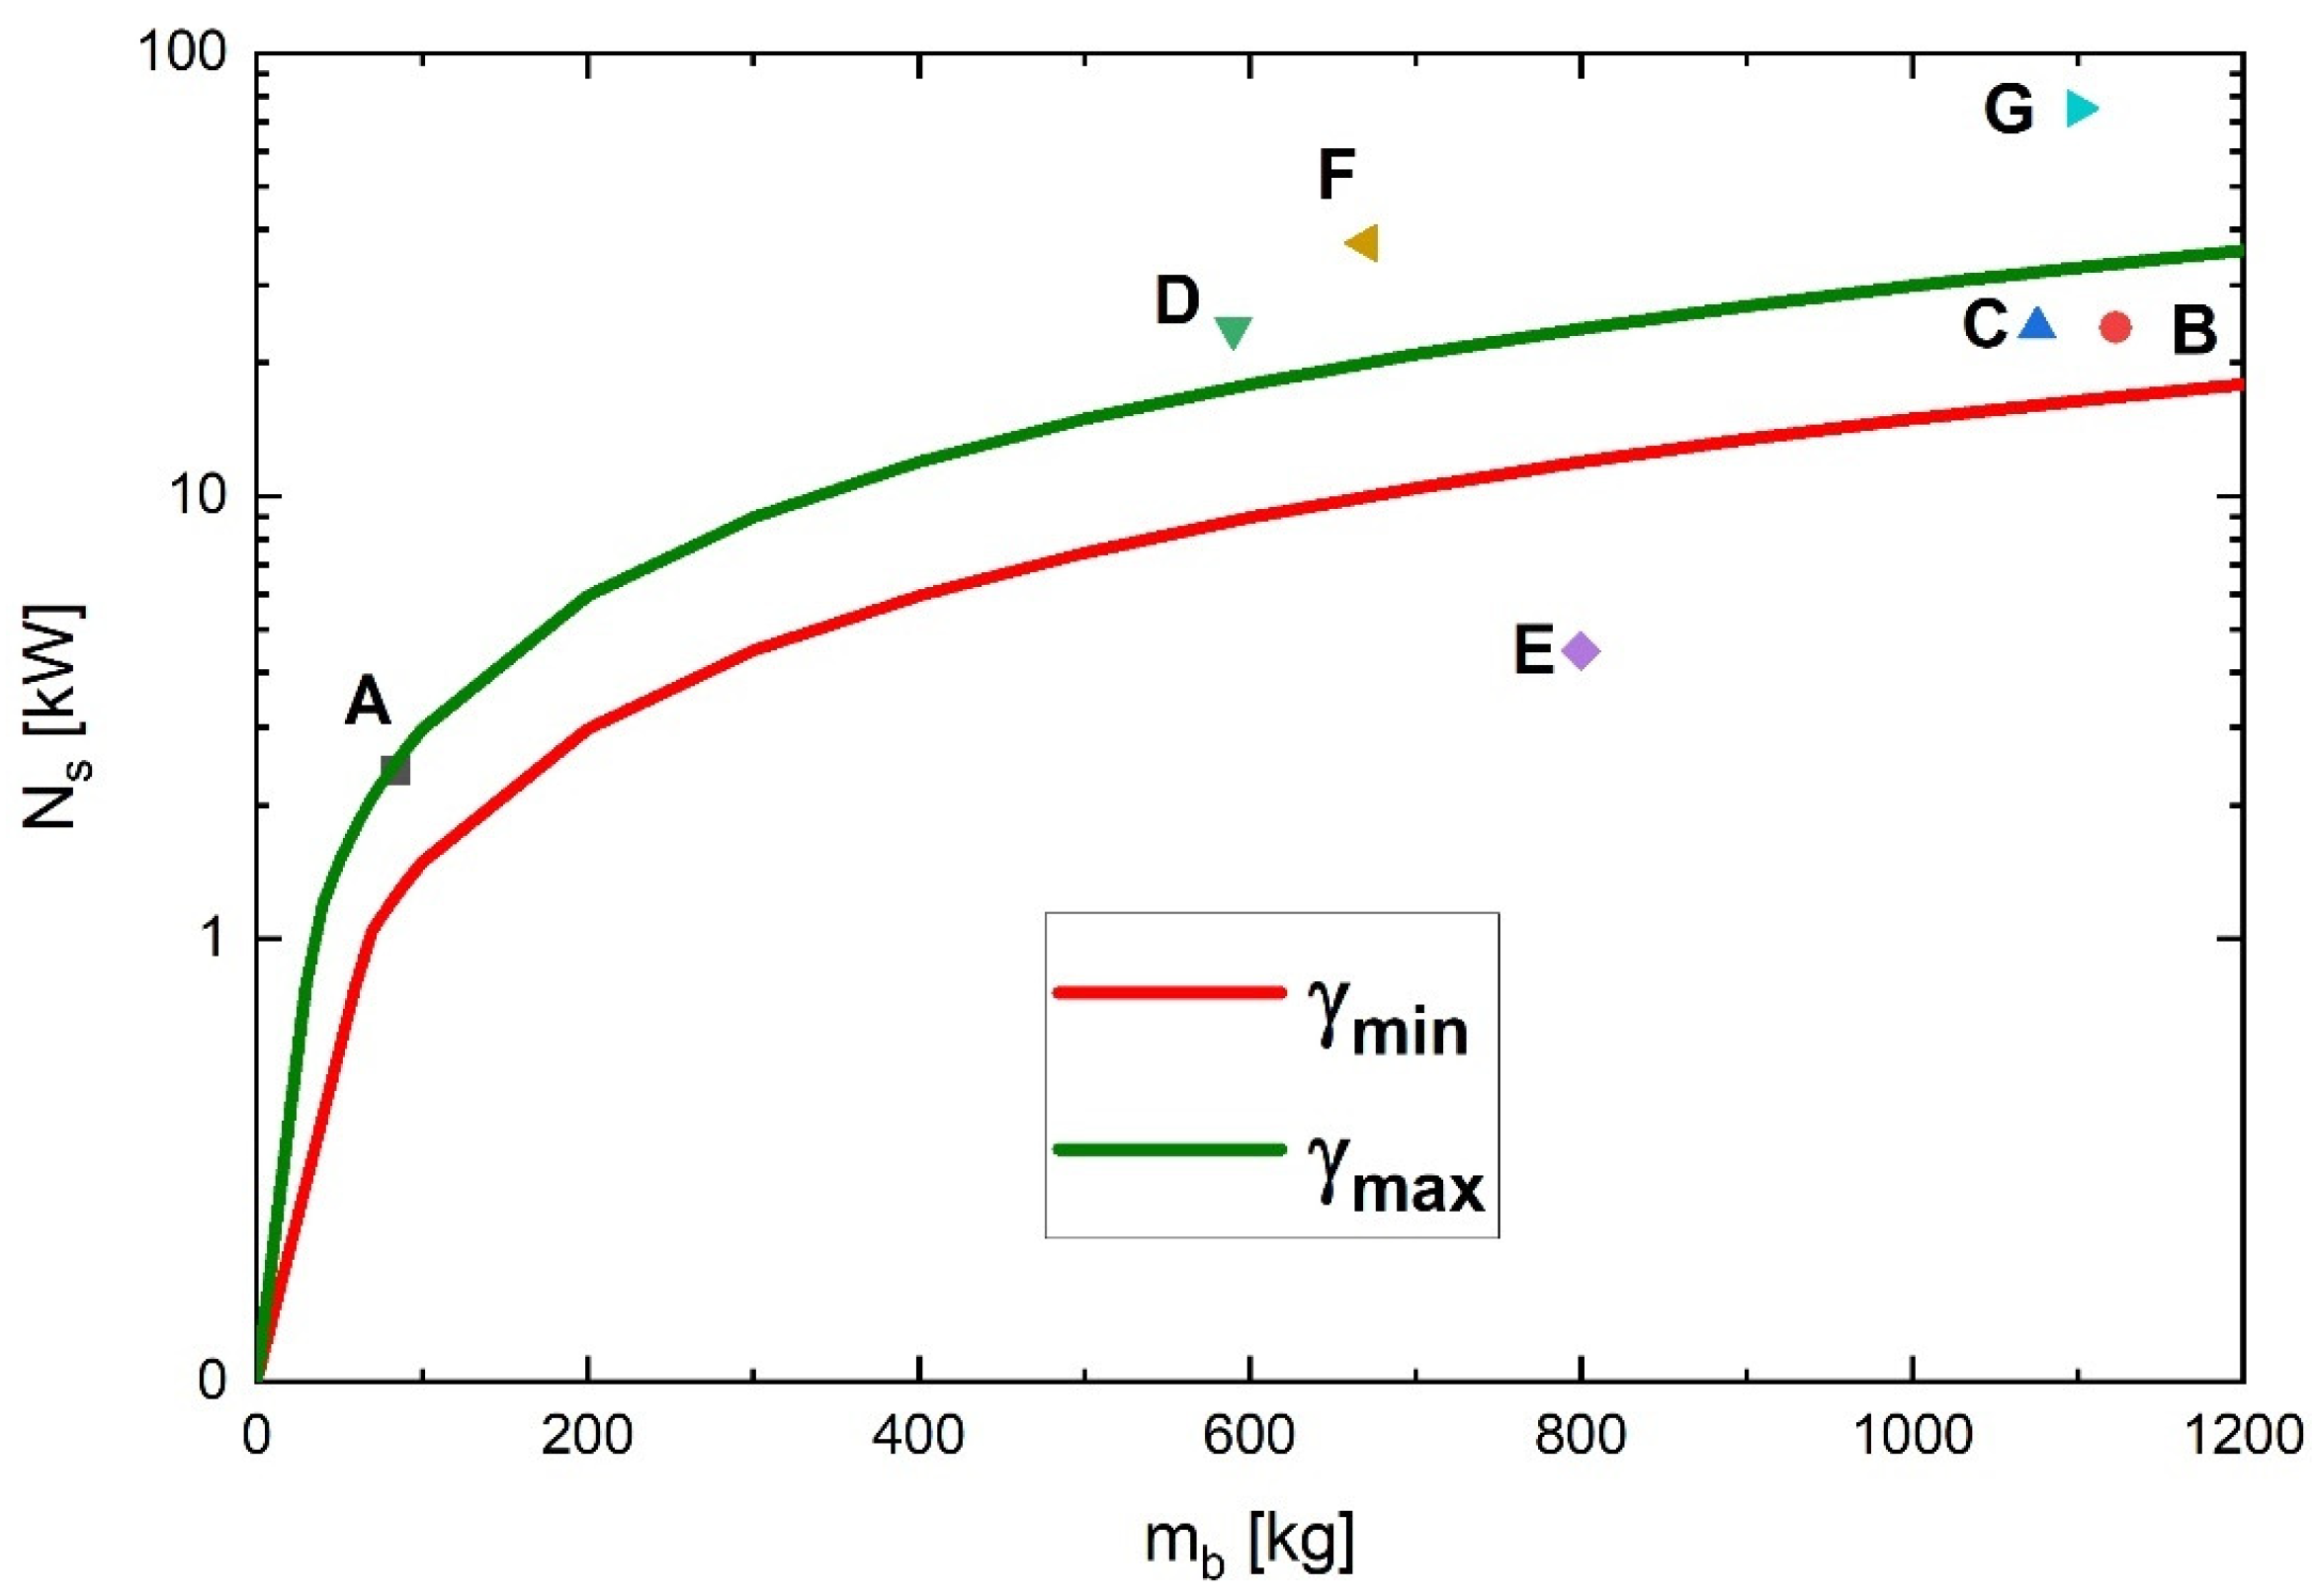
Figure 2 shows the calculated values of Ns for the investigated platform, PIAP Patrol. In this graph, the calculated values of γmin and γmax (red and green lines) are also added.
Figure 2 provides an overview of existing mobile platforms for which data regarding the drive system have been made public (vehicle database without payload). Platform-M possesses limited drive-system power, suggesting a restricted ability to overcome obstacles. In the case of a research platform with a tracked drive, additional accessories, such as a polymer membrane fuel-cell stack installation, can be installed based on payload requirements. According to the relationship determined in Figure 2, the drive system of the research platform has an upper limit of recommended power, which is associated with the possibility of installing additional accessories like a manipulator, explosive vapour sensors, CBRN&E sensors, a portable X-ray radiation scanner, a shotgun mount with camera and collimator sight, glass breakers, other pyrotechnic devices, and multispectral observation systems.

2.3. Measurement of Electrical Load Profile with the UGV Research Platform Moving on Different Surfaces

The electrical power demand related to the tracked UGV in real operating conditions was measured under various terrain and weather conditions. The research UGV had its manipulator removed, and a measuring system was installed. This system had the potential to save measurement data on a nonvolatile memory device. The total weight of such a set reached 84 kg (ca. 185 lb). The selection of the research grounds and measurement sections was preceded by an analysis based on publicly available spatial information provided by the head office of Geodesy and Cartography (GUGiK in Polish), particularly the digital terrain map tools (NMT in Polish). Measurements were carried out in a diverse area in terms of (i) ground (outside the building), gravel, asphalt, cobblestones, low grass, medium grass, snow, and ice; and (ii) inside the building, PVC floor.
In Figure 3, the experimental setup was installed on the UGV platform to measure the electrical load profile during rides on different surfaces of varying degrees of hardness (grass, ice, ice road, unpaved road, and rocky road).
The elaborated methodology enables the estimation of the impact of individual resistance values, which requires aggregating operational data in an environment close to the real one. For this purpose, electrical parameters of current—I(n) and voltage—U(n) output from the energy source used (electrochemical battery) plus GNSS RTK precise location data and inertial data are recorded. Measurements were carried out in a diverse area, including the ground outside the building (gravel, asphalt, cobblestones, low grass, medium grass, snow, and ice) and inside the building (PVC floor).

2.4. Energy-Efficiency Investigations of 2–5 kW PEMFC Stacks Cooled by Air and Supplied by Gaseous Hydrogen

In the investigations described here, the family of 2–3 kW PEMFC stacks was chosen for the investigations. The PEMFC stacks used in this study were constructed in open-cathode modes and were air cooled. The fan system is responsible for supplying air [41,42,43].
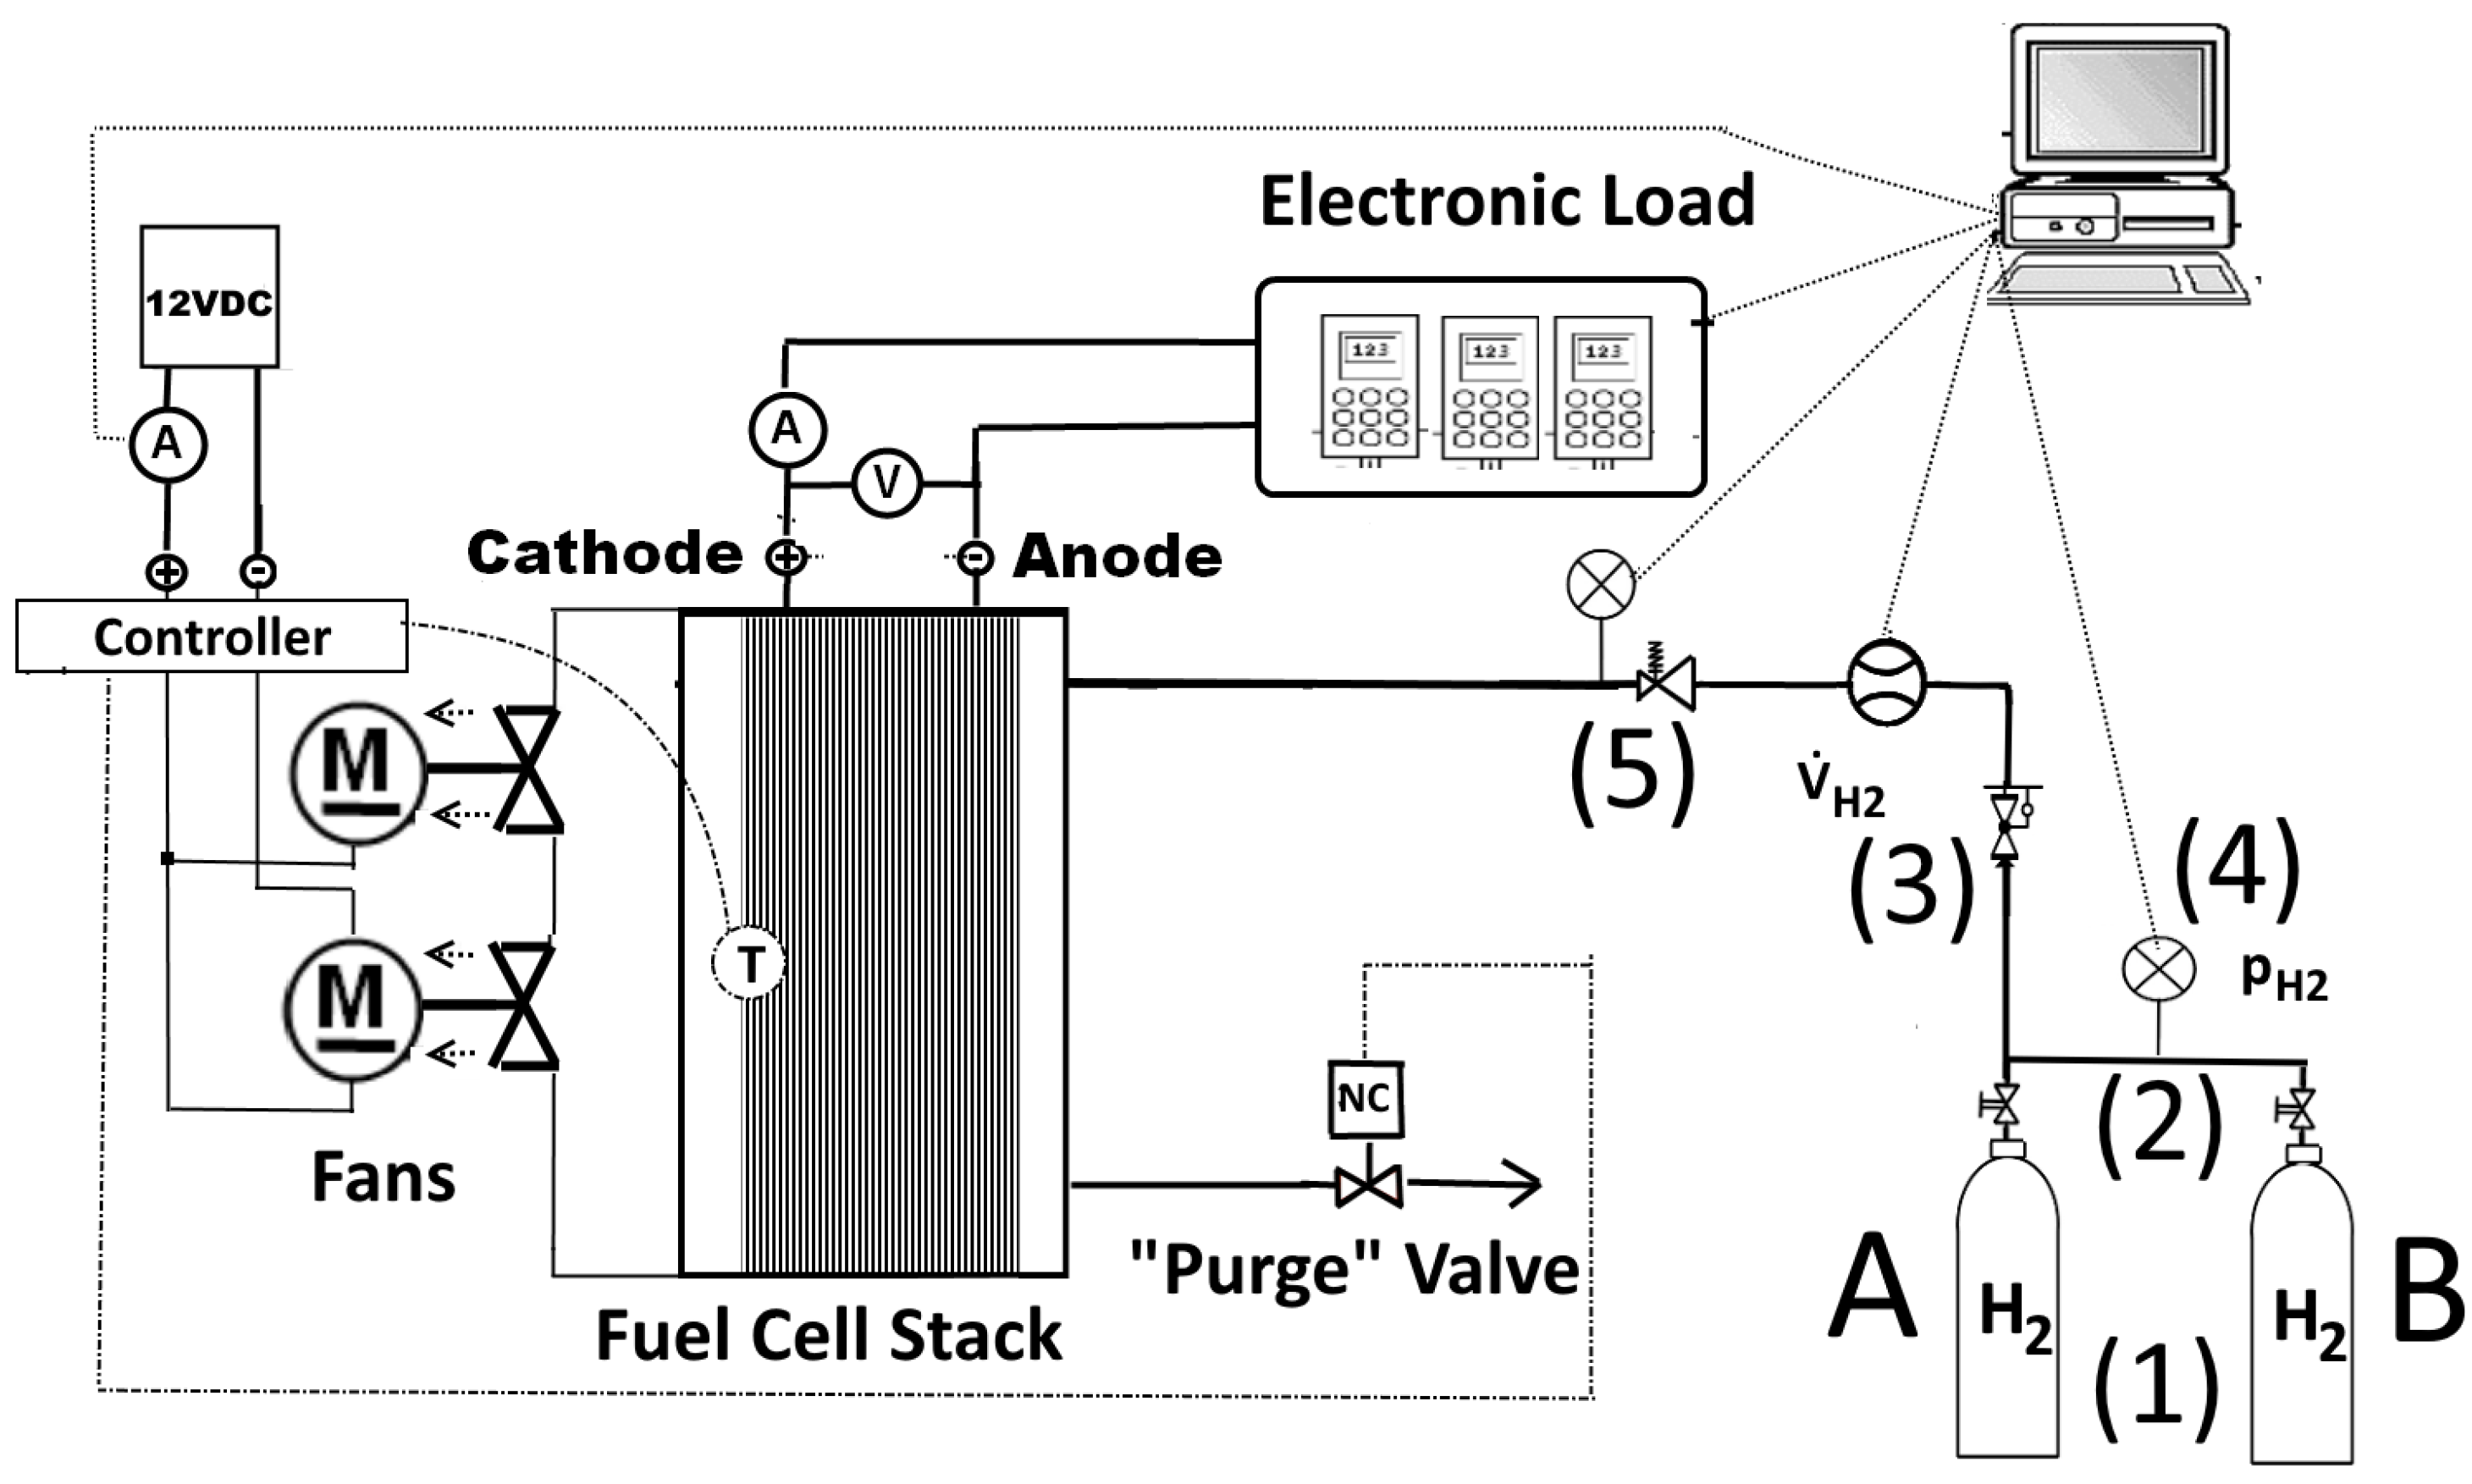
During the electrical investigations (Figure 4), the compressed hydrogen fuel was stored in two ultralight composite cylinders (A and B). Two composite tanks with a capacity of 6.8 Ndm3 (H2 Planet, Italy) were used. The ultralight H2 composite tanks (1) were connected in parallel using steel tubes (2) with one pressure regulator (3), a single-stage high/medium-pressure regulator (high pressure = 350–400 bar, medium pressure = 5–10 bar), and a pressure sensor (4) for the hydrogen stored inside the tanks. An electronic pressure sensor and an electronic pressure regulator (5) (from medium pressure of 10 bar to low pressure of 0.5 bar), linked directly to the anode space of the PEMFC stacks, were connected to the system. The air for cooling the PEMFC stack and air for cathodic electrochemical reactions is supplied through channels in the bipolar plates. The investigated fuel cells operate in the so-called closed-anode PEMFC stacks configuration, meaning that the hydrogen outlet from the fuel cells is normally closed (NC—normal close) by means of a solenoid purge valve. To purge the anode side of the PEMFC stack, the valve is opened frequently by the stack controller. During the operation of the stack, auxiliary devices (cooling fans, solenoid valves, and monitoring and measurement systems) were powered by a laboratory DC power supply via a step-down converter that reduced voltage to 12 VDC. The amount of electrical power consumed by the auxiliary devices representing the so-called ‘own’ needs of the fuel-cell stack was recorded using a Power Log 6S data logger. The electrical parameters of the 2 kW–3 kW PEMFC stacks were determined using a Chroma 63202 electronic load (2600 W/0–50 A/0–600 V) for a current range from 0–50 A (power < 2 kW). For higher currents (I > 50 A), an additional resistive load was used. We also use another electronic load Chroma 63206 (6000 W/0–420 A/0–600 V).
Voltage measurements were made with an Agilent 34410 A voltmeter (Agilent, Santa Clara, CA, USA) (6.5 digits) and current measurements with an Agilent 34411 A multimeter (Agilent, Santa Clara, CA, USA) (6.5 digits) using a 150 A/60 mV current shunt. Measurement data were recorded on a PC with dedicated software. During the electrical tests of the 2–5 kW PEMFC stacks, the temperature of the fuel-cell membranes in the PEMFC stack was monitored by temperature sensors.
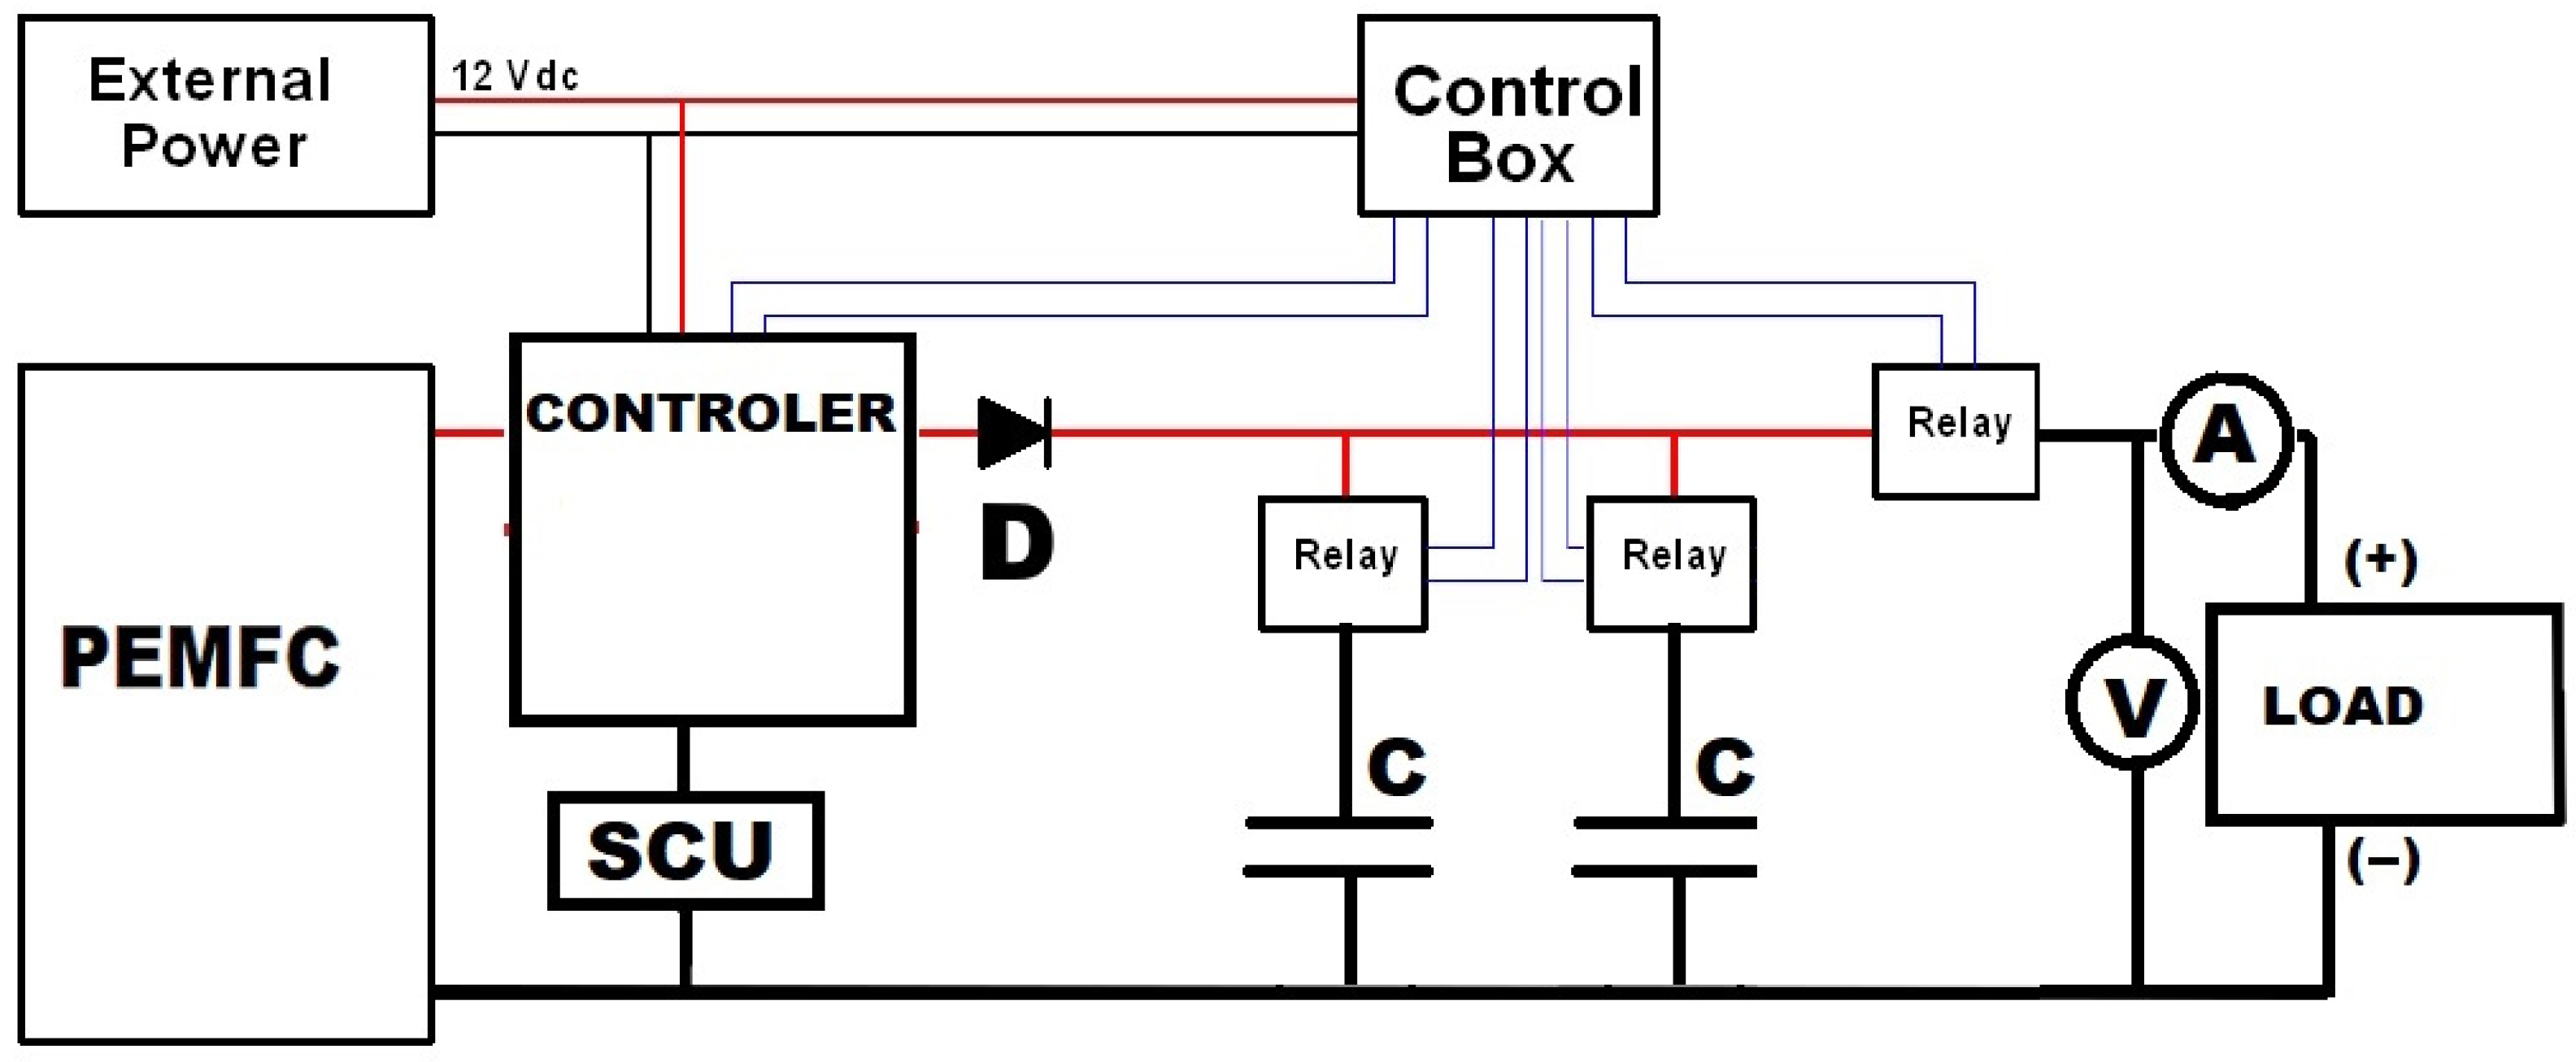
The integration of the 2 kW PEMFC stack with a supercapacitor battery (Hy-Caps 4,16 F 60 V H2 Planet Italy) is also presented in Figure 5.
The possibility of recovering electrical energy dissipated during the operating short circuit unit (SCU) in the PEMFC stack exists. The SCU is a device responsible for humidifying the polymer electrolyte membrane in the PEMFC stack. The short-circuit method has also been found to improve the performance of fuel cells by stripping oxides and other adsorbed species from platinum, which requires systematically understanding the effect of the short-circuit method’s parameters on fuel-cell performance [44].
Figure 6 shows another option for the integration of a PEMFC stack with a supercapacitor battery.
Figure 6 shows a block diagram of the SCU system designed to improve the operating parameters of the stack of PEMFCs with energy recovery using supercapacitor banks. The essence of the proposed solution lies in its integration into the circuit containing the stack of PEMFCs (1) through a power transistor (5) or a supercapacitor bank C (4), capable of storing the charge from the short-circuit current. Diode (2) in line to electronic load (3). The energy stored in the supercapacitor bank is recovered after the short circuit ends and the power transistor (5) is disconnected. In the subsequent stage, the power transistor (6) is employed to activate the supercapacitor bank C (4) as a source of direct current for the DC–DC converter (8), whose output is connected to serve as an additional power supply for the microcontroller unit MCU (7) of the stack of PEMFCs. Consequently, the SCU system enhances the operating parameters of the stack of PEMFCs, and the energy stored in the supercapacitor bank C (4) during the short circuits of the SCU system is reclaimed and used to supply the electric loads.
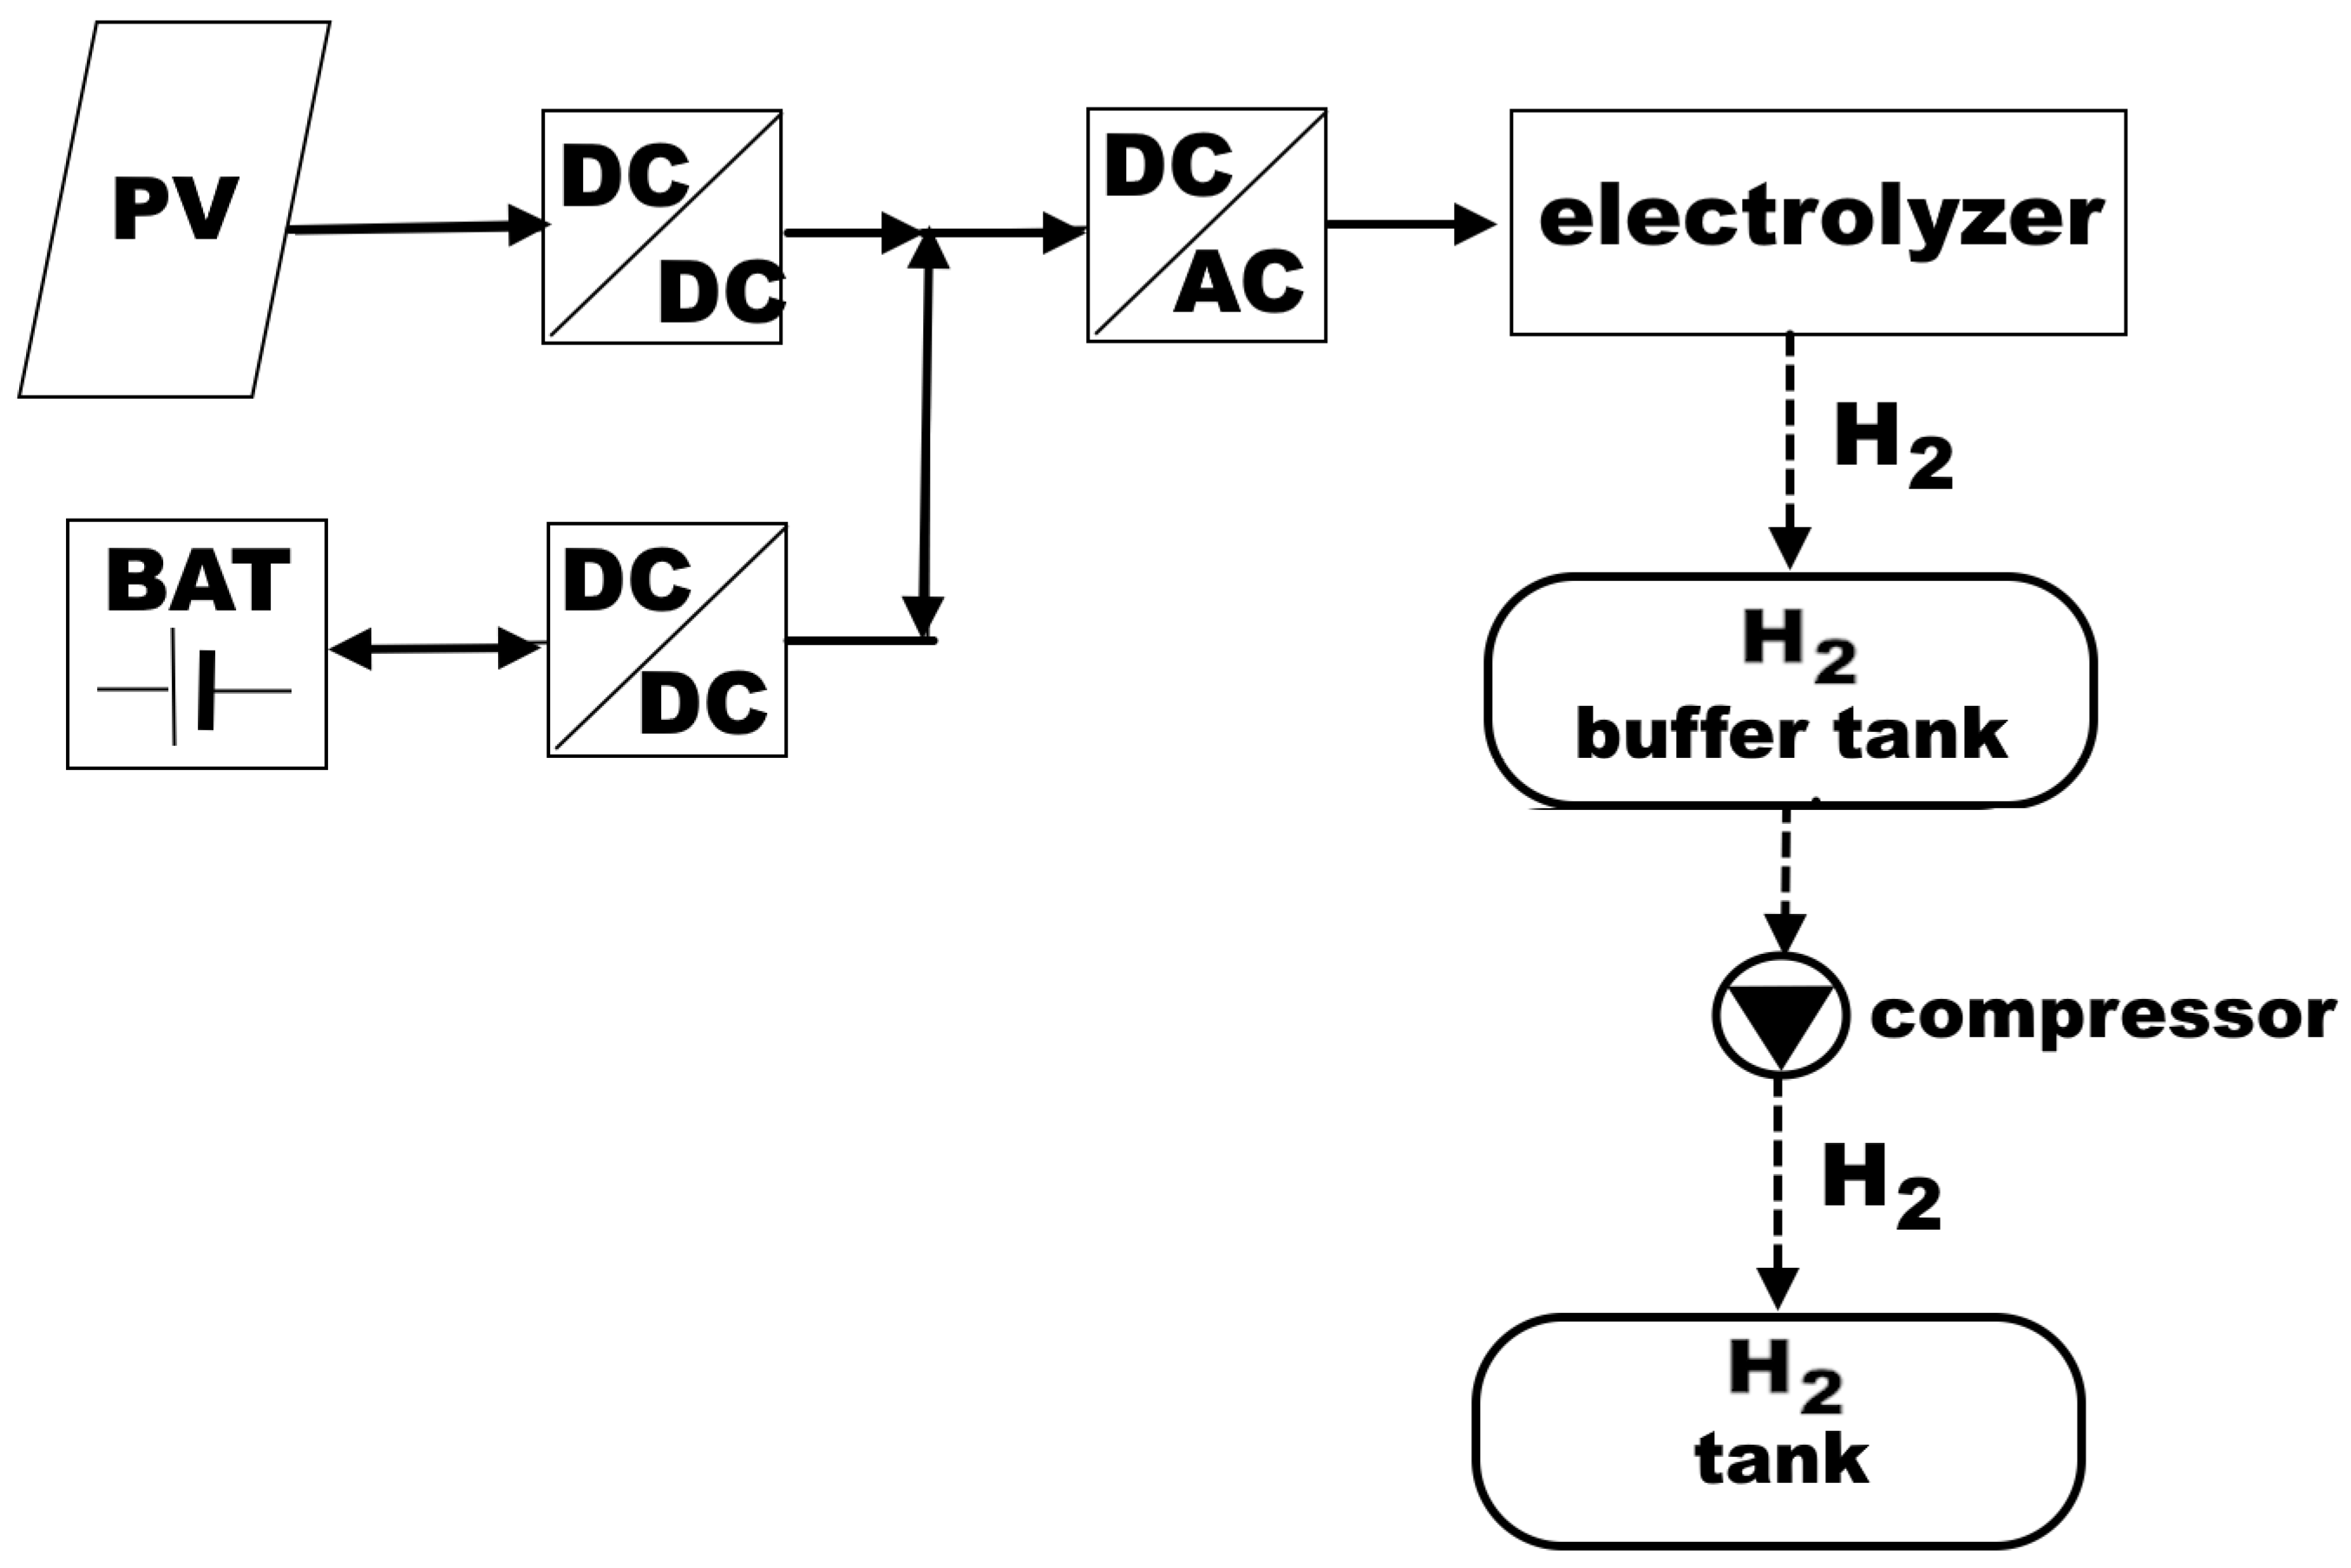
Figure 7 shows the experimental setup for investigating the efficiency of green hydrogen production via the electrolysis method using a 6.5 kW PV installation integrated with a battery storage system. The anion exchange membrane electrolyser (AEM) with a hydrogen production capacity of j = 0.5 m3 H2/h is employed in this system. The energy efficiency is estimated for a mobile system, such as a charging point unit for a hybrid power source dedicated to UGVs.
The electrical energy produced from the 6.5 kW PV installation, according to the diagram in Figure 7, is converted into direct current energy by a DC–DC converter. The direct current energy can be transferred directly to the DC–AC inverter that powers the hydrogen-producing electrolyser. The possible surpluses of PV energy using another bidirectional DC–DC converter are stored in the battery (BAT) of the battery bank. The battery bank, through a bidirectional DC–DC converter, can power, stabilise, and ensure the safe operation of the electrolyser using a DC–AC inverter when there is insufficient PV electricity, without the need to frequently turn it on and off. The hydrogen obtained from the electrolyser is collected in the H2 buffer tank under the pressure generated by the electrolyser (30 bar).
The hydrogen is then compressed using a device (Maximator Booster DLE 15-2-GG-H2 + Booster DLE 30-2-GG-H2; Nordhausen, Germany ) and transferred to the H2 tanks, i.e., high-pressure composite tanks used for the long-term storage and distribution of hydrogen.

3. Results

3.1. Investigations of the Electrical Load Profile While Moving the UGV Research Platform

The development of a hybrid energy source with a PEMFC fuel stack, which allows the mobile robot to be used for a longer period, required accurate knowledge of the fluctuations in the vehicle’s electrical power while driving on different roads. This knowledge is necessary to achieve the maximum specific energy density and maximum energy demand for the newly developed hybrid energy sources. In operating mode, the required load profile largely determines the design of fuel cells as well as their rated power. Measurements of real-world profiles allow the elaboration of a basic operating profile that includes the standby power corresponding directly to the minimum power consumption of the vehicle, the peak power, and several power rise and fall ramps reflecting the variations of the vehicle load profile [45,46].
One of the main factors affecting the variable electricity demand for the robot’s movement is the type of road surface outside buildings and the floor inside buildings or industrial halls. The impact of velocity has also been considered.
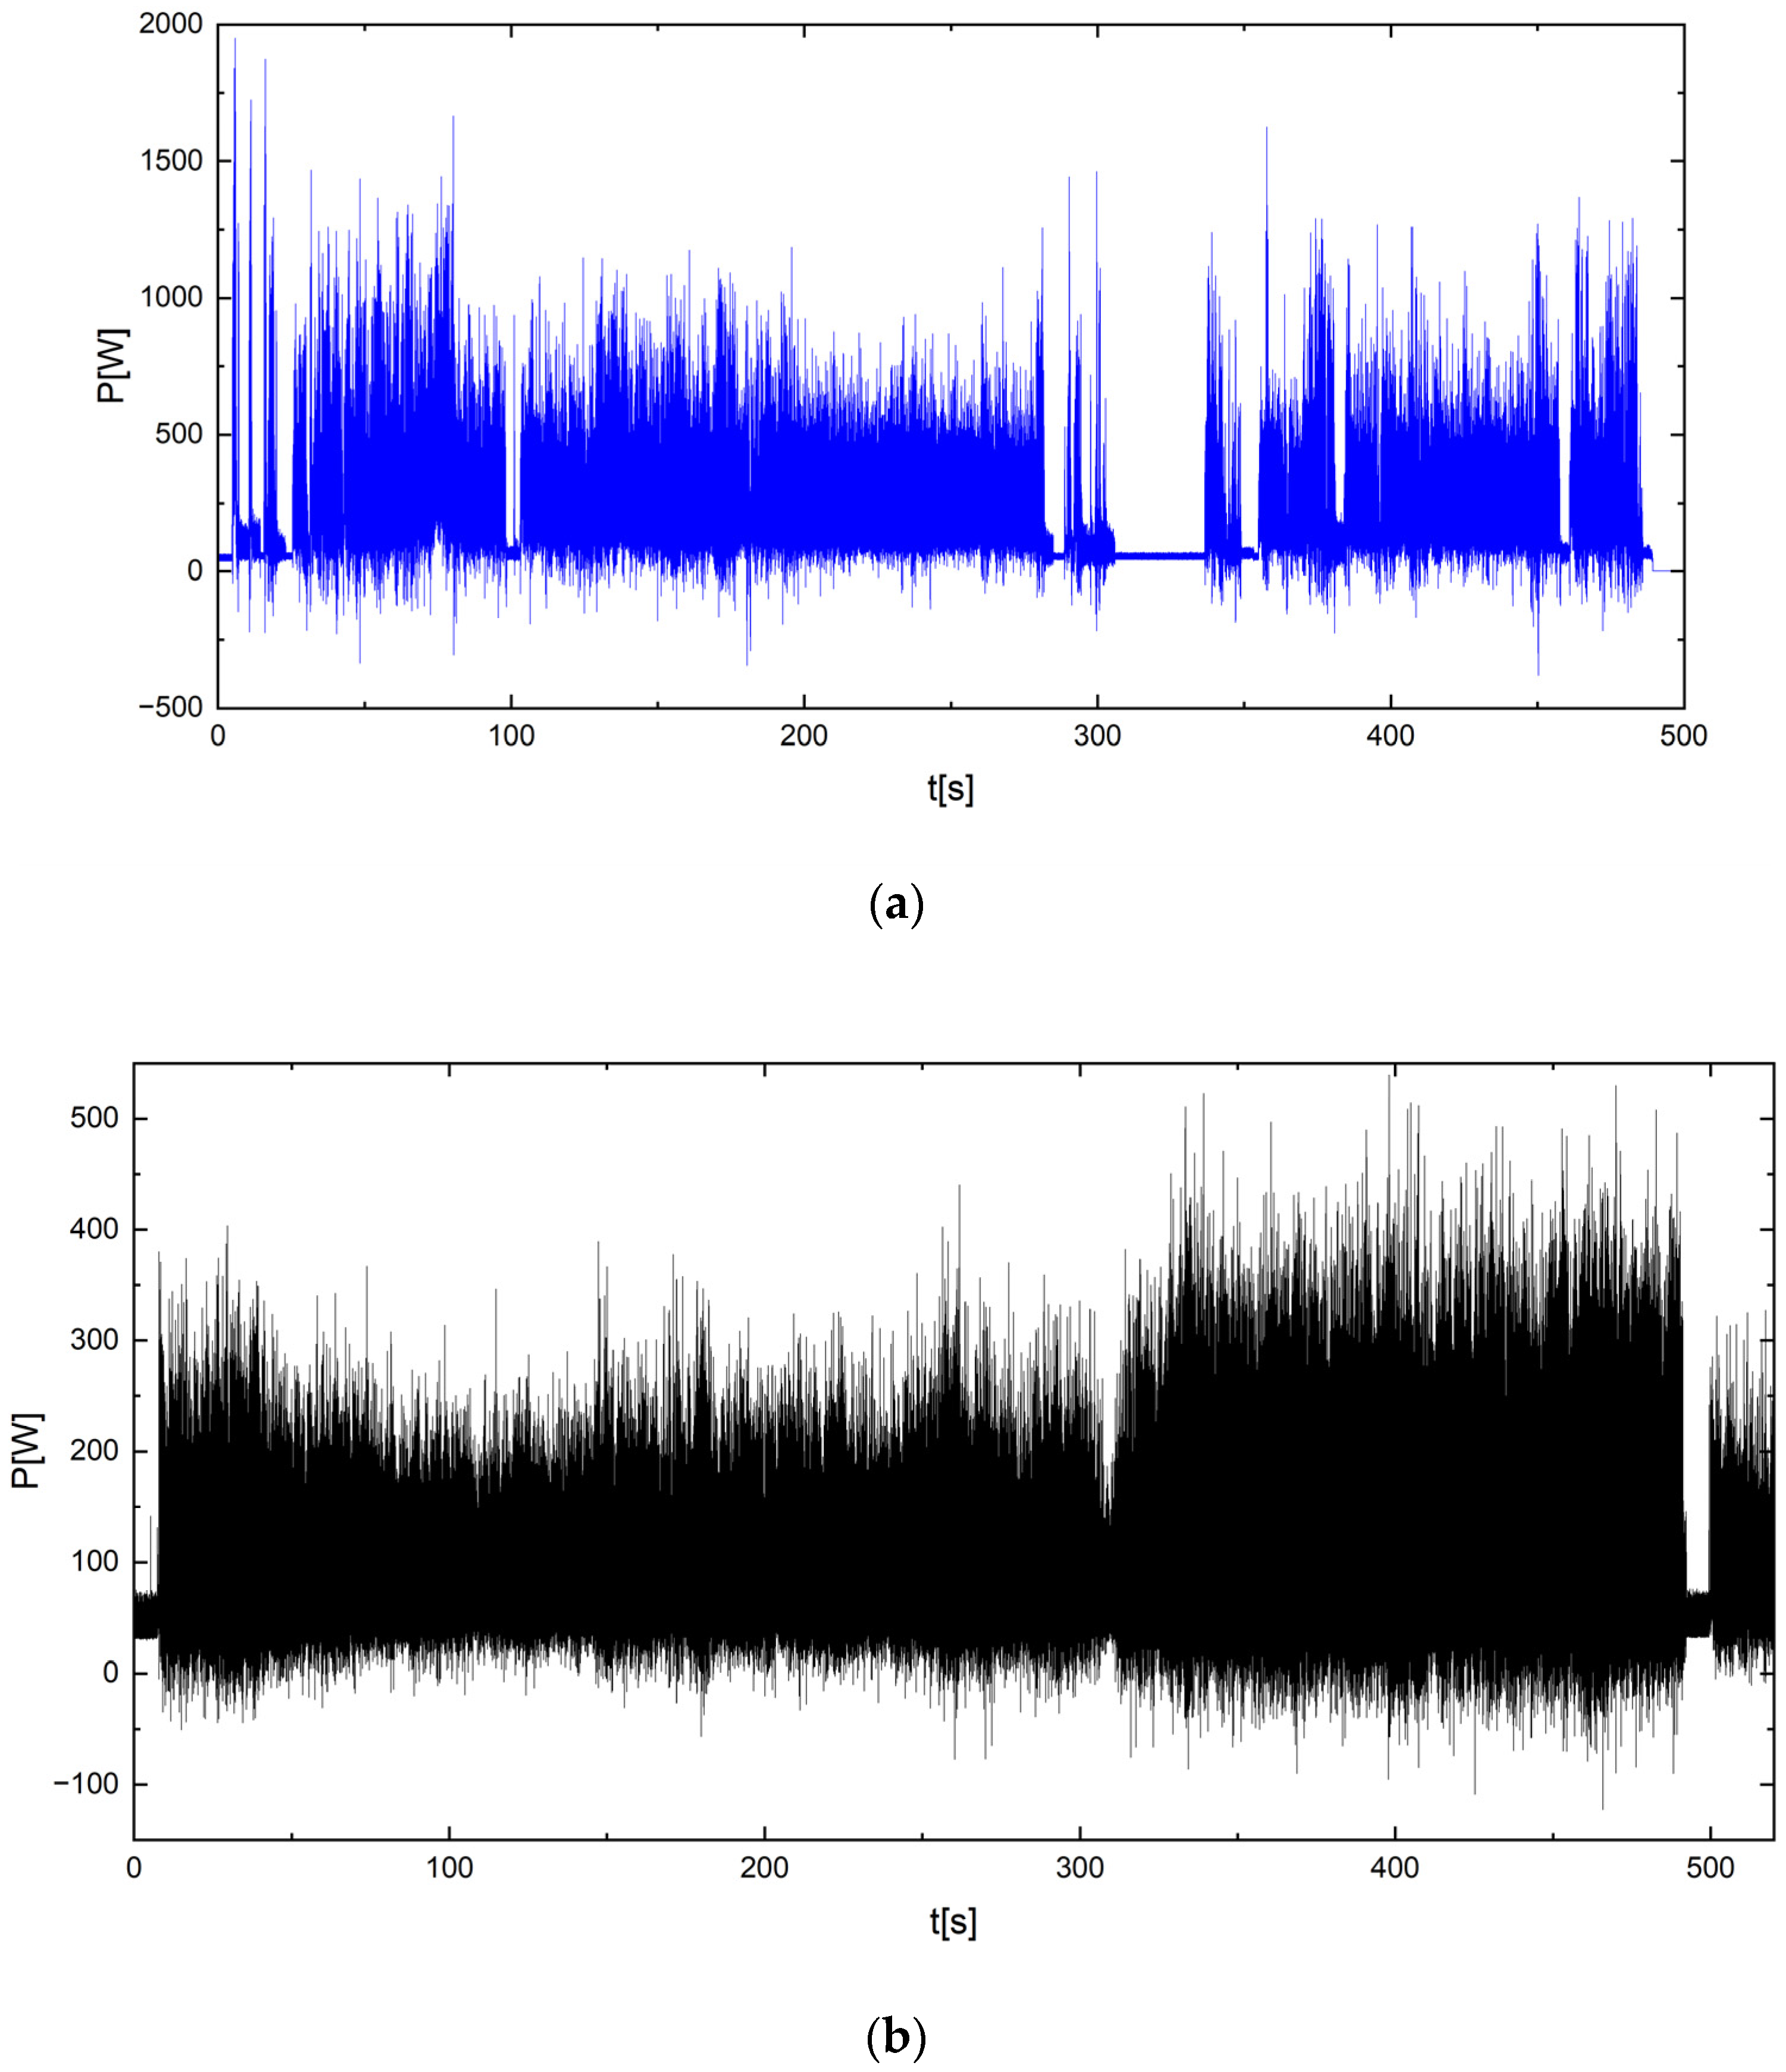
Figure 8a,b shows the electrical power consumption (P) as a function of time recorded on rocky ground and a grassy hill for the UGV research platform.
The measured electrical load profiles show that the maximum power of the vehicle is ~2000 W in the case of Figure 8a; Figure 8b shows a smoother power load profile vs. time, and the observed maximum peak power is lower, reaching a value of ~600 W.
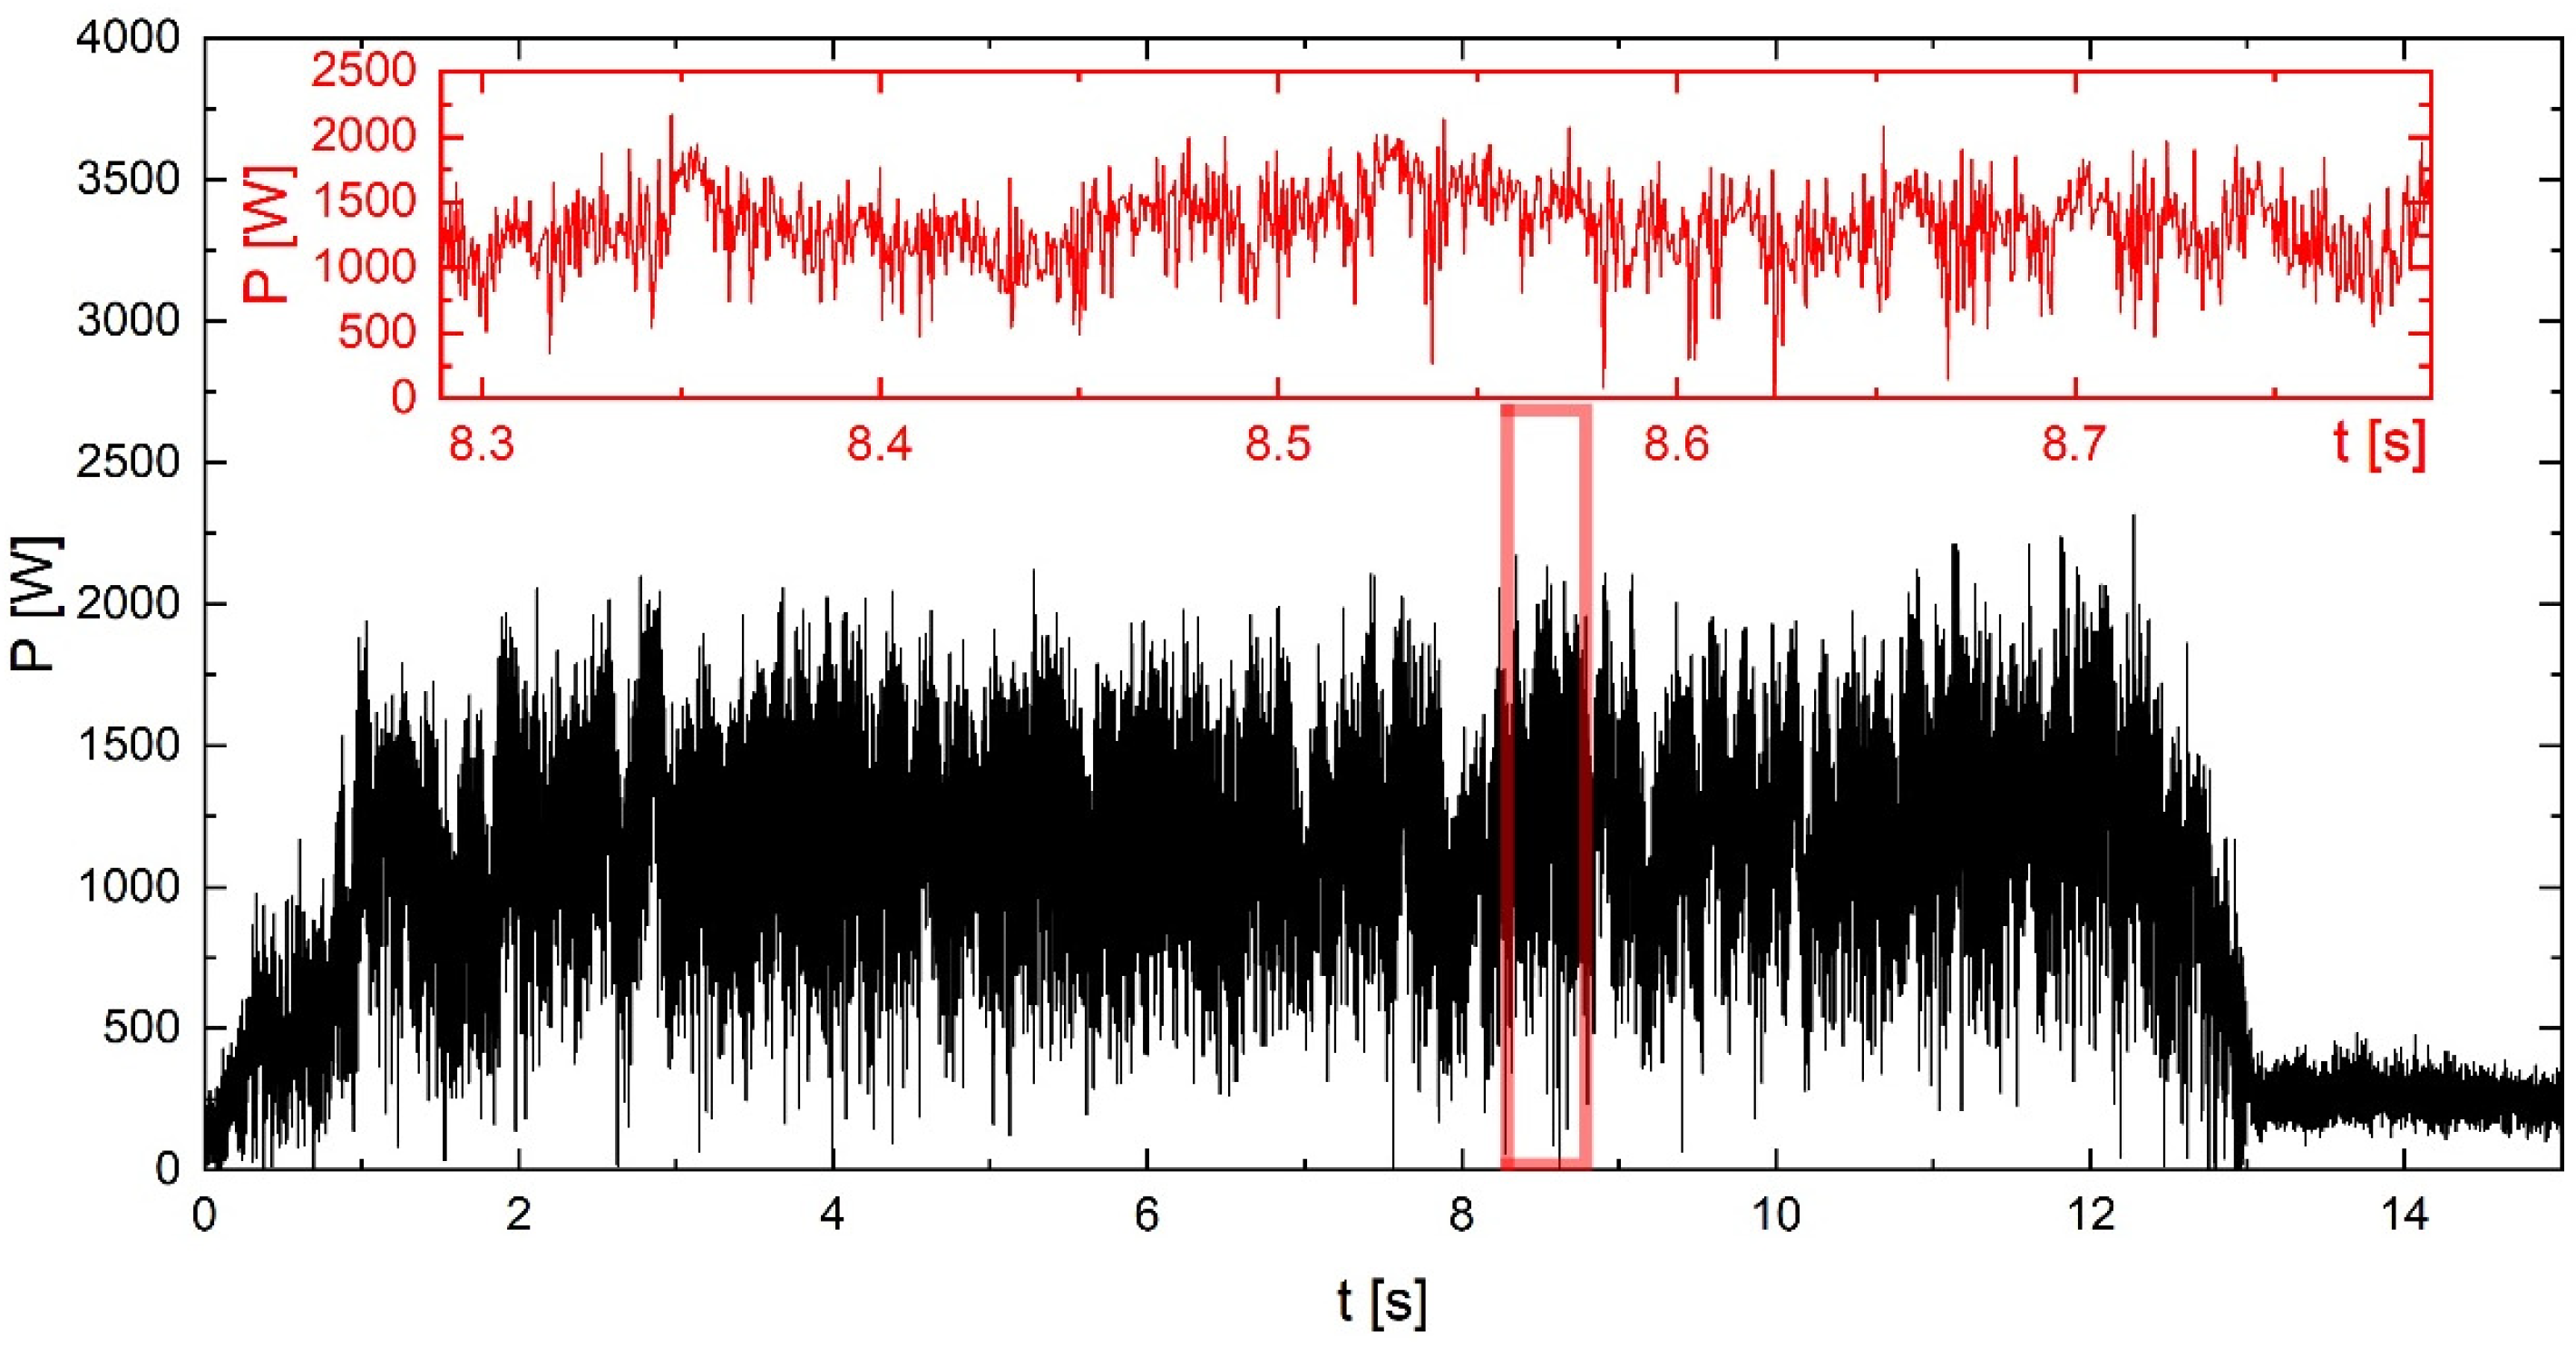
The experimental conditions reflect variations in real electrical load profiles (Figure 9) recorded when driving the investigated robot up a hill with a slope of 30 degrees.
The analysis of the electrical waveforms (Figure 10) of power (P) vs. time (t) and current (I) vs. time (t), recorded in independent electrical tests, showed an electrical power peak higher than 2000 W and electrical current load in the range of 80–90 A in the short time of operation. These electrical load profiles can be characteristic of winter conditions while riding on icy ground or slopes.
Figure 11 shows the average power consumption (P) measured at idle and during the robot’s movement at the constant speed v = 7 km/h on different road types.
Comparative analysis of the average electrical power recorded among moving robots on different types of roads revealed that the highest power demand is on snow-covered and icy roads. The recorded electrical power is approximately 1470 W. On typical outdoor surfaces, such as asphalt, grass, and indoor paths, the electrical power required was measured to be less than 1 kW, typically in the range of 500–700 W. Movement at motor idle required an electrical power of less than 200 W. Variations in the slope of the terrain in open areas of the site were another factor that affected the changes in electrical load during the movement of the robot.
Table 2 summarises the variable electrical power requirements depending on the slope of the grassy ground.
Analysis of the data in Table 2 clearly shows that an increase in ground slope causes an increase in electrical power demand from 600 W to 1700 W to move the UGV. The velocity (km/h) of the mobile robots also impacts the electrical load profile.
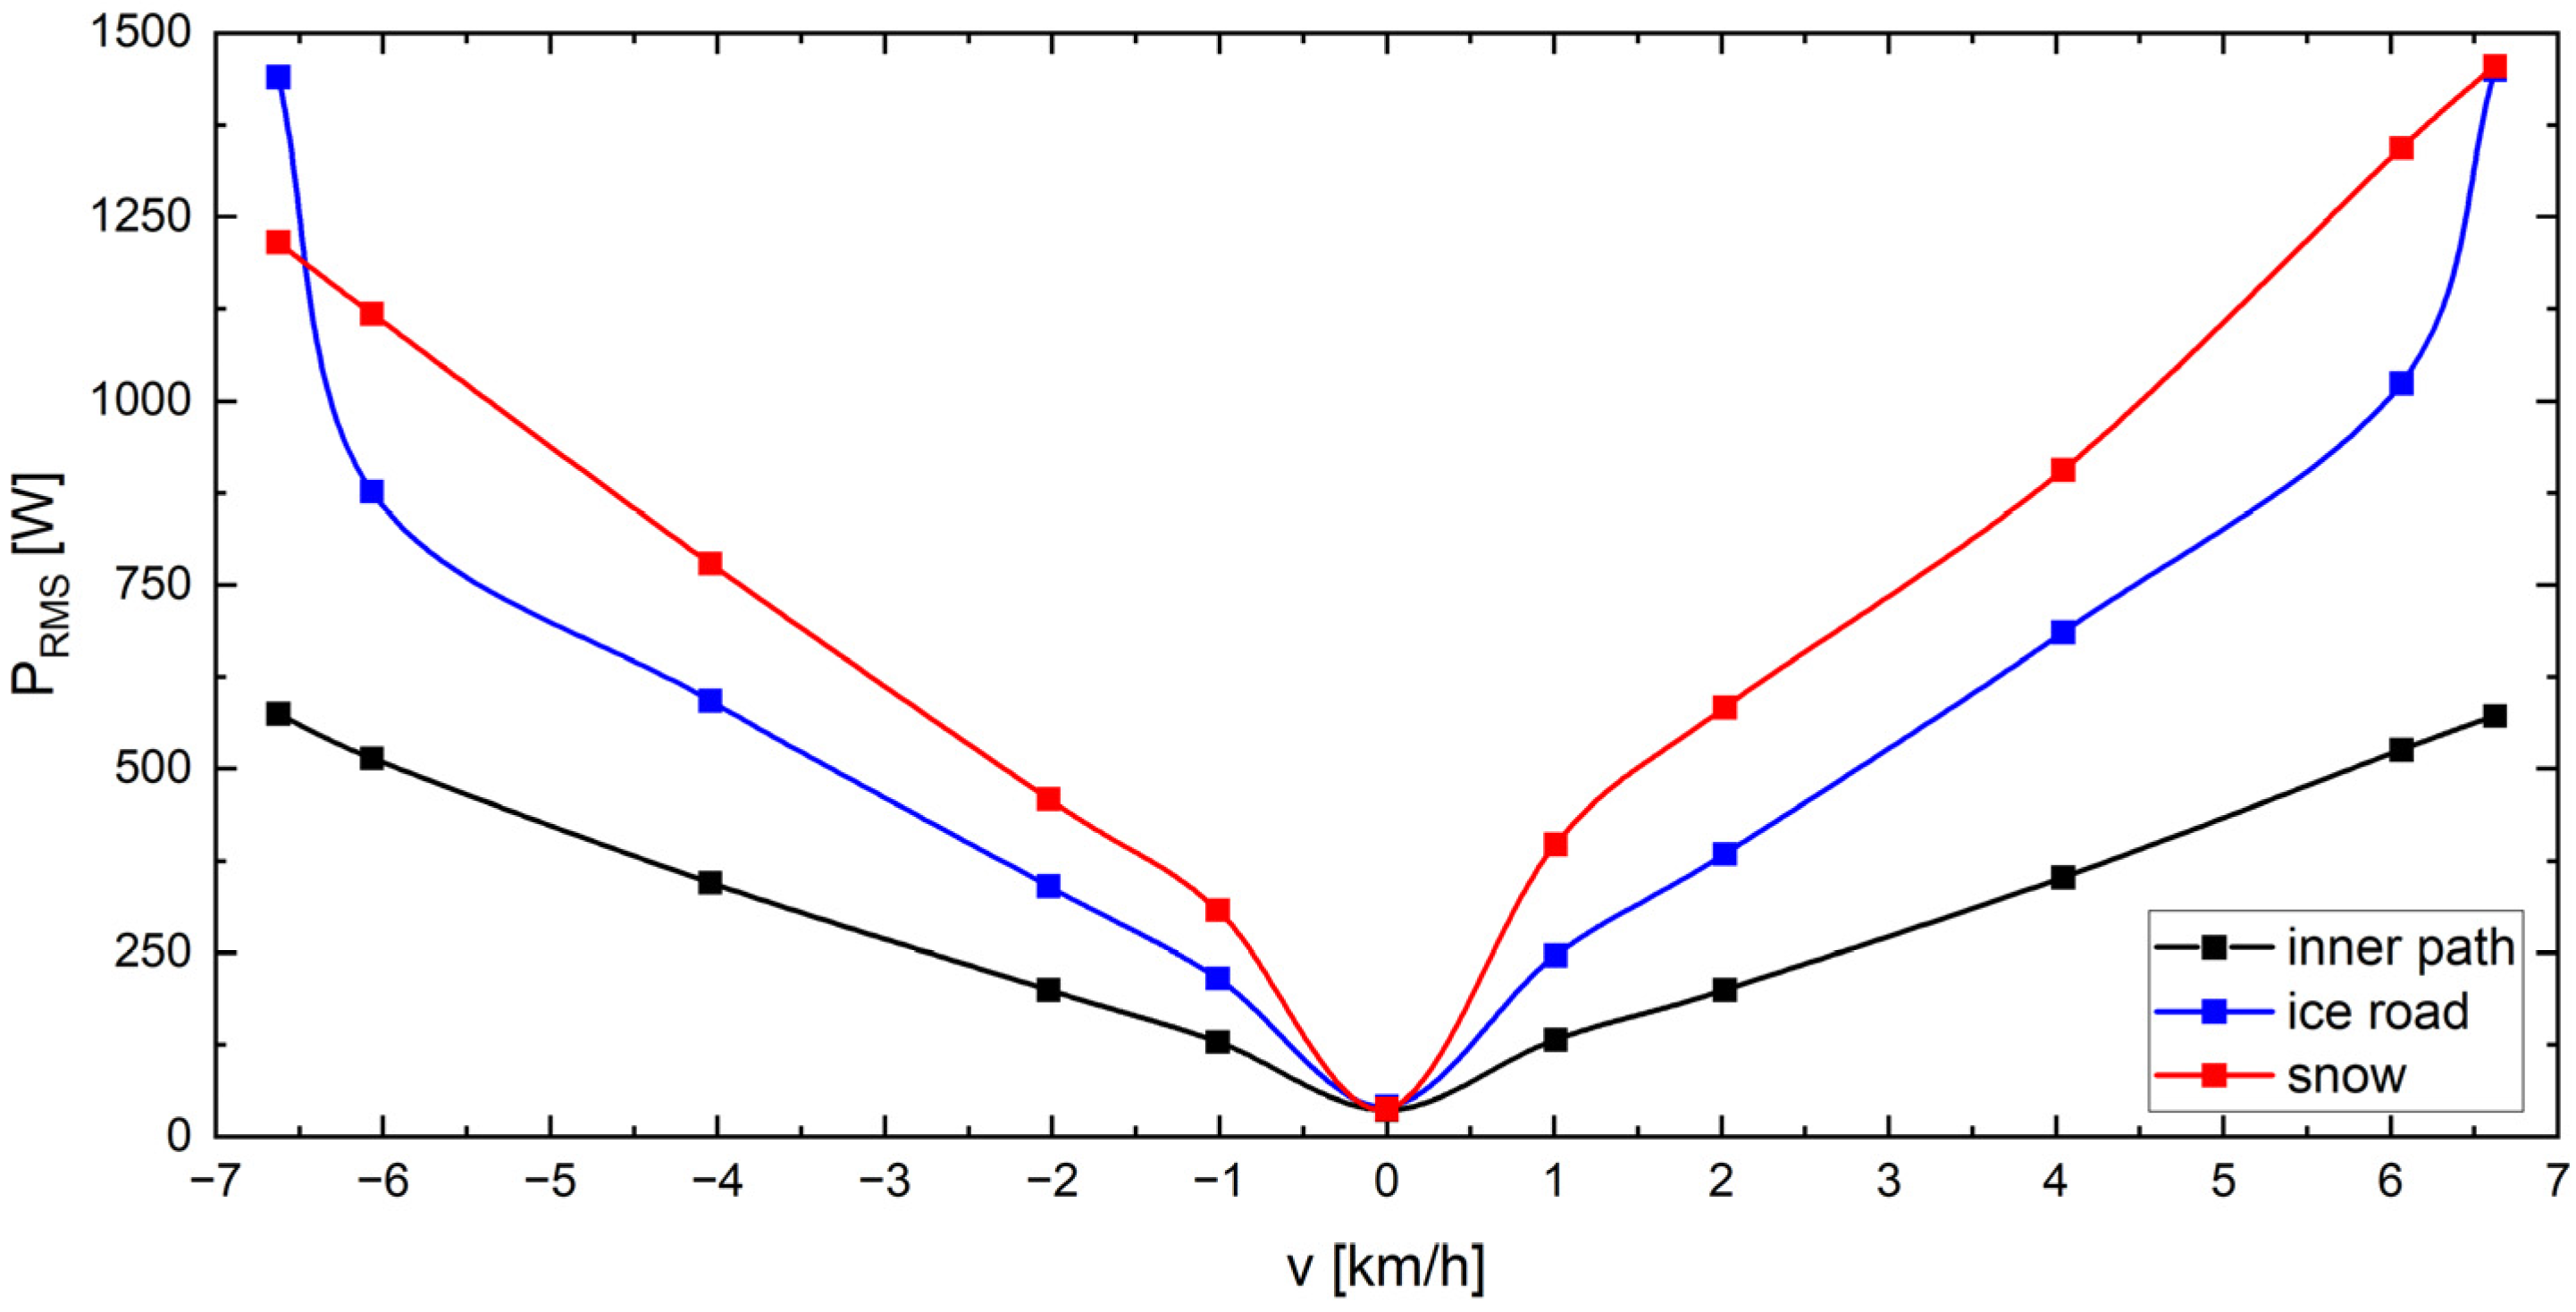
Figure 12 shows the changes in electrical load (P) as a function of the velocity depending on the position of the drive wheel in relation to the direction of travel (positive values indicate forward driving with the driving wheel at the rear, while negative values indicate driving backwards).
The experimental data obtained on the electrical load profiles of the robots in various operating conditions show that electrical power consumption varies depending on the driving speed v (km/h) and the type of ground. As the recorded experimental data indicate, the highest electrical power consumption was recorded in winter conditions, on icy ground and in snow. The values determined for electrical power (PRMS) as a function of speed for the other tested substrates fall within a wide range, from 200 W to approximately 1500 W.
The determined PRMS electrical load profiles agree with the requirements available in the technical literature for medium ground vehicles with a weight of approximately 100 kg. It is well known that pure PEMFC drive systems for electric vehicles have low dynamics, so they cannot sufficiently handle power demand peaks during starting and acceleration and cannot recover the energy generated during braking. An auxiliary power supply, usually a battery, is required to work with the PEMFC stack in highly dynamic driving scenarios. The auxiliary power supply can improve the performance of the hybrid system by (i) compensating for the lack of power of the fuel cells, (ii) absorbing the feedback energy generated by the engine during vehicle deceleration and braking, and (iii) mitigating power fluctuations. The usefulness of hybrid energy sources, such as batteries and fuel cells, for powering unmanned aerial vehicles has been demonstrated for use in various classes of drones. The PEMFC stack is usually hybridised with highly dischargeable lithium batteries. The battery can also be charged to maintain SOC above the prescribed limit. Continuous electrical power is supplied by the fuel cells, but peak power is supplied by the battery [47,48]. Gonzalez et al. investigated the passive fuel cell and battery hybrid energy system for the Summit XL UGV platform. The authors presented results focused on the stationary assembled hybrid power sources studied with a 200 W PEMFC stack and LiPo cells connected directly in parallel [49].

3.2. Energy-Efficiency Study of the Family of 2–3 kW PEMFC Stacks

From the experimental investigations of the electrical load profiles of the robot when driving on different roads, the required electrical load profile, considering the peak or instantaneous demand for electrical power, is between 2200 W and 2500 W.
The first stage of electrical testing of PEMFC fuel-cell stacks is to determine the voltage (U)–current (I) and current (I)–electrical power (P) dependencies. Hydrogen–oxygen fuel-cell stacks are characterised by the maximum power represented by a pair of (U-voltage–I current)max parameters, which is usually visible on the U–I curve. It is crucial for the operating conditions of PEMFC stacks as a power source. Gradual electrical loading of the fuel-cell stack leads to a self-regulating variation in the work conditions (voltage drop, current increase), which leads to an adequate increase in the power drawn from the PEMFC stack, according to the rising need. This action will be efficient until the maximum power point is achieved. After receiving maximum electrical power, the increasing load current will gradually decrease [50,51]
In the case of instantaneous power deficit, a frequently used solution is the employment of an auxiliary unit consisting of a storage battery pack or supercapacitor system [52]
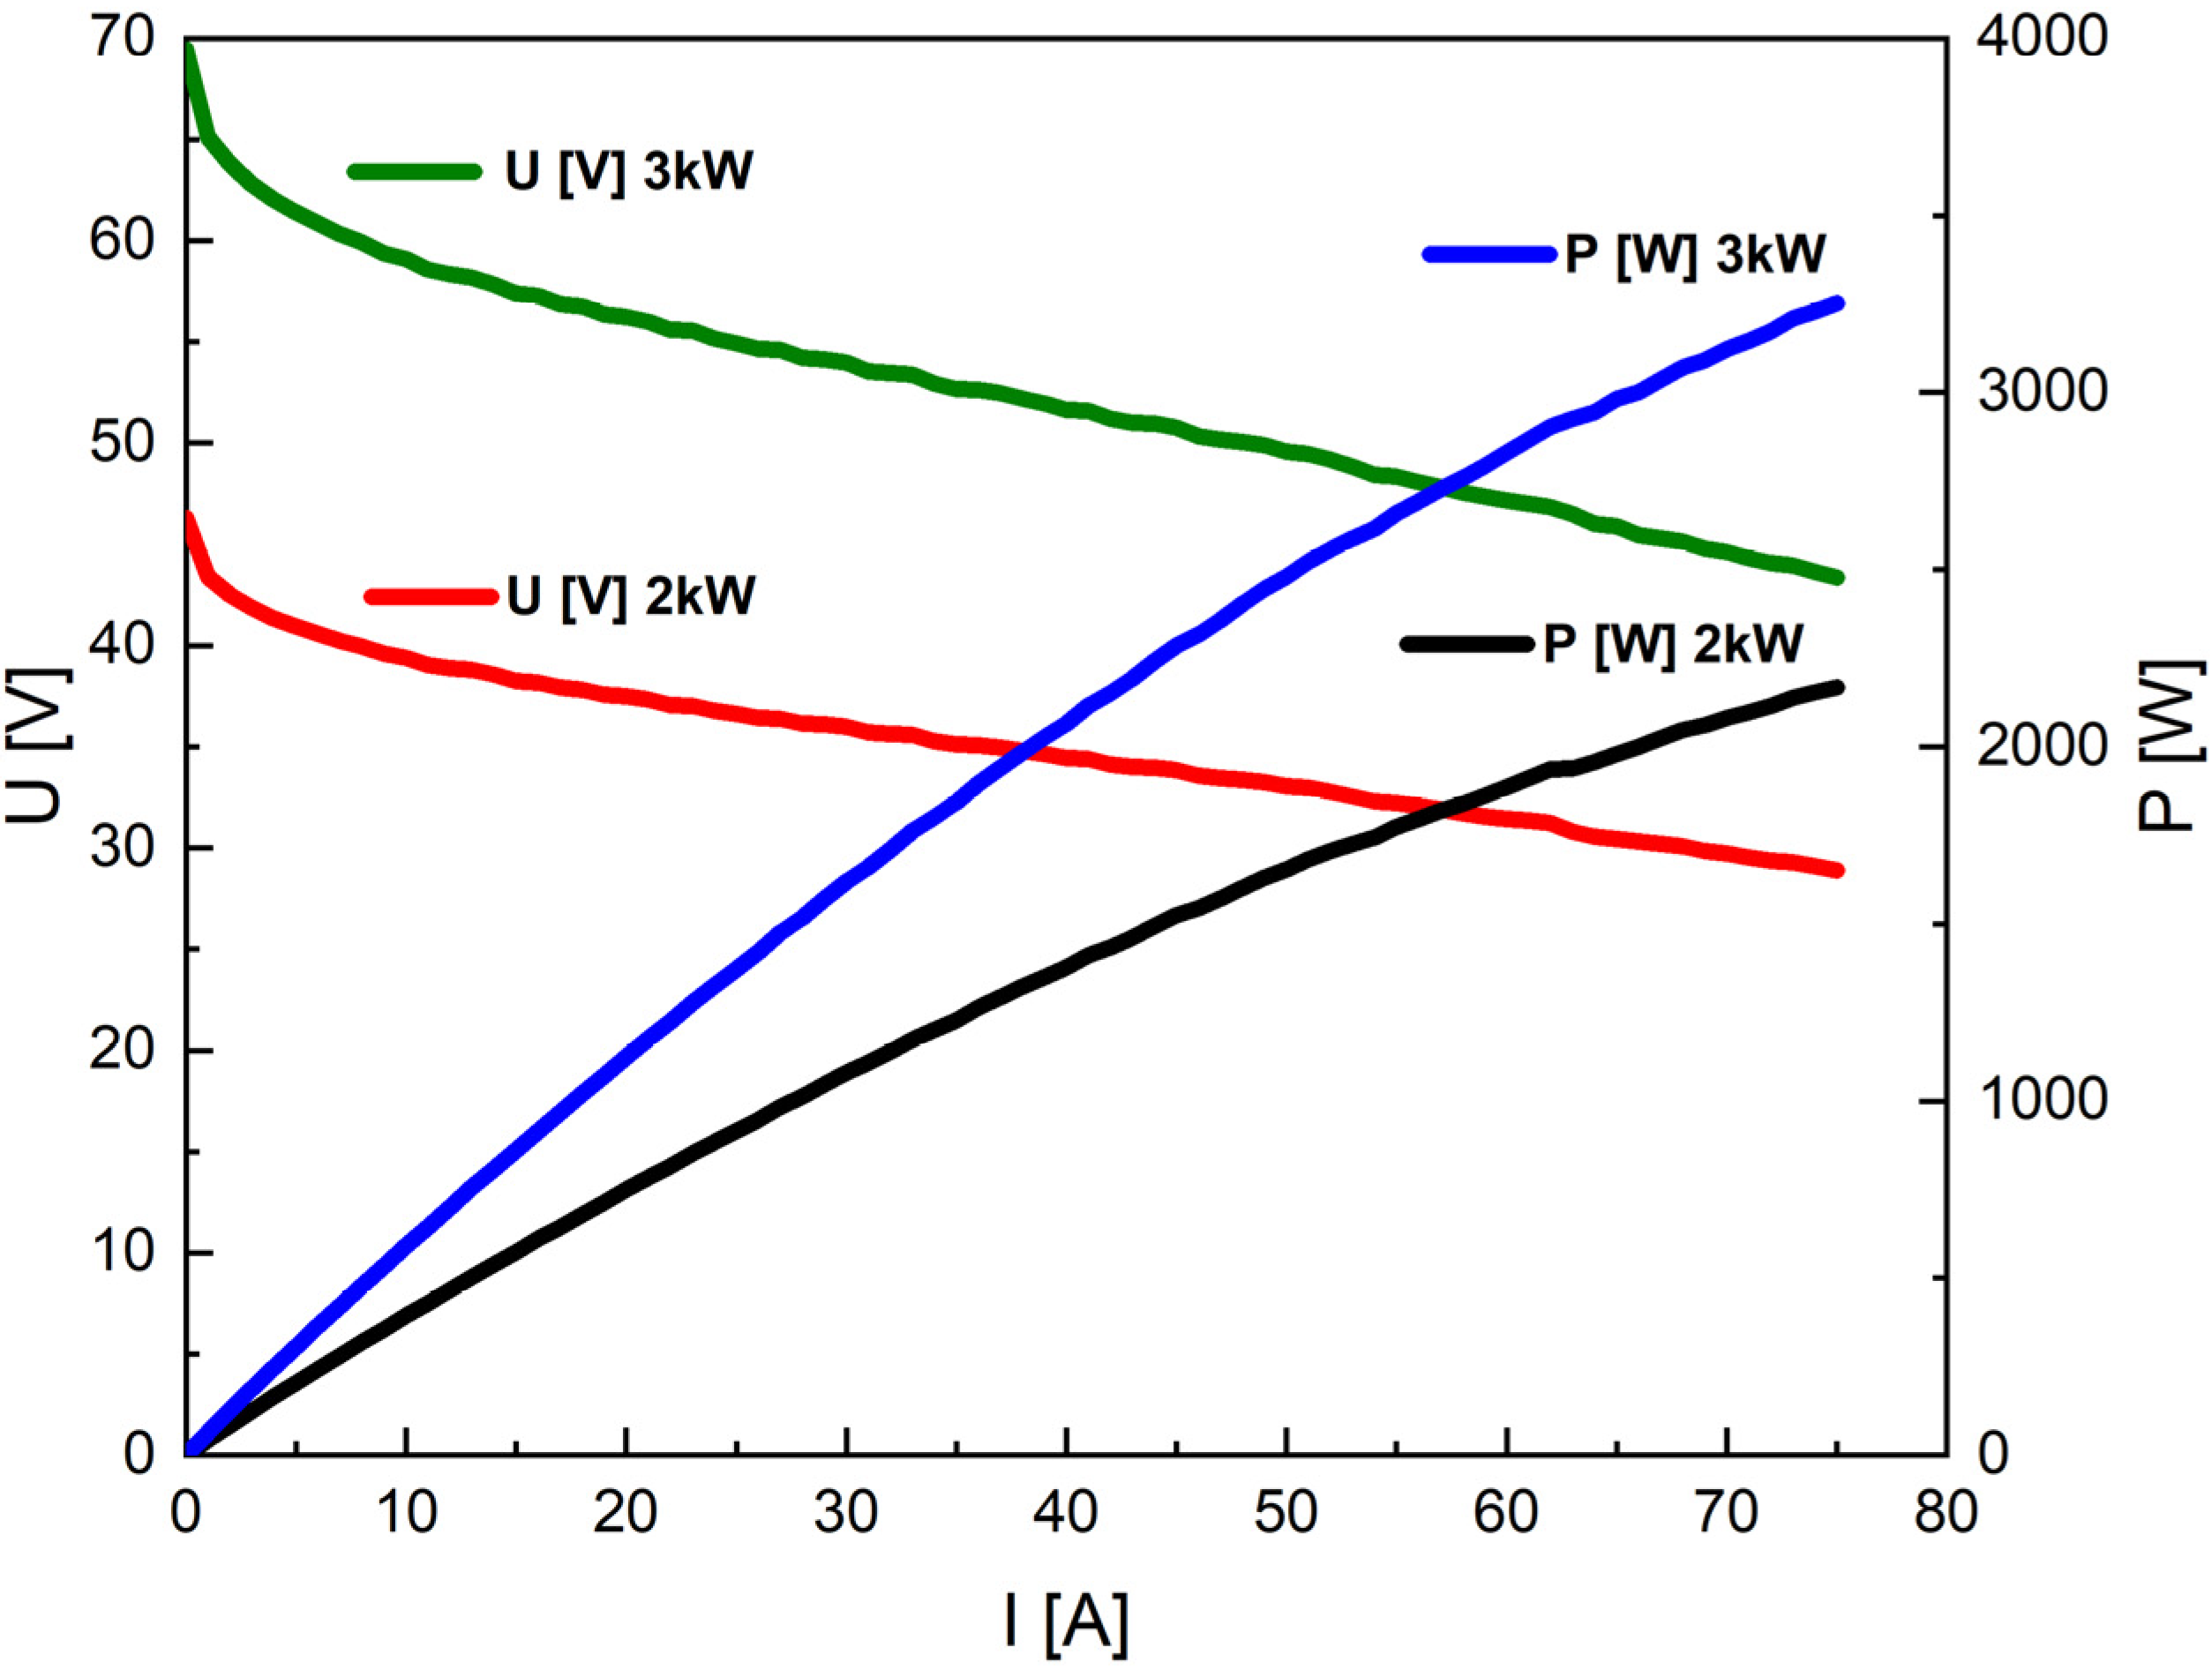
Figure 13 shows the voltage–current (U–I) and electrical power–current (P–I) dependencies for a family of PEMFC stacks with electrical power ranging from 0 to 2 kW or 0 to 3 kW.
From the voltage–current (U–I) and electrical power–current (P–I) dependencies shown in Figure 13, it can be concluded that the open-circuit voltage (OCV) of the 2 kW PEMFC stack reaches values of 42 V for a current (I) of 0 A. The gradually electrically loaded PEMFC stacks lead to a decrease in voltage (U) with a simultaneous increase in current (I). In the first phase of the increase in amperage from 0 to 5 A, there is a rapid voltage drop in the OCV value (the so-called activation losses) to the value at which the voltage changes linearly, due to the dominant ohmic losses associated with the internal resistance of the fuel-cell stack. For both the PEMFC stacks investigated, the (U–I) and (P–I) dependencies obtained for the 2 kW PEMFC stack showed that the highest possible continuous current load (I) of the PEMFC stack in the drive unit should not exceed 75 A.
For series-connected PEMFC stacks of 2–3 kW, a voltage increase can be observed, while the electrical load (I) is at the same level and does not exceed 75 A. As mentioned in the description of the experimental part of this work, the main difference in the intended application of the 2 kW PEMFC stacks, which are characterised by a very similar electrical structure, is the possibility of reducing the total mass and their dimensions. Both bipolar metal plates and bipolar graphite plates are used in PEMFC stacks. The use of lightweight PEMFC stacks with bipolar metal plates is the main way to reduce the mass of energy sources for UAV applications [53,54]. Furthermore, the lifetime of the PEMFC stacks with metallic bipolar plates is lower compared to PEMFC stacks with graphite bipolar plates, as shown by the analysis of the existing data in the literature [55,56].
Another issue related to the reliability of the operation of the PEMFC stack as components of a hybrid power source is determining the electrical power necessary to supply the balance of plant (BOP) for the PEMFC stack. The 2 kW PEMFC investigated was constructed in an open-cathode air-cooling system that required electrical energy for the air-cooling system (fans) and the control and measurement devices responsible for the proper operation of the fuel-cell stack.
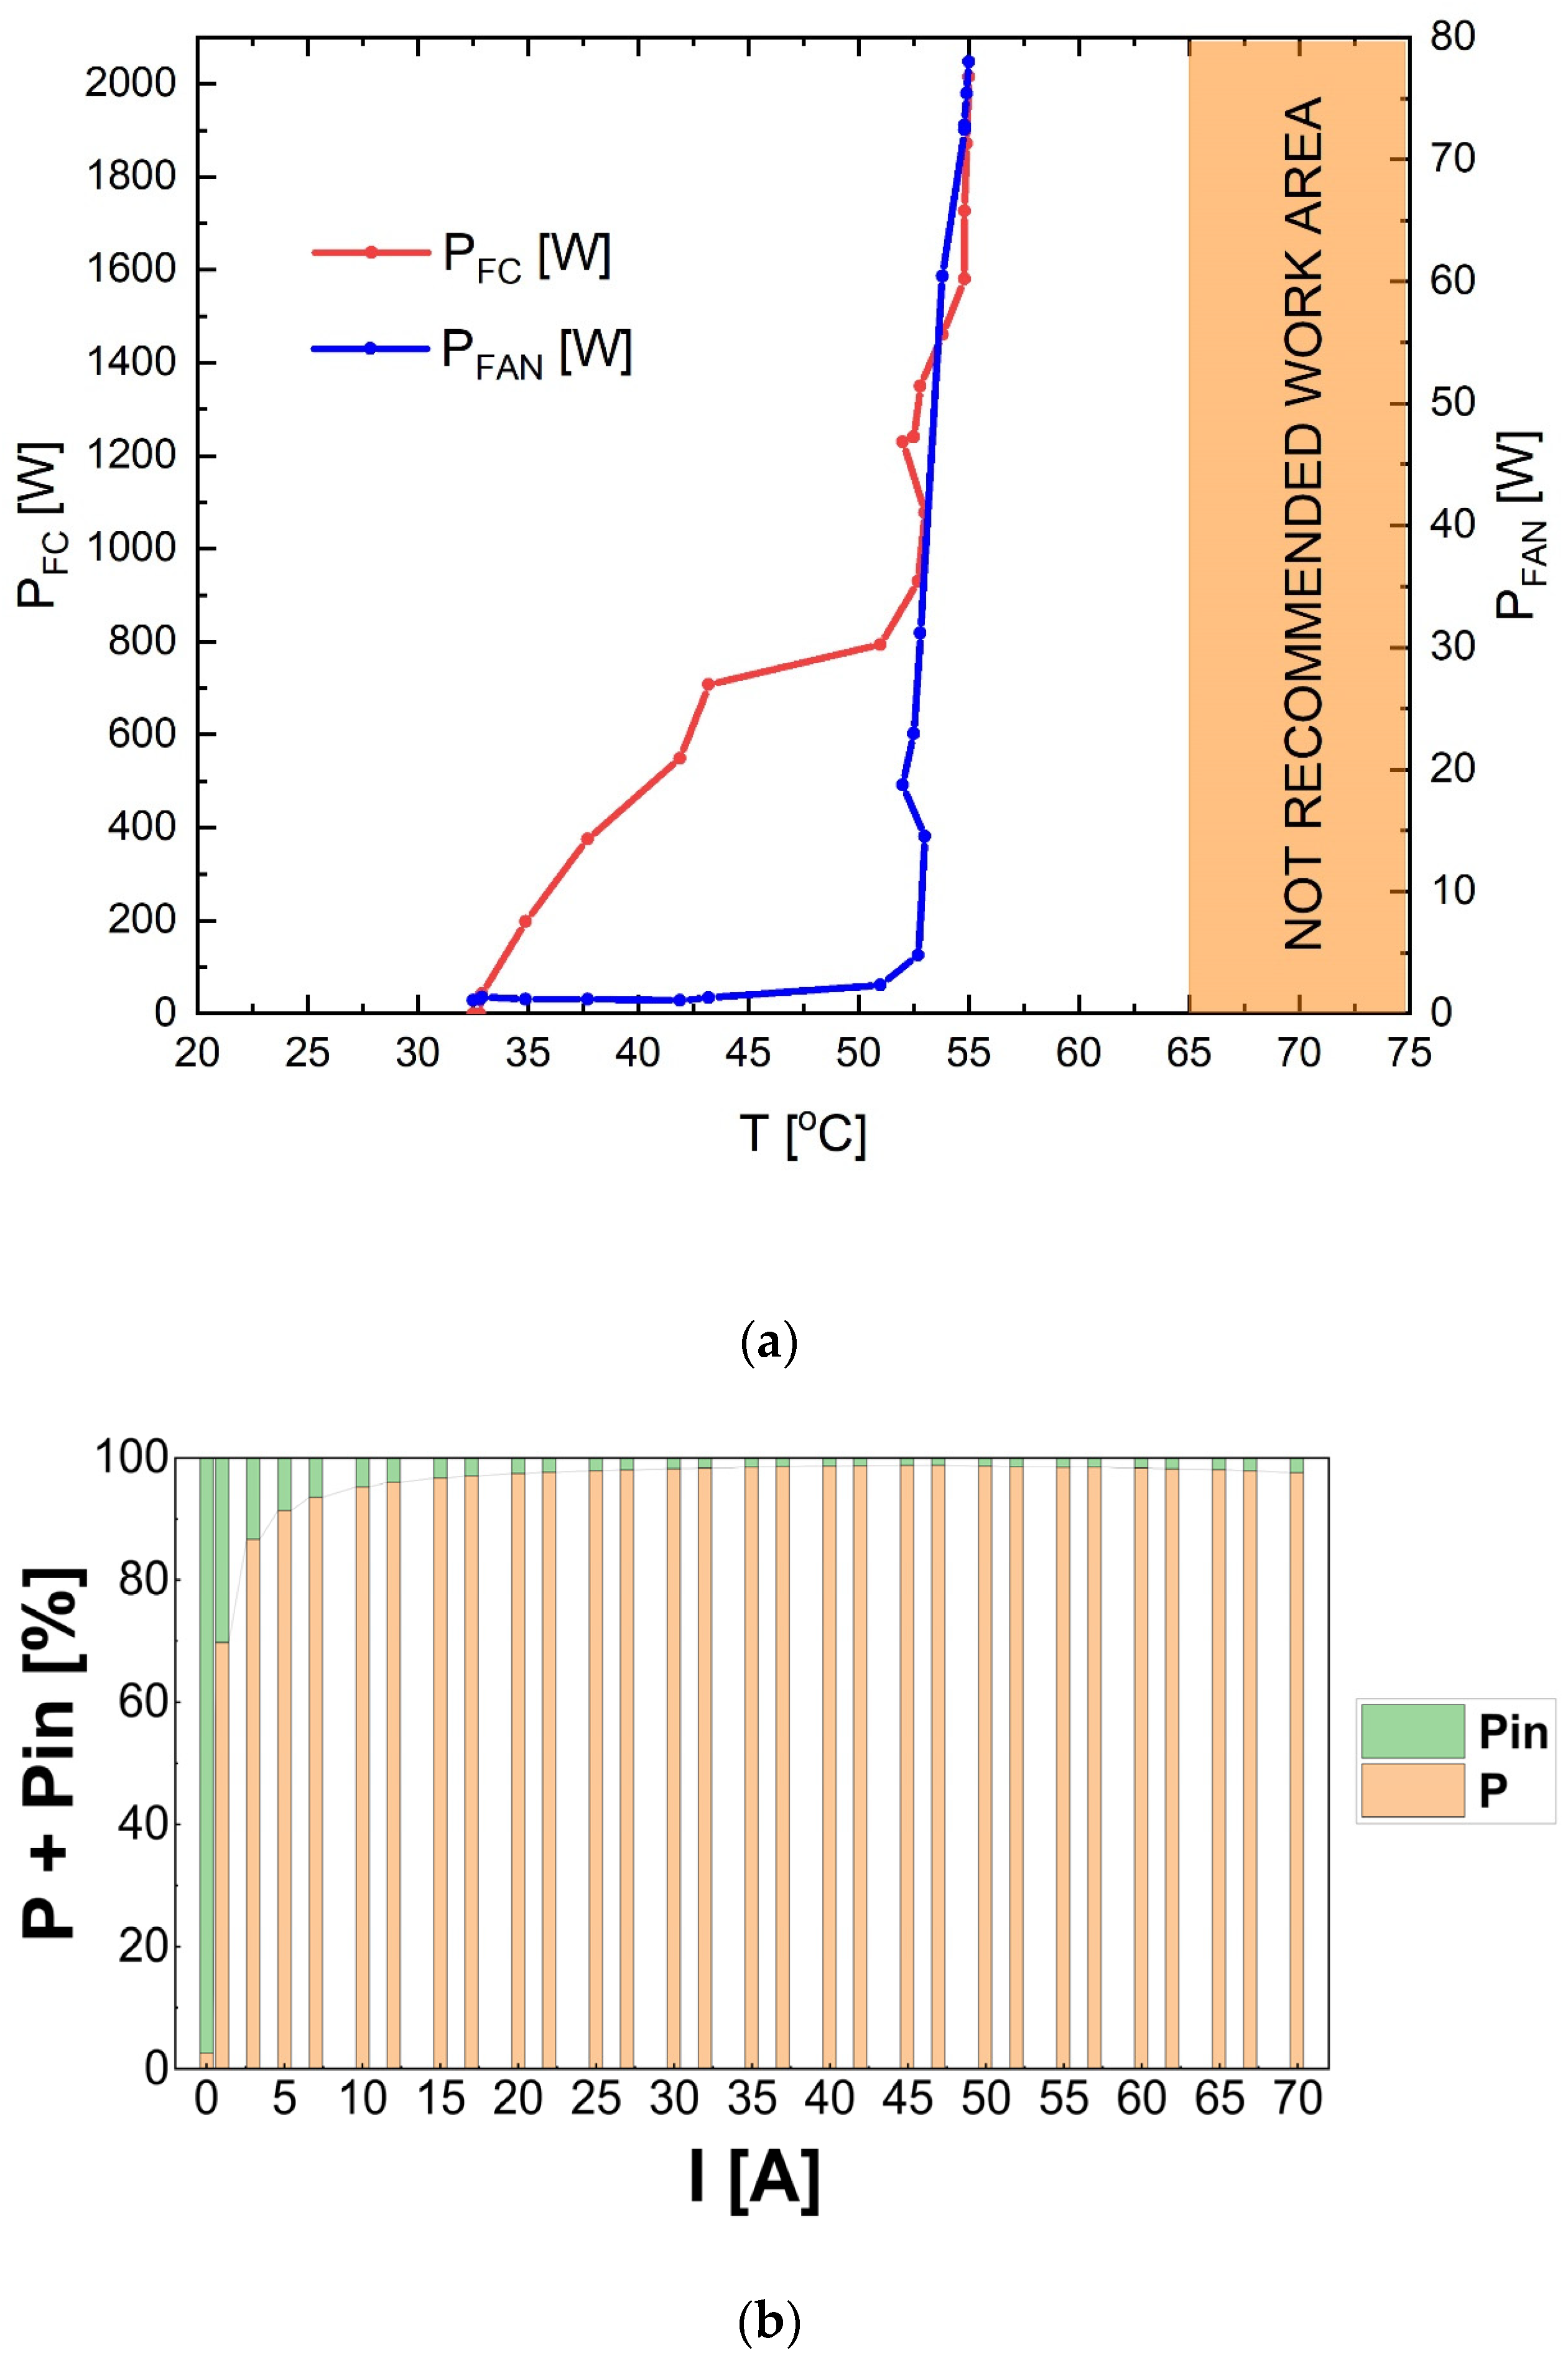
Figure 14a,b determined, based on experimental measurements, the electrical power (P) necessary to supply the electrical cooling system (air fans) vs. the temperature (T) of fuel cells.
The measured electrical power needed to supply fans is correlated with the electrical power produced by the PEMFC stack during operation.
In Figure 14a, it is evident that the increase in temperature of the PEMFC stack during operation is directly proportional to the rise in electrical power output (P) of the PEMFC stack. The maximum temperature of 54–55 °C is recorded for the nominal electrical power output achieved by the PEMFCs. The simultaneous increase in the electrical power (P) and the temperature of the fuel cells led to an elevation in the electrical power required to operate the air-cooling fans. The estimated electrical power needed to drive the cooling fans does not exceed 100 W. The dynamic operation of the electrical propulsion unit required swift power output adjustments from the PEMFC stack when increasing the electrical load over time, as well as a reduction in electrical power production from the PEMFC stack when decreasing the electrical load.
Figure 14b illustrates the varying percentage contribution of electrical needs necessary to supply the BOP (Pin) compared to the total electrical power (P) produced by the 3 kW PEMFC stack. As the load current (I) of the PEMFC stack increases, the electrical power (P) drawn by the load increases, and the percentage share of auxiliary power (Pin), primarily used by the air-cooling system of the fuel-cell stack, decreases. The minimum percentage share of auxiliary power is achieved for the current range of 35–55 A. Beyond a current intensity (I) of 55 A, there is an increase in the percentage share of auxiliary power (Pin), which is related to the intensification of cooling for electrical power close to the rated power of the fuel-cell stack. For both the 2 kW and 3 kW PEMFC stacks, the demand for electrical power (P) necessary to supply the auxiliary systems of the PEMFC stack increases with the increasing rated electrical power of the power source. The air-cooling system, fed by a series of fans, requires a reliable power supply. Increasing the rated electrical power of the PEMFC stack leads to an increase in the number of fans and the electricity required to operate them. This factor complicates the design of the target power generator with PEMFCs and extends the system for controlling and managing the electrical energy from this source.
The results of the investigations and the design and construction of the cooling system for PEMFC stacks with an output of 2 to 10 kW are presented in our previous papers [41,42]. Based on the analysis described above, the 2 kW PEMFC stack is selected for further investigation.
The investigation of the electrical performance of the targeted 2 kW PEMFC stack under variable electrical load is the next important issue, in order to analyse the possibility of using the PEMFC stack as a component for the drive unit in the UGV platform.
Based on the recorded electrical load profiles of the drive unit of the Patrol PIAP vehicle, it is observed that, depending on the vehicle speed, terrain profile, and road surface condition, variable electrical power consumption was observed over time.
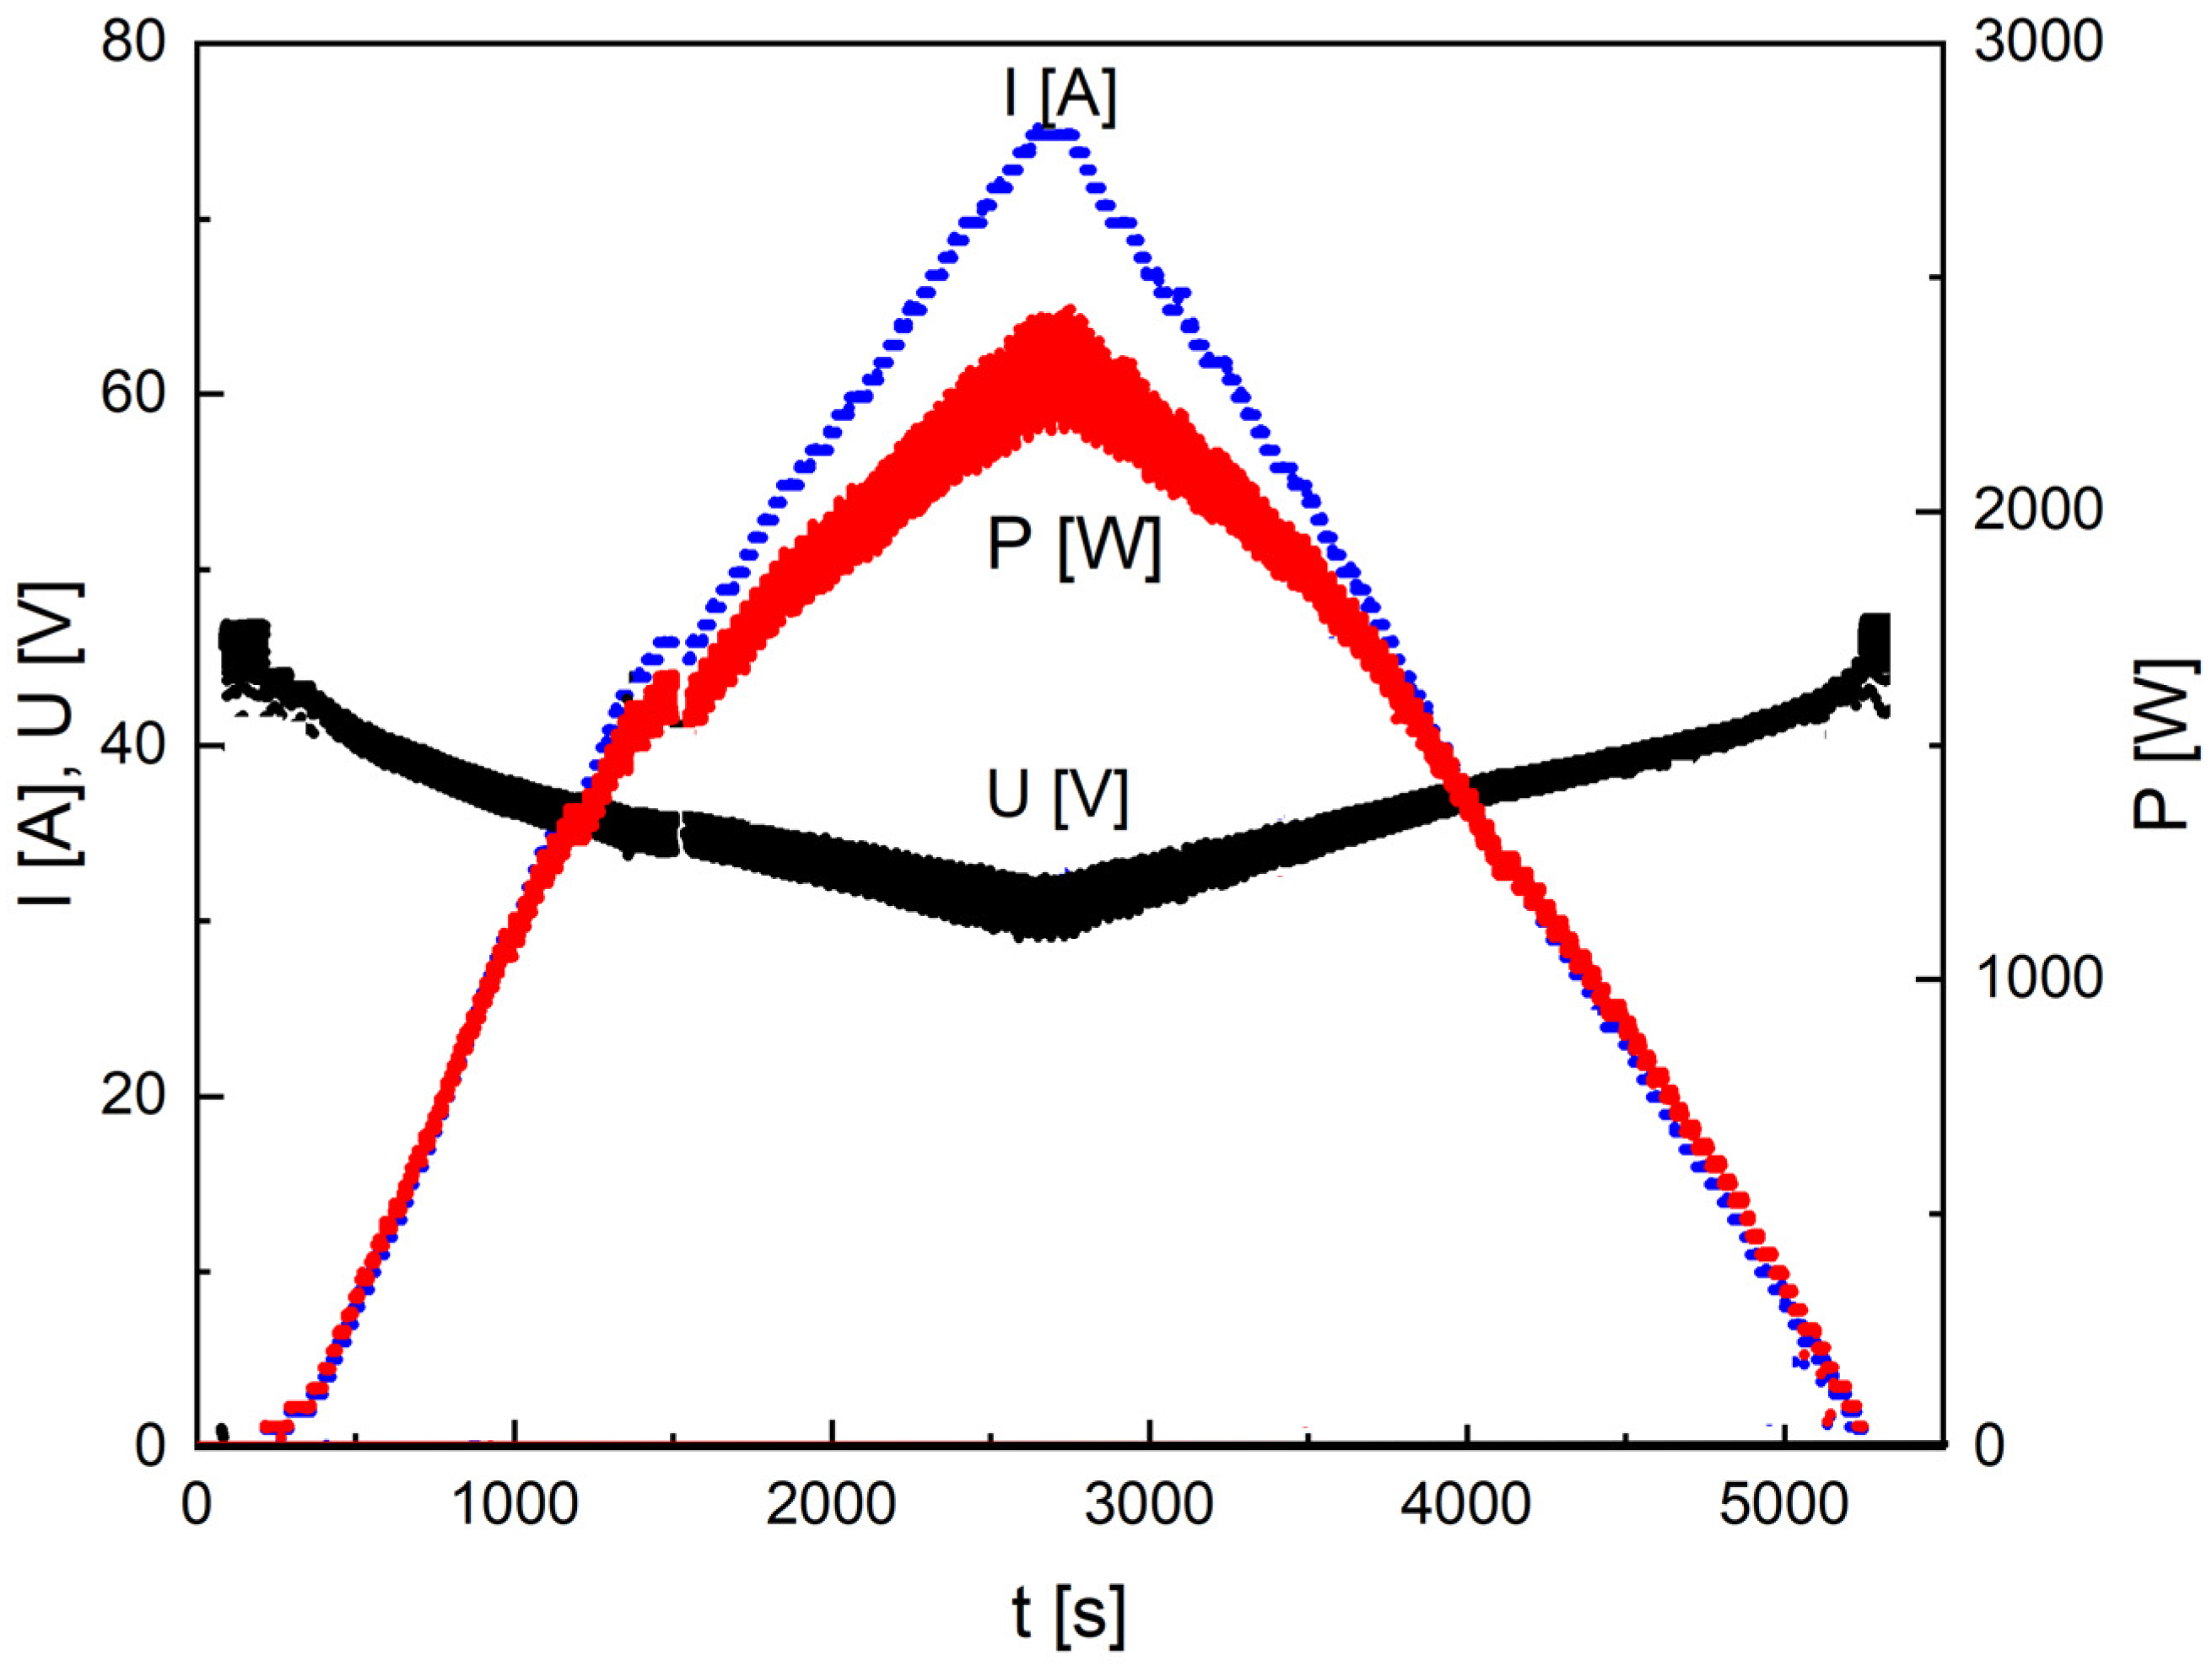
One of the important criteria for the electrical investigation of the PEMFC fuel-cell stack is the analysis of variation in values of electrical parameters, i.e., voltage (U), current (I), and electrical power (P) during a gradual increase in the electrical load to conditions close to the nominal electrical power value P over time and then gradually reducing it.
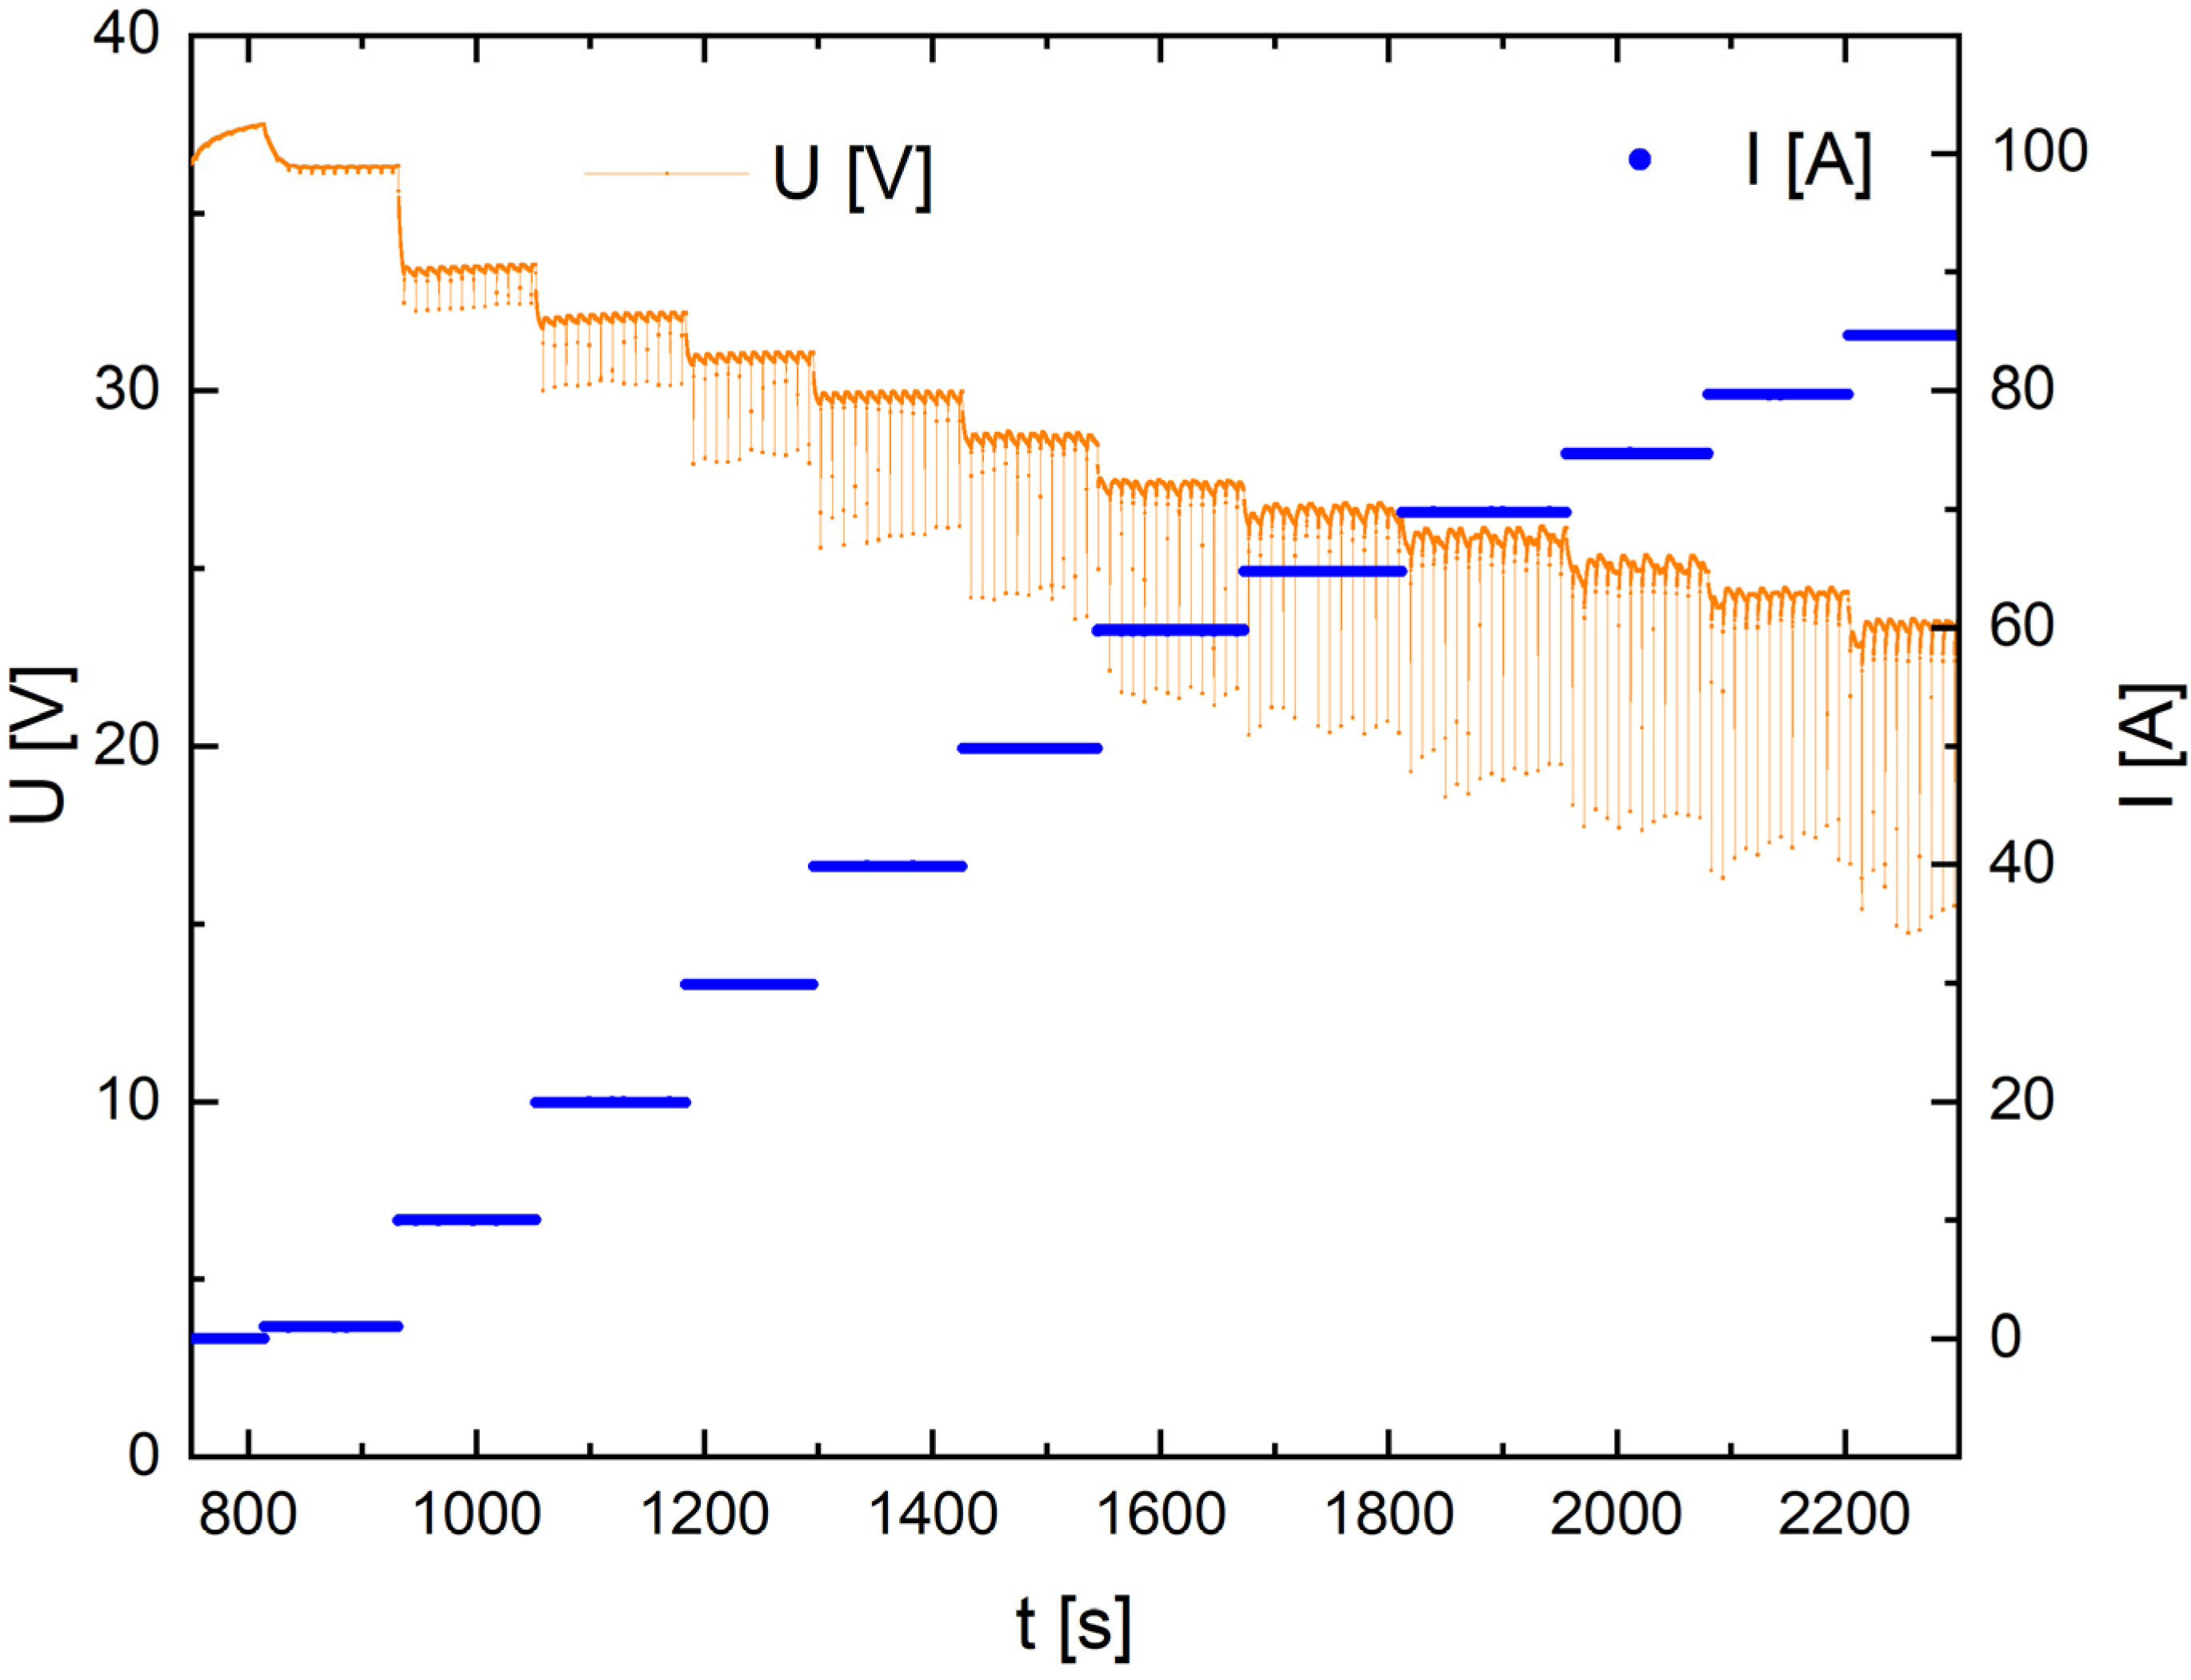
Figure 15 shows an example of electrical waveforms depicting the dependence of voltage (U) and current (I) over time (t) recorded for the fuel-cell stack. This recording was obtained while gradually increasing the electrical load (P) to the nominal electrical power of ~2 kW and then gradually reducing it.
The analysis of the electrical waveforms (Figure 15) shows that the voltage (U) decreases over time (t) with an increasing electrical load (I = 5 A increase per 10 s), depending on the applied electrical load with a constant current. In the case of electrical power (P) vs. time (t), a gradual increase in electrical power (P) with a corresponding increase in electrical current load (I) is observed. The received electrical power (P) is above 2 kW during the electrical load. This phenomenon indicates that it is possible to rapidly increase the electrical power (P) to the nominal value (P) in a short time (t). Conversely, a decrease in the current (I) flowing gradually over time resulted in an increase in the voltage (V) and a reduction of the electrical power (P). The small drops marked in the graphs that appeared in the fluctuations of the voltage and current values corresponded to the humidification system’s power, based on an SCU system. The electrical power of the PEMFC stack was corrected and corresponded well to the recorded electrical power (P) compared to the time (t).
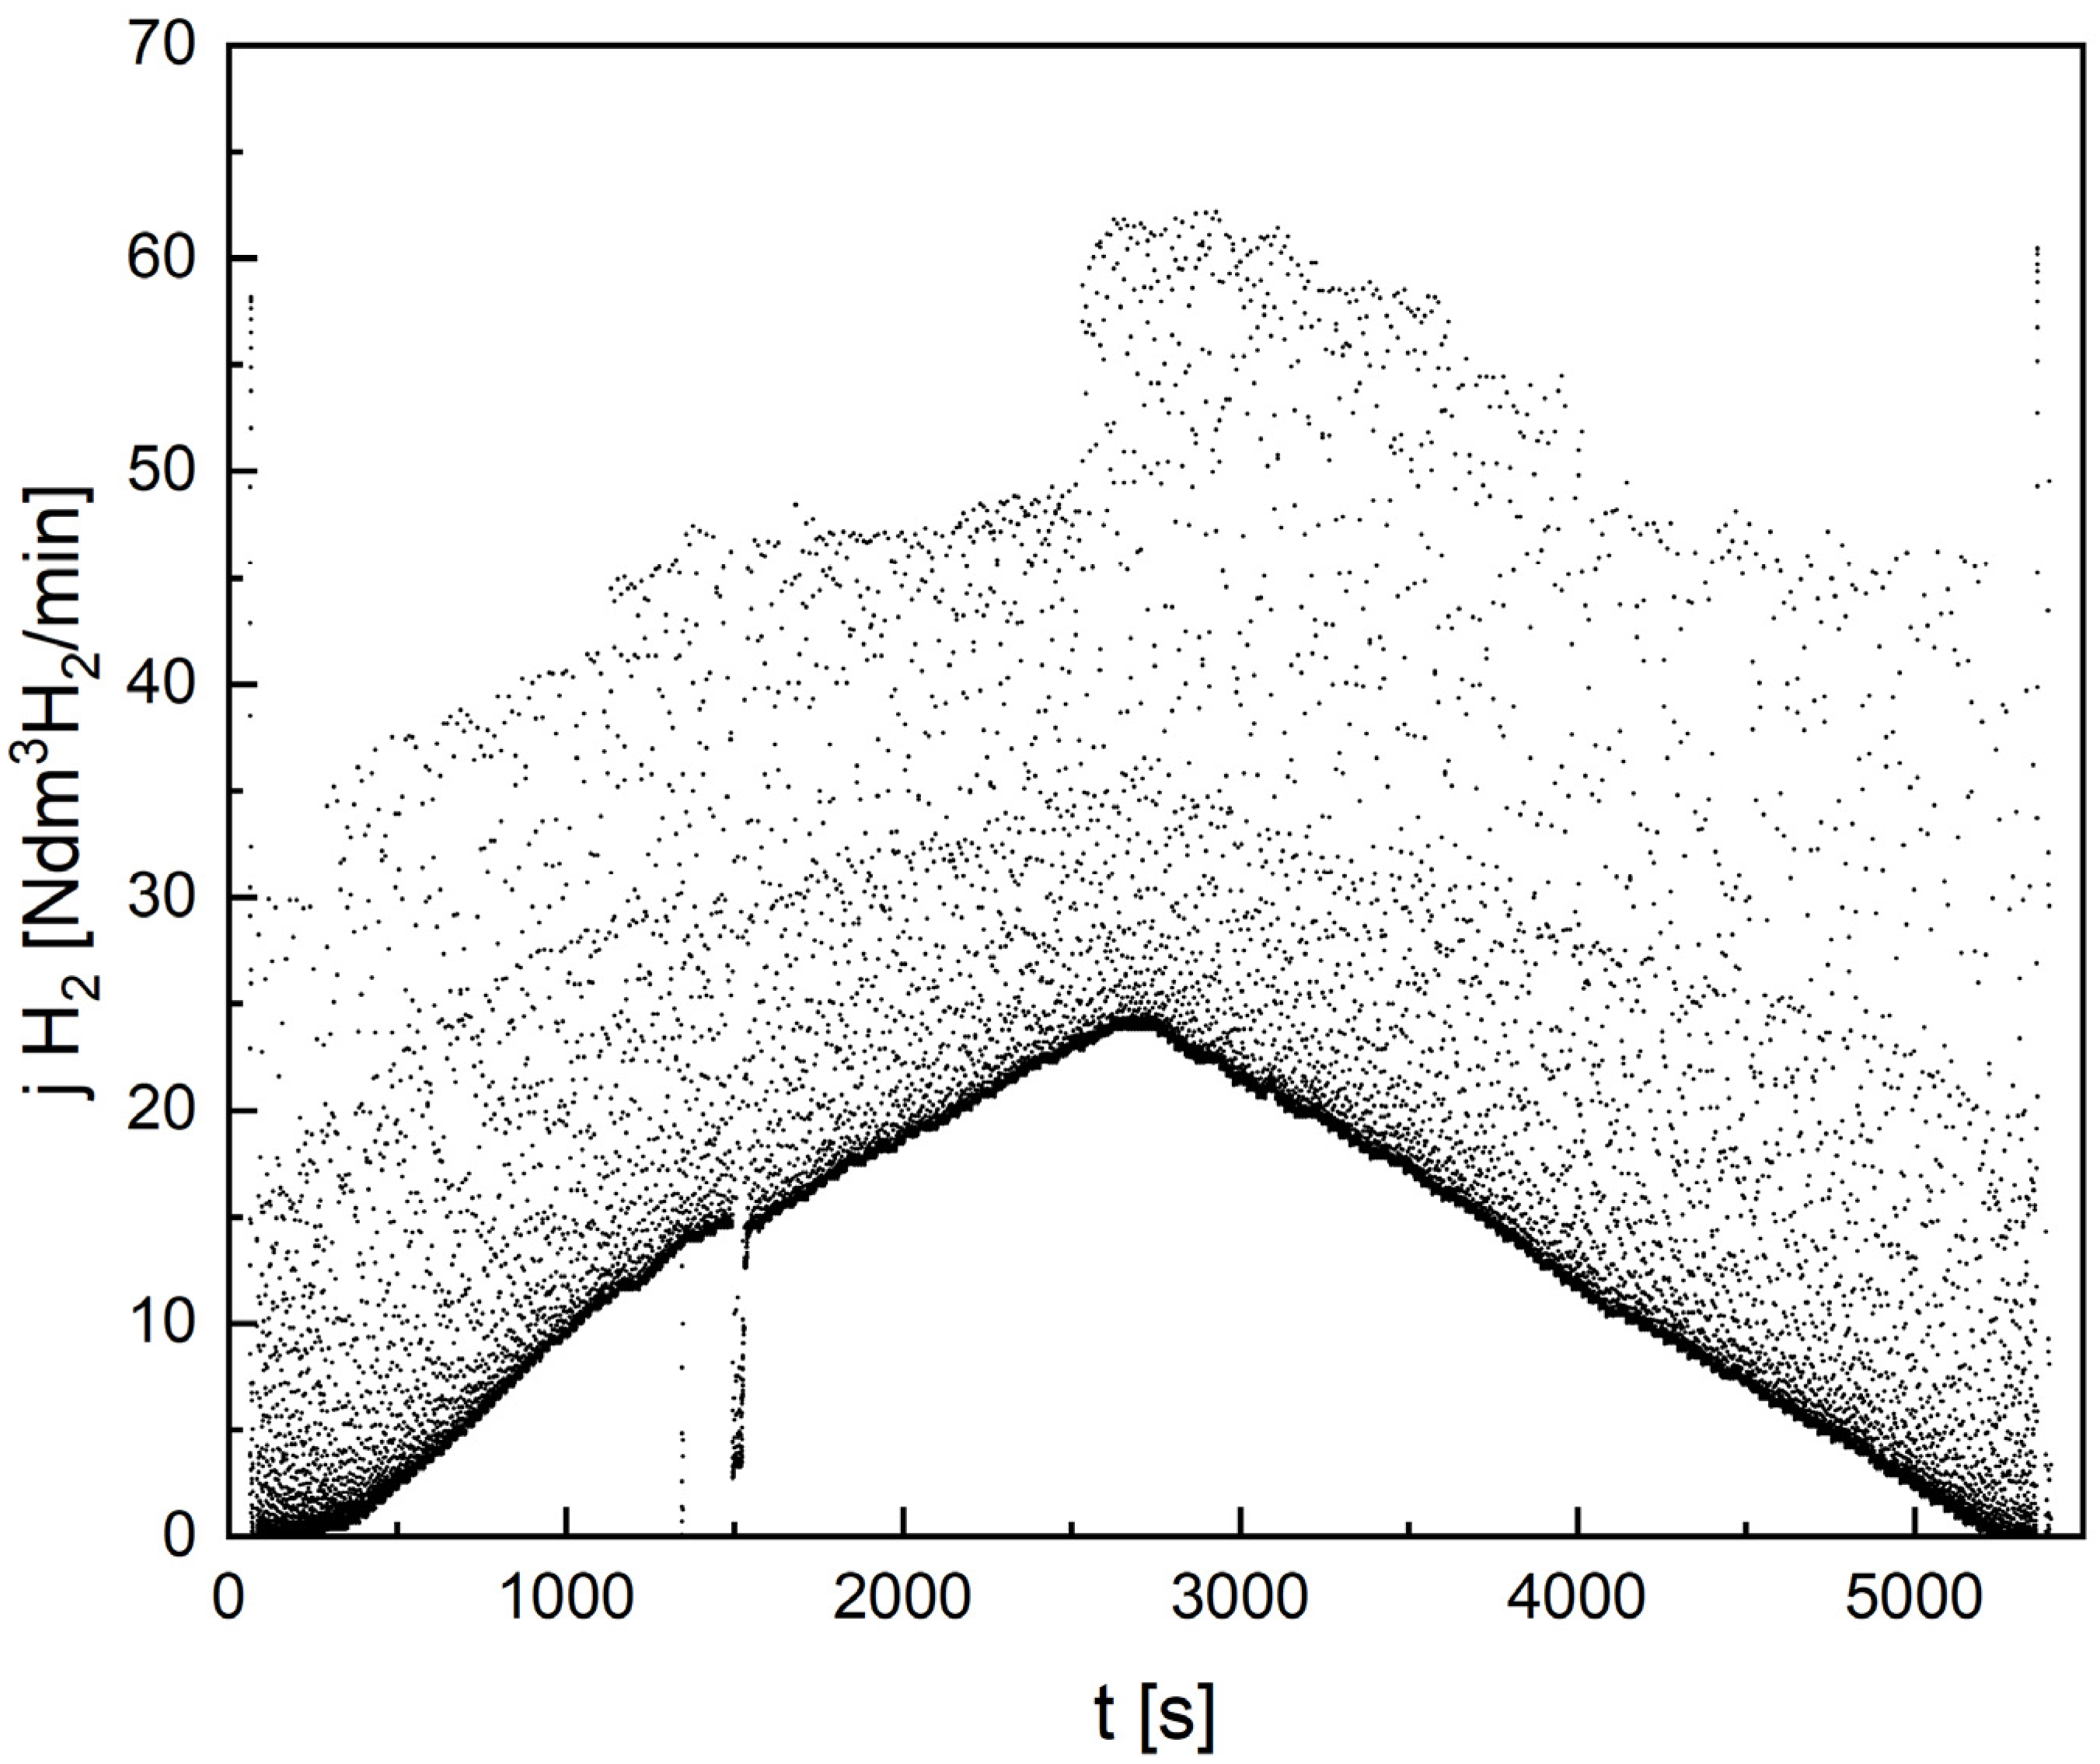
The crucial phenomenon for the continuous operation of the PEMFC stack is determining the variation of the hydrogen supply (required flux j [Ndm3H2/min]) vs. time (t).
Figure 16 shows the dependencies of the intensity of hydrogen flux j (Ndm3H2/min) vs. time (t). The experimental data presented in Figure 16 directly refer to the PEMFC stack operation under electrical load.
Figure 16 shows the baseline changes in the hydrogen flow rate (thick black line) during the fuel-cell stack operation under dynamic electrical load, and the points reflecting the increase in flow rate during the purging and operation of the PEMFC membrane humidification system, i.e., the SCU system.
The design of a hybrid energy source with a 2 kW PEMFC stack required the experimental verification of the operation of the source with the nominal electrical power at a variable electrical load profile.
Figure 17 shows the electrical waveforms of voltage (U), current (I), and electrical power (P) during the operation of the PEMFC stack under a constant load of 75 A.
In relation to Figure 17, after the PEMFC stack was started, it was loaded with a constant current of 75 A. When operating under a constant load with a current of 75 A, we observe an increase in the voltage (U) from 28 V to 31 V after a period of 9000 s. At the same time, the average power (P) of the fuel-cell stack increased from 2100 W to ~ 2300 W. The increase in the value of current intensity and electrical power is related to the wetting of the fuel-cell stack with water, which is a product of the electrochemical reaction taking place at the cathode of the fuel-cell stack when operating at a high load intensity (I) of 75 A and the SCU system operating simultaneously. The internal resistance of the fuel-cell stack is reduced. After the time (t) > 9000 s, the load on the stack of fuel cells (I) was gradually reduced to the value of 0 A, for which the voltage (U) of 46 V corresponds to the OCV voltage. The obtained results on the electrical performance of the PEMFC stack under a variable electrical load confirm the possibility of applying the 2 kW PEMFC stack in the desired hybrid power source.
The short-circuit process means that, when a switch is turned on, the positive and negative terminals of the fuel cell are connected by an external circuit and the voltage drops to a low value. When the switch is off, the PEMFC fuel-cell stack operates under normal conditions. During a short circuit, the current reaches a large value, and a high degree of water and heat are produced. Some studies reported the production of excess water and moisture evaporation from GDL at high heat generation as the reasons for performance improvement [57,58]. The short-circuit method has been found to improve the performance of fuel cells by stripping oxides and other adsorbed species from platinum, which requires systematically understanding the influence of the short-circuit method’s parameters on fuel-cell performance [59,60].
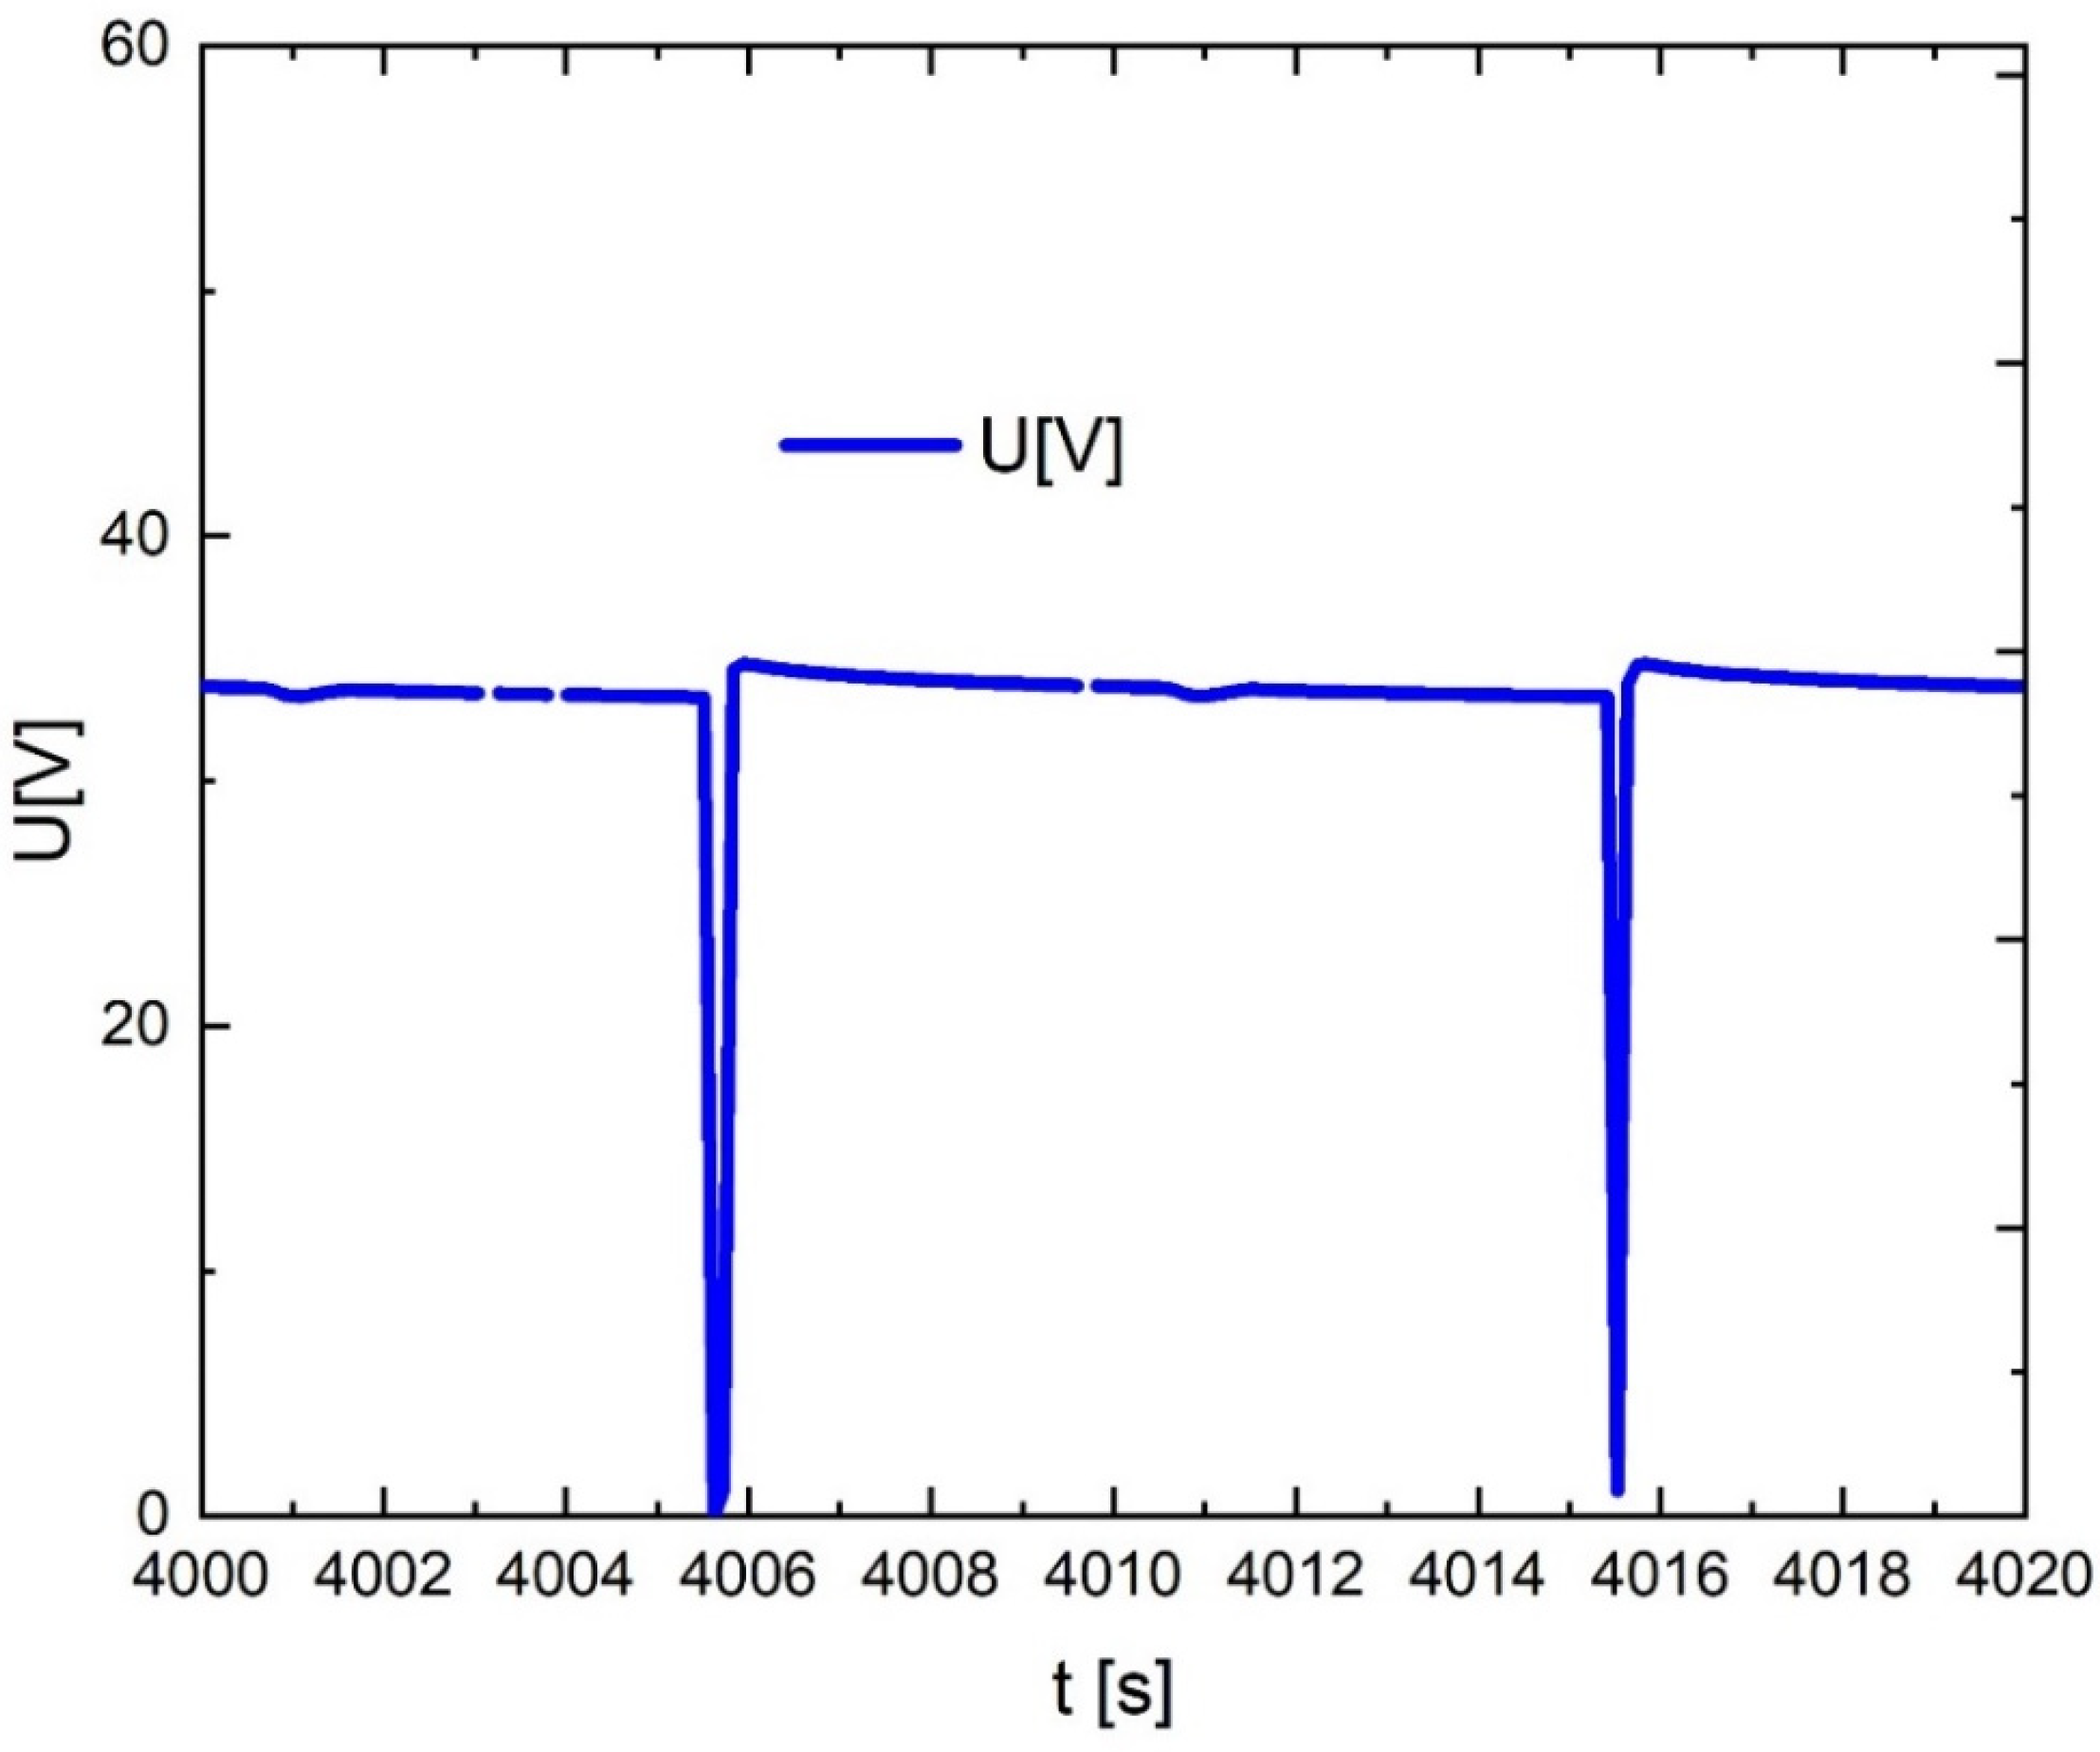
Figure 18 shows the variation of voltage (U) vs. time (t) before and after the SCU unit is engaged. The PEMFC stack operates under an electrical load (I) of 50 A.
In the voltage graph (Figure 18), every 10 s, there is a voltage drop to 0 V that lasts approximately 200 ms, which is caused by the operation of the SCU system used for self-humidification of the polymer electrolyte in the fuel-cell stack. The benefit of applying the SCU is a significant increase in the voltage from 33.4 V to 34.8 V, because of the flow of short-circuit current.
The milestone for ensuring the continuous operation of the PEMFC stacks is the analysis of hydrogen-fuel consumption during the operation of the PEMFC stack under constant electrical load in stationary conditions and under a variable electrical load. In the case of PEMFC stacks operation, the hydrogen is distributed for electrical energy production, as well as for use in the purge process and for SCU performance.
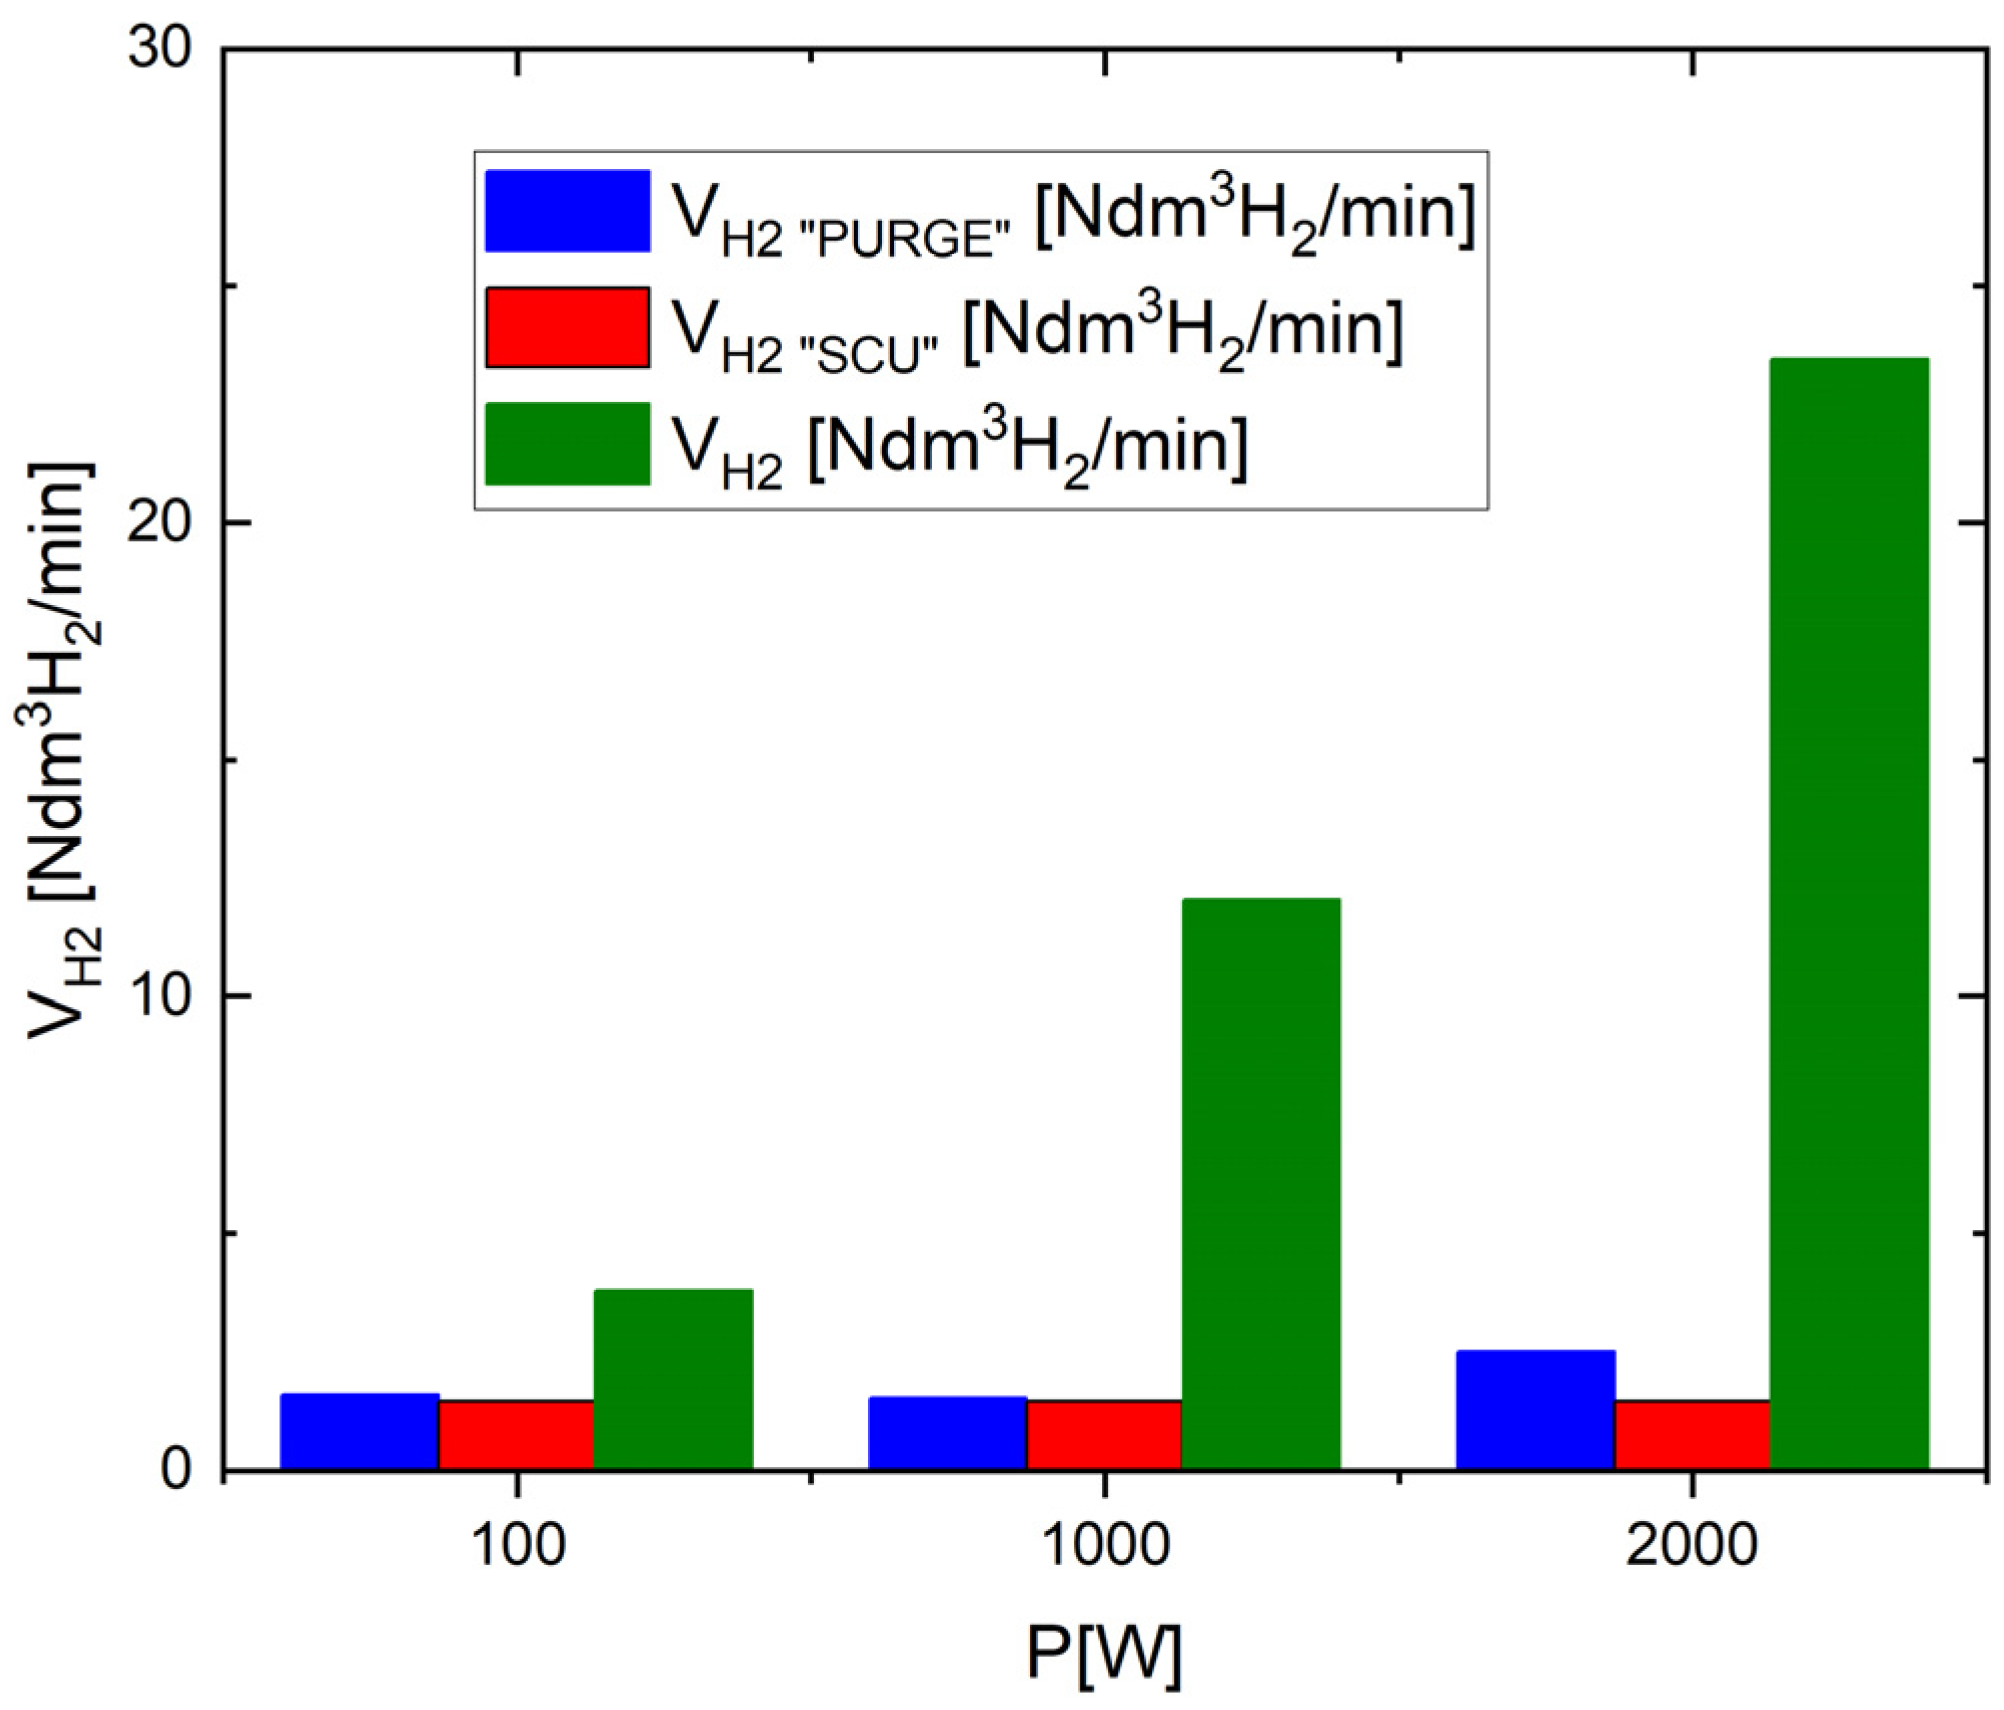
Figure 19 shows the dependence of total hydrogen volume (VH2) vs. electrical power (P) for all processes.
As illustrated in Figure 19, the volume of hydrogen (VH2) used over time to flush the surface of anode electrodes in single fuel cells in PEMFC stacks increases slightly with an increase in the electrical power (P) of the PEMFC stack. A similar situation is observed for the humidification process under SCU device operation and the purge operation. The analysis of hydrogen distribution into various processes is helpful in predicting the possible operating duration for PEMFCs in the drive units of UGV mobile platforms. The utility of hydrogen for a purge process, as well as a humidification process, does not exceed 4–5%.
Figure 20 presents the dependence of changes in the electrical efficiency (η) of the electrical power (P) of the 2 kW PEMFC stack.
As can be seen from Figure 20, an electrical efficiency (η) of close to 50% is observed within a power range of 0.5–1.3 kW; following the attainment of 1.5 kW, a small decrease was observed. At 2 kW, electrical efficiency was close to 47%. As can be seen, the total hydrogen consumption increases with increasing electrical power from the PEMFC stack operation. When the PEMFC stack operates with electrical power close to 2 kW, the hydrogen flux required to supply this device is estimated at the level of 26 Ndm3/min.

3.3. The Integrated Power Sources Involving the 2 kW PEMFC Stack and a Supercapacitor Bank

In this study, the results of electrical tests of a hybrid power source consisting of a stack of 2 kW fuel cells and a supercapacitor bank with a capacitance (C) of 8 F are presented. The main objective of the supercapacitor bank is to eliminate the voltage dips caused by the operation of the SCU system during the operation of the 2 kW PEMFC stack and to provide the peak electrical power (P) of >2000 W while the vehicle is moving.
Figure 21 shows the changes in voltage (U) measured by a voltmeter and the current intensity (I) measured with an ammeter at the input to the electricity receiver for systems according to the configuration shown in Figure 5.
If a supercapacitor is connected in parallel to the output of the PEMFC stack (as shown in Figure 5), the voltage (U) dips and the current (I) decays at the input to the electricity receiver, which result from the operation of the SCU, are eliminated. At the same time, it can be observed that, for a load with a current (I) in the range from 1 A to 80 A, there was no voltage decay to 0 V, and the continuity of the current was maintained without its limitation. This proves that the energy stored in the supercapacitors was sufficient to cover the demand of the electrical energy receiver at the moment of voltage decrease during the PEMFC stack operation when the SCU was activated. When loaded with a current (I) of 90 A, the protection of the fuel-cell stack controller turned it off.
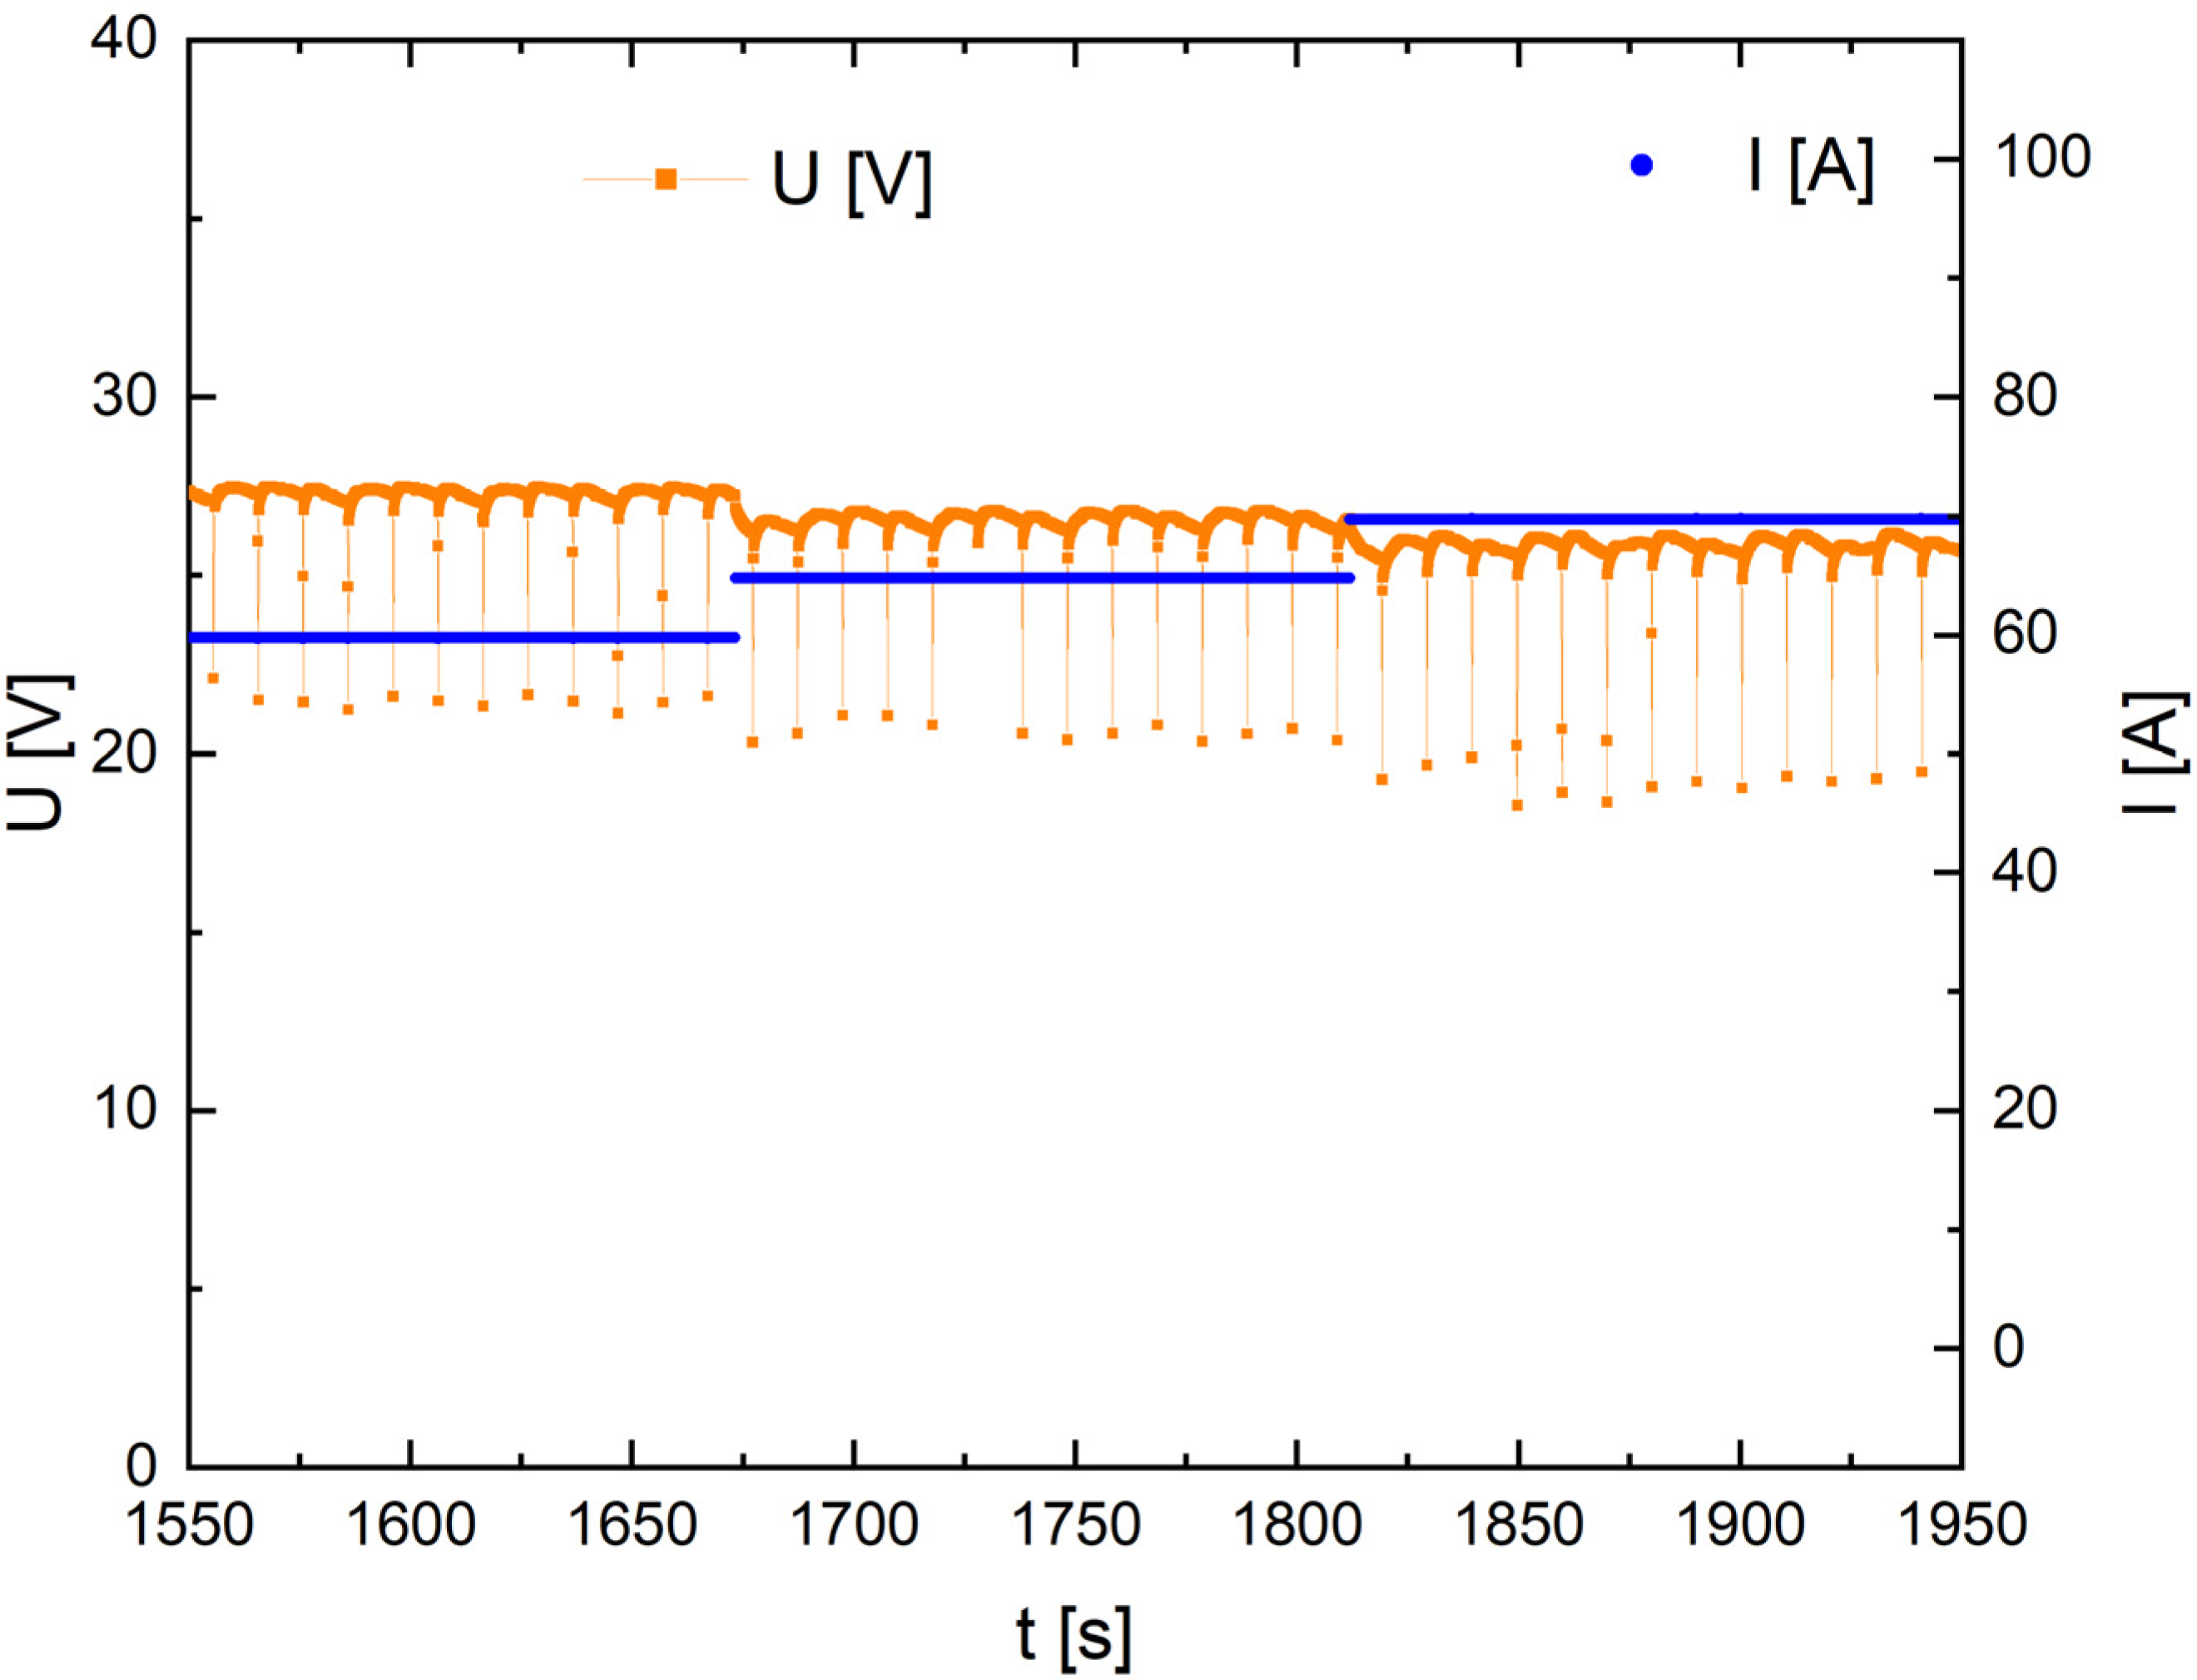
Figure 22 shows a graph of changes in the voltage (U[V]) measured by the voltmeter (V) and the current intensity (I[A]) measured by the ammeter (A) at the input to the electricity receiver powered by the PEMFC stack with an operating SCU in configuration with two parallel supercapacitors with a total capacitance (C) of 2 × 4.15 = 8.3 F.
In the case of the configuration in Figure 5, when the PEMFC stack is connected directly to the electricity receiver with a parallelly connected supercapacitor bank with a capacitance (C) of 8.3 F, the graph in Figure 22 shows the voltage (U) at the moment of activation of the SCU decreasing every 10 s from 27 V to 20 V for a current (I) of 65 A. The voltage dips after using two supercapacitor banks connected in parallel were limited to 20 V without loss of continuity of power supply to the receiver with a current of 65 A. When the SCU is operational and there is no power supply from the PEMFC stack, electrical energy is taken from the supercapacitor bank to the receiver, which causes it to discharge, and the voltage decreases to the value resulting from the load current.
To sum up, the use of supercapacitor banks with progressively larger capacitance increasingly eliminates the unfavourable phenomena of voltage dips that occur during the operation of the SCU of the PEMFC stack. The size, and therefore capacitance, of this supercapacitor bank must be selected depending on the current consumed by the electricity receiver powered by the fuel-cell stack and the frequency and duration of voltage decays caused by the operation of the SCU.

3.4. Improvement of Operating Parameters and Energy Recovery during the Performance of an Air-Cooled Stack of PEMFCs with Open Cathodes

This section presents a solution for the measurements (Figure 6) of a new type of SCU system that allows for the recovery of energy loss during the momentary short circuit. In solutions to date, the electrical energy generated during the short circuit because of the flow of short-circuit current has been mainly dissipated as heat. In the presented solution, the recovered electrical energy is stored in a supercapacitor from which it can be retrieved and used (e.g., for supplying the electric loads). The new SCU system design improves the electrical power rating of the fuel-cells stack by reducing the voltage drop on the electrolyte internal resistance (self-moistening) because of the flow of a momentary short-circuit current. It also allows for increased efficiency of the power generator with PEMFCs, thanks to the energy recovered from the SCU system.
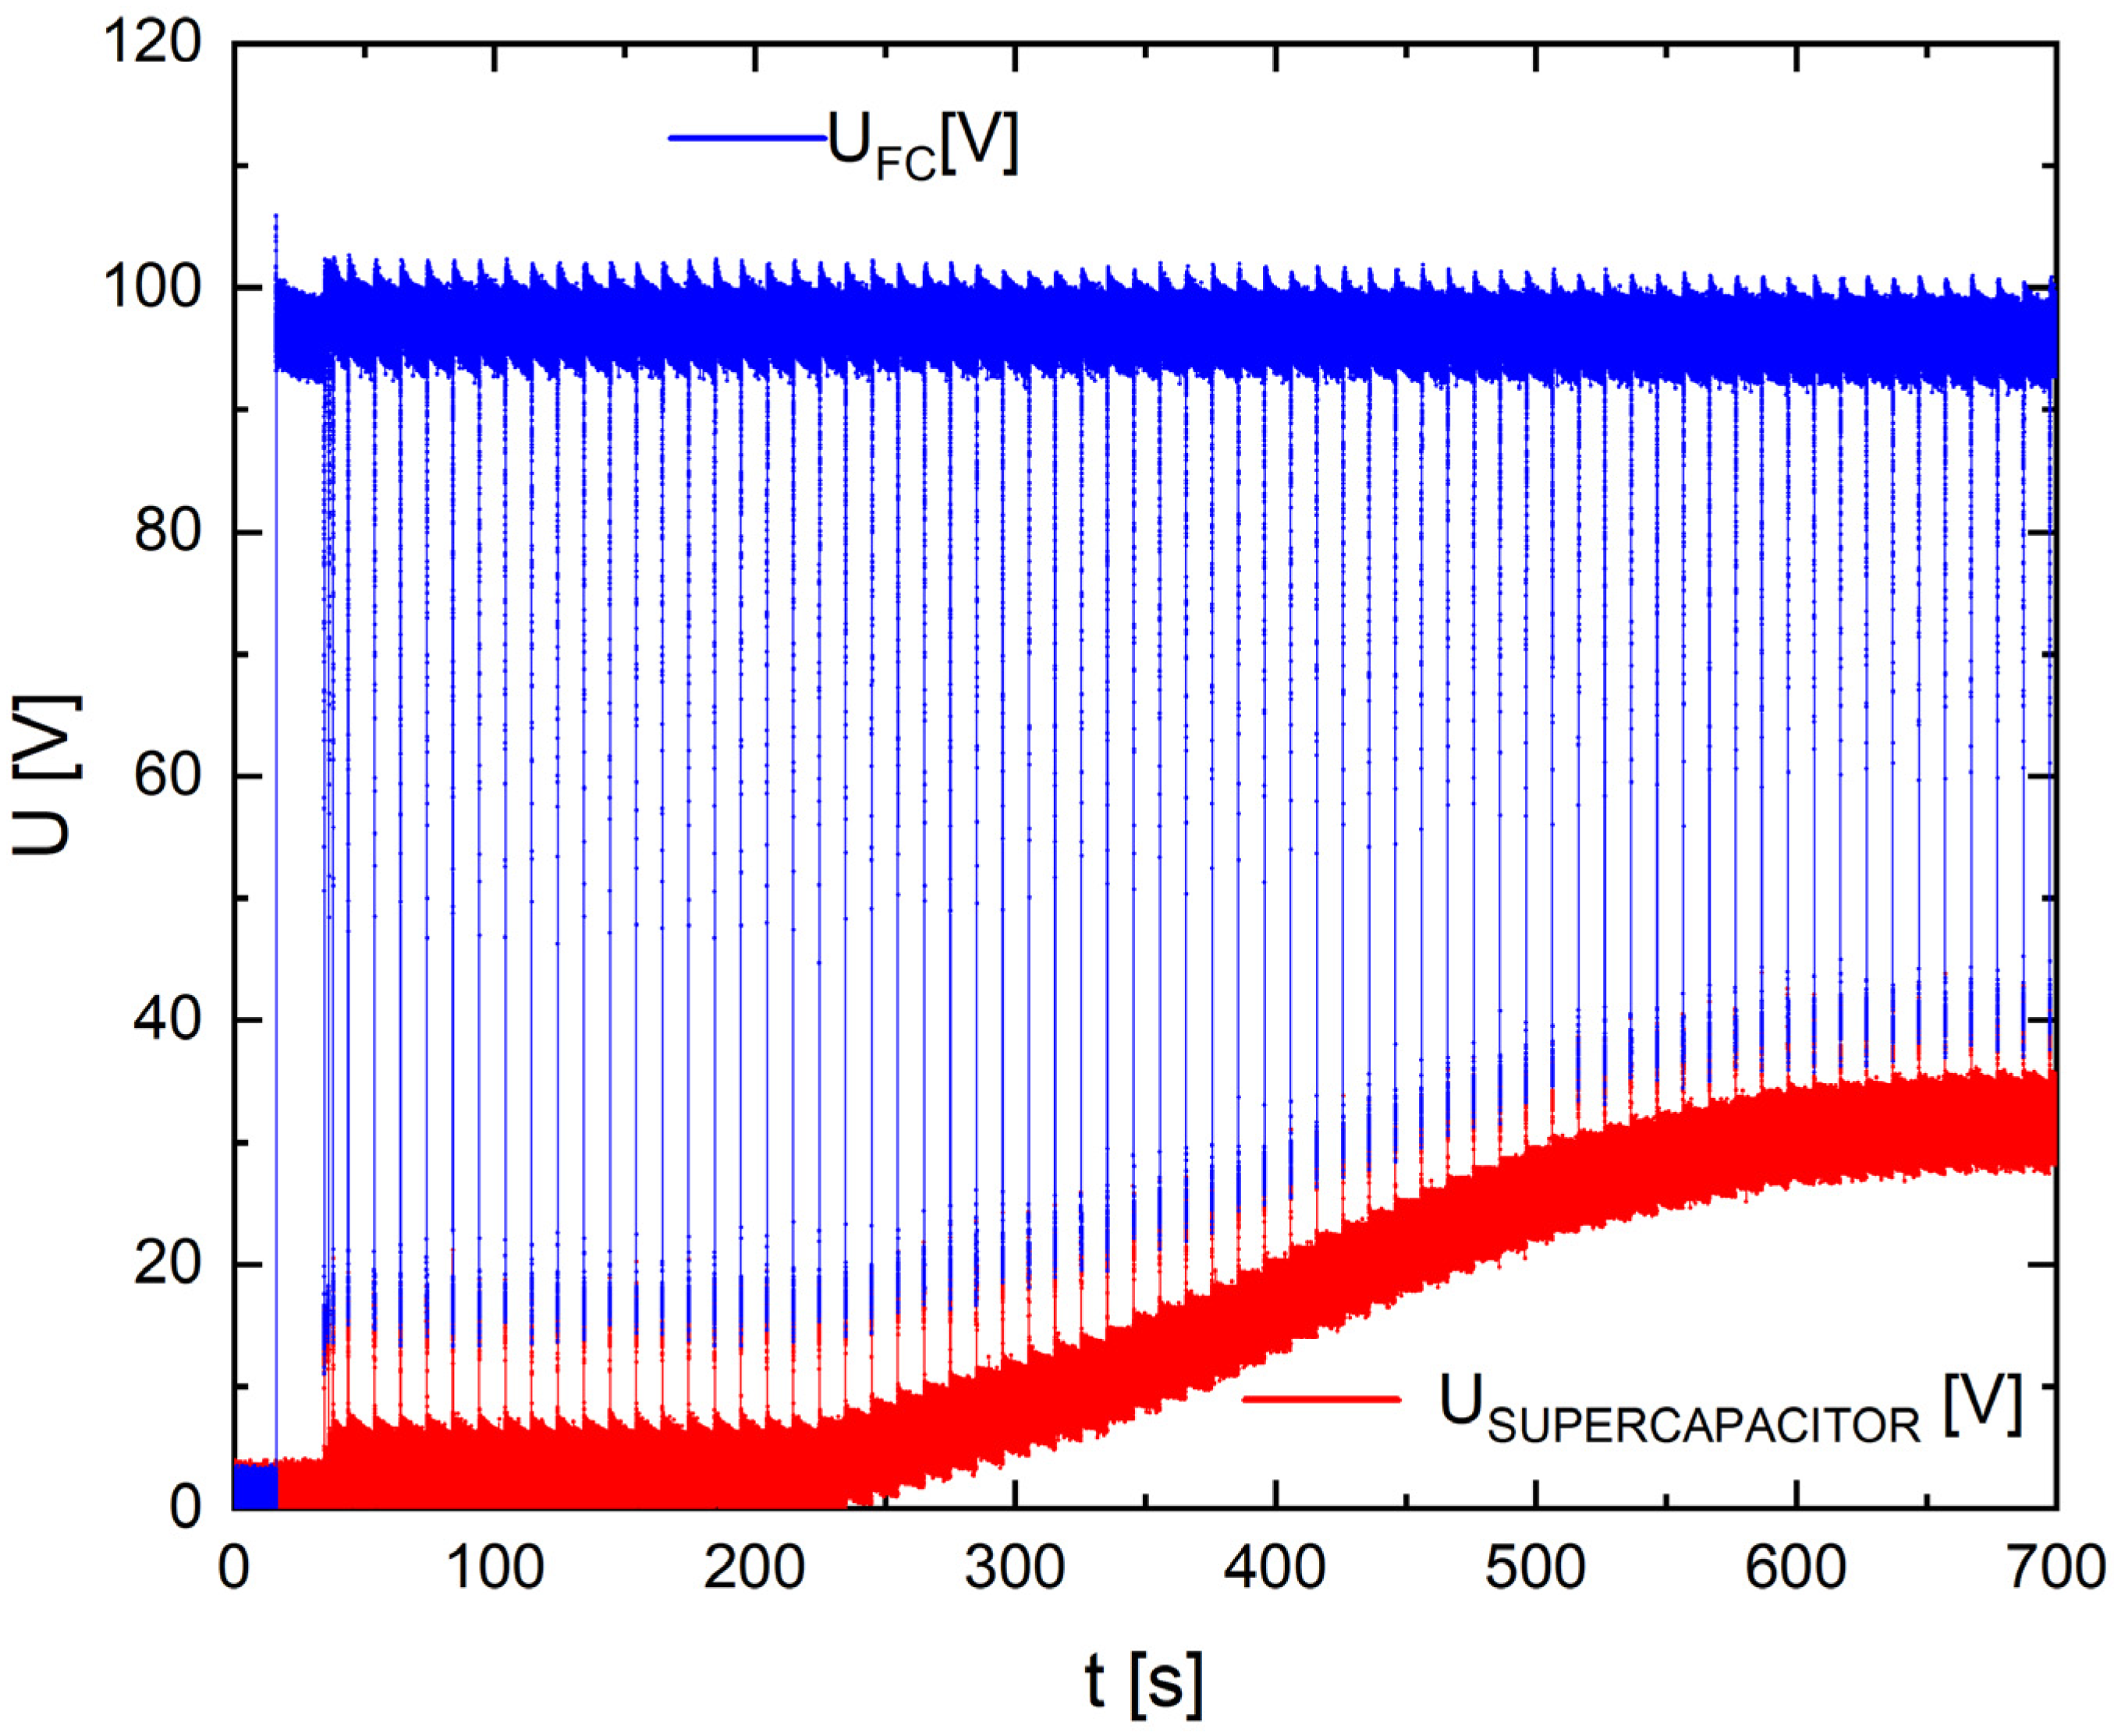
Figure 23 and Figure 24 illustrate the possibility of the energy recovery from the SCU system by a supercapacitor bank integrated with a 5 kW stack of PEMFCs.
Figure 23 presents a voltage vs. time graph for the stack of PEMFCs (Cell Two) and the supercapacitor bank (Capacitor Two) during the SCU system operation with energy recovery. An important feature is the occurrence of regular voltage drops (peaks) (U) (Cell Two) on the stack of PEMFCs. It is important to notice the operation of the SCU system and the corresponding voltage increase (Capacitor Two). The voltage dips are caused by the activation of the fuel-cell stack by means of the transistor of the supercapacitor bank (which is charged during those voltage dips) and are observed as positive peaks (also occurring every 10 s). After the initial charging of the supercapacitor bank at t = 380 s, the energy stored in supercapacitors is retrieved.
Figure 24 shows a staged increase of current (I) taken from the supercapacitor bank from 0 A at t = 380 s to 0.26 A at t = 650–700 s. The electrical power (P) of the energy retrieved from the supercapacitor bank reaches 8 W, and the voltage (Capacitor Two) on the supercapacitor bank stops increasing and reaches around 32 VDC. In addition, to eliminate the voltage dips on the output from the stack of PEMFCs during the SCU system operation, an additional supercapacitor bank should be used to filter these discrete voltage changes.

3.5. Hybrid Power Sources Involving a PEMFC Stack and Battery Pack

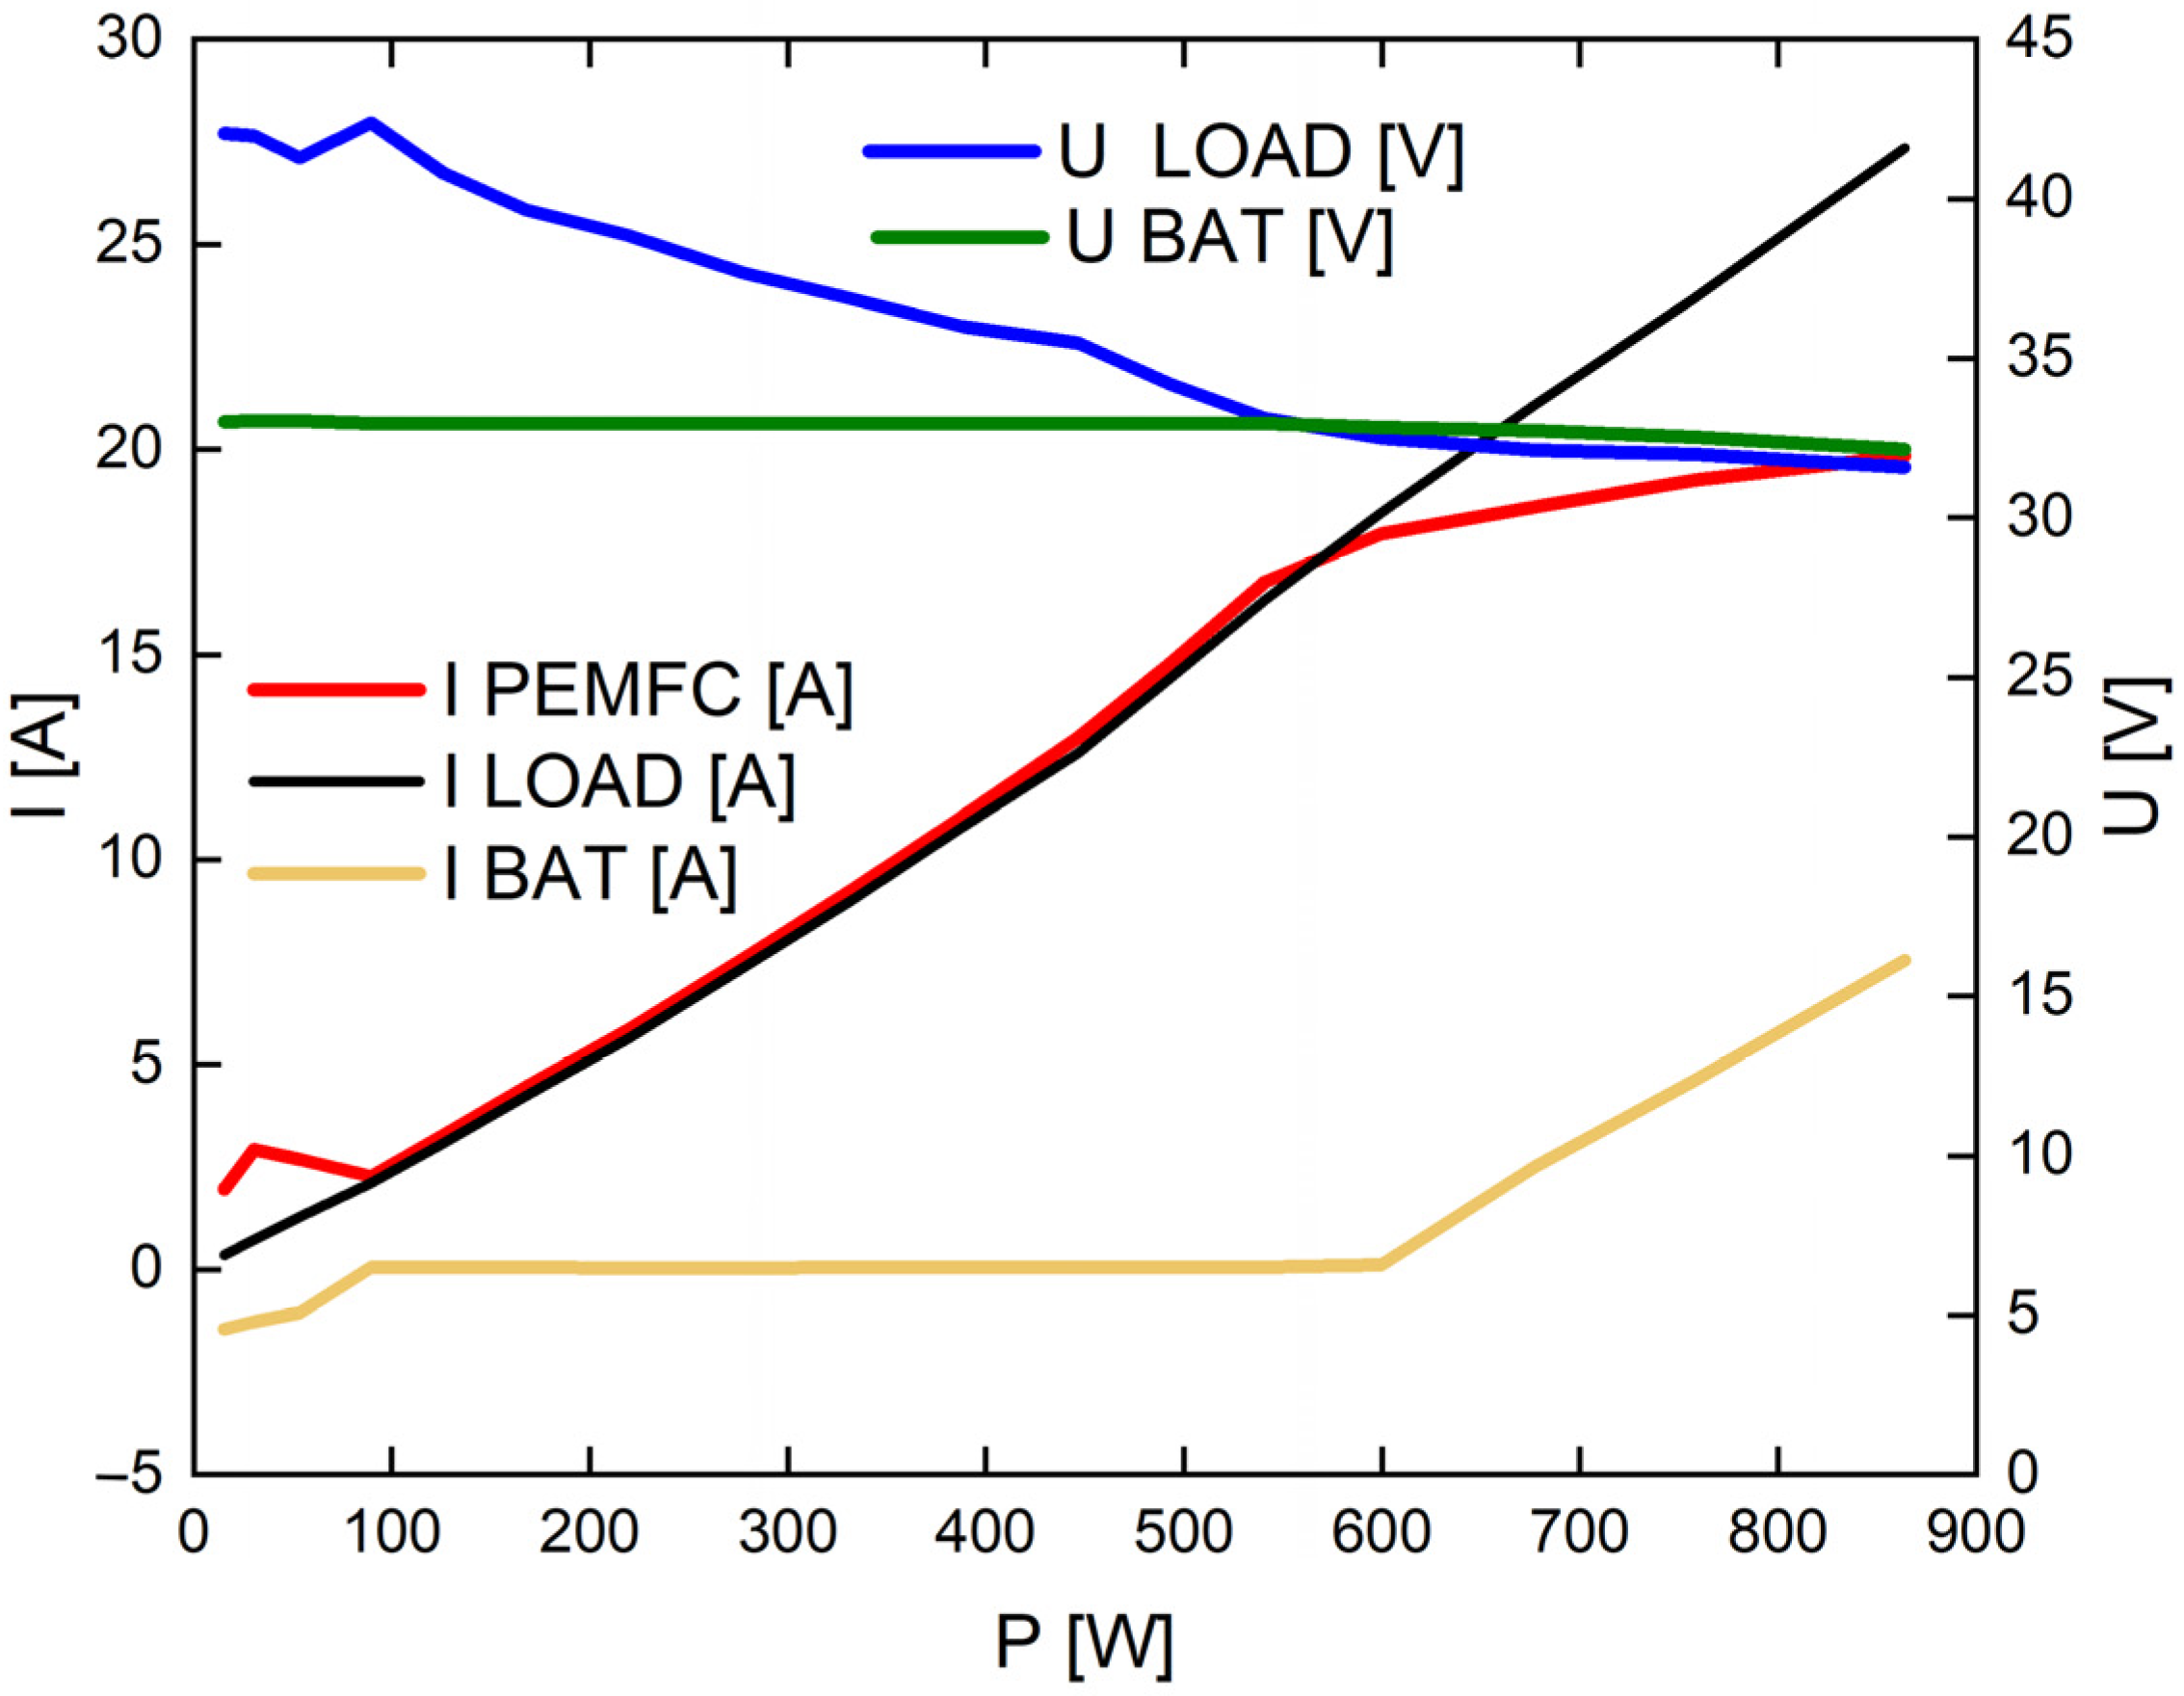
The important issue relating to the application of the PEMFC stack in the electrical propulsion unit is the integration of a 2 kW PEMFC stack with an electrochemical battery. In Figure 25, the analysis of the electrical power output of a hybrid power source during the battery-charging process is presented.
The graph in Figure 25 shows the dependencies of changes in current and voltage for the electrical load power-supply system powered in parallel from a stack of fuel cells and a BAT battery pack (LiPo 8S) charged by a DC–DC converter. In the case of a load with power (P) below 100 W, the voltage measured by electrical load, which is also the voltage measured at the output terminals of the PEMFC stack, has a high value of approximately ULOAD = UPEMFC = 42 V. This is higher than the voltage of the BAT battery pack (LiPo8S) UBAT = 33 V. At the same time, low current consumption by electrical load ILOAD < 5 A allows the cell to be loaded by the converter and recharged using the DC–DC converter, lowering the voltage (LM2569) of the BAT battery pack, which is visible as negative values of the battery current IBAT = (−2 A). Thus, the PEMFC stack operates and is kept ready for load, while excess energy is stored in the BAT battery pack through the hybrid charging mode. After exceeding power (P) of 100 W, all energy from the fuel cell is directed to the powered electrical load, as evidenced by the increase in the load current of the motor ILOAD from 5 A to 18 A for power (P) of 600 W. The voltage of the fuel cell at this time is gradually reduced from ULOAD = UPEMFC = 42 V to ULOAD = UPEMFC = 33 V for power (P) of 600 W. During this time, the BAT battery pack is not working IBAT = 0 A and the voltage UBAT = 33 V is kept constant. This is a fuel cell’s only operating mode in a hybrid system. After exceeding power (P) of 600 W, the voltage on the electrical load drops to the value ULOAD = UPEMFC < 32 V, which enables the automatic connection of the BAT battery pack and the transition of the system to the hybrid operation mode. That is, all energy from the fuel cell IPEMFC = 18 A is directed to power the electrical load ILOAD = 21 A, and the missing electricity is taken from the BAT battery pack, as evidenced by the positive value of the battery current IABT = +2.5 A at power (P) of 677 W. A further increase of power in the electrical load causes an increase in the current drawn mainly from the BAT battery pack. When loaded with a power (P) of 864 W, it reaches the value of IBAT = +7.5 A, and the accompanying voltage drops to the value of UBAT = 32 V.

3.6. The Utility of an Elaborated 2 kW PEMFC in the Propulsion Unit for the UGV Research Platform

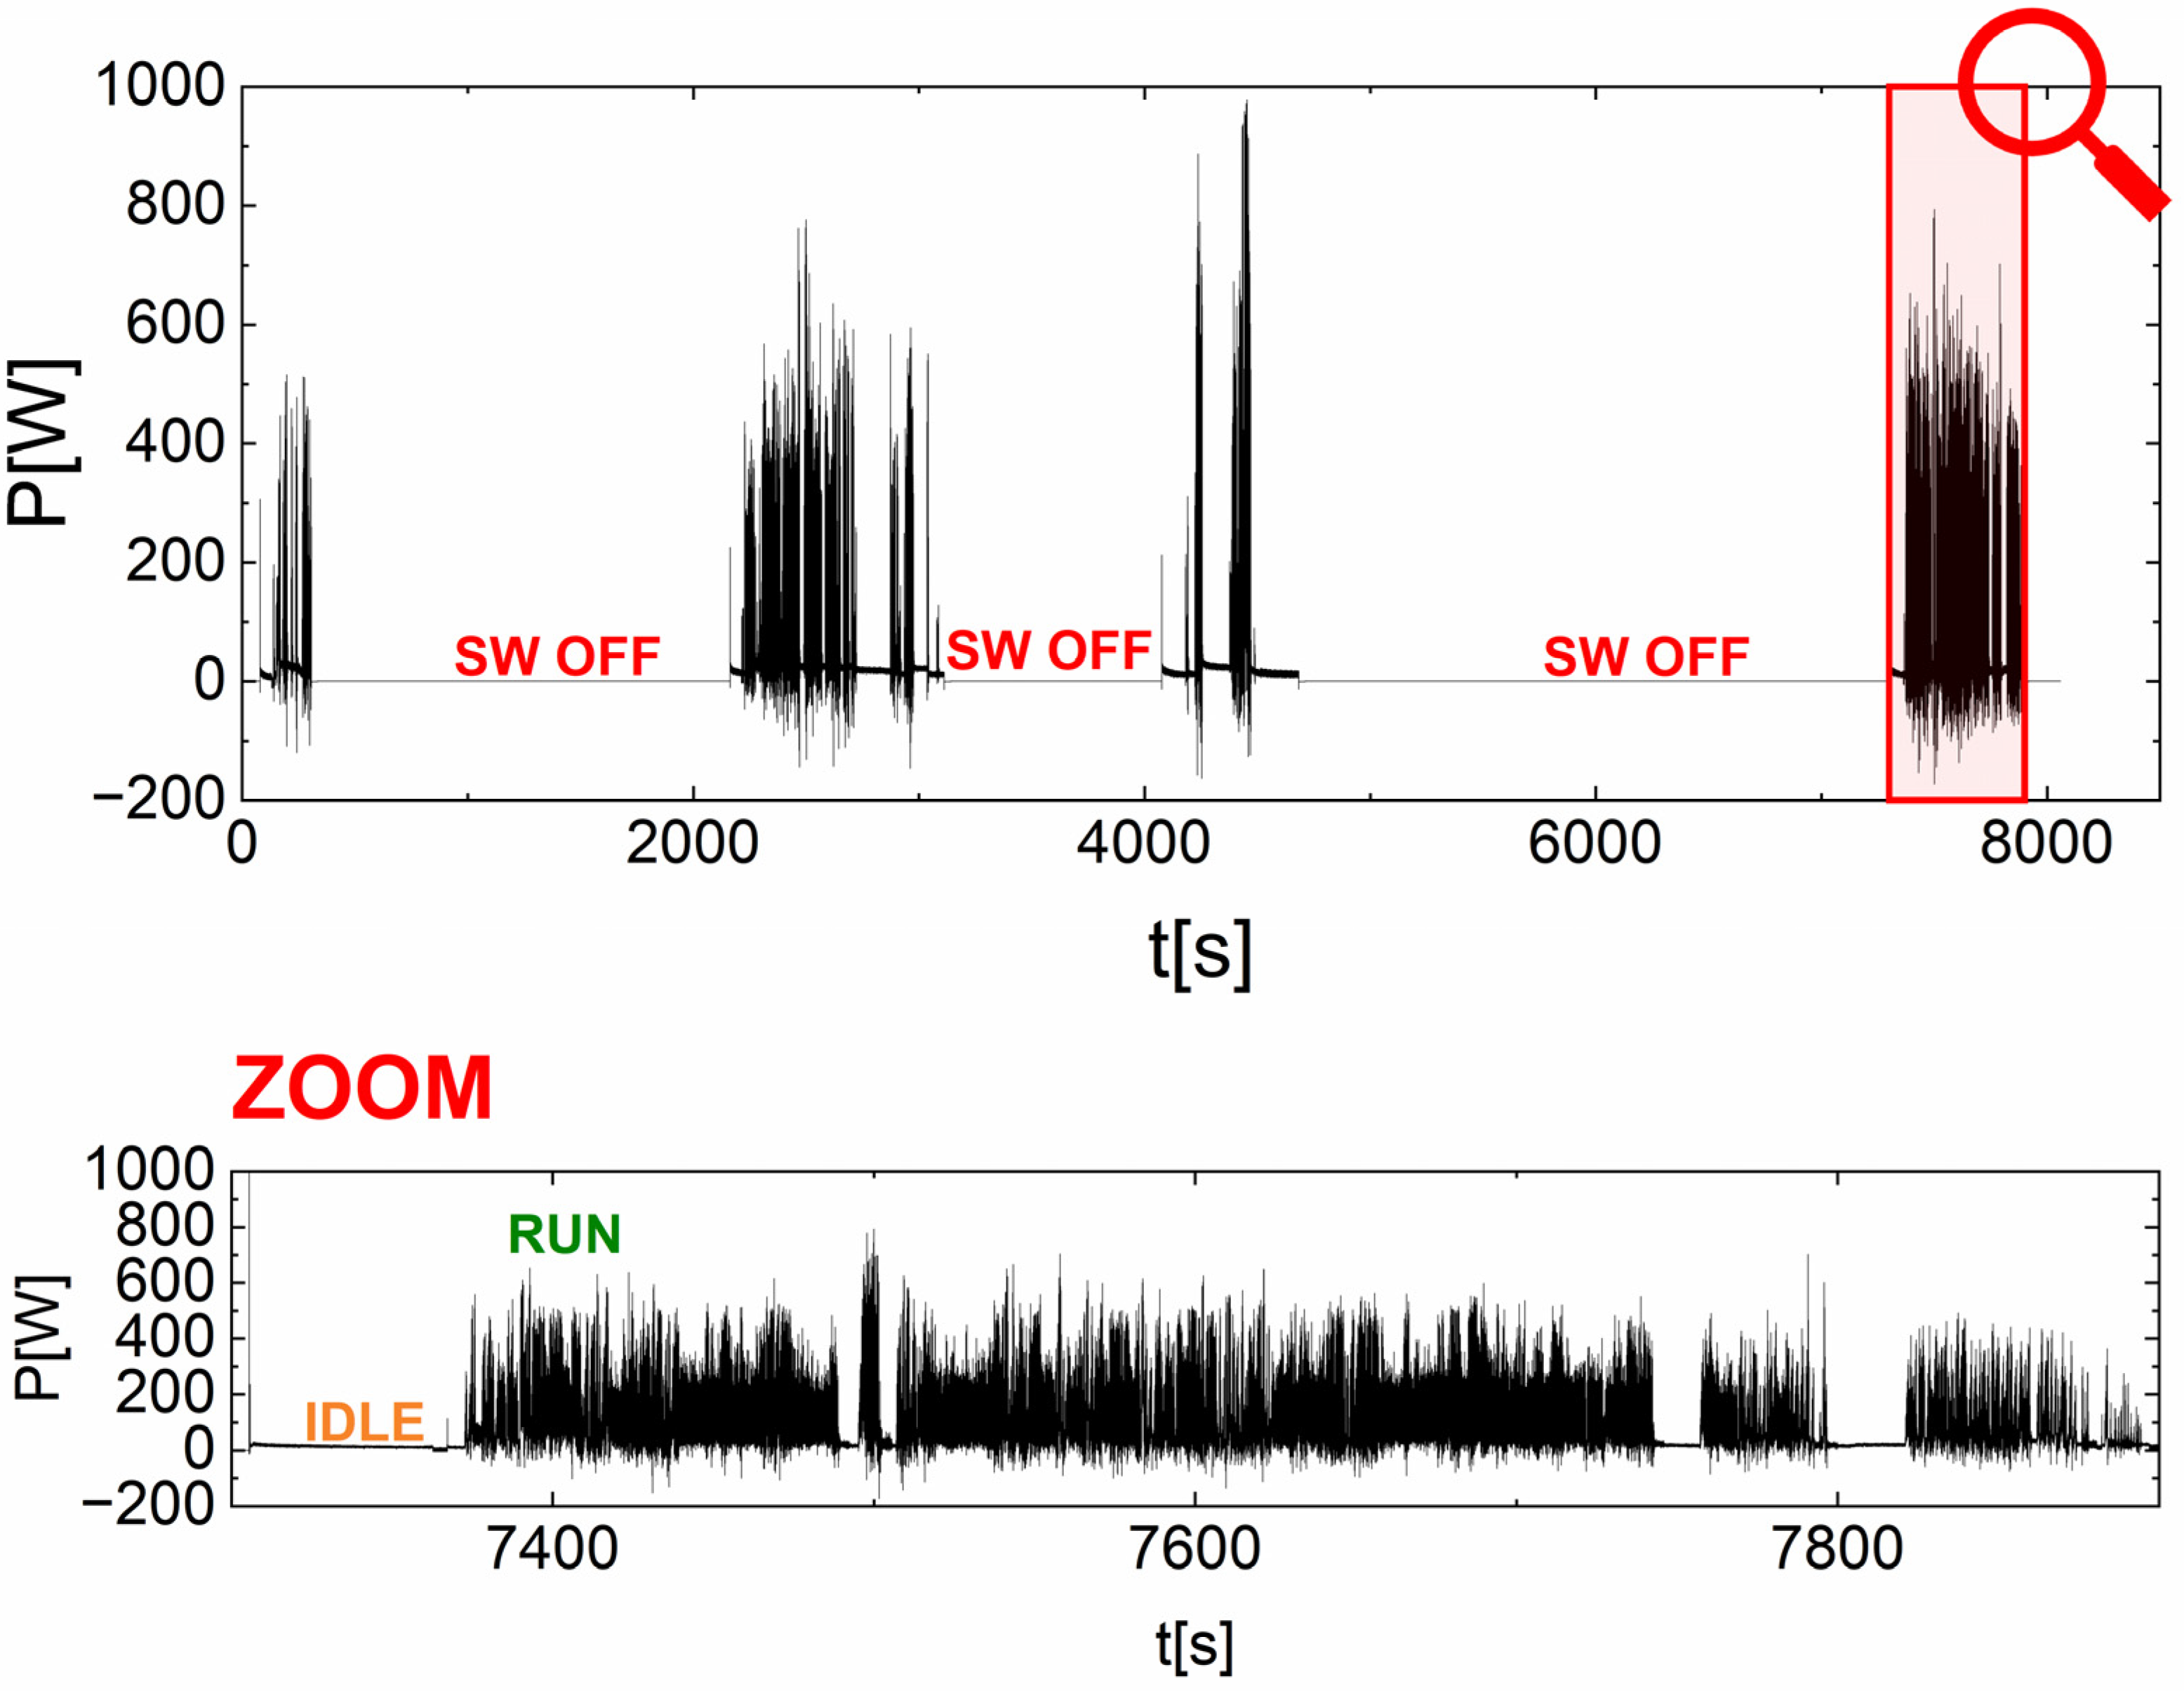
The key stage in testing the suitability of a 2 kW PEMFC stack was its application to the robot’s drive unit. Figure 26 shows the registered changes in the electrical power of a 2 kW PEMFC stack.
The recorded profile of the changes in electrical power (P) over time (t) shows the following operating conditions of the UGV platform while travelling at a speed of v = 4 km/h. As can be seen from Figure 26, the peak power recorded in this profile did not exceed 600 W.
Baldic et al. [61] analysed the properties of PEMFCs developed by Protonex (Southborough, MA, USA), which are optimised for longer endurance in applications such as small UAVs and UGVs. These applications require power systems with high specific energy (Wh/kg). Within the 100–1500 W power range, it has been shown that fuel-cell systems can outperform battery systems by a factor of 2–8x. The integration of fuel-cell power systems into these platforms can provide significant additional mission capabilities for military and civilian applications. UGV Talon is a representative small UGV, which contains hybrid power sources involving a PEMFC stack and a Li-ion battery pack. This new solution in the area of hybrid power sources provides for twice the energy storage of advanced batteries [62,63].

3.7. Development of a Hydrogen Distribution-Management System for the Purpose of Electricity Production and the Needs of the PEMFC Stack

In mobile applications with PEMFCs, the most desirable type of hydrogen is the so-called green hydrogen, which can be produced in a decentralized installation of an off-grid energy system containing 6.5 kW PV panels, an electrochemical battery (useful energy stored ~10 kWh), an AEM electrolyser with a hydrogen production capacity of j = 0.5 m3/h, a pneumatic compressor to compress the hydrogen to a pressure of 350–400 bar, and ultra-lightweight hydrogen tanks.
The concept of a distributed microgrid solution composed of photovoltaic installations, electrochemical batteries as an energy buffer, and a water electrolysis unit involving an electrolyser with an anion exchange membrane (AEM) electrolyser or proton exchange membrane is proposed for the production and delivery of hydrogen for small vehicles, as well as for stationary application. In this study, the electrolyser with an anion exchange membrane is proposed. The main advantages of an AEM electrolyser compared to a PEM electrolyser with similar capacities are the possibility to achieve higher hydrogen output pressure as well as lower electrical energy needs required for the capacity production of 1 m3 H2/h. The literature suggests that AEM electrolysers can be made more cost effective by employing lower-cost catalysts (non-PGM electrocatalysts) as well as using low-cost materials in the construction of the hydrogen production unit [64,65,66].
Figure 27 presents the predicted electricity generation of a 6.5 kW PV system used to operate the AEM electrolyser, charge the electrochemical battery, and power the hydrogen compressor.
Figure 27 shows the monthly energy yields Epv [kWh] of a PV system consisting of 14 Longi Solar LR4-72 HPH 450 PV modules for a site in Krakow. In the winter months, the monthly energy values that can be obtained from the PV system are around 200 kWh, while in the summer months, they reach 915 kWh (in July). Over the course of the year, the entire plant will produce approximately 6200 kWh for the site in Krakow.
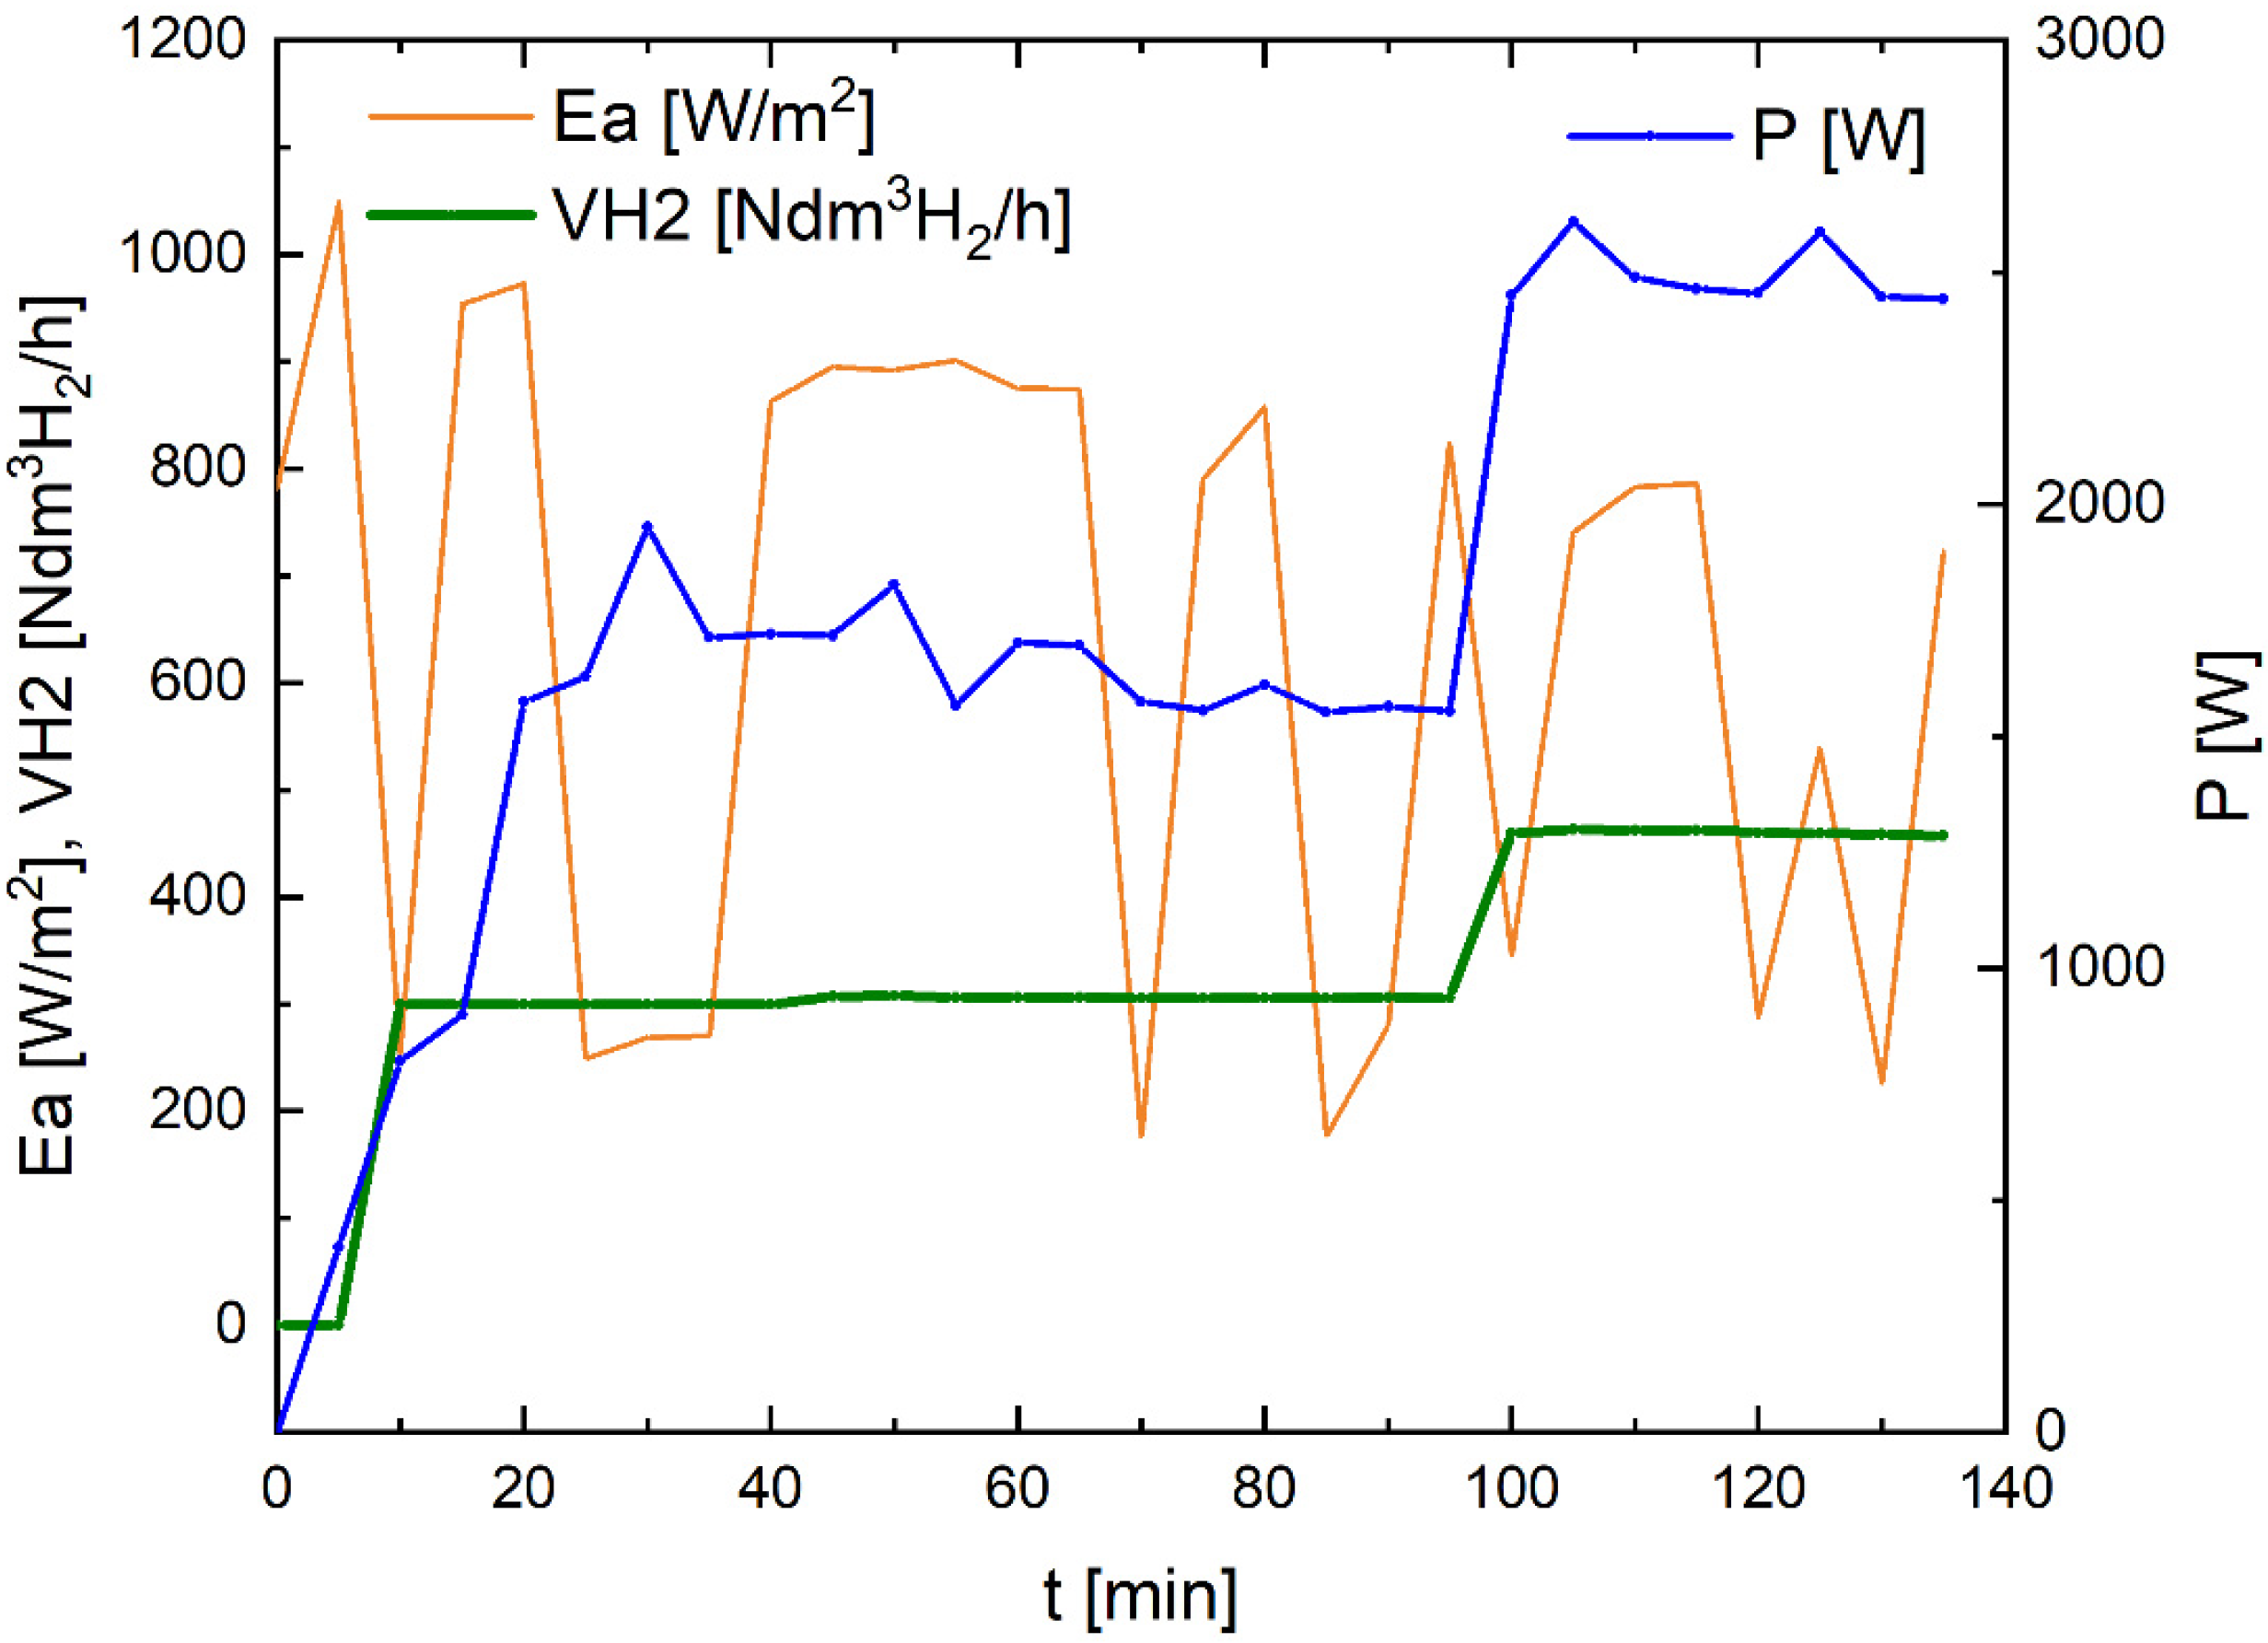
The possibility of using the electricity generated by a PV system to operate the AEM electrolyser and other electricity consumers is shown in Figure 28. In Figure 28, the green curve represents the efficiency VH2 [Ndm3 H2/h] of hydrogen production in an electrolyser operated with electricity, whose power (P) is represented by the blue curve. Hydrogen production was started after five minutes, reached 300 Ndm3H2/h after 10 min, and was maintained for 90 min at an average power (P) of ~1.6 kW. The efficiency of the hydrogen production then increased, reaching 460 Ndm3H2/h after 100 min at a power (P) of ~2.5 kW. The orange curve of the intensity of solar radiation (Ea) falling on the PV systems changed from 200 W/m2 to 1000 W/m2 during the measurement. However, despite these changes, we do not observe any changes in the power (P) or the production efficiency of hydrogen. The electrochemical batteries, with a useful energy of ~20 kWh, were a stable power source for the electrolyser of the PV plant during the whole measurement period.
Based on the electrical measurements carried out on the experimental set-up shown in Figure 7, some data were obtained on the energy required to supply the AEM electrolyser with a capacity of j = 0.5 m3/h and on the energy required for hydrogen compression from 30 to 350 bar using the Maximator compressor (Booster DLE 15-2-GG-H2 + Booster DLE 30-2-GG-H2). The data collected are summarised in Table 3. The hydrogen processing parameters are defined as the volume or mass of hydrogen as a compressed gas under 350 bar and the time required to produce hydrogen, which is required to be stored in composite tanks of different listed capacities. The estimated and experimentally verified time of operation of a 2 kW PEMFC stack with nominal electrical power is presented.
Based on the data presented in Table 3, it can be concluded that, when using hydrogen tanks with a total water capacity (V) of 4 dm3, the operating time of the stack with the full declared nominal power is 0.7 h. Gradually increasing the volume of the composite hydrogen tank, e.g., 13.6 dm3 or 19.2 dm3, results in an appropriate extension to the operating time of the fuel-cell stack with full electrical power (P) of 2 kW, which is ~2.3 h (350 bar) for a 13.6 dm3 tank and ~3.5 h for the greatest considered tank volume of 19.2 dm3.
One of the possibilities for distributed hydrogen production to meet the needs of PEMFC stacks in mobile robots is the design and construction of a mobile hydrogen dispenser. Hydrogen will be produced by water electrolysis in an AEM electrolyser with a capacity of j = 0.5 m3/h. A PV installation with an electrical power output of 6.5 kW will be used as the main source of electricity to supply the AEM electrolyser. Composite high-pressure cylinders with a total volume of 19.2 dm3 (two cylinders, each with a volume of 9.6 dm3) at a pressure of 350 bar can collect hydrogen with a volume of VH2 = 5.49 Nm3 H2 and a mass of mH2 = 0.45 kgH2.
An electrolyser with a capacity of 0.5 Nm3 H2/h (or 1 kgH2/day) can produce the volume of hydrogen required to fill a composite hydrogen cylinder of 19.2 dm3 at a pressure of 350 bar in 11 h. If the electrolyser requires 4.8 kWh/Nm3 H2 of electricity to produce hydrogen at 350 bar, it will consume 26.4 kWh. In Table 3, the electrical energy required to compress hydrogen using a Maximator piston compressor from a pressure of 35 bar at the outlet of the electrolyser to a hydrogen storage pressure of 350 bar in tanks is also presented. The required energy to compress hydrogen gas is 0.26 kWh for a 4 dm3 tank or 1.29 kWh for a 19.6 dm3 tank.
In this way, the electrical energy required to supply an electrolyser and a hydrogen-compression plant is determined. The usefulness of the elaborated distributed green hydrogen production unit to supply the PEMFC stack in the propulsion unit of the UGV research platform is demonstrated.

4. Conclusions

This paper provides the results of investigations into the energy-efficiency characteristics of a PEMFC stack as a component for building a hybrid energy source to power the propulsion of the UGV research platform. First, electrical load profiles for the selected UGV platform were determined while driving on different terrains and under different climatic conditions. Based on the research conducted, it was found that the highest average electrical power load values were in the 1400–1800 W range. The electrical waveform recorded from a moving UGV platform also indicated a peak power demand above 2000 W in a short period. The results obtained from the electrical investigation of a 2 kW PEMFC stack under dynamic electrical load in stationary conditions confirm its durability of operation as sufficient to be included as a component in the construction of the UGV power unit. The electrical efficiency is determined to be close to 50% in the power range of 500–1600 W. In the case of higher electrical power, a small drop in electrical efficiency is observed at 47%. It was found that more than 95% of hydrogen is used for electricity production in a PEMFC stack. Special attention is paid to the analysis of the operation of the PEMFC stack under the humidification process realized by the SCU. During the humidification of polymer Nafion-based membranes, voltage dips often occurred as the SCU operated. To mitigate the voltage dips during PEMFC operation, the integration of a bank of supercapacitors is proposed. The additional option of integrating a bank of supercapacitors can recover the electrical energy dissipated under the SCU process. The 2 kW PEMFC stack was successfully tested in the UGV research platform driving on a concrete road. The option of green hydrogen production from an off-grid renewable energy system for the UGV platforms is also investigated in the experimental installation. It was found that the application of an AEM electrolyser with a hydrogen capacity production of j = 0.5 m3/h is suitable for supplying hydrogen for a PEMFC stack used in a UGV platform. The electrical energy required to supply the AEM electrolyser and to perform hydrogen compression was determined. The proposed PV installation seems to be a good option for a mobile point charger.

Author Contributions

M.D.; conception of the paper, writing, preparation of the original draft, preparation of the revision version, monitoring and interpretation of the results, M.Z.; methodology of the UGV investigations, experimental parts, writing of the manuscript; software preparation, data curation A.R.; preparation of the experimental part PEMFC stack and supercapacitors, graphs, monitoring; M.R.; software, data curation, visualisation. All authors have read and agreed to the published version of the manuscript.

Funding

This research work was funded as part of the “Implementation Doctorate” programme V/2021 68.10.210.05750.

Data Availability Statement

Data are contained within the article.

Conflicts of Interest

The authors declare no conflict of interest.

Abbreviations

ACAlternating current
AC–DCAlternating current to direct current
AEMAnion exchange membrane
BATBattery
BOPBalance of plant
BLDCBrushless DC electric motor
CBRN&EChemical, biological, radiological, nuclear, and explosive
DCDirect current
DC–DCDirect current to direct current
DC–ACDirect current to alternating current
DEMDigital elevation model
DoFDegrees of freedom
FCFuel cell
GNSSGlobal navigation satellite system
GPSGlobal positioning system
GUGiKGłówny Urząd Geodezji i Kartografii (Head Office of Geodesy and Cartography) [Polish]
IEDImprovised explosive device
LIDARLaser imaging, detection, and ranging
LiIonLithium-ion battery
LiPoLithium-ion polymer
Łukasiewicz–PIAPŁukasiewicz Research Network–Industrial Research Institute for Automation and Measurements PIAP
MCUMicrocontroller unit
NMTNumeryczna Mapa Terenu (Digital Elevation Model) [Polish]
NONormally open
NCNormally closed
OCVOpen-circuit voltage
PIAPPrzemysłowy Instytut Automatyki i Pomiarów (Industrial Research Institute for Automation and Measurements) [Polish]
PEMProton exchange membrane
PEMFCProton exchange membrane fuel cell; proton electrolyte membrane fuel cells
PVPhotovoltaic
PVCPolyvinyl chloride
RTKReal-time kinematic positioning
SCUShort-circuit unit
SOCState of charge
UAVUnmanned aerial vehicle
UGVUnmanned ground vehicle
X-rayX-radiation (Röntgen radiation)
H2Hydrogen
jH2Hydrogen flux over time [m³H2/h]
PRMSRoot mean square electrical power [W]
PavgAverage electrical power [W]
PinInput electrical power [W]
γSpecific power [kW/ton]
γminRecommended minimum value specific power [kW/ton]
γmaxRecommended maximum value specific power [kW/ton]
mbMass of the vehicle base [ton]
mH2Mass of hydrogen [kgH2]
ΔmMass of other components installed on the vehicle base [kg]
NSMechanical propulsion power [kW]
ULOADElectrical voltage drop on the load [V]
IBATBattery current [A]
ILOADElectrical load current intensity [A]
UPEMFCElectrical voltage on fuel-cell stack [V]
VH2Hydrogen volume [Ndm³H2/min]
UBATVoltage on battery [V]
EpvEnergy yields [kWh]
EaVariation of solar radiation [W/m²]
CElectrical capacitance [F]
IElectrical current intensity [A]
PElectrical power [W]
UElectrical voltage [V]
tTime [s]
TTemperature [°C]
vVelocity [km/h]
ηElectrical efficiency [%]

References

  1. Krecht, R.; Suta, A.; Tóth, Á.; Ballagi, Á. Towards the resilience quantification of (military) unmanned ground vehicles. Clean. Eng. Technol. 2023, 14, 100644. [Google Scholar] [CrossRef]
  2. Rose, M. Technology Development for Army Unmanaged Ground Vehicles; National Academy of Science: Washington, DC, USA, 2002. [Google Scholar]
  3. Bishop, R. A survey of intelligent vehicle applications worldwide. In Proceedings of the IEEE Intelligent Vehicles Symposium 2000 (Cat. No. 00TH8511), Dearborn, MI, USA, 5 October 2000; IEEE: Piscataway, NJ, USA, 2000; pp. 25–30. [Google Scholar]
  4. Mirzapour, O.; Rui, X.; Sahraei-Ardakani, M. Transmission impedance control impacts on carbon emissions and renewable energy curtailment. Energy 2023, 278, 127741. [Google Scholar] [CrossRef]
  5. Chen, H.Y.; Zhang, Y. An overview of research on military unmanned ground vehicles. Binggong Xuebao/Acta Armamentarii 2014, 35, 1696–1706. [Google Scholar] [CrossRef]
  6. Sivaraman, S.; Trivedi, M.M. Looking at vehicles on the road: A survey of vision-based vehicle detection, tracking, and behavior analysis. IEEE Trans. Intell. Transp. Syst. 2013, 14, 1773–1795. [Google Scholar] [CrossRef]
  7. Hu, X.; Assaad, R.H. The use of unmanned ground vehicles (mobile robots) and unmanned aerial vehicles (drones) in the civil infrastructure asset management sector: Applications, robotic platforms, sensors, and algorithms. Expert Syst. Appl. 2023, 232, 120897. [Google Scholar] [CrossRef]
  8. Han, Y.; Wang, B.; Guan, T.; Tian, D.; Yang, G.; Wei, W.; Tang, H.; Chuah, J.H. Research on Road Environmental Sense Method of Intelligent Vehicle Based on Tracking Check. IEEE Trans. Intell. Transp. Syst. 2022, 24, 1261–1275. [Google Scholar] [CrossRef]
  9. Chen, Y. Research on collaborative innovation of key common technologies in new energy vehicle industry based on digital twin technology. Energy Rep. 2022, 8, 15399–15407. [Google Scholar] [CrossRef]
  10. Min, C.; Pan, Y.; Dai, W.; Kawsar, I.; Li, Z.; Wang, G. Trajectory optimization of an electric vehicle with minimum energy consumption using inverse dynamics model and servo constraints. Mech. Mach. Theory 2023, 181, 105185. [Google Scholar] [CrossRef]
  11. Farooq, M.U.; Eizad, A.; Bae, H.-K. Power solutions for autonomous mobile robots: A survey. Robot. Auton. Syst. 2023, 159, 104285. [Google Scholar] [CrossRef]
  12. McNulty, D.; Hennessy, A.; Li, M.; Armstrong, E.; Ryan, K.M. A review of Li-ion batteries for autonomous mobile robots: Perspectives and outlook for the future. J. Power Sources 2022, 545, 231943. [Google Scholar] [CrossRef]
  13. Orhan, M.F.; Saka, K.; Yousuf, M. Design and Optimization of Fuel Cells: A Case Study on Polymer Electrolyte Membrane Fuel Cell Power Systems for Portable Applications. Adv. Polym. Technol. 2022, 2022, 6568456. [Google Scholar] [CrossRef]
  14. Çalışır, D.; Ekici, S.; Midilli, A.; Hikmet Karakoc, T. Benchmarking environmental impacts of power groups used in a designed UAV: Hybrid hydrogen fuel cell system versus lithium-polymer battery drive system. Energy 2023, 262, 125543. [Google Scholar] [CrossRef]
  15. Hagen, A.; Wulff, A.C.; Zielke, P.; Sun, X.; Talic, B.; Ritucci, I.; Frandsen, H.L.; Jensen, S.H.; Kiebach, W.R.; Hendriksen, P.V. SOFC stacks for mobile applications with excellent robustness towards thermal stresses. Int. J. Hydrogen Energy 2020, 45, 29201–29211. [Google Scholar] [CrossRef]
  16. Huang, Q.; Jiang, S.; Wang, Y.; Jiang, J.; Chen, Y.; Xu, J.; Qiu, H.; Su, C.; Chen, D. Highly active and durable triple conducting composite air electrode for low-temperature protonic ceramic fuel cells. Nano Res. 2023, 16, 9280–9288. [Google Scholar] [CrossRef]
  17. Papurello, D.; Iafrate, C.; Lanzini, A.; Santarelli, M. Trace compounds impact on SOFC performance: Experimental and modelling approach. Appl. Energy 2017, 208, 637–654. [Google Scholar] [CrossRef]
  18. Hu, Y.; Han, C.J.; Li, W.Y.; Hu, Q.; Wu, H.S.; Luo, Z.X. Experimental evaluation of methanol steam reforming reactor heated by catalyst combustion for kW-class SOFC. Int. J. Hydrogen Energy 2023, 48, 4649–4664. [Google Scholar] [CrossRef]
  19. Fang, Y.; Min, H.; Wu, X.; Wang, W.; Zhao, X.; Mao, G. On-Ramp Merging Strategies of Connected and Automated Vehicles Considering Communication Delay. IEEE Trans. Intell. Transp. Syst. 2022, 23, 15298–15312. [Google Scholar] [CrossRef]
  20. Xu, J.; Park, S.H.; Zhang, X.; Hu, J. The Improvement of Road Driving Safety Guided by Visual Inattentional Blindness. IEEE Trans. Intell. Transp. Syst. 2022, 23, 4972–4981. [Google Scholar] [CrossRef]
  21. Meldrum, J.S.; Green, C.A.; Gwaltney, G.D.; Bradley, S.A.; Keith, J.M.; Podlesak, T.F. Fuel-cell powered unmanned ground vehicle. In Unmanned Systems Technology IX, Proceedings of the Defense and Security Symposium, Orlando, FL, USA, 9–13 April 2007; SPIE: Bellingham, WA, USA, 2007; Volume 6561, p. 6561. [Google Scholar]
  22. Hwang, J.J.; Hu, J.S.; Lin, C.H. Design of a range extension strategy for power decentralized fuel cell/battery electric vehicles. Int. J. Hydrogen Energy 2015, 40, 11704–11712. [Google Scholar] [CrossRef]
  23. Isorna, F.; Fernandez Barranco, A.; Bogeat, J.A.; Lopez, E.; Segura, F.; Andujar, J.M. Use of unmanned fuel cell ground vehicles (UGVs) for precision agricul-ture (TecnOlivo Project). In Proceedings of the VII Symposium on Hydrogen, Fuel Cells and Advanced Batteries (HYCELTEC 2019), Barcelona, Spain, 1–3 July 2019; Available online: https://www.researchgate.net/publication/335060764 (accessed on 29 September 2023).
  24. Ren, P.; Pei, P.; Li, Y.; Wu, Z.; Chen, D.; Huang, S. Degradation mechanisms of proton exchange membrane fuel cell under typical automotive operating conditions. Prog. Energy Combust. Sci. 2020, 80, 100859–100903. [Google Scholar] [CrossRef]
  25. Chen, W.; Chen, B.; Meng, K.; Zhou, H.; Tu, Z. Experimental study on dynamic response characteristics and performance degradation mechanism of hydrogen-oxygen PEMFC during loading. Int. J. Hydrogen Energy 2023, 48, 4800-e11. [Google Scholar] [CrossRef]
  26. Cho, S.M.; Kim, C.; Kim, K.S.; Kim, D.K. Lightweight hydrogen storage cylinder for fuel cell propulsion systems to be applied in drones. Int. J. Press. Vessel. Pip. 2021, 194, 104428. [Google Scholar] [CrossRef]
  27. Li, X.; Zhu, C.; Liu, C.; Song, J.; Liu, X.; Li, J. Research on protection methods for 70 MPa on-board Type IV hydrogen storage cylinders under localized fire conditions. Int. J. Hydrogen Energy 2023, in press. [Google Scholar] [CrossRef]
  28. Barale, J.; Nastro, F.; Violi, D.; Rizzi, P.; Luetto, C.; Baricco, M. A metal hydride compressor for a small scale H2 refuelling station. Int. J. Hydrogen Energy 2023, 48, 34105–34119. [Google Scholar] [CrossRef]
  29. Yang, C.; Guo, R.; Jing, X.; Li, P.; Yuan, J.; Wu, Y. Degradation mechanism and modeling study on reversible solid oxide cell in dual-mode—A review. Int. J. Hydrogen Energy 2022, 47, 37895–37928. [Google Scholar] [CrossRef]
  30. Luo, L.; Chen, L.; Li, L.; Liu, S.; Li, Y.; Li, C.; Li, L.; Cui, J.; Li, Y. High-entropy alloys for solid hydrogen storage: A review. Int. J. Hydrogen Energy 2023, in press. [Google Scholar] [CrossRef]
  31. Shahi, R.R.; Gupta, A.K.; Kumari, P. Perspectives of high entropy alloys as hydrogen storage materials. Int. J. Hydrogen Energy 2023, 48, 21412–21428. [Google Scholar] [CrossRef]
  32. A New Mobile Robot PIAP PATROL®. Available online: https://piap.lukasiewicz.gov.pl/ (accessed on 25 September 2023).
  33. Krakówka, T.; Typiak, A.; Cader, M. Selection of Manipulator Configuration for a Portable Robot for Special Tasks. J. Autom. Mob. Robot. Intell. Syst. 2023, 16, 21–30. [Google Scholar] [CrossRef]
  34. Report an Analysis of, U.S. Army Unmanned Ground Vehicle Strategy; Colonel Glenn Baca United States Army. Available online: https://apps.dtic.mil/sti/pdfs/ADA568455.pdf (accessed on 18 September 2022).
  35. R8 INTEGRATOR 25 kW. Available online: https://argoxtv.com/intl/vehicles/r8-integrator-2 (accessed on 18 September 2022).
  36. R8 INTEGRATOR 20 kW. Available online: https://argoxtv.com/intl/vehicles/r8-integrator-2 (accessed on 18 September 2022).
  37. Available online: https://podarilove.ru/en/informaciya-o-boevyh-robotah-amerikanskie-nazemnye-boevye/ (accessed on 18 September 2022).
  38. Available online: https://en.topwar.ru/83913-den-innovaciy-yuvo-robototehnicheskiy-kompleks-platforma-m.html (accessed on 18 September 2022).
  39. Laska 2.0. Available online: https://www.army-technology.com/projects/laska-2-0-unmanned-robotic-platform/ (accessed on 1 September 2023).
  40. AvantGuard MK1. Available online: https://army-guide.com/eng/product4691.html (accessed on 16 September 2022).
  41. Dudek, M.; Raźniak, A.; Rosół, M.; Siwek, T.; Dudek, P. Design, development, and performance of a 10 kW polymer exchange membrane fuel cell stack as part of a hybrid power source designed to supply a motor glide. Energies 2020, 13, 4393. [Google Scholar] [CrossRef]
  42. Dudek, M.; Lis, B.; Raźniak, A.; Krauz, M.; Kawalec, M. Selected aspects of designing modular PEMFC stacks as power sources for unmanned aerial vehicles. Appl. Sci. 2021, 11, 675. [Google Scholar] [CrossRef]
  43. Ou, K.; Wang, Y.X.; Kim, Y.B. Performance Optimization for Open-cathode Fuel Cell Systems with Overheating Protection and Air Starvation Prevention. Fuel Cells 2017, 17, 299–307. [Google Scholar] [CrossRef]
  44. Zhang, C.; Liu, H.; Zeng, T.; Chen, J.; Lin, P.; Deng, P.; Liu, F.; Zheng, Y. Systematic study of short circuit activation on the performance of PEM fuel cell. Int. J. Hydrogen Energy 2021, 46, 23489–23497. [Google Scholar] [CrossRef]
  45. Broderick, J.; Hartner, J.; Tilbury, D.; Atkins, E. Modeling and simulation of an unmanned ground vehicle power system. In Unmanned Systems Technology XVI; Karlsen, R.E., Gage, D.W., Shoemaker, C.M., Gerhart, G.R., Eds.; SPIE: Bellingham, WA, USA, 2014; p. 908406. [Google Scholar]
  46. Tribioli, L.; Cozzolino, R.; Chiappini, D.; Iora, P. Energy management of a plug-in fuel cell/battery hybrid vehicle with on-board fuel processing. Appl. Energy 2016, 184, 140–154. [Google Scholar] [CrossRef]
  47. Xiao, C.; Wang, B.; Wang, C.; Yan, Y. Design of a novel fully-active PEMFC-Lithium battery hybrid power system based on two automatic ON/OFF switches for unmanned aerial vehicle applications. Energy Convers. Manag. 2023, 292, 117417–117435. [Google Scholar] [CrossRef]
  48. Verstraete, D.; Lehmkuehler, K.; Gong, A.; Harvey, J.R.; Brian, G. Characterisation of a hybrid, fuel-cell-based propulsion system for small unmanned aircraft. J. Power Sources 2014, 250, 204–211. [Google Scholar] [CrossRef]
  49. Gonzalez, E.J.; Cuesta, J.S.; Fernadez, F.J.V.; Lerena, F.I.; Carlini, M.A.; Bordons, C.; Hernandez, E.; Elfes, A. Experimental evaluation of a passive fuel cell/battery hybrid power system. Int. J. Hydrogen Energy 2019, 44, 1272–12782. [Google Scholar]
  50. Dudek, M.; Tomczyk, P.; Wygonik, P.; Korkosz, M.; Bogusz, P.; Lis, B. Hybrid Fuel Cell—Battery System as a Main Power Unit for Small Unmanned Aerial Vehicles (UAV). Int. J. Electrochem. Sci. 2013, 8, 8442–8463. [Google Scholar] [CrossRef]
  51. Fathabadi, H. Combining a proton exchange membrane fuel cell (PEMFC) stack with a Li-ion battery to supply the power needs of a hybrid electric vehicle. Renew. Energy 2019, 130, 714–724. [Google Scholar] [CrossRef]
  52. Oksuztepe, E.; Bayrak, Z.U.; Kaya, U. Effect of flight level to maximum power utilization for PEMFC/supercapacitor hybrid uav with switched reluctance motor thruster. Int. J. Hydrogen Energy 2023, 48, 11003–11016. [Google Scholar] [CrossRef]
  53. Renau, J.; Schanzes, S.; Lozzano, A.; Barroso, J.; Barreras, F. Analysis of the performance of a passive hybrid power plant to power a lightweight unmanned aerial vehicle for a high altitude mission. J. Power Sources 2017, 356, 124–132. [Google Scholar] [CrossRef]
  54. Intelligent Energy launches 2.4 kW fuel cell module for UAVs. Fuel Cells Bull. 2019, 5, 6. Available online: https://www.sciencedirect.com/science/article/abs/pii/S1464285919301890 (accessed on 29 September 2023).
  55. Gao, X.; Chen, J.; Xu, R.; Zhen, Z.; Chen, X.; Cui, L. Research progress and prospect of the materials of bipolar plates for proton exchange membrane fuel cells (PEMFCs). Int. J. Hydrogen Energy 2023, in press. [Google Scholar] [CrossRef]
  56. Liu, R.; Jia, Q.; Zhang, B.; La, Z.; Chen, L. Protective coatings for metal bipolar plates of fuel cells: A review. Int. J. Hydrogen Energy 2022, 47, 22915–22937. [Google Scholar] [CrossRef]
  57. Grumm, F.; Schumann, M.; Cosse, C.; Plenz, M.; Lücken, A.; Schulz, D. Short Circuit Characteristics of PEM Fuel Cells for Grid Integration Applications. Electronics 2020, 9, 602. [Google Scholar] [CrossRef]
  58. Trogadas, P.; Cho, J.I.S.; Kapil, N.; Rasha, L.; Corredera, A.; Brett, D.J.L.; Coppens, M. Effect of extended short-circuiting in proton exchange membrane fuel cells. Sustain. Energy Fuels 2020, 4, 5739–5746. [Google Scholar] [CrossRef]
  59. Okonkwo, C.P.; Ige, O.O.; Barhoumi, E.M.; Uzoma, P.C.; Emori, W.; Benamor, A.; Abdullah, A.M. Platinum degradation mechanisms in proton exchange membrane fuel cell (PEMFC) system: A review. Int. J. Hydrogen Energy 2021, 46, 15850–15865. [Google Scholar] [CrossRef]
  60. Tellez-Cruz, M.M.; Escorihuela, J.; Solorza-Feria, O.; Compañ, V. Proton Exchange Membrane Fuel Cells (PEMFCs): Advances and Challenges. Polymers 2021, 13, 3064. [Google Scholar] [CrossRef]
  61. Baldic, J.; Osenar, P.; Lauder, N.; Launie, P. Fuel cell systems for long duration electric UAVs and UGVs. In Defense Transformation and Net-Centric Systems 2010, Proceedings of SPIE Defense, Security, and Sensing, Orlando, FL, USA, 5–9 April 2010; SPIE: Bellingham, WA, USA, 2010; Volume 7707. [Google Scholar] [CrossRef]
  62. Zimmermann, T.; Keil, P.; Hofmann, M.; Horsche, M.F.; Pichlmaier, S.; Jossen, A. Review of system topologies for hybrid electrical energy storage systems. J. Energy Storage 2016, 8, 78–90. [Google Scholar] [CrossRef]
  63. Saravanakumar, Y.; Sultan, M.T.H.; Shahar, F.H.; Giernacki, W.; Łukaszewicz, A.; Nowakowski, M.; Holovatyy, A.; Stępień, S. Power Sources for Unmanned Aerial Vehicles: A State-of-the Art. Appl. Sci. 2023, 13, 11932. [Google Scholar] [CrossRef]
  64. Riemer, M.; Duval-Dachary, S.; Bachmann, T.M. Environmental implications of reducing the platinum group metal loading in fuel cells and electrolysers: Anion exchange membrane versus proton exchange membrane cells. Sustain. Energy Technol. Assess. 2023, 53, 103086. [Google Scholar] [CrossRef]
  65. Arora, A.; Zantye, M.S.; Hasan, F.M.M. Sustainable hydrogen manufacturing via renewable-integrated intensified process for refueling stations. Appl. Energy 2022, 311, 118667. [Google Scholar] [CrossRef]
  66. Wang, L.; Weissbach, T.; Reissner, R.; Ansar, A.; Gago, A.S.; Holdcroft, S.; Friedrich, K.A. High Performance Anion Exchange Membrane Electrolysis Using Plasma-Sprayed, Non-Precious-Metal Electrodes. ACS Appl. Energy Mater. 2019, 11, 7903–7912. [Google Scholar] [CrossRef]
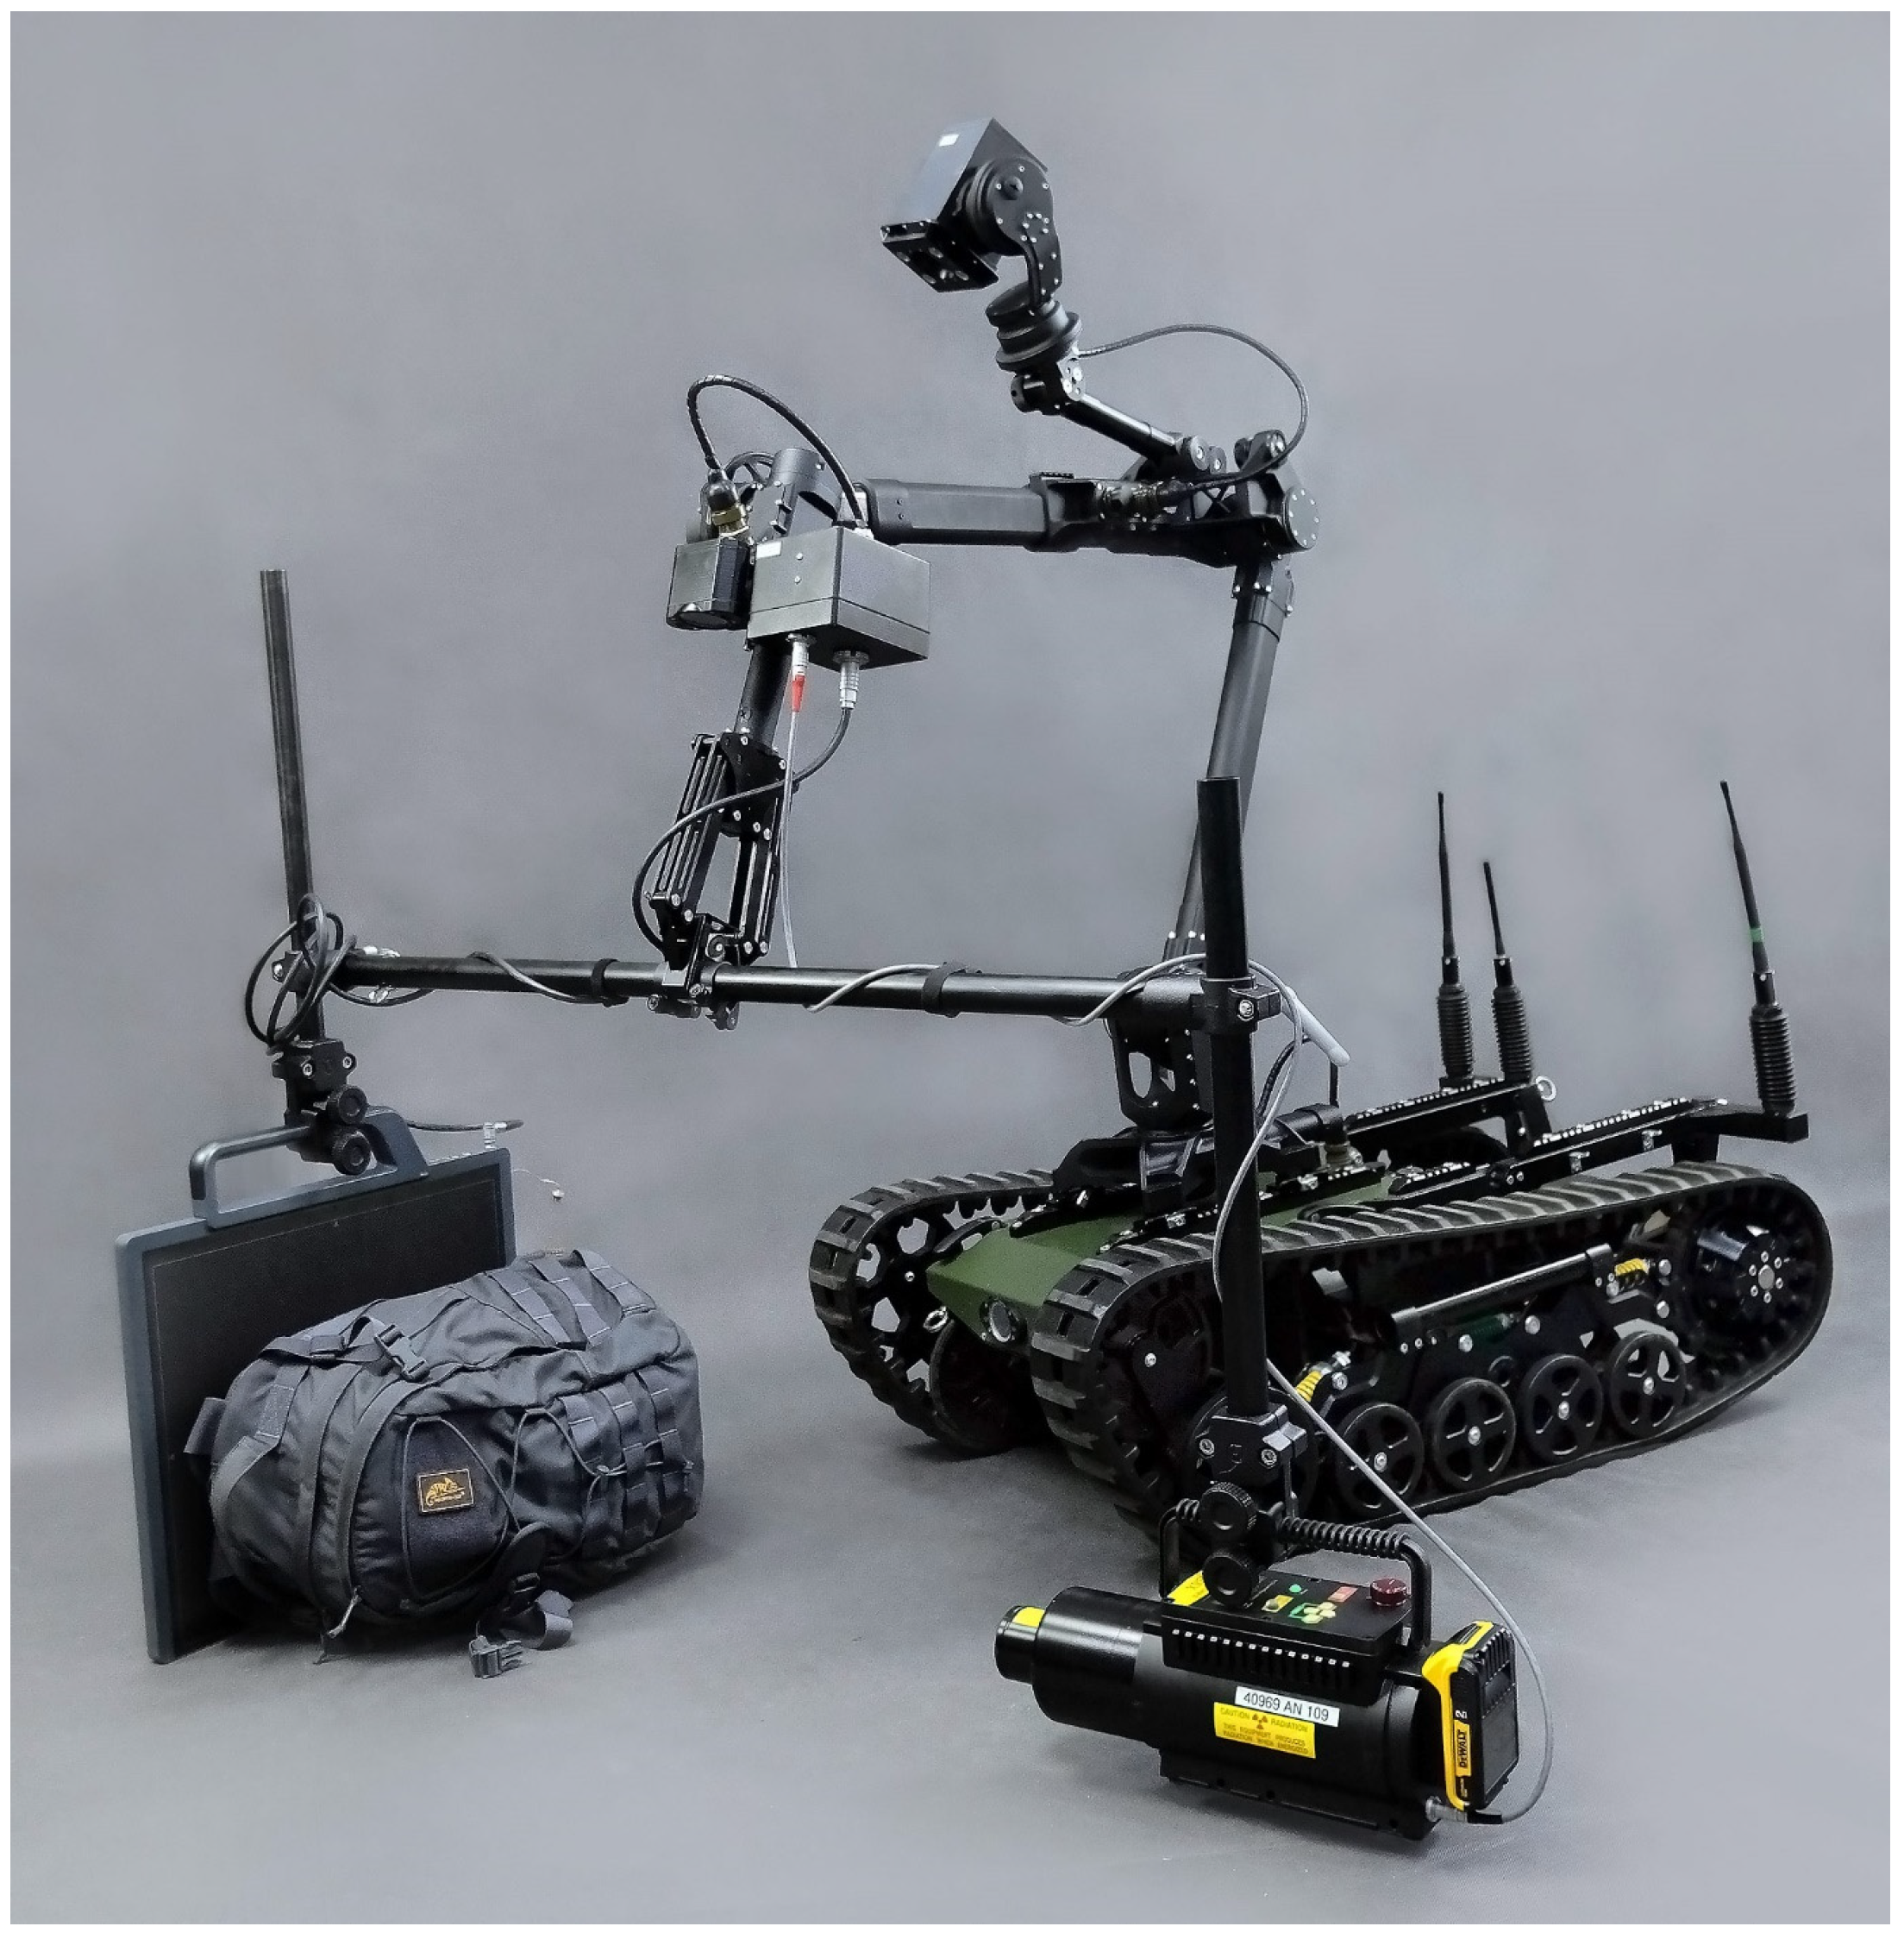
Figure 1. Photograph of PIAP Patrol with an X-ray portable scanner.
Energies 16 07531 g001
Figure 2. Determined mechanical propulsion power Ns vs. mb—mass of the vehicle base. A—Research platform used in this study; B—R8 INTEGRATOR 25 kW [35]; C—R8 INTEGRATOR 20 kW [36]; D—Protector(“Defender”) [37]; E—Platform-M [38]; F—Laska 2.0 [39]; G—AvantGuard MK1 [40].
Energies 16 07531 g002
Figure 3. The research UGV with measuring equipment (a) and some selected sections for the experiment—Fort Fortress Warsaw V ‘Włochy’ (b).
Energies 16 07531 g003
Figure 4. Experimental setup for the investigations of PEMFC stack performance under variable electrical load.
Energies 16 07531 g004
Figure 5. Diagram of the PEMFC stack system with an SCU powering the electrical energy receiver (LOAD) in the configuration. Two parallel supercapacitors with a capacitance of 2 × C (in the diagram: A—ammeter for measuring the current, C—supercapacitor, D—diode, V—voltmeter to measure voltage).
Energies 16 07531 g005
Figure 6. Schematic diagram of the integration of the energy-recovery SCU system using supercapacitor banks with the stack of PEMFCs.
Energies 16 07531 g006
Figure 7. Laboratory installation of green hydrogen production using a 6.5 kW PV installation integrated with a battery energy-storage unit and the anion exchange membrane electrolyser (AEM) with hydrogen capacity production j = 0.5 m3 H2/h (Enapter, Germany).
Energies 16 07531 g007
Figure 8. (a). The variation of electrical power (P) vs. time (t) while driving on rocky ground. (b). The variation of electrical power (P) vs. time (t) while riding on a small grassy hill.
Energies 16 07531 g008
Figure 9. The variation of electrical power (P) vs. time (t) when riding up a grass hill with a 30-degree slope.
Energies 16 07531 g009
Figure 10. The electrical waveform of current (I) and voltage (U) vs. time (t) recorded when riding up a grass hill with a 30-degree slope.
Energies 16 07531 g010
Figure 11. The electrical power demand (PRMS) under the movement of the robot on different types of ground.
Energies 16 07531 g011
Figure 12. Variation of electrical power demand vs. velocity depends on the position of the drive wheel in relation to the direction of travel (positive values indicate forward driving with the driving wheel at the rear, while negative values indicate driving backwards).
Energies 16 07531 g012
Figure 13. Dependencies of the voltage–current (U–I) and electrical power–current (P–I) recorded for 2–5 kW PEMFC stacks. (I—applied current load from DC electronic load).
Energies 16 07531 g013
Figure 14. (a) Electrical power of fuel cells (PFC) and the electrical power needed to supply the air-cooling system (PFAN) vs. temperature (T) recorded during the operation of the 2 kW PEMFC stack. (b). Percentage of the power Pin required for auxiliary devices in relation to total electrical power (P) produced by the 3 kW PEMFC stack.
Energies 16 07531 g014
Figure 15. Waveforms of current (I), voltage (U), and power (P) recorded for the PEMFC stack over time.
Energies 16 07531 g015
Figure 16. Variation of hydrogen flux j (jH2) vs. time (t) during the electrical operation of the PEMFC stack according to conditions.
Energies 16 07531 g016
Figure 17. Electrical waveforms of voltage (U), current (I), and electrical power (P) during operation of the PEMFC stack under a constant load of 75 A.
Energies 16 07531 g017
Figure 18. Variation of voltage (U) vs. time (t) recorded under a humidification process realised by the SCU. The 2 kW PEMFC stack operates under an electrical load (I) of 50 A.
Energies 16 07531 g018
Figure 19. Hydrogen usage for electrical energy production, hydrogen purge, and SCU performance.
Energies 16 07531 g019
Figure 20. Electrical efficiency (η) and hydrogen utility (VH2) vs. electrical power (P) produced by the PEMFC stack.
Energies 16 07531 g020
Figure 21. The variation of changes in the voltage (U) measured by the voltmeter and the current intensity (I) measured by the ammeter at the input to the electricity receiver powered by a PEMFC stack with an operating SCU in the configuration.
Energies 16 07531 g021
Figure 22. Dependence of variation in the voltage (U) and the current at the input to the electricity receiver powered by the PEMFC stack with an operating SCU in configuration with two parallel supercapacitors with a total capacitance (C) of 2 × 4.15 = 8.3 F.
Energies 16 07531 g022
Figure 23. Dependence of voltage (U) vs. time (t) recorded for a PEMFC stack integrated with a battery of supercapacitors was recorded during the SCU system operation.
Energies 16 07531 g023
Figure 24. Variation of current (I) or electrical power (P) recovered from the supercapacitor bank during the SCU system operation.
Energies 16 07531 g024
Figure 25. Dependence of variation in the current (I) and voltage (U) for the electrical load power-supply system from the PEMFC stack and the BAT battery pack, which is recharged with a DC–DC converter.
Energies 16 07531 g025
Figure 26. Electrical load profile of a 2 kW PEMFC stack while driving on an asphalt road. (SW OFF—SWITCH OFF).
Energies 16 07531 g026
Figure 27. Estimated monthly energy yields (Epv) from a PV installation consisting of 14 Longi Solar LR4-72 HPH 450 PV panels for a location in Krakow.
Energies 16 07531 g027
Figure 28. The variation of solar radiation (Ea), hydrogen volume production (VH2), or electrical power (P) distributed in the system (P) vs. time (t).
Energies 16 07531 g028
Table 1. Basic technical data of the PIAP Patrol [32,33].
Dimensions in stowed position:98 × 57 × 65 cm (length × width × height)
Weight (without accessories) of the robot with manipulator and battery95 kg
Maximum speed8 km/h
Operating time (mission dependent, possibility of quick battery replacement)5 h
Maximum lift capacityFully extended at the front: 7 kg
Close to the front: 22 kg
Maximum reach (horizontal)—from the vertical rotation axis1940 mm
Maximum reach (vertical)—from the lower edge of the tracks2170 mm
Table 2. The data according to variable average electrical power Pavr recorded for different slopes of grassy ground.
NumberSlope of GroundPavr [W]
1620
210°1100
330°1700
Table 3. Hydrogen processing parameters and the electrical energy required to supply an AEM electrolyser or two-stage hydrogen compressor (Maximator Booster DLE 15-2 -GG-H2 (1 stage) plus Booster DLE 30-2-GG-H2 (2 stage)).
Total water capacity of hydrogen tank
[Ndm3]
413.619.2
VH2 compressed hydrogen [m3]1.143.95.5
mH2 compressed [kg]0.090.320.45
Time of hydrogen production by AEM electrolyser
j = 0.5 m3/h
2.37.811
Energy needs for supplying electrolyser [kWh]5.518.726.4
Energy needs for hydrogen compressing [kWh]0.260.841.29
Time of operation 2 kW PEMFC stack [h] 0.72.4 3.4
Disclaimer/Publisher’s Note: The statements, opinions and data contained in all publications are solely those of the individual author(s) and contributor(s) and not of MDPI and/or the editor(s). MDPI and/or the editor(s) disclaim responsibility for any injury to people or property resulting from any ideas, methods, instructions or products referred to in the content.