Abstract
Hydraulic fracturing is widely recognized as a potential stimulation technology for the development of challenging natural gas hydrate. However, the fracturing behavior of non-diagenetic hydrate reservoirs has peculiar characteristics that are different from those of conventional oil and gas reservoirs. Herein, a fully coupled fluid-mechanical model for simulating hydraulic fracturing in hydrate-bearing sediments (HBS) was established based on the discrete element method, and the influence of hydrate saturation, in situ stress, and injection rate on the meso-fracture evolution was investigated. The results indicate that with the increase in hydrate saturation, the fracture morphology transitions from bi-wing to multi-branch, thereby enhancing fracture complexity. Both tensile and shear failure modes exist, and the tensile failure between the weakly cemented sediment particles is dominant. The tensile strength of HBS is an exponential function of hydrate saturation, with the breakdown pressure being governed by hydrate saturation and in situ stress, with the form being consistent with the classical Kirsch equation. Additionally, lower in situ stress and higher injection rates are conducive to the generation of microcracks, whereas an excessive injection rate reduces the fracture length. These findings contribute to understanding the meso-evolution mechanism of hydraulic fractures and guide the design of on-site hydraulic fracturing plans of natural gas hydrate reservoirs.
1. Introduction
Natural gas hydrate (NGH) is a crystalline compound consisting of natural gas molecules (mainly methane) and water molecules [1]. Global NGH deposits are estimated to contain 1.8–2.1 × 10¹⁶ stm3 of natural gas, at least twice the carbon content of all proven conventional fossil fuels [2]. Given this, NGH is considered to be an important part of the global carbon cycle and ideal alternative energy in the 21st century [3,4].
NGH accumulation in marine sediments is controlled by many factors, such as geological, formation temperature, and capillary pressure [5,6,7]. In most cases, the fracture system provides a channel for gas to migrate to the occurrence zone and is the key factor affecting NGH accumulation [8]. However, when the steady state of hydrates is disrupted, the pore overpressure generated by their dissociation can lead to uncontrolled hydraulic fracturing, which may harm marine ecosystems [9]. For example, gas hydrate destabilization may generate soft-sediment deformation and seafloor collapses or trigger large-scale continental slope instability [10]. Moreover, the released methane leaks into the ocean through the fracture systems, affecting the atmospheric methane budget and exacerbating the greenhouse effect [11,12,13,14,15], and also seep-carbonate masses associated with sedimentary instability in the host sediments are reported as evidence for the occurrence of paleo-gas hydrates [16]. Therefore, studying the fracturing behavior of hydrate-bearing sediments (HBS) is quite important to understand the NGH occurrence mechanism and its roles in the global carbon cycle.
From the perspective of resources, approximately 97% of hydrates occur in clayey–silty sediments, making gas recovery challenging because the pressure transmission, fluid injection, thermal diffusion, hydrate dissociation, and fluid seepage are inhibited by the low reservoir permeability [17,18,19]. Given this, hydraulic fracturing (HF) has been proposed for enhancing the productivity of NGH reservoirs [20,21,22,23,24,25]. Moreover, the stimulation effects of HF on hydrate reservoirs have been confirmed through recent simulations [20,21,22,23]. Our latest studies discovered that HF combined with multi-well inject–production systems increase the gas production by 1–2 orders of magnitude [25]. Consequently, studying the fracturing behaviors of HBS is of great importance for the commercial development of hydrates.
At present, a handful of researchers have studied the fracturing behavior of HBS on a lab scale. Konno et al. (2016) conducted fracturing tests in synthesized HBS using a triaxial pressure autoclave and observed fractures perpendicular to the minimum principal stress plane [26]. Too et al. (2018) carried out HF in a penny-shaped crack on synthesized hydrate-bearing sand and discovered vertical fractures [27]. Yamada et al. (2018) used porous media composed of glass beads, NaHCO3, C2H5OH, and ice to simulate HBS and then implemented HF by injecting C2H5OH aqueous solution [28]. Their results indicate that the high permeable seepage channels formed are conducive to the fluid flow. Liu et al. (2020) evaluated the fracability of HBS based on the analytic hierarchy process-entropy method [29]. Their findings suggest that HBS with high hydrate saturation and great stress anisotropy have fracability. Ma et al. (2022) proved the fracability of clayey silt hydrates even with a low hydrate saturation of 25% [30]. Nie et al. (2022) analyzed the fracability of clayey–silty HBS based on the multi-layer perceptron and analytic hierarchy process [31]. The above studies confirm that various fractures can be formed in HBS. However, hydrate distribution in synthesized HBS is difficult to control, and the experimental conditions are too harsh for conducting HF tests. Additionally, capturing the fracture evolution is difficult owing to the inside of the sample being undetectable. Accordingly, the use of numerical simulation to study the fracturing behavior of HBS is another effective means.
There are four main numerical simulation methods for hydraulic fracturing.
- Finite-element method (FEM): Numerous researchers have used the FEM to simulate HF in various oil and gas reservoirs, among which the cohesive zone method (CZM) based on the viscoelastic–plastic damage constitutive criterion is widely used [32,33,34,35,36]. However, the mesh needs to be constantly reconstructed to simulate the fracture growth, which greatly increases the number of calculations. Additionally, fracture propagation is disturbed by grid boundaries, thus affecting the reliability of the results.
- Extended finite-element method (XFEM): XFEM is a variation of FEM in which discontinuous enrichment functions are introduced to describe the discontinuity of fractures, thereby solving the calculation burden caused by mesh reconstruction [37]. Although the method is effective, the XFEM introduces additional difficulties such as the need for special integration techniques to resolve the stiffness matrix, blending of enriched and non-enriched elements, and ill-conditioned stiffness matrices [38]. In addition, the most suitable enrichment functions for a particular type of stress concentration are usually not known in advance. This poses new challenges when applying the XFEM to arbitrary types of singularities [39,40].
- Boundary element method (BEM): Unlike the FEM, which divides elements in the continuum domain, the BEM only meshes elements on the domain boundary [41]. The displacement discontinuity method (DDM), an indirect DEM, is widely used to simulate HF [42]. However, the BEM is not good at solving nonlinear problems and cannot accurately describe the stress and displacement fields at the fracture tip [43]. For example, it is difficult to simulate fracture propagation in heterogeneous materials and handle the coupling of fluid–solid between the rock matrix and fractures [32].
- Discrete element method (DEM): The DEM was proposed by Cundall and Strack (1979) for simulating the interaction between granular materials [44]. Unlike methods based on continuum mechanics, the DEM idealizes the material as separate particles bonded together at their contacts, and the microcracks generated by the breakage of the bonds. Since there are no precise meshing and numerous continuum assumptions, the DEM has a unique model heterogeneity and thus can simulate the HF process of discrete materials. However, limited by the number of particles and computational resources, the DEM is primarily used for small-scale simulations and is good at revealing the meso-mechanical behavior of discrete materials, whereas methods such as the unconventional fracture model [45], the simplified 3D DDM [46], and the FEM-based method [47] are capable of mine-scale simulations.
Several HF simulations have been conducted based on the DEM. Shimizu et al. (2011) studied the fracturing behavior of hard rock and obtained AE data similar to those obtained via experiments [48]. Wang et al. (2014) found that the simulated fracture length and breakdown pressure of a coal seam were consistent with the field results [49]. Zhou et al. (2017) confirmed that the DEM was reliable for understanding the interaction between fractures in a laminated rock [50]. The above studies proved the applicability of the DEM in various fracturing conditions, considering that HBS is a discontinuous complex medium composed of loose sediment particles and cemented hydrate particles and thus specifically suitable for simulation with the DEM. Additionally, the DEM can reconstruct samples at the material level, allowing good control of hydrate distribution and clear capture of the evolution of fractures.
This study intended to investigate the meso-mechanical behavior of HBS during hydraulic fracturing, which, to the best of our knowledge, is still not well understood. To this end, a hydraulic fracturing model of HBS was established based on a fully coupled fluid-mechanical algorithm in the DEM, and the meso-parameters of the DEM model were calibrated by the drained shearing experiments of HBS in the Nankai Trough. Subsequently, the effects of hydrate saturation, in situ stress, and injection rate on fracturing behaviors, such as the initiation pressure, evolution of microcracks, bond failure mode, and fracturing effect, were thoroughly analyzed. The findings of this study reveal the meso-evolution mechanism of fractures, contributing to the understanding of the peculiar fracturing behavior of this heterogeneous complex geologic material and the implementation of hydraulic fracturing in hydrate reservoirs.
2. Methodology
2.1. HBS Simulation Methodology
A DEM code, that is, the particle flow code (PFC), was employed. In the PFC, materials are modeled as an aggregate of small rigid circular particles that interact through normal, shear, and rotary springs at contacts; therefore, the constitutive behavior of various materials can be modeled by assigning linear-based and/or bonded-contact models [44]. In addition, with the load changes, the force and position of particles are updated by the force-displacement law using a time-stepping algorithm.
The details of the DEM algorithm can be found in Ref. [51]. Only the simulation methodology of HBS is presented here. HBS can be regarded as a composite medium composed of sediment particles and hydrate particles (Figure 1a). Thus, there are three contact types in HBS, namely sediment–sediment (s_s), sediment–hydrate (s_h), and hydrate–hydrate (h_h). In s_s, the bond force is as weak as the capillary tension of meniscus water [52]; thus, the flat-joint model is adopted (Figure 1b) in which the circular particles are constructed into polygonal particles and a flat-joint contact simulates the behavior of an interface between two notional surfaces. In s_h and h_h, the bonds are stronger due to the cemented nature of hydrates [53]. Consequently, the parallel-bond model is used to characterize the mechanical behavior of hydrates (Figure 1c) [54,55]. Once the bonds fail, they degenerate into the rolling resistance model, in which a rolling resistance coefficient is used to characterize the shape effect of particles (Figure 1d).
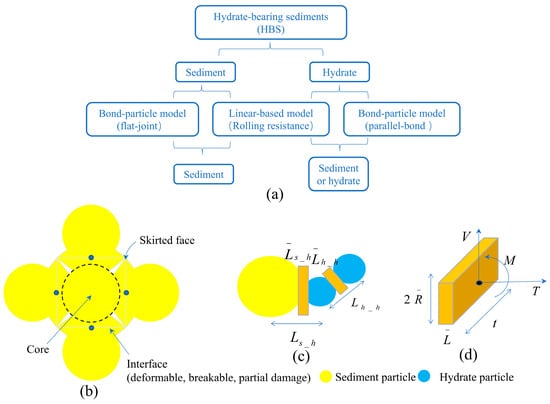
Figure 1.
(a) Contact models in HBS. (b) Flat-joint model. (c) Parallel-bond model. (d) Forces carried in a parallel bond.
2.2. Fluid–Mechanical Coupling Algorithm
The coupling between fluid and mechanical fields is described using Cundall’s fluid flow algorithm [56,57,58]. In Cundall’s fluid flow algorithm, a closed chain formed by particles in contact with each other is defined as a “reservoir” for storing pore fluid, and each contact is assumed to be a “pipe” for exchanging fluid from adjacent reservoirs, resulting in the formation of a flow network, as shown in Figure 2a.
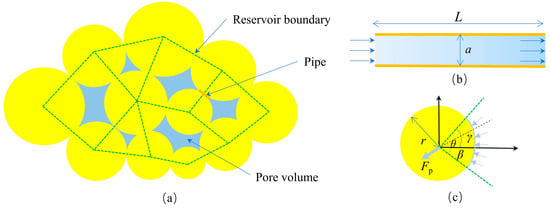
Figure 2.
(a) Flow network. (b) Poiseuille channel flow in pipes. (c) Applied force on particles induced by fluid pressure.
The flow in pipes is assumed to be Poiseuille channel flow (Figure 2b), and the flow between reservoirs can be described by the Hagen–Poiseuille equation:
where is the flow rate (m3/s), is the fluid viscosity (mPa·s), is the pressure difference (MPa), is the pipe length (m), and is the pipe aperture (m).
is the harmonic mean of the two-particle radii and and can be described as
When is the compressive stress, is calculated by
where is the initial aperture (m), and is the normal contact force (N).
When is the tensile stress or the bond at the contact fails, then is described as
where is the distance between particles (m).
The value of determines the permeability of the medium [59] and is written as
The permeability of HBS is governed by hydrate saturation and described by the Tokyo mode [60]:
where is the permeability of the hydrate-free sediment (m2), and is the exponential parameter and its value is 2.5 in this study [61].
Based on Equations (5) and (6), the value of is calculated by
During the time , the variation in the fluid pressure is
where is the bulk modulus of the fluid (Pa), is the volume of the reservoir (m3), is the change in the reservoir volume (m3), and is the number of pipes.
Simultaneously, the fluid pressure acts on the surface of the surrounding particles (Figure 2c). The applied force acting on the particle center is given by
When the bond fails, it is assumed that the flow instantaneously occurs, and the pore pressure in the new reservoir is their average value described as
where and are the pore pressure of reservoir “i” and “j”, respectively (MPa).
The fully coupled fluid–mechanical models are shown in Figure 3. The simulation of the mechanics of particles is presented on the left side, where the movement of particles and the contact force between particles are updated by the motion equation and force-displacement law; the simulation of fluid flow is presented on the right side, where Cundall’s fluid flow algorithm is employed; and in the middle is the fluid–mechanical coupling process, where the variation in contact force between particles causes the change in pipe aperture, and the variation in reservoir pressure updates its force on the surrounding particles. After the fluid calculation step, a kind of additional force is exerted on the particles calculated by fluid pressure in the reservoir. Consequently, the above two interactive processes realized the full coupling of the mechanical and fluid fields.
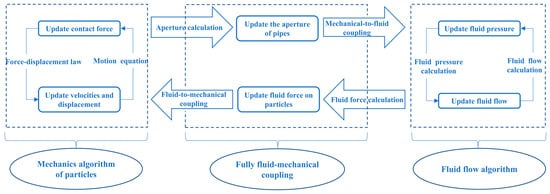
Figure 3.
Fully coupled fluid and mechanical model.
2.3. Microcrack Growth and Failure Criteria
When the contact force is greater than the bond strength, a microcrack is generated. The crack length is assumed to be the same as the length of the pipe , and its direction is perpendicular to the line connecting the centers of the two particles [48,49,50]. Notably, this assumption is mainly used for crack visualization and not for representing the actual crack lengths.
The tensile stress and shear stress acting on the bond can be calculated by
where is the axial force (N), is the shear force (N), is the moment (N·m), is the moment of inertia (kg·m2), is the cross-sectional area (m2), and is the bond radius (m).
For the flat-joint model, as the joint is regarded as a plane that cannot bear moments, the calculation of its tensile stress excluded the moment term in Equation (11).
Figure 4 shows the bond failure modes and the failure envelope. When the tensile stress or shear stress exceeds the tensile strength or shear strength , a corresponding tensile or shear microcrack occurs. The shear strength is determined by the normal stress , cohesion , and friction angle and described as
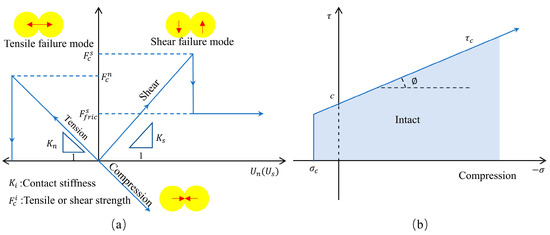
Figure 4.
(a) Failure modes of bonds. (b) Failure envelope.
3. Modeling
3.1. HF Model
Figure 5 shows the HF model of HBS. The radius of sediment particles is 0.1–0.2 mm, and the median size is 0.113 mm, which is consistent with that of sediments in the Nankai Trough [61]. Referring to the method used in previous studies, smaller particles (0.04 mm radius) are generated to represent hydrates [15,54,55]. In this manner, HBS with a certain hydrate saturation can be generated by controlling the number of hydrate particles. The densities of sediments and hydrates are the same as those in the Nankai Trough, at 2650 and 320 kg/m3, respectively [61]. Limited by computing resources, the model size is set to 10 mm × 10 mm. A circular hole with a radius of 0.3 mm is reserved in the center of the model for fluid injection. Additionally, the surrounding smooth servo walls are used for simulating the in situ stress through the servo mechanism [51].
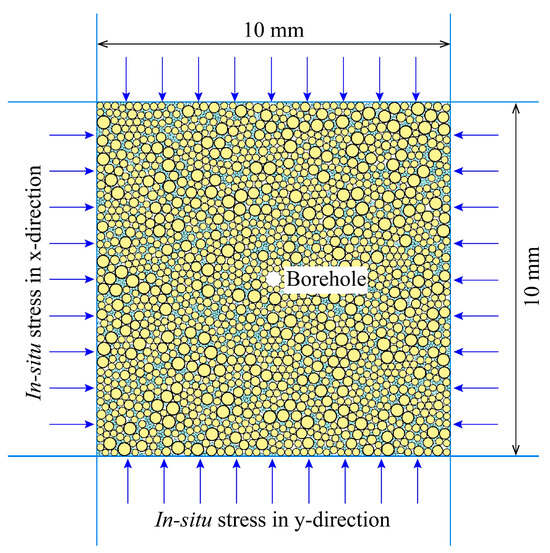
Figure 5.
HF model of hydrate-bearing sediments.
3.2. Calibration of Model Parameters
Proper calibration of meso-parameters is crucial for DEM simulation. Here, drained shearing tests are mostly used to calibrate meso-parameters, and the calibration principle is that the mechanical response of HBS generated by the DEM is qualitatively consistent with the indoor test results. Based on the drained shearing test results of HBS in the Nankai Trough [62], the “trial–error” method was adopted to calibrate the meso-parameters. Through repeated attempts, the values of the meso-parameters were obtained (Table 1). The drained shear model of HBS is shown in Figure 6. It can be seen that the simulated deviatoric stress–axial strain is in good agreement with the indoor test results, proving the reliability of the values of the meso-parameters in Table 1.

Table 1.
Values of meso-parameters.
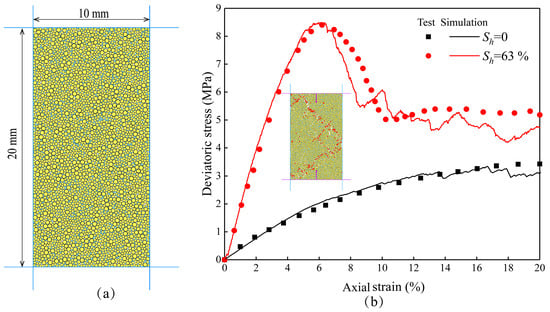
Figure 6.
(a) Drained shearing model of HBS. (b) Deviatoric stress–axial strain curves obtained by simulation and indoor tests.
Additionally, the Brazilian splitting test was simulated to obtain the tensile strength of HBS, as shown in Figure 7. When the hydrate saturation is 0%, 20%, 40%, and 60%, the simulated tensile strength of HBS is 0.59, 0.80, 1.17, and 1.71 MPa respectively, indicating that the tensile strength increases as hydrate saturation increases.
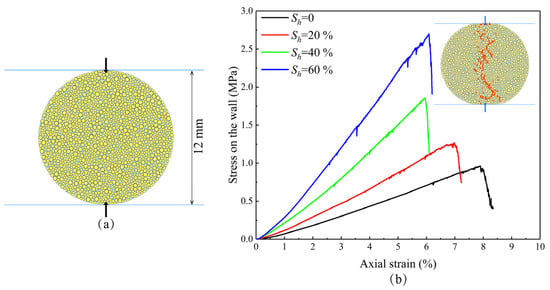
Figure 7.
(a) Brazilian splitting model. (b) Stress–strain curves.
Figure 8 depicts the obtained in our simulation and previous indoor tests. It can be seen that the tensile strength obtained from previous indoor tests is highly variable. This is due to the strong non-homogeneity of HBS, especially since sediment components, grain size, and hydrate distribution pattern all have significant influence on the mechanic properties of HBS. Nevertheless, a general trend of increasing tensile strength with increasing hydrate saturation can be observed as the existence of hydrates improves the consolidation of HBS. The simulated values are within the range of the test results of 0.28−12.5 MPa [26,27,63,64,65,66,67], which further supports the reliability of the DEM model. Additionally, the simulated tensile strength also increases as hydrate saturation increases and is found to be an exponential function of hydrate saturation with a fitting coefficient R2 of 0.9981. This indicates that the DEM model well simulated the bonding characteristics of hydrate particles.
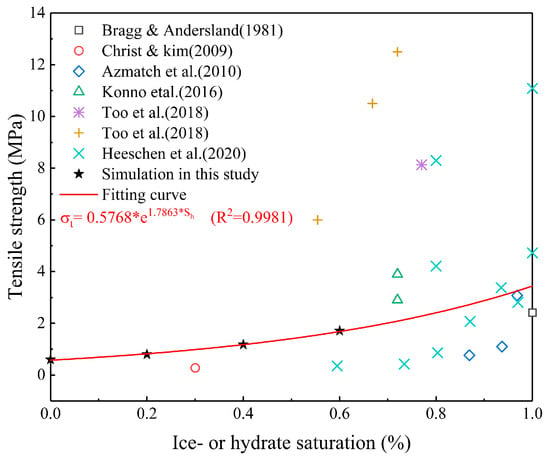
Figure 8.
Tensile strength was obtained in this study and previous indoor tests [26,27,63,64,65,66,67].
4. Results and Discussion
4.1. Effects of Hydrate Saturation
The fracturing process was simulated for HBS with hydrate saturations of 0, 25%, 35%, 45%, 55%, and 65%, respectively. Notably, the injection rate was 5 × 10⁻⁷ m3/s, and the in situ stresses in the X and Y directions were 1 and 2.5 MPa, respectively.
4.1.1. Injection Pressure
In our simulation, the number of microcracks developed within 5 × 10⁻⁴ s was recorded as acoustic emission (AE) events. The injection pressure and AE events at different hydrate saturations are shown in Figure 9. As can be seen, injection pressure increases with the injection of fracturing fluid, and a sudden drop occurs at the AE event. Furthermore, the fluctuations in injection pressure are synchronous with the occurrence of AE events. The maximum injection pressure is regarded as the breakdown pressure , which represents the overall strength of the HBS. It can be seen that the breakdown pressure increases as hydrate saturation increases, which is 4.25 ( = 0%), 5.74 (= 25%), 7.92 ( = 35%), 8.82 ( = 45%), 9.46 ( = 55%), and 12.06 MPa ( = 65%). The mechanism of this phenomenon is twofold: first, the presence of hydrates reduces the effective permeability of the HBS, which increases the resistance to fluid flow and reduces the rate of fluid leaching; second, the bonding behavior of hydrates improves the consolidation strength of the HBS, and greater fluid energy is required for fracture initiation and propagation.
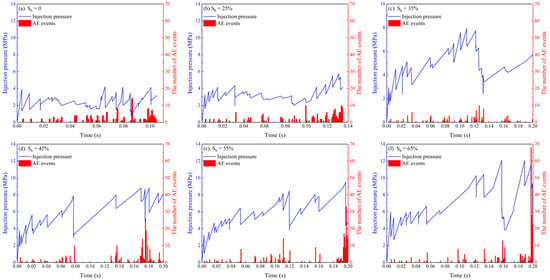
Figure 9.
Variation in injection pressure and AE events under different hydrate saturations. (a) = 0%; (b) = 25%; (c) =35%; (d) = 45%; (e) = 55%; (f) = 65%.
The relationship between breakdown pressure and hydrate saturation is fitted in Figure 10. It can be seen that is an exponential function of , and the fitting coefficient R2 reached 0.9711, proving the reliability of the equation.
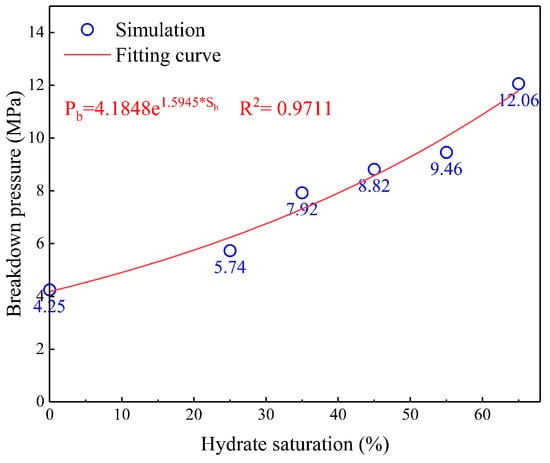
Figure 10.
Relationship between breakdown pressure and hydrate saturation.
4.1.2. Contact-Force Chains and Applied Force Induced by Fluid
The contact force between the particles and the applied force induced by the fluid was recorded, as shown in Figure 11. As can be seen, contact-force chains were mainly distributed along the vertical direction to bear the maximum in situ stress. However, in the near frac zone, contact-force chains were distorted as the particles were compressed by the fluid pressure. With the increase in hydrate saturation, the particles on the frac zone were subjected to greater fluid pressure, resulting in more severe distortion of contact-force chains. In the frac zone, particles separated under the fluid pressure, owing to the lack of contact force there. Additionally, as hydrate saturation increases, the strength of the HBS gradually increases and the permeability gradually decreases, which leads to a gradual reduction in the region of fluid action. Consequently, the presence of hydrates affects the interaction behavior between particles and fluid, including a slower fluid penetration rate, and increasing the applied force on particles induced by fluid pressure.
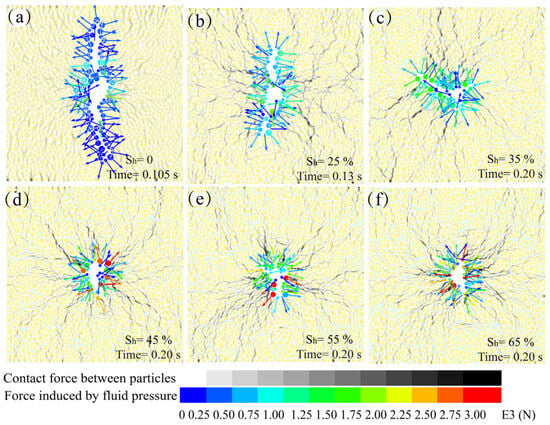
Figure 11.
Contact force between particles and the applied force on particles induced by fluid. (a) = 0%; (b) = 25%; (c) = 35%; (d) = 45%; (e) = 55%; (f) = 65%.
4.1.3. Evolution of Microcracks
The microcrack distribution at different times was recorded, as shown in Figure 12. When hydrate saturation was lower than 25% (Figure 12a,b), a macro fracture along the direction of maximum in situ stress was formed. Different from the bi-wing fractures in Figure 12a,b, multi-branch fractures at hydrate saturations of 45%–65% (Figure 12c–f) were generated. This indicates that with an increasing hydrate saturation, the strong cemented zone of hydrates forced hydraulic fractures to divert to weakly cemented sediments, causing the formation of multi-branch fractures. However, the CZM-based simulations in Refs. [35,36] all obtained regular flat fractures because of the assumption that HBS were homogeneous and isotropic. In contrast, the heterogeneity of HBS caused by the uneven distribution of hydrates was well simulated in the DEM model, which makes our simulation results more consistent with the existing experimental results [27,28,29,30,31].
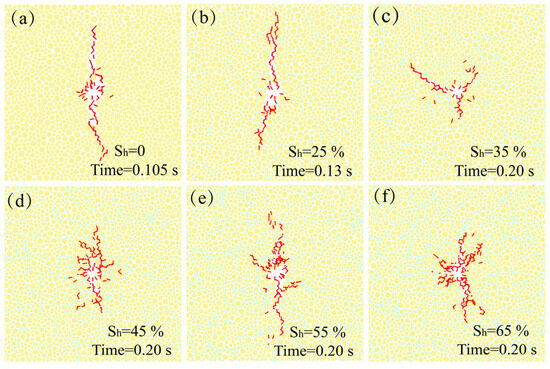
Figure 12.
Microcrack distribution under various hydrate saturations (red: microcracks). (a) = 0%; (b) = 25%; (c) = 35%; (d) = 45%; (e) = 55%; (f) = 65%.
To reveal the fracture evolution mechanism, the microcracks with different failure modes generated at different contacts were recorded, as shown in Figure 13. As can be seen, both tensile and shear microcracks exist at s_s for the hydrate-free sediment (Figure 13a), with more tensile microcracks. When the hydrate saturation is 25% (Figure 13b), a few tensile microcracks occur at s_h. When the hydrate saturation increases to 35% (Figure 13c–f), there is further emergence of a few tensile microcracks at h_h, whereas shear microcracks are difficult to occur at s_h and h_h. Overall, tensile and shear microcracks at s_s play a dominant role, followed by the tensile microcracks at s_h.
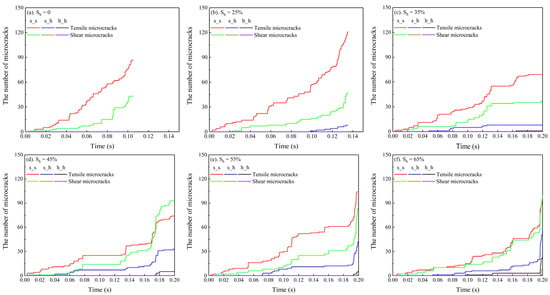
Figure 13.
Variation in microcracks with different failure modes under different hydrate saturations. (a) = 0%; (b) = 25%; (c) = 35%; (d) = 45%; (e) = 55%; (f) = 65%.
4.2. Effects of the In Situ Stress
The fracturing process was simulated for HBS with X-direction stress of 1, 2.5, and 5 MPa, respectively. Notably, the hydrate saturation was 55%, the injection rate was 5 × 10⁻⁷ m3/s, and the in situ stress in the Y-direction was 2.5 MPa.
4.2.1. Injection Pressure
The injection pressure under different in situ stress conditions is shown in Figure 14. As can be seen, when the in situ stresses in the X-direction were 1, 2.5, and 5 MPa, the breakdown pressures were 8.82, 11.02, and 11.82 MPa, respectively, indicating that the breakdown pressure increases as the in situ stress increases. This is because great contact force needs to be overcome for the generation of microcracks under high in situ stress.
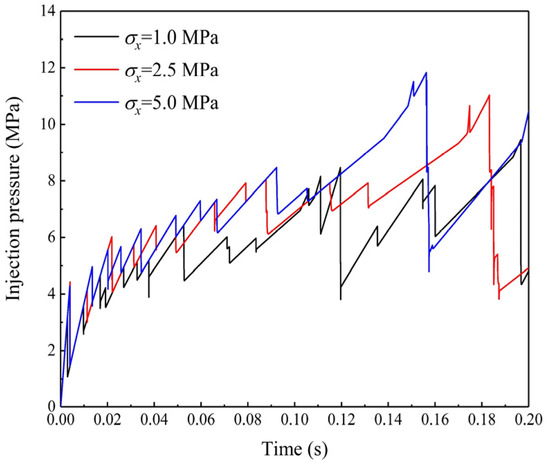
Figure 14.
Variation in injection pressure under different in situ stresses.
In addition, according to the Kirsch equation of stress distribution around the elastic circular hole [68,69,70], the breakdown pressure is described as
where and are the principal stresses in the two directions (MPa), and .
Here, the relationship between and , , and are fitted as
The regression coefficient of Equation (15) is 0.9981, indicating its reliability. Furthermore, this also reveals that the initiation mode belongs to the tensile failure mode, which is consistent with the experimental results of Ref. [31].
By comparing Equations (14) and (15), we discovered that their forms were consistent, but the coefficients were different. As the Kirsch equation is derived on the assumption that the formation is elastic, isotropic, and homogeneous, a certain degree of correction is required in the actual application. Additionally, Equation (14) is developed under a relatively ideal condition. Especially, the phase transition may occur for the hydrate in the change in environmental conditions, which may further influence the fluid flow and fracture propagation [71]. Consequently, further applications should take full account of the peculiar physico-mechanical properties of HBS.
Combined with the fitted equation in Figure 10 and Equation (15), the breakdown pressure can be described as the function of hydrate saturation and in situ stress:
4.2.2. Distribution and Number of Microcracks
The microcrack distribution as well as the number of microcracks under different in situ stresses are shown in Figure 15 and Figure 16, respectively. As can be seen, when the X-direction in situ stress increases from 1 to 5 MPa, the microcrack growth direction gradually shifts from X-axil to Y-axil. This is consistent with the classic fracturing theory and the HF experiments of HBS conducted in Refs. [27,29]; that is, the magnitude of the minimum in situ stress difference controls the fracture propagation direction.
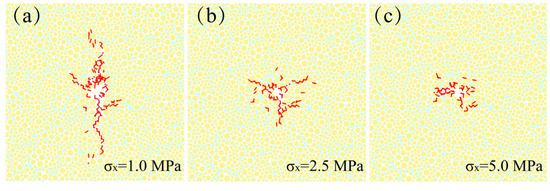
Figure 15.
Microcrack distribution under different in situ stresses. (a) = 1.0 MPa; (b) = 2.5 MPa; (c) = 5.0 MPa.
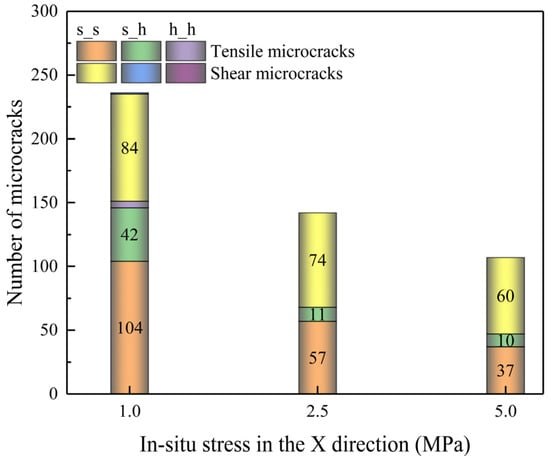
Figure 16.
Number of microcracks with different failure modes under different in situ stresses.
Additionally, the total number of microcracks decreases from 263 to 107 as the X-direction in situ stress increases from 1 to 5 MPa, indicating that the large in situ stress prevents the generation of microcracks. Thus, NGH reservoirs with shallow depth are the “sweet spots”, which is in line with the fracability evaluation results in Ref. [31].
4.3. Effects of Injection Rate
To analyze the effect of the injection rate on fracturing behavior, the fracturing process was simulated for injection rates of 1 × 10⁻⁷, 5 × 10⁻⁷, and 1 × 10⁻⁶ m3/s, respectively. Notably, the hydrate saturation was 55%, and the in situ stresses in the X- and Y-directions were 1 and 2.5 MPa, respectively.
4.3.1. Injection Pressure
The injection pressure at various injection rates is shown in Figure 17. With the increase in the injection rate, the fluctuation frequency of injection pressure increased, indicating that more microcracks were generated. Additionally, the breakdown pressures are 8.76, 9.45, and 10.86 MPa for injection rates of 1 × 10⁻⁷, 5 × 10⁻⁷, and 1 × 10⁻⁶ m3/s, respectively, indicating that the breakdown pressure increases as the injection rate increases. The HF experiments of HBS in Ref. [30] also observed this phenomenon, and the mechanism for this is the rapid accumulation and hysteresis dissipation of bottom-hole fluid energy at a high injection rate.
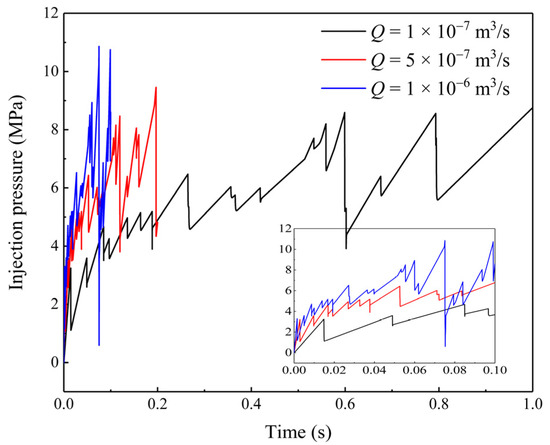
Figure 17.
Variation in injection pressure under different injection rates.
4.3.2. Distribution and Number of Microcracks
The microcrack distribution as well as the number of microcracks under different injection rates are shown in Figure 18 and Figure 19, respectively. As can be seen, when the injection rate is enhanced from 1 × 10⁻⁷ m3/s to 1 × 10⁻⁶ m3/s, the number of microcracks increases from 121 to 306, suggesting that microcrack generation is more favorable at large injection rates. However, when the injection rate is 1 × 10⁻⁶ m3/s, microcracks are mainly distributed in the near-well region, resulting in insufficient fracture penetration depth. Overall, when the displacement is 5 × 10⁻⁷ m3/s, the number of microcracks is sufficient and the fracture penetration depth is ideal. Therefore, appropriate injection rates should be selected when designing the fracturing plans for hydrate reservoirs.
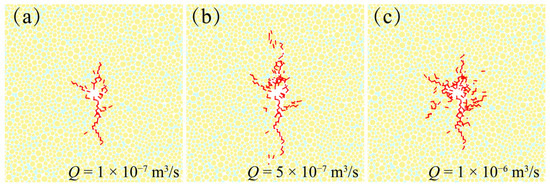
Figure 18.
Microcrack distribution under various injection rates. (a) Q = 1 × 10⁻⁷ m3/s; (b) 5 × 10⁻⁷ m3/s; (c) 1 × 10⁻⁶ m3/s.
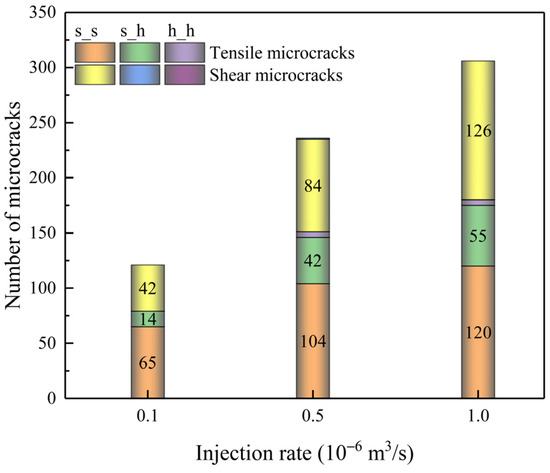
Figure 19.
Number of microcracks with different failure modes under various injection rates.
5. Conclusions
In this study, a fully coupled fluid–mechanical model was established to simulate HF in HBS, and the effects of hydrate saturation, in situ stress, and injection rate on the fracturing behavior were investigated. The following conclusions can be drawn.
- Hydrate saturation has a significant effect on fracture morphology, and complex fractures tend to form in HBS with high hydrate saturation. When the hydrate saturation is lower than 25%, bi-wing fractures are formed. With the increase in hydrate saturation, the strength of HBS significantly increased due to the bond nature of hydrates, thus increasing the injection pressure and forming multiple fractures.
- The tensile and shear stresses induced by the injected fluid jointly promote the generation of hydraulic fractures, with tensile stress being dominant. Additionally, fractures tend to propagate in the weakly cemented sediments, followed by those at the interface between hydrates and sediments. Owing to the high bond strength between hydrate particles, it is difficult for fractures to pass through them.
- Without considering the fracturing conditions, the breakdown pressure of HBS is governed by hydrate saturation and in situ stress. Given that the tensile strength of HBS is an exponential function of hydrate saturation, the fitted equation of the breakdown pressure of HBS is consistent with the classical Kirsch equation.
- Small in situ stress and high injection rates are conducive to the generation of microcracks, whereas an excessive injection rate causes over-reconstruction in the vicinity of the wellbore and reduces fracture penetration depth. Therefore, the shallow hydrate reservoir with elevated hydrate saturation is the “sweet spot” for fracturing, and an appropriate injection rate should be chosen for this non-diagenetic geomaterial.
The findings of this study reveal the mesoscale evolution of hydraulic fractures in HBS, which can help to understand the particular fracturing behaviors of HBS and be an important guide for the design of on-site fracturing schemes. Nevertheless, the simulations were conducted under specific conditions, especially since the hydrate phase transition, sediment components, and geochemistry issues were not considered. Additionally, to better guide engineering, combining the DEM and FEM for mine-scale numerical modeling is also an important potential research direction.
Author Contributions
Conceptualization, X.L.; data curation, Q.L. and H.C.; formal analysis, Y.D. and S.W.; investigation, Q.L., X.W. and J.J.; methodology, H.Z.; software, H.Z. and Y.W.; validation, Y.D.; visualization, Y.W.; writing—original draft, X.L. and H.Z. All authors have read and agreed to the published version of the manuscript.
Funding
This research received no external funding.
Data Availability Statement
All data used to support the findings of this study are included within the article.
Conflicts of Interest
The authors declare that they have no known competing financial interests or personal relationships that could have appeared to influence the work reported in this paper.
References
- Sloan, E.D., Jr.; Koh, C.A. Clathrate Hydrates of Natural Gases; Taylor & Francis Group: New York, NY, USA, 2008. [Google Scholar] [CrossRef]
- Klauda, J.B.; Sandler, S.I. Global Distribution of Methane Hydrate in Ocean Sediment. Energy Fuels 2005, 19, 459–470. [Google Scholar] [CrossRef]
- Chong, Z.R.; Yang, S.H.B.; Babu, P.; Linga, P.; Li, X. Review of natural gas hydrates as an energy resource: Prospects and challenges. Appl. Energy 2016, 162, 1633–1652. [Google Scholar] [CrossRef]
- Liu, L.; Ryu, B.; Sun, Z.; Wu, N.; Cao, H.; Geng, W.; Zhang, X.; Jia, Y.; Xu, C.; Guo, L.; et al. Monitoring and research on environmental impacts related to marine natural gas hydrates: Review and future perspective. J. Nat. Gas Sci. Eng. 2019, 65, 82–107. [Google Scholar] [CrossRef]
- Liu, X.; Flemings, P.B. Dynamic multiphase flow model of hydrate formation in marine sediments. J. Geophys. Res. 2007, 112, B03101. [Google Scholar] [CrossRef]
- Buleiko, V.M.; Grigoriev, B.A.; Istomin, V.A. Capillary effects on phase behavior of liquid and gaseous propane and dynamics of hydrate formation and dissociation in porous media. Fluid Phase Equilibria 2017, 441, 64–71. [Google Scholar] [CrossRef]
- Xie, Y.; Li, R.; Wang, X.; Zheng, T.; Cui, J.; Yuan, Q.; Qin, H.; Sun, C.; Chen, G. Review on the accumulation behavior of natural gas hydrates in porous sediments. J. Nat. Gas Sci. Eng. 2020, 83, 103520. [Google Scholar] [CrossRef]
- Daigle, H.; Bangs, N.L.; Dugan, B. Transient hydraulic fracturing and gas release in methane hydrate settings: A case study from southern Hydrate Ridge. Geochem. Geophys. Geosyst. 2011, 12, Q12022. [Google Scholar] [CrossRef]
- Kayen, R.E.; Lee, H.J. Pleistocene slope instability of gas hydrate-laden sediment on the Beaufort sea margin. Mar. Geotechnol. 1991, 10, 125–141. [Google Scholar] [CrossRef]
- Handwerger, A.L.; Rempel, A.W.; Skarbek, R.M. Submarine landslides triggered by destabilization of high-saturation hydrate anomalies. Geochem. Geophys. Geosyst. 2017, 18, 2429–2445. [Google Scholar] [CrossRef]
- Brown, P.; Sanders, R.; McDonagh, E.; Henson, S.; Best, A.I.; Poulton, A.J.; Mayor, D.J. Impacts and effects of ocean warming on carbon management including methane hydrates. In Explaining Ocean Warming: Causes, Scale, Effects and Consequences; IUCN: Gland, Switzerland, 2016; p. 373. [Google Scholar] [CrossRef]
- Skarke, A.; Ruppel, C.; Kodis, M.; Brothers, D.; Lobecker, E. Widespread methane leakage from the sea floor on the northern US Atlantic margin. Nat. Geosci. 2014, 7, 657–661. [Google Scholar] [CrossRef]
- Zhang, Y.; Zhai, W.-D. Shallow-ocean methane leakage and degassing to the atmosphere: Triggered by offshore oil-gas and methane hydrate explorations. Front. Mar. Sci. 2015, 2, 34. [Google Scholar] [CrossRef][Green Version]
- McGinnis, D.F.; Greinert, J.; Artemov, Y.; Beaubien, S.E.; Wüest, A. Fate of rising methane bubbles in stratified waters: How much methane reaches the atmosphere? J. Geophys. Res. 2006, 111, C09007. [Google Scholar] [CrossRef]
- Pillsbury, L.; Weber, T.C. Fate of methane gas bubbles emitted from the seafloor along the Western Atlantic Margin as observed by active sonar. J. Acoust. Soc. Am. 2015, 137, 2361. [Google Scholar] [CrossRef]
- Argentino, C.; Conti, S.; Fioroni, C.; Fontana, D. Evidences for Paleo-Gas Hydrate Occurrence: What We Can Infer for the Miocene of the Northern Apennines (Italy). Geosciences 2019, 9, 134. [Google Scholar] [CrossRef]
- Moridis, G.J.; Reagan, M.T.; Boyle, K.L.; Zhang, K. Evaluation of the Gas Production Potential of Some Particularly Challenging Types of Oceanic Hydrate Deposits. Transp. Porous Media 2011, 90, 269–299. [Google Scholar] [CrossRef]
- Wang, B.; Fan, Z.; Zhao, J.; Lv, X.; Pang, W.; Li, Q. Influence of intrinsic permeability of reservoir rocks on gas recovery from hydrate deposits via a combined depressurization and thermal stimulation approach. Appl. Energy 2018, 229, 858–871. [Google Scholar] [CrossRef]
- Yang, M.; Gao, Y.; Zhou, H.; Chen, B.; Li, Y. Gas production from different classes of methane hydrate deposits by the depressurization method. Int. J. Energy Res. 2019, 43, 5493–5505. [Google Scholar] [CrossRef]
- Chen, C.; Yang, L.; Jia, R.; Sun, Y.; Guo, W.; Chen, Y.; Li, X. Simulation Study on the Effect of Fracturing Technology on the Production Efficiency of Natural Gas Hydrate. Energies 2017, 10, 1241. [Google Scholar] [CrossRef]
- Yang, L.; Chen, C.; Jia, R.; Sun, Y.; Guo, W.; Pan, D.; Li, X.; Chen, Y. Influence of Reservoir Stimulation on Marine Gas Hydrate Conversion Efficiency in Different Accumulation Conditions. Energies 2018, 11, 339. [Google Scholar] [CrossRef]
- Feng, Y.; Chen, L.; Suzuki, A.; Kogawa, T.; Okajima, J.; Komiya, A.; Maruyama, S. Enhancement of gas production from methane hydrate reservoirs by the combination of hydraulic fracturing and depressurization method. Energy Convers. Manag. 2019, 184, 194–204. [Google Scholar] [CrossRef]
- Sun, J.; Ning, F.; Liu, T.; Liu, C.; Chen, Q.; Li, Y.; Cao, X.; Mao, P.; Zhang, L.; Jiang, G. Gas production from a silty hydrate reservoir in the South China Sea using hydraulic fracturing: A numerical simulation. Energy Sci. Eng. 2019, 7, 1106–1122. [Google Scholar] [CrossRef]
- Ju, X.; Liu, F.; Fu, P.; White, M.D.; Settgast, R.R.; Morris, J.P. Gas Production from Hot Water Circulation through Hydraulic Fractures in Methane Hydrate-Bearing Sediments: THC-Coupled Simulation of Production Mechanisms. Energy Fuels 2020, 34, 4448–4465. [Google Scholar] [CrossRef]
- Zhong, X.; Pan, D.; Zhai, L.; Zhu, Y.; Zhang, H.; Zhang, Y.; Wang, Y.; Li, X.; Chen, C. Evaluation of the gas production enhancement effect of hydraulic fracturing on combining depressurization with thermal stimulation from challenging ocean hydrate reservoirs. J. Nat. Gas Sci. Eng. 2020, 83, 103621. [Google Scholar] [CrossRef]
- Konno, Y.; Jin, Y.; Yoneda, J.; Uchiumi, T.; Shinjou, K.; Nagao, J. Hydraulic fracturing in methane-hydrate-bearing sand. RSC Adv. 2016, 6, 73148–73155. [Google Scholar] [CrossRef]
- Too, J.L.; Cheng, A.; Khoo, B.C.; Palmer, A.; Linga, P. Hydraulic fracturing in a penny-shaped crack. Part II: Testing the frackability of methane hydrate-bearing sand. J. Nat. Gas Sci. Eng. 2018, 52, 619–628. [Google Scholar] [CrossRef]
- Yamada, H.; Chen, L.; Okajima, J.; Komiya, A.; Maruyama, S. Visualization of the flow pattern in methane hydrate reservoir model. J. Fluid Sci. Technol. 2018, 13, JFST0028. [Google Scholar] [CrossRef]
- Liu, X.; Zhang, W.; Qu, Z.; Guo, T.; Sun, Y.; Rabiei, M.; Cao, Q. Feasibility evaluation of hydraulic fracturing in hydrate-bearing sediments based on analytic hierarchy process-entropy method (AHP-EM). J. Nat. Gas Sci. Eng. 2020, 81, 103434. [Google Scholar] [CrossRef]
- Ma, X.; Jiang, D.; Sun, Y.; Li, S. Experimental study on hydraulic fracturing behavior of frozen clayey silt and hydrate-bearing clayey silt. Fuel 2022, 322, 124366. [Google Scholar] [CrossRef]
- Nie, S.; Zhong, X.; Song, J.; Tu, G.; Chen, C. Experimental study on hydraulic fracturing in clayey-silty hydrate-bearing sediments and fracability evaluation based on multilayer perceptron-analytic hierarchy process. J. Nat. Gas Sci. Eng. 2022, 106, 104735. [Google Scholar] [CrossRef]
- Zhai, L.; Zhang, H.; Pan, D.; Zhu, Y.; Zhu, J.; Zhang, Y.; Chen, C. Optimisation of hydraulic fracturing parameters based on cohesive zone method in oil shale reservoir with random distribution of weak planes. J. Nat. Gas Sci. Eng. 2020, 75, 103130. [Google Scholar] [CrossRef]
- Wang, D.; Dong, Y.; Sun, D.; Yu, B. A three-dimensional numerical study of hydraulic fracturing with degradable diverting materials via CZM-based FEM. Eng. Fract. Mech. 2020, 237, 107251. [Google Scholar] [CrossRef]
- Huang, C.; Chen, S. Effects of Ductility of Organic-Rich Shale on Hydraulic Fracturing: A Fully Coupled Extended-Finite-Element-Method Analysis Using a Modified Cohesive Zone Model. SPE J. 2020, 26, 591–609. [Google Scholar] [CrossRef]
- Ma, X.; Cheng, J.; Sun, Y.; Li, S. 2D Numerical Simulation of Hydraulic Fracturing in Hydrate-Bearing Sediments Based on the Cohesive Element. Energy Fuels 2021, 35, 3825–3840. [Google Scholar] [CrossRef]
- Ma, X.; Jiang, D.; Fang, X.; Wang, X. Numerical simulation of single-cluster and multi-cluster fracturing of hydrate reservoir based on cohesive element. Eng. Fract. Mech. 2022, 265, 108365. [Google Scholar] [CrossRef]
- Martínez, E.R.; de Farias, M.M.; Junior, F.E. Investigation of the notch angle in hydraulic fracturing using XFEM. J. Braz. Soc. Mech. Sci. Eng. 2019, 41, 437. [Google Scholar] [CrossRef]
- Sun, Z.; Ooi, E.T.; Song, C. Finite fracture mechanics analysis using the scaled boundary finite element method. Eng. Fract. Mech. 2015, 134, 330–353. [Google Scholar] [CrossRef]
- Bouhala, L.; Shao, Q.; Koutsawa, Y.; Younes, A.; Núñez, P.; Makradi, A.; Belouettar, S. An XFEM crack-tip enrichment for a crack terminating at a bi-material interface. Eng. Fract. Mech. 2013, 102, 51–64. [Google Scholar] [CrossRef]
- Menk, A.; Bordas, S.P.A. Numerically determined enrichment functions for the extended finite element method and applications to bi-material anisotropic fracture and polycrystals. Int. J. Numer. Methods Eng. 2010, 83, 805–828. [Google Scholar] [CrossRef]
- Zhao, Y.-L.; Xie, S.-C.; Peng, X.-L.; Zhang, L.-H. Transient pressure response of fractured horizontal wells in tight gas reservoirs with arbitrary shapes by the boundary element method. Environ. Earth Sci. 2016, 75, 1220. [Google Scholar] [CrossRef]
- Choo, L.Q.; Zhao, Z.; Chen, H.; Tian, Q. Hydraulic fracturing modeling using the discontinuous deformation analysis (DDA) method. Comput. Geotech. 2016, 76, 12–22. [Google Scholar] [CrossRef]
- Ben, Y.; Wang, Y.; Shi, G. Challenges of simulating hydraulic fracturing with DDA. In Proceedings of the ISRM SINOROCK 2013, Shanghai, China, 18–20 June 2013; pp. 607–611. [Google Scholar] [CrossRef]
- Cundall, P.A.; Strack, O.D.L. A discrete numerical model for granular assemblies. Geotechnique 1979, 29, 47–65. [Google Scholar] [CrossRef]
- Olga, K.; Xiaowei, W. Hydraulic Fracturing in Formations with Permeable Natural Fractures. In Effective and Sustainable Hydraulic Fracturing; Andrew, P.B., John, M., Rob, J., Eds.; IntechOpen: Rijeka, Croatia, 2013. [Google Scholar] [CrossRef]
- Wang, J.; Lee, H.P.; Li, T.; Olson, J.E. Three-Dimensional Analysis of Hydraulic Fracture Effective Contact Area in Layered Formations with Natural Fracture Network. In Proceedings of the 54th U.S. Rock Mechanics/Geomechanics Symposium, Physical Event Cancelled, Golden, CO, USA, 28 June–1 July 2020. [Google Scholar]
- Dahi Taleghani, A.; Gonzalez, M.; Shojaei, A. Overview of numerical models for interactions between hydraulic fractures and natural fractures: Challenges and limitations. Comput. Geotech. 2016, 71, 361–368. [Google Scholar] [CrossRef]
- Shimizu, H.; Murata, S.; Ishida, T. The distinct element analysis for hydraulic fracturing in hard rock considering fluid viscosity and particle size distribution. Int. J. Rock Mech. Min. Sci. 2011, 48, 712–727. [Google Scholar] [CrossRef]
- Wang, T.; Zhou, W.; Chen, J.; Xiao, X.; Li, Y.; Zhao, X. Simulation of hydraulic fracturing using particle flow method and application in a coal mine. Int. J. Coal Geol. 2014, 121, 1–13. [Google Scholar] [CrossRef]
- Zhou, J.; Zhang, L.; Braun, A.; Han, Z. Investigation of Processes of Interaction between Hydraulic and Natural Fractures by PFC Modeling Comparing against Laboratory Experiments and Analytical Models. Energies 2017, 10, 1001. [Google Scholar] [CrossRef]
- ICG Inc. PFC2D-Particle Flow Code in Two Dimensions. Version 4.0. User’s Manual; ICG: Minneapolis, MN, USA, 2010. [Google Scholar]
- Yan, R.T.; Wei, C.F.; Wei, H.Z.; Tian, H.H.; Wu, E.L. A generalized critical state model for gas hydrate-bearing sediments. In Constitutive Modeling of Geomaterials; Springer: Berlin/Heidelberg, Germany, 2013. [Google Scholar]
- Soga, K.; Lee, S.L.; Ng, M.Y.A.; Klar, A. Characterisation and engineering properties of Methane hydrate soils. 2nd Int. Workshop Characterisation Eng. Prop. Nat. Soils 2006, 4, 1642–2591. [Google Scholar] [CrossRef]
- Jiang, M.; Liu, J.; Shen, Z. Investigating the mechanical behavior of grain-coating type methane hydrate bearing sediment in true triaxial compression tests by distinct element method. SCIENTIA SINICA Phys. Mech. Astron. 2018, 49, 034613. [Google Scholar] [CrossRef]
- Zhang, H.; Bi, J.; Luo, X. Oedometer test of natural gas hydrate-bearing sands: Particle-scale simulation. J. Nat. Gas Sci. Eng. 2020, 84, 103631. [Google Scholar] [CrossRef]
- Bruno, M.S. Micromechanics of stress-induced permeability anisotropy and damage in sedimentary rock. Mech. Mater. 1994, 18, 31–48. [Google Scholar] [CrossRef]
- Thallak, S.L.; Rothenburg; Dusseault, M. Simulation of multiple hydraulic fractures in a discrete element system. In Proceedings of the 32nd U.S. Symposium on Rock Mechanics (USRMS), Norman, Oklahoma, 10–12 July 1991. [Google Scholar]
- Han, Y.; Cundall, P.A. Lattice Boltzmann modeling of pore-scale fluid flow through idealized porous media. Int. J. Numer. Methods Fluids 2011, 67, 1720–1734. [Google Scholar] [CrossRef]
- Al-Busaidi, A. Distinct element modeling of hydraulically fractured Lac du Bonnet granite. J. Geophys. Res. 2005, 110, B06302. [Google Scholar] [CrossRef]
- Masuda, Y.; Fujinaga, Y.; Naganawa, S.; Fujita, K.; Sato, K.; Hayashi, Y. Modeling and experimental studies on dissociation of methane gas hydrates in Berea sandstone cores. In Proceedings of the International Conference on Gas Hydrates, Salt Lake City, UT, USA, 18–22 July 1999. [Google Scholar]
- Yoneda, J.; Masui, A.; Konno, Y.; Jin, Y.; Kida, M.; Katagiri, J.; Nagao, J.; Tenma, N. Pressure-core-based reservoir characterization for geomechanics: Insights from gas hydrate drilling during 2012–2013 at the eastern Nankai Trough. Mar. Pet. Geol. 2017, 86, 1–16. [Google Scholar] [CrossRef]
- Yoneda, J.; Masui, A.; Konno, Y.; Jin, Y.; Egawa, K.; Kida, M.; Ito, T.; Nagao, J.; Tenma, N. Mechanical behavior of hydrate-bearing pressure-core sediments visualized under triaxial compression. Mar. Pet. Geol. 2015, 66, 451–459. [Google Scholar] [CrossRef]
- Heeschen, K.U.; Janocha, J.; Spangenberg, E.; Schicks, J.M.; Giese, R. The impact of ice on the tensile strength of unconsolidated sand—A model for gas hydrate-bearing sands? Mar. Pet. Geol. 2020, 122, 104607. [Google Scholar] [CrossRef]
- Bragg, R.A.; Andersland, O.B. Strain rate, temperature, and sample size effects on compression and tensile properties of frozen sand. Eng. Geol. 1981, 18, 35–46. [Google Scholar] [CrossRef]
- Christ, M.; Kim, Y.-C. Experimental study on the physical-mechanical properties of frozen silt. KSCE J. Civ. Eng. 2009, 13, 317–324. [Google Scholar] [CrossRef]
- Azmatch, T.F.; Sego, D.C.; Arenson, L.U.; Biggar, K.W. Tensile Strength of Frozen Soils Using Four-point Bending Test. In Proceedings of the 63rd Canadian Geotechnical Conference and 6th Canadian Permafrost Conference, Calgary, AB, Canada, 12–16 September 2010; pp. 436–442. [Google Scholar]
- Too, J.L.; Cheng, A.; Khoo, B.C.; Palmer, A.; Linga, P. Hydraulic fracturing in a penny-shaped crack. Part I: Methodology and testing of frozen sand. J. Nat. Gas Sci. Eng. 2018, 52, 609–618. [Google Scholar] [CrossRef]
- Hubbert, M.K.; Willis, D.G. Mechanics Of Hydraulic Fracturing. Trans. AIME 1957, 210, 153–168. [Google Scholar] [CrossRef]
- Haimson, B.; Fairhurst, C. Initiation and Extension of Hydraulic Fractures in Rocks. Soc. Pet. Eng. J. 1967, 7, 310–318. [Google Scholar] [CrossRef]
- Haimson, B.C.; Cornet, F.H. ISRM Suggested Methods for rock stress estimation—Part 3: Hydraulic fracturing (HF) and/or hydraulic testing of pre-existing fractures (HTPF). Int. J. Rock Mech. Min. Sci. 2003, 40, 1011–1020. [Google Scholar] [CrossRef]
- Zhang, T.; Zhang, Y.; Katterbauer, K.; Al Shehri, A.; Sun, S.; Hoteit, I. Phase equilibrium in the hydrogen energy chain. Fuel 2022, 328, 125324. [Google Scholar] [CrossRef]
Disclaimer/Publisher’s Note: The statements, opinions and data contained in all publications are solely those of the individual author(s) and contributor(s) and not of MDPI and/or the editor(s). MDPI and/or the editor(s) disclaim responsibility for any injury to people or property resulting from any ideas, methods, instructions or products referred to in the content. |
© 2023 by the authors. Licensee MDPI, Basel, Switzerland. This article is an open access article distributed under the terms and conditions of the Creative Commons Attribution (CC BY) license (https://creativecommons.org/licenses/by/4.0/).